
Double Performance Prism: innovation performance Measurement systems for manufacturing SMEs
15
International Journal of Innovative Research in Advanced Engineering (IJIRAE) ISSN: 2349-2163 Issue 03, Volume 4 (March 2017) www.ijirae.com _________________________________________________________________________________________________ IJIRAE: Impact Factor Value – SJIF: Innospace, Morocco (2016): 3.916 | PIF: 2.469 | Jour Info: 4.085 | ISRAJIF (2016): 3.715 | Indexcopernicus: (ICV 2015): 47.91 IJIRAE © 2014- 17, All Rights Reserved Page -113 Double Performance Prism: innovation performance Measurement systems for manufacturing SMEs Florent Lado Nogning * Mickaël Gardoni Department of automated manufacturing engineering Department of automated manufacturing engineering Ecole de Technologie Supérieure, Montreal, Canada Ecole de Technologie Supérieure, Montreal, Canada Manuscript History Number: IJIRAE/RS/Vol.04/Issue03/MRAE10099 Received: 07, March 2017 Final Correction: 20, March 2017 Final Accepted: 28, March 2017 Published: March 2017 Abstract — No performance measurement system currently takes into account the innovator dilemma which consists of the necessity of balancing between the exploratory and exploitative innovation activities. This balance remains a major challenge in innovation management. Although small and medium enterprises account for 95% of firms in developed countries, according to Web of Science database, only 1.5% of research papers on innovation and 0.5% of research papers on performance measurement focus on small and medium enterprises. Drawing on the Performance Prism of Andy Neely, this paper develops an innovation performance measurement system for manufacturing small and medium enterprises in order to achieve a balance of exploration and exploitation activities. This model, known as the Double Performance Prism, is based on stakeholder theory. It considers innovation as a solution to customers’ expressed and observed needs. It has been implemented in two manufacturing small and medium enterprises. As key results, an innovation success map and a 10-indicator Innovation Scoreboard emerged from the research and implementation. The aim of these results is to foster the development of an ambidextrous organization. Further quantitative studies will be necessary to validate the proposed innovation map. Keywords — performance measurement, innovation process, small and medium enterprises, exploration, exploitation, innovation dilemma I. INTRODUCTION No performance measurement system currently takes into account the innovator dilemma which consists of the necessity of balancing between the exploratory and exploitative innovation activities. This balance remains a major challenge in innovation management [1]. Firms that succeed in balancing exploitation and exploitation are considered ambidextrous. To achieve this, they must reconcile the conflicting cultures of these two activities [2]. How can they manage the process of innovation without tools consistent with the most important challenges, especially the innovator dilemma? Not surprisingly, The Conference Board of Canada concluded in a research that up to 40% of enterprises don’t measure their performance in terms of innovation, and only 8% measure their innovation performance with at least 4 indicators [3]. Small and medium enterprises (SMEs), which are companies with less than 250 employees, are significant drivers of employment growth ([4], [5]). Two-thirds of job creation is attributed to SMEs [6]. The importance of SMEs in job creation has contributed to an increase in SME research in government and scholarly communities. However, it is only since the 1980s that SMEs emerged as an important area of scholarly research. Previously, due to the economy of scale theory, an SME was an intermediate phase of the development of a big company, which was deemed the only type of organization capable of sustaining international competition. One consequence of this is that, although SMEs account for 95% of firms in developed countries, according to the Web of Science database, only 1.5% of research papers on innovation and 0.5% of research papers on performance measurement focus on SMEs. In order to tackle these two challenges—the innovator dilemma and the lack of SME research in this context—we decided to design a system that could help manufacturing SMEs manage exploitative and exploratory innovation activities. To do this, we needed a full understanding of the SME innovation process.
-
Upload
am-publications -
Category
Engineering
-
view
34 -
download
6
Transcript of Double Performance Prism: innovation performance Measurement systems for manufacturing SMEs
International Journal of Innovative Research in Advanced Engineering (IJIRAE) ISSN: 2349-2163 Issue 03, Volume 4 (March 2017) www.ijirae.com
_________________________________________________________________________________________________ IJIRAE: Impact Factor Value – SJIF: Innospace, Morocco (2016): 3.916 | PIF: 2.469 | Jour Info: 4.085 |
ISRAJIF (2016): 3.715 | Indexcopernicus: (ICV 2015): 47.91 IJIRAE © 2014- 17, All Rights Reserved Page -113
Double Performance Prism: innovation performance
Measurement systems for manufacturing SMEs
Florent Lado Nogning* Mickaël Gardoni
Department of automated manufacturing engineering Department of automated manufacturing engineering Ecole de Technologie Supérieure, Montreal, Canada Ecole de Technologie Supérieure, Montreal, Canada Manuscript History Number: IJIRAE/RS/Vol.04/Issue03/MRAE10099 Received: 07, March 2017 Final Correction: 20, March 2017 Final Accepted: 28, March 2017 Published: March 2017
Abstract — No performance measurement system currently takes into account the innovator dilemma which consists of the necessity of balancing between the exploratory and exploitative innovation activities. This balance remains a major challenge in innovation management. Although small and medium enterprises account for 95% of firms in developed countries, according to Web of Science database, only 1.5% of research papers on innovation and 0.5% of research papers on performance measurement focus on small and medium enterprises. Drawing on the Performance Prism of Andy Neely, this paper develops an innovation performance measurement system for manufacturing small and medium enterprises in order to achieve a balance of exploration and exploitation activities. This model, known as the Double Performance Prism, is based on stakeholder theory. It considers innovation as a solution to customers’ expressed and observed needs. It has been implemented in two manufacturing small and medium enterprises. As key results, an innovation success map and a 10-indicator Innovation Scoreboard emerged from the research and implementation. The aim of these results is to foster the development of an ambidextrous organization. Further quantitative studies will be necessary to validate the proposed innovation map.
Keywords — performance measurement, innovation process, small and medium enterprises, exploration, exploitation, innovation dilemma
I. INTRODUCTION
No performance measurement system currently takes into account the innovator dilemma which consists of the necessity of balancing between the exploratory and exploitative innovation activities. This balance remains a major challenge in innovation management [1]. Firms that succeed in balancing exploitation and exploitation are considered ambidextrous. To achieve this, they must reconcile the conflicting cultures of these two activities [2]. How can they manage the process of innovation without tools consistent with the most important challenges, especially the innovator dilemma? Not surprisingly, The Conference Board of Canada concluded in a research that up to 40% of enterprises don’t measure their performance in terms of innovation, and only 8% measure their innovation performance with at least 4 indicators [3].
Small and medium enterprises (SMEs), which are companies with less than 250 employees, are significant drivers of employment growth ([4], [5]). Two-thirds of job creation is attributed to SMEs [6]. The importance of SMEs in job creation has contributed to an increase in SME research in government and scholarly communities. However, it is only since the 1980s that SMEs emerged as an important area of scholarly research. Previously, due to the economy of scale theory, an SME was an intermediate phase of the development of a big company, which was deemed the only type of organization capable of sustaining international competition. One consequence of this is that, although SMEs account for 95% of firms in developed countries, according to the Web of Science database, only 1.5% of research papers on innovation and 0.5% of research papers on performance measurement focus on SMEs.
In order to tackle these two challenges—the innovator dilemma and the lack of SME research in this context—we decided to design a system that could help manufacturing SMEs manage exploitative and exploratory innovation activities. To do this, we needed a full understanding of the SME innovation process.
International Journal of Innovative Research in Advanced Engineering (IJIRAE) ISSN: 2349-2163 Issue 03, Volume 4 (March 2017) www.ijirae.com
_________________________________________________________________________________________________ IJIRAE: Impact Factor Value – SJIF: Innospace, Morocco (2016): 3.916 | PIF: 2.469 | Jour Info: 4.085 |
ISRAJIF (2016): 3.715 | Indexcopernicus: (ICV 2015): 47.91 IJIRAE © 2014- 17, All Rights Reserved Page - 115
It is well known that the role and influence of the entrepreneur in an SME is paramount. We therefore chose a phenomenological research approach to describe the innovation process with a focus on the SME entrepreneur. The SME innovation process is supported by five critical success factors: marketing, ambidextrous organization, ambidextrous leadership, financing, and technology and learning. In this context, marketing has emerged as the most important critical success factor. This is consistent with a user-cantered approach in innovation [7]. The purpose of this paper is to report on the design and implementation of an innovation performance measurement model in small and medium manufacturing enterprises. It comprises a theoretical development of the Double Performance Prism and two case studies that elucidate the process of its implementation. The case studies consist in implementing the new model of innovation performance measurement that we developed by drawing on the Performance Prism model of Andy Neely [8]. The paper is structured in four sections. Section one offer a brief theoretical background of SME performance measurement and SME innovation performance measurement models. Section two discusses the research methodology, which comprises a theoretical approach and two case studies used to gather and analyse the data. Section three reports the results, and Section four discusses the structure of the SME innovation map and Innovation Scoreboard (ISB) that emerged from the data.
II. THEORETICAL BACKGROUND
A. PERFORMANCE MEASUREMENT SYSTEMS (PMSS)
Performance measurement systems (PMSs) have a five-decade long research history that has shifted from a focus on budgetary control in the 1960s to integrated performance measurement in the 1980s to integrated performance management in the 2000s [9]. However, it is only in the 1990s that PMSs started to gain increasing popularity in what Neely in [10] has called the “performance measurement revolution.” This revolution was the result of the generalized expectation gap experienced in financial-oriented PMSs [11]. It consisted of a new generation of balanced or integrated PMSs ([12], [13], [14], [8]), which considered financial metrics as just one of numerous performance dimensions. PMSs face numerous emergent challenges. This is sometimes accompanied by the addition of new data and metrics, instead of corresponding PMS alignment with changing strategies [15]. Reference [8] believes PMSs are facing another crisis, which is due to an overabundance of data. According to him, “[t]he fundamental problem today is not that people are measuring the wrong things [...], it is that they are trying to measure too much.” PMS implementation is therefore insufficient without performance measurement management. This is consistent with [16] appeal to managers to ask them the question: are the metrics providing data needed to answer the questions for a better management? Furthermore, in today’s turbulent and dynamic environments, strategy updates become a permanent imperative for managers. These must take into account three important challenges: performance measurement as a social system, performance measurement in networks, and performance measurement as a learning system [9].
SME performance measurement is one of the emergent themes in the performance measurement research agenda. The majority of PMS approaches were designed and tested in the context of large companies [17]. They must be adjusted to take into account the structural and cultural characteristics of small and medium companies. These characteristics include flexibility, a flat structure, a high potential for innovation, a lack of resources, and others. Some of these characteristics have been described as constraints to PMS implementation: a reactive mindset, limited resources, a lack of strategic planning and thinking [18]. To overcome these obstacles, Reference [19] suggested the following approaches: the implementation process must mobilize few resources and produce short-term results; it must also be iterative in order to be flexible and to adapt to strategy changes. Few scholars have designed specific PMSs for SMEs. Reference [20] has developed a balanced PMS drawing on quantitative research with 93 Finnish SMEs. It is based on activity-based costing (ABC) as a prerequisite and its logic model is the production function model from the allocation of resources to results. Reference [21] used a qualitative approach with five Texan SMEs to add a temporal dimension to his performance measurement model that considers short-term metrics (less than one year) and long term metrics (next five years). Finally, Reference [22] developed an eight-step detailed process named PMS-IRIS that they implemented in 22 SMEs. In doing so, they produced the following recommendations for successful PMS implementation in SMEs: they must have an organization and a culture of information management and their managers must be trained in performance management. None of these SME PMSs are related to innovation performance measurement.
Innovation performance measurement is another emergent theme in the performance measurement research agenda. Drivers of successful innovation are well documented, especially for large firms, but their metrics are still unsatisfactory [23]. Models of innovation performance have been developed that draw on different methodologies including empirical ones like firm surveys ([6], [24]), case studies [25], and theoretical approaches ([23], [26], [27]). The OECD methodology is widespread and validated among the thirty OECD members, but it focuses mainly on the national innovation system and less on individual firms. The following Table I illustrate and compares different innovation performance measurement models. Traditional and recent models of innovation performance measurement are still input/output oriented, and the result is that the innovation process is neglected [23]. Indicators focus on past innovation performance, stressing control more than management purpose. One of the consequences of the lack of process-oriented innovation performance measurement frameworks is that the innovation dilemma is still not adequately addressed, particularly in SMEs [1].
International Journal of Innovative Research in Advanced Engineering (IJIRAE) ISSN: 2349-2163 Issue 03, Volume 4 (March 2017) www.ijirae.com
_________________________________________________________________________________________________ IJIRAE: Impact Factor Value – SJIF: Innospace, Morocco (2016): 3.916 | PIF: 2.469 | Jour Info: 4.085 |
ISRAJIF (2016): 3.715 | Indexcopernicus: (ICV 2015): 47.91 IJIRAE © 2014- 17, All Rights Reserved Page - 116
TABLE I -INNOVATION PERFORMANCE MEASUREMENT MODELS MODELS CHARACTERISTICS
OECD model [6] Based on firm surveys. Best suited for benchmark and less for innovation process
Balance Scorecard (BSC) model ([28], [26], [25]) Yet to be tested and validated, designed for large organizations
Multicriteria decision model – AHP (analytic hierarchy process)
Well suited for portfolio management
Economical model – DEA (data envelopment analysis) - [29]
Well suited for benchmark – input/output oriented
B. INNOVATION DILEMMA: EXPLORATION AND EXPLOITATION Exploitative innovation refers to activities that refine and combine knowledge already available in the firm, while exploratory innovation refers to activities that include research, variation, and risk-taking [2]. The balance of these two activities is driven by the capacity of an organization to manage simultaneously incremental and revolutionary change ([30], [31]), also known as ambidexterity. It draws on evolutionary management [32] and organizational learning [2]. This is consistent with the evolutionary theory of economics popularized by [33], which is a foundational text of innovation research. It states that firms evolve not only through optimization but also through learning and exploration. It also places an emphasis on the firm’s process of acquiring, storing, maintaining, and renewing technological and organizational knowledge. According to [33], this process is the cornerstone of a firm’s innovation performance.
Exploitation and exploration require different skills and must be managed by conflicting management approaches. This is consistent with [34] who point out that one “challenge involves balancing the portfolio of existing and new opportunities over time. This task is particularly difficult for two reasons: Resources at any given time are limited, and new and existing opportunities require that conflicting management approaches be exercised simultaneously.” Exploitation requires skills related to planning, respect for procedures, optimization and cost control. Exploration requires skills related to experimentation, trial and error, and out-of-the-box thinking. These conflicting skills are seldom possessed by just one individual, but often managers must consider them in their team casting. To do this, managers need to demonstrate dynamic capabilities ([30], [35], [36]). Dynamic capabilities are needed in the management of a turbulent and changing environment. These capabilities consist of sensing opportunities and threats in the environment, seizing opportunities, and maintaining competitiveness through protection, reinforcement, and the reconfiguration of assets [37]. It is an empowerment process for managers whose leadership is considered to have an impact on the survival of their enterprises.
III. THEORETICAL DEVELOPMENT
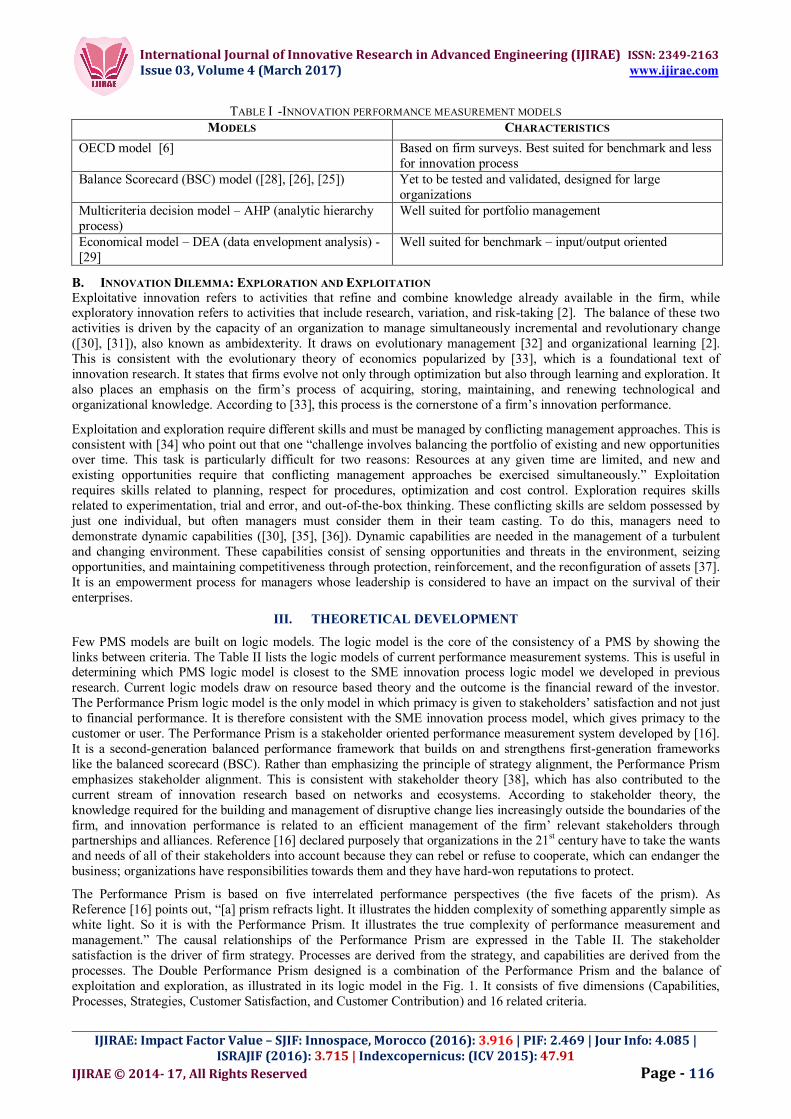
Few PMS models are built on logic models. The logic model is the core of the consistency of a PMS by showing the links between criteria. The Table II lists the logic models of current performance measurement systems. This is useful in determining which PMS logic model is closest to the SME innovation process logic model we developed in previous research. Current logic models draw on resource based theory and the outcome is the financial reward of the investor. The Performance Prism logic model is the only model in which primacy is given to stakeholders’ satisfaction and not just to financial performance. It is therefore consistent with the SME innovation process model, which gives primacy to the customer or user. The Performance Prism is a stakeholder oriented performance measurement system developed by [16]. It is a second-generation balanced performance framework that builds on and strengthens first-generation frameworks like the balanced scorecard (BSC). Rather than emphasizing the principle of strategy alignment, the Performance Prism emphasizes stakeholder alignment. This is consistent with stakeholder theory [38], which has also contributed to the current stream of innovation research based on networks and ecosystems. According to stakeholder theory, the knowledge required for the building and management of disruptive change lies increasingly outside the boundaries of the firm, and innovation performance is related to an efficient management of the firm’ relevant stakeholders through partnerships and alliances. Reference [16] declared purposely that organizations in the 21st century have to take the wants and needs of all of their stakeholders into account because they can rebel or refuse to cooperate, which can endanger the business; organizations have responsibilities towards them and they have hard-won reputations to protect.
The Performance Prism is based on five interrelated performance perspectives (the five facets of the prism). As Reference [16] points out, “[a] prism refracts light. It illustrates the hidden complexity of something apparently simple as white light. So it is with the Performance Prism. It illustrates the true complexity of performance measurement and management.” The causal relationships of the Performance Prism are expressed in the Table II. The stakeholder satisfaction is the driver of firm strategy. Processes are derived from the strategy, and capabilities are derived from the processes. The Double Performance Prism designed is a combination of the Performance Prism and the balance of exploitation and exploration, as illustrated in its logic model in the Fig. 1. It consists of five dimensions (Capabilities, Processes, Strategies, Customer Satisfaction, and Customer Contribution) and 16 related criteria.
International Journal of Innovative Research in Advanced Engineering (IJIRAE) ISSN: 2349-2163 Issue 03, Volume 4 (March 2017) www.ijirae.com
_________________________________________________________________________________________________ IJIRAE: Impact Factor Value – SJIF: Innospace, Morocco (2016): 3.916 | PIF: 2.469 | Jour Info: 4.085 |
ISRAJIF (2016): 3.715 | Indexcopernicus: (ICV 2015): 47.91 IJIRAE © 2014- 17, All Rights Reserved Page - 117
For the Capabilities dimension, the criteria are the five critical success factors of process innovation that emerged in our previous research: marketing, leadership, organization, technology and learning, and financing. For the Processes dimension, the criteria are the innovation process steps: collection of wants and needs, idea choice, project development, and solution diffusion. For the Strategies dimension, the criteria are exploitation and exploration. For the Customer Satisfaction dimension, the criteria are satisfaction of current customers and satisfaction of future customers. For the Customer Contribution dimension, the criteria are contributions of current customers and contributions of future customers. For each of these 16 criteria, we have found indicators in the innovation and PMS literature, some which an innovation manager can choose from to measure the criteria. We proposed about 50 indicators illustrated in Table III, and one of the objectives of the following case studies is to choose and test the most relevant in order to achieve a 10-indicator Innovation Scoreboard (ISB).
TABLE II - COMPARISONS OF SME INNOVATION PROCESS LOGIC MODEL WITH PMS LOGIC MODELS LOGIC MODEL OF SME INNOVATION PROCESS (PREVIOUS RESEARCH)
LOGIC MODEL OF PERFORMANCE PRISM [16]
LOGIC MODEL OF THE BALANCED SCORECARD (BSC) [12]
LOGIC MODEL OF INTEGRATED PERFORMANCE MEASUREMENT FOR SMALL FIRMS [20]
LOGIC MODEL OF PMS-IRIS METHODOLOGY [22]
International Journal of Innovative Research in Advanced Engineering (IJIRAE) ISSN: 2349-2163 Issue 03, Volume 4 (March 2017) www.ijirae.com
_________________________________________________________________________________________________ IJIRAE: Impact Factor Value – SJIF: Innospace, Morocco (2016): 3.916 | PIF: 2.469 | Jour Info: 4.085 |
ISRAJIF (2016): 3.715 | Indexcopernicus: (ICV 2015): 47.91 IJIRAE © 2014- 17, All Rights Reserved Page - 118
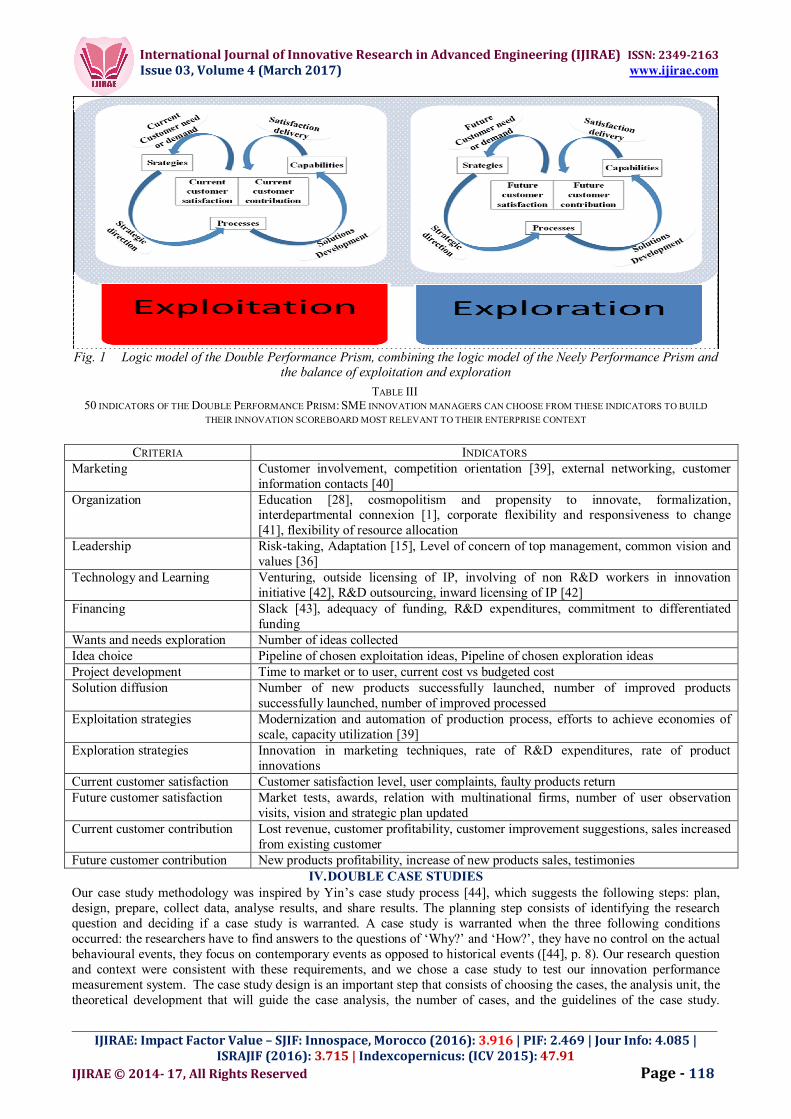
Fig. 1 Logic model of the Double Performance Prism, combining the logic model of the Neely Performance Prism and
the balance of exploitation and exploration
TABLE III 50 INDICATORS OF THE DOUBLE PERFORMANCE PRISM: SME INNOVATION MANAGERS CAN CHOOSE FROM THESE INDICATORS TO BUILD
THEIR INNOVATION SCOREBOARD MOST RELEVANT TO THEIR ENTERPRISE CONTEXT
CRITERIA INDICATORS Marketing Customer involvement, competition orientation [39], external networking, customer
information contacts [40] Organization Education [28], cosmopolitism and propensity to innovate, formalization,
interdepartmental connexion [1], corporate flexibility and responsiveness to change [41], flexibility of resource allocation
Leadership Risk-taking, Adaptation [15], Level of concern of top management, common vision and values [36]
Technology and Learning Venturing, outside licensing of IP, involving of non R&D workers in innovation initiative [42], R&D outsourcing, inward licensing of IP [42]
Financing Slack [43], adequacy of funding, R&D expenditures, commitment to differentiated funding
Wants and needs exploration Number of ideas collected Idea choice Pipeline of chosen exploitation ideas, Pipeline of chosen exploration ideas Project development Time to market or to user, current cost vs budgeted cost Solution diffusion Number of new products successfully launched, number of improved products
successfully launched, number of improved processed Exploitation strategies Modernization and automation of production process, efforts to achieve economies of
scale, capacity utilization [39] Exploration strategies Innovation in marketing techniques, rate of R&D expenditures, rate of product
innovations Current customer satisfaction Customer satisfaction level, user complaints, faulty products return Future customer satisfaction Market tests, awards, relation with multinational firms, number of user observation
visits, vision and strategic plan updated Current customer contribution Lost revenue, customer profitability, customer improvement suggestions, sales increased
from existing customer Future customer contribution New products profitability, increase of new products sales, testimonies
IV. DOUBLE CASE STUDIES
Our case study methodology was inspired by Yin’s case study process [44], which suggests the following steps: plan, design, prepare, collect data, analyse results, and share results. The planning step consists of identifying the research question and deciding if a case study is warranted. A case study is warranted when the three following conditions occurred: the researchers have to find answers to the questions of ‘Why?’ and ‘How?’, they have no control on the actual behavioural events, they focus on contemporary events as opposed to historical events ([44], p. 8). Our research question and context were consistent with these requirements, and we chose a case study to test our innovation performance measurement system. The case study design is an important step that consists of choosing the cases, the analysis unit, the theoretical development that will guide the case analysis, the number of cases, and the guidelines of the case study.
International Journal of Innovative Research in Advanced Engineering (IJIRAE) ISSN: 2349-2163 Issue 03, Volume 4 (March 2017) www.ijirae.com
_________________________________________________________________________________________________ IJIRAE: Impact Factor Value – SJIF: Innospace, Morocco (2016): 3.916 | PIF: 2.469 | Jour Info: 4.085 |
ISRAJIF (2016): 3.715 | Indexcopernicus: (ICV 2015): 47.91 IJIRAE © 2014- 17, All Rights Reserved Page - 119
Furthermore, a solid theoretical development must precede the case study ([44], p. 136). In our research, the unit of analysis is the entire internal organization of the SME as the innovation process is transversal and encompasses every unit of the organization. In the design phase, the researcher could choose among five technical analysis types: form matching, explanation construction, chronological series analysis, logic models, and cross-case synthesis. We chose the Double Performance Prism logic model as the guideline for our case study. We also chose two case studies for literal replication instead of theoretical replication ([44], p. 54).
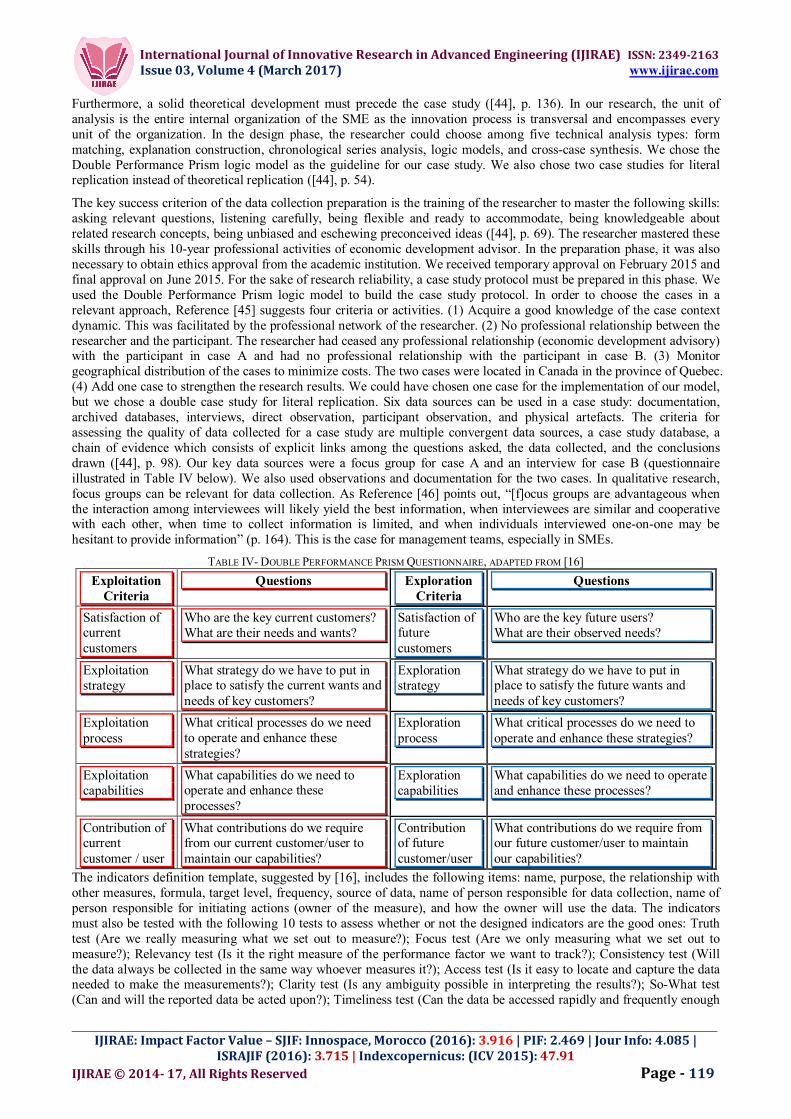
The key success criterion of the data collection preparation is the training of the researcher to master the following skills: asking relevant questions, listening carefully, being flexible and ready to accommodate, being knowledgeable about related research concepts, being unbiased and eschewing preconceived ideas ([44], p. 69). The researcher mastered these skills through his 10-year professional activities of economic development advisor. In the preparation phase, it was also necessary to obtain ethics approval from the academic institution. We received temporary approval on February 2015 and final approval on June 2015. For the sake of research reliability, a case study protocol must be prepared in this phase. We used the Double Performance Prism logic model to build the case study protocol. In order to choose the cases in a relevant approach, Reference [45] suggests four criteria or activities. (1) Acquire a good knowledge of the case context dynamic. This was facilitated by the professional network of the researcher. (2) No professional relationship between the researcher and the participant. The researcher had ceased any professional relationship (economic development advisory) with the participant in case A and had no professional relationship with the participant in case B. (3) Monitor geographical distribution of the cases to minimize costs. The two cases were located in Canada in the province of Quebec. (4) Add one case to strengthen the research results. We could have chosen one case for the implementation of our model, but we chose a double case study for literal replication. Six data sources can be used in a case study: documentation, archived databases, interviews, direct observation, participant observation, and physical artefacts. The criteria for assessing the quality of data collected for a case study are multiple convergent data sources, a case study database, a chain of evidence which consists of explicit links among the questions asked, the data collected, and the conclusions drawn ([44], p. 98). Our key data sources were a focus group for case A and an interview for case B (questionnaire illustrated in Table IV below). We also used observations and documentation for the two cases. In qualitative research, focus groups can be relevant for data collection. As Reference [46] points out, “[f]ocus groups are advantageous when the interaction among interviewees will likely yield the best information, when interviewees are similar and cooperative with each other, when time to collect information is limited, and when individuals interviewed one-on-one may be hesitant to provide information” (p. 164). This is the case for management teams, especially in SMEs.
TABLE IV- DOUBLE PERFORMANCE PRISM QUESTIONNAIRE, ADAPTED FROM [16] Exploitation
Criteria Questions Exploration
Criteria Questions
Satisfaction of current customers
Who are the key current customers? What are their needs and wants?
Satisfaction of future customers
Who are the key future users? What are their observed needs?
Exploitation strategy
What strategy do we have to put in place to satisfy the current wants and needs of key customers?
Exploration strategy
What strategy do we have to put in place to satisfy the future wants and needs of key customers?
Exploitation process
What critical processes do we need to operate and enhance these strategies?
Exploration process
What critical processes do we need to operate and enhance these strategies?
Exploitation capabilities
What capabilities do we need to operate and enhance these processes?
Exploration capabilities
What capabilities do we need to operate and enhance these processes?
Contribution of current customer / user
What contributions do we require from our current customer/user to maintain our capabilities?
Contribution of future customer/user
What contributions do we require from our future customer/user to maintain our capabilities?
The indicators definition template, suggested by [16], includes the following items: name, purpose, the relationship with other measures, formula, target level, frequency, source of data, name of person responsible for data collection, name of person responsible for initiating actions (owner of the measure), and how the owner will use the data. The indicators must also be tested with the following 10 tests to assess whether or not the designed indicators are the good ones: Truth test (Are we really measuring what we set out to measure?); Focus test (Are we only measuring what we set out to measure?); Relevancy test (Is it the right measure of the performance factor we want to track?); Consistency test (Will the data always be collected in the same way whoever measures it?); Access test (Is it easy to locate and capture the data needed to make the measurements?); Clarity test (Is any ambiguity possible in interpreting the results?); So-What test (Can and will the reported data be acted upon?); Timeliness test (Can the data be accessed rapidly and frequently enough
International Journal of Innovative Research in Advanced Engineering (IJIRAE) ISSN: 2349-2163 Issue 03, Volume 4 (March 2017) www.ijirae.com
_________________________________________________________________________________________________ IJIRAE: Impact Factor Value – SJIF: Innospace, Morocco (2016): 3.916 | PIF: 2.469 | Jour Info: 4.085 |
ISRAJIF (2016): 3.715 | Indexcopernicus: (ICV 2015): 47.91 IJIRAE © 2014- 17, All Rights Reserved Page - 120
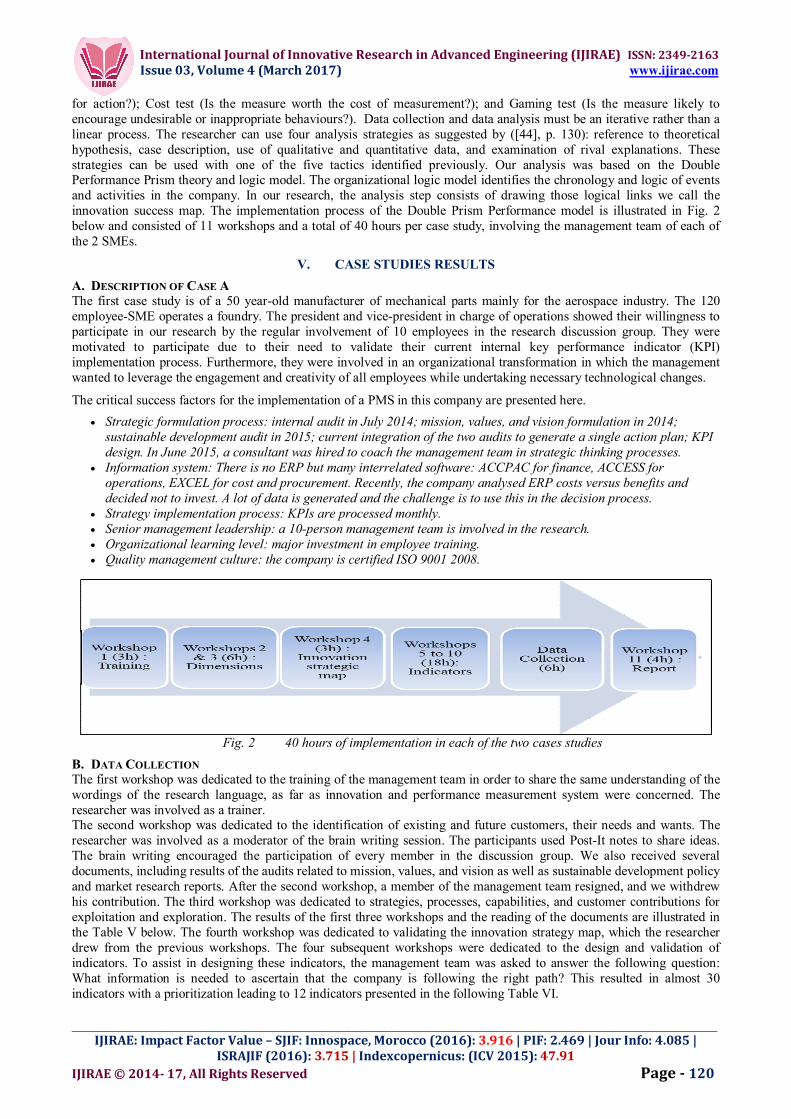
for action?); Cost test (Is the measure worth the cost of measurement?); and Gaming test (Is the measure likely to encourage undesirable or inappropriate behaviours?). Data collection and data analysis must be an iterative rather than a linear process. The researcher can use four analysis strategies as suggested by ([44], p. 130): reference to theoretical hypothesis, case description, use of qualitative and quantitative data, and examination of rival explanations. These strategies can be used with one of the five tactics identified previously. Our analysis was based on the Double Performance Prism theory and logic model. The organizational logic model identifies the chronology and logic of events and activities in the company. In our research, the analysis step consists of drawing those logical links we call the innovation success map. The implementation process of the Double Prism Performance model is illustrated in Fig. 2 below and consisted of 11 workshops and a total of 40 hours per case study, involving the management team of each of the 2 SMEs.
V. CASE STUDIES RESULTS
A. DESCRIPTION OF CASE A The first case study is of a 50 year-old manufacturer of mechanical parts mainly for the aerospace industry. The 120 employee-SME operates a foundry. The president and vice-president in charge of operations showed their willingness to participate in our research by the regular involvement of 10 employees in the research discussion group. They were motivated to participate due to their need to validate their current internal key performance indicator (KPI) implementation process. Furthermore, they were involved in an organizational transformation in which the management wanted to leverage the engagement and creativity of all employees while undertaking necessary technological changes.
The critical success factors for the implementation of a PMS in this company are presented here.
Strategic formulation process: internal audit in July 2014; mission, values, and vision formulation in 2014; sustainable development audit in 2015; current integration of the two audits to generate a single action plan; KPI design. In June 2015, a consultant was hired to coach the management team in strategic thinking processes.
Information system: There is no ERP but many interrelated software: ACCPAC for finance, ACCESS for operations, EXCEL for cost and procurement. Recently, the company analysed ERP costs versus benefits and decided not to invest. A lot of data is generated and the challenge is to use this in the decision process.
Strategy implementation process: KPIs are processed monthly. Senior management leadership: a 10-person management team is involved in the research. Organizational learning level: major investment in employee training. Quality management culture: the company is certified ISO 9001 2008.
Fig. 2 40 hours of implementation in each of the two cases studies
B. DATA COLLECTION The first workshop was dedicated to the training of the management team in order to share the same understanding of the wordings of the research language, as far as innovation and performance measurement system were concerned. The researcher was involved as a trainer. The second workshop was dedicated to the identification of existing and future customers, their needs and wants. The researcher was involved as a moderator of the brain writing session. The participants used Post-It notes to share ideas. The brain writing encouraged the participation of every member in the discussion group. We also received several documents, including results of the audits related to mission, values, and vision as well as sustainable development policy and market research reports. After the second workshop, a member of the management team resigned, and we withdrew his contribution. The third workshop was dedicated to strategies, processes, capabilities, and customer contributions for exploitation and exploration. The results of the first three workshops and the reading of the documents are illustrated in the Table V below. The fourth workshop was dedicated to validating the innovation strategy map, which the researcher drew from the previous workshops. The four subsequent workshops were dedicated to the design and validation of indicators. To assist in designing these indicators, the management team was asked to answer the following question: What information is needed to ascertain that the company is following the right path? This resulted in almost 30 indicators with a prioritization leading to 12 indicators presented in the following Table VI.
International Journal of Innovative Research in Advanced Engineering (IJIRAE) ISSN: 2349-2163 Issue 03, Volume 4 (March 2017) www.ijirae.com
_________________________________________________________________________________________________ IJIRAE: Impact Factor Value – SJIF: Innospace, Morocco (2016): 3.916 | PIF: 2.469 | Jour Info: 4.085 |
ISRAJIF (2016): 3.715 | Indexcopernicus: (ICV 2015): 47.91 IJIRAE © 2014- 17, All Rights Reserved Page - 121
C. DESCRIPTION OF CASE B Case B is a 10 year-old SME manufacturing start-up operating in the powder metallurgy industry. The founder has worked in the wind energy industry for almost 20 years. He saw an opportunity to launch a new business venture and combined intuitive business intelligence with an investment in R&D to develop new, high performance brake pads for high power wind turbines. His willingness to participate in our research can be explained by the opportunity it offered him to evaluate his current innovation processes and to empower his start-up managers with innovation management best practices. His current and future customers are multinational companies with high expectations from their suppliers. The critical success factors for the implementation of a PMS in this company are presented here.
Strategic formulation process: mission, values, and vision were formulated in 2015. An economic development advisor released a five-function audit and issued an action plan. The business plan was recently updated.
Information system: there is no ERP but there is some management software. Strategy implementation process: regular meetings of the management team and weekly meetings of the
operational team. Senior management leadership: the president is an open-minded leader who is able to involve highly proficient
partners. Organizational learning level: major investment in hiring proficient employees and partners. Almost every
employee has a post-secondary diploma. Quality management culture: the company is implementing quality and safety systems inspired by his multinational
customers’ requirements.
TABLE V - STRATEGIES, PROCESSES, CAPABILITIES, CUSTOMERS’ SATISFACTION AND CUSTOMERS’ CONTRIBUTION – CASE A
Exploitation Exploration Present customer needs and wants : price, quality, on-time delivery, reliable customer service
Future customer needs : complex products delivered in small batch, turnkey manufacturing solutions
Strategies : partnership with suppliers, partnership with customers, automation, lean management
Strategies : partnership with research centers, manufacturing integration
Processes : pipeline of automation and lean projects with priority criteria; develop voice of the customer
Processes : develop business intelligence, pipeline of collaborative R&D projects
Capabilities : information system, sales training, procurement strategic negotiation,
Capabilities : networking, collaboration with universities and research centers, government financing,
Customer contribution : reliability, profitability, collaboration
Customer contribution : engagement, collaboration
TABLE VI - INNOVATION PROCESS INDICATORS – CASE A Exploitation Exploration
Operational profitability Number of new complex products delivered par year or new turnkey solutions delivered
On-time delivery Ratio R&D/revenues
Supplier performance Ratio of sales of new products
Number of projects codeveloped with suppliers Number of non-available services
Number of automation projects Time of new techniques learning
Completion time Number of business intelligence meetings
D. DATA COLLECTION Data was collected through a one-week intensive research internship with significant involvement of the company president. The first workshop was dedicated to his training in order to share the same understanding of the research language, as far as innovation and performance measurement system were concerned. The researcher was involved as a trainer. The second workshop was dedicated to the identification of existing and future customers, their needs and wants. The researcher was involved as the interviewer of the president in semi-structured interviews. We also received a number of documents including mission, values, and vision, business plan, a business proposition from research centres, templates of a quality control check-list to be implemented. The third workshop was dedicated to strategies, processes, capabilities, and customer contributions for exploitation and exploration. The results of the three workshops and the reading of the documents are illustrated in the Table VII below. The fourth workshop was dedicated to validating the innovation strategy map, which the researcher drew from the previous workshops. The four following workshops were dedicated to the design and validation of indicators.
International Journal of Innovative Research in Advanced Engineering (IJIRAE) ISSN: 2349-2163 Issue 03, Volume 4 (March 2017) www.ijirae.com
_________________________________________________________________________________________________ IJIRAE: Impact Factor Value – SJIF: Innospace, Morocco (2016): 3.916 | PIF: 2.469 | Jour Info: 4.085 |
ISRAJIF (2016): 3.715 | Indexcopernicus: (ICV 2015): 47.91 IJIRAE © 2014- 17, All Rights Reserved Page - 122
To assist in designing these indicators, the management team was asked to answer the following question: What information is needed to ascertain that the company is following the right path? This resulted in 10 indicators presented in the following Table VIII.
E. IMPLEMENTATION POST-MORTEM The implementation process involved a learning curve for both case study managers. They became aware of exploitation and exploration language. One year after the beginning of the research program, the VP of Operations (SME A) said the following: “Now, we can consider that our company is more balanced in terms of exploitation and exploration because we involve more and more external resources to boost internal change.” Following the implementation process, SME A hired a management consultant to build a competency map for the company in order to strengthen the training of new employees and their performance follow-up. The implementation process also resulted in the development of management best practices. Managing with KPIs helps SME managers share a common vision of the enterprise and a common language. One of the SME managers in case study A had the following to say: “Now that we are more aware of exploitation and exploration issues, we are better able to counter the common objection from our employees—‘we have always done like that’.” The president of the SME in case study B said the following: “Throughout this intensive research week, I realized that we had a good approach to innovation and development, but we lacked tools and indicators to measure our performance. This is fundamental in proper enterprise management.”
TABLE VII- STRATEGIES, PROCESSES, CAPABILITIES, CUSTOMERS’ SATISFACTION AND CUSTOMERS’ CONTRIBUTION – CASE B Exploitation Exploration
Present customer needs and wants : low price, quality, fast delivery, local supplier, spare parts recycling
Future customer needs : new products with reduced wear, up to 50% lesser
Strategies : partnership with customers, automation, product optimization
Strategies : partnership with research centers, internal R&D
Processes : pipeline of automation and lean projects with priority criteria; develop voice of the customer
Processes : develop business intelligence, pipeline of collaborative R&D projects
Capabilities : interdepartmental collaboration, private and government financing, staffing
Capabilities : networking, collaboration with universities and research centers, government financing
Customer contribution : reliability, profitability, referencing new customers
Customer contribution : involvement in field tests and added value feedback
TABLE VIII - INNOVATION PROCESS INDICATORS – CASE B Exploitation Exploration
On-time deliveries Reduce wear rate by 50% Annual needs forecast Field test results Productivity Research results On-time completion of operation committee plan
On-time completion of collaborative project committee plan
Working capital ratio On budget completion of collaborative project committee plan
VI. DISCUSSION Three major results of our research are described below.
A. THREE-STEP STRATEGIC THINKING PROCESS AND DEFINITION OF INNOVATION INDICATORS
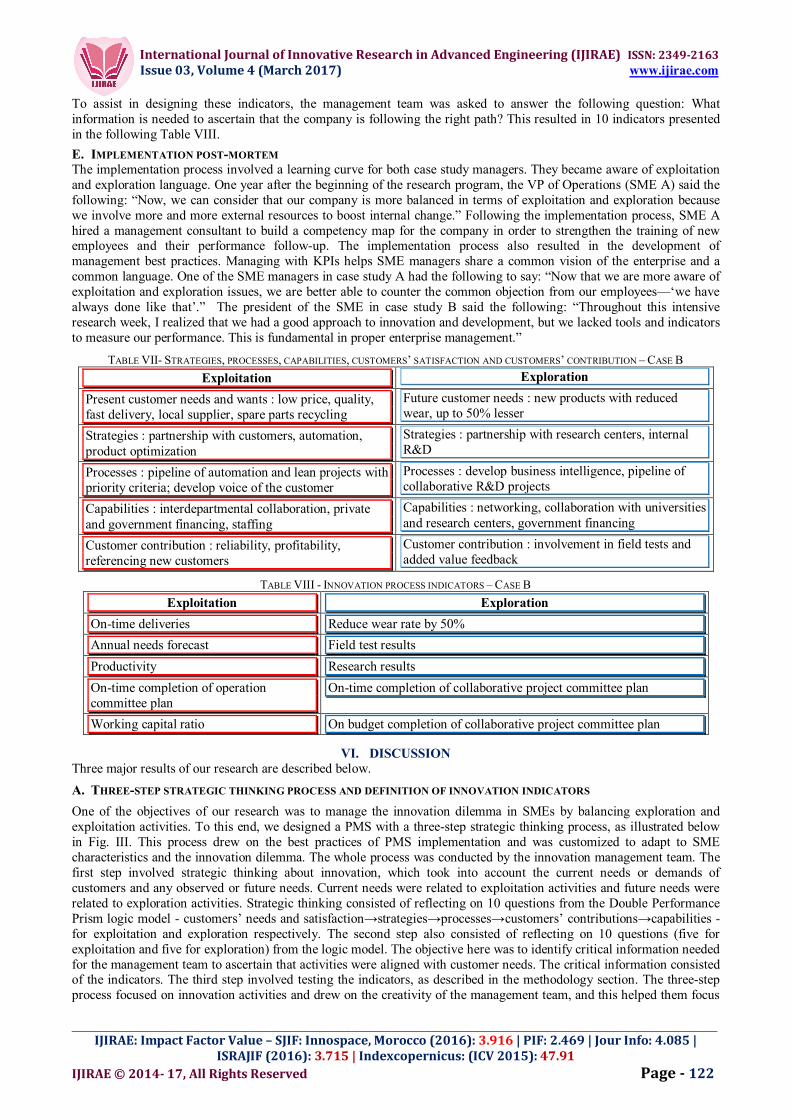
One of the objectives of our research was to manage the innovation dilemma in SMEs by balancing exploration and exploitation activities. To this end, we designed a PMS with a three-step strategic thinking process, as illustrated below in Fig. III. This process drew on the best practices of PMS implementation and was customized to adapt to SME characteristics and the innovation dilemma. The whole process was conducted by the innovation management team. The first step involved strategic thinking about innovation, which took into account the current needs or demands of customers and any observed or future needs. Current needs were related to exploitation activities and future needs were related to exploration activities. Strategic thinking consisted of reflecting on 10 questions from the Double Performance Prism logic model - customers’ needs and satisfaction→strategies→processes→customers’ contributions→capabilities - for exploitation and exploration respectively. The second step also consisted of reflecting on 10 questions (five for exploitation and five for exploration) from the logic model. The objective here was to identify critical information needed for the management team to ascertain that activities were aligned with customer needs. The critical information consisted of the indicators. The third step involved testing the indicators, as described in the methodology section. The three-step process focused on innovation activities and drew on the creativity of the management team, and this helped them focus
International Journal of Innovative Research in Advanced Engineering (IJIRAE) ISSN: 2349-2163 Issue 03, Volume 4 (March 2017) www.ijirae.com
_________________________________________________________________________________________________ IJIRAE: Impact Factor Value – SJIF: Innospace, Morocco (2016): 3.916 | PIF: 2.469 | Jour Info: 4.085 |
ISRAJIF (2016): 3.715 | Indexcopernicus: (ICV 2015): 47.91 IJIRAE © 2014- 17, All Rights Reserved Page - 123
on customers’ expressed and observed needs. A balance in the satisfaction of expressed needs and observed needs is the core of the innovation dilemma solution, as this balance helps to build an ambidextrous organization.The strategic thinking process resulted in a diagnosis of the innovation strategy by the management team to ensure its alignment with customers’ needs. It introduced the balance of exploration and exploitation as an imperative and a sine qua non of innovation performance. It was also a learning process for the SME innovation managers, and it helped them to strengthen their vision as a prerequisite for PMS implementation. It detailed the steps to follow, which means it can be used autonomously or with limited coaching by any SME management team.
Fig. 3 3-step innovation strategic thinking process for manufacturing SMEs
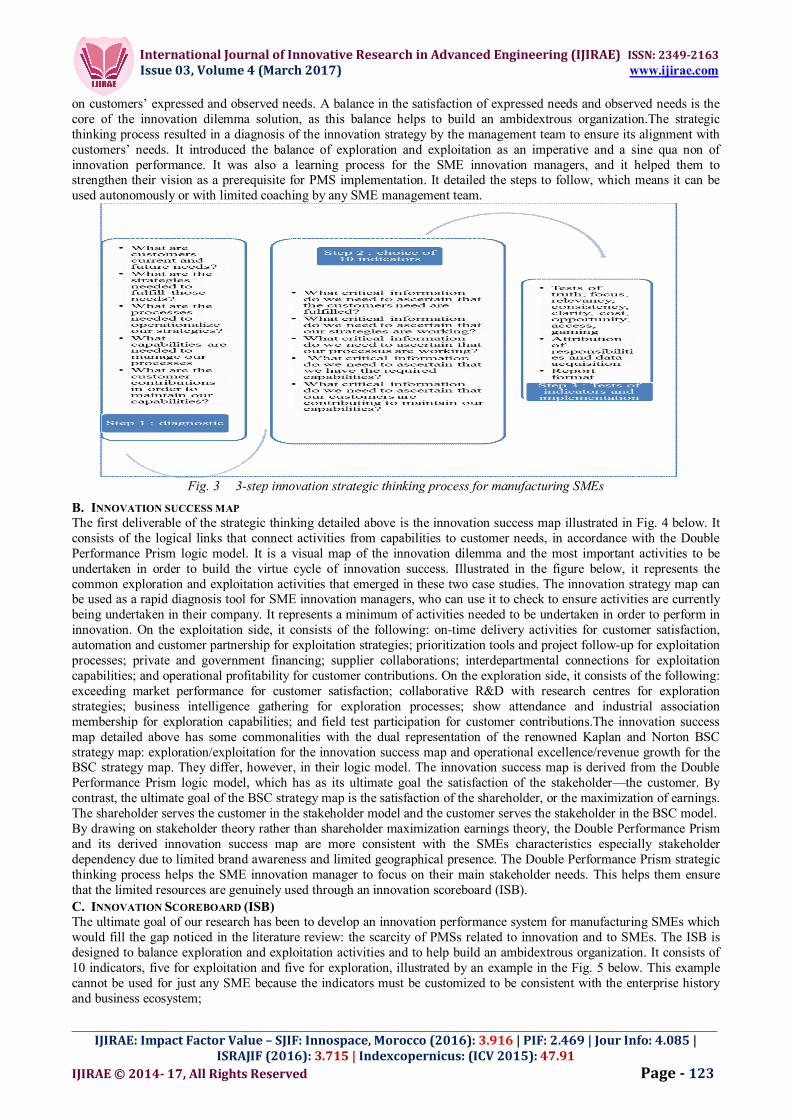
B. INNOVATION SUCCESS MAP The first deliverable of the strategic thinking detailed above is the innovation success map illustrated in Fig. 4 below. It consists of the logical links that connect activities from capabilities to customer needs, in accordance with the Double Performance Prism logic model. It is a visual map of the innovation dilemma and the most important activities to be undertaken in order to build the virtue cycle of innovation success. Illustrated in the figure below, it represents the common exploration and exploitation activities that emerged in these two case studies. The innovation strategy map can be used as a rapid diagnosis tool for SME innovation managers, who can use it to check to ensure activities are currently being undertaken in their company. It represents a minimum of activities needed to be undertaken in order to perform in innovation. On the exploitation side, it consists of the following: on-time delivery activities for customer satisfaction, automation and customer partnership for exploitation strategies; prioritization tools and project follow-up for exploitation processes; private and government financing; supplier collaborations; interdepartmental connections for exploitation capabilities; and operational profitability for customer contributions. On the exploration side, it consists of the following: exceeding market performance for customer satisfaction; collaborative R&D with research centres for exploration strategies; business intelligence gathering for exploration processes; show attendance and industrial association membership for exploration capabilities; and field test participation for customer contributions.The innovation success map detailed above has some commonalities with the dual representation of the renowned Kaplan and Norton BSC strategy map: exploration/exploitation for the innovation success map and operational excellence/revenue growth for the BSC strategy map. They differ, however, in their logic model. The innovation success map is derived from the Double Performance Prism logic model, which has as its ultimate goal the satisfaction of the stakeholder—the customer. By contrast, the ultimate goal of the BSC strategy map is the satisfaction of the shareholder, or the maximization of earnings. The shareholder serves the customer in the stakeholder model and the customer serves the stakeholder in the BSC model. By drawing on stakeholder theory rather than shareholder maximization earnings theory, the Double Performance Prism and its derived innovation success map are more consistent with the SMEs characteristics especially stakeholder dependency due to limited brand awareness and limited geographical presence. The Double Performance Prism strategic thinking process helps the SME innovation manager to focus on their main stakeholder needs. This helps them ensure that the limited resources are genuinely used through an innovation scoreboard (ISB).
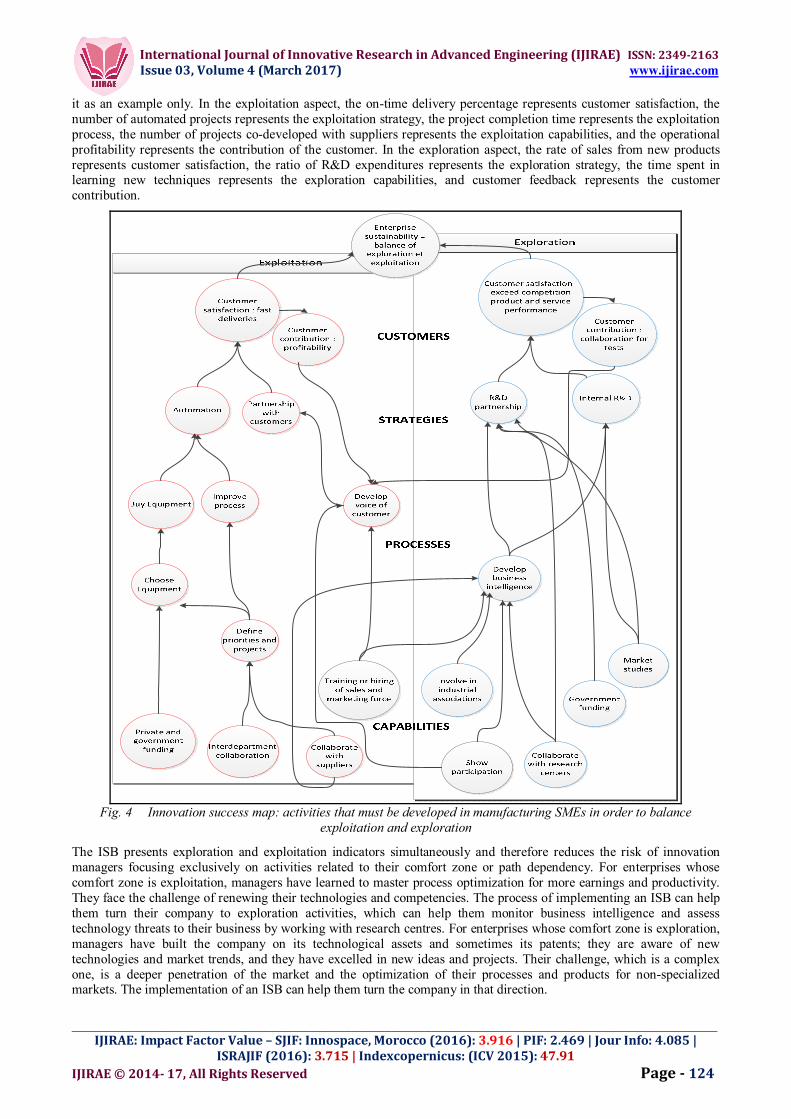
C. INNOVATION SCOREBOARD (ISB) The ultimate goal of our research has been to develop an innovation performance system for manufacturing SMEs which would fill the gap noticed in the literature review: the scarcity of PMSs related to innovation and to SMEs. The ISB is designed to balance exploration and exploitation activities and to help build an ambidextrous organization. It consists of 10 indicators, five for exploitation and five for exploration, illustrated by an example in the Fig. 5 below. This example cannot be used for just any SME because the indicators must be customized to be consistent with the enterprise history and business ecosystem;
International Journal of Innovative Research in Advanced Engineering (IJIRAE) ISSN: 2349-2163 Issue 03, Volume 4 (March 2017) www.ijirae.com
_________________________________________________________________________________________________ IJIRAE: Impact Factor Value – SJIF: Innospace, Morocco (2016): 3.916 | PIF: 2.469 | Jour Info: 4.085 |
ISRAJIF (2016): 3.715 | Indexcopernicus: (ICV 2015): 47.91 IJIRAE © 2014- 17, All Rights Reserved Page - 124
it as an example only. In the exploitation aspect, the on-time delivery percentage represents customer satisfaction, the number of automated projects represents the exploitation strategy, the project completion time represents the exploitation process, the number of projects co-developed with suppliers represents the exploitation capabilities, and the operational profitability represents the contribution of the customer. In the exploration aspect, the rate of sales from new products represents customer satisfaction, the ratio of R&D expenditures represents the exploration strategy, the time spent in learning new techniques represents the exploration capabilities, and customer feedback represents the customer contribution.
Fig. 4 Innovation success map: activities that must be developed in manufacturing SMEs in order to balance
exploitation and exploration
The ISB presents exploration and exploitation indicators simultaneously and therefore reduces the risk of innovation managers focusing exclusively on activities related to their comfort zone or path dependency. For enterprises whose comfort zone is exploitation, managers have learned to master process optimization for more earnings and productivity. They face the challenge of renewing their technologies and competencies. The process of implementing an ISB can help them turn their company to exploration activities, which can help them monitor business intelligence and assess technology threats to their business by working with research centres. For enterprises whose comfort zone is exploration, managers have built the company on its technological assets and sometimes its patents; they are aware of new technologies and market trends, and they have excelled in new ideas and projects. Their challenge, which is a complex one, is a deeper penetration of the market and the optimization of their processes and products for non-specialized markets. The implementation of an ISB can help them turn the company in that direction.
International Journal of Innovative Research in Advanced Engineering (IJIRAE) ISSN: 2349-2163 Issue 03, Volume 4 (March 2017) www.ijirae.com
_________________________________________________________________________________________________ IJIRAE: Impact Factor Value – SJIF: Innospace, Morocco (2016): 3.916 | PIF: 2.469 | Jour Info: 4.085 |
ISRAJIF (2016): 3.715 | Indexcopernicus: (ICV 2015): 47.91 IJIRAE © 2014- 17, All Rights Reserved Page - 125
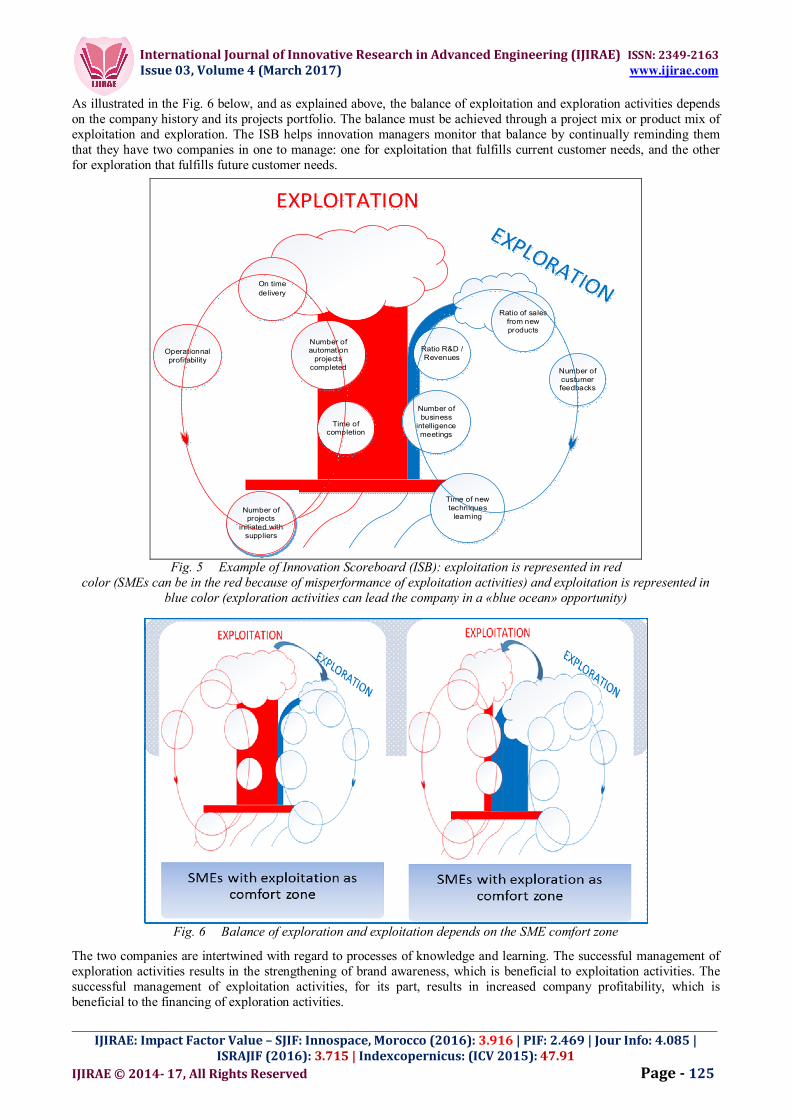
As illustrated in the Fig. 6 below, and as explained above, the balance of exploitation and exploration activities depends on the company history and its projects portfolio. The balance must be achieved through a project mix or product mix of exploitation and exploration. The ISB helps innovation managers monitor that balance by continually reminding them that they have two companies in one to manage: one for exploitation that fulfills current customer needs, and the other for exploration that fulfills future customer needs.
On time delivery
Number of automation
projects completed
Time of completion
Number of projects
initiated with suppliers
Operationnal profitability
Ratio of sales from new products
Number of custumer feedbacks
Number of business
intelligence meetings
Time of new techniques
learning
Ratio R&D / Revenues
EXPLOITATION
Fig. 5 Example of Innovation Scoreboard (ISB): exploitation is represented in red
color (SMEs can be in the red because of misperformance of exploitation activities) and exploitation is represented in blue color (exploration activities can lead the company in a «blue ocean» opportunity)
Fig. 6 Balance of exploration and exploitation depends on the SME comfort zone
The two companies are intertwined with regard to processes of knowledge and learning. The successful management of exploration activities results in the strengthening of brand awareness, which is beneficial to exploitation activities. The successful management of exploitation activities, for its part, results in increased company profitability, which is beneficial to the financing of exploration activities.
International Journal of Innovative Research in Advanced Engineering (IJIRAE) ISSN: 2349-2163 Issue 03, Volume 4 (March 2017) www.ijirae.com
_________________________________________________________________________________________________ IJIRAE: Impact Factor Value – SJIF: Innospace, Morocco (2016): 3.916 | PIF: 2.469 | Jour Info: 4.085 |
ISRAJIF (2016): 3.715 | Indexcopernicus: (ICV 2015): 47.91 IJIRAE © 2014- 17, All Rights Reserved Page - 126
The innovation success map and the innovation scoreboard implementation process are also knowledge management processes. The innovation success map provides an overview of the knowledge available that is combined for new processes and improved products in the enterprises (exploitation) and the knowledge to be acquired in order to build the future of the enterprise (exploration). Innovation management and knowledge management are intertwined. As we discovered in our empirical research, learning is an important dimension of the innovation process. Learning willingness and learning capacity are important to manage the change required in any innovation process, either from exploration to exploitation or from exploitation to exploration.
VII. BENEFITS, LIMITATIONS AND FUTURE RESEARCH
Our research is useful to SME innovation managers. They can use the generic innovation success map for a diagnosis of their innovation process and to determine their innovation comfort zone. They can build their ISB in order to balance exploitation with exploration, and to manage their performance in terms of innovation. Our research is also useful for innovation public policy. Governments all over the world are in search of relevant SME innovation policy because SMEs are driving two-third of job creation. Our research can help public authorities to reengineer their SMEs financial aids. Our research was limited to manufacturing SMEs. Further empirical research is needed to apply innovation success map and innovation scoreboard to service SMEs, especially by testing if they share the same innovation process and dimensions. Furthermore, the innovation success map we built from our double case studies demonstrated theoretical validity of the Double Performance Prism and not statistical validity. For the latter, further quantitative research would probably show sectoral and regional patterns of the logic model, and the ratio of exploration vs exploitation activities that is optimal for the innovation success. We have built a generic model for innovation success map but the innovation scoreboard (ISB) we built from our research remains idiosyncratic. Further research could draw on it and build few generic ISB models for exploitation and exploration SME respectively so that managers could use them without need of customization.
VIII. CONCLUSIONS
The objectives of our research was to design a PMS for the management of the innovation process in manufacturing SMEs in order to tackle the innovation dilemma, which is the necessary balance of exploration and exploitation activities. Drawing on Neely’s Performance Prism and on a theoretical development, we developed the Double Performance Prism with 10 indicators and an innovation success map. The implementation of the model in two manufacturing SMEs helps us to define the necessary activities that must be managed to ensure an efficient innovation process. For exploitative innovation, activities consist of on-time deliveries, automation, partnership with customers, project management, interdepartmental collaboration, collaboration with suppliers, and profitability. For exploratory innovation, activities consist of R&D, collaboration with research centers, government financing, business intelligence, involvement in industrial associations, and field tests in customer settings. The 10-indicator innovation scorecard that was derived from the success innovation map must be customized to each enterprise as it is dependent on the history and ecosystem of each particular enterprise. It consists of the critical information needed to ascertain that the innovation success map has been followed. Further quantitative research is needed to determine the ratio of exploitation versus exploration activities that delivers the optimal innovation performance in manufacturing SMEs.
REFERENCES
[1] Y. Y. Chang, and M. Hughes, “Drivers of innovation ambidexterity in small- to medium-sized firms”, European Management Journal, Vol. 30 No. 1, pp. 1-17, Feb. 2012.
[2] J. G. March, “Exploration and exploitation in organizational learning”, Organization science, Vol. 2 No. 1, pp. 71-87, Feb. 1991.
[3] S. Cohn, and G. Bruce, “Metrics for Firm-Level Business Innovation in Canada”, The Conference Board of Canada, Ottawa, Dec. 2013.
[4] D. Birch, “Who creates jobs?”, The Public Interest, Vol. 65, pp. 3 14, 1981 [5] D. Birch, “Job creation in America: How our smallest companies put the most people to work”. Free Press, New
York, 1987. [6] OECD, “OECD SME and Entrepreneurship Outlook 2005”, OECD Publishing, 2005 [7] V. Bilgram, A. Brem, and K. I. Voigt, “User-centric innovations in new product development—Systematic
identification of lead users harnessing interactive and collaborative online-tools”. International journal of innovation management, Vol. 12 No 3, pp. 419-458, Sept. 2008.
[8] A. Neely, C. Adams, and P. Crowe, “The performance prism in practice”, Measuring business excellence, Vol. 5 No. 2, pp. 6-13, 2001.
[9] U. Bititci, P. Garengo, V. Dorfler, and S. Nudurupati, “Performance Measurement: Challenges for Tomorrow”, International Journal of Management Reviews, Vol. 14 No. 3, pp. 305-327, Sep. 2012.
[10] A. Neely, “The performance measurement revolution: why now and what next?”, International journal of operations & production management, Vol. 19 No. 2, pp. 205-228, 1999.
[11] R. G. Eccles, “The performance-measurement manifesto”. Harvard Business Review, Vol. 69 No. 1, pp. 131-137, Jan.-Feb. 1991.
International Journal of Innovative Research in Advanced Engineering (IJIRAE) ISSN: 2349-2163 Issue 03, Volume 4 (March 2017) www.ijirae.com
_________________________________________________________________________________________________ IJIRAE: Impact Factor Value – SJIF: Innospace, Morocco (2016): 3.916 | PIF: 2.469 | Jour Info: 4.085 |
ISRAJIF (2016): 3.715 | Indexcopernicus: (ICV 2015): 47.91 IJIRAE © 2014- 17, All Rights Reserved Page - 127
[12] R. S. Kaplan, and D. P. Norton, “Using the balanced scorecard as a strategic management system”, Harvard business review, Vol. 74 No. 1, pp. 75-85, 1996
[13] R. S. Kaplan, and D. P. Norton, “Having trouble with your strategy?: Then map it”, Focusing Your Organization on Strategy—with the Balanced Scorecard, pp. 49, 2000
[14] R. S. Kaplan, and D. P. Norton, “Mastering the management system”, Harvard business review, Vol. 86 No. 1, pp. 62, Jan. 2008
[15] S. A. Melnyk, U. Bititci, K. Platts, J. Tobias, and B. Anderson, “Is performance measurement and management fit for the future?”, Management Accounting Research, Vol. 25 No. 2, pp. 117–118, June 2014.
[16] A. D. Neely, C. Adams, and M. Kennerley, “The performance prism: The scorecard for measuring and managing business success”. Prentice Hall Financial Times, London, 2002.
[17] M. Hudson Smith, and D. Smith, “Implementing strategically aligned performance measurement in small firms”, International Journal of Production Economics, Vol. 106 No. 2, pp. 393-408, Ap. 2017.
[18] M. Hudson, J. Lean, and P. A. Smart, “Improving control through effective performance measurement in SMEs”, Production planning and control, Vol. 12 No. 8, pp. 804-813, 2001.
[19] M. Hudson, A. Smart, and M. Bourne, “Theory and practice in SME performance measurement systems”, International Journal of Operations and Production Management, Vol. 21 No. 8, pp. 1096-1115, 2001.
[20] E. K. Laitinen, “A dynamic performance measurement system: evidence from small Finnish technology companies”, Scandinavian journal of management, Vol. 18 No. 1, pp. 65-99, Mar. 2002.
[21] H. G. Chong, “Measuring performance of small-and-medium sized enterprises: the grounded theory approach”, Journal of Business and Public Affairs, Vol. 2 No. 1, pp. 1-10, 2008.
[22] R. Chalmeta, S. Palomero, and M. Matilla, “Methodology to develop a performance measurement system in small and medium-sized enterprises”, International Journal of Computer Integrated Manufacturing, Vol. 25 No. 8, pp. 716-740, Mar. 2012.
[23] R. Adams, J. Bessant, and R. Phelps, “Innovation management measurement: A review”, International Journal of Management Reviews, Vol. 8 No. 1, pp. 21-47, Mar. 2006.
[24] J. Alegre, R. Lapiedra, and R. Chiva, “A measurement scale for product innovation performance”, European Journal of Innovation Management, Vol. 9 No. 4, pp. 333-346, 2006.
[25] V. Lazzarotti, R. Manzini, and L. Mari, “A model for R&D performance measurement”, International Journal of Production Economics, Vol. 134 No. 1, pp. 212-223, Nov. 2011.
[26] P. Schentler, F. Lindner, and R. Gleich, Innovation Performance Measurement, In Innovation and International Corporate Growth, pp. 299-317. Springer Berlin Heidelberg, Feb. 2010.
[27] H. Edison, N. Bin Ali, and R. Torkar, “Towards innovation measurement in the software industry”, Journal of Systems and Software, Vol. 86 No. 5, pp. 1390-1407, May 2013.
[28] E. H. Kessler, and A. K Chakrabarti, “Innovation speed: A conceptual model of context, antecedents, and outcomes”, Academy of Management Review, Vol. 21 No 4, pp. 1143-1191, Oct. 1996.
[29] C. Cruz-Cázares, C. Bayona-Sáez, and T. García-Marco, “You can’t manage right what you can’t measure well: Technological innovation efficiency”, Research Policy, Vol. 42 No. 6, pp. 1239-1250, July-Aug. 2013.
[30] M. L. Tushman, and C. A. O’ Reilly, “Ambidextrous organizations: Managing evolutionary and revolutionary change”, California Management Review, Vol. 38 No. 4, pp. 8-30, 1996.
[31] T. A. Hemphill, “BOOK REVIEW: Lead and Disrupt: How to Solve the Innovator’s Dilemma”. International Journal of Innovation Management, 1780001, Ap. 2017
[32] R. A. Burgelman , “Strategy as vector and the inertia of coevolutionary lock-in”, Administrative Science Quarterly, Vol. 47 No. 2, pp. 325-357, June 2002.
[33] R. R. Nelson, and S. G. Winter, An evolutionary theory of economic change, Cambridge, MA, 1982. [34] R. A. Burgelman, C. M. Christensen, and S. C. Wheelwright, Integrating technology and strategy: A general
management perspective, Strategic Management of Technology and Innovation, McGraw-Hill, Boston, pp. 1-12, 2004.
[35] B. Lawson, and D. Samson, “Developing innovation capability in organisations: a dynamic capabilities approach”. International journal of innovation management, Vol. 5 No. 3, pp. 377-400, Sep. 2001.
[36] C. A. O’Reilly, and M. L. Tushman, “Ambidexterity as a dynamic capability: Resolving the innovator's dilemma”, Research in organizational behavior, Vol. 28, pp. 185-206, June 2008.
[37] D. J. Teece, “Explicating dynamic capabilities: the nature and microfoundations of (sustainable) enterprise performance”, Strategic management journal, Vol. 28 No. 13, pp. 1319-1350, Aug. 2007.
[38] R. E. Freeman, Strategic management: A stakeholder approach. Cambridge University Press, Cambridge, UK, 2010.
[39] B. Menguc, and S. Auh, “The asymmetric moderating role of market orientation on the ambidexterity–firm performance relationship for prospectors and defenders”, Industrial Marketing Management, Vol. 37 No. 4, pp. 455-470, June 2008
[40] K. Atuahene Gima, “An exploratory analysis of the impact of market orientation on new product performance”, Journal of product innovation management, Vol. 12 No. 4, pp. 275-293, Sep. 1995.

International Journal of Innovative Research in Advanced Engineering (IJIRAE) ISSN: 2349-2163 Issue 03, Volume 4 (March 2017) www.ijirae.com
_________________________________________________________________________________________________ IJIRAE: Impact Factor Value – SJIF: Innospace, Morocco (2016): 3.916 | PIF: 2.469 | Jour Info: 4.085 |
ISRAJIF (2016): 3.715 | Indexcopernicus: (ICV 2015): 47.91 IJIRAE © 2014- 17, All Rights Reserved Page - 128
[41] R. Rothwell, “Successful industrial innovation: critical factors for the 1990s”, R&D Management, Vol. 22 No.3, pp. 221-240, July 1992.
[42] V. van de Vrande, J. P. J. de Jong, W. Vanhaverbeke, and M. de Rochemont, “Open innovation in SMEs: Trends, motives and management challenges”, Technovation, Vol. 29 No. 6-7, pp. 423-437, June–July 2009.
[43] F. Damanpour, “Organizational innovation: A meta-analysis of effects of determinants and moderators”, Academy of management journal, Vol. 34 No. 3, pp. 555-590, Sep. 1991.
[44] R. K. Yin, Case study research: Design and methods. Sage publications, 2009. [45] Y. C. Gagnon, L'étude de cas comme méthode de recherche: guide de réalisation, PUQ, 2005 [46] J. W Creswell, Qualitative inquiry and research design: Choosing among five approaches, 3rd ed. Sage
publications, Thousand Oaks, CA, 2012.


![PRISM Team Performance Diagnostic Report Team... · PRISM Team Performance Diagnostic Report [Continue] 1 What it measures In theory, work teams are created to produce optimum results](https://static.fdocuments.us/doc/165x107/5b840e367f8b9ad34a8b6316/prism-team-performance-diagnostic-team-prism-team-performance-diagnostic.jpg)

