![[Drum] Mel Bay - Complete Double Bass Drum Cookbook](https://static.fdocuments.us/doc/165x107/544a9d66af7959a0438b49fd/drum-mel-bay-complete-double-bass-drum-cookbook.jpg)
Double Bay Economic Feasibility Study Final - Prepared by ...
100
Prepared for Woollahra Municipal Council Final – July 2015 Double Bay Economic Feasibility Study
Transcript of Double Bay Economic Feasibility Study Final - Prepared by ...

Prepared for Woollahra Municipal Council
Final – July 2015
Double Bay Economic Feasibility Study
Double Bay Economic Feasibility Study
Ref: C15257- Final Hill PDA Page 2 | 94
QUALITY ASSURANCE
Report Contact
VIRGINIA HILL
Adv Dip Val, MProDev, PMAPI
Senior Consultant [email protected]
Quality Control
This document is for discussion purposes only unless signed and dated by a Principal of HillPDA.
Reviewed by:
Dated 24/7/2015
SARAH HILL
PhD (Candidate) M.Urban & Regional Planning (Hons) (USYD) BSc (USYD), Cert. UK Planning Law & Practice (MUL) MPIA, MRTPI MAICD, JP
Director [email protected]
Report Details Job Ref No: C15257 Version: 1 File Name: Double Bay Economic Feasibility Study Date Printed: 24/07/2015

Double Bay Economic Feasibility Study
Ref: C15257- Final Hill PDA Page 3 | 94
CONTENTS Executive Summary ...................................................................................................... 7
Demand and Affordability .................................................................................... 7
Stakeholder Engagement ................................................................................... 10
Recommendations and Options ......................................................................... 12
Feasibility ……………………………………………………………………………………………………….11
1 Study Purpose, Context and Approach ............................................................... 15
Study Approach .................................................................................................. 15
The Study Area ................................................................................................... 16
2 Who is and who will live in the Study Area? ....................................................... 19
Existing Population Characteristics ..................................................................... 19
Projected Population Characteristics ................................................................. 26
Existing and Forecast Household Characteristics ............................................... 28
What Does it All Mean? ...................................................................................... 33
3 Double Bay Market Research ............................................................................. 35
Residential Apartment Market Overview ........................................................... 35
Residential Apartment Sales Evidence ............................................................... 37
Retail Market Overview ...................................................................................... 44
Commercial Office Market Overview ................................................................. 47
Key Findings ........................................................................................................ 48
4 Housing Demand and Affordability .................................................................... 50
Woollahra Housing Affordability Calculator ....................................................... 50
Key Findings ........................................................................................................ 50
5 What the Stakeholders Said ............................................................................... 54
6 Feasibility Analysis .............................................................................................. 58
Financial Modelling Methodology ...................................................................... 58
Investment Value for Test Sites .......................................................................... 58
Location of Test Sites .......................................................................................... 59
Financial Feasibility Criteria ................................................................................ 61
Development Options ........................................................................................ 62
Modelling Results ............................................................................................... 63
Key Findings ........................................................................................................ 68
7 Findings, recommendations and Options ........................................................... 69
Key Findings ........................................................................................................ 69
Recommendations and Options ......................................................................... 71
Appendix A: Planning and Policy Context ................................................................... 75
Woollahra 2025 - Our community, our place, our plan 2013 ............................. 76
Double Bay Economic Feasibility Study
Ref: C15257- Final Hill PDA Page 4 | 94
Double Bay Place Plan 2014 ............................................................................... 76
Woollahra Local Environmental Plan 2014 ......................................................... 77
Zoning……………………………………………………………………………………………………………..77
Woollahra Development Control Plan 2015 (DCP) ............................................. 81
Appendix B: Financial Modelling Assumptions ........................................................... 84
Appendix C:Site One: Cross Street Financial Summary .............................................. 87
Appendix C: Site Two: Cross Street Financial Summary ............................................. 88
Appendix D: Site Three: New south Head Road Finanical SUmmary .......................... 89
Appendix E: Site Four: New South Head Road Finanical Summary ............................ 90
Appendix F: Site Five: New South Head Road Finanical Summary ............................. 91
Appendix G: Site Six: Bay Street Financial Summary .................................................. 92
TABLES Table 1 - Indicative Sale Prices by Apartment Type – Double Bay (2015) ................................... 10
Table 2- Population Growth by LGA and Locality 2001-2011 ..................................................... 20
Table 3: Household average occupancy size (SEPP65 Apartment Design Guide) ....................... 31
Table 4: Household average occupancy size (Double Bay Market Apartment Size Assumptions 32
Table 5 - Housing Structure and Tenure by Age Bracket ............................................................ 32
Table 6 - Forecast Dwelling Growth by LGAs and Locality (2011-2041) ...................................... 33
Table 7 - Embassy at Redleaf – Asking Prices ............................................................................. 38
Table 8 - The Lincoln – Asking Prices .......................................................................................... 39
Table 9 - The Bay Residences 2013-2014 ................................................................................... 40
Table 10 - Existing Sold Prices - March to May 2015 .................................................................. 41
Table 11 – Development Pipeline in Double Bay, Rose Bay and Edgecliff .................................. 43
Table 12 - Retail Sales Evidence in Centre – April 2014-April 2015 ............................................ 46
Table 13– Retail Net Leases in the Town Centre April 2014-April 2015...................................... 46
Table 14– Retail Gross Leases in the Centre ............................................................................... 47
Table 15 - Commercial Strata Sales ............................................................................................ 48
Table 16 - Indicative Sale Prices by Apartment Type for the Centre (June 2015) ....................... 53
Table 17 - Assumed Investment Values for the test sites ........................................................... 59
Table 18 - Performance Criteria ................................................................................................. 61
Table 19 - Site 1, Results ............................................................................................................. 63
Table 20 - Site 2 Results.............................................................................................................. 64
Table 21 - Site 3 Results.............................................................................................................. 64
Table 22 - Site 4 Results.............................................................................................................. 65
Table 23 - Site 5 Results.............................................................................................................. 66
Table 24 - Site 6 Results.............................................................................................................. 67

Double Bay Economic Feasibility Study
Ref: C15257- Final Hill PDA Page 5 | 94
FIGURES Figure 2: Boundary of Double Bay - Bellevue Hill SA2 (Locality) ................................................... 8
Figure 1: Overall breakdown of the Locality’s dwelling stock (2011)............................................ 8
Figure 3 - Projected Population Growth - by Locality and LGAs (2011-2041) ............................... 9
Figure 4 - Occupation of Residential Flats, Units and Apartments in the Locality by Age Group (2011) ........................................................................................................................................... 9
Figure 5 – Occupation of Semi-detached Dwellings by Age Group in the Locality by Age Group (2011) ........................................................................................................................................... 9
Figure 6 – Occupation of Separate Dwellings in the Locality by Age Group (2011) .................... 10
Figure 7 – Plan of the Double Bay Commercial Centre ............................................................... 16
Figure 8 - The Study Area in Context .......................................................................................... 17
Figure 9: Floor space by BLC, Double Bay 2013 .......................................................................... 18
Figure 10 - Boundary of Double Bay - Bellevue Hill SA2 (Locality) .............................................. 19
Figure 11 – Locality and LGAs Age Structure, 2011 .................................................................... 20
Figure 12 - Change in the Locality Age Structure 2001-2011 ...................................................... 21
Figure 13 - Locality Age Group vs Household Tenure ................................................................. 22
Figure 14 - Greater Sydney Age Group vs Household Tenure, 2011 ........................................... 23
Figure 15 - Locality Personal Weekly Income by Tenure Type 2011 ........................................... 23
Figure 16 - Greater Sydney Personal Weekly Income by Tenure Type ....................................... 24
Figure 17 - Proportion of Individual Weekly Income over Age Distribution (Locality) ................ 25
Figure 18 - Proportion of Individual Weekly Income over Age Distribution (Greater Sydney) ... 26
Figure 19 - Projected Population Percentage Growth (2011-2041) ............................................ 26
Figure 20 - Projected Age Group Contribution to Growth (2011–2041) ..................................... 27
Figure 21 - Projected Population - Dominant Age Groups (2011–2041) ..................................... 28
Figure 22 - LGAs and Locality Dwelling Structure Composition variance .................................... 29
Figure 23 - Residential Flats, Units and Apartments (Locality) ................................................... 29
Figure 24 -Proportion of Population in Dwelling Structures (Locality), 2011 .............................. 29
Figure 25 - Semi-detached (Locality) .......................................................................................... 29
Figure 26 - Separate House (Locality) ......................................................................................... 29
Figure 27 - Number of Bedroom in Dwelling Structures (Locality), 2011.................................... 30
Figure 28 - Number of Persons Residing in Dwellings (Locality), 2011 ....................................... 31
Figure 29 - LGAs and Locality Dwelling Projections 2011-2041 .................................................. 33
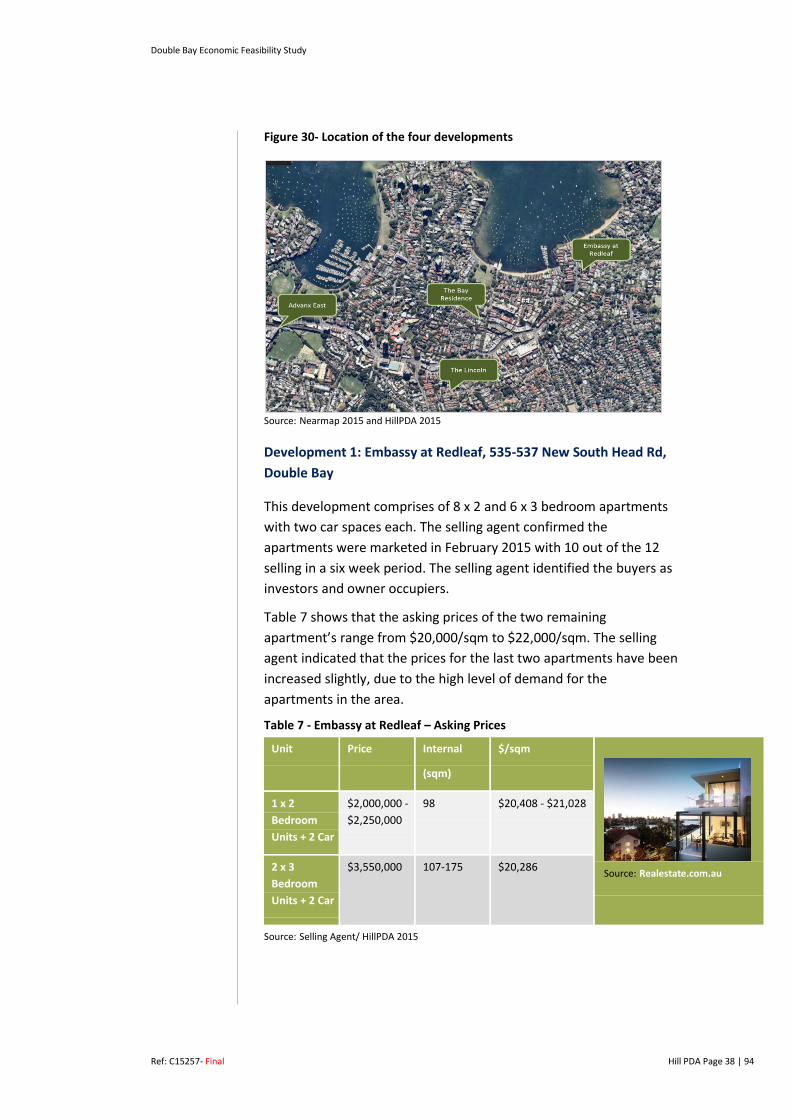
Figure 30- Location of the four developments ........................................................................... 38
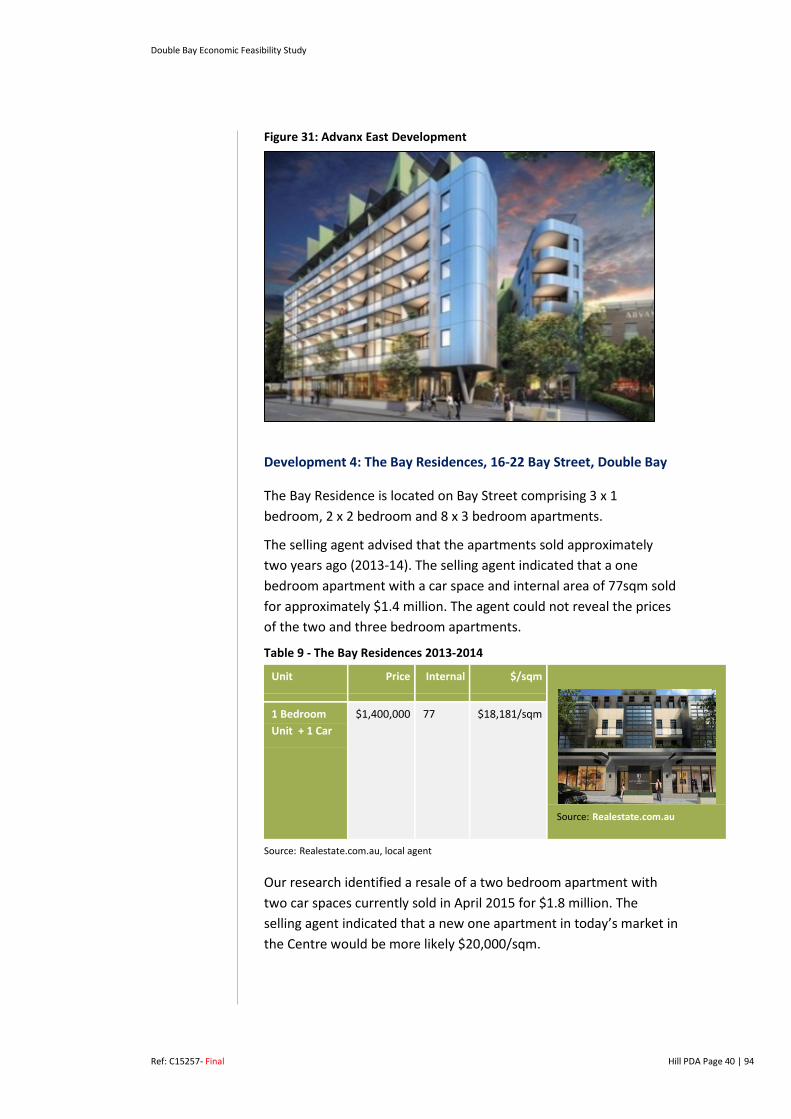
Figure 31: Advanx East Development ......................................................................................... 40
Figure 32 - Snapshot of the Woollahra LGA Affordability Calculator ....................................... 51
Figure 33 - Double Bay Business Centre ..................................................................................... 78
Figure 34 - Town Centre Floor Space Ratios ............................................................................... 79
Figure 35 - Height Limits within the Study Area ......................................................................... 79
Double Bay Economic Feasibility Study
Ref: C15257- Final Hill PDA Page 6 | 94
Figure 36 - Heritage Listed Properties within the Study Area ..................................................... 80
Figure 37 - Minimum Lot Size within the Study Area .................................................................. 80
Figure 38 - Double Bay Local Centre (Woollahra DCP 2015)....................................................... 81
Figure 39 - D5.5.3 Built form envelopes (levels 1 and 2) ............................................................ 82
Figure 40 - Built form envelopes (level 3+) ................................................................................. 82

Double Bay Economic Feasibility Study
Ref: C15257- Final Hill PDA Page 7 | 94
EXECUTIVE SUMMARY
Woollahra Municipal Council is committed to enhancing the vitality and viability of the Double Bay Commercial Centre (hereafter referred to as the Centre). One component of Council’s potential strategy to achieve this objective is to increase the number of residents living within the Centre through an increase in the number of shop top apartments.
In particular, Council is interested in pursuing a strategy that encourages development that provides a mix of smaller apartment sizes1 so as to achieve a diversity of price points and in turn younger age group residing within the Centre.
Despite the notable strength of the existing Sydney residential market, substantial new residential development is not occurring within the Centre. This Study was therefore commissioned to investigate from a planning and property economics perspective, any prospective barriers to increasing the number of apartments (and thereby residential population) in the Centre having particular regard to smaller sized apartments e.g. studio and one bedroom apartments.
To investigate these matters and inform the Study we reviewed the existing demographic and market characteristics of both Double Bay and the broader Eastern Suburbs Region. We have engaged with key stakeholders, reviewed the market’s ability to purchase existing dwellings (housing affordability) and tested the financial viability of a range of indicative sites in the Centre.
On this basis we have identified a range of planning and non-planning approaches for consideration by Council to support the objective of increasing the Centre’s population.
Demand and Affordability
Our research identified significant demand for housing within the Centre owing to its appeal as a waterfront location, within close proximity to Sydney CBD and its prestigious reputation. There was also general agreement that the Centre had become a more attractive location to a younger demographic owing to the activation created by its new wine bars, cafes and restaurants.
More broadly the area’s appeal is exemplified by the fact that over 80% of Woollahra LGA’s population growth (+1,744 people) over the past two census periods has occurred in the Double Bay-Bellevue Hill
1 Smaller Apartments: Studios and One bedrooms

Double Bay Economic Feasibility Study
Ref: C15257- Final Hill PDA Page 8 | 94
Statistical Area (hereafter referred to as the Locality). This residential growth is forecast to continue with 50% of the LGA’s future residential growth (+5,528 people) anticipated to occur within the Locality between 2011 and 20312.
Figure 2: Boundary of Double Bay - Bellevue Hill SA2 (Locality)
MapInfo2015 Source:
With respect to age distribution, as of 2011 the 25 to 34 year age bracket was the single largest age group, which is in the Locality in line with Woollahra and Waverley LGAs.
Whilst this age bracket has been steadily increasing in number over the past decade, the Department of Planning and Environment’s (DP&E) population forecasts by age anticipate this will change as older (50+ years) and younger age brackets (0 to 14 years) grow more significantly over the next 30 years. This change being a likely reflection of a maturing population in line with Sydney wide trends but it may also be in part a reflection of anticipated affordability challenges for younger age groups.
2 BTS Population Projections 2014
Source: ABS, Census of Population and Housing, 2011
Figure 1: Overall breakdown of the Locality’s dwelling stock (2011)

Double Bay Economic Feasibility Study
Ref: C15257- Final Hill PDA Page 9 | 94
Figure 3 - Projected Population Growth - by Locality and LGAs (2011-2041)
DP&E Projections and BTS Travel Zone Projections 2014 Source:
With respect to dwelling stock, the Locality is currently dominated (59%) by flats, apartments and unit dwellings (predominantly 2 bedroom dwellings) with 15 to 44 years olds occupying 50% of this stock. Younger residents within the Locality were also more likely to rent for a greater number of years when compared to the Greater Sydney Average.
The Locality’s younger demographic (25 to 34 year olds) was also found to be more affluent than their peers across Greater Sydney with 57% of Woollahra LGA’s residents in this age bracket earning over $1,000 per week as of 2011. Whilst this was a significantly greater proportion than the Greater Sydney average of (33%), in accordance with our housing affordability calculator, a $1,000 a week income would only support a mortgage of $450,0003.
As set out in Table 1 below however, it is anticipated that the entry point for a studio without car parking in the Centre would be in the order of $600,000 to $700,000. The asking price of a 1 bedroom apartment without car parking would start from $850,000. These entry points would only be affordable to a third (34%) and 20% respectively of the LGA’s existing 25 to 34 year olds assuming individual purchase.
3 The model profiles household income bands based on Woollahra LGA’s Census Data (indexed to 2015 dollars) and the level of rent / debt that each household income level could pay dependant on key variables (i.e. 5.7% interest rate, 10% deposit and no other equity).
0%10%20%30%40%50%60%70%80%90%
0 to 19 20 to 34 35 to 49 50 to 64 65 +
Popu
latio
n G
row
th (%
)
Age Group (years) Waverley (LGA)
Woollahra (LGA)
Double Bay - Bellevue Hill SA2
Figure 5 – Occupation of Semi-detached Dwellings by Age Group in the Locality by Age Group (2011)
Figure 4 - Occupation of Residential Flats, Units and Apartments in the Locality by Age Group (2011)

Double Bay Economic Feasibility Study
Ref: C15257- Final Hill PDA Page 10 | 94
Our market research shows however that there is no product on the market in the Centre in this price range verifying Councils identified need for this Study.
It is also noted that affordability could be greatly enhanced should two individuals combine to collectively service a home loan together. This could however necessitate the purchase of a larger apartment with a second bedroom that would in turn increase the anticipated price point to over the $1.4m mark. On this basis, a new 2 bedroom dwelling would only remain affordable to the highest earning (top 20% - 25%) of 25 to 34 year olds for purchase.
Table 1 - Indicative Sale Prices by Apartment Type – Double Bay (2015)
Apartment Size Sale Price Range Car Space $/sqm
Studio (45sqm) $600,000 to $700,000
$13,300/sqm to $15,500/sqm
Studio (45sqm) $700,000 to $800,000
$15,500/sqm to $17,700/sqm
1 Bedroom (55sqm internal)
$850,000- $950,000
$15,500/sqm - $17,280/sqm
1 Bedroom (55sqm internal)
$950,000 to $1,050,000
$17,500/sqm to $19,000/sqm
2 Bedroom (85sqm internal)
$1.4m to $1.5m
$16,470/sqm to $17,647/sqm
2 Bedroom (85sqm internal)
$1.5m to $1.6m
$17,647/sqm to $18,823/sqm
Stakeholder Engagement
Building on this demographic and market research, a range of Stakeholders were engaged to inform the research and to better understand the economic factors influencing housing supply. The Stakeholders represented landowners, developers, local businesses and industry experts.
The Stakeholders reiterated the attraction of Double Bay as a residential market that was well positioned for significant investment. This enthusiasm being explained by the number and calibre of Stakeholders who chose to participate in the engagement exercise.
The Stakeholders agreed that there was strong demand for smaller units and considered some locations better suited to this dwelling type within the Centre (i.e. those in closer proximity to the wine bars, cafes and restaurants). It was also agreed that there was a market for studio or one bedroom apartments without car parking in lieu of a
Figure 6 – Occupation of Separate Dwellings in the Locality by Age Group (2011)

Double Bay Economic Feasibility Study
Ref: C15257- Final Hill PDA Page 11 | 94
lower sale price. This was not the case however for two or three bedroom apartments.
Despite this support, Stakeholders identified a major barrier to Council’s objective of achieving redevelopment and population growth within the Centre was the existing planning controls, having particular regard to the over-riding height controls. In this respect Stakeholders identified that existing floor space ratios and building heights were not sufficient enough to facilitate viable redevelopment.
Subject to overcoming the viability challenges related to the existing planning controls, the Stakeholders identified that they would be likely to develop apartments to a high quality within the Centre. These developments would also be likely to provide a mix of apartment sizes, particularly on lower levels that did not benefit from the same views as the more valuable apartments on the upper levels. This would spread their market appeal whilst supporting Council’s objectives for a mix of age groups and additional vitality in the Centre.
Feasibility
Our feasibility testing of six indicative sites across the Centre confirms the views of stakeholders that redevelopment under the current planning controls is not financially viable in the majority of cases. This largely being a result of three key factors:
The high underlying land values in the Centre;
The high investment value of the majority of sites (that is the return achieved by the existing businesses and uses on the sites);
The need to amalgamate sites in some cases to achieve a development site of a reasonable scale.
These three factors are not outweighed by the ‘incentive’ to redevelop – that is, the potential development yield that could be achieved under the current planning controls. Our testing of 4 of the 6 sites within the Centre found that redevelopment in the current strong market would not be financially viable. The two exceptions being larger sites with lower existing investment and improvement values (i.e. larger sites with older and / or smaller buildings).
Our testing also confirms that basement level car parking has a compounding adverse effect to viability whilst a mix of apartment sizes (including larger apartments with views) is important to improving financial outcomes.
What we refer to as the tipping point is the minimum FSR (and in turn building height) required to achieve a financially viable development (i.e. an IRR of 18% and a Development Margin of 20%)

Double Bay Economic Feasibility Study
Ref: C15257- Final Hill PDA Page 12 | 94
Recommendations and Options
In light of the Study’s research and above referenced findings, to achieve Council’s stated objectives for the Centre we would primarily recommend:
1. Council reviews its existing planning controls having particular regard to building height and FSR.
We recognise that there are many factors that need to be considered in determining a permissible building height and envelope for any given site or Centre. On the basis of development feasibility alone we have found however that the majority of the sites within the Centre require an increase in FSR to a minimum of 2.8:1 and generally greater than 3:1 to become viable.
To this effect we would recommend Council consider a review of their planning controls to permit an FSR of between 3:1 and 3.5:1. The most appropriate FSR or FSRs within this range (or otherwise) would be dependent on urban design testing and other environmental considerations. Each site and its ‘tipping point’ must however be considered on its merits.
As a final consideration we highlight that this recommendation is based on the requirement for ground floor commercial / retail uses and residential on all upper floors. Whilst an additional floor (i.e. first floor) of commercial uses within a development in the Centre would support the provision of additional jobs and a greater level of day time activity. However with commercial achieving lower sale / rental value in comparison to residential, an additional floor of commercial means the FSR 3:1 – 3.5:1 range would necessitate a greater FSR than the recommended and thereby building height.
In the case of Recommendation 1 being implemented, there would be greater incentive for redevelopment within the Centre that is likely to result in the provision of a mix of apartment sizes. To support the latter objective further however we have also considered the following 5 options, each with their own pros and cons with respect to achieving desirable outcomes.
1. Option: A reduction in required car parking rates for studio and one bedroom apartments in the Centre (and potentially within a reasonable radius of the Centre). The intention of this option being to incentivise the provision of smaller dwellings at lower

Double Bay Economic Feasibility Study
Ref: C15257- Final Hill PDA Page 13 | 94
prices on sites with car parking constraints and by reducing the cost of construction.
2. Option: Minimum requirement for studio and / or one bedroom apartments i.e. a policy requirement for 30% - 40% of all dwellings to be provided as studio or one bedroom apartments within the Centre.
Our modelling has identified however that a requirement for smaller apartments) should also allow for a mix of larger apartment sizes 4as the sale values achieved by the latter are an important means of supporting the financial viability of redevelopment within a Centre such as Double Bay. Accordingly the requirement to provide too great a proportion of smaller apartments could act as a financial disincentive on some sites.
3. Option: Maximum unit size i.e. a policy requirement that all (or the majority) of 1 bedroom and 2 bedroom apartments are no more than 10% in size above SEPP 65 minimums i.e. 50sqm + 10% and 70sqm +10% respectively. By keeping the apartments smaller than many of those currently on the market, and possibly working in conjunction with Option 2, the intention is that they will be presented to the market within a more affordable price bracket suited to younger residents.
4. Option: Bonus FSR for the provision of additional smaller dwellings to provide a positive incentive for the development of additional smaller dwellings in conjunction with, or separate to, Options 2 and 3 (minimum provision and maximum size).
We note however that the provision of an FSR bonus would need to exceed the additional height and FSR given by Council to facilitate the viable redevelopment of sites within the Centre over and above the existing planning controls. This option would therefore require a careful balance between maintaining the amenity of the Centre whilst enhancing its development viability.
5. Option: Compact apartments – this final option relates to the provision of apartments sized below the SEPP 65 guidelines of 50sqm for 1 bedroom apartments e.g. 40sqm.
4 Larger Apartments: Two, three and four bedrooms apartments
An example of a compact dwelling layout in London
Double Bay Economic Feasibility Study
Ref: C15257- Final Hill PDA Page 14 | 94
International research (New York, London and Toronto) identifies that for affordability and lifestyle reasons young professionals are increasingly willing to trade apartment size for location and lifestyle. This is a prospect that has a number of benefits yet a number of unresolved challenges in a Sydney context, one of which being the impact of compact apartments to residential and design amenity. Should these barriers be overcome however, such an approach may have its benefits by facilitating additional residents within a given development and a more affordable price point for younger professionals.
In summary we suggest that as a starting point Council consider Recommendation 1, a review of existing FSR’s and thereby building heights, subject to urban design and amenity testing, to encourage redevelopment within the Centre and an increase in residents and workers in general.
To more specifically target smaller apartments we suggest that Council considers Option 1 (reduced car parking), layered with Options 2 and 3 (minimum apartment mix and maximum sizes).
Options 4 and 5 may also have merit however they would require notably greater analysis and testing. They may be considered longer term opportunities and outcomes; however they are not likely to be options that could be resolved in time to support development in the current residential market cycle.
Double Bay Economic Feasibility Study
Ref: C15257- Final Hill PDA Page 15 | 94
1 STUDY PURPOSE, CONTEXT AND APPROACH
HillPDA has been commissioned by Woollahra Municipal Council (Council) to undertake an Economic Feasibility Study (the Study), with a specific focus on the demand for, supply of and financial viability of smaller sized apartments within the Double Bay Commercial Centre (the Centre).
Council highlighted the underlying intent of the Study was to:
Attract a younger demographic of ‘city makers’ into the Centre to enhance its vitality and viability;
Explore why substantial new development is presently not occurring in the Centre; and
Highlight the planning controls and non-planning options that could be implemented to facilitate an additional residential population of up to 1,000 people.
To address this intent, the Study seeks to provide:
An understanding of the existing demand for smaller dwellings ( i.e studios and one bedrooms) by younger residents and how this relates to affordability;
Advice concerning the financially viability of providing smaller sized apartments with respect to the Centre’s existing planning controls; and
Recommendations to support the provision of a mix of additional housing in the Centre in support of Council’s objectives.
Study Approach
To inform the Study we have reviewed relevant local and State Government policies and strategies (Appendix 1) together with ABS Census Data to better understand the existing planning and demographic context (Chapter 2) of both Double Bay and the broader Eastern Suburbs Region.
We have reviewed property databases and interviewed industry experts (including real-estate agents, local developers, and land and business owners) to inform our market analysis (Chapters 3 and 5). This information has been subsequently cross examined with demographic and market data to better understand the affordability of existing apartment supply for younger residents (Chapter 4).
Collectively this data has informed the feasibility testing of six nominated sites in the Centre in accordance with the current
Double Bay Economic Feasibility Study
Ref: C15257- Final Hill PDA Page 16 | 94
planning controls and then under a range of different development scenarios to test the sensitivity of outcomes (Chapter 6).
Collectively this data and the test results have informed our recommendations to Council regarding the viability of smaller apartments in the Centre and means to support additional residential population outcomes (Chapter 7).
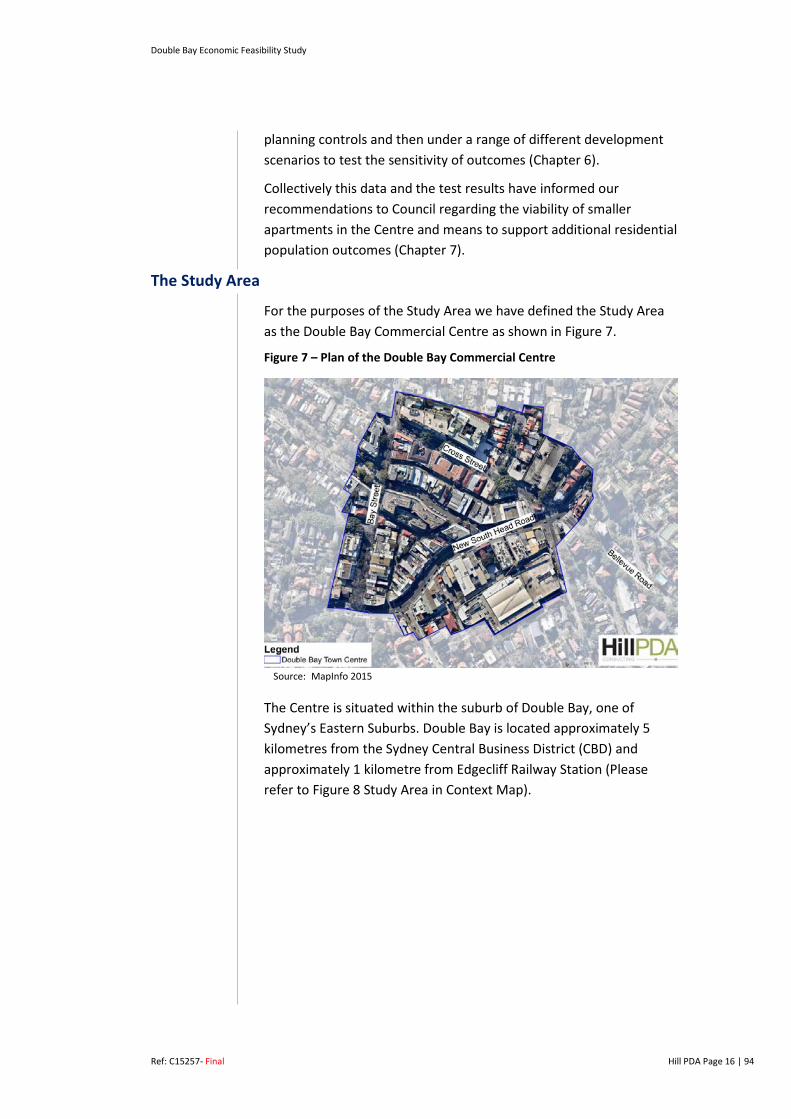
The Study Area
For the purposes of the Study Area we have defined the Study Area as the Double Bay Commercial Centre as shown in Figure 7.
Figure 7 – Plan of the Double Bay Commercial Centre
MapInfo 2015 Source:
The Centre is situated within the suburb of Double Bay, one of Sydney’s Eastern Suburbs. Double Bay is located approximately 5 kilometres from the Sydney Central Business District (CBD) and approximately 1 kilometre from Edgecliff Railway Station (Please refer to Figure 8 Study Area in Context Map).

Double Bay Economic Feasibility Study
Ref: C15257- Final Hill PDA Page 17 | 94
Figure 8 - The Study Area in Context
MapInfo 2015 Source:
Double Bay is well serviced by bus and ferry public transport services. The major arterial road, New South Head Road, runs directly through the Centre.
The Centre is well regarded as a premium retail precinct with numerous, restaurants, café’s, health and beauty services, commercial office space, specialty stores and designer label shops. A mix of business services are also offered together with new large format Woolworths.
Over the last five years the area has transformed from a culture of street-side cafes and restaurants to include a number of licensed bars enhancing its appeal and draw to a younger demographic.
The Centre’s built form is largely defined by a relatively fine-grain lot layout, with larger sites already accommodating larger format land uses such as commercial offices, the supermarket and hotel premises. The remaining built form in the Centre is of a lower scale, generally two to three storeys, with ground floor retail and commercial uses on the upper floors.
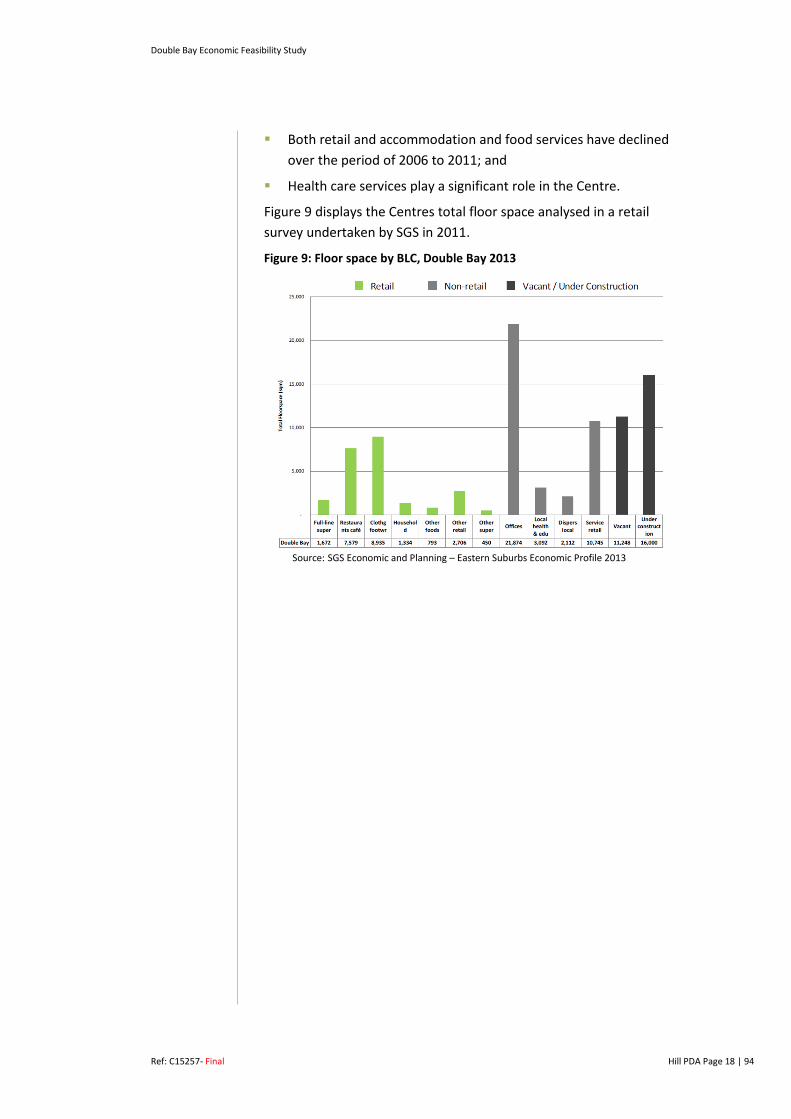
In accordance with a floor space survey outlined in the Eastern Suburb Economic Profile, the following observations were made:
A high vacancy rate of 13% was recorded (11,000sqm); however a portion would likely be absorbed by a new hotel being established;
A high portion of space occupied in the Centre is office space 22,000sqm of office space;
Double Bay Economic Feasibility Study
Ref: C15257- Final Hill PDA Page 18 | 94
Both retail and accommodation and food services have declined over the period of 2006 to 2011; and
Health care services play a significant role in the Centre.
Figure 9 displays the Centres total floor space analysed in a retail survey undertaken by SGS in 2011.
Figure 9: Floor space by BLC, Double Bay 2013
SGS Economic and Planning – Eastern Suburbs Economic Profile 2013 Source:
Double Bay Economic Feasibility Study
Ref: C15257- Final Hill PDA Page 19 | 94
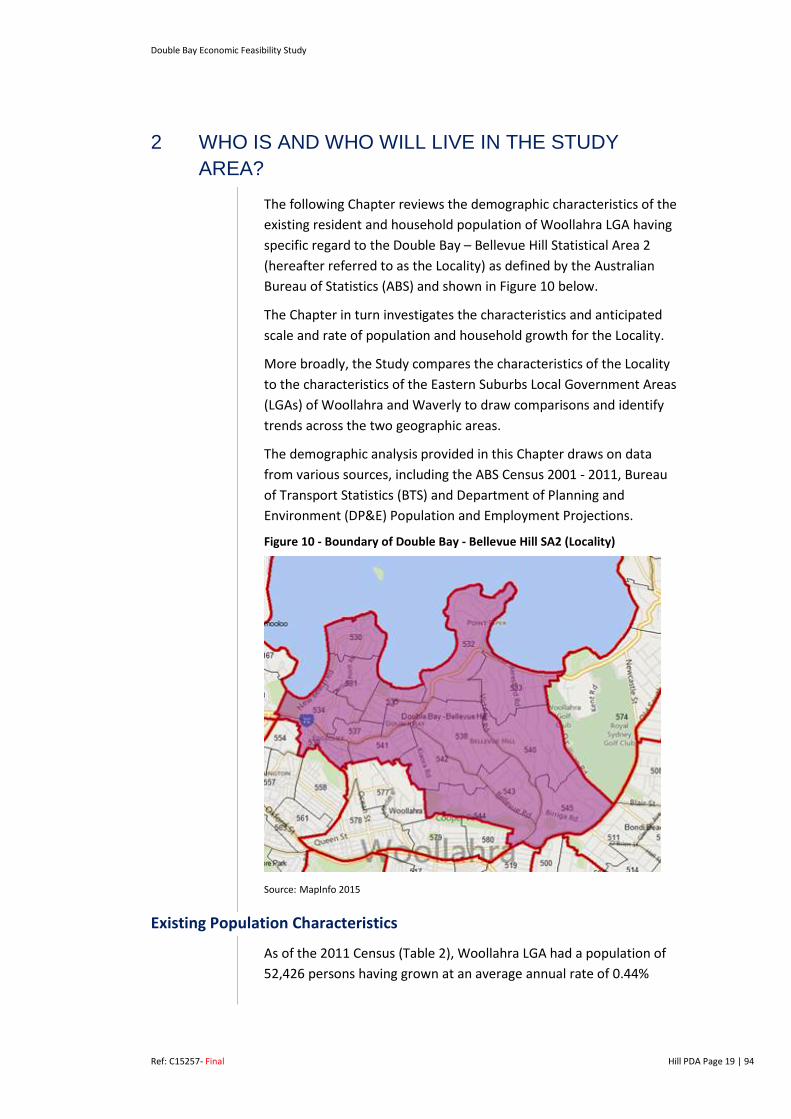
2 WHO IS AND WHO WILL LIVE IN THE STUDY AREA?
The following Chapter reviews the demographic characteristics of the existing resident and household population of Woollahra LGA having specific regard to the Double Bay – Bellevue Hill Statistical Area 2 (hereafter referred to as the Locality) as defined by the Australian Bureau of Statistics (ABS) and shown in Figure 10 below.
The Chapter in turn investigates the characteristics and anticipated scale and rate of population and household growth for the Locality.
More broadly, the Study compares the characteristics of the Locality to the characteristics of the Eastern Suburbs Local Government Areas (LGAs) of Woollahra and Waverly to draw comparisons and identify trends across the two geographic areas.
The demographic analysis provided in this Chapter draws on data from various sources, including the ABS Census 2001 - 2011, Bureau of Transport Statistics (BTS) and Department of Planning and Environment (DP&E) Population and Employment Projections.
Figure 10 - Boundary of Double Bay - Bellevue Hill SA2 (Locality)
MapInfo 2015 Source:
Existing Population Characteristics
As of the 2011 Census (Table 2), Woollahra LGA had a population of 52,426 persons having grown at an average annual rate of 0.44%
Double Bay Economic Feasibility Study
Ref: C15257- Final Hill PDA Page 20 | 94
over the ten year period (between the 2001 and 2011 Census years) or by 4.35% overall.
A similar, although slightly higher rate of growth (4.73%) occurred in the Waverley LGA over this period. Interestingly, the Locality experienced a higher rate of population growth than both LGA’s of 7.97% over the ten year census period. In view of the modest net increase in population in the Woollahra LGA of 2186 persons, this means that the Locality contributed to over 81% of the LGA’s growth. This may be largely as a consequence of the geographic extent of the Locality.
Table 2- Population Growth by LGA and Locality 2001-2011 2001 2006 2011 Net
Increase 01-11
Net increase %
% Growth p.a.
Waverley LGA 61,332 61,688 64,230 2,898 4.73% 0.47%
Woollahra LGA 50,240 50,423 52,426 2,186 4.35% 0.44%
Double Bay - Bellevue Hill Locality
22,270 22,450 24,044 1,774 7.97% 0.80%
ABS, Census of Population and Housing, 2011 Source:
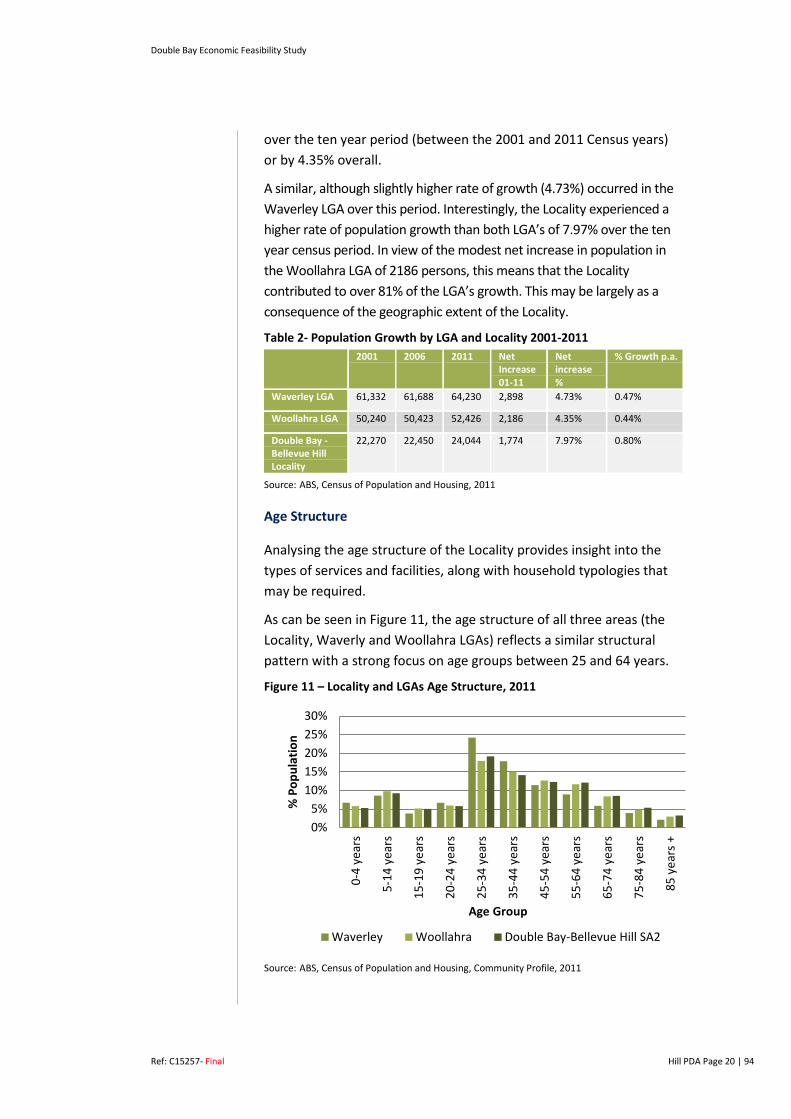
Age Structure
Analysing the age structure of the Locality provides insight into the types of services and facilities, along with household typologies that may be required.
As can be seen in Figure 11, the age structure of all three areas (the Locality, Waverly and Woollahra LGAs) reflects a similar structural pattern with a strong focus on age groups between 25 and 64 years.
Figure 11 – Locality and LGAs Age Structure, 2011
ABS, Census of Population and Housing, Community Profile, 2011 Source:
0%5%
10%15%20%25%30%
0-4
year
s
5-14
yea
rs
15-1
9 ye
ars
20-2
4 ye
ars
25-3
4 ye
ars
35-4
4 ye
ars
45-5
4 ye
ars
55-6
4 ye
ars
65-7
4 ye
ars
75-8
4 ye
ars
85 y
ears
+
% P
opul
atio
n
Age Group
Waverley Woollahra Double Bay-Bellevue Hill SA2

Double Bay Economic Feasibility Study
Ref: C15257- Final Hill PDA Page 21 | 94
The most dominant age bracket across all three catchments, as of 2011 Census, was the 25-34 year age bracket.
Over the past decade and as shown in Figure 12, this younger demographic has been steadily contributing to population growth in the Locality along with the 30 to 39 year age groups, indicating the growing desirability of the Locality to younger and middle age residents.
This increase also aligns with the growth in the in 0-9 year age group (particularly 0 to 4 year olds), suggesting that there is a growing proportion of younger family households moving into the area and existing households having children.
Notwithstanding this, the largest population increase in the Locality over the same 10 year period was the 60-69 year age group. This is likely to be reflective of downsizers looking to move into the suburb for lifestyle and amenity reasons, together with the aging of the existing population in place, consistent with broader Sydney and NSW trends.
Figure 12 - Change in the Locality Age Structure 2001-2011
ABS, Census of Population and Housing, 2011 Source:
The growth of a younger demographic or ‘City Makers’, living in inner city localities is a trend being experienced in other LGA’s across Sydney together with the inner ring suburbs of global cities such as London and New York5. This is likely caused by the shift in lifestyle preference with younger households willing to trade off dwelling size and ownership in return for better quality living spaces, in close proximity to jobs, amenities and activities.
5 City of Sydney Housing Diversity Study, undertaken by HillPDA, reflected a growing population of ‘city makers’ aged between 15-40 years living in inner city suburbs.
-300-200-100
0100200300400500600
0-4
5-9
10-1
415
-19
20-2
425
-29
30-3
435
-39
40-4
445
-49
50-5
455
-59
60-6
465
-69
70-7
475
-79
80-8
485
+
Chan
ge in
num
ber o
f peo
ple
Age Group (years)
Double Bay Economic Feasibility Study
Ref: C15257- Final Hill PDA Page 22 | 94
Studies also show that younger age groups also tend to be characterised by having a higher renter profile and being generally more upwardly mobile with greater disposable incomes.
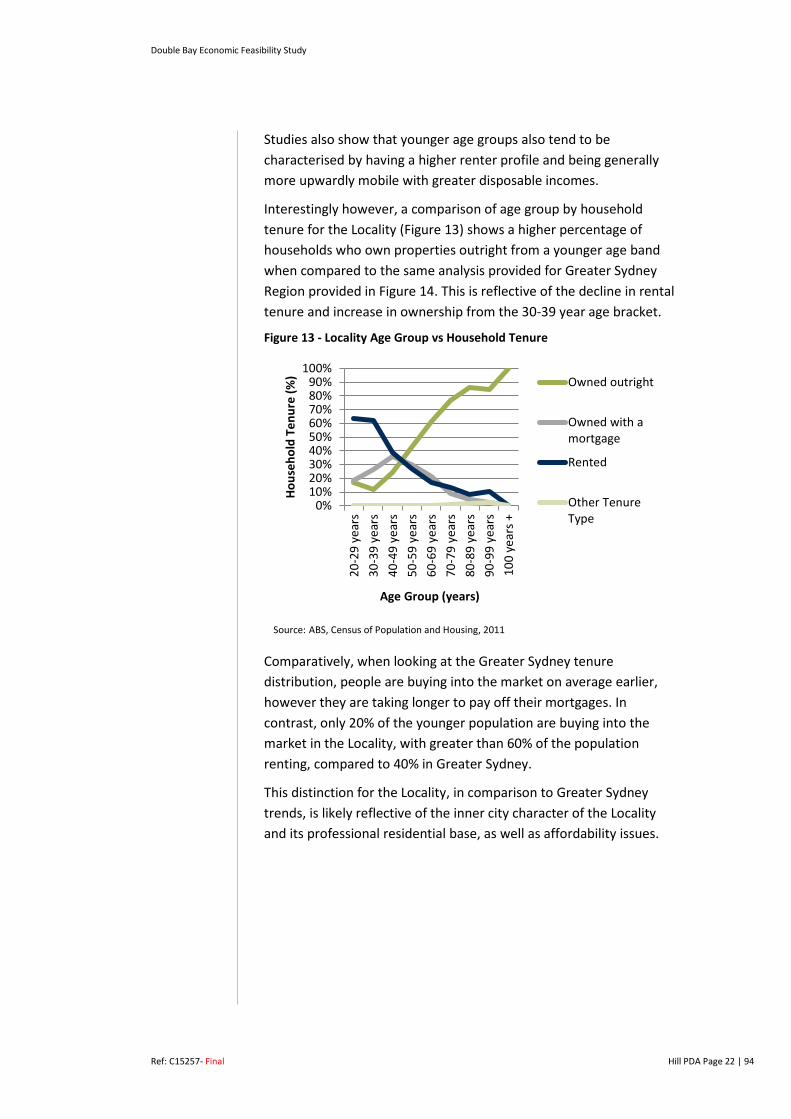
Interestingly however, a comparison of age group by household tenure for the Locality (Figure 13) shows a higher percentage of households who own properties outright from a younger age band when compared to the same analysis provided for Greater Sydney Region provided in Figure 14. This is reflective of the decline in rental tenure and increase in ownership from the 30-39 year age bracket.
Figure 13 - Locality Age Group vs Household Tenure
ABS, Census of Population and Housing, 2011 Source:
Comparatively, when looking at the Greater Sydney tenure distribution, people are buying into the market on average earlier, however they are taking longer to pay off their mortgages. In contrast, only 20% of the younger population are buying into the market in the Locality, with greater than 60% of the population renting, compared to 40% in Greater Sydney.
This distinction for the Locality, in comparison to Greater Sydney trends, is likely reflective of the inner city character of the Locality and its professional residential base, as well as affordability issues.
0%10%20%30%40%50%60%70%80%90%
100%20
-29
year
s30
-39
year
s40
-49
year
s50
-59
year
s60
-69
year
s70
-79
year
s80
-89
year
s90
-99
year
s10
0 ye
ars +
Hous
ehol
d Te
nure
(%)
Age Group (years)
Owned outright
Owned with amortgage
Rented
Other TenureType
Double Bay Economic Feasibility Study
Ref: C15257- Final Hill PDA Page 23 | 94
Figure 14 - Greater Sydney Age Group vs Household Tenure, 2011
ABS, Census of Population and Housing, 2011 Source:
Income Profile
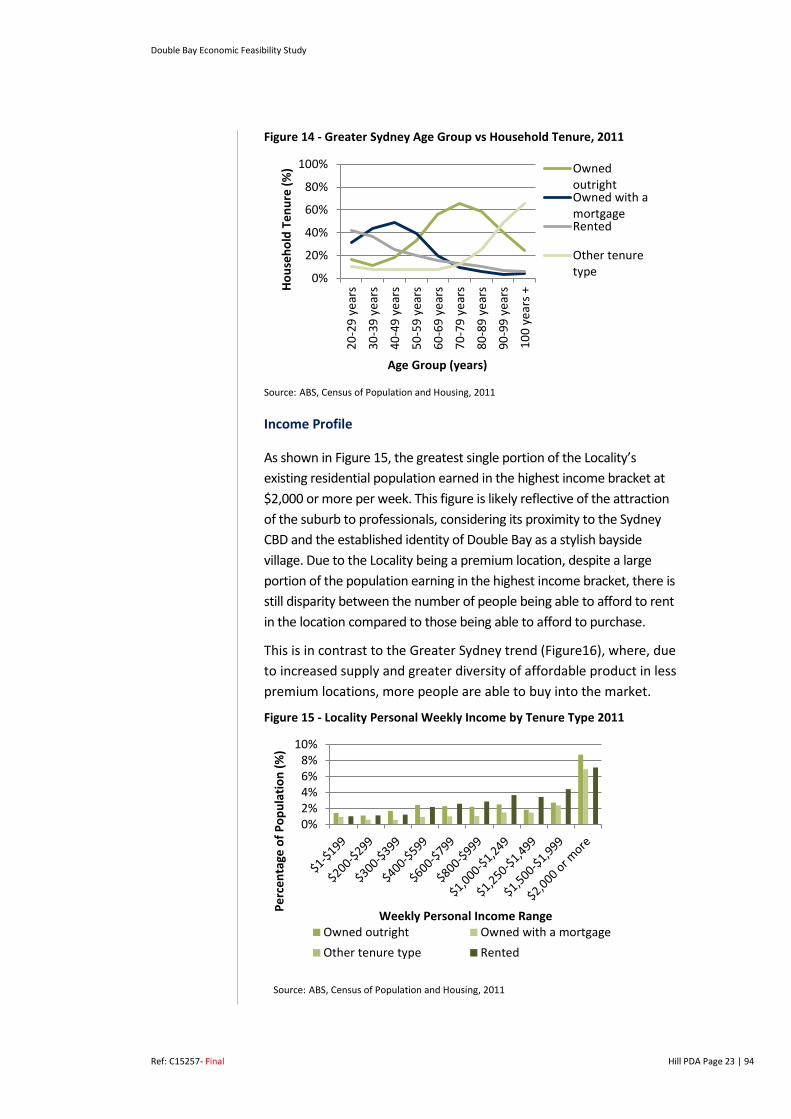
As shown in Figure 15, the greatest single portion of the Locality’s existing residential population earned in the highest income bracket at $2,000 or more per week. This figure is likely reflective of the attraction of the suburb to professionals, considering its proximity to the Sydney CBD and the established identity of Double Bay as a stylish bayside village. Due to the Locality being a premium location, despite a large portion of the population earning in the highest income bracket, there is still disparity between the number of people being able to afford to rent in the location compared to those being able to afford to purchase.
This is in contrast to the Greater Sydney trend (Figure16), where, due to increased supply and greater diversity of affordable product in less premium locations, more people are able to buy into the market.
Figure 15 - Locality Personal Weekly Income by Tenure Type 2011
ABS, Census of Population and Housing, 2011 Source:
0%
20%
40%
60%
80%
100%
20-2
9 ye
ars
30-3
9 ye
ars
40-4
9 ye
ars
50-5
9 ye
ars
60-6
9 ye
ars
70-7
9 ye
ars
80-8
9 ye
ars
90-9
9 ye
ars
100
year
s +
Hous
ehol
d Te
nure
(%)
Age Group (years)
OwnedoutrightOwned with amortgageRented
Other tenuretype
0%2%4%6%8%
10%
Perc
enta
ge o
f Pop
ulat
ion
(%)
Weekly Personal Income Range Owned outright Owned with a mortgageOther tenure type Rented

Double Bay Economic Feasibility Study
Ref: C15257- Final Hill PDA Page 24 | 94
Greater Sydney also had a high proportion of ‘low income earners’ owning property outright: this statistic being a likely reflection of the ‘retired population’ who may be more asset rich i.e. no longer earning a weekly salary.
Figure 16 - Greater Sydney Personal Weekly Income by Tenure Type
ABS, Census of Population and Housing, 2011 Source:
As can be seen in the heat graphic in Figure 17, a significant proportion of the Locality’s total existing resident population was earning in the highest weekly pay bracket, well above the Greater Sydney median of $619 per week6. This trend emerges in the 25-29 year age demographic and remains dominant until the 65-69 year age demographic, which may be a reflection of the proportion of residents in this age group retiring from working. It is important to note however that this table is not an indication of individuals underlying asset base and therefore wealth.
6 Australian Bureau of Statistics, 2011 Census Quick Stats, People – employment, Median Weekly Incomes - Personal
0.0%1.0%2.0%3.0%4.0%5.0%6.0%
Perc
enta
ge o
f Pop
ulat
ion
(%)
Weekly Personal Income Range
Owned outright Owned with a mortgage
Other tenure type Rented

Double Bay Economic Feasibility Study
Ref: C15257- Final Hill PDA Page 25 | 94
Figure 17 - Proportion of Individual Weekly Income over Age Distribution (Locality)
ABS, Census of Population and Housing, 2011 Source:
Comparatively, the income distribution of Greater Sydney population is more dispersed across the age and income bands (Figure 18). The most dominant income concentrations are for 25-29 year olds earning between $600-$1249 per week (1.2%) and 30-54 year olds earning $2,000 or more (1.0%-1.4%). Whereas, the Locality had a greater proportion of younger residents earning in the highest income bracket, reflecting a more professional population.
Other/Not Applicable
$1-$199
$200-$299
$300-$399
$400-$599
$600-$799
$800-$999
$1,000-$1,249
$1,250-$1,499
$1,500-$1,999
$2,000 or more
15-19 years 4.4% 1.0% 0.2% 0.1% 0.1% 0.0% 0.0% 0.0% 0.0% 0.0% 0.0% 20-24 years 1.9% 0.7% 0.5% 0.4% 0.6% 0.9% 0.6% 0.5% 0.3% 0.2% 0.1% 25-29 years 2.4% 0.2% 0.2% 0.2% 0.5% 0.8% 1.0% 1.6% 1.4% 1.5% 1.4% 30-34 years 2.2% 0.2% 0.2% 0.1% 0.4% 0.5% 0.7% 0.9% 1.2% 1.9% 2.9% 35-39 years 1.9% 0.1% 0.2% 0.2% 0.4% 0.5% 0.5% 0.7% 0.7% 1.0% 2.8% 40-44 years 1.6% 0.2% 0.2% 0.1% 0.4% 0.4% 0.5% 0.5% 0.5% 0.8% 2.5% 45-49 years 1.5% 0.2% 0.2% 0.2% 0.4% 0.4% 0.4% 0.4% 0.5% 0.8% 2.4% 50-54 years 1.3% 0.1% 0.2% 0.2% 0.4% 0.4% 0.4% 0.6% 0.4% 0.6% 2.4% 55-59 years 1.3% 0.1% 0.1% 0.2% 0.3% 0.4% 0.4% 0.5% 0.4% 0.6% 2.2% 60-64 years 1.4% 0.2% 0.2% 0.3% 0.6% 0.4% 0.5% 0.7% 0.6% 0.7% 2.1% 65-69 years 1.1% 0.2% 0.2% 0.3% 0.5% 0.3% 0.4% 0.5% 0.3% 0.4% 1.5% 70-74 years 0.9% 0.1% 0.2% 0.3% 0.4% 0.4% 0.3% 0.4% 0.2% 0.3% 0.9% 75-79 years 0.6% 0.2% 0.1% 0.3% 0.3% 0.2% 0.2% 0.2% 0.2% 0.3% 0.5% 80-84 years 0.7% 0.1% 0.1% 0.3% 0.3% 0.2% 0.2% 0.1% 0.2% 0.2% 0.6% 85-89 years 0.6% 0.0% 0.1% 0.2% 0.2% 0.2% 0.1% 0.2% 0.1% 0.2% 0.4% 90-94 years 0.3% 0.0% 0.0% 0.1% 0.1% 0.1% 0.1% 0.1% 0.0% 0.1% 0.2% 95-99 years 0.1% 0.0% 0.0% 0.0% 0.0% 0.0% 0.0% 0.0% 0.0% 0.0% 0.0% 100 years + 0.0% 0.0% 0.0% 0.0% 0.0% 0.0% 0.0% 0.0% 0.0% 0.0% 0.0% Total 24.1% 3.6% 3.0% 3.7% 5.8% 6.1% 6.4% 7.9% 6.9% 9.7% 22.9%

Double Bay Economic Feasibility Study
Ref: C15257- Final Hill PDA Page 26 | 94
Figure 18 - Proportion of Individual Weekly Income over Age Distribution (Greater Sydney)
ABS, Census of Population and Housing, 2011 Source:
Projected Population Characteristics
Despite the growth of the 25-39 year age bracket in the Locality over the past two census periods, looking forward, the population forecast data provided by both the Department of Planning and Environment and BTS Projections suggests that this age group will experience the lowest proportional growth of any age group over the next 30 years (see Figure 19).
Figure 19 - Projected Population Percentage Growth (2011-2041)
BTS Population Projections 2014 Source:
0%20%40%60%80%
100%
0 to 19 20 to 34 35 to 49 50 to 64 65 +
Popu
latio
n G
row
th (%
)
Age Group (years)
Waverley (LGA) Woollahra (LGA) Locality
Other/Not Applicable
$1-$199
$200-$299
$300-$399
$400-$599
$600-$799
$800-$999
$1,000-$1,249
$1,250-$1,499
$1,500-$1,999
$2,000 or more Total
15-19
4.2% 2.2% 0.5% 0.3% 0.3% 0.1% 0.0% 0.0% 0.0% 0.0% 0.0% 7.8% 20-24
2.1% 1.0% 0.9% 0.7% 1.1% 1.2% 0.8% 0.6% 0.2% 0.1% 0.0% 8.8%
25-29
1.7% 0.4% 0.5% 0.5% 0.9% 1.2% 1.2% 1.3% 0.9% 0.7% 0.4% 9.7% 30-34
1.5% 0.4% 0.5% 0.4% 0.8% 0.9% 0.9% 1.0% 0.9% 1.1% 1.0% 9.5%
35-39
1.3% 0.5% 0.5% 0.4% 0.8% 0.9% 0.8% 0.9% 0.8% 1.1% 1.4% 9.4% 40-44
1.2% 0.4% 0.5% 0.5% 0.8% 0.9% 0.8% 0.8% 0.7% 1.0% 1.3% 9.0%
45-49
1.1% 0.4% 0.5% 0.5% 0.8% 0.9% 0.8% 0.8% 0.6% 0.9% 1.2% 8.6% 50-54
1.1% 0.3% 0.5% 0.5% 0.8% 0.9% 0.8% 0.8% 0.6% 0.8% 1.0% 8.1%
55-59
1.1% 0.3% 0.6% 0.5% 0.7% 0.7% 0.6% 0.6% 0.5% 0.7% 0.7% 7.1% 60-64
1.1% 0.4% 0.8% 0.6% 0.7% 0.6% 0.5% 0.5% 0.3% 0.4% 0.4% 6.4%
65-69
0.7% 0.3% 0.9% 0.8% 0.7% 0.4% 0.3% 0.2% 0.1% 0.1% 0.2% 4.7% 70-74
0.5% 0.2% 0.9% 0.8% 0.5% 0.2% 0.1% 0.1% 0.1% 0.1% 0.1% 3.6%
75-79
0.4% 0.1% 0.7% 0.7% 0.4% 0.2% 0.1% 0.1% 0.0% 0.0% 0.0% 2.8% 80-84
0.4% 0.1% 0.5% 0.6% 0.4% 0.1% 0.1% 0.0% 0.0% 0.0% 0.0% 2.3%
85-89
0.3% 0.1% 0.2% 0.4% 0.2% 0.1% 0.0% 0.0% 0.0% 0.0% 0.0% 1.5% 90-94
0.2% 0.0% 0.1% 0.2% 0.1% 0.0% 0.0% 0.0% 0.0% 0.0% 0.0% 0.6%
95-99
0.0% 0.0% 0.0% 0.0% 0.0% 0.0% 0.0% 0.0% 0.0% 0.0% 0.0% 0.1% 100 years
0.0% 0.0% 0.0% 0.0% 0.0% 0.0% 0.0% 0.0% 0.0% 0.0% 0.0% 0.0%
Total 19.0% 7.0% 9.2% 8.6% 10.1% 9.6% 8.0% 7.9% 5.7% 7.1% 8.0% 100%
Projected Population Growth 2011 - 2031
Double Bay – Bellevue Hill Locality – +21% (+5,528 Persons)
Woollahra LGA – +19.5% (+11,000 Persons)
Waverley LGA – +19% (+13,350 Persons)

Double Bay Economic Feasibility Study
Ref: C15257- Final Hill PDA Page 27 | 94
Accordingly as shown in Figure 20 below, as a proportion of the total population, the 20 to 34 year age group is expected to decline across all locations. The assumptions behind these data sources are unclear; however, housing affordability and supply are likely to be contributing factors behind this projection. Furthermore, the forecasts are likely to reflect an ageing in place of the existing City Makers described in the preceding section.
Figure 20 - Projected Age Group Contribution to Growth (2011–2041)
BTS Travel Zone Population Projections 2014 Source:
Figure 20 also highlights an emerging population in the 65+ age group across all locations. This trend is likely to be reflective of both downsizers moving into the area and the natural aging of the current owner occupiers preferring to age in place.
Interestingly, there is also significant growth forecast in the younger age bracket of 0-19 years. This is particularly the case in Waverley and Woollahra LGAs, being potentially reflective of more families moving into these areas or the existing ‘City Maker’ population transitioning from the single and couple households with no dependents, to households with children, together with the aging of the notable growth in 0 to 4 years olds that occurred over the past census decade.
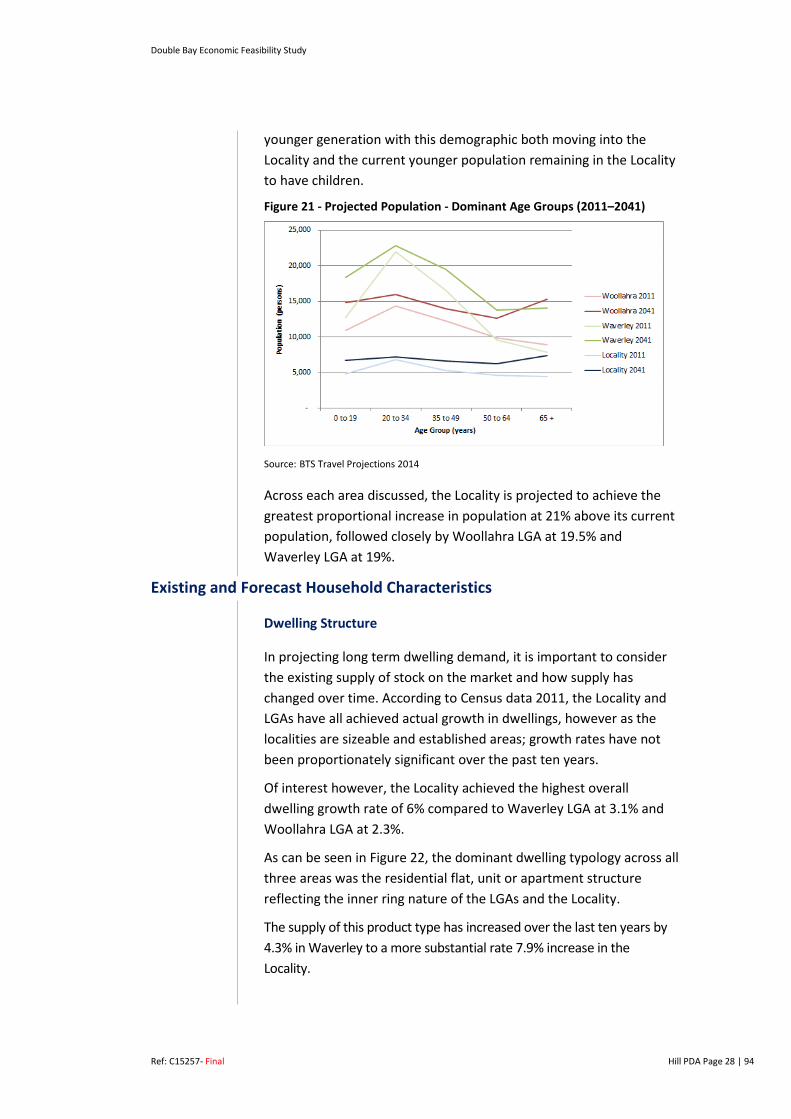
The growth trend across age groups in the Locality is more evenly distributed across 0-19 years, 35-49 years and 65+ years. The only anomaly being the decline in the 20-34 year age group.
As can be seen in the Figure 21, the overall age profile of the Locality will have a greater proportion of the population under 50 years of age, shifting from what was once a significant decline after 20-34 years age range to a more gradual decline. This suggests that the Locality is forecast to remain and become more popular for a
-10%
0%
10%
20%
30%
40%
0 to 19 20 to 34 35 to 49 50 to 64 65 +
% A
ge G
roup
Con
trib
utio
n
Age Group
Waverley (LGA) Woollahra (LGA)
Double Bay - Bellevue Hill SA2
Double Bay Economic Feasibility Study
Ref: C15257- Final Hill PDA Page 28 | 94
younger generation with this demographic both moving into the Locality and the current younger population remaining in the Locality to have children.
Figure 21 - Projected Population - Dominant Age Groups (2011–2041)
BTS Travel Projections 2014 Source:
Across each area discussed, the Locality is projected to achieve the greatest proportional increase in population at 21% above its current population, followed closely by Woollahra LGA at 19.5% and Waverley LGA at 19%.
Existing and Forecast Household Characteristics
Dwelling Structure
In projecting long term dwelling demand, it is important to consider the existing supply of stock on the market and how supply has changed over time. According to Census data 2011, the Locality and LGAs have all achieved actual growth in dwellings, however as the localities are sizeable and established areas; growth rates have not been proportionately significant over the past ten years.
Of interest however, the Locality achieved the highest overall dwelling growth rate of 6% compared to Waverley LGA at 3.1% and Woollahra LGA at 2.3%.
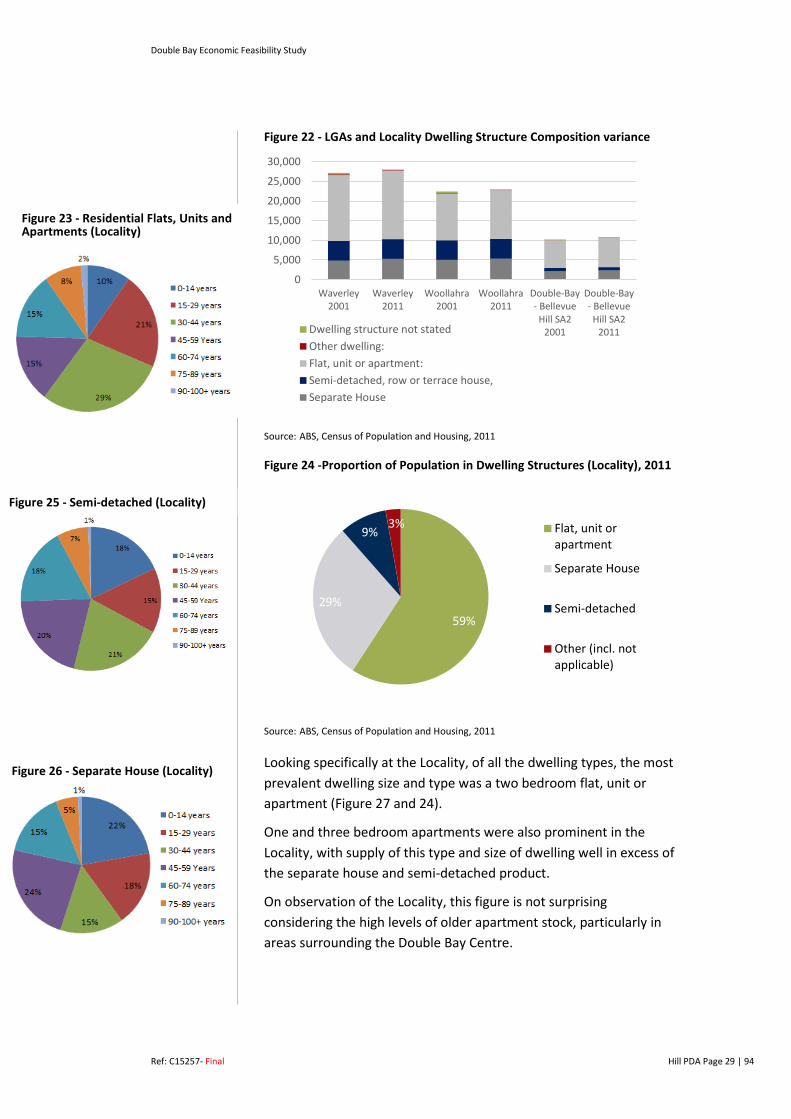
As can be seen in Figure 22, the dominant dwelling typology across all three areas was the residential flat, unit or apartment structure reflecting the inner ring nature of the LGAs and the Locality.
The supply of this product type has increased over the last ten years by 4.3% in Waverley to a more substantial rate 7.9% increase in the Locality.
Double Bay Economic Feasibility Study
Ref: C15257- Final Hill PDA Page 29 | 94
Figure 22 - LGAs and Locality Dwelling Structure Composition variance
ABS, Census of Population and Housing, 2011 Source:
Figure 24 -Proportion of Population in Dwelling Structures (Locality), 2011
ABS, Census of Population and Housing, 2011 Source:
Looking specifically at the Locality, of all the dwelling types, the most prevalent dwelling size and type was a two bedroom flat, unit or apartment (Figure 27 and 24).
One and three bedroom apartments were also prominent in the Locality, with supply of this type and size of dwelling well in excess of the separate house and semi-detached product.
On observation of the Locality, this figure is not surprising considering the high levels of older apartment stock, particularly in areas surrounding the Double Bay Centre.
0
5,000
10,000
15,000
20,000
25,000
30,000
Waverley2001
Waverley2011
Woollahra2001
Woollahra2011
Double-Bay- Bellevue
Hill SA22001
Double-Bay- Bellevue
Hill SA22011Dwelling structure not stated
Other dwelling:Flat, unit or apartment:Semi-detached, row or terrace house,Separate House
59% 29%
9% 3% Flat, unit or
apartment
Separate House
Semi-detached
Other (incl. notapplicable)
Figure 23 - Residential Flats, Units and Apartments (Locality)
Figure 26 - Separate House (Locality)
Figure 25 - Semi-detached (Locality)

Double Bay Economic Feasibility Study
Ref: C15257- Final Hill PDA Page 30 | 94
Figure 27 - Number of Bedroom in Dwelling Structures (Locality), 2011
ABS, Census of Population and Housing, 2011 Source:
As can be seen in Figures 23, 25, and 26, the age demographic occupying these dwellings types varies considerably. The age demographic in the Residential Flats, Units and Apartments comprised the majority of people aged between 15-44 years dominating over 50% of the stock. Separate houses had a greater proportion of 0-14 years and 45-59 years age groups, which is reflective of the general family household composition. The semi-detached product had a more equal distribution of age groups across the product types, with no outstanding results.
Interestingly however, when viewing the results of the number of persons residing in dwellings in the Locality as of 2011 (Figure 28), there was a relatively even split between two person households and four person households in the separate house product.
This is likely to be attributed to the ageing demographic in the Locality and the increasing number of empty-nesters.
Double Bay Economic Feasibility Study
Ref: C15257- Final Hill PDA Page 31 | 94
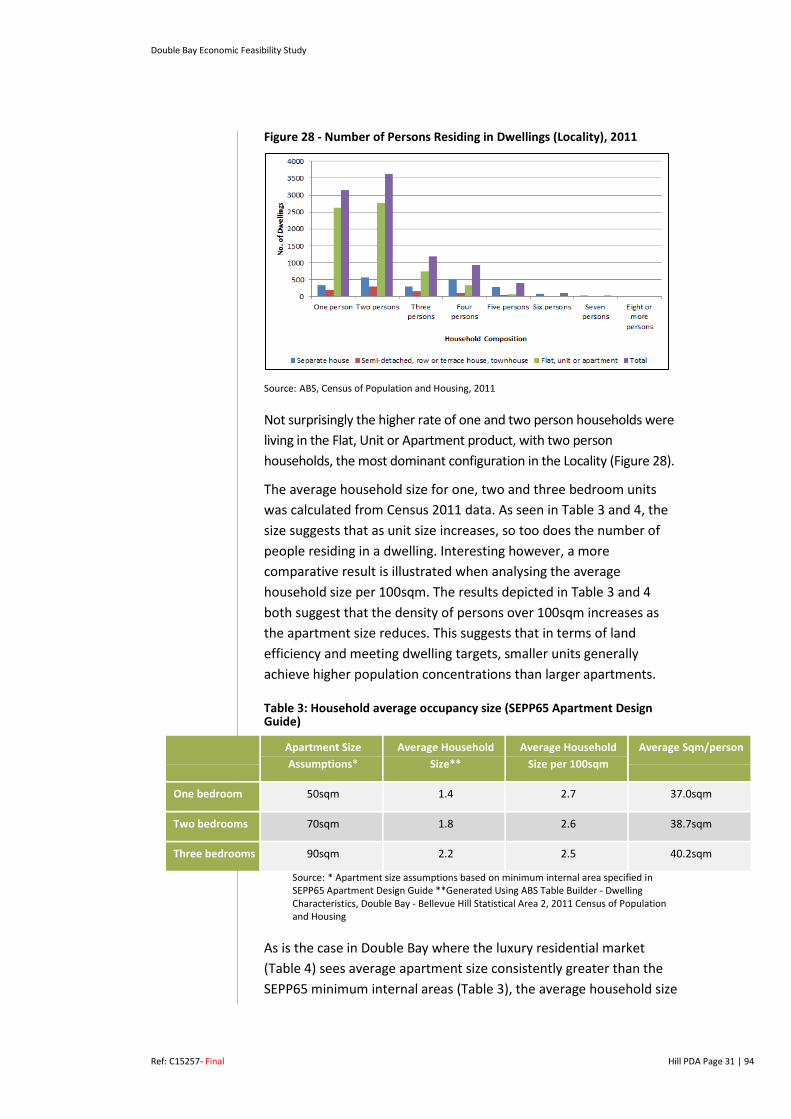
Figure 28 - Number of Persons Residing in Dwellings (Locality), 2011
ABS, Census of Population and Housing, 2011 Source:
Not surprisingly the higher rate of one and two person households were living in the Flat, Unit or Apartment product, with two person households, the most dominant configuration in the Locality (Figure 28).
The average household size for one, two and three bedroom units was calculated from Census 2011 data. As seen in Table 3 and 4, the size suggests that as unit size increases, so too does the number of people residing in a dwelling. Interesting however, a more comparative result is illustrated when analysing the average household size per 100sqm. The results depicted in Table 3 and 4 both suggest that the density of persons over 100sqm increases as the apartment size reduces. This suggests that in terms of land efficiency and meeting dwelling targets, smaller units generally achieve higher population concentrations than larger apartments.
Table 3: Household average occupancy size (SEPP65 Apartment Design Guide)
* Apartment size assumptions based on minimum internal area specified in Source:SEPP65 Apartment Design Guide **Generated Using ABS Table Builder - Dwelling Characteristics, Double Bay - Bellevue Hill Statistical Area 2, 2011 Census of Population and Housing
As is the case in Double Bay where the luxury residential market (Table 4) sees average apartment size consistently greater than the SEPP65 minimum internal areas (Table 3), the average household size
Apartment Size Assumptions*
Average Household Size**
Average Household Size per 100sqm
Average Sqm/person
One bedroom 50sqm 1.4 2.7 37.0sqm
Two bedrooms 70sqm 1.8 2.6 38.7sqm
Three bedrooms 90sqm 2.2 2.5 40.2sqm
Double Bay Economic Feasibility Study
Ref: C15257- Final Hill PDA Page 32 | 94
per 100sqm significantly reduces as apartment size increases. This will have an impact on the capacity to reach population and dwelling targets as the average square metre floor space delivered per person for a three bedroom (80.4sqm) is more than double the one bedroom outcome (37.0sqm).
Table 4: Household average occupancy size (Double Bay Market Apartment Size Assumptions
*Apartment size assumptions based on market research undertaken for this Source:study specific to Double Bay. **Generated Using ABS Table Builder - Dwelling Characteristics, Double Bay - Bellevue Hill Statistical Area 2, 2011 Census of Population and Housing,
Table 5 highlights that a rented Flat, Unit and Apartment product was the dominant housing choice in the Locality, most common to the 20-49 year age group. There was then a shift for age groups above 50 years, with the common form of housing being a separate house owned outright.
Table 5 - Housing Structure and Tenure by Age Bracket
ABS, Census of Population and Housing, 2011 Source:
Dwelling Projections
According to the BTS Dwelling Projections (Table 6), a 34% increase in dwellings is anticipated by 2041 in the Locality. This is an increase of approximately 4,033 dwellings at a growth rate of 1.15% per annum.
Similar growth is forecast for the LGAs with an additional 8,593 dwellings forecast for Waverley LGA and 7,715 forecast for Woollahra. This growth can be seen in Figure 29.
Apartment Size Assumptions*
Average Household Size**
Average Household Size per 100sqm
Average Sqm/person
One bedroom 50sqm 1.4 2.7 37.0sqm
Two bedrooms 100sqm 1.8 1.8 55.2sqm
Three bedrooms 200sqm 2.2 1.1 80.4sqm

Double Bay Economic Feasibility Study
Ref: C15257- Final Hill PDA Page 33 | 94
Table 6 - Forecast Dwelling Growth by LGAs and Locality (2011-2041) 2011 2021 2031 2041 Net
Increase 11-41
Net Increase %
% Growth p.a.
Waverley LGA 30,176 12,745 14,275 38,769 8,593 28% 0.95%
Woollahra LGA 23,382 25,340 28,272 31,097 7,715 33% 1.10%
Double Bay - Bellevue Hill SA2
11,716 12,745 14,275 15,749 4,033 34% 1.15%
BTS Dwelling Projections, 2014 Source:
Figure 29 - LGAs and Locality Dwelling Projections 2011-2041
BTS Population and Employment Projections 2014 Source:
What Does it All Mean?
Overall, there were a number of trends that emerged from the demographic analysis including:
A large rental market exists in the Locality generally consisting of the younger age demographic. This is likely due to low supply levels of affordable housing stock to purchase, as well as a significant demand from younger residents, “city makers”, preferring to live in the Locality for its lifestyle and amenity benefits;
The adjustment of the age profile to include a higher population of persons under fifty years of age, signifies that younger householders are remaining in the Locality, some of which are having children, along with an increase in younger people moving into the Locality. This suggests that there is likely to be an increase in demand for larger affordable apartment product for young families with children that prefer to live in apartments; and
- 5,000
10,000 15,000 20,000 25,000 30,000 35,000 40,000 45,000
2011 2016 2021 2026 2031 2036 2041
Num
ber o
f Dw
ellin
gs
Year
Locality
Waverley
Woollahra
Double Bay Economic Feasibility Study
Ref: C15257- Final Hill PDA Page 34 | 94
Larger apartments will likely remain dominant in the Locality. There is likely to be demand for an increase supply of this product, however considering the majority of 20-49 year olds are renting Flat, Unit and Apartments, it does suggest that affordability will remain an issue and the investor market will likely continue to be dominant.
In conclusion, the composition of the projected population could be influenced through the creation of more affordable and diverse housing supply to encourage and support a diversity of age profiles. Council could potentially facilitate and attract specific age groups by providing services and amenities tailored to the desired population.
Double Bay Economic Feasibility Study
Ref: C15257- Final Hill PDA Page 35 | 94
3 DOUBLE BAY MARKET RESEARCH
The following Chapter analyses trends and factors influencing the property market in the Centre and its surrounds. It also investigates the sale and rental prices of a range of uses including residential apartments, retail units and commercial office space. The research is based on detailed discussions with market and industry experts as well as a review of relevant property databases. These factors in turn inform the feasibility modelling discussed in Chapter 6.
Residential Apartment Market Overview
Double Bay is located in one of Australia’s most prestige localities that also benefits from good access to the Sydney CBD and Sydney Harbour. The suburb of Double Bay is characterised as a residential area with an affluent population.
In May 2015 the median sale value for a house (non-strata dwelling) within Woollahra was $3.3m (compared to a Sydney Median of $949,000)7. With respect to apartments, there was a notable difference in the median sale value of $967,000 (compared to a Sydney Median of $622,000).
The median apartment price in the Double Bay suburb in July 2015 was $1,200,000 in comparison to a median for Woollahra Local Government Area (LGA) of $1,015,0008. It is important to note that this classification refers to all strata titled dwellings including units, townhouses, terraces and semi-detached dwellings.
There are limited residential apartment buildings located in the Centre. The general construction of residential apartments tends to be mixed use development comprising of ground floor retail and shop top housing. These building are usually three to four storeys in height and are located along Bay Street and Cross Street.
A recent example of a typical four storey mixed use development is the Bay Residences located at 16-22 Bay Street, Double Bay. This development was converted from Sir Stamford Hotel to residential apartments. The development comprises of a mix of one, two and three bedrooms. Our discussions with selling agents indicated that there was high demand for the one and two bedroom apartments by young professionals.
7 As of July 2015 it is understood that the Sydney median increased to exceed $1m. 8 RPdata June 2015

Double Bay Economic Feasibility Study
Ref: C15257- Final Hill PDA Page 36 | 94
A high number of older style residential apartment buildings are located on New South Head Road, Ocean Avenue and along the harbour edge near the Double Bay ferry wharf.
Agents revealed there is demand for a mix of apartment sizes in the Centre. In particular two to three bedroom apartments tend to be purchased by downsizers whilst one and two bedroom apartment sales are more attractive to young professionals and investors. The investor market consists of the local, investors from across Sydney and from overseas.
Despite this demand and smaller apartments of Bay Residences mixed use development at 16-22 Bay Street example, our research shows that the majority of the newer residential apartments developed in the Centre comprise of only three and four bedrooms apartments. The internal areas generally range from 180sqm to 200sqm. Furthermore discussions with local agents indicated that this product attracted the downsizer market predominately from the local area such as Point Piper and Vaucluse. Downsizers generally want to stay in the local area, close to amenities and seek low maintenance accommodation.
Discussions with local selling agents indicated that new studio; one and two bedroom apartments in the Centre could likely sell for the following:
Studio with an internal area of 45sqm without a car space are generally likely to sell between $600,000- $700,000; equating to a $/sqm rate of $13,300/sqm - $15,500/sqm;
Studio with an internal area of 45sqm with car space are generally likely to sell $700,000- $800,000; equating to a $/sqm rate of $15,500/sqm - $17,700/sqm;
One bedroom apartments with an internal size of 55sqm without a car space are likely to sell for $100,000 less than an apartment with a car space ; $850,000- $950,000; equating to a $15,500/sqm - $17,280/sqm;
One bedroom apartments with an internal size of 55sqm and one car space are likely to sell between $950,000 and $1,050,000; equating to a $/sqm rate of $17,500/sqm to $19,000/sqm;
Two bedroom apartments with an internal size of 85sqm without a car space are likely to sell for $100,000 less than an apartment with a car space $1.4m to $1.5m; equating to $16,470/sqm to $17,647/sqm); and

Double Bay Economic Feasibility Study
Ref: C15257- Final Hill PDA Page 37 | 94
Two bedroom apartments with a car space an internal size of 85sqm are likely to sell between $1.5m to $1.6m; equating to $17,647/sqm to $18,823/sqm.
Discussions with local agents revealed that only studio and one bedroom apartments could be sold without car parking. However larger apartments such as two, three and four bedroom apartments would need to provide at least one car space per apartment. Otherwise the buyers’ market would be limited.
Our discussions with agents revealed that the Centre would be highly attractive for the younger demographic to reside in on account of its lifestyle attractors including a vibrant day and night life within the Centre as well as the close proximity to the Sydney CBD. To activate the Centre agents confirmed that there would need to be a diverse range of product that would meet the affordability bracket for higher earning young professionals (discussed further in Chapter 4).
The Centre has achieved a healthy vibe with a variety of restaurants, lounge bars and nightclubs being established to meet the demand of residents and visitors. This change in the Centre has meant it has become a destination for people to socialise and now live.
Residential Apartment Sales Evidence
HillPDA have researched four new residential developments current asking prices or sold prices off the plan in the suburb of Double bay, Edgecliff and Rushcutters Bay. These developments have informed our research on sale values being achieved, the apartment mix, and supply and demand in the Centre and its surrounds.
The four developments that have been analysed are as follows:
1. Embassy at Redleaf, 535-537 New South Head Rd, Double Bay
2. The Lincoln, 1 Lincoln Place, Edgecliff
3. Advanx East, 4 Neild Avenue, Rushcutters Bay
4. The Bay Residences, 16-22 Bay Street, Double Bay
Double Bay Economic Feasibility Study
Ref: C15257- Final Hill PDA Page 38 | 94
Figure 30- Location of the four developments
Nearmap 2015 and HillPDA 2015 Source:
Development 1: Embassy at Redleaf, 535-537 New South Head Rd, Double Bay
This development comprises of 8 x 2 and 6 x 3 bedroom apartments with two car spaces each. The selling agent confirmed the apartments were marketed in February 2015 with 10 out of the 12 selling in a six week period. The selling agent identified the buyers as investors and owner occupiers.
Table 7 shows that the asking prices of the two remaining apartment’s range from $20,000/sqm to $22,000/sqm. The selling agent indicated that the prices for the last two apartments have been increased slightly, due to the high level of demand for the apartments in the area.
Table 7 - Embassy at Redleaf – Asking Prices
Unit Price Internal
(sqm)
$/sqm
Realestate.com.au Source:
1 x 2 Bedroom Units + 2 Car
$2,000,000 - $2,250,000
98 $20,408 - $21,028
2 x 3 Bedroom Units + 2 Car
$3,550,000 107-175 $20,286
Selling Agent/ HillPDA 2015 Source:

Double Bay Economic Feasibility Study
Ref: C15257- Final Hill PDA Page 39 | 94
Development 2: The Lincoln, 18 Albert Street, Edgecliff
The Lincoln development consists of six apartments comprising 4 x 3 bedrooms and 2x 4 bedroom apartments. The project is expected to be completed in early 2016.
The selling agents revealed that the majority of the buyers enquiring are prospective owner occupiers and downsizers within the local area. A total of four out of the six apartments have sold to date.
Table 8 displays the current asking prices, displaying asking price between $20,000/sqm - $21,000/sqm with apartments on the top floor enjoying harbour views.
Table 8 - The Lincoln – Asking Prices
Apartment Asking Price Internal
(sqm)
$/sqm
Realestate.com.au Source:
Apartment 2: 3 Bedroom Unit
$4.10m 202sqm $20,297/sqm
Apartment: 4 Bedroom unit with views
$5.60m 235sqm $23,829/sqm
Realestate.com.au/ selling agent Source:
Development 3: Advanx East, 4 Neild Avenue, Rushcutters Bay
Advanx East is located on the corner of New South Head Road and Neild Avenue. This development is located outside the Woollahra LGA, comprising of 286 apartments with a mix of studio, 1, 2 and 3 bedroom and penthouse apartments. According to the selling agent the development released its first stage three years ago and only has one apartment remaining for sale (the penthouse).
The selling agent indicated that the development achieved a broad range of sale values internally of $15,000/sqm for the smaller units (i.e studios and 1 bedroom units) and around $16,000/sqm for the lager units (2 bedroom and 3 bedroom units). The buyers for the development were a mix of owner occupiers and investors.
The selling agent advised us that brand new smaller apartments in Centre could expect to achieve with $18,000/sqm to $20,000/sqm range.
Double Bay Economic Feasibility Study
Ref: C15257- Final Hill PDA Page 40 | 94
Figure 31: Advanx East Development
Development 4: The Bay Residences, 16-22 Bay Street, Double Bay
The Bay Residence is located on Bay Street comprising 3 x 1 bedroom, 2 x 2 bedroom and 8 x 3 bedroom apartments.
The selling agent advised that the apartments sold approximately two years ago (2013-14). The selling agent indicated that a one bedroom apartment with a car space and internal area of 77sqm sold for approximately $1.4 million. The agent could not reveal the prices of the two and three bedroom apartments.
Table 9 - The Bay Residences 2013-2014
Unit Price Internal $/sqm
Realestate.com.au Source:
1 Bedroom Unit + 1 Car
$1,400,000 77 $18,181/sqm
Realestate.com.au, local agent Source:
Our research identified a resale of a two bedroom apartment with two car spaces currently sold in April 2015 for $1.8 million. The selling agent indicated that a new one apartment in today’s market in the Centre would be more likely $20,000/sqm.
Double Bay Economic Feasibility Study
Ref: C15257- Final Hill PDA Page 41 | 94
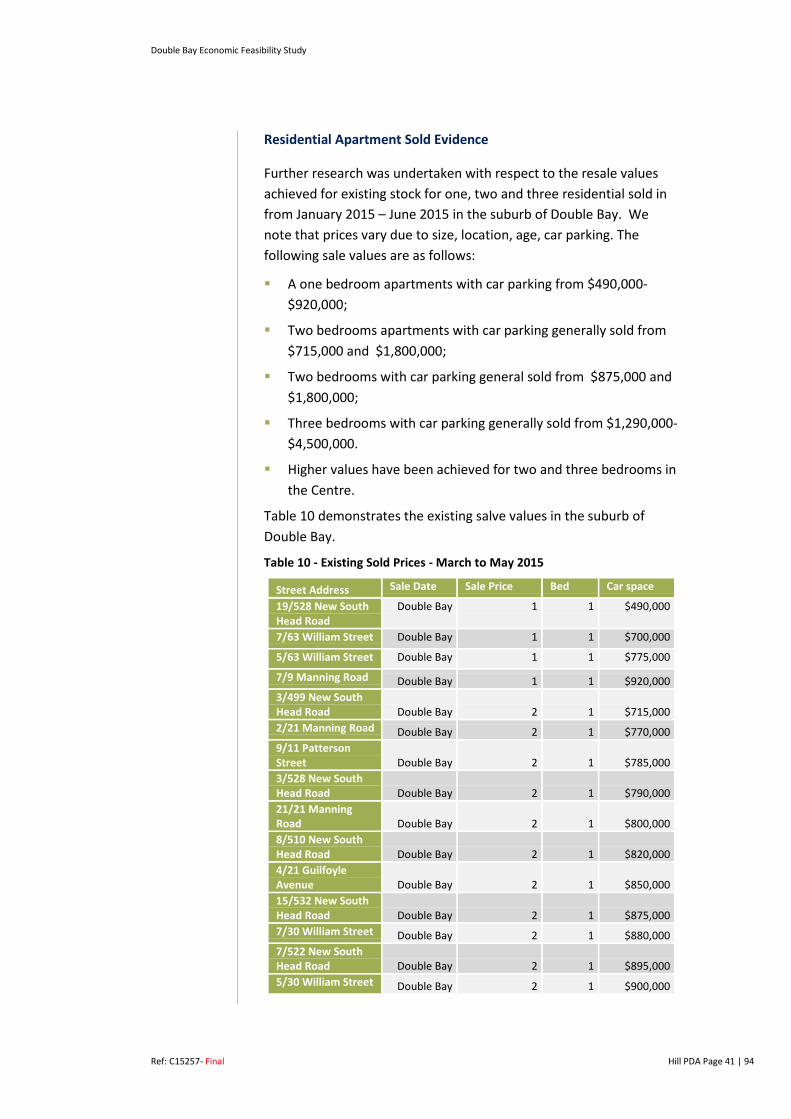
Residential Apartment Sold Evidence
Further research was undertaken with respect to the resale values achieved for existing stock for one, two and three residential sold in from January 2015 – June 2015 in the suburb of Double Bay. We note that prices vary due to size, location, age, car parking. The following sale values are as follows:
A one bedroom apartments with car parking from $490,000-$920,000;
Two bedrooms apartments with car parking generally sold from $715,000 and $1,800,000;
Two bedrooms with car parking general sold from $875,000 and $1,800,000;
Three bedrooms with car parking generally sold from $1,290,000-$4,500,000.
Higher values have been achieved for two and three bedrooms in the Centre.
Table 10 demonstrates the existing salve values in the suburb of Double Bay.
Table 10 - Existing Sold Prices - March to May 2015
Street Address Sale Date Sale Price Bed Car space
19/528 New South Head Road
Double Bay 1 1 $490,000
7/63 William Street Double Bay 1 1 $700,000
5/63 William Street Double Bay 1 1 $775,000
7/9 Manning Road Double Bay 1 1 $920,000 3/499 New South Head Road Double Bay 2 1 $715,000 2/21 Manning Road Double Bay 2 1 $770,000 9/11 Patterson Street Double Bay 2 1 $785,000 3/528 New South Head Road Double Bay 2 1 $790,000 21/21 Manning Road Double Bay 2 1 $800,000 8/510 New South Head Road Double Bay 2 1 $820,000 4/21 Guilfoyle Avenue Double Bay 2 1 $850,000 15/532 New South Head Road Double Bay 2 1 $875,000 7/30 William Street Double Bay 2 1 $880,000 7/522 New South Head Road Double Bay 2 1 $895,000 5/30 William Street Double Bay 2 1 $900,000

Double Bay Economic Feasibility Study
Ref: C15257- Final Hill PDA Page 42 | 94
RPData 2015 Source:
Residential Development Pipeline
Although development hasn’t been occurring as quickly as other parts of Sydney, the Centre seems to have demonstrated a strong and growing demand for residential apartments.
Street Address Sale Date Sale Price Bed Car space
62/10 Manning Road Double Bay 2 1 $915,000 6/532 New South Head Road Double Bay 2 1 $950,000 6/24 Ocean Avenue Double Bay 2 1 $980,000 11/2 Holt Street Double Bay 2 1 $1,020,000 14/2 Holt Street Double Bay 2 1 $1,020,000 2/276 New South Head Road Double Bay 2 1 $1,050,000 2/30 William Street Double Bay 2 1 $1,235,000 5H/2 Knox Street Double Bay 2 2 $1,800,000 4/260 New South Head Road Double Bay 3 1 $875,000 2/13 Manning Road Double Bay 3 1 $1,150,000 7/509-511 New South Head Road Double Bay 3 2 $1,275,000 4/5 Ocean Avenue Double Bay 3 1 $1,290,000 9/539 New South Head Road Double Bay 3 2 $1,445,000 4/42 Manning Road Double Bay 3 2 $1,510,780 10/539 New South Head Road Double Bay 3 2 $1,640,000 1P/14 Leura Road Double Bay 3 2 $1,655,000 10/20 Kiaora Road Double Bay 3 2 $1,710,000 8/529 New South Head Road Double Bay 3 2 $2,000,000
3/6 Ocean Avenue Double Bay 3 2 $2,000,000
2/45 Ocean Avenue Double Bay 3 3 $2,000,000
2/51 Carlotta Road Double Bay 3 2 $2,850,000
6/23 Manning Road Double Bay 3 3 $2,850,000
5/16 Carlotta Road Double Bay 3 2 $2,880,000 44/51 William Street Double Bay 3 2 $3,000,000 1/16 Court Road Double Bay 3 2 $3,137,000 25/2 Court Road Double Bay 3 2 $3,175,000 6G/2 Knox Street Double Bay 3 3 $3,900,000 2/45 Cross Street Double Bay 3 2 $4,100,000 8/45 Cross Street Double Bay 3 1 $4,500,000 1/16 Court Road Double Bay 3 2 $3,137,000 25/2 Court Road Double Bay 3 2 $3,175,000

Double Bay Economic Feasibility Study
Ref: C15257- Final Hill PDA Page 43 | 94
Table 11 demonstrates a range of development applications in the suburbs of Double Bay, Rose Bay and Edgecliff. The development applications include studio and 1 bedroom apartments that have been submitted to Council or are subject to a Sections 96 modification or have deferred commencement.
Table 11 – Development Pipeline in Double Bay, Rose Bay and Edgecliff
Cordellconnect, 2015 and RPdata 2015 Source:
Address Site Area
(sqm)
No. Units Current FSR Proposed FSR Comments
10 Court Road, Double Bay
532 8 1:1 1.19:1 The development application was submitted to Council and was approved on the 1st June 2015. The development is over three storeys consisting of 4 x 1 bedrooms and 4 x2 bedrooms. This development has been approved and is planned to commence in 2016.
4-8 Patterson Street, Double Bay
1,535 28 1:1 1.9:1 The development application was submitted to Council and is awaiting approval. The development is over four storeys consisting of 6 x studios, 3x 1 bedrooms and 19 x 2 bedrooms. Subject to approval, Construction is planned to commence in 2016.
327 New South Head Road, Double Bay
529 20 0.625:1 2.2:1 This planning proposal was lodge with Council in June 2014. The proposal was refused on the 3rd August 2015.
18-20 Albert Street, Edgecliff
2,017 6 0.75:1 0.93:1 This development comprises of 6 high end apartments that are due to be completed in early 2016. This project has been approved.
554-558 Old South Head Road, Rose Bay
1,420 11 1.5:1 and 2:1 across two sites
2.09:1 This site was sold with a development application. Construction of a four storey mixed use development comprising a commercial space of 91sqm and 1 x studio, 1 x 1, 6 x 2 & 3 x 3 bedroom units. This project is undetermined.
20-26 Cross Street 1,259 34 2.5:1 3.5:1 This development comprises of seven retail shops and 34 residential apartments consist of 9 x 1, 12 x 2, and 13 x 3 over six levels. This development application was lodged 31/7/2015.
66 Cross Street 272.8 2 1.05:1 1.07:1 This development comprises of two three bedrooms. This development application was lodged 19/5/2015.
357 New South Head Road
351.7 15 3.0:1 4.18:1 This development comprises of seven retail shops and 34 residential apartments consist of 3 x 1 and 12 x 3 over six levels. This development application was lodged 31/7/2015.
2 Forest Road
446.1 3 0.75:1 1.15:1 This development comprises of 3x three bedroom residential apartments over three storeys. To be confirmed 31/8/2015.
17 Carlotta Road 842 3 0.625:1 1.073:1 These developments comprise of 3 residential apartments plus study over three storeys. Lodged 17/3/2015.
16-18 Cross Street 671 12
2.5:1 5.06:1 This development comprises of three retail shops and 13 residential apartments consisting of 2 x 1, 1 x 2 and 9 x 3 over six storeys. This is still awaiting approval.
240 New South Head Road
382 20 4.04:1 4.0:1 This development comprises of 20 residential apartments 3 x studio, 11 x 1 and 6 x 2 over five storeys. This development application was refused on the 3rd August 2015.
321 New South Head Road
708 13 0.625:1
2.16:1
This development comprises of 2 x Studio, 2 x 1, 3 x 2, 6 x 3 bedrooms. This development is currently Undetermined - subject to VPA.
Double Bay Economic Feasibility Study
Ref: C15257- Final Hill PDA Page 44 | 94
Discussions with developers and real estate indicated that development is limited in the Centre due to difficulties with acquiring / amalgamating sites; the Double Bay community concerns regarding additional density; and the nature of the existing planning controls (such as height and FSR).
Retail Market Overview
Double Bay has traditionally been considered an established retail Centre owing to the wider catchment of shoppers it has attracted to its specialty in high Fashion, café, restaurant and lounge bar scene. The Centre has also over the last 12 months expanded its grocery and convenience offer with the new Woolworths and the speciality shops located within the Kiaora Lane development.
Our market research and discussions with local agents identified that the Centre’s retail market is performing extremely well with healthy demand. This improvement is related to the addition of new businesses such as small bar license being open within the Centre.
Agents indicated that retail premises located in Bay Street, Cross Street and Knox Street are the better performing streets for retail due to high footfall and good exposure. Retail premises located along New South Head Road have a slightly lower demand which can make it difficult to lease or sell. Agents indicated that if new retail space is developed in the right location such as Cross Street or Bay Street there would be a strong demand for the space.
New retail developments have been limited over the last decade in Double Bay until the Kiaora Development was approved in 2013, with Stage one being completed in April 2014. Stage one comprises a two levels of car park, two anchors being a major Woolworth’s and Dan Murphy’s, in addition speciality shops including restaurants, cafés plus commercial office spaces in the upper levels. Stage Two is planned to be completed by September to December 2015 which includes a three-storey public library, retail arcade of approximately 20 specialty shops, three levels of commercial office space and a public piazza area.
Agents indicated that all the new retail and commercial space in the Kiaora Lane development is for lease only and not for sale. Agents indicated that the both the retail and commercial space has experienced strong demand.
More specifically in the Centre agents indicated that retail units generally average an internal area of 80sqm, with typical tenants acquiring for restaurants, telecommunications (i.e Optus) and

Double Bay Economic Feasibility Study
Ref: C15257- Final Hill PDA Page 45 | 94
standard retail amenity (i.e cafe) space. The leasing agent advised that gross leases of $1,400/sqm have been achieved with lease terms of five years. Agents have identified that Bay Street has recently generated higher demand from tenants than ever before. The typical tenants interested in leasing retail units in the Centre are hairdressers, café’s/restaurants and small bars.
Discussions with local leasing agents indicated the following gross rents for retail units located in the Centre:
Cross Street retail leases is achieving gross rents up to $1,200/sqm;
Transvaal Avenue retail leases vary depending on the location of the street; The northern end achieves approximately $800/sqm, with the southern end achieving up to 1,200/sqm;
Bay Street between Knox and Cross Street is achieving gross rents in order of $1,000/sqm;
Knox Street has performed the strongest historically and generates the highest gross rents of around $1,200 and up to $1,300sqm;
The Cosmopolitan Centre generally achieves gross rents of $2,000/sqm.
All outgoings within the Centre range from $70-$100/sqm, dependant on the age, location, amenities etc.
Based on recent sales that have occurred in Double Bay and surrounding suburbs such as Rose Bay, a retail premises with an internal area of 20-80sqm could expect to sell around $15,000/sqm;
Based on recent sales that have occurred and what is currently on the market, a retail premises with an internal area of 100-200sqm could expect to sell between $10,000/sqm to $14,000/sqm;
Sale and rental values will vary depending on the level of amenities, condition of the property, exposure, proximity to parking, existing tenancies etc.
Retail Sales Evidence
Table 12 demonstrates sale values for various retail premises in the Double Bay Town Centre. The sale values range from $9,700/sqm-$13,400/sqm dependant on the size, location, age and condition of the premises.

Double Bay Economic Feasibility Study
Ref: C15257- Final Hill PDA Page 46 | 94
Table 12 - Retail Sales Evidence in Centre – April 2014-April 2015
Address Price Date Internal $/sqm
3/17 Knox St, Double Bay
$1,500,000 Apr-14 55 $27,273
3/5 Knox Street, Double Bay
$1,080,000 Apr-14 100 $10,800
38 Bay Street $725,000 Apr- 14 75 $9,667
385 New South Head Rd, Double Bay
$2,600,000 May-14 290 $8,965
330 New South Head Rd, Double Bay
$2,450,000 Jul-14 200 $12,250
330 New South Head Road
$2,450,000 Jul-14 183 $13,388
9A Bay Street, Double $1,950,000 Oct-14 174 $11,207
27 Bay St, Double Bay $2,870,000 Dec-14 268 $10,709
11 Knox Street, Double Bay
$13,100,000 April-15 778 $16,838
Realcommercial.com.au and HillPDA Research 2015 Source:
Retail Leasing Evidence
Table 13 demonstrates net rents achieved in the Centre. The sale values range from $645/sqm -$ 1,875/sqm dependant on the size, location, age and condition of the premises.
Table 13– Retail Net Leases in the Town Centre April 2014-April 2015
Address Date Internal Area
Rent (net) Rent/sqm Yield
11 Knox Street, Double Bay
April-15 778 $628,576 $808 4.80%
3/17 Knox St, Double Bay
Apr-14 55 $103,000 $1,872 6.69%
3/5 Knox Street, Double Bay
Apr-14 100 $64,311 $643 5.95%
Realcommercial.com.au and HillPDA Research 2015 Source:
Table 14 demonstrates gross rents achieved values in the Centre. The sale values range from $700/sqm -$ 1,200/sqm dependant on the size, location, age and condition of the premises.

Double Bay Economic Feasibility Study
Ref: C15257- Final Hill PDA Page 47 | 94
Table 14– Retail Gross Leases in the Centre
Address Leased Gross pa
Date Term Internal $/sqm
23-25 Bay Street, Double Bay
$39,000 + GST
Early 2015 1+2years 52 $750
27 Bay Street, Double Bay
$70,000 +GST
Feb-15 3 years 100 $700
4&/24 Bay St, Double Bay
$58,800 + GST
Feb-15 2+2years 49 $1,200
Realcommercial.com.au and HillPDA Research 2015 Source:
Commercial Office Market Overview
The Centre has traditionally been a retail Centre with ancillary residential and commercial units. Commercial office space within the Centre consists of ground floor real estate agencies and first floor commercial office space.
Agents indicated that commercial office space has experienced strong growth in both investment sales and tenants seeking office space. This strong activity has been demonstrated in sale values and rents being achieved over the past six months compared to those achieved over the last three years. Furthermore investments yields have dropped from 6% to 5% indicating a good demand for office space.
Local leasing agents identified that typical tenant enquiries are from small businesses such as accountants, solicitors and lawyers seeking first floor office space with real estate agencies generally interest in ground floor.
Discussions with local agents and our research demonstrate that office space between 50-100sqm could sell between $7,000/sqm to $9,000/sqm.
Gross rents achieved for first floor office accommodation in the Centre are likely to $490/sqm - $600/sqm, with outgoings ranging from $70/sqm to $100/sqm.
Currently the new development located at Kiaora Lane provides 3,227sqm of office space. Leasing agents have confirmed that the office space is achieving net rents between $520/sqm – 590/sqm.
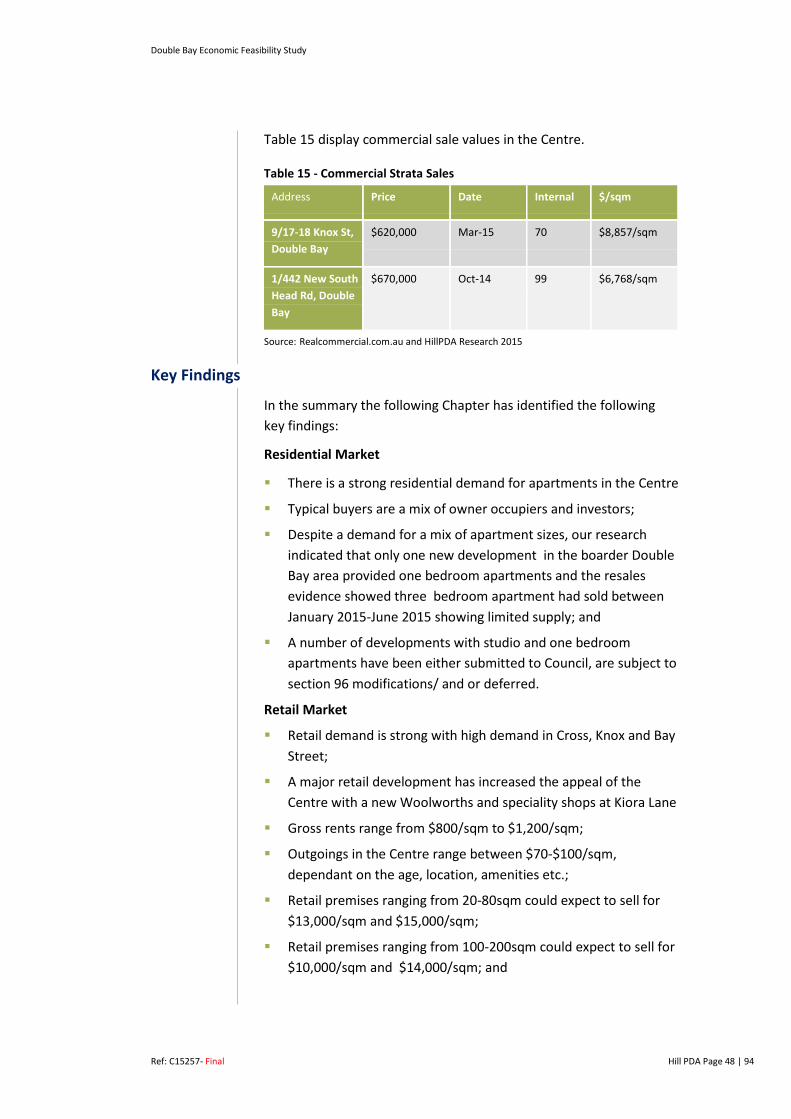
Double Bay Economic Feasibility Study
Ref: C15257- Final Hill PDA Page 48 | 94
Table 15 display commercial sale values in the Centre.
Table 15 - Commercial Strata Sales
Address Price Date Internal $/sqm
9/17-18 Knox St, Double Bay
$620,000 Mar-15 70 $8,857/sqm
1/442 New South Head Rd, Double Bay
$670,000 Oct-14 99 $6,768/sqm
Realcommercial.com.au and HillPDA Research 2015 Source:
Key Findings
In the summary the following Chapter has identified the following key findings:
Residential Market
There is a strong residential demand for apartments in the Centre
Typical buyers are a mix of owner occupiers and investors;
Despite a demand for a mix of apartment sizes, our research indicated that only one new development in the boarder Double Bay area provided one bedroom apartments and the resales evidence showed three bedroom apartment had sold between January 2015-June 2015 showing limited supply; and
A number of developments with studio and one bedroom apartments have been either submitted to Council, are subject to section 96 modifications/ and or deferred.
Retail Market
Retail demand is strong with high demand in Cross, Knox and Bay Street;
A major retail development has increased the appeal of the Centre with a new Woolworths and speciality shops at Kiora Lane
Gross rents range from $800/sqm to $1,200/sqm;
Outgoings in the Centre range between $70-$100/sqm, dependant on the age, location, amenities etc.;
Retail premises ranging from 20-80sqm could expect to sell for $13,000/sqm and $15,000/sqm;
Retail premises ranging from 100-200sqm could expect to sell for $10,000/sqm and $14,000/sqm; and
Double Bay Economic Feasibility Study
Ref: C15257- Final Hill PDA Page 49 | 94
Both sale value ranges will vary depending on the level of amenity, condition of the property, exposure, proximity to parking and existing tenancies.
Commercial Office
There is good demand for new commercial office space for small businesses;
Office space between 50-100sqm could sell between $7,000/sqm to $9,000/sqm;
Gross rents achieved for first floor office accommodation in the Centre are likely to achieve $490/sqm - $600/sqm, with outgoings ranging from $70/sqm to $100/sqm; and
Yields have dropped from 6% to 5% indicating a good demand for office space.
Double Bay Economic Feasibility Study
Ref: C15257- Final Hill PDA Page 50 | 94
4 HOUSING DEMAND AND AFFORDABILITY
There are a number important factors that influence the affordability of housing opportunities within any given area. These factors include the availability of housing stock (i.e. the supply and demand equation) as well as the diversity of existing housing stock (i.e. dwelling type, number of bedrooms and tenure) and thereby the range of price points available. Notwithstanding the importance of these two variables, a key third factor relates to the ability for households to pay i.e. the extent of their income to cover housing costs (i.e. a mortgage or rent).
This Chapter therefore draws together in brief the key findings of Chapters 2 and 3 to assess the likely affordability of housing for the Locality’s resident population based on household incomes (Chapter 2) and existing dwelling prices (Chapter 3).
Woollahra Housing Affordability Calculator
To undertake this analysis we have prepared an excel based model we call the Woollahra Household Income Affordability Calculator (as shown in Figure 32).
The model profiles household income bands based on Woollahra LGA’s Census Data (indexed to 2015 dollars) and the level of rent / debt that each household income level could pay dependant on key variables (i.e. 5.7% interest rate, 10% deposit and no other equity).
For the purposes of the exercise we have only included the proportion of the population’s households that are earning an income or stated their income as of the 2011 Census night. We note however that the ability to purchase a property may also be influenced by factors such as existing assets or inheritance.
Key Findings
The model shows that Woollahra LGA had a median household income of $152,000 per annum ($1,500-$1,999 per week). Assuming a 10% deposit and 5.7% lending rate, a household earning the median could service a loan and therefore purchase a property for approximately $900,000.
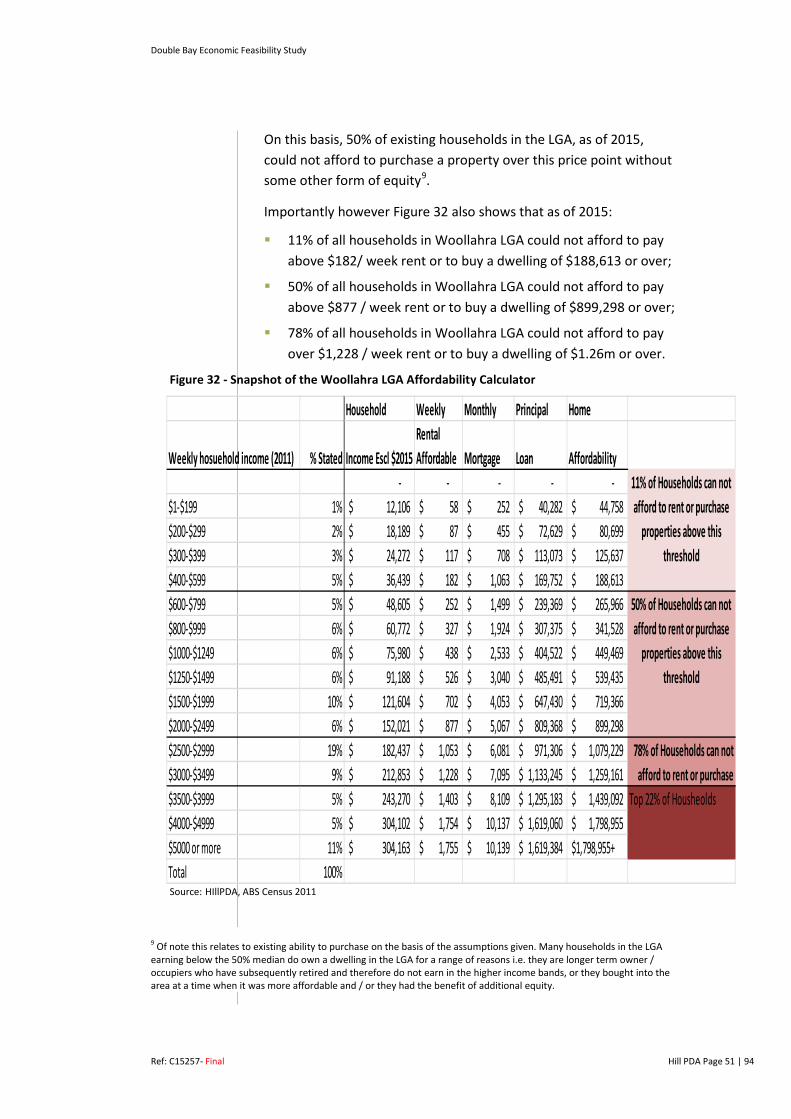
Double Bay Economic Feasibility Study
Ref: C15257- Final Hill PDA Page 51 | 94
On this basis, 50% of existing households in the LGA, as of 2015, could not afford to purchase a property over this price point without some other form of equity9.
Importantly however Figure 32 also shows that as of 2015:
11% of all households in Woollahra LGA could not afford to pay above $182/ week rent or to buy a dwelling of $188,613 or over;
50% of all households in Woollahra LGA could not afford to pay above $877 / week rent or to buy a dwelling of $899,298 or over;
78% of all households in Woollahra LGA could not afford to pay over $1,228 / week rent or to buy a dwelling of $1.26m or over.
Figure 32 - Snapshot of the Woollahra LGA Affordability Calculator
HIllPDA, ABS Census 2011 Source:
9 Of note this relates to existing ability to purchase on the basis of the assumptions given. Many households in the LGA earning below the 50% median do own a dwelling in the LGA for a range of reasons i.e. they are longer term owner / occupiers who have subsequently retired and therefore do not earn in the higher income bands, or they bought into the area at a time when it was more affordable and / or they had the benefit of additional equity.
Household Weekly Monthly Principal Home
Weekly hosuehold income (2011) % Stated Income Escl $2015Rental Affordable Mortgage Loan Affordability
- - - - - $1-$199 1% 12,106$ 58$ 252$ 40,282$ 44,758$ $200-$299 2% 18,189$ 87$ 455$ 72,629$ 80,699$ $300-$399 3% 24,272$ 117$ 708$ 113,073$ 125,637$ $400-$599 5% 36,439$ 182$ 1,063$ 169,752$ 188,613$ $600-$799 5% 48,605$ 252$ 1,499$ 239,369$ 265,966$ $800-$999 6% 60,772$ 327$ 1,924$ 307,375$ 341,528$ $1000-$1249 6% 75,980$ 438$ 2,533$ 404,522$ 449,469$ $1250-$1499 6% 91,188$ 526$ 3,040$ 485,491$ 539,435$ $1500-$1999 10% 121,604$ 702$ 4,053$ 647,430$ 719,366$ $2000-$2499 6% 152,021$ 877$ 5,067$ 809,368$ 899,298$ $2500-$2999 19% 182,437$ 1,053$ 6,081$ 971,306$ 1,079,229$ $3000-$3499 9% 212,853$ 1,228$ 7,095$ 1,133,245$ 1,259,161$ $3500-$3999 5% 243,270$ 1,403$ 8,109$ 1,295,183$ 1,439,092$ Top 22% of Housheolds $4000-$4999 5% 304,102$ 1,754$ 10,137$ 1,619,060$ 1,798,955$ $5000 or more 11% 304,163$ 1,755$ 10,139$ 1,619,384$ $1,798,955+Total 100%
11% of Households can not afford to rent or purchase
properties above this threshold
50% of Households can not afford to rent or purchase
properties above this threshold
78% of Households can not afford to rent or purchase

Double Bay Economic Feasibility Study
Ref: C15257- Final Hill PDA Page 52 | 94
Our market research (discussed in Chapter 3) found that as of May 2015 the median sale value for a house (non-strata dwelling) within Woollahra was $3.3m (compared to a Sydney Median of $949,000)10. This sale price could only be affordable for purchase to the existing households earning within the upper end of the top 11% of household incomes as of 2015.
With respect to apartments, there was a notable difference in the median sale value of $967,000 (compared to a Sydney Median of $622,000). The $900,000 price point was affordable for just over 50% of existing households in the LGA. Of note however, as shown in Table 16 below, this price point equates to likely sale prices for studio or 1 bedroom apartments without car parking in the Centre.
With respect to existing 25 to 34 year old residents, Chapter 2 found that 57% of Woollahra LGA’s residents in this age bracket earned over $1,000 per week. Whilst this was a significantly greater proportion than their peers across the Greater Sydney area (33%), in accordance with the Woollahra LGA Affordability Calculator, a $1,000 a week income would only support a mortgage of $450,000. This would not enable the purchase of an apartment in the Centre.
As set out in Table 16, it is anticipated that the entry point for a studio without car parking in the Centre could be $600,000 and a 1 bedroom without car parking $850,000. These entry points would be affordable to a third (34%) and 20% respectively of the LGA’s existing 25 to 34 year olds assuming individual purchase.
Our market research shows however that there is no product on the market in the Centre in this price range verifying Councils identified need for this Study.
It is also noted that affordability could be greatly enhanced if two individuals could service a home loan together. This could however necessitate the purchase of a larger apartment with a second bedroom that would in turn increase the anticipated price point to over the $1.4m mark. On this basis, a new 2 bedroom dwelling would only remain affordable to the highest earning (top 20% - 25%) 25 to 34 year olds for purchase.
10 As of July 2015 it is understood that the Sydney median increased to exceed $1m.

Double Bay Economic Feasibility Study
Ref: C15257- Final Hill PDA Page 53 | 94
Table 16 - Indicative Sale Prices by Apartment Type for the Centre (June 2015)
Apartment Size Sale Price Range Car Space $/sqm
Studio (45sqm) $600,000 to $700,000
$13,300/sqm to $15,500/sqm
Studio (45sqm) $700,000 to $800,000
$15,500/sqm to $17,700/sqm
1 Bedroom (55sqm internal)
$850,000- $950,000
$15,500/sqm - $17,280/sqm
1 Bedroom (55sqm internal)
$950,000 to $1,050,000
$17,500/sqm to $19,000/sqm
2 Bedroom (85sqm internal)
$1.4m to $1.5m
$16,470/sqm to $17,647/sqm
2 Bedroom (85sqm internal)
$1.5m to $1.6m
$17,647/sqm to $18,823/sqm
Whilst the Study Area has a more affluent resident population across all age groups in comparison to the Greater Sydney Average, the cost of housing in the LGA is also significantly greater. Accordingly residents, particularly in the younger age brackets (i.e 25-35 years old) are, or will be priced out of purchasing or renting in the Centre.
In the interests of achieving a greater diversity of age groups, the following Chapters explore further the barriers and opportunities to providing additional dwellings in the Centre across a range of price points.

Double Bay Economic Feasibility Study
Ref: C15257- Final Hill PDA Page 54 | 94
5 WHAT THE STAKEHOLDERS SAID
In order to inform the Study from a commercial perspective a workshop was held with key industry Stakeholders on Thursday July 1st 2015 at Council’s offices. For those unable to attend the workshop, two phone conferences were held on July 7th 2015.
The Stakeholders included:
Six landowners / developers with an interest in the Centre;
One real estate agent;
Four professionals representing clients; and
Two Woollahra Council officers and one Councillor.
Three key questions were asked of Stakeholders including:
1. Is Double Bay attractive to different market groups and if so why?
2. What factors are inhibiting the provision of smaller apartments?
3. What could be done to overcome these challenges?
The following key points were provided in response to the three questions.
Why is Double Bay attractive to different market groups?
Double Bay was identified as a highly desirable residential market by Stakeholders for a range of reasons including:
Its proximity to Sydney CBD and associated lifestyle attractors;
The Centre’s waterfront location;
Double Bays historical reputation and charm;
The Centre’s A grade apartment market and prestigious appeal;
The higher socio-economic status of its resident and visitor population;
The Centre’s proximity to transport such as the ferry, bus and Edgecliff rail station;
The reinvigoration of the Centre with new bars and cafes that are adding to its vitality and appeal to a younger generation;
The current strength of the Sydney residential market generally, low interest rates and comparatively low levels of housing supply; and
The Centre’s relatively flat gradient making it more attractive for elderly downsizers and shoppers.
Double Bay Economic Feasibility Study
Ref: C15257- Final Hill PDA Page 55 | 94
What factors are inhibiting the provision of smaller apartments?
A range of factors were identified as hindering the supply of smaller sized (i.e. studio and 1 bedroom apartments) within the Centre including:
Planning Controls
o The Centre’s existing floor space ratio (FSR);
o The Centre’s existing building height limits;
o Despite this it was recognised that the Double Bay community wanted to retain the ‘village’ feel of the Centre and hence additional height may not be supported.
Land Value
o The Centre had higher land values than many other Centres in Sydney;
o Many existing sites within the Centre have high existing improvement values;
o Many sites within the Centre are smaller and in fragmented ownership resulting in greater costs and challenges to achieve a reasonable sized development parcel.
Car Parking
o The greater cost of constructing basement car parking;
o Challenges relating to water table and acid sulphate soils;
o Commercial office car parking is expensive and limited (renting at $280 per car space per month);
o The market for two and three bedroom apartments require car parking however there is greater flexibility for studio and one bedroom apartments; and
o Car spaces are often used as spill over storage space.
Apartment Mix
o In order for one bedrooms to be viable a $20,000/sqm rate is required which results in a sale price that excludes most younger buyers for affordability reasons. Accordingly two and three bedroom apartments are favoured by the development industry as they appeal better to the older demographic that are in a stronger financial situation;
o The lower appetite for ‘mum and dads’ to move out of their larger house and downsize into a three bedroom apartment in Double Bay. Although in the case that they do, they may

Double Bay Economic Feasibility Study
Ref: C15257- Final Hill PDA Page 56 | 94
have their children move into the apartment with them which will add vitality to the Centre;
o The higher cost of the rental market owing to lack of supply to meet the level of demand generated by younger professionals;
o A preference for physical apartment separation (i.e. different floors) by downsizers from studio / one bedrooms owing to perceived noise and disturbance; and
o Additional rooms within apartments are attractive to the older end of the market seeking storage space or a room for their live in carers.
Development Factors
o High agent commission fees;
o The requirement by banks for 50% pre sales, the mortgage lending market, tax and finance issues;
o Current planning controls hinder viability despite the significant strength of the existing market.
What can be done to overcome these challenges?
A range of factors were identified by Stakeholders to support the provision of additional and smaller apartments in the Centre including:
A Review of Planning Controls, Land Value and Development Factors
o Increase building heights and FSR to allow development to become viable across the Centre;
o Nominate gateway sites to encourage development as well as desirable locations (e.g. near cafes and bars) for smaller apartments / younger residents;
o Council to provide incentives (i.e. FSR bonus) for landowners to amalgamate sites and / or provide smaller apartments;
o Reduce or eliminate s94a contributions for studio or one bedroom apartments;
o Less prescriptive design controls given that it is in the developer’s best interests in Double Bay to develop a scheme to a very high standard;
o The development of a long term vision for Double Bay for the development industry to buy into.
Double Bay Economic Feasibility Study
Ref: C15257- Final Hill PDA Page 57 | 94
Car Parking
o Reduce or eliminate the requirement for car parking for studio and one bedroom apartments.
Apartment Mix
o Council should not prescribe apartment mix i.e. proportion of 1, 2 and 3 bedrooms. This should be left to the market who are likely to develop a mix in any case, particularly for the apartments on lower floors not benefiting from views or closer to the bars and restaurants;
o Studios are less likely to sell in Double Bay than the Elizabeth Bay and Potts Point market;
o Increasing development outcomes and a mix of apartment sizes will attract people to spend money in the Centre.
Development Factors
o The need for Council to fast track the determination of development applications and reduce the need for consultant studies if smaller apartments are proposed.

Double Bay Economic Feasibility Study
Ref: C15257- Final Hill PDA Page 58 | 94
6 FEASIBILITY ANALYSIS
This Chapter explains the methodology and criteria used to assess the financial viability of each Test Site agreed by Council for testing.
Financial Modelling Methodology
To undertake the feasibility modelling we have used our proprietary software, Estate Master which is an industry benchmark used by developers, financiers and property valuers alike.
The analysis follows the approach of a hypothetical development feasibility adopting an acquisition land value and all the costs associated with the nominated hypothetical development including:
Site acquisition (stamp duty and legals);
Professional fees (design and management);
Demolition and construction (including car parking and balconies);
Property holding costs and statutory fees;
Equity, finance charges and interest on debt;
Marketing and selling costs; and
Revenue from sales, rentals and other income.
The hypothetical development cash flow is calculated and discounted to determine the internal rate of return before interest costs on an annual effective basis. Such an approach is commonly applied by developers and investors to determine if a project is viable.
Each of the test sites redevelopment envelopes have been based in accordance with the existing floor space ratio under the WLEP 2014. Therefore the test sites would subject to design.
Investment Value for Test Sites
For the purpose of testing a hypothetical development to assess its financial viability, Council have identified six sites (test sites) within the Centre. In accordance with the brief we have tested ground retail and residential on the upper floors.
To arrive at a current purchase price for our modelling, we have analysed existing market values (as discussed in Chapter 3) to calculate the existing investment value of each test site. The current investment values have been adopted in our financial modelling to test if the redevelopment of the site would be financially attractive to a reasonable developer.

Double Bay Economic Feasibility Study
Ref: C15257- Final Hill PDA Page 59 | 94
When a test site has two or more landowners, we adopted a 20% premium on the current investment value. This provides a more realistic investment value for the sites that would need to be amalgamated for redevelopment.
Table 17 demonstrates each test sites existing investment value and unimproved value (in accordance with the Valuers General (VG) Valuations July 2014). Each test sites existing investment value, existing investment with a 20% premium and unimproved values have been expressed as $/sqm rate.
Table 17 - Assumed Investment Values for the test sites
Site Address
Current Land Value
- VG's
Site Area (sqm)
VG $/site
Investment Value
$/sqm Investment Value
Premium 20%
$/sqm
Site 1 Cross
Street
$8,510,000
1,248 $6,819 $16,990,000 $13,614
The premium value does not apply as there is no
requirement for amalgamation
Site 2 Cross
Street
$8,840,000
1,330 $6,647 $8,340,000 $6,271
The premium value does not apply as there is no
requirement for amalgamation
Site 3 New South Head Rd
$1,650,000
548 $3,011 $5,500,000 $10,036 $ 6,600,000 $12,044
Site 4 New South Head Rd
$6,500,000
1,252 $5,192 $ 12,715,479 $10,156 $ 15,258,575 $12,187
Site 5 New South Head Rd
$8,180,000
1,796 $4,555 $10,000,000 $5,568 $12,000,000 $6,682
Site 6 Bay Street +Short Street
$4,875,000
1,484 $3,285 $20,573,427 $13,863
The premium value does not apply as there is no
requirement for amalgamation
Valuer General Valuations July 2014 and HillPDA 2015 Source:
Location of Test Sites
For the purpose of our modelling we have assumed the Base Case for Site 1 to Site 5 would be at an FSR 2.5:1. Test Site 6 Base Case would be at an FSR 2.5:1 and FSR 3:1. Each Test Sites proposed development would comprise of ground floor retail uses with studios, one and two bedroom apartments located on the upper floors.
As each site in the Centre has different development parameters, the test sites have been selected on the basis that they vary in land size, location, existing improvements and number of lots required for amalgamation. The mixed of Test Sites examples were chosen to provide range of development options in the Centre.

Double Bay Economic Feasibility Study
Ref: C15257- Final Hill PDA Page 60 | 94
For commercial in confidence reasons, we have not provided detailed addresses for the Test Sites. However we do provide below a summary of their general location.
The identified test sites are referred to as:
Site 1: Cross Street: This test site is located on the southern side of Cross Street. The site comprises of two lots with a total land area of 1,250sqm. The current improvement is a two level retail and commercial building with a total building area of 1,700sqm. For redevelopment purposes we have assumed this site is owned by one landowner and would not need to be amalgamated. A 20% premium value was not adopted.
Site 2: Cross Street: This test site is located on the northern side of Cross Street. The site comprises of one large lot with a total land area of 1,330sqm. The current improvement is single level retail building with a total building area of 650sqm. For redevelopment purposes we have assumed this site is owned by one landowner and would not need to be amalgamated. A 20% premium value was not adopted.
Site 3: New South Head Road: This test site is located on the Northern side of New South Head Road towards Rose Bay. To facilitate redevelopment we have assumed that the three lots would be amalgamated to form a total land size of 550sqm. The current improvement comprises of retail and commercial building over one level with a total building area of 550sqm. The Site is held over three individual ownerships. The 20% premium was included in the investment value to reflect site amalgamation.
Site 4: New South Head Road: This test site is located on the southern side of New South Head Road towards Rose Bay. For redevelopment purposes three lots would be amalgamated to form a total land area of 1,250sqm. The current improvements comprise of three retail and commercial buildings over one to two levels, totalling a building area of 1,845sqm. We note there are three individual landowners. The 20% premium was included in the investment value to reflect site amalgamation
Site 5: New South Head Road: This test site is located on the southern side of New South Head Road towards Edgecliff Station. For redevelopment purposes six lots would be amalgamated to form a total land area of approximately 1,800sqm. The current improvements comprise of two buildings retail and commercial

Double Bay Economic Feasibility Study
Ref: C15257- Final Hill PDA Page 61 | 94
buildings over two levels with a total building area of 1,200sqm. For the purpose of our modelling we have assumed there are six individual landowners. The 20% premium was included in the investment value to reflect site amalgamation.
Site 6: Bay Street and Short Street: This test site consists of two Site owned by one landowners. Hereafter the various lots are referred to as Site 6A and 6B. Site 6A is located on the western side of Bay Street towards New South Head Road. Site 6B is located along Short Lane. For redevelopment seven lots would need to be amalgamated to form a total land size of 1,840sqm. The current improvements are seven retail and commercial buildings over two levels with a total building area of 2,000sqm. For the purpose of our modelling we have assumed this site is owned by one landowner and would not need to be amalgamated. A 20% premium value was not adopted.
Financial Feasibility Criteria For our hypothetical modelling, we have set a target project Internal Rate of Return (IRR)11 of 18% p.a as the primary indicator, however regard has been given to the following performance criteria:
The Residual Land Value: is the land purchase price a developer can afford to achieve a viable development;
Development Profit: which is the total revenue less total cost including interest paid and received; and
Development Margin: which is profit divided by total development costs (including selling costs).
Table 18 - Performance Criteria
Performance Project IRR Development Margin
Feasible >18% >20%-25%
Marginally feasible 16%-18% 18%-20%
Not feasible <16% <18%
HillPDA 2015 Source:
11 Project Internal Rate of Return (IRR) – This is the discount rate where the Net Present Value equates to zero.
Double Bay Economic Feasibility Study
Ref: C15257- Final Hill PDA Page 62 | 94
Development Options
For Test Sites 1 to 5 we have adopted the current FSR of 2.5:1 as our base case. Site 6 we have adopted the current FSR 2.5:1 and 3:1. The Base Cases FSR’s are in accordance with the Woollahra Local Environment Plan (LEP) 2014, Double Bay Business Centre Floor Space Ratio map.
In the case that our modelling found that test sites base case was not viable; an additional three options were assessed to calculate the redevelopment viability.
In this scenario the four development options tested were as follows:
Option 1: The Base Case): Mixed Use Development (Site 1 to Site 5 FSR 2.5:1 and Site 6 FSR 2.5: and 3:1): This option was in accordance with the planning controls established by the LEP 2014 and DCP 2015. The proposed mixed use development comprises of ground floor retail with a mix of studios, one and two bedrooms located on the upper floors. Basement car parking was provided for both the retail units and the apartments in the development. This was in accordance with existing planning controls.
Option 2: Mixed Use Development with Reduced Car Parking (Site 1 to Site 5 FSR 2.5:1 and The Base Case for Site 6: FSR 2.5): and 3:1: This option was similar to the base case however the studio and one bedroom apartments were not provided with a car space. As consequence we assumed in accordance with market advice in (Chapter 3) that studio and one bedroom apartments would sell for $100,000 less than the same sized apartments with car parking.
Option 3: Mixed Use Development with No Basement Car Parking (Site 1 to Site 5 FSR 2.5:1 and The Base Case for Site 6: FSR 2.5:1 and 3:1: This option uses an FSR 2.5:1 or 3:1 which is in accordance with the LEP 2014. The proposed development comprises of ground floor retail and one bedroom apartments on the upper levels. Our assumption in the financial modelling is that the one bedroom apartments would sell for $100,000 less than the same sized apartments with car parking. We have also included a financial contribution for the shortfall of retail car spaces, on site in order of $27,325 per space.
Option 4: Mixed Use Development – FSR Tipping Point: This proposed development is to test the maximum FSR required for a development to become viable. This development option
The tipping point is the point at which there is sufficient FSR to achieve the viable redevelopment of the Site (i.e and IRR of 18%)

Double Bay Economic Feasibility Study
Ref: C15257- Final Hill PDA Page 63 | 94
comprise of ground floor retail with a mix of studio, one and two bedroom apartments on the upper levels. Basement car parking was provided for all the retail units and apartments in the development. This was in accordance with the existing Council car parking controls.
Modelling Results
Test Site 1: Cross Street
Table 19 provides a summary of the results of the modelling.
Table 19 - Site 1, Results
Site / Option Specifics Option 1: Base Case FSR 2.5:1
Option 2: Reduce Car Parking FSR
2.5:1
Option 3: One bedrooms No
basement FSR 2.5:1
Option 4: Base Case: Tipping
Point FSR 2.8:1
Site Area (sqm) 1,249 1,249 1,249 1,249
No. of Residential Units
31 31 34 39
Gross Building Area (sqm)
3,125 3,125 3,125 3,125
FSR 2.5:1 2.5:1 2.5:1 2.8:1
Land Purchase Value – Market Value
$16,9890,00 $16,990,000 $16,990,000 $16,990,000
Residual Land Value $12,101,765 $11,574,333 $12,224,751 $17,038,654
Project IRR 6% 5% 6% 18%
Viability Not Viable Not Viable Not Viable Viable
Estate Master Source:
What does it all mean?
Option 1 is in accordance with the existing planning controls and car parking requirements. This Option was not viable at an FSR 2.5:1. This demonstrates that the redevelopment of the Site did not return a higher value than its existing investment value.
Option 4 revealed that a minimum FSR of 2.8:1 and increase in building height would be required to achieve a viable development.
Both Option 2 and Option 3 removed car parking for studio and one bedroom apartments reducing the cost of development. Despite this reduce in costs both Options were found to be unviable.

Double Bay Economic Feasibility Study
Ref: C15257- Final Hill PDA Page 64 | 94
Test Site 2: Cross Street
Table 20 provides a summary of the results of the modelling.
Table 20 - Site 2 Results
Site / Option Specifics Option 1: Base Case FSR 2.5:1
Site Area (sqm) 1,329.6
No. of Residential Units 39
Gross Building Area (sqm)3 3,324
FSR 2.5:1
Land Purchase Value $8,340,000
Residual Land Value $14,492,803
Project IRR 36%
Viability Viable
Estate Master 2015 Source:
What does it all mean?
Option 2 is in accordance with the existing planning controls and car parking requirements. This Option was viable at an FSR 2.5:1. This demonstrates that the redevelopment of the Site would return a higher value than its existing investment value.
This option demonstrates that the current planning controls are appropriate on this Site.
Test Site 3: New South Head Road
Table 21 provides a summary of the results of the modelling.
Table 21 - Site 3 Results Site / Option Specifics Option 1: Base
Case FSR 2.5:1 Option 2: Reduce Car Parking FSR 2.5:1
Option 3: One bedrooms No basement FSR 2.5:1
Option 4: Base Case: Tipping Point FSR 3.25:1
Site Area (sqm) 547.7 547.7 547.7 547.7 No. of Residential Units 16 16 18 22
Gross Building Area (sqm)
1,369 1,369 1,369 1,862
FSR 2.5:1 2.5:1 2.5:1 3.25:1
Land Purchase Value – 20% Premium $6,600,000 $6,600,000 $6,600,000 $6,600,000
Residual Land Value $5,036,475 4,971,704 5,652,634 $6,613,885 Project IRR
10% 9% 13% 18%
Viability Not Viable Not Viable Not Viable Viable

Double Bay Economic Feasibility Study
Ref: C15257- Final Hill PDA Page 65 | 94
What does it all mean?
Option 1 is in accordance with the existing planning controls and car parking requirements. This Option was not viable at an FSR 2.5:1. This demonstrates that the redevelopment of the Site did not return a higher value than its existing investment value.
Option 4 revealed that a minimum FSR of 3.25:1 and increase in building height would be required to achieve a viable development.
Both Option 2 and Option 3 removed car parking for studio and one bedroom apartments reducing the cost of development. Despite this reduce in costs both Options were found to be unviable.
Test Site 4: New South Head Road
Table 22 provides a summary of the results of the modelling
Table 22 - Site 4 Results
Site / Option Specifics Option 1: Base Case FSR 2.5:1
Option 2: Reduce Car Parking FSR 2.5:1
Option 3: One bedrooms No basement FSR 2.5:1
Option 4: Base Case: Tipping Point FSR 3.55:1
Site Area (sqm) 1,251 1,251 1,251 1,251 No. of Residential Units 28 28 31 42
Gross Building Area (sqm)
3,130 3,130 3,130 4,945
FSR 2.5:1 2.5:1 2.5:1 3.55:1
Land Purchase Value – 20% Premium
$ 15,258,575 $ 15,258,575 $ 15,258,575 $ 15,258,575
Residual Land Value $ 8,072,128 $7,771,279
$7,783,278
$15,381,738
Project IRR -1% -2% -3% 18%
Viability Not Viable Not Viable Not Viable Viable
What does it all mean?
Option 1 is in accordance with the existing planning controls and car parking requirements. This Option was not viable at an FSR 2.5:1. This demonstrates that the redevelopment of the Site did not return a higher value than its existing investment value.
Option 4 revealed that a minimum FSR of 3.55:1 and increase in building height would be required to achieve a viable development.

Double Bay Economic Feasibility Study
Ref: C15257- Final Hill PDA Page 66 | 94
Both Option 2 and Option 3 removed car parking for studio and one bedroom apartments reducing the cost of development. Despite this reduce in costs both Options were found to be unviable.
Test Site 5: New South Head Road
Table 23 provides a summary of the results of the modelling.
Table 23 - Site 5 Results
Site / Option Specifics Option 1: Base Case FSR 2.5:1
Site Area (sqm) 1,795
No. of Residential Units 53
Gross Building Area (sqm) 4,489
FSR 2.5:1
Land Purchase Value – 20% Premium $12,000,000
Residual Land Value $16,280,169
Project IRR 28%
Estate Master 2015 Source:
Option 5 is in accordance with the existing planning controls and car parking requirements. This Option was viable at an FSR 2.5:1. This demonstrates that the redevelopment of the Site would return a higher value than its existing investment value.
This option demonstrates that the current planning controls are appropriate on this Site.

Double Bay Economic Feasibility Study
Ref: C15257- Final Hill PDA Page 67 | 94
Test Site 6: Bay Street and Short Street
Table 24 provides a summary of the results of the modelling.
Table 24 - Site 6 Results
Site / Option Specifics Option 1: Base Case FSR
2.5:1
Option 3: Reduce Car Parking FSR
2.5:1
Option 3: One bedrooms No
basement FSR 2.5:1
Option 4: Base Case: Tipping
Point FSR 3.2:1
Site Area (sqm) 1,837sqm 1,837sqm 1,837sqm 1,837sqm
No. of Residential Units 42 42 68 79
Gross Building Area (sqm) 4,593 4,593 4,593 5,878
FSR Site 6A 2.5:1 Site 6B:3:1
Site 6A 2.5:1 Site 6B:3:1
Site 6A 2.5:1 Site 6B:3:1
Site A: 4:1 Site B: 6:1
Land Purchase Value – 20% Premium $20,5734,266 $20,5734,266 $20,5734,266 $20,5734,266
Residual Land Value $ 11,989,835 $ 14,351,188 $11,680,560 $ 20,853,042
Project IRR 2% 7% 3% 18%
Viability Not Viable Not Viable Not Viable Viable
What does it all mean?
Option 1 is in accordance with the existing planning controls and car parking requirements. This Option was not viable at an FSR 2.5:1. This demonstrates that the redevelopment of the Site did not return a higher value than its existing investment value.
Option 4 revealed that a minimum FSR of 3.2:1 and increase in building height would be required to achieve a viable development.
Both Option 2 and Option 3 removed car parking for studio and one bedroom apartments reducing the cost of development. Despite this reduce in costs both Options were found to be unviable.

Double Bay Economic Feasibility Study
Ref: C15257- Final Hill PDA Page 68 | 94
Key Findings
In conclusion four out of the six test sites were not viable in accordance with the existing planning controls. This means that the existing investment value was higher than the redevelopment value. However two of the six test sites were viable in accordance with the current planning controls.
In order for Test Site 1 and Test Site 6 to be redeveloped they would require an increase in FSR of between 2.8:1 to 3.2:1.
Test Site 3 and Test Site 4 are located along New South Head Road. Both Test Sites have reflected lower apartment sale values than Test Site 1 and Test Site 6. In order for Test 3 and Test 4 to be viable an increase in FSR in the range of 3.25:1 to 3.55:1 would need to be achieved.
Test Site 2 and Test 5 were both viable in accordance with the existing FSR of 2.5:1.
We are of the opinion that development feasibility is a matter that should be considered on a site by site basis. However to encourage redevelopment in the Centre our modelling results identify the need to increase FSRs and building heights on particular Site within the Centre.

Double Bay Economic Feasibility Study
Ref: C15257- Final Hill PDA Page 69 | 94
7 FINDINGS, RECOMMENDATIONS AND OPTIONS
This final Chapter summarises the key findings of each of the preceding Chapters to provide recommendations and some potential options for Council to consider. The recommendations and options have been made to:
a) Enhance the viability of development in general within the Centre so as to increase the number of overall residents; and
b) Increase the attraction of providing a mix of apartment sizes to in turn attract a mix of buyer profiles including age groups.
Key Findings
Overall our research, engagement and testing has found:
The existing residential market for both the Centre and the Eastern suburbs is strong fuelled by a mix of low interest rates, growing demand (compared to actual supply) and the Study Area’s prestigious and lifestyle appeal;
The Centre has become an increasingly attractive location for younger residents and visitors on account of its changing retail and lifestyle mix (i.e. the type of small bars and restaurants offered). The development industry recognises that some sections of the Centre (such as Bay Street) are more attractive to a younger demographic both with respect to visitors and prospective residents, accordingly these areas would be better suited to this market;
The growing appeal of the Centre has supported strong demand for retail floorspace at ground level together with sound demand for commercial office suites for professionals in prime locations;
Despite the strength and scale of this demand however, mixed use development within the Centre has been limited in recent years and generally restricted to developments surrounding the Centre. The exception being the conversion of the Stamford Hotel to residential apartments;
Furthermore the majority of new developments that have progressed through to construction or off the plan sales in the Locality comprise of 2+ bedroom apartments. Some developments for studio and one bedroom apartments are within the development pipeline yet are either at the DA stage, are the subject of a Section 96 modification, have been deferred from construction or are located in adjacent Centres such as Rose Bay;
Double Bay Economic Feasibility Study
Ref: C15257- Final Hill PDA Page 70 | 94
Whilst stakeholders engaged for this Study advised that they were keen to redevelop within the Centre and would be likely to provide a mix of apartment sizes, this enthusiasm has not been realised to date despite the significant strength of the residential market. The primary reason agreed by all stakeholders interviewed from the development, investment or real estate industry related to the Centre’s existing planning controls. That is the existing FSR and building heights were not sufficient enough to overcome the high land, improvement and investment values within the Centre to incentivise change;
The results of our independent modeling support this Stakeholder input finding that for the majority of sites (4 out of 6 tested) within the Centre12 there was insufficient financial incentive to redevelop in accordance with the existing controls. This was irrespective of the mix of apartment sizes or variations to the car parking rates. Therefore showing that car parking was not an sufficient incentive;
Our modeling found that the ‘tipping point’ in the current market for the 4 sites that were unviable, was generally over an FSR of 2.8:1 up to 3.55:1 for the sites with high levels of existing investment value. By adjusting the controls to allow for greater floorspace and in turn building heights, redevelopment within the Centre would become more attractive thereby addressing Council’s initial objective to increase the Centre’s residential population;
Our modeling also found that the greatest value and return was achieved via the provision of larger apartment sizes aligning with the market research finding that very few developments in the Locality had progressed to construction with a reasonable proportion of 1 bedroom apartments or any studios. Accordingly any viable redevelopment in the Centre would require a mix of smaller and larger apartment. The larger units would subside the smaller units;
Additional development within the Centre may not however necessarily address Council’s secondary objective of increasing the number of smaller apartments available to younger owner / occupiers or renters;
12 The exceptions relating to larger sites, that do not require amalgamations to create a reasonable development parcel and with a limited level of existing development
Double Bay Economic Feasibility Study
Ref: C15257- Final Hill PDA Page 71 | 94
Our analysis finds that the majority of 25 to 35 years olds living in the Double Bay – Bellevue Hill Locality earn incomes that significantly exceed that of others in their age bracket across Sydney. Notwithstanding this, only 20% of existing residents in this age group could reasonably afford to buy a new 1 bedroom apartment without car parking within the Centre in their own right13.
Recommendations and Options
In light of the above referenced findings we recommend:
1. Recommendation: Council reviews its existing planning controls having particular regard to building height and FSR.
We recognise that there are many factors that need to be considered in determining a permissible building height and envelope for any given site or Centre. On the basis of development feasibility alone we have found however that the majority of the sites within the Centre require an increase in FSR to a minimum of 2.8:1 and generally greater than 3:1 to become viable. Each site and its ‘tipping point’ must however be considered on its merits.
To this effect we would recommend Council consider a review of their planning controls to permit an FSR of between 3:1 and 3.5:1. The most appropriate FSR or FSRs within this range (or otherwise) would be dependent on urban design testing and other environmental considerations.
As a final consideration we highlight that this recommendation is based on the requirement for ground floor commercial / retail uses and residential on all upper floors. Whilst an additional floor (i.e. first floor) of commercial uses within a development in the Centre would support the provision of additional jobs and a greater level of day time activity. However with commercial achieving lower sale / rental value in comparison to residential, an additional floor of commercial means the FSR 3:1 – 3.5:1 range would necessitate a greater FSR than the recommended and thereby building height.
As noted above this change would support redevelopment in the Centre that is likely to result in the provision of a mix of apartment sizes. To support the latter objective further however
13 The potential to purchase would however be enhanced should the household have dual income earners and / or some existing equity over and above a 10% deposit.
What we refer to as the tipping point is the minimum FSR (and in turn building height) required to achieve a financially viable development (i.e. an IRR of 18% and a Development Margin of 20%)
Double Bay Economic Feasibility Study
Ref: C15257- Final Hill PDA Page 72 | 94
we have also considered the following options including their pros and cons in achieving desirable outcomes.
1. Option: Reduction in required car parking rates for studio and one bedroom apartments in the Centre (and potentially within a reasonable radius of the Centre).
Given that the Centre provides a range of services and is relatively well served by public transport to major employment nodes, it would not be an unreasonable prospect for a smaller apartment to be developed without a dedicated car parking space.
This approach was also considered by industry experts to be acceptable to some investors and owner / occupiers of smaller dwellings (i.e studios and one bedrooms )as they were less likely to be car dependant than the typical buyer profile of 2+ bedroom apartments (i.e. downsizers and couples with children).
The intention of this option being to incentivise the provision of smaller dwellings on sites with car parking constraints and by reducing the cost of construction.
2. Option: Minimum requirement for studio and or one bedroom apartments – this option could relate to the minimum requirement (rather than a maximum as required in some LGAs) for a development mix i.e. 30 - 40% of all dwellings to be provided as studio or one bedroom apartments within the Centre. This approach would be in keeping with many Councils such as:
Randwick (Maximum 50% studio or one bedroom units);
North Sydney (25% – 35% studio and one bedroom units);
Marrickville (15% - 60% studio and one bedroom units);
It is important however that this minimum requirement still facilitates a mix of larger apartment sizes as the sale values achieved for these dwellings are an important means of supporting the financial viability of redevelopment within a Centre such as Double Bay. Accordingly too great a component of smaller apartments could act as a financial disincentive on some sites.
This option could also be tailored to more suitable locations within the Centre such as sites within the Bay Street precinct that are considered more attractive to younger residents or in precinct’s less likely to benefit from views and therefore premium sales for larger apartments. This latter element of Option 2 may however be considered too prescriptive to the market.

Double Bay Economic Feasibility Study
Ref: C15257- Final Hill PDA Page 73 | 94
3. Option: Maximum unit size – another option to be considered is a policy requirement that all (or the majority) of 1 bedroom and 2 bedroom apartments are no more than 10% in size above SEPP65 minimums i.e. 50sqm + 10% and 70sqm +10% respectively. By keeping the apartments smaller than many of those currently on the market, and possibly working in conjunction with Option 2, the intention is that they will be presented to the market within a more affordable price bracket.
We have included two bedroom apartments within this option as they may also present an option for two or more younger residents to share the rent of an apartment or a prospective mortgage on account of the second bedroom. This would also improve affordability.
4. Option: Bonus FSR for the provision of additional smaller dwellings – this option could provide a positive incentive to develop additional smaller dwellings in conjunction with, or separate to, Options 2and 3 (minimum provision and maximum size).
We note however that the provision of an FSR bonus would need to exceed the additional height and FSR given by Council to facilitate the viable redevelopment of sites within the Centre over and above the existing planning controls.
Given the high underlying land values in the Centre, an FSR bonus could be a highly attractive prospect to the developer. We note however that it could concurrently raise community concerns with regards to the height and scale of buildings in the Centre and the retention of its ‘village’ character. In this respect a careful balance between the amenity of the Centre and achieving Council’s objective for additional and younger residents would need to be considered.
The provision of a floorspace bonus for smaller apartments may also raise a valid question by the development industry as to why an increase in density would be permitted in exchange for smaller dwellings, yet was not considered acceptable in other circumstances.
Furthermore we recognise that this approach could result in the provision of additional smaller dwellings on the lower levels of buildings increasing supply. This option does not necessarily translate however into more affordable outcomes that in turn increases opportunities for younger residents to afford to live in
An example of a compact dwelling layout in London

Double Bay Economic Feasibility Study
Ref: C15257- Final Hill PDA Page 74 | 94
the Centre. To achieve this, an alternative, more legislative approach to securing housing within given price bands would be required. This would be a far more complex policy response to design and implement in light of the current mechanisms available to Council’s through the planning system.
5. Option: Compact Apartments – this final option relates to the provision of apartments sized below the SEPP 65 guidelines of 50sqm for 1 bedroom apartments e.g. 40sqm.
International research (New York, London and Toronto) identifies that on account of affordability and lifestyle reasons young professionals are increasingly willing to trade apartment size for location and lifestyle. This has resulted in schemes such as Pocket Living in London that increase development yield through smaller apartment sizes without car parking and thereby financial viability. In this example, the sale or rental of the apartments is means tested to target moderate income professionals. These smaller apartments can be provided as part of a scheme that also includes standard sized apartments across a mix of apartment types (i.e. 1, 2 and 3 bedroom).
This is a concept that has a number of benefits yet a number of unresolved challenges in a Sydney context. One important challenge being the impact of compact apartments to residential and design amenity. Should these barriers be overcome however, such an approach may have its benefits with respect to additional residents and a more affordable price point for younger professionals.
In summary we suggest that as a starting point Council consider Recommendation 1, a review of existing building heights and FSR to encourage redevelopment within the Centre and an increase in residents in general.
To more specifically target smaller apartments we suggest that Council considers Option 1 (reduced car parking), layered with Options 2 and 3 (minimum apartment mix and maximum sizes).
Options 4 and 5 may also have merit however they would require notably greater analysis and testing. They may be considered longer term opportunities and outcomes; however they are not likely to be options that could be resolved in time to support development in the current residential market cycle.

Double Bay Economic Feasibility Study
Ref: C15257- Final Hill PDA Page 75 | 94
APPENDIX A: PLANNING AND POLICY CONTEXT
The following Appendix provides an overview of the relevant local and State Government policies and controls that influence housing supply and type within the Centre. The information provided in this Chapter provide important context to the Study and inputs to the feasibility modeling discussed in Chapter 6.
State Government – A Plan for Growing Sydney 2014
The DP&E published ‘A Plan for Growing Sydney’ in December 2014. The Plan seeks to achieve the following overarching outcomes for Metropolitan Sydney:
Goal 1: A competitive economy with world-class services and transport;
Goal 2: A city of housing choice, with homes that meet our needs and lifestyles;
Goal 3: A great place to live with communities that are strong, healthy and well connected; and
Goal 4: A sustainable and resilient city that protects the natural environment and has a balanced approach to the use of land and resources.
Of particular relevance to this Study is Goal 2 - a city of housing choice, with homes that meet our needs and lifestyles. This will be achieved by:
Accelerating housing supply across Sydney;
Accelerating urban renewal across Sydney – providing homes closer to jobs; and
Improving housing choice to suit different needs and lifestyles.
The Centre has the opportunity to contribute to the State Government’s vision for Sydney as an urban renewal precinct in the Eastern Suburbs. The delivery of a smaller apartment product in the Centre would effectively contribute to the local economy and Centre’s vibrancy by creating opportunity for more in-Centre employment, a prosperous retail market and an active day and night time economy.

Double Bay Economic Feasibility Study
Ref: C15257- Final Hill PDA Page 76 | 94
Woollahra 2025 - Our community, our place, our plan 2013
The Woollahra 2025 Our Community, Our Place, Our Plan 2013 (Woollahra 2025) is a strategic document prepared in collaboration with the community through extensive engagement.
Woollahra 2025 is based on five key performance indicators of community well-being; quality places and spaces; a healthy environment; local prosperity; community leadership and participation. The Community Strategic Plan sets a vision for the area and guides development and prosperity.
The vision statement reads:
Woollahra will be a great place to live, work and visit where places and spaces are safe, clean and well maintained;
Our community will offer a unique mix of urban villages with a good range of shops, services and facilities; and
We will make the most of the natural beauty, leafy streetscapes, open spaces, views and proximity to the water and the city.
The document provides an overview of the challenges likely to be experienced over the next 10 to 20 years, with the key challenges relating to this Study including:
The NSW Government’s Metropolitan Strategy targets for 2,900 additional dwellings and 300 jobs in the area by 2031;
The objective to maintain mostly low rise mixed urban form, vibrant villages, architecture, heritage, parks and green open spaces;
Increased housing costs, which is changing the demographic mix in Woollahra, increasing the challenge of maintaining economic diversity; and
Aging population, requiring increased access to adaptable housing, accessible facilities and appropriate services.
Double Bay Place Plan 2014
The Double Bay Place Plan 2014 (Place Plan) is a strategic planning document that sets out the strategies, priorities and actions for achieving the vision for Double Bay. The Place Plan only applies to the B2 Local Centre as identified under Woollahra Local Environmental Plan 2014.
Of relevance to this Study, the following theme and actions apply:
Theme 3 - Planning and Centre Beautification
Source: (Woollahra 2025, 2013)

Double Bay Economic Feasibility Study
Ref: C15257- Final Hill PDA Page 77 | 94
3.1 - Double Bay is a place for people to live, work and play
3.1.1 - Ensure the planning controls encourage retail, commercial and residential mixed use development.
3.2 - Provide increased housing opportunities for people to live in Double Bay.
3.2.1 - Create a more diverse housing mix in Double Bay to make housing more affordable for young people and to increase the residential population of the village.
Woollahra Local Environmental Plan 2014
The Woollahra Local Environmental Plan 2014 (LEP) came into effect on the 23rd May 2015. The particular aims of the LEP relevant to this Study are as follows:
1.2.2(a) - To ensure growth occurs in a planned and co-ordinated way;
1.2.2(d) - To provide greater population densities in and around the Centres that are well serviced by public transport;
1.2.2(e) - To facilitate opportunities, in suitable locations, for diversity in dwelling density and type;
1.2.2(k) - To minimise and manage traffic and parking impacts; and
1.2.2(l) - To ensure development achieves the desired future character of the area.
The objectives of the LEP are achieved through the land use zoning and development provisions.
Zoning
The Study Area (Figure 33) comprises the area zoned B2 – Local Centre under the Woollahra Local Environmental Plan 2014 (LEP). This area identifies the extent of the Double Bay Business Centre and incorporates the Transvaal Avenue heritage conservation area and the Kiaora Lands.

Double Bay Economic Feasibility Study
Ref: C15257- Final Hill PDA Page 78 | 94
Figure 33 - Double Bay Business Centre
Source: Woollahra Municipal Council LEP 2014
The objectives of the B2 Local Centre zone are:
To provide a range of retail, business, entertainment and community uses that serve the needs of people who live in, work in and visit the local area;
To encourage employment opportunities in accessible locations;
To maximise public transport patronage and encourage walking and cycling;
To attract new business and commercial opportunities;
To provide active ground floor uses to create vibrant Centres;
To provide for development of a scale and type that is compatible with the amenity of the surrounding residential area; and
To ensure that development is of a height and scale that achieves the desired future character of the neighbourhood.
Floor Space Ratio
The Study Area Floor Space Ratio (FSR) ranges from 1:1 to 2.5:1 and 3:1.
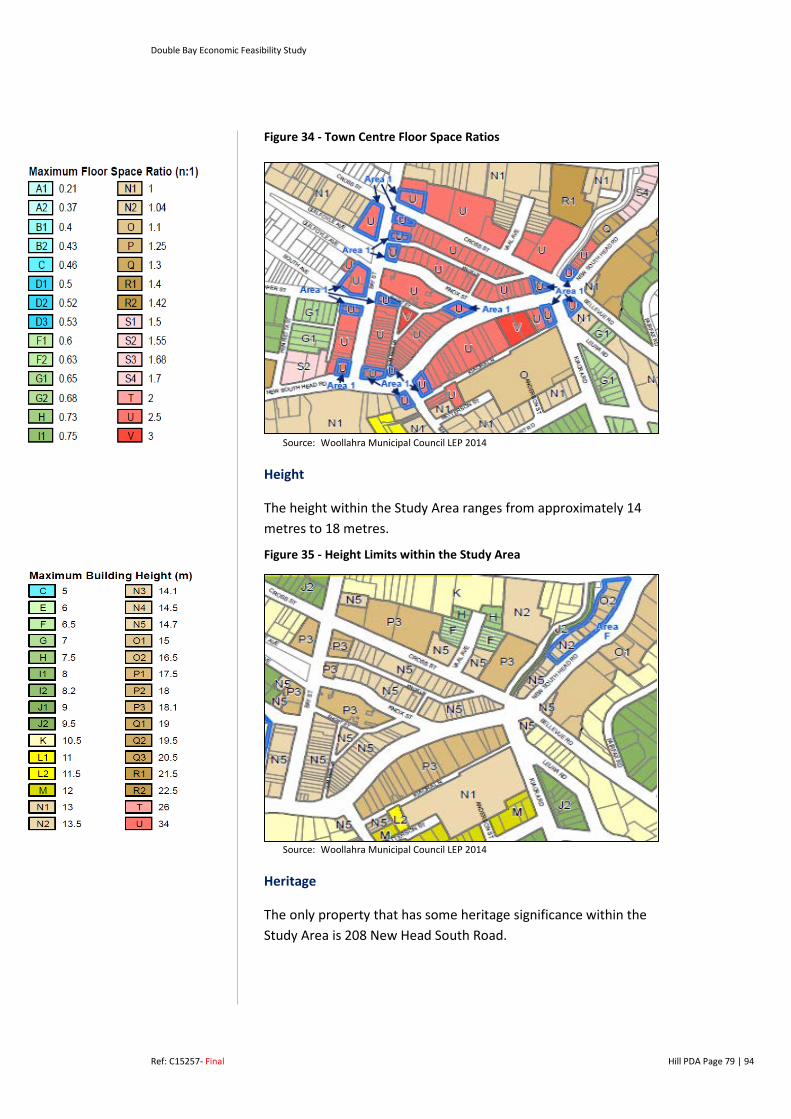
Double Bay Economic Feasibility Study
Ref: C15257- Final Hill PDA Page 79 | 94
Figure 34 - Town Centre Floor Space Ratios
Woollahra Municipal Council LEP 2014 Source:
Height
The height within the Study Area ranges from approximately 14 metres to 18 metres.
Figure 35 - Height Limits within the Study Area
Woollahra Municipal Council LEP 2014 Source:
Heritage
The only property that has some heritage significance within the Study Area is 208 New Head South Road.
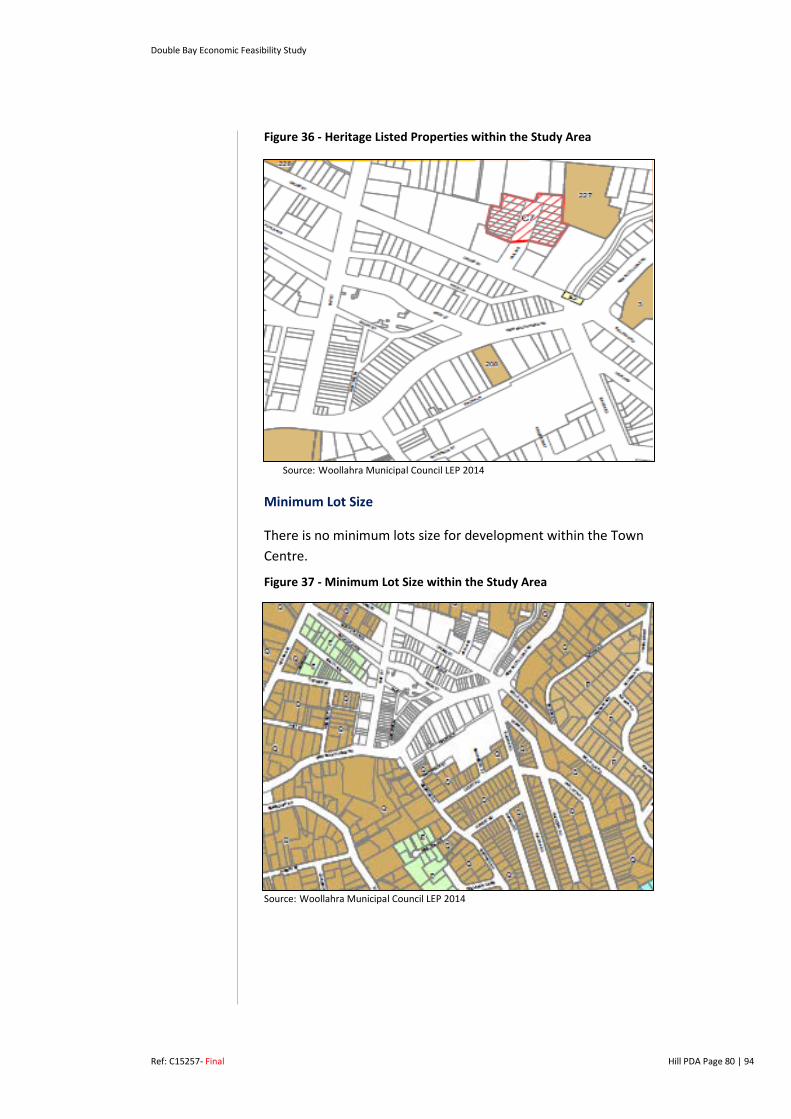
Double Bay Economic Feasibility Study
Ref: C15257- Final Hill PDA Page 80 | 94
Figure 36 - Heritage Listed Properties within the Study Area
Woollahra Municipal Council LEP 2014 Source:
Minimum Lot Size
There is no minimum lots size for development within the Town Centre.
Figure 37 - Minimum Lot Size within the Study Area
Woollahra Municipal Council LEP 2014 Source:

Double Bay Economic Feasibility Study
Ref: C15257- Final Hill PDA Page 81 | 94
Woollahra Development Control Plan 2015 (DCP)
The Woollahra Development Control Plan, specifically Chapter D5, Part D Business Centres has been established to guide future development in the Centre as identified in Figure 38.
Figure 38 - Double Bay Local Centre (Woollahra DCP 2015)
Woollahra Development Control Plan 2015 Source:
The DCP encourages mixed use retail, business, office and / or residential development to contribute to a vibrant living, working and shopping experience.
The core objectives of the plan, as relevant to the Study, include:
O3 - To encourage a diverse mix of uses in the Double Bay Centre and maintain retail uses at ground level;
O5 - To ensure a high standard of architectural and landscape design in any new developments within the Double Bay Centre;
O6 - To preserve and enhance the diversity of uses in the Double Bay Centre; and
O7 - To ensure that new development is compatible with the existing built form, streetscape and village character.
Key strategies for the Centre relevant to the Study relate to the need to:
Ensure the Centre maintains its commercial viability and competitive position within the Sydney retail market;
Foster the existing mix of uses within the Centre such as hotels, retail and commercial businesses and residential on the upper levels;
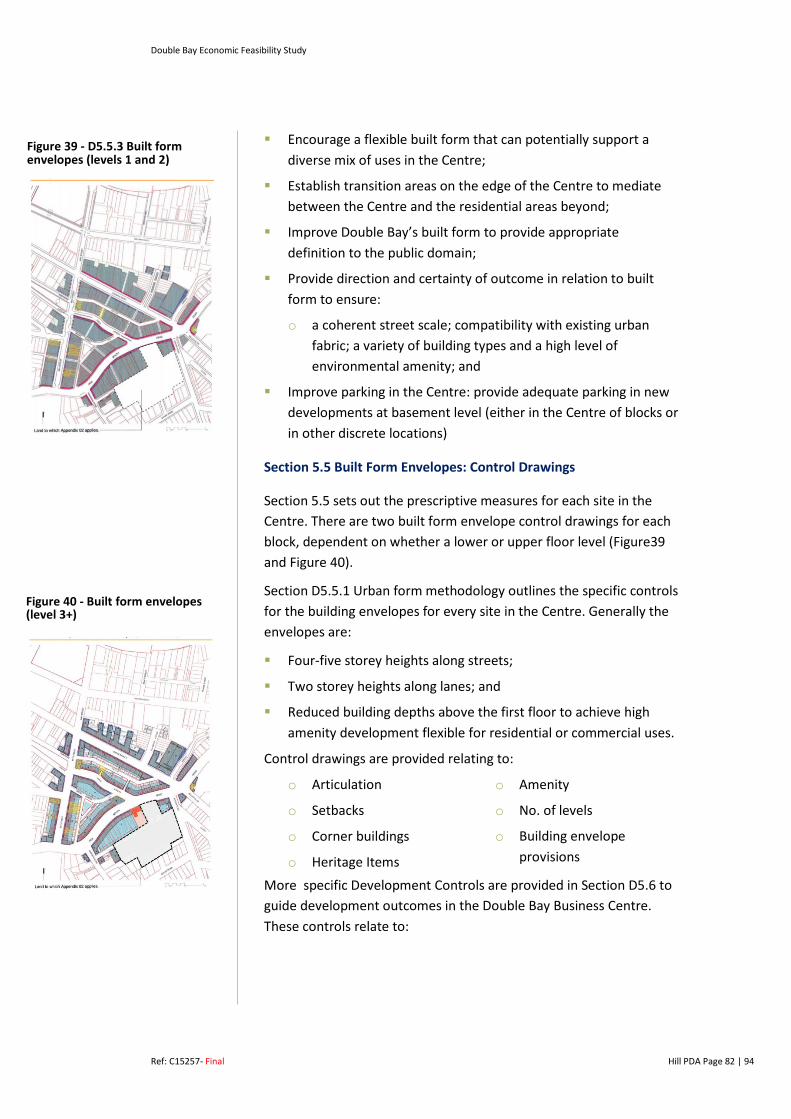
Double Bay Economic Feasibility Study
Ref: C15257- Final Hill PDA Page 82 | 94
Encourage a flexible built form that can potentially support a diverse mix of uses in the Centre;
Establish transition areas on the edge of the Centre to mediate between the Centre and the residential areas beyond;
Improve Double Bay’s built form to provide appropriate definition to the public domain;
Provide direction and certainty of outcome in relation to built form to ensure:
o a coherent street scale; compatibility with existing urban fabric; a variety of building types and a high level of environmental amenity; and
Improve parking in the Centre: provide adequate parking in new developments at basement level (either in the Centre of blocks or in other discrete locations)
Section 5.5 Built Form Envelopes: Control Drawings
Section 5.5 sets out the prescriptive measures for each site in the Centre. There are two built form envelope control drawings for each block, dependent on whether a lower or upper floor level (Figure39 and Figure 40).
Section D5.5.1 Urban form methodology outlines the specific controls for the building envelopes for every site in the Centre. Generally the envelopes are:
Four-five storey heights along streets;
Two storey heights along lanes; and
Reduced building depths above the first floor to achieve high amenity development flexible for residential or commercial uses.
Control drawings are provided relating to:
o Articulation
o Setbacks
o Corner buildings
o Heritage Items
o Amenity
o No. of levels
o Building envelope provisions
More specific Development Controls are provided in Section D5.6 to guide development outcomes in the Double Bay Business Centre. These controls relate to:
Figure 39 - D5.5.3 Built form envelopes (levels 1 and 2)
Figure 40 - Built form envelopes (level 3+)
Double Bay Economic Feasibility Study
Ref: C15257- Final Hill PDA Page 83 | 94
o Use
o Urban Character
o Relationship to public domain
o Amenity
o Solar access and natural ventilation
o Geotechnology and hydrogeology
o Parking and servicing
o Application of concessions
The controls provide further explanation to the Built Form Envelopes: Control Drawings, and introduce additional provisions not described in the drawings. Not all controls are relevant to the every development, however the applicant must nominate and provide justification if controls are considered irrelevant.

Double Bay Economic Feasibility Study Error! Unknown switch argument.
Ref: C15257 HillPDA Page 84 | 94
APPENDIX B: FINANCIAL MODELLING ASSUMPTIONS
The following assumptions were made:
Car Parking
In accordance with the WDCP 2015 we have assumed the following car parking requirements.
Studio: 1 car space per apartment;
One bedroom apartment: 1 car space per apartment
Two bedroom apartments: 1.5 car spaces per apartment
Visitor Parking :0.25 car spaces per apartment; and
Retail: 3.3 car spaces per 100sqm of retail space
Financial contribution to Council in lieu of onsite provision of retail spaces shortfall - $27,325 car space
Residential Apartments
We have assumed that the mix of apartments would comprise of:
20% studio apartments;
40% one bedrooms; and
40% two bedrooms
End Sale Values
Due to the high-level nature of this assessment and in the absence of detailed plans, Hill PDA has adopted a dollar per square metre for retail and a salve value for apartments in the order of:
Cross Street, Bay Street and Short Street:
Retail - $13,500sqm-$15,000sqm
Residential test site with car parking
o Studios: $800,000
o 1 bedroom: $1,000,000
o 2 bedrooms: $1,500,000
For option 4 on this test site we have assumed an additional 15% on sale values given that the additional FSR assumed (and therefore building height) would facilitate better district and or harbour views.
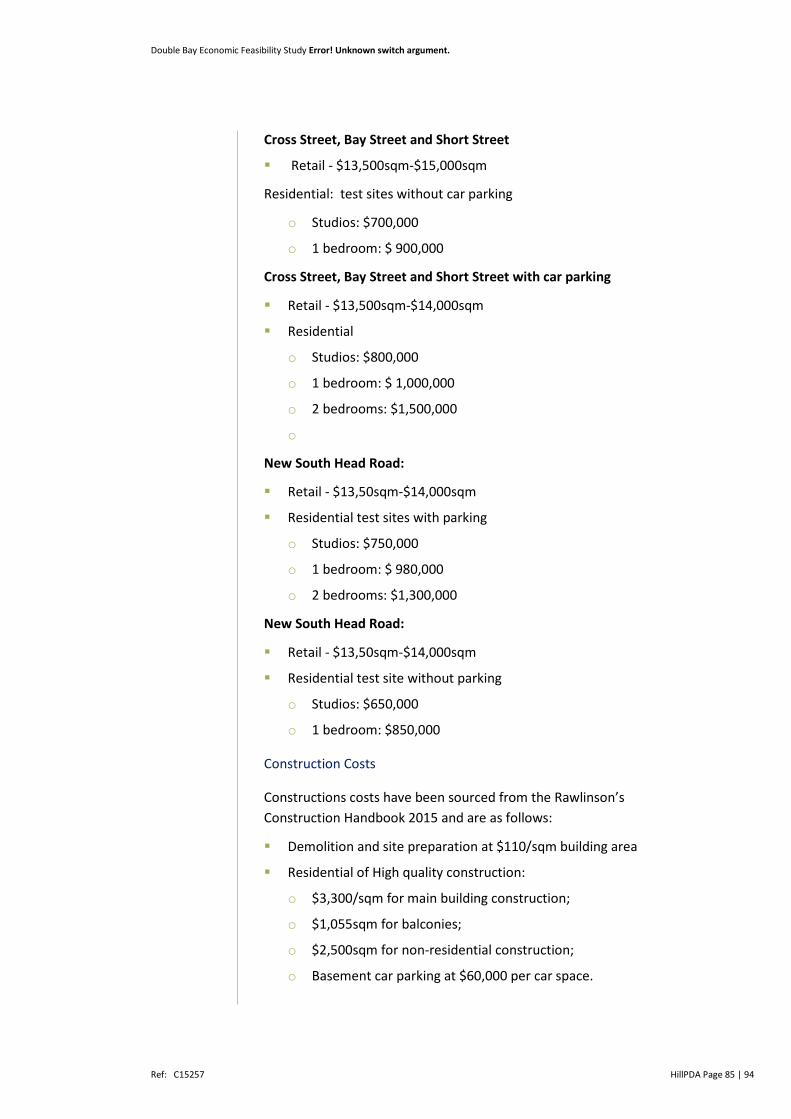
Double Bay Economic Feasibility Study Error! Unknown switch argument.
Ref: C15257 HillPDA Page 85 | 94
Cross Street, Bay Street and Short Street
Retail - $13,500sqm-$15,000sqm
Residential: test sites without car parking
o Studios: $700,000
o 1 bedroom: $ 900,000
Cross Street, Bay Street and Short Street with car parking
Retail - $13,500sqm-$14,000sqm
Residential
o Studios: $800,000
o 1 bedroom: $ 1,000,000
o 2 bedrooms: $1,500,000
o
New South Head Road:
Retail - $13,50sqm-$14,000sqm
Residential test sites with parking
o Studios: $750,000
o 1 bedroom: $ 980,000
o 2 bedrooms: $1,300,000
New South Head Road:
Retail - $13,50sqm-$14,000sqm
Residential test site without parking
o Studios: $650,000
o 1 bedroom: $850,000
Construction Costs
Constructions costs have been sourced from the Rawlinson’s Construction Handbook 2015 and are as follows:
Demolition and site preparation at $110/sqm building area
Residential of High quality construction:
o $3,300/sqm for main building construction;
o $1,055sqm for balconies;
o $2,500sqm for non-residential construction;
o Basement car parking at $60,000 per car space.
Double Bay Economic Feasibility Study Error! Unknown switch argument.
Ref: C15257 HillPDA Page 86 | 94
Additional cost assumptions include:
Professional fees that have been assumed at 10% of building construction costs
Construction contingency of 5% of construction costs.
Statutory costs:
o Residential: Section 94A contributions
o Retail: A contribution of $13/sqm
o Landholding costs based on prevailing statutory rates and assumed to diminish with sales

Double Bay Economic Feasibility Study Error! Unknown switch argument.
Ref: C15257 HillPDA Page 87 | 94
APPENDIX C: SITE ONE: CROSS STREET FINANCIAL SUMMARY
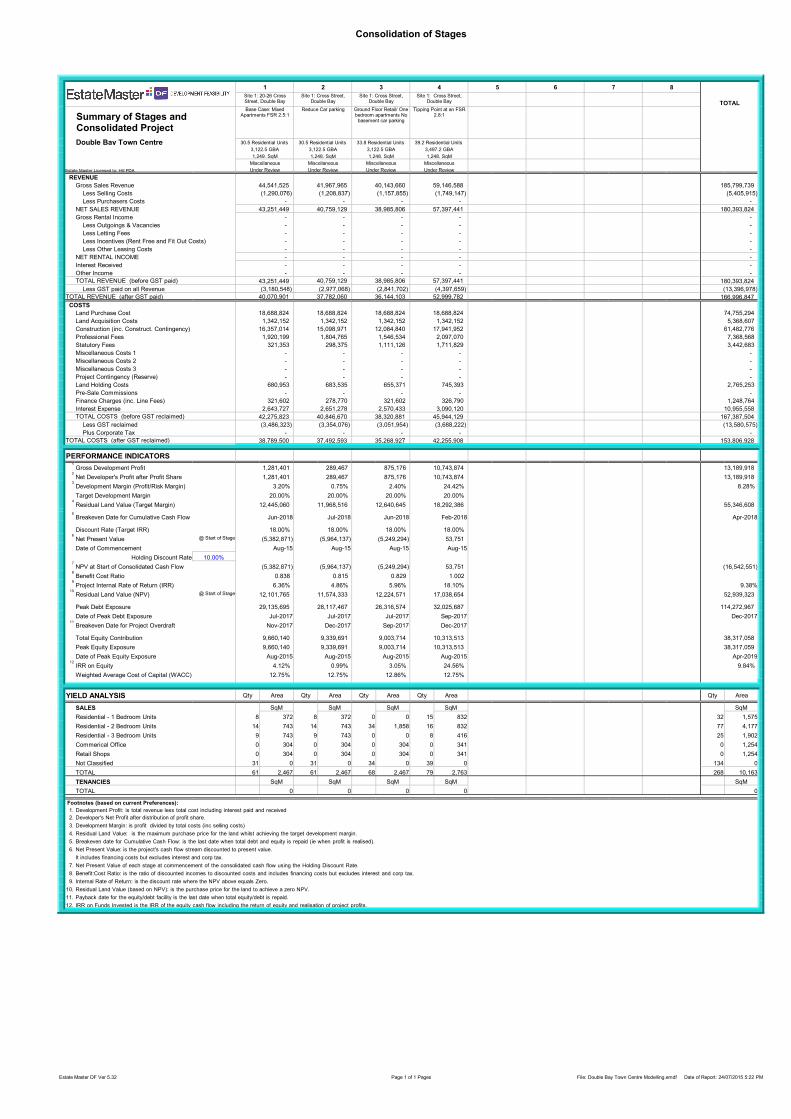
Consolidation of Stages
TRUE 1 TRUE 1 TRUE 1 TRUE 1 TRUE 1 TRUE 1 TRUE 1 TRUE 1
TOTAL
Double Bay Town Centre
Estate Master Licensed to: Hill PDA
REVENUE
Gross Sales Revenue
Less Selling Costs
Less Purchasers Costs
NET SALES REVENUE
Gross Rental Income
Less Outgoings & Vacancies
Less Letting Fees
Less Incentives (Rent Free and Fit Out Costs)
Less Other Leasing Costs
NET RENTAL INCOME
Interest Received
Other Income
TOTAL REVENUE (before GST paid)
Less GST paid on all Revenue
TOTAL REVENUE (after GST paid)
COSTS
Land Purchase Cost
Land Acquisition Costs
Construction (inc. Construct. Contingency)
Professional Fees
Statutory Fees
Miscellaneous Costs 1
Miscellaneous Costs 2
Miscellaneous Costs 3
Project Contingency (Reserve)
Land Holding Costs
Pre-Sale Commissions
Finance Charges (inc. Line Fees)
Interest Expense
TOTAL COSTS (before GST reclaimed)
Less GST reclaimed
Plus Corporate Tax
TOTAL COSTS (after GST reclaimed)
PERFORMANCE INDICATORS1
Gross Development Profit2
Net Developer's Profit after Profit Share3
Development Margin (Profit/Risk Margin)
Target Development Margin4
Residual Land Value (Target Margin)
5
Breakeven Date for Cumulative Cash Flow
Discount Rate (Target IRR)6
Net Present Value @ Start of Stage
Date of Commencement
Holding Discount Rate 10.00%7
NPV at Start of Consolidated Cash Flow8
Benefit Cost Ratio9
Project Internal Rate of Return (IRR)10
Residual Land Value (NPV) @ Start of Stage
Peak Debt Exposure
Date of Peak Debt Exposure11
Breakeven Date for Project Overdraft
Total Equity Contribution
Peak Equity Exposure
Date of Peak Equity Exposure12
IRR on Equity
Weighted Average Cost of Capital (WACC)
YIELD ANALYSIS Qty Area Qty Area Qty Area Qty Area Qty Area Qty Area Qty Area Qty Area Qty Area
SALES SqM SqM SqM SqM - - - - SqM
Residential - 1 Bedroom Units 8 372 8 372 0 0 15 832 0 0 0 0 0 0 0 0 32 1,575
Residential - 2 Bedroom Units 14 743 14 743 34 1,858 16 832 0 0 0 0 0 0 0 0 77 4,177
Residential - 3 Bedroom Units 9 743 9 743 0 0 8 416 0 0 0 0 0 0 0 0 25 1,902
Commerical Office 0 304 0 304 0 304 0 341 0 0 0 0 0 0 0 0 0 1,254
Retail Shops 0 304 0 304 0 304 0 341 0 0 0 0 0 0 0 0 0 1,254
Not Classified 31 0 31 0 34 0 39 0 0 0 0 0 0 0 0 0 134 0
TOTAL 61 2,467 61 2,467 68 2,467 79 2,763 0 0 0 0 0 0 0 0 268 10,163
TENANCIES SqM SqM SqM SqM - - - - SqM
TOTAL 0 0 0 0 0 0 0 0 0
Footnotes (based on current Preferences):
1. Development Profit: is total revenue less total cost including interest paid and received
2. Developer's Net Profit after distribution of profit share.
3. Development Margin: is profit divided by total costs (inc selling costs)
4. Residual Land Value: is the maximum purchase price for the land whilst achieving the target development margin.
5. Breakeven date for Cumulative Cash Flow: is the last date when total debt and equity is repaid (ie when profit is realised).
6. Net Present Value: is the project's cash flow stream discounted to present value.
It includes financing costs but excludes interest and corp tax.
7. Net Present Value of each stage at commencement of the consolidated cash flow using the Holding Discount Rate.
8. Benefit:Cost Ratio: is the ratio of discounted incomes to discounted costs and includes financing costs but excludes interest and corp tax.
9. Internal Rate of Return: is the discount rate where the NPV above equals Zero.
10. Residual Land Value (based on NPV): is the purchase price for the land to achieve a zero NPV.
11. Payback date for the equity/debt facility is the last date when total equity/debt is repaid.
12. IRR on Funds Invested is the IRR of the equity cash flow including the return of equity and realisation of project profits.
1 2 3 4 5 6 7 8
Site 1: 20-26 Cross Street, Double Bay
Site 1: Cross Street, Double Bay
Site 1: Cross Street, Double Bay
Site 1: Cross Street, Double Bay
0 0 0 0
Summary of Stages and Consolidated Project
Base Case: Mixed Apartments FSR 2.5:1
Reduce Car parking Ground Floor Retail/ One bedroom apartments No basement car parking
Tipping Point at an FSR 2.8:1
0 0 0 0
30.5 Residential Units 30.5 Residential Units 33.8 Residential Units 39.2 Residential Units - - - -
3,122.5 GBA 3,122.5 GBA 3,122.5 GBA 3,497.2 GBA - - - -
1,249. SqM 1,248. SqM 1,248. SqM 1,248. SqM - - - -
Miscellaneous Miscellaneous Miscellaneous Miscellaneous - - - -
Under Review Under Review Under Review Under Review - - - -
44,541,525 41,967,965 40,143,660 59,146,588 - - - - 185,799,739
(1,290,076) (1,208,837) (1,157,855) (1,749,147) - - - - (5,405,915)
- - - - - - - - -
43,251,449 40,759,129 38,985,806 57,397,441 - - - - 180,393,824
- - - - - - - - -
- - - - - - - - -
- - - - - - - - -
- - - - - - - - -
- - - - - - - - -
- - - - - - - - -
- - - - - - - - -
- - - - - - - - -
43,251,449 40,759,129 38,985,806 57,397,441 - - - - 180,393,824
(3,180,548) (2,977,068) (2,841,702) (4,397,659) - - - - (13,396,978)
40,070,901 37,782,060 36,144,103 52,999,782 - - - - 166,996,847
18,688,824 18,688,824 18,688,824 18,688,824 - - - - 74,755,294
1,342,152 1,342,152 1,342,152 1,342,152 - - - - 5,368,607
16,357,014 15,098,971 12,084,840 17,941,952 - - - - 61,482,776
1,920,199 1,804,765 1,546,534 2,097,070 - - - - 7,368,568
321,353 298,375 1,111,126 1,711,829 - - - - 3,442,683
- - - - - - - - -
- - - - - - - - -
- - - - - - - - -
- - - - - - - - -
680,953 683,535 655,371 745,393 - - - - 2,765,253
- - - - - - - - -
321,602 278,770 321,602 326,790 - - - - 1,248,764
2,643,727 2,651,278 2,570,433 3,090,120 - - - - 10,955,558
42,275,823 40,846,670 38,320,881 45,944,129 - - - - 167,387,504
(3,486,323) (3,354,076) (3,051,954) (3,688,222) - - - - (13,580,575)
- - - - - - - - -
38,789,500 37,492,593 35,268,927 42,255,908 - - - - 153,806,928
1,281,401 289,467 875,176 10,743,874 - - - - 13,189,918
1,281,401 289,467 875,176 10,743,874 - - - - 13,189,918
3.20% 0.75% 2.40% 24.42% - - - - 8.28%
20.00% 20.00% 20.00% 20.00% - - - -
12,445,060 11,968,516 12,640,645 18,292,386 - - - - 55,346,608
Jun-2018 Jul-2018 Jun-2018 Feb-2018 Jan-1900 Jan-1900 Jan-1900 Jan-1900 Apr-2018
18.00% 18.00% 18.00% 18.00% - - - -
(5,382,871) (5,964,137) (5,249,294) 53,751 - - - -
Aug-15 Aug-15 Aug-15 Aug-15 - - - -
(5,382,871) (5,964,137) (5,249,294) 53,751 - - - - (16,542,551)
0.838 0.815 0.829 1.002 - - - -
6.36% 4.86% 5.96% 18.10% - - - - 9.38%
12,101,765 11,574,333 12,224,571 17,038,654 - - - - 52,939,323
29,135,695 28,117,467 26,316,574 32,025,687 - - - - 114,272,967
Jul-2017 Jul-2017 Jul-2017 Sep-2017 Jan-1900 Jan-1900 Jan-1900 Jan-1900 Dec-2017
Nov-2017 Dec-2017 Sep-2017 Dec-2017 Jan-1900 Jan-1900 Jan-1900 Jan-1900
9,660,140 9,339,691 9,003,714 10,313,513 - - - - 38,317,058
9,660,140 9,339,691 9,003,714 10,313,513 - - - - 38,317,059
Aug-2015 Aug-2015 Aug-2015 Aug-2015 Jan-1900 Jan-1900 Jan-1900 Jan-1900 Apr-2019
4.12% 0.99% 3.05% 24.56% - - - - 9.84%
12.75% 12.75% 12.86% 12.75% - - - -
Estate Master DF Ver 5.32 Page 1 of 1 Pages File: Double Bay Town Centre Modelling.emdf Date of Report: 24/07/2015 5:22 PM

Double Bay Economic Feasibility Study Error! Unknown switch argument.
Ref: C15257 HillPDA Page 88 | 94
APPENDIX C: SITE TWO: CROSS STREET FINANCIAL SUMMARY
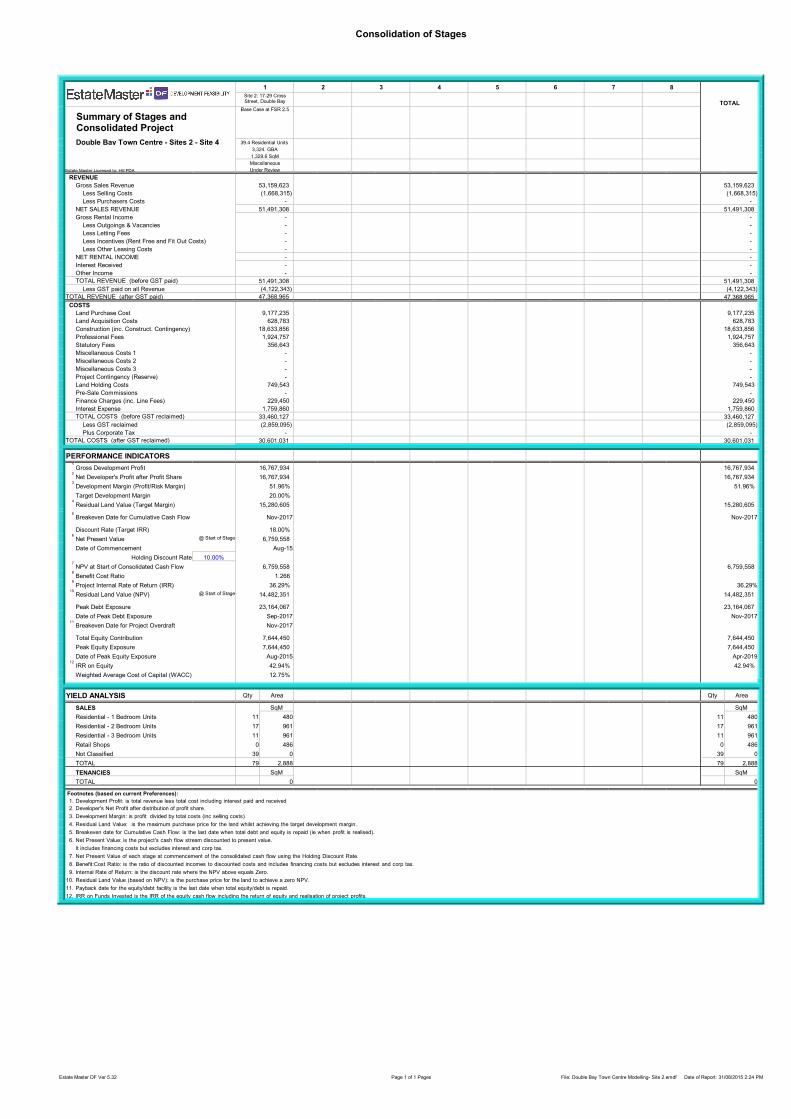
Consolidation of Stages
TRUE 1 TRUE 1 TRUE 1 TRUE 1 TRUE 1 TRUE 1 TRUE 1 TRUE 1
TOTAL
Double Bay Town Centre - Sites 2 - Site 4
Estate Master Licensed to: Hill PDA
REVENUE
Gross Sales Revenue
Less Selling Costs
Less Purchasers Costs
NET SALES REVENUE
Gross Rental Income
Less Outgoings & Vacancies
Less Letting Fees
Less Incentives (Rent Free and Fit Out Costs)
Less Other Leasing Costs
NET RENTAL INCOME
Interest Received
Other Income
TOTAL REVENUE (before GST paid)
Less GST paid on all Revenue
TOTAL REVENUE (after GST paid)
COSTS
Land Purchase Cost
Land Acquisition Costs
Construction (inc. Construct. Contingency)
Professional Fees
Statutory Fees
Miscellaneous Costs 1
Miscellaneous Costs 2
Miscellaneous Costs 3
Project Contingency (Reserve)
Land Holding Costs
Pre-Sale Commissions
Finance Charges (inc. Line Fees)
Interest Expense
TOTAL COSTS (before GST reclaimed)
Less GST reclaimed
Plus Corporate Tax
TOTAL COSTS (after GST reclaimed)
PERFORMANCE INDICATORS1
Gross Development Profit2
Net Developer's Profit after Profit Share3
Development Margin (Profit/Risk Margin)
Target Development Margin4
Residual Land Value (Target Margin)
5
Breakeven Date for Cumulative Cash Flow
Discount Rate (Target IRR)6
Net Present Value @ Start of Stage
Date of Commencement
Holding Discount Rate 10.00%7
NPV at Start of Consolidated Cash Flow8
Benefit Cost Ratio9
Project Internal Rate of Return (IRR)10
Residual Land Value (NPV) @ Start of Stage
Peak Debt Exposure
Date of Peak Debt Exposure11
Breakeven Date for Project Overdraft
Total Equity Contribution
Peak Equity Exposure
Date of Peak Equity Exposure12
IRR on Equity
Weighted Average Cost of Capital (WACC)
YIELD ANALYSIS Qty Area Qty Area Qty Area Qty Area Qty Area Qty Area Qty Area Qty Area Qty Area
SALES SqM - - - - - - - SqM
Residential - 1 Bedroom Units 11 480 0 0 0 0 0 0 0 0 0 0 0 0 0 0 11 480
Residential - 2 Bedroom Units 17 961 0 0 0 0 0 0 0 0 0 0 0 0 0 0 17 961
Residential - 3 Bedroom Units 11 961 0 0 0 0 0 0 0 0 0 0 0 0 0 0 11 961
Retail Shops 0 486 0 0 0 0 0 0 0 0 0 0 0 0 0 0 0 486
Not Classified 39 0 0 0 0 0 0 0 0 0 0 0 0 0 0 0 39 0
TOTAL 79 2,888 0 0 0 0 0 0 0 0 0 0 0 0 0 0 79 2,888
TENANCIES SqM - - - - - - - SqM
TOTAL 0 0 0 0 0 0 0 0 0
Footnotes (based on current Preferences):
1. Development Profit: is total revenue less total cost including interest paid and received
2. Developer's Net Profit after distribution of profit share.
3. Development Margin: is profit divided by total costs (inc selling costs)
4. Residual Land Value: is the maximum purchase price for the land whilst achieving the target development margin.
5. Breakeven date for Cumulative Cash Flow: is the last date when total debt and equity is repaid (ie when profit is realised).
6. Net Present Value: is the project's cash flow stream discounted to present value.
It includes financing costs but excludes interest and corp tax.
7. Net Present Value of each stage at commencement of the consolidated cash flow using the Holding Discount Rate.
8. Benefit:Cost Ratio: is the ratio of discounted incomes to discounted costs and includes financing costs but excludes interest and corp tax.
9. Internal Rate of Return: is the discount rate where the NPV above equals Zero.
10. Residual Land Value (based on NPV): is the purchase price for the land to achieve a zero NPV.
11. Payback date for the equity/debt facility is the last date when total equity/debt is repaid.
12. IRR on Funds Invested is the IRR of the equity cash flow including the return of equity and realisation of project profits.
1 2 3 4 5 6 7 8
Site 2: 17-29 Cross Street, Double Bay
0 0 0 0 0 0 0
Summary of Stages and Consolidated Project
Base Case at FSR 2.5 0 0 0 0 0 0 0
39.4 Residential Units - - - - - - -
3,324. GBA - - - - - - -
1,329.6 SqM - - - - - - -
Miscellaneous - - - - - - -
Under Review - - - - - - -
53,159,623 - - - - - - - 53,159,623
(1,668,315) - - - - - - - (1,668,315)
- - - - - - - - -
51,491,308 - - - - - - - 51,491,308
- - - - - - - - -
- - - - - - - - -
- - - - - - - - -
- - - - - - - - -
- - - - - - - - -
- - - - - - - - -
- - - - - - - - -
- - - - - - - - -
51,491,308 - - - - - - - 51,491,308
(4,122,343) - - - - - - - (4,122,343)
47,368,965 - - - - - - - 47,368,965
9,177,235 - - - - - - - 9,177,235
628,783 - - - - - - - 628,783
18,633,856 - - - - - - - 18,633,856
1,924,757 - - - - - - - 1,924,757
356,643 - - - - - - - 356,643
- - - - - - - - -
- - - - - - - - -
- - - - - - - - -
- - - - - - - - -
749,543 - - - - - - - 749,543
- - - - - - - - -
229,450 - - - - - - - 229,450
1,759,860 - - - - - - - 1,759,860
33,460,127 - - - - - - - 33,460,127
(2,859,095) - - - - - - - (2,859,095)
- - - - - - - - -
30,601,031 - - - - - - - 30,601,031
16,767,934 - - - - - - - 16,767,934
16,767,934 - - - - - - - 16,767,934
51.96% - - - - - - - 51.96%
20.00% - - - - - - -
15,280,605 - - - - - - - 15,280,605
Nov-2017 Jan-1900 Jan-1900 Jan-1900 Jan-1900 Jan-1900 Jan-1900 Jan-1900 Nov-2017
18.00% - - - - - - -
6,759,558 - - - - - - -
Aug-15 - - - - - - -
6,759,558 - - - - - - - 6,759,558
1.266 - - - - - - -
36.29% - - - - - - - 36.29%
14,482,351 - - - - - - - 14,482,351
23,164,067 - - - - - - - 23,164,067
Sep-2017 Jan-1900 Jan-1900 Jan-1900 Jan-1900 Jan-1900 Jan-1900 Jan-1900 Nov-2017
Nov-2017 Jan-1900 Jan-1900 Jan-1900 Jan-1900 Jan-1900 Jan-1900 Jan-1900
7,644,450 - - - - - - - 7,644,450
7,644,450 - - - - - - - 7,644,450
Aug-2015 Jan-1900 Jan-1900 Jan-1900 Jan-1900 Jan-1900 Jan-1900 Jan-1900 Apr-2019
42.94% - - - - - - - 42.94%
12.75% - - - - - - -
Estate Master DF Ver 5.32 Page 1 of 1 Pages File: Double Bay Town Centre Modelling- Site 2.emdf Date of Report: 31/08/2015 2:24 PM
Double Bay Economic Feasibility Study Error! Unknown switch argument.
Ref: C15257 HillPDA Page 89 | 94
APPENDIX D: SITE THREE: NEW SOUTH HEAD ROAD FINANICAL SUMMARY

Consolidation of Stages
TRUE 1 TRUE 1 TRUE 1 TRUE 1 TRUE 1 TRUE 1 TRUE 1 TRUE 1
TOTAL
Double Bay Town Centre - Sites 2 - Site 4
Estate Master Licensed to: Hill PDA
REVENUE
Gross Sales Revenue
Less Selling Costs
Less Purchasers Costs
NET SALES REVENUE
Gross Rental Income
Less Outgoings & Vacancies
Less Letting Fees
Less Incentives (Rent Free and Fit Out Costs)
Less Other Leasing Costs
NET RENTAL INCOME
Interest Received
Other Income
TOTAL REVENUE (before GST paid)
Less GST paid on all Revenue
TOTAL REVENUE (after GST paid)
COSTS
Land Purchase Cost
Land Acquisition Costs
Construction (inc. Construct. Contingency)
Professional Fees
Statutory Fees
Miscellaneous Costs 1
Miscellaneous Costs 2
Miscellaneous Costs 3
Project Contingency (Reserve)
Land Holding Costs
Pre-Sale Commissions
Finance Charges (inc. Line Fees)
Interest Expense
TOTAL COSTS (before GST reclaimed)
Less GST reclaimed
Plus Corporate Tax
TOTAL COSTS (after GST reclaimed)
PERFORMANCE INDICATORS1
Gross Development Profit2
Net Developer's Profit after Profit Share3
Development Margin (Profit/Risk Margin)
Target Development Margin4
Residual Land Value (Target Margin)
5
Breakeven Date for Cumulative Cash Flow
Discount Rate (Target IRR)6
Net Present Value @ Start of Stage
Date of Commencement
Holding Discount Rate 10.00%7
NPV at Start of Consolidated Cash Flow8
Benefit Cost Ratio9
Project Internal Rate of Return (IRR)10
Residual Land Value (NPV) @ Start of Stage
Peak Debt Exposure
Date of Peak Debt Exposure11
Breakeven Date for Project Overdraft
Total Equity Contribution
Peak Equity Exposure
Date of Peak Equity Exposure12
IRR on Equity
Weighted Average Cost of Capital (WACC)
YIELD ANALYSIS Qty Area Qty Area Qty Area Qty Area Qty Area Qty Area Qty Area Qty Area Qty Area
SALES SqM SqM SqM SqM - - - - SqM
Residential - 1 Bedroom Units 4 198 4 198 0 0 6 257 0 0 0 0 0 0 0 0 15 653
Residential - 2 Bedroom Units 7 396 7 396 18 989 9 514 0 0 0 0 0 0 0 0 42 2,295
Residential - 3 Bedroom Units 5 396 5 396 0 0 6 514 0 0 0 0 0 0 0 0 15 1,306
Retail Shops 0 267 0 267 0 267 0 347 0 0 0 0 0 0 0 0 0 1,148
Not Classified 16 0 16 0 18 0 21 0 0 0 0 0 0 0 0 0 72 0
TOTAL 33 1,256 33 1,256 36 1,256 42 1,633 0 0 0 0 0 0 0 0 143 5,402
TENANCIES SqM SqM SqM SqM - - - - SqM
TOTAL 0 0 0 0 0 0 0 0 0
Footnotes (based on current Preferences):
1. Development Profit: is total revenue less total cost including interest paid and received
2. Developer's Net Profit after distribution of profit share.
3. Development Margin: is profit divided by total costs (inc selling costs)
4. Residual Land Value: is the maximum purchase price for the land whilst achieving the target development margin.
5. Breakeven date for Cumulative Cash Flow: is the last date when total debt and equity is repaid (ie when profit is realised).
6. Net Present Value: is the project's cash flow stream discounted to present value.
It includes financing costs but excludes interest and corp tax.
7. Net Present Value of each stage at commencement of the consolidated cash flow using the Holding Discount Rate.
8. Benefit:Cost Ratio: is the ratio of discounted incomes to discounted costs and includes financing costs but excludes interest and corp tax.
9. Internal Rate of Return: is the discount rate where the NPV above equals Zero.
10. Residual Land Value (based on NPV): is the purchase price for the land to achieve a zero NPV.
11. Payback date for the equity/debt facility is the last date when total equity/debt is repaid.
12. IRR on Funds Invested is the IRR of the equity cash flow including the return of equity and realisation of project profits.
1 2 3 4 5 6 7 8
Site 3: Base Case: New South Head Road
Site 3: New South Head Road: No Parking
Site 3: New South Head Road - No Parking
Site 3: Tipping Point: New South Head Road
0 0 0 0
Summary of Stages and Consolidated Project
Base Case at FSR 2.5 Ground Floor Retail/ One bedroom No Basement
Parking
Ground Floor retail and One Bedrooms - No
Basement
Tipping Point at an FSR 3.25:1
0 0 0 0
16.2 Residential Units 16.2 Residential Units 18. Residential Units 21.1 Residential Units - - - -
1,369.3 GBA 1,369.3 GBA 1,369.3 GBA 1,780. GBA - - - -
547.7 SqM 547.7 SqM 547.7 SqM 547.7 SqM - - - -
Miscellaneous Miscellaneous Miscellaneous Miscellaneous - - - -
Under Review Under Review Under Review Under Review - - - -
21,056,977 19,865,144 19,419,576 27,374,070 - - - - 87,715,767
(650,928) (611,597) (600,149) (846,206) - - - - (2,708,880)
- - - - - - - - -
20,406,049 19,253,547 18,819,427 26,527,864 - - - - 85,006,887
- - - - - - - - -
- - - - - - - - -
- - - - - - - - -
- - - - - - - - -
- - - - - - - - -
- - - - - - - - -
- - - - - - - - -
- - - - - - - - -
20,406,049 19,253,547 18,819,427 26,527,864 - - - - 85,006,887
(1,551,026) (1,442,678) (1,429,079) (2,016,334) - - - - (6,439,118)
18,855,023 17,810,868 17,390,348 24,511,529 - - - - 78,567,769
7,260,000 7,260,000 7,260,000 7,260,000 - - - - 29,040,000
484,990 484,990 484,990 484,990 - - - - 1,939,960
8,517,897 7,691,237 6,082,323 11,051,940 - - - - 33,343,397
939,939 864,103 724,824 1,172,127 - - - - 3,700,994
160,839 147,466 507,577 187,065 - - - - 1,002,947
- - - - - - - - -
- - - - - - - - -
- - - - - - - - -
- - - - - - - - -
93,980 94,660 88,012 93,980 - - - - 370,632
- - - - - - - - -
118,494 112,390 125,300 120,193 - - - - 476,377
1,195,680 1,190,815 1,160,007 1,277,475 - - - - 4,823,977
18,771,819 17,845,661 16,433,033 21,647,771 - - - - 74,698,284
(1,582,279) (1,496,658) (1,336,691) (1,851,507) - - - - (6,267,134)
- - - - - - - - -
17,189,540 16,349,003 15,096,342 19,796,264 - - - - 68,431,150
1,665,482 1,461,865 2,294,006 4,715,265 - - - - 10,136,619
1,665,482 1,461,865 2,294,006 4,715,265 - - - - 10,136,619
9.34% 8.62% 14.61% 22.84% - - - - 14.25%
20.00% 20.00% 20.00% 20.00% - - - -
5,323,693 5,307,074 6,031,376 6,994,205 - - - - 23,656,348
Apr-2018 May-2018 Feb-2018 Feb-2018 Jan-1900 Jan-1900 Jan-1900 Jan-1900 Mar-2018
18.00% 18.00% 18.00% 18.00% - - - -
(1,721,625) (1,793,143) (1,043,592) 15,289 - - - -
Aug-15 Aug-15 Aug-15 Aug-15 - - - -
(1,721,625) (1,793,143) (1,043,592) 15,289 - - - - (4,543,071)
0.881 0.871 0.919 1.001 - - - -
9.90% 9.38% 12.79% 18.06% - - - - 12.74%
5,036,475 4,971,704 5,652,634 6,613,885 - - - - 22,274,697
12,964,723 12,317,045 11,285,525 14,950,343 - - - - 51,517,635
Sep-2017 Sep-2017 Sep-2017 Sep-2017 Jan-1900 Jan-1900 Jan-1900 Jan-1900 Dec-2017
Dec-2017 Dec-2017 Nov-2017 Nov-2017 Jan-1900 Jan-1900 Jan-1900 Jan-1900
4,280,742 4,074,751 3,879,270 4,949,568 - - - - 17,184,331
4,280,742 4,074,751 3,879,270 4,949,568 - - - - 17,184,332
Aug-2015 Aug-2015 Aug-2015 Aug-2015 Jan-1900 Jan-1900 Jan-1900 Jan-1900 Apr-2019
10.64% 9.89% 15.37% 22.86% - - - - 15.33%
12.75% 12.75% 12.90% 12.75% - - - -
Estate Master DF Ver 5.32 Page 1 of 1 Pages File: Double Bay Town Centre Modelling- Site 2 Site 4.emdf Date of Report: 24/07/2015 10:30 PM

Double Bay Economic Feasibility Study Error! Unknown switch argument.
Ref: C15257 HillPDA Page 90 | 94
APPENDIX E: SITE FOUR: NEW SOUTH HEAD ROAD FINANICAL SUMMARY
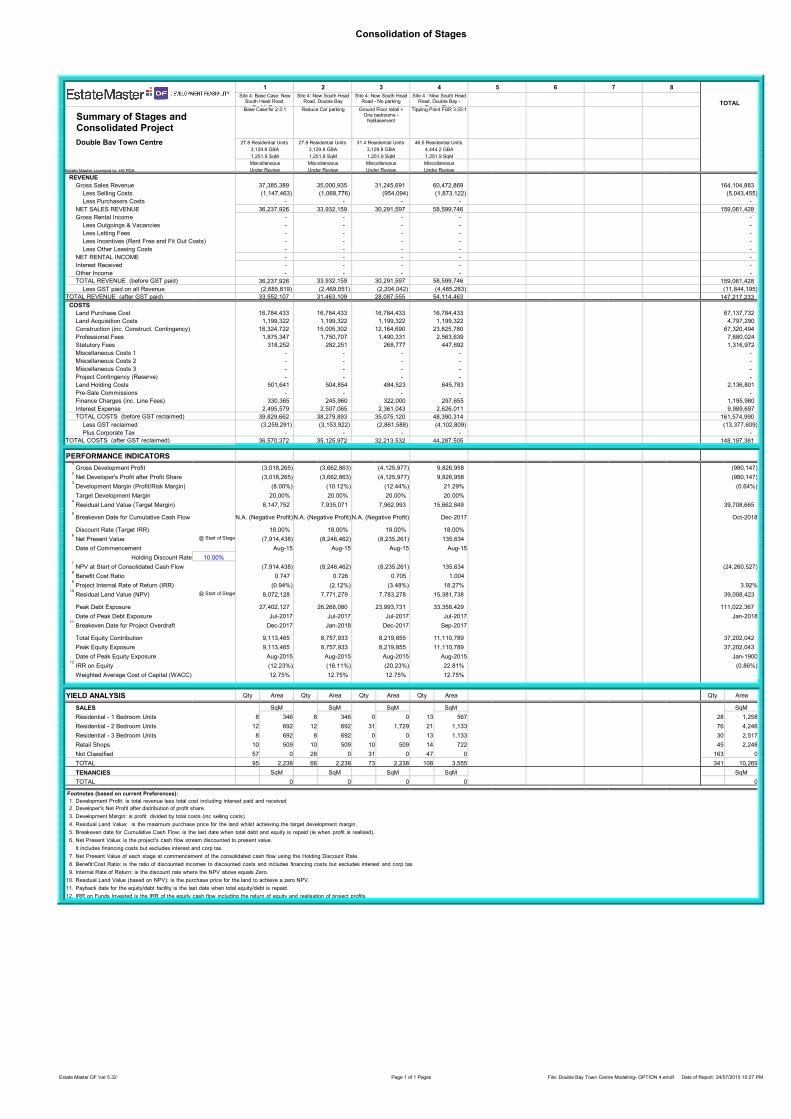
Consolidation of Stages
TRUE 1 TRUE 1 TRUE 1 TRUE 1 TRUE 1 TRUE 1 TRUE 1 TRUE 1
TOTAL
Double Bay Town Centre
Estate Master Licensed to: Hill PDA
REVENUE
Gross Sales Revenue
Less Selling Costs
Less Purchasers Costs
NET SALES REVENUE
Gross Rental Income
Less Outgoings & Vacancies
Less Letting Fees
Less Incentives (Rent Free and Fit Out Costs)
Less Other Leasing Costs
NET RENTAL INCOME
Interest Received
Other Income
TOTAL REVENUE (before GST paid)
Less GST paid on all Revenue
TOTAL REVENUE (after GST paid)
COSTS
Land Purchase Cost
Land Acquisition Costs
Construction (inc. Construct. Contingency)
Professional Fees
Statutory Fees
Miscellaneous Costs 1
Miscellaneous Costs 2
Miscellaneous Costs 3
Project Contingency (Reserve)
Land Holding Costs
Pre-Sale Commissions
Finance Charges (inc. Line Fees)
Interest Expense
TOTAL COSTS (before GST reclaimed)
Less GST reclaimed
Plus Corporate Tax
TOTAL COSTS (after GST reclaimed)
PERFORMANCE INDICATORS1
Gross Development Profit2
Net Developer's Profit after Profit Share3
Development Margin (Profit/Risk Margin)
Target Development Margin4
Residual Land Value (Target Margin)
5
Breakeven Date for Cumulative Cash Flow
Discount Rate (Target IRR)6
Net Present Value @ Start of Stage
Date of Commencement
Holding Discount Rate 10.00%7
NPV at Start of Consolidated Cash Flow8
Benefit Cost Ratio9
Project Internal Rate of Return (IRR)10
Residual Land Value (NPV) @ Start of Stage
Peak Debt Exposure
Date of Peak Debt Exposure11
Breakeven Date for Project Overdraft
Total Equity Contribution
Peak Equity Exposure
Date of Peak Equity Exposure12
IRR on Equity
Weighted Average Cost of Capital (WACC)
YIELD ANALYSIS Qty Area Qty Area Qty Area Qty Area Qty Area Qty Area Qty Area Qty Area Qty Area
SALES SqM SqM SqM SqM - - - - SqM
Residential - 1 Bedroom Units 8 346 8 346 0 0 13 567 0 0 0 0 0 0 0 0 28 1,258
Residential - 2 Bedroom Units 12 692 12 692 31 1,729 21 1,133 0 0 0 0 0 0 0 0 76 4,246
Residential - 3 Bedroom Units 8 692 8 692 0 0 13 1,133 0 0 0 0 0 0 0 0 30 2,517
Retail Shops 10 509 10 509 10 509 14 722 0 0 0 0 0 0 0 0 45 2,248
Not Classified 57 0 28 0 31 0 47 0 0 0 0 0 0 0 0 0 163 0
TOTAL 95 2,238 66 2,238 73 2,238 108 3,555 0 0 0 0 0 0 0 0 341 10,269
TENANCIES SqM SqM SqM SqM - - - - SqM
TOTAL 0 0 0 0 0 0 0 0 0
Footnotes (based on current Preferences):
1. Development Profit: is total revenue less total cost including interest paid and received
2. Developer's Net Profit after distribution of profit share.
3. Development Margin: is profit divided by total costs (inc selling costs)
4. Residual Land Value: is the maximum purchase price for the land whilst achieving the target development margin.
5. Breakeven date for Cumulative Cash Flow: is the last date when total debt and equity is repaid (ie when profit is realised).
6. Net Present Value: is the project's cash flow stream discounted to present value.
It includes financing costs but excludes interest and corp tax.
7. Net Present Value of each stage at commencement of the consolidated cash flow using the Holding Discount Rate.
8. Benefit:Cost Ratio: is the ratio of discounted incomes to discounted costs and includes financing costs but excludes interest and corp tax.
9. Internal Rate of Return: is the discount rate where the NPV above equals Zero.
10. Residual Land Value (based on NPV): is the purchase price for the land to achieve a zero NPV.
11. Payback date for the equity/debt facility is the last date when total equity/debt is repaid.
12. IRR on Funds Invested is the IRR of the equity cash flow including the return of equity and realisation of project profits.
1 2 3 4 5 6 7 8
Site 4: Base Case: New South Head Road,
Double Bay
Site 4: New South Head Road, Double Bay
Site 4: New South Head Road - No parking
Site 4 : New South Head Road, Double Bay - Tipping Point
0 0 0 0
Summary of Stages and Consolidated Project
Base Case:fsr 2.5:1 Reduce Car parking Ground Floor retail + One bedrooms -NoBasement
Tipping Point FSR 3.55:1 0 0 0 0
27.8 Residential Units 27.8 Residential Units 31.4 Residential Units 46.5 Residential Units - - - -
3,129.8 GBA 3,129.8 GBA 3,129.8 GBA 4,444.2 GBA - - - -
1,251.9 SqM 1,251.9 SqM 1,251.9 SqM 1,251.9 SqM - - - -
Miscellaneous Miscellaneous Miscellaneous Miscellaneous - - - -
Under Review Under Review Under Review Under Review - - - -
37,385,389 35,000,935 31,245,691 60,472,869 - - - - 164,104,883
(1,147,463) (1,068,776) (954,094) (1,873,122) - - - - (5,043,455)
- - - - - - - - -
36,237,926 33,932,159 30,291,597 58,599,746 - - - - 159,061,428
- - - - - - - - -
- - - - - - - - -
- - - - - - - - -
- - - - - - - - -
- - - - - - - - -
- - - - - - - - -
- - - - - - - - -
- - - - - - - - -
36,237,926 33,932,159 30,291,597 58,599,746 - - - - 159,061,428
(2,685,819) (2,469,051) (2,204,042) (4,485,283) - - - - (11,844,195)
33,552,107 31,463,109 28,087,555 54,114,463 - - - - 147,217,233
16,784,433 16,784,433 16,784,433 16,784,433 - - - - 67,137,732
1,199,322 1,199,322 1,199,322 1,199,322 - - - - 4,797,290
16,324,722 15,005,302 12,164,690 23,825,780 - - - - 67,320,494
1,875,347 1,750,707 1,490,331 2,563,639 - - - - 7,680,024
318,252 282,251 268,777 447,692 - - - - 1,316,972
- - - - - - - - -
- - - - - - - - -
- - - - - - - - -
- - - - - - - - -
501,641 504,854 484,523 645,783 - - - - 2,136,801
- - - - - - - - -
330,365 245,960 322,000 297,655 - - - - 1,195,980
2,495,579 2,507,065 2,361,043 2,626,011 - - - - 9,989,697
39,829,662 38,279,893 35,075,120 48,390,314 - - - - 161,574,990
(3,259,291) (3,153,922) (2,861,588) (4,102,809) - - - - (13,377,609)
- - - - - - - - -
36,570,372 35,125,972 32,213,532 44,287,505 - - - - 148,197,381
(3,018,265) (3,662,863) (4,125,977) 9,826,958 - - - - (980,147)
(3,018,265) (3,662,863) (4,125,977) 9,826,958 - - - - (980,147)
(8.00%) (10.12%) (12.44%) 21.29% - - - - (0.64%)
20.00% 20.00% 20.00% 20.00% - - - -
8,147,752 7,935,071 7,962,993 15,662,849 - - - - 39,708,665
N.A. (Negative Profit)N.A. (Negative Profit)N.A. (Negative Profit) Dec-2017 Jan-1900 Jan-1900 Jan-1900 Jan-1900 Oct-2018
18.00% 18.00% 18.00% 18.00% - - - -
(7,914,438) (8,246,462) (8,235,261) 135,634 - - - -
Aug-15 Aug-15 Aug-15 Aug-15 - - - -
(7,914,438) (8,246,462) (8,235,261) 135,634 - - - - (24,260,527)
0.747 0.726 0.705 1.004 - - - -
(0.94%) (2.12%) (3.48%) 18.27% - - - - 3.92%
8,072,128 7,771,279 7,783,278 15,381,738 - - - - 39,008,423
27,402,127 26,268,080 23,993,731 33,358,429 - - - - 111,022,367
Jul-2017 Jul-2017 Jul-2017 Jul-2017 Jan-1900 Jan-1900 Jan-1900 Jan-1900 Jan-2018
Dec-2017 Jan-2018 Dec-2017 Sep-2017 Jan-1900 Jan-1900 Jan-1900 Jan-1900
9,113,465 8,757,933 8,219,855 11,110,789 - - - - 37,202,042
9,113,465 8,757,933 8,219,855 11,110,789 - - - - 37,202,043
Aug-2015 Aug-2015 Aug-2015 Aug-2015 Jan-1900 Jan-1900 Jan-1900 Jan-1900 Jan-1900
(12.23%) (16.11%) (20.23%) 22.81% - - - - (0.86%)
12.75% 12.75% 12.75% 12.75% - - - -
Estate Master DF Ver 5.32 Page 1 of 1 Pages File: Double Bay Town Centre Modelling- OPTION 4.emdf Date of Report: 24/07/2015 10:27 PM
Double Bay Economic Feasibility Study Error! Unknown switch argument.
Ref: C15257 HillPDA Page 91 | 94
APPENDIX F: SITE FIVE: NEW SOUTH HEAD ROAD FINANICAL SUMMARY

Consolidation of Stages
TRUE 1 TRUE 1 TRUE 1 TRUE 1 TRUE 1 TRUE 1 TRUE 1 TRUE 1
TOTAL
Double Bay Town Centre
Estate Master Licensed to: Hill PDA
REVENUE
Gross Sales Revenue
Less Selling Costs
Less Purchasers Costs
NET SALES REVENUE
Gross Rental Income
Less Outgoings & Vacancies
Less Letting Fees
Less Incentives (Rent Free and Fit Out Costs)
Less Other Leasing Costs
NET RENTAL INCOME
Interest Received
Other Income
TOTAL REVENUE (before GST paid)
Less GST paid on all Revenue
TOTAL REVENUE (after GST paid)
COSTS
Land Purchase Cost
Land Acquisition Costs
Construction (inc. Construct. Contingency)
Professional Fees
Statutory Fees
Miscellaneous Costs 1
Miscellaneous Costs 2
Miscellaneous Costs 3
Project Contingency (Reserve)
Land Holding Costs
Pre-Sale Commissions
Finance Charges (inc. Line Fees)
Interest Expense
TOTAL COSTS (before GST reclaimed)
Less GST reclaimed
Plus Corporate Tax
TOTAL COSTS (after GST reclaimed)
PERFORMANCE INDICATORS1
Gross Development Profit2
Net Developer's Profit after Profit Share3
Development Margin (Profit/Risk Margin)
Target Development Margin4
Residual Land Value (Target Margin)
5
Breakeven Date for Cumulative Cash Flow
Discount Rate (Target IRR)6
Net Present Value @ Start of Stage
Date of Commencement
Holding Discount Rate 10.00%7
NPV at Start of Consolidated Cash Flow8
Benefit Cost Ratio9
Project Internal Rate of Return (IRR)10
Residual Land Value (NPV) @ Start of Stage
Peak Debt Exposure
Date of Peak Debt Exposure11
Breakeven Date for Project Overdraft
Total Equity Contribution
Peak Equity Exposure
Date of Peak Equity Exposure12
IRR on Equity
Weighted Average Cost of Capital (WACC)
YIELD ANALYSIS Qty Area Qty Area Qty Area Qty Area Qty Area Qty Area Qty Area Qty Area Qty Area
SALES SqM - - - - - - - SqM
Residential - 1 Bedroom Units 14 640 0 0 0 0 0 0 0 0 0 0 0 0 0 0 14 640
Residential - 2 Bedroom Units 23 1,279 0 0 0 0 0 0 0 0 0 0 0 0 0 0 23 1,279
Residential - 3 Bedroom Units 15 1,279 0 0 0 0 0 0 0 0 0 0 0 0 0 0 15 1,279
Retail Shops 13 648 0 0 0 0 0 0 0 0 0 0 0 0 0 0 13 648
Not Classified 53 0 0 0 0 0 0 0 0 0 0 0 0 0 0 0 53 0
TOTAL 118 3,847 0 0 0 0 0 0 0 0 0 0 0 0 0 0 118 3,847
TENANCIES SqM - - - - - - - SqM
TOTAL 0 0 0 0 0 0 0 0 0
Footnotes (based on current Preferences):
1. Development Profit: is total revenue less total cost including interest paid and received
2. Developer's Net Profit after distribution of profit share.
3. Development Margin: is profit divided by total costs (inc selling costs)
4. Residual Land Value: is the maximum purchase price for the land whilst achieving the target development margin.
5. Breakeven date for Cumulative Cash Flow: is the last date when total debt and equity is repaid (ie when profit is realised).
6. Net Present Value: is the project's cash flow stream discounted to present value.
It includes financing costs but excludes interest and corp tax.
7. Net Present Value of each stage at commencement of the consolidated cash flow using the Holding Discount Rate.
8. Benefit:Cost Ratio: is the ratio of discounted incomes to discounted costs and includes financing costs but excludes interest and corp tax.
9. Internal Rate of Return: is the discount rate where the NPV above equals Zero.
10. Residual Land Value (based on NPV): is the purchase price for the land to achieve a zero NPV.
11. Payback date for the equity/debt facility is the last date when total equity/debt is repaid.
12. IRR on Funds Invested is the IRR of the equity cash flow including the return of equity and realisation of project profits.
1 2 3 4 5 6 7 8
Site 5: Base Case: New South Head Road
0 0 0 0 0 0 0
Summary of Stages and Consolidated Project
Base Case FSR 2.5:1 0 0 0 0 0 0 0
52.5 Residential Units - - - - - - -
4,489.8 GBA - - - - - - -
1,795.9 SqM - - - - - - -
Miscellaneous - - - - - - -
Under Review - - - - - - -
64,656,848 - - - - - - - 64,656,848
(2,027,672) - - - - - - - (2,027,672)
- - - - - - - - -
62,629,177 - - - - - - - 62,629,177
- - - - - - - - -
- - - - - - - - -
- - - - - - - - -
- - - - - - - - -
- - - - - - - - -
- - - - - - - - -
- - - - - - - - -
- - - - - - - - -
62,629,177 - - - - - - - 62,629,177
(5,001,827) - - - - - - - (5,001,827)
57,627,350 - - - - - - - 57,627,350
13,200,000 - - - - - - - 13,200,000
930,490 - - - - - - - 930,490
25,623,577 - - - - - - - 25,623,577
2,651,245 - - - - - - - 2,651,245
491,245 - - - - - - - 491,245
- - - - - - - - -
- - - - - - - - -
- - - - - - - - -
- - - - - - - - -
641,083 - - - - - - - 641,083
- - - - - - - - -
255,330 - - - - - - - 255,330
2,300,327 - - - - - - - 2,300,327
46,093,298 - - - - - - - 46,093,298
(3,960,772) - - - - - - - (3,960,772)
- - - - - - - - -
42,132,526 - - - - - - - 42,132,526
15,494,824 - - - - - - - 15,494,824
15,494,824 - - - - - - - 15,494,824
35.09% - - - - - - - 35.09%
20.00% - - - - - - -
16,522,176 - - - - - - - 16,522,176
Oct-2017 Jan-1900 Jan-1900 Jan-1900 Jan-1900 Jan-1900 Jan-1900 Jan-1900 Oct-2017
18.00% - - - - - - -
4,713,820 - - - - - - -
Aug-15 - - - - - - -
4,713,820 - - - - - - - 4,713,820
1.132 - - - - - - -
28.08% - - - - - - - 28.08%
16,280,168 - - - - - - - 16,280,168
31,759,561 - - - - - - - 31,759,561
Jul-2017 Jan-1900 Jan-1900 Jan-1900 Jan-1900 Jan-1900 Jan-1900 Jan-1900 Sep-2017
Sep-2017 Jan-1900 Jan-1900 Jan-1900 Jan-1900 Jan-1900 Jan-1900 Jan-1900
10,623,501 - - - - - - - 10,623,501
10,623,501 - - - - - - - 10,623,501
Aug-2015 Jan-1900 Jan-1900 Jan-1900 Jan-1900 Jan-1900 Jan-1900 Jan-1900 Feb-2019
33.88% - - - - - - - 33.88%
12.75% - - - - - - -
Estate Master DF Ver 5.32 Page 1 of 1 Pages File: Double Bay Town Centre Modelling- Option 5.emdf Date of Report: 31/08/2015 2:26 PM
Double Bay Economic Feasibility Study Error! Unknown switch argument.
Ref: C15257 HillPDA Page 92 | 94
APPENDIX G: SITE SIX: BAY STREET FINANCIAL SUMMARY
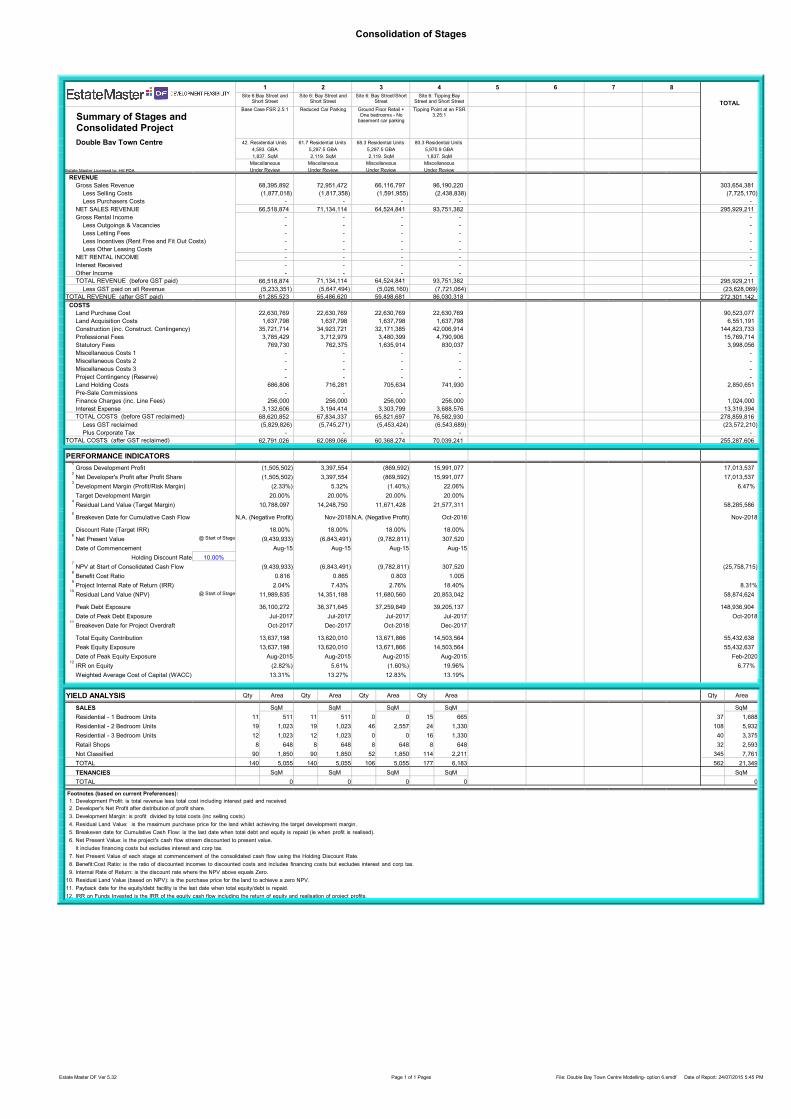
Consolidation of Stages
TRUE 1 TRUE 1 TRUE 1 TRUE 1 TRUE 1 TRUE 1 TRUE 1 TRUE 1
TOTAL
Double Bay Town Centre
Estate Master Licensed to: Hill PDA
REVENUE
Gross Sales Revenue
Less Selling Costs
Less Purchasers Costs
NET SALES REVENUE
Gross Rental Income
Less Outgoings & Vacancies
Less Letting Fees
Less Incentives (Rent Free and Fit Out Costs)
Less Other Leasing Costs
NET RENTAL INCOME
Interest Received
Other Income
TOTAL REVENUE (before GST paid)
Less GST paid on all Revenue
TOTAL REVENUE (after GST paid)
COSTS
Land Purchase Cost
Land Acquisition Costs
Construction (inc. Construct. Contingency)
Professional Fees
Statutory Fees
Miscellaneous Costs 1
Miscellaneous Costs 2
Miscellaneous Costs 3
Project Contingency (Reserve)
Land Holding Costs
Pre-Sale Commissions
Finance Charges (inc. Line Fees)
Interest Expense
TOTAL COSTS (before GST reclaimed)
Less GST reclaimed
Plus Corporate Tax
TOTAL COSTS (after GST reclaimed)
PERFORMANCE INDICATORS1
Gross Development Profit2
Net Developer's Profit after Profit Share3
Development Margin (Profit/Risk Margin)
Target Development Margin4
Residual Land Value (Target Margin)
5
Breakeven Date for Cumulative Cash Flow
Discount Rate (Target IRR)6
Net Present Value @ Start of Stage
Date of Commencement
Holding Discount Rate 10.00%7
NPV at Start of Consolidated Cash Flow8
Benefit Cost Ratio9
Project Internal Rate of Return (IRR)10
Residual Land Value (NPV) @ Start of Stage
Peak Debt Exposure
Date of Peak Debt Exposure11
Breakeven Date for Project Overdraft
Total Equity Contribution
Peak Equity Exposure
Date of Peak Equity Exposure12
IRR on Equity
Weighted Average Cost of Capital (WACC)
YIELD ANALYSIS Qty Area Qty Area Qty Area Qty Area Qty Area Qty Area Qty Area Qty Area Qty Area
SALES SqM SqM SqM SqM - - - - SqM
Residential - 1 Bedroom Units 11 511 11 511 0 0 15 665 0 0 0 0 0 0 0 0 37 1,688
Residential - 2 Bedroom Units 19 1,023 19 1,023 46 2,557 24 1,330 0 0 0 0 0 0 0 0 108 5,932
Residential - 3 Bedroom Units 12 1,023 12 1,023 0 0 16 1,330 0 0 0 0 0 0 0 0 40 3,375
Retail Shops 8 648 8 648 8 648 8 648 0 0 0 0 0 0 0 0 32 2,593
Not Classified 90 1,850 90 1,850 52 1,850 114 2,211 0 0 0 0 0 0 0 0 345 7,761
TOTAL 140 5,055 140 5,055 106 5,055 177 6,183 0 0 0 0 0 0 0 0 562 21,349
TENANCIES SqM SqM SqM SqM - - - - SqM
TOTAL 0 0 0 0 0 0 0 0 0
Footnotes (based on current Preferences):
1. Development Profit: is total revenue less total cost including interest paid and received
2. Developer's Net Profit after distribution of profit share.
3. Development Margin: is profit divided by total costs (inc selling costs)
4. Residual Land Value: is the maximum purchase price for the land whilst achieving the target development margin.
5. Breakeven date for Cumulative Cash Flow: is the last date when total debt and equity is repaid (ie when profit is realised).
6. Net Present Value: is the project's cash flow stream discounted to present value.
It includes financing costs but excludes interest and corp tax.
7. Net Present Value of each stage at commencement of the consolidated cash flow using the Holding Discount Rate.
8. Benefit:Cost Ratio: is the ratio of discounted incomes to discounted costs and includes financing costs but excludes interest and corp tax.
9. Internal Rate of Return: is the discount rate where the NPV above equals Zero.
10. Residual Land Value (based on NPV): is the purchase price for the land to achieve a zero NPV.
11. Payback date for the equity/debt facility is the last date when total equity/debt is repaid.
12. IRR on Funds Invested is the IRR of the equity cash flow including the return of equity and realisation of project profits.
1 2 3 4 5 6 7 8
Site 6:Bay Street and Short Street
Site 6: Bay Street and Short Street
Site 6: Bay Street/Short Street
Site 6: Tipping:Bay Street and Short Street
0 0 0 0
Summary of Stages and Consolidated Project
Base Case FSR 2.5:1 Reduced Car Parking Ground Floor Retail + One bedrooms - No basement car parking
Tipping Point at an FSR 3.25:1
0 0 0 0
42. Residential Units 61.7 Residential Units 68.3 Residential Units 80.3 Residential Units - - - -
4,593. GBA 5,297.5 GBA 5,297.5 GBA 5,970.9 GBA - - - -
1,837. SqM 2,119. SqM 2,119. SqM 1,837. SqM - - - -
Miscellaneous Miscellaneous Miscellaneous Miscellaneous - - - -
Under Review Under Review Under Review Under Review - - - -
68,395,892 72,951,472 66,116,797 96,190,220 - - - - 303,654,381
(1,877,018) (1,817,358) (1,591,955) (2,438,838) - - - - (7,725,170)
- - - - - - - - -
66,518,874 71,134,114 64,524,841 93,751,382 - - - - 295,929,211
- - - - - - - - -
- - - - - - - - -
- - - - - - - - -
- - - - - - - - -
- - - - - - - - -
- - - - - - - - -
- - - - - - - - -
- - - - - - - - -
66,518,874 71,134,114 64,524,841 93,751,382 - - - - 295,929,211
(5,233,351) (5,647,494) (5,026,160) (7,721,064) - - - - (23,628,069)
61,285,523 65,486,620 59,498,681 86,030,318 - - - - 272,301,142
22,630,769 22,630,769 22,630,769 22,630,769 - - - - 90,523,077
1,637,798 1,637,798 1,637,798 1,637,798 - - - - 6,551,191
35,721,714 34,923,721 32,171,385 42,006,914 - - - - 144,823,733
3,785,429 3,712,979 3,480,399 4,790,906 - - - - 15,769,714
769,730 762,375 1,635,914 830,037 - - - - 3,998,056
- - - - - - - - -
- - - - - - - - -
- - - - - - - - -
- - - - - - - - -
686,806 716,281 705,634 741,930 - - - - 2,850,651
- - - - - - - - -
256,000 256,000 256,000 256,000 - - - - 1,024,000
3,132,606 3,194,414 3,303,799 3,688,576 - - - - 13,319,394
68,620,852 67,834,337 65,821,697 76,582,930 - - - - 278,859,816
(5,829,826) (5,745,271) (5,453,424) (6,543,689) - - - - (23,572,210)
- - - - - - - - -
62,791,026 62,089,066 60,368,274 70,039,241 - - - - 255,287,606
(1,505,502) 3,397,554 (869,592) 15,991,077 - - - - 17,013,537
(1,505,502) 3,397,554 (869,592) 15,991,077 - - - - 17,013,537
(2.33%) 5.32% (1.40%) 22.06% - - - - 6.47%
20.00% 20.00% 20.00% 20.00% - - - -
10,788,097 14,248,750 11,671,428 21,577,311 - - - - 58,285,586
N.A. (Negative Profit) Nov-2018N.A. (Negative Profit) Oct-2018 Jan-1900 Jan-1900 Jan-1900 Jan-1900 Nov-2018
18.00% 18.00% 18.00% 18.00% - - - -
(9,439,933) (6,843,491) (9,782,811) 307,520 - - - -
Aug-15 Aug-15 Aug-15 Aug-15 - - - -
(9,439,933) (6,843,491) (9,782,811) 307,520 - - - - (25,758,715)
0.816 0.865 0.803 1.005 - - - -
2.04% 7.43% 2.76% 18.40% - - - - 8.31%
11,989,835 14,351,188 11,680,560 20,853,042 - - - - 58,874,624
36,100,272 36,371,645 37,259,849 39,205,137 - - - - 148,936,904
Jul-2017 Jul-2017 Jul-2017 Jul-2017 Jan-1900 Jan-1900 Jan-1900 Jan-1900 Oct-2018
Oct-2017 Dec-2017 Oct-2018 Dec-2017 Jan-1900 Jan-1900 Jan-1900 Jan-1900
13,637,198 13,620,010 13,671,866 14,503,564 - - - - 55,432,638
13,637,198 13,620,010 13,671,866 14,503,564 - - - - 55,432,637
Aug-2015 Aug-2015 Aug-2015 Aug-2015 Jan-1900 Jan-1900 Jan-1900 Jan-1900 Feb-2020
(2.82%) 5.61% (1.60%) 19.96% - - - - 6.77%
13.31% 13.27% 12.83% 13.19% - - - -
Estate Master DF Ver 5.32 Page 1 of 1 Pages File: Double Bay Town Centre Modelling- option 6.emdf Date of Report: 24/07/2015 5:45 PM
Double Bay Economic Feasibility Study Error! Unknown switch argument.
Ref: C15257 HillPDA Page 93 | 94
Disclaimer
1. This report is for the confidential use only of the party to whom it is addressed ("Client") for the specific purposes to which it refers and has been based on, and takes into account, the Client’s specific instructions. It is not intended to be relied on by any third party who, subject to paragraph 3, must make their own enquiries in relation to the issues with which this report deals.
2. Hill PDA makes no representations as to the appropriateness, accuracy or completeness of this report for the purpose of any party other than the Client ("Recipient"). Hill PDA disclaims all liability to any Recipient for any loss, error or other consequence which may arise as a result of the Recipient acting, relying upon or using the whole or part of this report's contents.
3. This report must not be disclosed to any Recipient or reproduced in whole or in part, for any purpose not directly connected to the project for which Hill PDA was engaged to prepare the report, without the prior written approval of Hill PDA. In the event that a Recipient wishes to rely upon this report, the Recipient must inform Hill PDA who may, in its sole discretion and on specified terms, provide its consent.
4. This report and its attached appendices are based on estimates, assumptions and information provided by the Client or sourced and referenced from external sources by Hill PDA. While we endeavour to check these estimates, assumptions and information, no warranty is given in relation to their reliability, feasibility, accuracy or reasonableness. Hill PDA presents these estimates and assumptions as a basis for the Client’s interpretation and analysis. With respect to forecasts, Hill PDA does not present them as results that will actually be achieved. Hill PDA relies upon the interpretation of the Client to judge for itself the likelihood of whether these projections can be achieved or not.
5. Due care has been taken to prepare the attached financial models from available information at the time of writing, however no responsibility can be or is accepted for errors or inaccuracies that may have occurred either with the programming or the resultant financial projections and their assumptions.
6. This report does not constitute a valuation of any property or interest in property. In preparing this report Hill PDA has relied upon information concerning the subject property and/or proposed development provided by the Client and Hill PDA has not independently verified this information except where noted in this report.
7. In relation to any valuation which is undertaken for a Managed Investment Scheme (as defined by the Managed Investments Act 1998) or for any lender that is subject to the provisions of the Managed Investments Act, the following clause applies:
This valuation is prepared on the assumption that the lender or addressee as referred to in this valuation report (and no other) may rely on the valuation for mortgage finance purposes and the lender has complied with its own lending guidelines as well as prudent finance industry lending practices, and has considered all prudent aspects of credit risk for any potential borrower, including the borrower’s ability to service and repay any mortgage loan. Further, the valuation is prepared on the assumption that the lender is providing mortgage financing at a conservative and prudent loan to value ratio.
Double Bay Economic Feasibility Study Error! Unknown switch argument.
Ref: C15257 HillPDA Page 94 | 94
ABN 52 003 963 755
Sydney
Level 3, 234 George Street Sydney NSW 2000 GPO Box 2748 Sydney NSW 2001 t: +61 2 9252 8777 f: +61 2 9252 6077 e: [email protected]
Melbourne
Suite 114, 838 Collins Street Docklands VIC 3008 t: +61 3 9629 1842 f: +61 3 9629 6315 e: [email protected]
Brisbane
Level 27 Santos Place, 32 Turbot Street Brisbane QLD 4000 GPO Box 938 Brisbane QLD 4001 t: +61 7 3181 5644 e: [email protected]