
DOT/FAA/AR-99/20, P2, voi ii Development of a Supplemental ...
255
DOT/FAA/AR-99/20, P2, voi ii Development of a Supplemental Inspection Document for the Fairchild SA226 and SA227 Aircraft, Part 2, Volume II Office of Aviation Research Washington, D.C. 20591 October 1999 Technical Report This document is available to the U.S. public through the National Technical Information Service (NTIS), Springfield, Virginia 22161. U.S. Department of Transportation Federal Aviation Administration 20000114 058
Transcript of DOT/FAA/AR-99/20, P2, voi ii Development of a Supplemental ...

DOT/FAA/AR-99/20, P2, voi ii Development of a Supplemental Inspection Document for the Fairchild SA226 and SA227 Aircraft, Part 2, Volume II
Office of Aviation Research Washington, D.C. 20591
October 1999
Technical Report
This document is available to the U.S. public through the National Technical Information Service (NTIS), Springfield, Virginia 22161.
U.S. Department of Transportation Federal Aviation Administration
20000114 058

NOTICE
This document is disseminated under the sponsorship of the U.S. Department of Transportation in the interest of information exchange. The United States Government assumes no liability for the contents or use thereof. The United States Government does not endorse products or manufacturers. Trade or manufacturer's names appear herein solely because they are considered essential to the objective of this report. This document does not constitue FAA certification policy. Consult your local FAA aircraft certification office as to its use.
This report is available at the Federal Aviation Administration William J. Hughes Technical Center's Full-Text Technical Reports page: www.tc.faa.gov/its/act141/reportpage.html in Adobe Acrobat portable document format (PDF).

Technical Report Documentation Page 1. Report No.
DOT/FAA/AR-99/20, P2, Vol II
2. Government Accession No. 3. Recipient's Catalog No.
4. Title and Subtitle
DEVELOPMENT OF A SUPPLEMENTAL INSPECTION DOCUMENT FOR THE FAIRCHILD SA226 AND SA227 AIRCRAFT, PART 2, VOLUME II
5. Report Date
October 1999
6. Performing Organization Code
7. Author(s)
W. Dwyer
8. Performing Organization Report No.
9. Performing Organization Name and Address
Fairchild Aircraft P.O. Box 790490 San Antonio, TX 78216
10. Work Unit No. (TRAIS)
11. Contract or Grant No.
12. Sponsoring Agency Name and Address
U.S. Department of Transportation Federal Aviation Administration Office of Aviation Research Washington, DC 20591
13. Type of Report and Period Covered
Technical Report, Part 2, Volume II 14. Sponsoring Agency Code
ACE-100 15. Supplementary Notes
The FAA William J. Hughes Technical Center manager was Dr. Xiaogong Lee. 16. Abstract
This report (consisting of volume I and volume II) is the second phase of a three-phase program sponsored by the Federal Aviation Administration to develop a supplemental inspection document for Fairchild SA226 and SA227 aircraft. In this report, the results of material characterization and testing are presented. Crack growth analysis of all the critical structural elements using NASGRO is performed and the results documented.
17. Keywords
SA226 and SA227, Crack growth, Damage tolerance, Structural inspection, Metro, Merlin, SID, NASGRO
19. Security Classir. (of this report)
Unclassified
18. Distribution Statement
This document is available to the public through the National Technical Information Service (NTIS), Springfield, Virginia 22161.
20. Security Classif. (of this page)
Unclassified
21. No. of Pages
255
22. Price
Form DOT F1700.7 (8-72) Reproduction of completed page authorized

TABLE OF CONTENTS
Volume I 1. INTRODUCTION 1-1
2. ANALYSIS METHOD 2-1
2.1 NASGRO Stress Relationships 2-1 2.2 Usage and Load Spectra 2-1 2.3 Determination of Fastener Loads 2-4 2.4 Additional NASGRO Crack Cases 2-4 2.5 Initial Flaw Assumptions 2-5 2.6 Material Properties 2-6 2.7 Detectable Crack Sizes and Inspection Intervals 2-7
3. SA226 FULL-SCALE FATIGUE TEST 3-1
4. WING GROUP ... 4-1
4.1 PSEW1SA226 Main Spar Lower Surface at WS 99 4-1 4.2 PSE W2 SA226 Main Spar Lower Cap at WS 9.0 4-8 4.3 PSE W3 SA226 Rear Spar Lower Cap at WS 27.0 4-10 4.4 PSE W4 SA227 Main Spar Lower Cap at WS 99.0 4-13 4.5 PSE W5 SA227 Skin Splice at WS 99.51 Lower Surface 4-16 4.6 PSE W6 SA227 Wing Extension Fitting, Main Spar Lower Surface 4-18 4.7 PSE W7 SA227 Lower Wing Skin on Forward Side of Main Landing Gear Trunnion at WS 113 4-20 4.8 PSE W8 SA226 and SA227 Chordwise Skin Splice at WS 173.9 Lower Surface 4-22 4.9 PSE W9 SA226 and SA227 Skin Splice at WS 27 Lower Surface Outboard of Rib 4-23 4.10 PSE W10 SA226 and SA227 Skin Splice at WS 27 Lower Surface Inboard of Splice 4-23 4.11 PSE Wl 1 SA226 Wing Lower Center Section Skin at Landing Light Cutout 4-25 4.12 PSE W12 SA227 Tip Extension Fitting, Rear Spar Lower Surface 4-27 4.13 PSE W13 SA227 Tip Extension at End of Outboard Fitting, Rear Spar Lower Surface 4-28 4.14 PSE W14 SA227 Tip Extension at End of Outboard Fitting, Main Spar Lower Surface 4-31
5. ENGINE MOUNT AND NACELLE GROUP 5-1
5.1 PSE EMI SA227 Upper Engine Mount (27-62114) at the Firewall 5-1 5.2 PSE Nl SA226 and SA227 Nacelle Upper Longeron at the Firewall 5-3 5.3 PSE N2 SA226 and SA227 Nacelle Upper Longeron at Wing Rib Attach Angle 5-5 5.4 PSE N3 SA226 and SA227 Nacelle Upper Longeron Wing Rib Attach Angle 5-6
6. HORIZONTAL AND VERTICAL STABILIZER GROUP 6-1
6.1 PSE Hl SA226 and SA227 Horizontal Stabilizer Rib Strap at Rear Spar BL 3.135 6-1 6.2 PSE H2 SA226 and SA227 Horizontal Stabilizer Pitch Trim Actuator Fitting .' 6-2 6.3 PSE VI SA226 and SA227 Vertical Fin Main Spar Cap Strips Below Pivot Fitting 6-2
7. CARGO DOOR SURROUND STRUCTURE GROUP 7-1
7.1 PSE F4 SA226 and SA227 Fuselage Frames at Fwd and Aft Cargo Door Latches 7-1 7.2 PSE F5 SA226 and SA227 Fuselage Frame at Cargo Door Latch at FS 455.7 and 473.4 7-1 7.3 PSE F6 SA226 and SA227 Fuselage Frame at Cargo Door Sides 7-2 7.4 PSE F7 SA226 and SA227 Cargo Door Hinge 7-3 7.5 PSE F10 SA226 and SA227 Cargo Door Opening Corners 7-5
8. OTHER FUSELAGE GROUP 8-1
8.1 PSE Fl SA226 and SA227 T-Stringer at Top Centerline Near FS 330 8-1 8.2 PSE F2 SA226 and SA227 Wing to Fuselage Forward Attachment Fitting 8-2 8.3 PSE F3 SA226 and SA227 Wing to Fuselage Aft Attachment Fitting 8-2

8.4 PSE F8 SA226 and SA227 Corners of Passenger Window Cutouts 8-2 8.5 PSE F9 SA226 T-Stringer, Bottom Centerline Aft of FS 362 8-3 8.6 PSE Fll SA226 and SA227 Forward Pressure Bulkhead 8-3 8.7 PSE F12 SA226 and SA227 Passenger Door Opening Corners 8-4 8.8 PSE F13 SA226 and SA227 Control Column Roller Bearing 8-5
9. LANDING GEAR GROUP 9-1
9.1 PSE LG2 SA226 and SA227 Landing Gear Cylinder (5453001-1,-3) Under 14,000 lbs Landing Weight... 9-1
10. ONSET OF WIDESPREAD FATIGUE DAMAGE (WFD) 10-1
11. SUMMARY OF RESULTS 11-1
12. REFERENCES 12-1
APPENDICES
A—STRESS ANALYSES AND STIFFNESS MODELS 1 B—NASGRO STRESS FACTORS AND CONSTANTS C—NASGRO OUTPUT FILES
Volume II
APPENDICES
D—NASGRO SCHEDULE FILE
E—FORTRAN SOURCE CODE FOR MODIFIED CRACK CASES
F—TESTDSIG AND ANALYSIS FOR DTA OF FAIRCHILD SA226 MAIN WESTG SPAR LOWER CAP AT WS 99-VOLUMEI
G—TESTING AND ANALYSIS FOR DTA OF FAIRCHILD SA226 MAIN WING LOWER SPAR CAP AT WS 99 - VOLUME II - APPENDICES
IV

LIST OF FIGURES
2-1 SPECTRUM COMPARISON - SA226 AND SA227 2-2
2-2 PEAK ACCELERATION VS SINK RATE (15,675 LBS) 2-3
2-3 STRESS REDUCTION IN MODIFIED CRACK CASE 2-5
2-4 COMPARISON OF CRACK GROWTH RATES FOR SEVERAL NASGRO MATERIALS AND 2024-T42 2-7
2-5 DETERMINATION OF INSPECTION INTERVALS 2-8
4-1 ONE-g STRESS DISTRIBUTION, SA226 MAIN SPAR (12,500 lbs MTOW) FROM FINITE ELEMENT ANALYSIS 4-1
4-2 PSE Wl FINITE ELEMENT RESULTS, UNIT LOAD CASE 4-2
4-3 PSE Wl SA226 MAIN SPAR LOWER CAP WS 99 4-3
4-4 INSPECTION LOCATIONS FOR MAIN SPAR LOWER CAP 4-3
4-5 TWO CRACK SCENARIOS FOR SPAR CAP 4-4
4-6 CRACKS GROWING TOWARD EDGE OF SPAR ASSEMBLY 4-5
4-7 CRACKS GROWING TOWARD CENTER OF SPAR 4-6
4-8 DETERMINATION OF EXTENT OF INSPECTION FOR Wl 4-7
4-9 PSE Wl GROWTH OF INITIAL EDGE FLAW IN CAP 4-8
4-10 PSE W2 SA226 MAIN SPAR LOWER CAP WS 9.0 4-9
4-11 PSE W3 NASTRAN FINITE ELEMENT MODEL 4-11
4-12 PSE W3 SA226 REAR SPAR LOWER CAP AT WS 27.0 4-12
4-13 GROWTH OF AVERAGE QUALITY FLAW IN W3 4-13
4-14 SA227 MAIN SPAR LOWER CAP ELEMENTS (1-G STRESSES FROM FIGURE 4-15 DATA) 4-14
4-15 SA227 MAIN SPAR STRESS DISTRIBUTION (14,000 lbs MTOW) 4-14
4-16 PSE W4 SA227 MAIN SPAR LOWER CAP PRIMARY GROWTH 4-15
4-17 GROWTH OF SECONDARY FLAW AT WS 99 4-16
4-18 SCHEMATIC OF SPLICE AT WS 99 LOWER SURFACE 4-16
4-19 PSE W5 SA227 SKIN SPLICE AT WS 99 LOWER SURFACE... 4-17
4-20 CRACK IN WS 99 SPLICE LINKING ZERO, TWO, AND FOUR HOLES 4-18
4-21 PSE W6 LOAD DISTRBUTION IN STIFFNESS MODEL 4-19
4-22 PSE W6 SA227 WING EXTENSION FITTING MAIN SPAR LOWER SURFACE 4-19
4-23 PSE W7 SA227 LOWER WING SKIN FWD SIDE OF LANDING GEAR TRUNNION AT WS 1134-7 .. 4-21
4-24 PSE W7 CONTINUING DAMAGE IN 0.032 SKIN 4-22
4-25 PSE W8CHORDWISE SKIN SPLICE AT WS 173.9 4-23
4-26 PSE W10 FINITE ELEMENT MODEL OUTPUT 4-24
4-27 PSE W10 SA226 and SA227 SKIN SPLICE AT WS 27 INBOARD 4-25
4-28 NASBEM BOUNDARY ELEMENT MODEL FOR PSE Wl 1 4-26
4-29 NASBEM OUTPUT AT FILLET IN PSE Wl 1 4-26
V

4-30 PSE Wl 1 SA226 WING LOWER CENTER SECTION SKIN AT LANDING LIGHT CUTOUT 4-27
4-31 PSE W12 SA227 TIP EXTENSION FITTING REAR SPAR LOWER SURFACE 4-28
4-32 PSE W13 SA227 TIP EXTENSION AT END OF OUTBOARD FITTING REAR SPAR LOWER SURFACE 4-29
4-33 PSE W14 SA227 TIP EXTENSION AT END OF OUTBOARD FITTING MAIN SPAR LOWER SURFACE 4-31
5-1 ENGINE MOUNT TRUSS F.B.D 5-2
5-2 ENGINE MOUNT BEFORE AND AFTER SERVICE BULLETIN 5-3
5-3 PSE Nl NACELLE UPPER LONGERON AT FIREWALL 5-4
5-4 FREE BODY DIAGRAM OF LONGERON SECTION (KEELSON WEB NEGLECTED) 5-5
5-5 NASTRAN MODEL OF LONGERON ATTACHMENT TO WING 5-6
5-6 SCHEMATIC OF UPPER NACELLE STRUCTURE 5-7
5-7 PSE N3 NACELLE UPPER LONGERON ATTACH ANGLE 5-8
6-1 SCHEMATIC OF VERTICAL TAIL PIVOT FITTING SPLICE 6-3
7-1 PSE F-5 LOWER LATCH FRAME AT STRINGER CUTOUT 7-2
7-2 CARGO DOOR HINGE FINITE ELEMENT MODEL 7-3
7-3 PSE F7 CARGO DOOR HINGE 7-4
7-4 PSE F10 CARGO DOOR CUTOUT CRACK GROWTH 7-5
8-1 PSE Fl T-STRINGER, TOP CENTERLINE NEAR FS 300 8-2
8-2 FATIGUE TEST DATA - CORNERS OF WINDOW CUTOUTS 8-3
8-3 PSE Fl 1 FORWARD PRESSURE BULKHEAD CHANNEL 8-4
LIST OF TABLES
2-1 PEAK ACCELERATION VS SINK RATE 2-5 2-2 DETECTABLE CRACK SIZES 2-10 11-1 SUMMARY OF CRACK GROWTH RESULTS 11-2 11-2 SUMMARY OF INSPECTION INTERVALS 11-3
VI

APPENDIX D NASGRO SCHEDULE FILE
GSFC GODDARD PAYLOAD SPECTRUM 2, 4,
-100.00, -90.00, -80.00, -70.00, -60.00, -50.00, -40.00, -30.00, -20.00, -10.00, -7.00, -5.00, -3.00,
15, 49, 81,
178, 641,
3120, 3405, 5019,
28853, 91655,
0/ CONS1 CONSTANT AMPLITUDE LOADING
1, 1.00, -1.00, 1.00, 0/ TAXI Taxi Spectrum for Metro 226
100.00, 90.00, 80.00, 70.00, 60.00, 50.00, 40.00, 30.00, 20.00, 10.00, 7.00, 5.00, 3.00,
-100.00, -90.00, -80.00, -70.00, -60.00, -50.00, -40.00, -30.00, -20.00, -10.00, -7.00, -5.00, -3.00,
100.00, 90.00, 80.00, 70.00, 60.00, 50.00, 40.00, 30.00, 20.00, 10.00, 7.00, 5.00, 3.00,
-1.00,
-100.00, -90.00, -80.00, -70.00, -60.00, -50.00, -40.00, -30.00, -20.00, -10.00, -7.00, -5.00, -3.00,
100.00, 90.00, 80.00, 70.00, 60.00, 50.00, 40.00, 30.00, 20.00, 10.00, 7.00, 5.00, 3.00,
-100.00, -90.00, -80.00, -70.00, -60.00, -50.00, -40.00, -30.00, -20.00, -10.00, -7.00, -5.00, -3.00,
1.00, -1.00, 1.00,
100. 90. 80. 70. 60. 50. 40. 30. 20. 10. 7. 5. 3.
-1.
1.9000, .30, 0 30, -0 30, 0. 30, 30, 0. 30 -0 30 0.30 .0900, .40, 0 40, -0 40, 0. 40, 40, 0. 40 -0 40 0.40
.0100, 0/ GUST-L Gust
.46, 0 46, -0 46, 0. 46, 46, 0. 46 -0 46 0.46
& Maneuver Spectrum (2 HR) For Long Range Flight Metro 226 38.28571, -0.30, 0.30, -0.30, 0.30, -0.30, 0.30, -0.30, 0.30,
4.57143, -0.50, 0.50, -0.50, 0.50, -0.50, 0.50, -0.50, 0.50, 2.28572, -0.60, 0.60, -0.60, 0.60, -0.60, 0.60, -0.60, 0.60,
.45714, -0.80, 0.80, -0.80, 0.80, -0.80, 0.80, -0.80, 0.80,
.08286, -1.00, 1.00, -1.00, 1.00, -1.00, 1.00, -1.00, 1.00,
.02057, -1.20, 1.20, -1.20, 1.20, -1.20, 1.20, -1.20, 1.20,
.00686, -1.40, 1.40, -1.40, 1.40, -1.40, 1.40, -1.40, 1.40,
.00240, -1.60, 1.60, -1.60, 1.60, -1.60, 1.60, -1.60, 1.60,
.00074, -1.80, 1.80, -1.80, 1.80, -1.80, 1.80, -1.80, 1.80,
.00086, 0/ GUST-M Gust
-2.00, 2.00, -2.00, 2.00, -2.00, 2.00, -2.00, 2.00,
& Maneuver Spectrum (1 Hour For Medium Range Flight Metro 226 19.14286, -0.30, 0.30, -0.30, 0.30, -0.30, 0.30, -0.30, 0.30, 2.28571, -0.50, 0.50, -0.50, 0.50, -0.50, 0.50, -0.50, 0.50, 1.14286, -0.60, 0.60, -0.60, 0.60, -0.60, 0.60, -0.60, 0.60, .22857, -0.80, 0.80, -0.80, 0.80, -0.80, 0.80, -0.80, 0.80, .04143, -1.00, 1.00, -1.00, 1.00, -1.00, 1.00, -1.00, 1.00, .01029, -1.20, 1.20, -1.20, 1.20, -1.20, 1.20, -1.20, 1.20, .00343, -1.40, 1.40, -1.40, 1.40, -1.40, 1.40, -1.40, 1.40, .00120, -1.60, 1.60, -1.60, 1.60, -1.60, 1.60, -1.60, 1.60, .00037, -1.80, 1.80, -1.80, 1.80, -1.80, 1.80, -1.80, 1.80, .00043,
0/ GUST-S Gust
-2.00, 2.00, -2.00, 2.00, -2.00, 2.00, -2.00, 2.00,
& Maneuver Spectrum (30 MIN) For Short Range Flight Metro 226 9.57143, -0.30, 0.30, -0.30, 0.30, -0.30, 0.30, -0.30, 0.30, 1.14286, -0.50, 0.50, -0.50, 0.50, -0.50, 0.50, -0.50, 0.50, .57143, -0.60, 0.60, -0.60, 0.60, -0.60, 0.60, -0.60, 0.60, .11429, -0.80, 0.80, -0.80, 0.80, -0.80, 0.80, -0.80, 0.80, .02071, -1.00, 1.00, -1.00, 1.00, -1.00, 1.00, -1.00, 1.00, .00514, -1.20, 1.20, -1.20, 1.20, -1.20, 1.20, -1.20, 1.20, .00171, -1.40, 1.40, -1.40, 1.40, -1.40, 1.40, -1.40, 1.40, .00060, -1.60, 1.60, -1.60, 1.60, -1.60, 1.60, -1.60, 1.60, .00019, -1.80, 1.80, -1.80, 1.80, -1.80, 1.80, -1.80, 1.80 .00021, -2.00, 2.00, -2.00, 2.00, -2.00, 2.00, -2.00, 2.00
GUST-L7 Gust & Maneuver Spectrum (2 HR) For Long Range Flight SA227 00.00000, -0.00, 0.00, -0.00, 0.00, -0.00, 0.00, -0.00, 0.00 24.51503, -0.22, 0.22, -0.22, 0.22, -0.22, 0.22, -0.22, 0.22 2.72800, -0.43, 0.43, -0.43, 0.43, -0.43, 0.43, -0.43, 0.43 .46463, -0.65, 0.65, -0.65, 0.65, -0.65, 0.65, -0.65, 0.65 .10640, -0.87, 0.87, -0.87, 0.87, -0.87, 0.87, -0.87, 0.87 .02640, -1.08, 1.08, -1.08, 1.08, -1.08, 1.08, -1.08, 1.08
D-l

.00960, -1.30, 1.30, -1.30, 1.30, -1.30, 1.30, -1.30, 1.30,
.00297, -1.52, 1.52, -1.52, 1.52, -1.52, 1.52, -1.52, 1.52,
.00114, -1.73, 1.73, -1.73, 1.73, -1.73, 1.73, -1.73, 1.73,
.00051, -1.95, 1.95, -1.95, 1.95, -1.95, 1.95, -1.95, 1.95,
GUST-M7 Gust & Maneuver Spectrum (1 HR) For Medium Range Flight SA227 00.00000, -0.00, 0.00, -0.00, 0.00, -0.00, 0.00, -0.00, 0.00, 31.10351, -0.22, 0.22, -0.22, 0.22, -0.22, 0.22, -0.22, 0.22, 2.98177, -0.43, 0.43, -0.43, 0.43, -0.43, 0.43, -0.43, 0.43, .44934, -0.65, 0.65, -0.65, 0.65, -0.65, 0.65, -0.65, 0.65, .09423, -0.87, 0.87, -0.87, 0.87, -0.87, 0.87, -0.87, 0.87, .02326, -1.08, 1.08, -1.08, 1.08, -1.08, 1.08, -1.08 1.08, .00757, -1.30, 1.30, -1.30, 1.30, -1.30, 1.30, -1.30 1.30, .00231, -1.52, 1.52, -1.52, 1.52, -1.52, 1.52, -1.52 1.52, .00080, -1.73, 1.73, -1.73, 1.73, -1.73, 1.73, -1.73 1.73, .00034, -1.95, 1.95, -1.95, 1.95, -1.95, 1.95, -1.95 1.95,
GUST-S7 Gust & Maneuver Spectrum (0.5 HR) For Short Range Flight SA227 00.00000, -0.00, 0.00, -0.00, 0.00, -0.00, 0.00, -0.00 0.00, 15.09007, -0.22, 0.22, -0.22, 0.22, -0.22, 0.22, -0.22 0.22,
1.52174, -0.43, 0.43, -0.43, 0.43, -0.43, 0.43, -0.43 0.43,
.23221, -0.65, 0.65, -0.65, 0.65, -0.65, 0.65, -0.65 0.65,
.04871, -0.87, 0.87, -0.87, 0.87, -0.87, 0.87, -0.87 0.87,
.01210, -1.08, 1.08, -1.08, 1.08, -1.08, 1.08, -1.08 1.08,
.00397, -1.30, 1.30, -1.30, 1.30, -1.30, 1.30, -1.30 1.30,
.00123, -1.52, 1.52, -1.52, 1.52, -1.52, 1.52, -1.52 1.52,
.00043, -1.73, 1.73, -1.73, 1.73, -1.73, 1.73, -1.73 1.73,
.00017, 0/ LAND-21 Lar
-1.95, 1.95, -1.95, 1.95, -1.95, 1.95, -1.95 1.95,
iding Spectrum - Metro 226 gage 21 .2750, 1.00, 1. 01, 1.00, 1.01, 1.00, 1.01, 1.00, 1 01, .4400, 0.81, 1. 12, 0.81, 1.12, 0.81, 1.12, 0.81, 1 12, .2200, 0.61, 1. 23, 0.61, 1.23, 0.61, 1.23, 0.61, 1 23, .0590, 0.42, 1. 33, 0.42, 1.33, 0.42, 1.33, 0.42, 1 33, .0048, 0.22, 2. 44, 0.22, 2.44, 0.22, 2.44, 0.22, 2 44, .0012, 0.03, 2 55, 0.03, 2.55, 0.03, 2.55, 0.03, 2 55,
LAND-26 Landing Spectrum - Metro 226 gage 26 .2750, 1.00, 1 01, 1.00, 1.01, 1.00, 1.01, 1.00, 1 01, .4400, 0.00, 1 74, 0.00, 1.74, 0.00, 1.74, 0.00, 1 74, .2200, -1.00, 2 48, -1.00, 2.48, -1.00, 2.48, -1.00, 2 48, .0590, -2.00, 3 22, -2.00, 3.22, -2.00, 3.22, -2.00, 3 22, .0048, -3.00, 3 96, -3.00, 3.96, -3.00, 3.96, -3.00, 3 96, .0012, -4.00, 4 70, -4.00, 4.70, -4.00, 4.70, -4.00, 4 70,
\J i
LAND-25 Landing Spect rum - gage 25 .2750, 1.00, 1 01, 1.00, 1.01, 1.00, 1.01, 1.00, 1 01, .4400, 0.80, 1 10, 0.80, 1.10, 0.80, 1.10, 0.80, 1 10, .2200, 0.60, 1 20, 0.60, 1.20, 0.60, 1.20, 0.60, 1 20, .0590, 0.40, 1 30, 0.40, 1.30, 0.40, 1.30, 0.40, 1 30, .0048, 0.20, 1 40, 0.20, 1.40, 0.20, 1.40, 0.20, 1 40, .0012,
0/ LAND-2 3 Lai
0.00, 1 50, 0.00, 1.50, 0.00, 1.50, 0.00, 1 50,
iding Spec trum - Metro 226 Gage 23 .2750, 1.00, 1 01, 1.00, 1.01, 1.00, 1.00, 1.00, 1 00, .4400, 0.81, 1 06, 0.81, 1.06, 0.81, 1.06, 0.81, 1 06, .2200, 0.62, 1 12, 0.62, 1.12, 0.62, 1.12, 0.62, 1 12, .0590, 0.43, 1 18, 0.42, 1.18, 0.43, 1.18, 0.43, 1 .18, .0048, 0.23, 1 24, 0.23, 1.24, 0.23, 1.24, 0.23, 1 .24, .0012,
0/ LAND-G Esl
0.04, 1 30, 0.04, 1.30, 0.04, 1.30, 0.04, 1 .30,
limated peak G' s based on drop test .2750, -0.55, 0 .55, -0.55, 0.55, -0.55, 0.55, -0.55, 0 -55, .4400, -0.57, 0 .57, -0.57, 0.57, -0.57, 0.57, -0.57, 0 .57, .2200, -0.62, 0 .62, -0.62, 0.62, -0.62, 0.62, -0.62, 0 .62, .0590, -0.70, 0 .70, -0.70, 0.70, -0.70, 0.70, -0.70, 0 .70, .0048, -0.82, 0 .82, -0.82, 0.82, -0.82, 0.82, -0.82, 0 .82, .0012, -0.98, 0 .98, -0.98, 0.98, -0.98, 0.98, -0.98, 0 .98,
D-2

0/ LAND-22
.2750,
.4400,
.2200,
.0590,
.0048,
.0012, 0/ LAND-24
.2750,
.4400,
.2200,
.0590,
.0048,
.0012, 0/ LAND-28
.2750,
Landing Spectrum - Metro 226 gage 21 1.00, 0.75, 0.50, 0.26, 0.01, -0.24,
1.01, 1.23, 1.46, 1.69, 1.92, 2.14,
1.00, 0.75, 0.50, 0.26, 0.01, -0.24,
1.01, 1.23, 1.46, 1.69, 1.92, 2.14,
Landing Spectrum - Metro 226 gage 24 1.00, 0.79, 0.59, 0.38, 0.17, -0.04,
1.01, 1.07, 1.14, 1.21, 1.29, 1.36,
1.00, 0.79, 0.59, 0.38, 0.17, -0.04,
1.01, 1.07, 1.14, 1.21, 1.29, 1.36,
Landing Spectrum - 1.00, 1.01,
Metro 226 gage 28 1.00, 1.01,
1.00, 0.75, 0.50, 0.26, 0.01, -0.24,
1.00, 0.79, 0.59, 0.38, 0.17,
-0.04,
1.00,
1.01, 1.23, 1.46, 1.69, 1.92, 2.14,
1.01, 1.07, 1.14, 1.21, 1.29, 1.36,
1.01,
00, 75,
0.50, 0.26, 0.01, -0.24,
1.00, 0.79, 0.59, 0.38, 0.17, -0.04,
1.00,
1.01, 1.23, 1.46, 1.69, 1.92, 2.14,
1.01, 1.07, 1.14, 1.21, 1.29, 1.36,
1.01,
.4400,
.2200,
.0590,
.0048,
.0012, 0/ PRESS-7
-1.84, -4.69, -7.53, -10.37, -13.22,
4.64, 8.28,
11.92, 15.56, 19.20,
-1.84, -4.69, -7.53, -10.37, -13.22,
0/ GND
0/ PROP-14
624, 0/ PROP-15
624, 0/ THRUST
1, 0/
Pressure Cycle 7 psi 0.00, 1.00, 0.00,
Ground fuselage reading 0.00, 0.01, 0.00,
Gage 14 -0.3,
Gage 15 -2.2,
0.0,
1.00,
1.00,
1.00,
-0.3,
-2.2,
0.0,
4.64, 8.28,
11.92, 15.56, 19.20,
1.00,
0.01,
1.00,
1.00,
1.00,
-1.84, -4.69, -7.53, -10.37, -13.22,
0.00,
0.00,
-0.3,
-2.2,
0.0,
4.64, 8.28,
11.92, 15.56, 19.20,
1.00,
0.01,
1.00,
1.00,
1.00,
-1.84, -4.69, -7.53, -10.37, -13.22,
0.00,
0.00,
-0.3,
-2.2,
0.0,
4.64, 8.28,
11.92, 15.56, 19.20,
1.00,
0.00,
1.00,
1.00,
1.00,
D-3/D-4

APPENDIX E FORTRAN SOURCE CODE FOR MODIFIED CRACK CASES
SUBROUTINE SITC11 (SAFE, MODE, SMIN4, SMAX4, C,NSQUAN, IHDSQ, MSOP, K SR, DELTAK, CAYMAX, FO , F3 , FDUM1, FDUM2 , NJOB, K NETMSG,SFLOl,SYLD1,IACMSG,ISESS,*,*)
CDO CDO IDENTIFICATION CDO CDO SUBROUTINE SITCA3 (MODE, SMIN4, SMAX4 , CNSQUAN, IHDSQ,MSOP, CDO K SR, DELTAK, CAYMAX, FO , F3 , FDUM1, FDUM2 , NJOB, CDO K NETMSG, SFLOl, SYLD1, IACMSG, *) CDO CDO PROGRAMMER - CDO MODIFIED FOR BATCH - L.C. WILLIAMS 4/93 C97 MODIFIED -- ADDITIONAL MATERIAL CONSIDERATION. . CHEN 7/97 C98 MODIFIED — CORRECTED ERRORS IN 7/97 MOD.. J VANCE 9/98 CD1 CD1 PURPOSE CD1 CD1 CONTROL OF INPUT, OUTPUT, CALCULATION, AND PROOF-TEST CD1 FOR THROUGH CRACK FROM HOLE IN PLATE. CD2 CD2 CALLING ARGUMENT INPUT CD2 CD2 C - CRACK LENGTH, C CD2 MODE - 'IPUT','OPUT','CALC■, OR 'PRÜF' CD2 NETMSG - FLAG TO CHECK NET STRESS > YIELD STRESS (0=CHECK) CD2 NJOB - NO. OF TIMES THROUGH ROUTINE CD2 SMAX4 - (tl) STRESSES CORR. TO FO, F3, FDUM1, FDUM2 CD2 SMIN4 - (t2) STRESSES CORR. TO FO, F3, FDUM1, FDUM2 CD2 SYLD1 - YIELD STRESS CD3 CD3 CALLING ARGUMENT OUTPUT CD3 CD3 * - RETURN1 CD3 CAYMAX - SIF<MAX> CD3 DELTAK - SIF<MAX> - SIF<MIN> CD3 FO - NONDIMENSIONALIZED SIF FOR 1ST STRESS QUANTITY, SO CD3 F3 - NONDIMENSIONALIZED SIF FOR 2ND STRESS QUANTITY, S3 CD3 FDUM1 - NONDIMENSIONALIZED SIF FOR UNUSED STRESS QUANTITY CD3 FDUM2 - NONDIMENSIONALIZED SIF FOR UNUSED STRESS QUANTITY CD3 IHDSQ - (15,4) ARRAY OF 4 60-CHAR STRESS DESCRIPTIONS CD3 NETMSG - FLAG TELLING IF NET STRESS > YIELD STRESS (1=TRUE) CD3 NSQUAN - NO. OF STRESS QUANTITIES CD3 SR - 1 - DELTAK/CAYMAX CD5 CD5 INTERNAL VARIABLES CD5 CD5 ALPHA - D/(D+2C) CD5 AMBDA - (PI/2) * (D+C) / (2B - C) CD5 BOUND - B - (D/2) CD5 CONST - SQRT(PI*C) CD5 EPSI - CORRECTION FOR CRACK TIP PLASTIC ZONE CD5 PI - 3.14159... CD5 RNET1... 3 - MEAN NET SECTION STRESS CD5 OTHER VALUES DEFINED IN EQUATIONS CD9 CD9 SPECIAL COMMENTS CD9 CD9 SUBROUTINES CALLED: INTC03, OPTC03 C
IMPLICIT DOUBLE PRECISION (A-H,0-Z) CHARACTER*80 MSOP(6) CHARACTER*1 SAFE,AREF,WFCHEK CHARACTER*4 MODE,IHDSQ(15,4) DIMENSION SMIN4 (4) , SMAX4 (4)
E-l

COMMON /GEO/ T,D,W,B,SBB,XFIL(15) COMMON/NETOUT/SNETVT, SNETRT, SNETV(4) , SNETR(4) COMMON /IOUNTS/ UN, IOU, IBF
C ADDED 7/21/97 COMMON /TC11/ AREATC11, AITC11, CENTTC11 COMMON /JUDGE/ AIJC
DATA PI/3.14159265358979D0/ DATA EPSI/0.13D0/
C OPEN (UNIT=74, FILE= ' 1111SDEL.TXT ' , STATUS = 'UNKNOWN' ) C p*******************************************************************
c C Calc or 'Proof Test' Mode C
IF (MODE.EQ.'CALC.OR.MODE.EQ.'PRÜF') THEN C C Geometric checks C
BOUND = B - 0.5D0*D IF (C.LT.0D0.OR.C.GE.BOUND) THEN
IF (MODE. EQ. 'CALC ) WRITE (7,60001) C, BOUND IF (MODE.EQ. 'CALC ) WRITE (IOU, 60001) C,BOUND IF (MODE.EQ.'PRÜF') WRITE (7,60002) C,BOUND IF (MODE.EQ.'PRÜF') WRITE (IOU,60002) C,BOUND RETURN 1
ENDIF
C=X=X=X=X=X=X=X=X=X=X C AREA3 IS ADDITIONAL AREA NOT PART OF THE PLATE WITH THE OFF-CENTER HOLE
AREA3 = AREATC11
C=X=X=X=X=X=X=X=X=X=X C SDEL = RECIPROCAL OF REDUCTION FACTOR FOR REMOTE STRESS. SDEL C IS GREATER THAN 1 C
SDEL = (W/fW-C) )*( (W-C)*T + AREA3)/(W*T + AREA3)
C C Check if Net stress > Yield stress C
PF0 = DMAX1(DABS(SMAX4(1)/SDEL),DABS(SMIN4(1)/SDEL))*W*T PF3 = DMAX1(DABS(SMAX4(2)/SDEL) , DABS (SMIN4 (2)/SDEL) ) *D*T ALI = W - B - D/2D0 AL2 = B - C - D/2D0 AREA1 = AL1*T AREA2 = AL2*T AREA = AREA1 + AREA2 + AREA3
C=X=X=X=X=X=X=X=X=X=X C S0A & S3A ARE P/A STRESSES C
S0A = PF0/(AREA1 + AREA2) S3A = PF3/(AREA1 + AREA2) EX1 = AL1/2D0 EX2 = W - AL2/2D0
C=X=X=X=X=X=X=X=X=X=X C CENTTC11 IS CENTROID OF ADDITIONAL AREA WRT PART EDGE C EXC IS CENTROID OF W*T AND AREA3 C
EX3 = CENTTC11 EXB = (AREA1*EX1 + AREA2*EX2 + AREA3*EX3)/AREA EXC = (W*T*W/2D0 + AREA3*EX3)/(W*T + AREA3 )
E-2

QOFF = DABS(EXC - EXB) All = T*AL1**3/12D0 + AREA1*(EX1-EXB)**2 AI2 = T*AL2**3/12D0 + AREA2*(EX2-EXB)**2
C=X=X=X=X=X=X=X=X=X=X C AITC11 IS MOMENT OF INERTIA OF ADDITIONAL AREA ABOUT CENTROID C OF THE CROSS SECTION C
AI3 = AITC11 AI = All + AI2 + AI3
C=X=X=X=X=X=X=X=X=X=X C SOB, S3B IS MC/I FOR TWO PORTIONS OF CRACKED PLATE C
EXD = (AREA1*EX1 + AREA2*EX2 ) / (AREA1+AREA2 ) SOB = PF0*QOFF*( (1D0-EPSI)*W - EXB)/AI S3B = PF3*(W-B-EXD)*((1D0-EPSI)*W - EXB)/AI
C=X=X=X=X=X=X=X=X=X=X C TOTAL STRESS ON CRACKED PLATE MC/I + P/A
SNETVT = S0A+S0B+S3A+S3B SNETRT = SNETVT /SYLD1
C . . . CHECK FOR YIELD ONE TIME OR FLOW ALWAYS IF (NETMSG.EQ.O. AND. SNETVT. GE.SYLD1) THEN
NETMSG=1
WRITE ( * , *) ' THE SNETVT ' , SNETVT
END IF C
IF (SNETVT.GE.SFLOl) THEN NETMSG=5
ENDIF C C Compute SIFs C
ALPHA = D/(D+2D0*C) AMBDA = (PI/2D0)*(D+C)/(2D0*B-C) GO = 0.7071D0+ALPHA*(0.7548D0+ALPHA*(0.3415D0+
K ALPHA*(0.642D0+ALPHA*0.9196D0))) Gl = ALPHA*(0.078DO+ALPHA*(0.7588DO+ALPHA*((-0.4293D0)+
K ALPHA*(0.0644D0+ALPHA*0.651D0)))) GW = DSQRT (SBB/DCOS (AMBDA) ) FO = G0*GW F3 = (0.5D0*G0*D/W + Gl)*GW FDUM1 = 0.0D0 FDUM2 = 0.0D0 CONST = DSQRT(PI*C) IF (MODE.EQ.'CALC') THEN
C CAYMAX = CONST*DMAXl( (SMAX4 (1) *F0+DABS (SMAX4 (2) ) *F3) , C K + (SMIN4(1)*F0+DABS(SMIN4(2) )*F3) )
C=X=X=X=X=X=X=X=X=X=X C SDEL REDUCES SMAX AND SMIN TO ACCOUNT FOR LOAD TRANSFER C TO ADDITIONAL AREA
CAYMAX=CONST*DMAXl ( (SMAX4 (1) /SDEL*FO+DABS (SMAX4 (2) /SDEL) *F3) , K + (SMIN4(1)/SDEL »FO+DABS(SMIN4(2)/SDEL)*F3) )
C DELTAK=CONST*F0*DABS( SMAX4(1) - SMIN4(1) )
DELTAK=CONST*F0*DABS( SMAX4(1)/ SDEL - SMIN4(1)/ SDEL)
C CALCULATE DELTAK DUE TO PIN LOAD ALONE C DELTK2 = DABS( SMAX4(2)-SMIN4(2) ) *F3»CONST
DELTK2 = DABS( SMAX4(2)/ SDEL-SMIN4(2)/ SDEL )*F3*CONST
E-3

ADD THE DELTAK VALUES DELTAK = DELTAK+DELTK2
ELSE IF (MODE.EQ.'PRÜF') THEN CAYMAX = CONST*(SMAX4(l)*F0+DABS(SMAX4(2))*F3)
CAYMAX = ( CONST*(SMAX4(l)/SDEL*F0+DABS(SMAX4(2)/SDEL)*F3) ) ENDIF
IF (CAYMAX. NE.ODO) THEN SR = 1D0 - DELTAK/CAYMAX
C WRITE (74, *) • DELTAK/CAYMAX = ' , DELTAK/CAYMAX
ENDIF C C Input Mode C
ELSE IF (MODE(1:1).EQ.'I') THEN CALL INTC11(NJOB,NSQUAN,MODE,IHDSQ,ISESS,*100)
C C Output Mode
C ELSE IF (MODE.EQ.'OPUT') THEN
CALL OPTC1KMSOP) C C Extraordinary ending
C ELSE
WRITE (7,60009) MODE WRITE (IOU,60009) MODE RETURN 1
ENDIF
WRITE (*,*) ' RUNNING THROUGH CRACK .. TC 11'
RETURN C C - Return to previous prompt. 100 RETURN 2
c c 60001 FORMAT!/' ',10X,'FINAL RESULTS:'/
K 11X,'Crack outside geometric bounds:'/ K 11X, 'c = \G12.4,' B - (D/2) = ',G12.4)
60002 FORMAT)/' ',10X,'Crack outside bounds: c = ', K G12.4,' B - (D/2) = \G12.4)
60009 FORMAT(/' ',10X, K 'Program coding error in Sbrtn SITC03: MODE = ',A4) END
SUBROUTINE SITC12 (SAFE,MODE, SMIN4, SMAX4, CNSQUAN, IHDSQ,MSOP, K SR,DELTAK,CAYMAX,F0,Fl,F2,FDUM1,NJOB, K NETMSG, SFLOl, SYLD1, IACMSG, ISESS, *, *)
C97 C97 8/97 MODIFIED BY JUDGE CHEN ... ADDITIONAL AREA ADDED C97 THIS SUBROUTINE IS SIMILAR TO SITC02 C97 C98 10/98 MODIFIED BY J VANCE. . . REV EQUATION FOR AND USE C98 OF 'SDEL' CD0 CD0 IDENTIFICATION CD0 CD0 SUBROUTINE SITC02 (MODE, SMIN4 , SMAX4 , CNSQUAN, IHDSQ,MSOP, CD0 K SR,DELTAK,CAYMAX,F0,Fl,F2,FDUMl,NJOB, CD0 K NETMSG, SFLOl, SYLD1, IACMSG, *)
E-4

CDO CDO PROGRAMMER - S. PIOTROWSKI, LOCKHEED-EMSCO CDO MODIFIED FOR BATCH - L.C. WILLIAMS 4/93 CD1 CD1 PURPOSE CD1 CD1 CONTROL OF INPUT, OUTPUT, CALCULATION AND PROOF-TEST CD1 FOR SINGLE EDGE THROUGH CRACK. CD2 CD2 CALLING ARGUMENT INPUT CD2 CD2 C - CRACK LENGTH, C CD2 MODE - 'IPUT','OPUT','CALC', OR 'PRÜF' CD2 NETMSG - FLAG TO CHECK NET STRESS > YIELD STRESS (0=CHECK) CD2 NJOB - NO. OF TIMES THROUGH ROUTINE CD2 SMAX4 - (tl) STRESSES CORR. TO FO,Fl,F2,FDUM1 CD2 SMIN4 - (t2) STRESSES CORR. TO FO, Fl, F2, FDUM1 CD2 SYLD1 - YIELD STRESS CD3 CD3 CALLING ARGUMENT OUTPUT CD3 CD3 * - RETURN1 CD3 CAYMAX - SIF<MAX> CD3 DELTAK - SIF<MAX> - SIF<MIN> CD3 FO - NONDIMENSIONALIZED SIF FOR 1ST STRESS QUANTITY CD3 Fl - NONDIMENSIONALIZED SIF FOR 2ND STRESS QUANTITY CD3 F2 - NONDIMENSIONALIZED SIF FOR 3RD STRESS QUANTITY CD3 IHDSQ - (15,4) ARRAY OF 4 60-CHAR STRESS DESCRIPTIONS CD3 NETMSG - FLAG TELLING IF NET STRESS > YIELD STRESS (1=TRUE) CD3 NSQUAN - NO. OF STRESS QUANTITIES CD3 SR - 1 - DELTAK/CAYMAX CD5 CD5 INTERNAL VARIABLES CD5 CD5 BETA - (PI*C)/(WD*2) CD5 CONST - SQRT(PI*C) CDS EPSI - CORRECTION FOR CRACK TIP PLASTIC ZONE CD5 FSINB - 1 - SIN (BETA) CD5 PI - 3.14159.. . CD5 RNET - MEAN NET SECTION STRESS CD5 Y - SEC(BETA)*SQRT( TAN (BETA)/BETA ) CD9 CD9 SPECIAL COMMENTS CD9 CD9 SUBROUTINES CALLED: INTC02, OPTC02 C
IMPLICIT DOUBLE PRECISION (A-H,0-Z) CHARACTER*80 MSOP(6) CHARACTER* 1 SAFE, AREF, WFCHEK CHARACTER*4 MODE,IHDSQ(15,4) DIMENSION SMIN4(4),SMAX4(4) COMMON /GEO/ TH,WD,XFIL(18) COMMON/NETOUT/SNETVT, SNETRT, SNETV (4) , SNETR (4) COMMON /IOUNTS/ UN, IOU, IBF COMMON /TC12JC/ AREA3 , F3 , G3 ,RIX,RIY,RM, IBARCNT COMMON /JUDGE/ AIJC DATA PI/3.14159265358979D0/
DATA EPSI/O.13D0/
C p*******************************************************************
C C CALC OR 'PROOF TEST' MODE C
IF(MODE.EQ.'CALC.OR.MODE.EQ.'PRÜF') THEN C C GEOMETRY CHECK C
IF (C.LT.ODO.OR.C.GE.WD) THEN IF (MODE.EQ.'CALC') WRITE (IOU,20000) C,WD
E-5

c c c c c c c
IF (MODE.EQ.'CALC") WRITE(7,20000) C,WD IF (MODE.EQ. IF (MODE.EQ. RETURN 1
ENDIF
'PRÜF') WRITE (IOU,20001) C,WD 'PRÜF') WRITE(7,20001) C,WD
CHECK NET STRESS > YIELD STRESS
SDEL IS RECIPROCAL OF STRESS REDUCTION FACTOR FOR LOAD TRANSFER TO ADDITIONAL AREA (AREA3)
SDEL = (WD/(WD-C)) SDEL = 1.
^((WD-C)*TH + AREA3)/(WD*TH + AREA3)
C97 C97 C97 C97 C97 C97 C97 C97 C97 C97 C97 C97 C97 C97 C97
K K
EPS2 = 1D0 - 2D0*EPSI TERM = WD / (WD - C)
TERM2 = TERM * TERM
RNET = DMAXK DABS (SMAX4 (1) ) , DABS (SMIN4 (1) ) ) * (TERM + EPS2*3D0*C*TERM2/WD)+
DMAXK DABS(SMAX4(2) ) , DABS (SMIN4 (2) ) ) *TERM RNET = RNET + DMAX1(DABS(SMAX4(3)),DABS(SMIN4(3)))*EPS2*
TERM2
RNET = DMAXK DABS (SMAX4 (1)/SDEL) , DABS (SMIN4 (1) /SDEL) ) * (TERM + EPS2*3D0*C*TERM2/WD)+
DMAXKDABS(SMAX4(2) /SDEL) , DABS (SMIN4 (2 ) /SDEL) ) *TERM RNET = RNET + DMAX1 (DABS (SMAX4 (3 )/SDEL) ,
DABS(SMIN4(3)/SDEL))*EPS2*TERM2
C WRITE (*, 998) 'AREA3', ' F3 ' , 'G3\ 'RIX' , 'RIY' , ' C WRITE(7,998)'AREA3','F3','GS','RIX','RIY', C WRITE (* , 99 9) AREA3 , F3 , G3 , RIX, RIY, RM, IBARCNT C WRITE (7, 999) AREA3 , F3 , G3 , RIX, RIY, RM, IBARCNT
RM' 'RM'
'IBARCNT" ■IBARCNT'
SUMA = AREA3 + SUMAX = AREA3 SUMAXSQ = AREA3
SUMAY = AREA3 * SUMAYSQ = AREA3 *
TH * (WD-C) * G3 + TH/2*(WD-C)**2 * G3**2 + TH/4*(WD-C)**3 F3 + TH**2/2*(WD-C) F3**2 + TH**3/4*(WD-C)
SUMIOX = RIX + (WD-C) SUMIOY = RIY + TH/12
' TH**3/12 (WD-C>**3
YBAR RIXCG
= SUMAY/SUMA = SUMIOX + SUMAYSQ YBAR* SUMAY
XBAR RIYCG
= SUMAX /SUMA = SUMIOY + SUMAXSQ XBAR* SUMAX
IBACNT WAS SET IN INTC12.FOR WAS ESTABLISHED FOR REFERENCE COUNT
IF (IBARCNT .LE. 1) XBAR1 = XBAR YBAR1 = YBAR
ENDIF IBARCNT=IBARCNT+1
THEN
EY EX
YBAR XBAR
YBAR1 XBAR1
C Before the crack gets much beyond the initial length that was set, c Take the first ybar calculated and then set it into another location c called ybarl and keep it there for later use
E-6

c Now find the bending stress about the entire section center of gravity c about the strong axis but in the end of the crack. Set the first xbar c into xbarl, the same was as the ybar, to save it for use now. c (Jack Simmons)
C Note that given the initial S2 value which is on the full uncracked face c in order to find what that moment does to the net section, the moment c from S@ is needed, then apply that moment to the net section thus c M2 = S2 * T *W**2/6
ccc sample format DMAX1( DABS(SMAX4(1)/SDEL) , DABS(SMIN4(1)/SDEL) ) SI = RM * (YBAR - TH/2) / RIXCG S2M0D=S1+
k DMAXK DABS (SMAX4 11)/SDEL) , DABS (SMIN4 (1)/SDEL) )* k TH*WD*EY*YBAR/RIXCG
S2PRIME=((YBAR-T)/YBAR) * S2M0D S2AVE = (S2PRIME + S2MOD) 12. SOPRIME = DMAXK DABS (SMAX4 (1) /SDEL) , DABS (SMIN4 (1)/SDEL) ) +S2AVE SBX = S2M0D -S2SAVE
S2P = ( (DMAXK DABS(SMAX4(3)/SDEL) , DABS (SMIN4 (3)/SDEL) )* k TH*WD**2)/6 + k DMAXK DABS (SMAX4(1)/SDEL) , DABS (SMIN4 (1)/SDEL) ) *TH*WD*EX) k *((WD-C)-XBAR)/RIYCG
SNETVT=S0PRIME+SBX+S2P
C WRITE(7,*)' th',' wd',' C C WRITE(7,999)Th,Wd,C C WRITE(7,*)' XBAR1',' YBAR1' C WRITE(7,999)XBAR1,YBAR1 C WRITE(7,*)' SOPRIME',• SBX',' S2P' C WRITE(7,997»SOPRIME,SBX,S2P C WRITE(7,*) 'SNETVT = ' , SNETVT
SNETRT=SNETVT / S YLD1 C WRITE(7,*)"SNETVT = ',SNETVT C WRITE(7,*)' SYLD1 = ',SYLD1
C97 SNETVT = RNET C97 SNETRT = SNETVT/SYLD1
C . . . CHECK FOR YIELD ONE TIME OR FLOW ALWAYS IF (NETMSG.EQ.O. AND. SNETVT. GE.SYLD1) THEN
NETMSG=1 END IF
C IF (SNETVT.GE.SFLOl) THEN
NETMSG=5 ENDIF
C C CALCULATION OF STRESS INTENSITY FACTORS C
BETA = 0.5D0*PI*C/WD IF (BETA.LT.1D-12) THEN
Y = 1D0 ELSE
Y = DSQRT(DTAN(BETA)/BETA) / DCOS (BETA) ENDIF
FSINB = 1.D0 - DSIN(BETA) FO = Y * (0.752 + 2.02*(C/WD) + 0.37*FSINB**3) Fl = FO/2. F2 = Y * (0.923 + 0.199*FSINB**4) FDUM1 = 0.0D0 CONST = DSQRT(PI*C) IF (MODE.EQ. 'CALC ) THEN
CAYMAX = CONST*DMAXK (F0*SMAX4(1)/SDEL K +F1*DABS(SMAX4(2))/SDEL +F2*SMAX4(3)/SDEL), K (F0*SMIN4(1)/SDEL + F1*DABS(SMIN4(2)/SDEL)
E-7

K +F2*SMIN4(3)/SDED) DELTAK = CONST* ( DABS ( (F0*SMAX4 (1)/SDEL + F2*SMAX4 (3) /SDEL) -
K (F0*SMIN4(1)/SDEL + F2*SMIN4(3)/SDEL)) K + F1*DABS( SMAX4(2)/SDEL - SMIN4 (2) /SDEL ) )
C WRITE(7,996)'SMAX,SMIN, CONST, FO, DELTAK', SMAX4 (1), SMIN4 (1), CONST, C K FO, DELTAK
ELSE IF (MODE. EQ. ' PRÜF ' ) THEN CAYMAX = CONST* ( F0*SMAX4 (1)/SDEL+F1*DABS (SMAX4 (2)/SDEL)
K +F2*SMAX4(3)/SDEL )
END IF
C print values for checking C WRITE (IOU,*) 'SMAX4 ' , SMAX4 C WRITE (IOU,*) 'SMIN4 ' , SMIN4 C IF (MODE.EQ.'CALC") THEN C IF (DELTAK.LT.ODO) THEN C CAYMAX = CAYMAX - DELTAK C DELTAK = - DELTAK C ENDIF C ENDIF
IF (CAYMAX.NE.ODO) SR = 1D0 - DELTAK/CAYMAX C C INPUT MODE C
ELSE IF (MODE(l:l).EQ.'I') THEN CALL INTC12 (NJOB,NSQUAN,MODE, IHDSQ, ISESS, *100)
C C OUTPUT MODE C
ELSE IF (MODE.EQ.'OPUT') THEN CALL OPTC12(MSOP)
WRITE (* , *) ' MADE IT BACK FROM CALL OPTC12 ' C C ERROR MESSAGES C
ELSE WRITE (IOU,21000) MODE WRITE(7,21000) MODE RETURN 1
ENDIF
RETURN C C - Return to previous prompt. 100 RETURN 2
C C 20000 FORMAT(/' ',10X,'FINAL RESULTS:'/
K 11X,'Crack outside geometric bounds:'/ K 11X, 'c = \G12.4,' W= ',G12.4)
20001 FORMAT!/' ',10X,'Crack outside geometric bounds: c = ', K G12.4, ' W = \G12.4)
21000 FORMAT(/' ',10X, K 'Program coding error in Sbrtn SITC02: MODE = ',A4)
996 FORMAT(A30,5(F8.4,1X)) 999 FORMAT(lx,6(lx,f9.4) ,19) 997 FORMAT(lx,6(lx,e9.4) ,19) 998 FORMAT(7(A10))
END
E-8

APPENDIX F
Testing and Analysis for DTA of
FairchHd SA226 Main Wing Spar Lower Cap at WS99
FINAL REPORT SwRI Project No. 06-8520
prepared by
Joseph W. Cardinal Fräser J. McMaster Peter C. McKeighan
prepared for
Fairchild Aircraft, Inc. San Antonio, Texas
January 1999
APPROVED:
\
''^r^-CX. >» N JXA.>jr^cvX>Jas C --»«o,
Hal Burnside, Ph.D., P.E., Director Structural Engineering Department

APPENDIX F TESTING AND ANALYSIS FOR DTA OF FAIRCHILD SA226 MAIN WING SPAR LOWER CAP AT WS99
Final Report
SwRI Project No. 06-8520
F-i

ACKNOWLEDGEMENTS
The authors of this report would like to thank Fairchild Aircraft, Inc., for funding this program and for manufacturing the coupons used in the spectrum testing. A special note of appreciation is also due to Dr. Walt Dwyer of Fairchild for his assistance in the design of the coupons and for providing other essential data.
A number of other Southwest Research Institute staff members also contributed to this effort. These individuals include Jon Cutshall, finite element analyses of the complex coupon; Dick Page, fracture surface analyses; Tom Masden, Dale Haines and Darryl Wagar, coupon testing; Isaac Rodriguez, photography; and Terry Sloan, document preparation.
F-ii

Table of Contents
Page
ACKNOWLEDGEMENTS F-ii
List of Figures F-v
List of Tables F-vi
EXECUTIVE SUMMARY F-vii
F1.0 INTRODUCTION Fl-1
F2.0 MAIN WING SPAR LOWER CAP GEOMETRY AT WS 99 (FCL Wl) F2-1
F3.0 MATERIAL PROPERTIES TESTING F3-1 F3.1 MECHANICAL CHARACTERIZATION TESTING F3-1
F3.1.1 Specimen Geometries F3-1 F3.2 TENSILE TEST RESULTS F3-2 F3.3 FRACTURE TOUGHNESS TEST RESULTS F3-2 F3.4 FATIGUE CRACK GROWTH RATE TESTING AND RESULTS F3-2
F3.4.1 Crack Length Measurement and Crack Growth Test Control Methodology F3-2
F3.4.2 Modeling of Fatigue Crack Growth Rate Data F3-3
F4.0 DEVELOPMENT OF SPECTRUM FOR FCL Wl COUPON TESTS F4-1
F5.0 COUPON SPECTRUM TESTING F5-1 F5.1 GENERAL TEST PROCEDURES F5-2
F5.1.1 Spectrum Test Methods and Control F5-2 F5.1.2 Spectrum Markerband Procedure F5-2
F5.2 SIMPLE COUPON GEOMETRY F5-3 F5.2.1 Coupon Design F5-3 F5.2.2 Test Setup and Coupon Pre-cracking F5-3 F5.2.3 Results F5-3
F5.3 COMPLEX COUPON GEOMETRY F5-5 F5.3.1 Coupon Design F5-5 F5.3.2 Test Setup and Coupon Pre-cracking F5-5 F5.3.3 Strain Survey F5-5 F5.3.4 Results F5-6
F-iii

Table of Contents (Continued)
Page
F6.0 ANALYSIS OF COUPON TESTS F6-1 F6.1 CRACK GROWTH RELATIONSHIP F6-1 F6.2 SIMPLE COUPON ANALYSIS RESULTS F6-1 F6.3 COMPLEX COUPON ANALYSIS RESULTS F6-2
F7.0 RECOMMENDATIONS FOR DTA F7-1
F8.0 REFERENCES F8-1
F-iv

List of Figures
Figure Page
F2.1 FCLW1—Main Wing Spar Lower Cap at Wing Station 99.0 F2-1 F2.2 Cross Section of Main Wing Spar Lower Cap at Wing Station 99.0 Showing
Location of Presumed Crack for DTA F2-2
F3.1 Typical Fatigue and Fracture Test Station in the SwRI Solid and Fracture Mechanics Laboratory F3-6
F3.2 Tensile Specimen Geometry Utilized for Assessing the Tensile Strength of the Aluminum Extrusion (Extracted from ASTM Standard E8) F3-6
F3.3 Design for the 1-T Plan Geometry Compact Tension Fracture and Fatigue Crack Growth Specimens F3-7
F3.4 Design for the Middle Crack Tension Specimen for Fatigue Crack Growth Studies F3-8
F3.5 Design for the 1-T Plan Geometry Eccentrically Loaded Single-Edge Crack Tension Specimen for Fatigue Crack Growth Studies F3-9
F3.6 Typical KRAK Gage Setup with Gage Bonded to Face of C(T) Specimen F3-10 F3.7 Schematic of Connections Required on a KRAK Gage on a C(T) Specimen F3-10 F3.8 FCG Data for the 2014-T6511 Extrusion Compared with the NASGRO Output
(Using NASGRO Material Constants) F3-11 F3.9 FCG Data for the 2014-T6511 Extrusion Compared with the NASGRO Output
(Using Modified NASGRO Material Constants) F3-12 F3.10 Ratio of Experimental to Predicted Lives of FCG Test Specimens Using the
NASGRO Model Parameters F3-13
F5.1 Design for the Simple Geometry Coupon for Spectrum Crack Growth Studies F5-8 F5.2 Representative Test Setup for the Simple Geometry Coupon F5-9 F5.3 Summary of All SCG Tests Performed on the Simple Coupon Geometry F5-10 F5.4 Summary of Spectrum Crack Growth Testing for the Simple Geometry
Coupon F5-11 F5.5 Micrographs of the Simple Geometry Coupons Highlighting the Different Grain
Structures (a) Test SS-2 and (b) Test SS-3 F5-12 F5.6 Design for the Complex Geometry Coupon for Spectrum Crack Growth
Studies F5-13 F5.7 KRAK Gage Details for the Complex Geometry Coupons F5-14 F5.8 Representative Test Setup for the Complex Geometry Coupon F5-15 F5.9 Comparison of Initial Strain Gage Readings, Normalized with Respect to
Strain Gage 8 F5-16 F5.10 Percent Load Transfer and Secondary Bending for All Three Complex
Geometry Tests F5-17 F5.11 Summary of All SCG Tests Performed on the Complex Coupon Geometry F5-18
F-v

Figure
F5.12
F6.1 F6.2
F6.3
List of Figures (Continued)
Page
Summary of Spectrum Crack Growth Testing for the Simple Geometry Coupon F5-19
NASGRO Model TC03 for a Through-Crack From an Offset Hole in a Plate F6-2 Comparison of Analysis Results with Coupon Test Results for the Simple FCL Wl Coupon Geometry F6-3 Comparison of Analysis Results with Coupon Test Results for the Complex FCL Wl Coupon Geometry F6-4
List of Tables
Table
F3.1
F3.2 F3.3 F3.4
F5.1 F5.2
Page
Material Characterization Tests Performed on Aluminum Alloy 2014-T6511 Extrusion • F3-4 Monotonie Tensile Test Data Obtained for the 2014-T6511 Material F3-4 Fracture Toughness Data Obtained for the 2014-T6511 Material F3-5 Comparison Between the Experimental and NASGRO Predicted Crack Growth for all FCG Tests F3-5
Spectrum Crack Growth Tests and Specimen IDs F5-7 Pre-Cracking Details for the Complex Geometry Tests F5-7
F-vi

EXECUTIVE SUMMARY
Southwest Research Institute (SwRJ) performed testing and analyses to support a damage tolerance analysis (DTA) effort undertaken by Fairchild Aircraft to extend the useful life of the SA226/SA227 series of aircraft. Fairchild identified the most fatigue critical principal structural element (PSE) on this aircraft as the main wing spar lower cap at wing station 99.0. The lower spar at wing station 99.0 consists of a three-element spar cap comprised of the lower cap, the spar angles and the titanium straps. The lower cap and the spar angles are manufactured from 2014-T6511 aluminum extrusions. The fatigue critical location (FCL) is located in the horizontal legs of the spar angle at the last outboard fastener hole just prior to where the titanium straps end.
Material characterization tests were performed to obtain the basic properties of the 2014- T6511 aluminum extrusion. These included tensile, fracture toughness and fatigue crack growth rate tests. Coupon spectrum tests were performed to generate empirical data to determine whether or not crack growth at this FCL was influenced by load interaction effects (retardation) and to assess the validity of the NASGRO crack growth analysis model used for the DTA of this location. Two specimen geometries were investigated. A simple coupon design using an offset (open) hole in a plate was tested first. This was followed by a more complex coupon geometry designed to represent the load transfer and built-up nature of the actual joint. Load spectra for the coupon tests were derived from the stress spectra developed by Fairchild for this location.
Crack growth analyses were performed using NASGRO for each coupon geometry and demonstrated that very good predictions of the measured data were possible without the use of a retardation model. These results provide confidence in using the NASGRO software and these material properties in the DTA of the 2014-T6511 wing spar components on the SA226/SA227 aircraft. Recommendations were also provided for the final DTA of this location, including the assumption of an initial corner crack in the analysis and the use of a continuing damage analysis to determine the amount of additional life which exists in the part beyond failure of the short ligament.
F-vii/F-viii

F1.0 INTRODUCTION
This report summarizes the results of testing and analyses performed by Southwest Research Institute (SwRI) in support of a damage tolerance analysis (DTA) effort undertaken by Fairchild Aircraft to extend the useful life of the SA226/SA227 series of aircraft and to assure the continued airworthiness of these airframes. This class of aircraft have been in production since 1970 and were not designed using damage tolerance techniques. In September 1995, Fairchild Aircraft was funded by the Federal Aviation Administration (FAA) to develop a Supplemental Inspection Document (SID) for the SA226/SA227 aircraft using a damage tolerance approach (FAA Contract No. DTFA03-95-C-00044). The testing and analysis described herein were performed to develop key information for use in the DTA of the most fatigue critical principal structure element (PSE) on the aircraft.
Fairchild identified the most fatigue critical PSE on the aircraft as the main wing spar lower cap at wing station 99.0. This fatigue critical location (FCL) was designed by Fairchild as FCL Wl in their interim SID development report [Fl]. A selection and prioritization of FCLs for analysis was performed by Fairchild using a formal ranking procedure developed for use in USAF Structural Integrity Programs [F2]. The results of this ranking process are summarized in Reference [Fl].
The geometry and materials of FCL Wl are described in Section F2.0 of this report. Since FCL Wl was the most critical location, SwRI was tasked by Fairchild to generate material property data that would support the DTA of this location. These data consisted of tensile and fracture properties as well as fatigue crack growth rate data and were obtained from specimens excised from representative spar material samples provided to SwRI by Fairchild. A description of these tests and their results are presented in Section F3.0.
In order to validate the predictability of the crack growth models used to represent FCL Wl in the DTA, SwRI performed two sets of coupon spectrum tests on hardware representative of the main spar lower cap at wing station 99.0. Prior to beginning these tests, the spectrum developed by Fairchild for use in the DTA had to be converted to a form suitable for use in the laboratory test machines. Section F4.0 summarizes this process. Details of the two coupon designs (simple and complex) and the spectrum test procedure are presented in Section F5.0 along with results from the tests. Raw data from all the testing performed in this program are contained in the appendices along with additional analyses used to interpret the crack growth measurements.
The results of the coupon tests are compared to analytical predictions made using the NASGRO crack growth analysis software [F3] in Section F6.0 of the report. Finally, a number of recommendations for DTA based on the findings of this program are provided in Section F7.0.
Fl-l/Fl-2

F2.0 MAIN WING SPAR LOWER CAP GEOMETRY AT WS 99 (FCL Wl)
A schematic of the geometry of SA226/SA227 main wing spar lower cap at wing station 99.0 (FCL Wl) is provided in Figure F2.1. This is a three-element spar cap comprised of the lower cap, the spar angles and the titanium straps and is the primary load carrying member in the wing at this wing station. The lower cap and the spar angles are manufactured from 2014-T6511 aluminum extrusions. The FCL is located in the spar angle at the last outboard fastener hole just prior to where the titanium straps end. This is the highest stressed location in the main wing spar.
Figure F2.2 shows a dimensioned cross section of the lower spar cap at wing station 99.0 indicating the location of the presumed crack for the damage tolerance analysis. A through-thickness crack at the fastener hole is presumed to exist for the DTA. In addition to the high stress levels at this location, this area would be very difficult to inspect as well; hence, FCL Wl was chosen as the FCL on which to perform the coupon spectrum testing in support of the DTA.
Titanium Strap
Titanium Strap
Main Spar Lower Cap
Main Spar Extruded Angle
Figure F2.1 FCL Wl—Main Wing Spar Lower Cap at Wing Station 99.0
F2-1

o 03 «! O H o Q
H-l b
M «2 o iA cd /*~N u
„H "3" es U Ä oo u
O T—1 1
*- ■*— in
1—1
na
S 1—i ^—1 C/5 ö s
CO <D 0) hl
ö & CM o s p
'S es u
j ! il ■-
^ A Ji o
V tae e
■ P*
£ o
J3 t/J © S?\ o\ s o
■ PN
\ ' cd
) SD &
• PH
1 ■
CN *J
\
es 1 l es u
>-.
1 ' o
I J
i M es a
tZJ tut s
•tm
& /c £ \ ' e
"ES ^^ >
-t- £ £ OH •M
Ä v oo
o e o
U-i T— H u ü es c > 4>
1—1 c •r-1 t/3
ö
,f£ ^ *. —i
s es
C _o 'S3 a
e Q
O
U r*
M s T
iß o
»PH
Z
F2-2

F3.0 MATERIAL PROPERTIES TESTING
This section describes the material characterization tests performed to obtain basic properties of the 2014-T6511 aluminum extrusion for use in the damage tolerance analysis of the main wing spar lower cap.
F3.1 MECHANICAL CHARACTERIZATION TESTING
Mechanical characterization testing consisted of tensile, fracture toughness, and fatigue crack growth evaluations of the 2014-T6511 aluminum extrusion. The scope of the evaluations is summarized in Table F3.1. Fracture and fatigue testing was performed in the Solid and Fracture Mechanics laboratory at SwRI using a workstation similar to that shown in Figure F3.1. Tensile testing was subcontracted to the Charles C. Kawin Co. (Broadview, Illinois).
Fatigue crack growth testing was performed at different load ratios (denoted as R-ratio and defined as the ratio of minimum to maximum load applied during the fatigue cycle) to determine the influence of mean load level. The nominal R-ratios considered were -0.2, 0.2, 0.5 and 0.8.
F3.1.1 Specimen Geometries
The basic geometries and methods generally conformed to the relevant ASTM test specification [F4]:
• tensile testing: ASTM E8-96a (Standard Test Methods for Tension Testing of Metallic Materials).
• fracture testing: AgTM E399.90 (Standard Test Methods for Plane Strain Fracture Toughness of Metallic Materials).
• FCG rate testing: ASTM E647-95a (Standard Test Methods for Measurement of Fatigue Crack Growth Rates).
Tensile testing specimen blanks were machined into standard specimens with gage lengths of 0.500 inch, as illustrated in Figure F3.2. The tensile properties were determined in the longitudinal orientation for two different types of aluminum extrusion 2014-T6511, that is, a wide plate (specimen ID prefix TE) and angle extrusion (specimen ID prefix TA).
Fracture testing was performed on a sub-thickness (0.125 inch) 1-T plan geometry, compact- tension specimen as illustrated in Figure F3.3. All fracture toughness evaluations were performed on specimens in the L-T orientation and in the thickest geometry possible with the supplied material. This nomenclature implies that the applied loading axis is in the longitudinal direction and the direction of crack advance is in the transverse direction. This orientation is consistent with the crack plane used for the FCL coupons.
Fatigue crack growth rate testing was performed on middle crack tension, M(T), specimens, compact tension, C(T), specimens as well as eccentrically loaded single edge crack tension, ESE(T), specimens with a 1-1/2 T plan geometry. Schematics of the M(T) and ESE(T) specimen geometries are shown in Figure F3.4 and F3.5, respectively. A listing of the test conditions employed is
F3-1

provided in Table F3.1. The ESE(T) specimen was selected for positive R-ratio fatigue crack growth testing because of non-coplanar crack growth observed in the C(T) specimens during FCG testing. It is not uncommon for 2xxx alloys to exhibit deflected crack growth due to the interaction of texture effects and stress state in the specimen. The ESE(T) specimen design results in a significant decrease in the T-stress (stress parallel to the crack surface) which will tend to increase self-similar cracking and reduce crack deflection [F5].
F3.2 TENSILE TEST RESULTS
A summary of the tensile data obtained for the 2014-T6511 aluminum extrusion is shown in Table F3.2. The tensile test result summary is extracted from the actual data tabulated in Appendix Gl - Material Characterization Properties. Additional details regarding the specifics of all the tensile tests are included in this appendix. All tensile data exceeded the minimums provided for this material as presented in MIL Handbook 5G [F6].
F3.3 FRACTURE TOUGHNESS TEST RESULTS
A summary of the fracture toughness data obtained for the 2014-T6511 aluminum extrusion is shown in Table F3.3. Additional details regarding the specifics of all the fracture tests are included in Appendix Gl.
It is important to describe the terminology used to discuss the fracture toughness results. When a fracture test is described as obtaining an invalid plane-strain fracture toughness value (denoted Kq), it does not imply that the test failed or was performed incorrectly. Rather, it implies that during fracture the specimen was not under true plane-strain conditions. The fracture toughness value is then termed Kq as opposed to Kic, see Table F3.3.
The most notable observation from Table F3.3 is the invalid plane-strain fracture toughness results for this material. The invalidity occurred due to non-plane-strain conditions as evidenced by insufficient thickness and nonlinearity in the load displacement trace. Nevertheless, the toughness levels observed can be considered relevant since the specimen thickness matched the extrusion thickness. Since the actual FCL location thickness used for this material is the same as the fracture test thickness, the toughness values listed in Table F3.3 are more representative of the actual fracture toughness in the less constrained, more plane-stress FCL specimen.
F3.4 FATIGUE CRACK GROWTH RATE TESTING AND RESULTS
F3.4.1 Crack Length Measurement and Crack Growth Test Control Methodology
A special load control method, termed K-control by ASTM, was employed during fatigue crack growth testing to insure that a complete crack growth curve was generated from a single specimen. With this method, the quantity (l/K)(dK/da) is kept constant by changing loads as the test progresses [F7]. This effectively results in a greater AK range and minimizes the number of specimens required to construct the crack growth curve from near-threshold to stage III failure. The obvious benefit of K-control methods is that test time is minimized and the number of required specimens is typically reduced. The K-rate (or, more appropriately, the quantity (l/K)(dK/da)) during these crack growth tests was typically between 3.5 and -3.5 in"1.
F3-2

Both visual (optical traveling microscope) and nonvisual (KRAK gages) crack length measurements were utilized during this crack growth rate characterization testing. The nonvisual crack length measurement technique used was the indirect potential drop method. The potential drop (PD) technique has been used quite successfully for many years to remotely measure crack length [F8]. The PD method utilized in this work is called indirect since the potential output from a KRAK gage bonded to the face of the specimen (illustrated in Figure F3.6) is used to determine crack length. A schematic of the electrical connections to the foil KRAK gage is shown in Figure F3.7.
In practice it is important to calibrate the indirect crack length measurements with the physically measured (e.g., visually measured) crack lengths to achieve the highest level of accuracy. This post-test correction uses a linear scheme based on a minimum of two crack length measurements: at the start and near the end of the test [F9]. Although more complicated, multiple degree-of-freedom correction techniques are available, the corrected crack length measurements typically do not usually differ significantly from the simple linear method [F8].
Fatigue crack growth rate curves for each of the four R-ratios tested in this program are provided in Appendix Gl. Additional details regarding the specifics of all the fatigue tests are included in this appendix. For all tests, the repeatability of the replicate testing was quite reasonable. All fatigue testing was performed in laboratory-air conditions.
F3.4.2 Modeling of Fatigue Crack Growth Rate Data
Fatigue crack growth data obtained in this program are compared in Figure F3.8 with the fatigue crack growth curves obtained using the NASGRO crack growth equation and parameters obtained from the NASGRO material database [F3]. As shown in Figure F3.8, the NASGRO curves do not match the test data obtained in the current work. Note, however, that the NASGRO material constants were obtained from testing performed on 2014-T6 plate and sheet and not 2014-T6511 extrusion.
Preliminary crack growth analyses for FCL Wl were performed by Fairchild using the 2014- T6 plate and sheet parameters in the NASGRO material database. Clearly, use of these parameters will overestimate the crack growth rate in spectrum crack growth predictions. Therefore, an iterative process was performed with the parameters so as to produce a best fit to the 2014-T6511 extrusion experimental data obtained in this program. The results of this process are shown in Figure F3.9 along with the revised NASGRO parameters.
Given the original and modified values for the NASGRO parameters, it is worthwhile to compare the experimental crack growth data to predictions made using the NASGRO model. A life ratio can then be determined for each test as defined by the ratio between experimental and predicted crack growth results NeXpt/Npred. Based upon past experience, a life ratio between 0.5 and 2.0 implies an excellent prediction of the total life results.
The life ratios for the four different load ratios are shown on Figure F3.10 and Table F3.4. Results obtained using the original NASGRO parameters did not match the recorded data particularly well for any of the load ratios considered. The modified NASGRO constants proved relatively effective in predicting the experimental data.
F3-3

Table F3.1 Material Characterization Tests Performed on
Aluminum Alloy 2014-T6511 Extrusion
Property Test Specimen ID Specimen Type
Orientation Load Ratios (R-ratios) Examined
-0.2 0.2 0.5 0.8
Tensile TE-1 to TE-4
TA-1 to TA-3
rectangular
rectangular
L
L
Fracture Toughness
FC-1 toFC-4 C(T) L-T
Fatigue Crack CM-1 to CM-3 M(T) L-T S
Growth CC-1 C(T) L-T •/
CE-3 to CE-4 ESE(T) L-T V
CE-1 to CE-2 ESE(T) L-T V
CE-5 to CE-6 ESE(T) L-T y CC-2 C(T) L-T s
Table F3.2 Monotonie Tensile Test Data Obtained for the 2014-T6511 Material
Material Orientation Spec. ID CTYS, ksi CTTS, ksi £, % RA, % E, 103 ksi
2014-T6511
extrusion
Longitudinal TE-1
TE-2
TE-3
TE-4
60.7
62.2
61.2
55.8
66.4
66.8
65.9
66.3
10.0
10.5
11.0
11.5
24.2
27.0
23.1
29.2
10.45
10.75
10.73
10.93
TA-1
TA-2
TA-3
61.7
61.3
62.1
65.6
65.4
64.9
10.0
10.5
11.0
20.6
25.5
33.4
11.74
11.25
11.03
average -» 60.7 65.9 10.6 26.1 10.98
MIL HNDBK 5G min. -> 55.0 65.0 8.0 10.50
NASGRO (2014-T6) -> 65.0 74.0
F3-4

Table F3.3 Fracture Toughness Data Obtained for the 2014-T6511 Material
Material Form Thickness (in)
Orientation Specimen ID
Kq
(ksWin)
Valid?
2014-T6511 extrusion 0.121
0.123
0.121
0.121
L-T
L-T
L-T
L-T
FCl
FC2
FC3
FC4
35.3
39.7
43.7
40.5
no1
no1
no1
no1
average —» 39.8
MIL HNDBK 5G min. (2014-T651 plate) -> 19.0 (valid Klc)
NASGRO (2014-T6) -> 27.0 (Klc)
invalid due to insufficient thickness, and Pmax/PQ > 1.10
Table F3.4 Comparison Between the Experimental and NASGRO Predicted Crack Growth for All FCG Tests
NASGRO Parameters R- ratio
Life Ratio Range
(Nexpt/Npred)
Comments
C n P q AKo Kc Smax'^O a
3.5E-8 2.8 0.5 1.00 2.70 51.8 0.3 1.5
-0.2
0.2
0.5
0.8
1.10-3.42
11.23-21.77
5.23-7.90
2.11-5.65
original NASGRO parameters
2.0E-9 3.7 0.5 1.00 2.70 51.8 0.3 2.0
-0.2
0.2
0.5
0.8
0.23-1.00
2.97-5.21
0.91-1.54
0.20-0.78
modified NASGRO parameters
Note: In NASGRO, Kc is computed using input values of yield strength, CTYS, plane strain fracture toughness; Kic, and thickness, t. The NASGRO values of oys (65.0 ksi) and Kic (27 ksi ^/in)
were used in the analyses to fit the data and compute a Kc of 51.8 ksi -Jin as shown above.
F3-5

loadframe
travelling microscope
typical FCG specimen
Figure F3.1 Typical Fatigue and Fracture Test Station in the SwRI Solid and Fracture Mechanics Laboratory
tf»E8
—^— L ———
1 f r * 1 1 1
H _..,|„
/ K *
■
Omnkn
SUHbaSpKkMn PH^TupcllMi.« ftfet aMt-Ttoa.tt4i.WU ■ %Mn.Wkh>
kL kL ■t. B-GtOi Ingti «MM 1 «d 2} *-«Mh0ttM3aid4) T-THrlin—(Ho»S) B nm%manm.mmftmtt 1-OMMI tagMi. «n 8Mn 2 and 7) *—langth off ivduoKl avion, mk> 8-UnpJh of grtj> Mctan. mki Stak8) C-Wam<Hj»wdlun.MW«*1itllu>w4—H)
BD0±OJ01
1 18 • 3 2
2J00O±OU006 OS» ±0010
V* 8 214 2 4«
uooo±aoo8 O2S0±0ja06
Vt 4 lift IV, *
t Specimen size used for tensile testing
Figure F3.2 Tensile Specimen Geometry Utilized for Assessing the Tensile Strength of the Aluminum Extrusion (Extracted from ASTM Standard E8 [Fl])
F3-6

o o CM
O O C\J
hlH-|H o o in
o o o
5 =
d>
E o <D e> c <D
E u a> a
CO P
Is
—13 10
»ÜB £ » M
ca <E IDE 5
O.
Ü
11 S I Q Z
CO
a, E n Q.
il ö
o o
r o » o o E _C8 o
o o CO
G T~ T~
M- Ü o 0)
% a. (0
00 "t
+■> a> CO 3
(0 Q. O) 1® >. a 1- 1- a ro
M—
as
e
U
C/J
o Ü u es j- u s on
T3 ctt fa
s es a> i- s u eS u
fa &
#o en S <u H ■<-> o es a £ o U
IM
« e e o a es
■
ha
«2 s .£f
SB
o
fa i- s en
F3-7

9.00
9.00
Drill and ream 1.03 diam (6 places) A 000
2.000
2.000
0.700 0.700 H\0.
Detail A
[— 0.350-* — 0.350 -J
Material 0.125 drill thru
0.010 wide thru-thickness EDM notch (2 places). Notch centered to within 0.003 on both axes.
1.000
^1.000
125 (nominal)
Ma«: 2014 extrusion
Finish:
32rms
Qty Reqd:
Drawn: p c McKeighan
Date: 3 0dober1997
Basic Dimension
Tolerances (inches)
under 6
6-24 incl
over 24
angles
Decimals 2 place 13 place
±0.01
±0.03
±0.001
±0.010 ±0.06 ±0.015
±0° 30'
Frac- tions
±1/32 ±1/16
±1/6 ±1'0'
Southwest Research Institut« San Antonio, Texas
Title Middle-cracked tension specimen for FCG studies
NuanTber 06-8520 (mt_all)
Filename c:\pcm\proj\fchild\dwgs\mt_all.pre
Scale
none
Sheet 1 of 1
Figure F3.4 Design for the Middle Crack Tension Specimen for Fatigue Crack Growth Studies
F3-8

*1
~\ as received
0.500/0.503 diam / ream thru (2)
Detail A
0.015 max-. EDM notch ^\ y
y 0.625-
Note 1 A-surfaces perpendicular and parallel (as applicable) to within 0.006, TIR.
Note 2 All surface finishes 32 RMS except loading hole bore (16 RMS).
Note 3 The intersection of the tips of the machined notch with the specimen faces shall be equidistant from the top and bottom edges of the specimen to within 0.015.
Material Number Specimen of Specs ID'S
2014-T6511 extrusion
CE1 to CE8
Matl: 2014-T6511
Finish:
32rms
Qty Reqd:
Drawn: R j_ McMaster
Date: 12 December 1997
Basic Dimension
Tolerances (inches)
under 6
6-24 incl
over 24
angles
Decimals Frac- 2 place 13 place tions
±0.01
±0.03
±0.005
±0.010
±0.06 ±0.015
±0° 30'
±1/32 ±1/16 ±1/6 ±1°0'
Southwest Research Institute San Antonio, Texas
Title Extended compact tension, EC(T), specimen for fatigue crack growth testing
£2 06-8520 (15TECT_C)
Filename c:~\fraser\swri\projects\fairchd\15tect_c
Scale
none'
Sheet 1 of 1
Figure F3.5 Design for the 1-T Plan Geometry Eccentrically Loaded Single-Edge Crack Tension Specimen for Fatigue Crack Growth Studies
F3-9

Figure F3.6 Typical Krak Gage Setup with Gage Bonded to Face of C(T) Specimen
typical C(T) specimen
V = voltage lead I = current lead
KRAK all leads looped gage for strain relief
terminal block
to FRACTOMAT
Figure F3.7 Schematic of Connections Required on a KRAK Gage on a C(T) Specimen
F3-10

10 -3
10-4
^ 10-5
o u u
5 "5
10-6 _
10 7 _
10
2014-T6511 extrusion NASGRO constants C=3.5e-8 Ako=2.70 n=2.8 K=51.8
p=0.5
q=1.00
Fairchild Tests (R=0.8) NASGRO (R=0.a) Fairchild Tests (R=-0.2) NASGRO (R=-0.2) Fairchild Tests (R=0.2) NASGRO (R=0.2) Fairchild Tests (R=0.5) NASGRO (R=0.5)
~i—i—I I i |
10
AK (ksiVin)
"i r
50
Figure F3.8 FCG Data for the 2014-T6511 Extrusion Compared with the NASGRO Output (Using NASGRO Material Constants)
F3-11

10 -3
10-4
~ io-5
u >» u
Z
"co •a 10-6
10 -7
10-
2014-T6511 extrusion NASGRO constants C=2.0e-9 Akb=2.70 n=3.7 Kc=518
P=05 Smalt/ao=0.3
q=1.00 a=2.0
Fairchild Tests (R=0.8) NASGRO (R=0.8) Fairchild Tests (R—Q.2) NASGRO (R-0.2) Fairchild Tests (R=0.2) NASGRO (R=0.2) Fairchild Tests (R=0.5) NASGRO (R=0.5)
10 50
AK (ksiVin)
Figure F3.9 FCG Data for the 2014-T6511 Extrusion Compared with the NASGRO Output (Using Modified NASGRO Material Constants)
F3-12

100
CO
.(0
5 2 o o 03 L. Ü
10 -
0.1
original NASGRO parameters Modified NASGRO parameters
I
t conservative prediction
exact prediction
non-conservative prediction
t
I
R = -0.2 R = 0.2 R = 0.5
Material and R-ratio combination
R = 0.8
Figure F3.10 Ratio of Experimental to Predicted Lives of FCG Test Specimens Using the NASGRO Model Parameters
F3-13/F3-14

F4.0 DEVELOPMENT OF SPECTRUM FOR FCL Wl COUPON TESTS
Fairchild developed load spectra for the SA226/SA227 aircraft as described in Reference [Fl]. These loads were then, in turn, used by Fairchild to develop stress spectra at fatigue critical locations using the results of in-flight strain surveys and earlier full-scale fatigue tests. This section of the FCL Wl testing and analysis report describes how SwRI converted the stress spectra used by Fairchild for their DTA of FCL Wl to a spectra suitable for use in the coupon testing machines.
The original analysis spectrum provided to SwRI by Fairchild for FCL Wl was a 5.5 hour spectrum consisting of one short flight (0.5 hour), three medium length flights (1.0 hour each), and one long flight (2.0 hours). Each flight was comprised of three loading blocks: taxi, gust, and landing. The taxi and landing blocks were identical for all flights. Differences in the number of cycles contained in the gust blocks distinguished the three flight types from each other. Each spectrum block contained a set of load steps with a (noninteger) number of occurrences, N, and minimum and maximum loads (Fmin, Fmax) corresponding to specific g-levels. In addition, a constant load value, Fmean, was supplied such that it was added to each load step to increase the mean load level.
The damage tolerance analysis (DTA) of this FCL uses NASGRO model TC03, a through- crack emanating from a hole in a plate subject to both a remote tension load and a pin load [F3]. Fairchild provided scale factors converting the spectrum file loads data to tension stresses and bearing stresses. Thus, in the course of executing NASGRO, the stresses are computed as follows:
<J0, min = _ ( -Fmin + Fmean ) SFt and "0, max
SFt
V ■''max ' ■''mean ) 0)
"3, min \ -''min "^ ■''mean ) &Fb and "3, max
SFb
— V •''max ' -''mean ) (2)
where So and 5*3 are the tension and bearing stresses, respectively (in the NASGRO notation), and SFt
and SFb are the scale factors converting the spectrum file loads data to tension and bearing stresses, respectively.
The coupon test program was conducted in two phases, using a simple coupon and a complex coupon. The simple coupon was a single plate of aluminum with an offset open hole. The complex coupon was designed to represent the actual spar sandwich structure with two aluminum plates and two titanium plates, fastened together. In order to develop a spectrum for testing in the laboratory it was necessary to convert the analysis spectrum described above to a test spectrum that (1) was comprised of integer cycle numbers and (2) was represented in terms of uniaxial tension loads.
To convert the spectrum such that it contained only integer cycles, the number of cycles were multiplied by a factor of 100 and rounded off. This resulted in a 550 hour spectrum; however, the rounding off to integer cycle numbers resulted in the loss of a number of fractional cycles. These cycles were recovered by creating a select few make-up cycles and manually inserting them into the spectrum file. A total of seven make-up cycles were added, four gust and three landing. The magnitude of these cycles was determined using a weighted average technique based on the
F4-1

fractional cycle amount lost during the round-off process and the corresponding magnitudes of those fractional cycles.
It was then necessary to convert the tension and bearing loads to remote tension loads to develop an equivalent tension test spectrum. This computation was made using the overall force balance on the coupon:
^eq = So(Wt) + S3(Dt) (3)
where W is the coupon width, D is the hole diameter, t is the thickness, and S0 and S3 are computed as equations 1 and 2.
An analysis of the open-hole simple coupon was performed using the original spectrum (with tension and bearing loads) and compared to results obtained using the remote equivalent tension load spectrum. As expected, the life was somewhat less for the equivalent tension load spectrum case. Thus, the tension only spectrum was scaled up by a factor of 1.06 to approximate the life predicted by the pin load plus tension load analysis.
For the complex coupon tests, the same equivalent tension load spectrum was used; however, it was scaled up by a factor of 1.16 based on the results of a strain survey in order to achieve the desired peak spectrum stress of approximately 11 ksi at the test section of the coupon. This target value of 11 ksi was chosen based on the 2-g stresses for this location listed in Table D-ll of Reference [Fl]. The analysis of the complex coupon uses the spectrum comprised of the tension and bearing loads since the hole is loaded by the fastener in the complex coupon test.
Comparisons between coupon test results and corresponding analytical predictions of crack growth must obviously use the same (test) spectrum. However, it is important to emphasize that the spectra developed for the simple and complex coupons were only developed for use in the coupon tests and should not be used for the final DTA. The original analysis spectrum should be used in the DTA.
F4-2

F5.0 COUPON SPECTRUM TESTING
The objectives of the coupon spectrum testing were to generate empirical data that could be used to (1) determine whether or not FCL Wl exhibited any effects of load interaction (retardation) on crack growth behavior and (2) to assess the validity of the NASGRO crack growth analysis model used for the DTA of this location. The test coupon geometries used to simulate FCL Wl as well as the test procedures used to perform the spectrum crack growth testing are described in this section.
The FCL Wl geometry is a sandwich structure comprised of the titanium straps and the aluminum spar angles and lower cap as shown in Figure F2.1. Based on stress analyses performed by Fairchild, the most critical areas of this joint are the last fastener holes at the outboard end of the titanium straps. Refer to Figures F2.1 and F2.2. The short ligament length in the horizontal leg of the spar cap is the worst case location at which a through-thickness crack is presumed to exist for the purposes of a damage tolerance analysis. In the coupon tests, a through-thickness crack was inserted at this location using an EDM procedure as described below.
The coupon designs used in this program were jointly developed by SwRI and Fairchild engineers. Fairchild Aircraft provided the aluminum and titanium material for manufacture of the coupons. Fairchild also drilled the fastener holes and assembled the complex specimens. SwRI was responsible for installation of the crack growth measurement gages and the strain gages.
The design of the coupons was based on three factors: (1) the availability of material stock at Fairchild; (2) the constraints of the test equipment (grips, fixtures, etc.); and (3) the geometry of the actual FCL Wl at WS 99. Generally, when performing coupon spectrum tests, it is desired to design a coupon that as closely as possible represents the actual geometry; however, as a practical matter, it is rare that the coupon geometry will exactly match the actual FCL geometry. Therefore, taking the three factors listed above into account, coupon design for spectrum testing must focus on developing a geometry that represents as best as practical the salient features of the actual FCL. Therefore, differences exist between the coupon design and the actual structure; however, the coupons do represent the general features of the FCL at WS 99.
Due to the complexity of this joint, it was deemed prudent by SwRI and Fairchild to implement a two-phase approach to the coupon spectrum testing for FCL Wl. A simple coupon design using an offset (open) hole in a plate was tested first. This was followed by a more complex coupon geometry designed to represent the load transfer and built-up nature of the actual joint. Note that in the complex geometry the crack is not visible from the exterior of the coupon and that a fastener fills the hole. Therefore, as will be described, the simple coupon tests served as preliminary studies to investigate the general spectrum crack growth behavior in this material and to establish the viability of the crack growth measurement technique planned for use in the complex geometry where the crack growth was not directly visible.
In this section of the report, a general overview of the test procedures is first presented followed by specific details of each coupon design and test setup along with the results obtained. Comparisons to analytical predictions are presented in Section F6.0.
F5-1

F5.1 GENERAL TEST PROCEDURES
The test procedures used to perform the spectrum crack growth (SCG) testing were developed from many years of experience performing similar testing at SwRI. Although there is no specific industrywide standard related to SCG testing, the methods used are derived from the ASTM E647 standard for fatigue crack growth testing [F4]. Spectrum loads were applied in the frequency range of 5-20 Hz. The actual loading frequency used depended upon the response and controllability of the specific servo-hydraulic frame employed.
The spectrum crack growth test matrix for FCL Wl is shown in Table F5.1. This tabular representation of the matrix is organized in terms of the two different coupon geometries: simple and complex.
F5.1.1 Spectrum Test Methods and Control
The coupon spectrum tests utilized closed-loop, servohydraulic testing systems specially designed to apply variable amplitude waveforms. The stress spectra were electronically stored in a format compatible with SwRI's computer software/hardware systems. The closed-looped control systems used in the test systems insure that the peak load levels are applied to the specimen during cycling. One of the key features of the systems used in the SwRI laboratory is a command/feedback certification procedure utilizing modification of the command signal based on the historical feedback performance during the last spectrum pass. This assures the most accurate and consistent loading of the specimen during testing.
F5.1.2 Spectrum Markerband Procedure
In addition to nonvisual measurements of crack length obtained using KRAK gages, a spectrum marking procedure was used to provide markerbands on the fracture surface to verify and posttest correct the nonvisually measured crack lengths. The marking procedure was tested using the simple geometry SCG specimens to insure that the technique did in fact mark the fracture surface consistently and hence could be used effectively on the complex coupon geometry. With the marking procedure, a number of markerbands, each about 0.003-0.005 inch wide, are placed on the fracture surface with an average of 15-20 markerbands placed on the fracture surface over a ligament length of 0.295 inch. The marking procedure involved applying constant amplitude loading at a high R-ratio so as to induce a different fracture surface appearance. The markerbands were typically applied at a peak load of 80 percent of peak spectrum load and an R-ratio of 0.6.
Due to the premature failure of the KRAK gages in the second test performed on the simple geometry, it was deemed vital to use the markerband procedure on the complex coupon geometries. Since the plate containing the crack was not visible from the exterior of the complex specimen, this insured that crack length measurements could still be made (from the fracture surface) in the event that the KRAK gages failed during the test.
F5-2

F5.2 SIMPLE COUPON GEOMETRY
F5.2.1 Coupon Design
The simple coupon geometry is shown in Figure F5.1. The FCL in the simple coupon geometry is defined as a through crack at a 0.19-inch-diameter offset hole having a 0.35-inch edge distance. The thickness of the coupon was 0.125 inch. EDM flaws were introduced into the coupons to facilitate the pre-cracking process prior to spectrum loading. All EDM flaws were through- thickness with a nominal width of 0.006 inch and a surface length of 0.025 inch.
F5.2.2 Test Setup and Coupon Pre-cracking
Pre-cracking was performed in order to precondition and sharpen the EDM flaw into a fatigue crack prior to spectrum testing. In the strictest sense, the EDM flaw is initially machined into the specimen. Although crack-like in nature, it would not act enough like a real fatigue crack to insure good initial data. Therefore, prior to spectrum testing, blocks of constant amplitude loading were applied to initiate and grow a fatigue crack from the EDM flaw. Experience has shown that a minimum of approximately 0.010-0.015 inch of constant-amplitude fatigue crack growth is required.
The goal during the simple coupon geometry pre-cracking was to grow a fatigue crack from the tip of the EDM flaw to a total length of 0.050 inch measured from the edge of the hole. Pre- crack load levels were kept as low as practical, typically less than 75-80 percent of the peak spectrum load. Constant-amplitude cycles at an R-ratio of 0.1 were employed during pre-cracking.
A photograph of the simple geometry coupon gripped in the servohydraulic load frame is shown in Figure F5.2. A fixed constraint, or antibuckling guide, was attached to the main clevis to provide support for a variety of teflon-coated movable, or free, constraints (these antibuckling fixtures are not shown in Figure F5.2). The movable constraints located between the fixed constraint and test section were free to move in a vertical direction only. Horizontal constraint was achieved through set screws that were located in the fixed constraint.
Visual and nonvisual crack length measurements were recorded. Two different sized gages were used during the simple coupon geometry testing: KG-BH5616-X08 (short ligament) and KG- BH5616-X15 (long ligament). Due to the length of the short ligament in the simple coupon geometry (0.256 inch), part of the -X08 KRAK gage overhung the edge of the coupon and therefore needed to be supported by an extension plate. This type of arrangement was also used for the complex geometry tests and, hence, a more in-depth explanation of this arrangement is provided in Section F5.3.
F5.2.3 Results
Two tests were performed using the simple coupon geometry as indicated in Table F5.1. In general, given a specific crack length envelope, if the cycles, or spectrum flight hours (SFHs) corresponding to the growth, are within ±15 percent, the test is considered repeatable. This level of accuracy is based upon extensive SwRI spectrum testing experience. The test-to-test repeatability is dependent upon the coupon geometry (complexity), inherent material variability, crack shape and errors in crack length measurement.
F5-3

Results obtained for the simple geometry coupons tested under flight spectrum conditions are shown in Figure F5.3. The data plotted in Figure F5.3 were obtained from visual measurements obtained using a microscope. Due to the failure of a KRAK gage on one of the coupons (SS-2), only nonvisual crack length measurements were obtained for one of the two tested coupons. Crack length measurements for each of the simple coupon geometry tests are provided in Appendix G2 - Spectrum Crack Growth Tests. The fracture surfaces for these coupons are shown, with test parameters, in Figure F5.4.
The results shown in Figures F5.3 and F5.4 for the simple coupon geometry tests can be summarized as follows:
• Total coupon life varied from 92 to 133 kSFH. Hence the tests exhibit poor repeatability.
• The crack growth curves observed (Figure F5.3) were concave up in accordance with typical behavior.
• The pre-cracked ligament failed prior to the initiation of a crack on the opposite side of the hole. Spectrum flight hours to failure of the short ligament ranged from58tol01kSFH.
• Initiation of a crack on the non pre-cracked side of the hole took approximately 16 to 24 kSFH following failure of the short ligament.
• The time spent cracking the longer (uncracked) ligament was approximately 10 to 16 kSFH.
• For coupon ID (SS-2), both KRAK gages failed at the extension tab-coupon interface at approximately 37 kSFH.
• The marking procedure used on the simple geometry tests appeared to work well.
As illustrated in the micrographs in Figure F5.4, vastly different fracture surfaces were observed for the two simple geometry coupon tests. This necessitated further investigation as this may be the reason for the large differences in spectrum flight hours for the two coupons. Test coupon SS-2 had a rough fracture surface with areas of large cleavage facets and prominent striations. Conversely, the fracture surface of test coupon SS-3 was relatively flat with only the applied markerbands visible on the fracture surface. Photographs of the macroscopic grain structure of both specimens are shown in Figure F5.5. Crack propagation in both coupons was found to be transgranular; however, a dramatic difference in grain size for the two coupons was noted.
The contrast in the SCG lives of the two simple geometry tests can be explained in terms of the differences in their grain structure. Whereas dislocations easily shear the small grains in SS-3, the larger grains in SS-2 form obstacles to dislocation motion with the result that the dislocations loop around the grains and bypass them. Thus, the principal cause of the apparent differences in the spectrum crack growth response of the two microstructures is expected to be crack deflection and the attendant roughness-induced closure.
F5-4

F5.3 COMPLEX COUPON GEOMETRY
F5.3.1 Coupon Design
The complex coupon design is shown in Figure F5.6. The complex geometry is a multiple- layered joint that represents the actual FCL with fastener loading, multiple load paths, and tension- bending. Testing of this joint required a high level of instrumentation, with strain gages (Figure F5.6) applied to various components of the joint to assess the overall loading and load paths in the structure. The test section of the coupon that contained the crack is labeled "E" in Figure F5.6. The FCL in the complex specimen is defined as a through crack at a 0.16-inch-diameter hole having a 0.375-inch edge distance. Again, the thickness of the test section was 0.125 inch.
F5.3.2 Test Setup and Coupon Pre-cracking
During the pre-cracking phase of testing it was found to be extremely difficult to initiate a crack from the EDM notch (due to the complex nature of the joint and the low constant-amplitude loads applied). Therefore, a multitude of different peak constant amplitude loads and R-ratios were used to successfully initiate a crack and propagate the crack to the required 0.050-inch pre-crack length. The details of the pre-cracking loads and R-ratios used in the complex geometry pre- cracking process are summarized in Table F5.2.
A single sized gage was used during this testing phase: KG-BH5616-X08 (short ligament and middle ligament). Due to the length of the short ligament in the complex geometry (0.295 inch), part of the -X08 KRAK gage overhung the edge of the coupon and therefore needed to be supported by an extension tab. A photograph of the KRAK gages applied to the test section of the joint is shown in Figure F5.7. A photograph of the complex geometry coupon mounted in the servohydraulic load frame is shown in Figure F5.8. Hydraulic grips were used during this testing phase to insure the best load transfer. However, due to the large size (and mass) of the grips, test frequency was limited to a maximum of 10 Hz.
F5.3.3 Strain Survey
An initial strain survey was performed on all complex geometry coupons to measure the relative strain levels reached during loading of the complex joint. Eight strain gages were attached to the coupons and the strain measurements were obtained at 85 percent of the peak spectrum load. A summary of the strain survey results is given in Figure F5.9 as a function of the relative positions of the strain gages. The repeatability of the strain gage measurements for the three complex coupons is quite excellent.
Strain gage numbers 7 and 8 were positioned on the complex coupon such that they matched the location of Fairchild flight test gages 3 and 2, respectively. (Refer to Table D-ll of Reference [Fl].) Therefore, the average of gages 7 and 8 was used to scale the spectrum such that a target stress value of 11 ksi was achieved on the lower cap portion of the complex coupon. As discussed in Section F4.0, the scale factor obtained in this fashion was 1.16.
The complex geometry tests were also periodically interrupted to take strain data for a loading and unloading ramp to 85 percent of the peak spectrum load. Representative strain traces
F5-5

for all three tests and compliance data are provided in Appendix G2. Compliance measurements taken during all three tests showed little difference between loading and unloading and remained constant for the majority of the test duration.
The compliance results can be used to determine both load transfer and bending using the following equations:
Load Transfer (%) =100
Bending (%) =100
\ c5+c6A
v C3+C4y
C, -C2
Cj+Cj
(4)
(5)
where Q is the calculated compliance value at gage i. The results are shown in Figure F5.10 plotting percent load transfer and percent secondary bending as a function of spectrum flight hour (loading cycle).
The mean load transfer observed for all tests was between 40-42 percent indicating that the titanium straps take approximately 40 percent of the load. The similarity of the responses is remarkable and presumably indicative of uniform joint behavior and fixed clamping. Relative to a pure tensile test, levels of bending were quite high, as expected, and typically averaged 17-20 percent. Bending in the actual wing spar would be expected to be less than that observed in the complex coupon geometry due to the presence of the vertical legs of the spar angles in the actual structure.
F5.3.4 Results
The test results obtained for the complex geometry coupons (CS-1, CS-2, and CS-3) tested under flight spectrum conditions are shown in Figure F5.ll. Visual and nonvisual crack length measurements for each of the complex coupon geometry tests are provided in Appendix G2. Premature failure of the KRAK gages did not occur during any of the three complex geometry tests. The fracture surfaces for these coupons are shown in Figure F5.12, with the markerbands clearly visible for all three tests.
The results shown in Figures F5.11 and F5.12 can be summarized as follows:
• Complex geometry tests were terminated after the short ligament failed (or appeared to be completely fractured).
• Short ligament life was measured to be 121, 142, and 201 kSFH.
• Curved crack fronts were observed for all tests. This is indicative of the tension-bending loading obtained during testing of the built-up joint.
• Posttest visual crack length measurements (Figure F5.11) for all tests were shown to be approximately 0.010-0.020 inch greater than those measured using the KRAK gages. This difference is investigated and discussed further in Appendix G2.
F5-6

Table F5.1 Spectrum Crack Growth Tests and Specimen IDs
FCL Designation
Geometry Specimen ID Thickness (inch)
EDM Length (inch)
Wl
simple SS-2
SS-3
0.1231
0.1232
0.024
0.025
complex CS-1
CS-2
CS-3
0.1243
0.1244
0.1242
0.017
0.023
0.022
Table F5.2 Pre-Cracking Details for the Complex Geometry Tests
Specimen ID Number of Cycles
Maximum Precracking Load (% of peak spectrum load = 4520 lbs)
R-ratio
CS-1 51,000 55 0.1
83,000 65 0.1
100,000 75 0.1
100,000 95 0.1
250,000 100 0.1
65,000 100 -1.0 3,978 100 0.1
107,400 80 0.1
CS-2 100,000 100 0.0
49,320 100 -1.0 78,102 80 0.0
CS-3 29,070 100 -1.0
3,000 80 0.0
F5-7

4^
2.500
grip area-
-1.000- 1.500
1.500
m
0.350
Q> \
grip: area
m.
0.500
0.850
3.150
0.025 long EDM flaw (thru)
4.000
2.500
Matl: 2014 extrusion
Finish:
32rms
Qty Reqd:
Drawn: P. C. McKeighan
Date: 3 October 1997
Hh°. 125
8.000
/
Grip Alignment Hole Drill and ream 0.257 diam thru (2 places)
/
FCL hole sized for #6 fastener, 0.188 diam drill thru
Basic Dimension
Tolerances (inches)
under 6
6-24 incl
over 24
angles
Decimals 2 place 13 place
±0.01
±0.03
±0.001
±0.010
±0.06 ±0.015
±0°30'
Frac- tions
±1/32
±1/16
±1/6 ±1°0'
rtj|j|tef\-%^ Southwest Research Institute San Antonio, Texas
Title Simplified Spectrum Crack Growth (SCG) Coupon
Drawinq Number 06-8520 (scg_sim)
Filename c:\pcm\proj\fchiid\dwgs\scg_sim.pre
Scale
none
Sheet 1 of 1
Figure F5.1 Design for the Simple Geometry Coupon for Spectrum Crack Growth Studies
F5-8

extension tab (for KRAK gage
Overhang)
fastener hole and EDM notch
Figure F5.2 Representative Test Setup for the Simple Geometry Coupon
F5-9

s: o c
c -I
o CO V.
Ü
U.HU
Simple Geometry SCG tests A
Short Liaament Front A A SS-2
0.35 - D SS-3 Short Liaament Rear A
▲ ■
SS-2 SS-3 Lona Liaament Front
A
A SS-2 0.30 - ■ SS-3
Lona Liaament Rear A SS-2 A H SS-3
0.25 - A
D A
D
0.20 D
D "
A A A A
. n ■ A A
■
D ■ A A
A m
A
■ A A A
0.15 ■ A A
° A ▲ ■ . ■ A
- ■ ▲
0.10 „A A D ■
A
- O ■ A A
A
E ■ A ED
0.05 \ jg«fr A A ■
i k A ■ A
■
TJ A
um A*
0.00 - i i i i i i i I r I'l-I'l 1 1 1 1 1 1 | 1 1 1 1 1 ITT'I"'1 ITT 1 1 1 1 ' ' i i ii i i i i \ i | ii'i i ' rTTTTTTTTTTTTTT
0 20 40 60 80 100 120 140
Spectrum Flight Hours (x1000)
Figure F5.3 Summary of All SCG Tests Performed on the Simple Coupon Geometry
F5-10

Cycles per
550 SFH
SUMMARY OF SPECTRUM PARAMETERS
Load levels (lbs)
Minimum Maximum Comments
14076 -1406 1451 offset hole
FRACTURE SURFACES MILESTONES
Total Life = 133.5 kSFH
ligament failed at 101.6 kSFH reinitiation at 117.3 kSFH
Test = SS-2
Total Life = 92.9 kSFH
ligament failed at 58.6 kSFH reinitiation at 82.6 kSFH
Test = SS-3
Figure F5.4 Summary of Spectrum Crack Growth Testing for the Simple Geometry Coupon
F5-11

Tl i
to
(a)
(b) Figure F5.5 Micrographs of the Simple Geometry Coupons Highlighting the Different
Grain Structures (a) Test SS-2 and (b) Test SS-3
F5-12

* * » - ■« ►■ u 0 ■^ w
OOiVO 3
C o c
_ _ '" * t3
6S0I C 1 . o «
4) 4* 'S
1
«
SA£0 1 ü
i L i A u: a u. n <
.s - <3\
-0---CJ)- "T '.'. ■ ■ ^
S 2 1' o o u 'a
V, S e u u f *-* -s < E w
•s c
o II CO
-0---0- -T ' -; 3 C o « w t/l Ü
g
ö in CN oo
i
o CD 3 o _&. 1
'■5 — -O---0- -7 ^ _: : .
O U Ü U 60 u n
o z
i s c o D an ca 00
.2 c .0
o - -r - H> - o in
_ _ " ' 1_ .
j»
P
2.2 SO
vo 0
el "05 o 00
w.« 4T H< 4? 4i
■^ s Cl m w
2N -?-B--t- (C
a 2
ON o\
0 0 Ö -H
O O O
Ö 0
CD 1 X§ \ \ ' 1 i
2 D S g o 8 O s -H
*s 00 O >—> •s £ "5
_o IS Ö -H
Ö 0
j§ V- -?- o o 8P
— ■ ""
ui (N
o
'8- o 1 [ c ■si
Is \D .£ V)
1
«n 1
ON ÜB I r-
i
« u a
C 3 3
0 f i i i
r^ o
o o "1 ,ö
' " x1 Ö
.. l i "* ' ' ■ |S > CM — .2 ."a <N l
^ ll h ^ II ^ ^ II ^| ^ II *■
' ta to fct- fcö ta ta o o o o o o m en --* ^* <— ^
-0---Q- .
1,
T
r req
uire
d pe
r ass
t
2s u
4-*
-0---0- --_ .s
P o 2 £ © -S
-0---0- -7 ^ 4>
- ■ : " E 3
125-
inth
i 10
0-in
thi
0.12
5-in
t 0.
100-
int
ar a
ngle
( ;0
.125
-in
1 r <»» ]u.r<
CA
ca o
3 en g
tabs
(0.
g ta
bs (0
. m
stra
p (i
m s
trap
( ct
ion
- sp
wer
cap
(
CJ C C 3 2 u _o
11 O S 2 a * 'o o o •— -S D o. w — __ *J <-• u ;„
t/3 < CQ Ü Q W fe
«5
O u Ü u es s- U s a u u a
1»
e o a s o U
s o cu Ü cu
a S o U <u
«2 & on CA V Q
in
cu i- s M
F5-13

fastener holes test section extension tab
■.)•■- , .
2KRAK gages
m r
\ •. iastenecfcolesl
Meß
extension tab
Figure F5.7 KRAK Gage Details for the Complex Geometry Coupons
F5-14

KRAKgage
hydraulic grips
Figure F5.8 Representative Test Setup for the Complex Geometry Coupon
F5-15

1.5
1.4 •~\
1.3 05
1,? 0;
tf O) I.I v.^ o
■b 1.0 c D 0.9
•4— co b 0.8 C/3 CO
<D 0.7 ^— co
0.6
0.5
• CS-1 -■ ■■ a CS-2 •■ ■
A C S -3 :
. .. «^
*fl
•_ A A 7 • *
■ ■ i 1 1 1 1
12 3 4 5 6 7 8
Gage Number
, 10Q »I
ii 1&2 Z2-
7
0.75
KRAK gage on extension tab
-Q -© - -6 -
i—■ EZ2
-d) - -0 • -4>
4.650
6.750
9.000
lr H
d strain gages (8)
o.io. 1.20
Figure F5.9 Comparison of Initial Strain Gage Readings, Normalized with Respect to Strain Gage 8
F5-16

O) c
"O c 0)
L. A
S £ (0 m c ■o IU c 4-> o ■o
CO o
Ü CO 0)
1 <0 «0 P Cn V»
ffl
£ E- Ü «J /
o o © o o CM
o o o in
o o o o 10
4» H >» 1-
©
Ü
a S o U
i.
H
T- CM CO i i i
CO CO CO O ü Ü
i6T
13
o CO -^ o i_ u o in CM
3 O X
a V *J .n "O
O) s o 41 o u. M o E >> o i- o 3
i. 4-i
es
8 U O
o o o a
CO 41
in ES r*. es
u
o S o es o o H in
es o
o -w o SS o 4> in U
CM 4>
o CD
in m o in
in o m CO
o CO
in CM
o m CM T-
4< S- 3 DJ)
ßujpuag Ajepuooas pue jajsueji peon ^uaojad
F5-17

u.ouu - Fracture surface measurement
0 ■
0.275 - A
■ •
CS-1 CS-2 CS-3 A
■
0.250 - •
A ■
0.225 - A •
■
0.200 A
• A ■
^c 0.175 - A
A
■
■4-»
c
u CO L. o
0.150
0.125 -
A
A
A A
• A
A 0
• ■
• ■
■ ■
■
A A • ■
0.100 A «
A ■ ■
0.075 I
A A«
i4-
• ■ ■
■
0.050 open symbols represent the end of the specimen ligament not an actual physical crack measurement
0.025 -
0.000 - I 1
0 40000 80000 120000 160000 200000
Spectrum Flight Hours
Figure F5.ll Summary of All SCG Tests Performed on the Complex Coupon Geometry
F5-18

SUMMARY OF SPECTRUM PARAMETERS
Cycles per
550 SFH
Load levels (lbs)
Minimum Maximum Comments
14076 -4380 4520 offset hole (built-up joint)
FRACTURE SURFACES Test = CS-3 MILESTONES
Test terminated = 121.0 kSFH
Test = CS-1
Test = CS-2
Test terminated = 201.2 kSFH
Test terminated = 142.7 kSFH
Figure F5.12 Summary of Spectrum Crack Growth Testing for the Simple Geometry Coupon
F5-19/F5-20

F6.0 ANALYSIS OF COUPON TESTS
Crack growth analyses of the simple and complex coupon spectrum tests were performed using NASGRO to determine if FCL Wl exhibited any effects of load interaction (retardation) and to assess the general validity of the NASGRO crack growth analysis model (Figure 6-1) used for the DTA of this location. This section presents the results of these analyses and compares them to the data obtained in the coupon tests. For reference, Appendix G3 provides listings of the batch data files and the spectrum files used in the NASGRO analyses.
F6.1 CRACK GROWTH RELATIONSHIP
The crack growth equation used in the NASGRO software [F3] is:
C(l-f)"AK" da
f KIT V 1-
V tSK
dN . . ( KV y (l-R)" 1-
AK (6)
(l-*c). v v1 -"-c/y
where N is the number of applied fatigue cycles, a is the crack length, R is the stress ratio, AK is the stress intensity factor range, and C, n, p, and q are parameters obtained from the curve fit to the empirical data, see Figure F3.9. The threshold intensity factor range, AKth is approximated in NASGRO as a function of the threshold intensity factor range at R = 0, defined as AKo. Kc is the thickness dependent fracture toughness of the material. The function/allows for the use of a crack closure model. Using this NASGRO crack growth equation, analytical comparisons were made to the coupon spectrum crack growth data and demonstrated that very good predictions were possible without the use of a retardation or closure model.
Based on the fatigue crack growth data generated in this program (Section F3.4) and the data contained in the NASGRO material properties database, the following parameters were used in the crack growth analyses of the 2014-T6511 aluminum extrusion coupon material:
C = 2.0E-09
n = 3.70
p = 0.50 q = 1.00
A£o = 2.70ksWin
Kc = 51.8ksWin
F6.2 SIMPLE COUPON ANALYSIS RESULTS
The results of the simple coupon crack growth analysis are plotted against the measured crack growth data for coupon SS-3 in Figure F6.2 demonstrating excellent agreement between analysis and test. This good level of agreement was obtained without using a retardation model and without using the closure model contained in NASGRO. Therefore, it can be concluded that load
F6-1

test results obtained from coupon SS-2 were deemed anomalous due to the microstructural differences discussed in Section F5.2.3 and were not used for comparison.
F6.3 COMPLEX COUPON ANALYSIS RESULTS
The results of the complex coupon crack growth analysis are plotted against the measured crack growth data from coupons CS-1, 2 and 3 in Figure F6.3. Excellent agreement is demonstrated between analysis and test for the shortest lived test results (CS-1 and CS-3) without the use of a retardation or closure model.
The analysis of the complex coupon geometry using the NASGRO TC03 model considers only in-plane tension and pin loads and does not account for the bending that actually occurred in the test specimen. Hence, this through-crack model uses a straight crack front. The curved crack fronts shown in Figure F5.12 and the strain gage measurements shown in Figure F5.9 are indicative of the amount of bending that was present in the complex coupon as a result of the shift in the neutral axis caused by the titanium straps. The crack growth test data plotted in Figure F6.3 are those measured at the point of maximum crack length (along the lower sides of the specimens in the photographs in Figure F5.12). Thus, the comparison shown in Figure F6.3 is actually a comparison between the maximum measured crack lengths and predicted (straight front) through-crack lengths. This analysis approach is conservative in terms of life since the largest crack size is used in the model representing a straight crack front.
t f t T T T s0+p/wt
S3 = P / D t
t = thickness
rnrm s, Figure F6.1 NASGRO Model TC03 for a Through-Crack From an Offset Hole in a Plate
F6-2

FCL W1 Simple Coupon Analysis 2014-T6511
0.250
0.225
0.200
0.175
0.150
0 0.125 _l
u ra Ö 0.100
0.075
0.050
0.025
Coupon Geometry:
Width, W= 1.00 in Thickness, t = 0.125 in Hole Diameter, D = 0.188 in Edge Distance, B = 0.35 in
0.000
o
o
o SS3 Test Results
-—Analysis
| ' l M | 1 I I I | I " " I 1 ' ' ' ' ' ' ' '
0 5 10 15 20 25 30 35 40 45 50 55 60 65
Flight Hours (Thousands)
Figure F6.2 Comparison of Analysis Results with Coupon Test Results for the Simple FCL Wl Coupon Geometry
F6-3

FCL W1 Complex Coupon Analysis 2014-T6511
0.300
0.275
0.250
0.225
0.200
~ 0.175
o 0.150
0.075
0.050
0.025
Coupon Geometry:
Width, W= 1.434 in Thickness, t = 0.125 in Hole Diameter, D = 0.159 in Edge Distance, B = 0.375 in
D
D
0.000
A CS-1
□ CS-2
o CS-3
^—Analysis
-J 1 u H ' h -J 1 1 \ ' 1 ' 1 ' h
0 20 40 60 80 100 120 140 160 180 200
Flight Hours (Thousands)
Figure F6.3 Comparison of Analysis Results With Coupon Test Results for the Complex FCL Wl Coupon Geometry
F6-4

F7.0 RECOMMENDATIONS FOR DTA
Using the crack growth material properties generated in this program and the NASGRO TC03 fracture mechanics model, it was possible to accurately predict the results of both the simple and complex coupons representing FCL Wl. These predictions were made without the need for invoking a retardation model indicating that load interaction effects for FCL Wl under this spectrum are not significant. These favorable results provide confidence in using the NASGRO software and these material properties in the DTA of the 2014-T6511 wing spar components on the SA226/SA227 aircraft. However, it is important to emphasize that the spectra developed for the analysis of the simple and complex coupons were specifically developed to conduct and analyze the coupon tests and should not be used for the final DTA. The original analysis spectrum should be used in the DTA.
These coupon tests and the subsequent crack growth analyses were conducted assuming the existence of a through-thickness flaw emanating from the fastener hole at FCL Wl. In the DTA, additional life could be demonstrated by beginning the analyses assuming that the initial flaw was a quarter-circular corner crack having a radius of 0.05 inch. Such an analysis would be performed using NASGRO model CC02 for a corner crack growing from an offset hole in a plate. The assumption of an initial corner crack would be consistent with the recommendations made in the USAF Damage Tolerant Design Handbook [F10]. This initial flaw shape and size philosophy is also echoed in the FAA Damage Tolerance Assessment Handbook [Fl 1].
In addition to the assumption of an initial corner crack, the DTA could also make use of the continuing damage concept where additional life beyond the failure of the short ligament is computed assuming the crack initiates on the opposite side of the hole. This analysis procedure, which is also documented in References [F10] and [Fl 1], could be used in conjunction with a model that accounts for load redistribution into the adjacent spar structure to demonstrate additional life beyond that computed using simply NASGRO models TC03 or CC02.
F7-1/F7-2

F8.0 REFERENCES
Fl. Dwyer, W., "Development of a Supplemental Inspection Document for SA226/SA227 Aircraft, Interim Report I," Report No. R1517, Fairchild Aircraft, May 1997.
F2. Brooks, C.L., "An Engineering Procedure to Select and Prioritize Component Evaluation under USAF Structural Integrity Requirements," McDonnell Aircraft Company, McDonnell Douglas Corporation, 1990.
F3. Forman, R.G., et al., "Fatigue Crack Growth Computer Program NASGRO," Version 2.03, JSC-22267A, NASA-JSC, May 1994.
F4. Annual Book of ASTM Standards, Section 3: Metals Test Methods and Analytical Procedures, Vol. 3.01 Metals - Mechanical Testing; Elevated and Low-Temperature Tests; Metallography, 1997.
F5. Piascik, R.S. and Newman, Jr., J.C., "An Extended Compact Tension Specimen for Fatigue Crack Growth and Fracture Testing," International Journal of Fracture, Vol. 76, pp. R43- R48, 1996.
F6. Military Handbook: Metallic Materials and Elements for Aerospace Vehicle Structures, MIL-HNDBK-5G, United States Department of Defense, Wright-Patterson AFB, November 1994.
F7. Donald, J.K. and Schmidt, D.W., "Computer-Controlled Stress Intensity Gradient Technique for High Rate Fatigue Crack Growth Testing," Journal of Testing and Evaluation, JTEVA, Vol. 8, No. 1, pp. 19-24, 1980.
F8. McKeighan, P.C. and Smith, D.J., "Determining the Potential Drop Calibration of a Fatigue Crack Growth Specimen Subjected to Limited Experimental Observations," Journal of Testing and Evaluation, JTEVA, Vol. 22, No. 4, pp. 291-301, 1994.
F9. Donald, J.K. and Ruschau, J., "Direct Current Potential Difference Crack Length Measurement Techniques," from Fatigue Crack Measurement: Techniques and Applications, K.J. Marsh, R.O. Ritchie, and R.A. Smith, Eds., EMAS, 1990.
F10. Gallagher, J.P., et al., "USAF Damage Tolerant Design Handbook," AFWAL-TR-82-3073, May 1984.
Fll. Damage Tolerance Assessment Handbook. Vols. I and II, DOT-VNTSC-FAA-93-13.I, October 1993.
F8-1/F8-2

APPENDIX G
Testing and Analysis for DTA of
Fairchild SA226 Main Wing Spar Lower Cap at WS99
FINAL REPORT SwRi Project No. 06-8520
prepared by
Joseph W. Cardinal Fräser J. McMaster Peter C. McKeighan
prepared for
Fairchild Aircraft, Inc. San Antonio, Texas
January 1999
APPROVED:
r~
■A iTx, At->-^-^'v'J\,\
Hal Burnside, Ph.D., P.E., Director Structural Engineering Department

APPENDIX G TESTING AND ANALYSIS FOR DTA OF FAIRCHILD SA226 MAIN WING SPAR LOWER CAP AT WS 99
Page
Gl Material Characterization Properties Gl-1
G2 Spectrum Crack Growth Tests G2-1
G3 Crack Growth Analysis Data Files G3-1
G-i

APPENDIX Gl Material Characterization Properties
Data: Tensile Test Results Fracture Toughness Results Fatigue Crack Growth Results
Contents: Tensile Tests • Data Sheet for each Test Fracture Tests • Load versus Displacement (CMOD) Response • Analysis of Test Data Fatigue Crack Growth Tests • Crack Growth Plots (R-ratio) • Crack Growth Plots (individual tests) • Test Conditions • Tabulated Data
G-ii

Tensil Tests
7 tests: TE-1 to -4 TA-lto-3
Gl-1

t «AT» 3?,/:- Ifjä CHARLES C. KAWIN COMPANY
*imz* pMMAILIltö'ADDRESS / P.O. BOX 310 / MAYWOOD, ILLINOIS 60153
SOUTHWEST RESEARCH INST. 7010 6220 CULEBRA RD P. O. DRAWER 28510 SAN ANTONIO TX 78284 FRÄSER MCMASTER
P. 0. # 50138
DESCR 2014-T6511 ALUMINUM EXTRUSION
REPORT DATE: 11/17/97
LAB NO: 1110-076 / 01
SAMPLE TE-1
JOB NO:
THKNS: . 130 WIDTH: YIELD STRENGTH: lbs ULT STRENGTH: lbs ELONG ON 2. 00 IN.
MECHANICAL-TESTING RESULTS
. 505 3, 984. 4. 359.
.20
AREA* YIELD STRENGTH psi : TENSILE psi : ELONGATION % : REDUCTION OF AREA V.
. 065T 60.685 66.398
10. 00 24. 21
'IELD STRENGTH BY EXTENSOMETER 0. 37. OFFSET
TEST METHODS: ASTM B557 i
MODULUS OF ELASTICITY - 10.450.000 PSI
PAGE 1 OF
THIS REPORT SHALL NOT BE REPRODUCE WITHOUT THE WRITTEN APPROVAL OF THI
A INSPECTOR
EPT IN FULL. ARLES C. KAWIN CO.
Gl-2

&c ^CHARLES C. KAWIN COMPANY
Q"J^Ö(£ÄbDfes / P.O. BOX 310 / MAYWOOD, ILLINOIS 60153
SOUTHWEST RESEARCH INST. 7010 6220 CULEBRA RD P. 0. DRAWER 28510 SAN ANTONIO TX 78284 FRÄSER MCMASTER
LAB NO: 1110-076 / 02
P.O. # 50138
DESCR 2014-T6511 ALUMINUM EXTRUSION
REPORT DATE: 11/17/97
JOB NO:
SAMPLE TE-2
THKNS: . 131 WIDTH: YIELD STRENGTH: lbs ULT STRENGTH: lbs ELONG ON 2. 00 IN.
MECHANICAL TESTING RESULTS
. 505 4, 116. 4. 420.
.21
'IELD STRENGTH BY EXTENSOMETER O. 27. OFFSET
TEST METHODS: ASTM B557 ;
AREA: YIELD STRENGTH psi : TENSILE psi : ELONGATION 7. : REDUCTION OF AREA '/.
.066c 62.218 66.813
10. 50 27. 01
MODULUS OF ELASTICITY - 10.750.000
INSPECTOI
PAGE 2 OF
THIS REPORT SHALL NOT BE REPRODUCED/EXCEPT IN FULL. WITHOUT THE WRITTEN APPROVAL OF THE CHARLES C. KAWIN CO.
Gl-3

*- f r* *'l SI ^
Ö CHARLES C. KAWIN COMPANY MEWIiUHGOt MB0RA7ÜHES
S7HU. MAILING ADDRESS / P.O. BOX 310 / MAYWOOD, ILLINOIS 60153
SOUTHWEST RESEARCH INST. 6220 CULEBRA RD P. 0. DRAWER 28510 SAN ANTONIO TX 78284 FRÄSER MCMASTER
LAB NO: 1110-076 / 03
SAMPLE TE-3
7010 P. 0. * 50138
DESCR 2014-T6S11 ALUMINUM EXTRUSION
REPORT DATE: 11/17/97
JOB NO:
THKNS: . 129 WIDTH: YIELD STRENGTH: lbs ULT STRENGTH: lbs ELONG ON 2. 00 IN. •:
MECHANICAL TESTING RESULTS
502 3, 960. 4, 266.
22
IELD STRENGTH BY EXTENSOMETER 0. 27. OFFSET
TEST METHODS: ASTM B557 ;
AREA: YIELD STRENGTH psi : TENSILE psi : ELONGATIDN 7. : REDUCTION OF AREA '/.
MODULUS OF ELASTICITY - 10.730,000 PSI
. 064$ 61.151 65. 876
11.00 23.05
'QA INSPECTOI
PAGE 3 OF/
THIS REPORT SHALL NOT BE REPRODUCED EXCEPT IN FULL, WITHOUT THE WRITTEN APPROVAL OF THE CHARLES C. KAWIN CO.
Gl-4

Ifl CHARLES C. F®W&£pMPANY uEtHmsm. waofpg© \ 5 PA" - ■'
MAIUNG ADDRESS / P.O. BO&^f!Q1f^OOp; ILLINOIS 60153
SOUTHWEST RESEARCH INST. 7010 6220 CULEBRA RD P. 0. DRAWER 28510 SAN ANTONIO TX 78284 FRÄSER MCMASTER
LAB NO: 1110-076 / 04
SAMPLE TE-4
P. 0. * 50138
DESCR 2014-T6511 ALUMINUM EXTRUSION
REPORT DATE: 11/17/97 SSSC7SB£BSSr===SBBBBSS3
JOB NO:
MECHANICAL TESTING RESULTS-
THKNS: . 130 WIDTH: . 505 -
YIELD STRENGTH: lbs 3,660. ULT STRENGTH: lbs 4,354. ELONG ON 2.00 IN. .23
'IFLD STRENGTH BY EXTENSOMETER 0. 27. OFFSET
TEST METHODS: ASTM B557 ;
AREA: YIELD STRENGTH psi : TENSILE psi : ELONGATION 7. : REDUCTION OF AREA 7.
. 065? 55.750 66,321
11. 50 29. 24
MODULUS OF ELASTICITY - 10.930,000 PSI
INSPECTOR
PAGE 4 OF
THIS REPORT SHALL NOT BE REPRODUCED EXCEPT IN FULL, WITHOUT THE WRITTEN APPROVAL OF T^HE CHARLES C. KAWIN CO.
Gl-5

I fÜ CHARLES C. KAWIN COMPANY
ÄCCTS ?AYA"' MAILING ADDRESS / P.O.BOX310 / MAYWOOD, ILLINOIS 60153
Q7PQV?'; ?'f, ': ?' SOUTHWEST" RESEARCH INST. 7010 6220 CULEBRA RO P. 0. DRAWER 2B510 SAN ANTONIO TX 782B4 FRÄSER MCMASTER
LAB NO: 1110-076 / 05
SAMPLE TA-1
P.0. # 50138
DESCR 2014-T6511 ALUMINUM EXTRUSION
REPORT DATE: 11/17/97
JOB NO:
THKNS: . 127 WIDTH: YIELD STRENGTH: lbs ULT STRENGTH: lbs ELONG ON 2. 00 IN. ':-
MECHANICAL TESTING RESULTS
502 3. 936. 4. 181.
.20
AREA: YIELD STRENGTH psi : TENSILE psi : ELONGATION X : REDUCTION OF AREA 7.
. 0639 61,737 65.580
10. 00 20. 59
F:IELD STRENGTH BY EXTENSOMETER 0.27. OFFSET
TEST METHODS: ASTM B557 ;
MODULUS OF ELASTICITY - 11,740.000 PSI
PAGE 5 OF
THIS REPORT SHALL NOT BE REPRODUC WITHOUT THE WRITTEN APPROVAL OF TftE Cl
lA INSPECTOR
T IN FULL. C. KAWIN CO.
Gl-6

RtCElV^i- I Öl CHARLES C. KAWIN COMPANY &CCTS r'MT/-.. |fc^ m/wiBGm UBOWTORES
W- ün1"' ?1» ?r- 'MAIüNG ADDRESS / P.O. BOX 310 / MAVWOOD. IUJNOIS 60153 5 \ K-i c
SOUTHWEST RESEARCH INST. 7010 6220 CULEBRA RD P. O. DRAWER 28510 SAN ANTONIO TX 78284 FRÄSER MCMASTER
LAB NO: 1110-076 / 06
SAMPLE TA-2
P. O. # 50138
DESCR 2014-T6S11 ALUMINUM EXTRUSION
REPORT DATE: 11/17/97
JOB NO:
MECHANICAL"TESTING RESULTS
THKNS: . 125 WIDTH: . 501 " YIELD STRENGTH: lbs 3.840. ULT STRENGTH: lbs 4.095. ELONG ON 2.00 IN. : - .21
F/IELD STRENGTH BY EXTENSOMETER 0. 27. OFFSET
TEST METHODS: ASTM B557 i
AREA * YIELD STRENGTH psi : TENSILE psi : ELONGATION 7. : REDUCTION OF AREA '/.
MODULUS OF ELASTICITY - 11.250.000 PSI
. 062c 61.317 65.389
10. 50 25.49
PAGE 6
THIS REPORT SHALL NOT BE REPRODU WITHOUT THE WRITTEN APPROVAL OF
FULL. KAWIN CO.
Gl-7

EMpHARLES C. KAW1N COMPANY ^C£^fe?l imMmeeN. IABORATORES
DORES'S /:F*.0. BOX 310 / MAYWOOD, ILUNOIS 60153 GJWl^
SOUTHWEST RESEARCH INST. 7010 P. 0. # 50138 6220 CULEBRA RD P. 0. DRAWER 28510 SAN ANTONIO TX 78284 FRÄSER MCMASTER
REPORT DATE: 11/17/97
JOB NO:
DESCR 2014-T6511 ALUMINUM EXTRUSION
LAB NO: 1110-076 / 07 ==ss=sssssraxss:=
SAMPLE TA-3
MECHANICAL TESTING RESULTS
THKNS: . 127 WIDTH: . 506 YIELD STRENGTH: lbs 3,990. ULT STRENGTH: lbs 4, 171. ELONG ON 2. 00 IN. .22
AREA: YIELD STRENGTH psi : TENSILE psi : ELONGATION V. : REDUCTION OF AREA X
.064: 62,090 64,906
11.00 33.37
fIELD STRENGTH BY EXTENSOMETER 0. 2% OFFSET
TEST METHODS: ASTM B557 ;
MODULUS OF ELASTICITY - 11,034,000 PSI
PAGE 7 OF
THIS REPORT SHALL NOT BE REPRODUCED/EXCEPT/IN FULL, WITHOUT THE WRITTEN APPROVAL OF THE/CHARLES C. KAWIN CO.
Gl-8
Fracture Toughness Tests
4 tests: FC-1 to -4
Gl-9

<
I- Q
o v.
"5 LL.
o q d o
o q d CO
o q d CO
o q d
E s_» +-• c (D E <D Ü
_GJ Q. O
T>
Q o Ü
O q d CM
1 1 1 1 .1 1 1 ^y. o
o o O CO
o CD
o o c CM C
D d 1- o O
(sdj>|)
o
peon
o c D
Gl-10

***** KIc DIGITAL DATA ANALYZER ***** Version 3.0
TEST: Fairchild PROJ: 06-8520 SPEC: fcl]
SPECIMEN/MATERIAL PROPERTIES: Width W
Thickness B Crack Length
Youngs Modulus Yield Strength
2.001 xn .121 in
1.019 in 11.000 10*3 ksi 60.700 ksi
I/O PARAMETERS: Analysis File = fcl.txt : Data/Plot File = fcl.asc ■ Input Data File = fcl.dat
Header = 3 rows Data = 2 cols
LOAD: Col 1 with .200 kips/volt CMOD: Col 2 with 10.000 mil/volt and Offset .37 mil
= INPUT DATA SCAN ===
Total Points = 3502 Pmax = .958 kips imax Pmean = .494 kips Pmin = .000 kips imin
CMODmax = 99.883 mil CMODmean = 26.279 mil CMODmin = .273 mil
=== LINEARITY SUMMARY ===
Offset based on 20.0%-40.0% slope Compliance = 48.624 mil/kip Stan. Dev. = .02022
3479
3
SEC ; Pt Range # PTS % LOAD StD SL OFF % 1 3107 -3479 373 90.0 - 100.0 .71673 247.5 2 3020 -3380 361 87.5 - 97.5 .50598 164.7 3 2931 -3288 358 85.0 - 95.0 .32137 109.2 4 2842 -3199 358 82.5 - 92.5 .15681 74.7 5 2753 -3107 355 80.0 - 90.0 .10095 57.8 6 2663 -3020 358 77.5 - 87.5 .05437 48.9 7 2573 -2931 359 75.0 - 85.0 .02703 45.5 8 2483 -2842 360 72.5 - 82.5 .02567 45.8 9 2392 -2753 362 70.0 - 80.0 .03266 44.0
10 2307 -2663 357 67.5 - 77.5 .02993 41.6 11 2217 -2573 357 64.9 - 75.0 .02578 38.7 12 2131 -2483 353 62.5 - 72.5 .02849 38.1 13 2041 -2392 352 60.0 - 70.0 .03847 38.7 14 1952 -2307 356 57.5 - 67.5 .07515 34.1 15 1863 -2217 355 55.0 - 64.9 .08702 25.6 16 1773 -2131 359 52.5 - 62.5 .03512 17.4
Gl-11

17 1684 -2041 358 50.0 - 60.0 .02281 14.5 18 1593 -1952 360 47.5 - 57.5 .02499 11.9 19 1506 -1863 358 45.0 - 55.0 .02599 9.3 20 1418 -1773 356 42.5 - 52.5 .02230 6.7 21 1328 -1684 357 40.0 - 50.0 .02076 4.9 22 1240 -1593 354 37.5 - 47.5 .01556 3.5 23 1153 -1506 354 35.0 - 45.0 .01509 2.5 24 1067 -1418 352" 32.5 - 42.5 .01410 1.7 25 979 -1328 350 30.0 - 40.0 .01409 1.1 26 893 -1240 348 27.5 - 37.5 .01483 .5 27 804 -1153 350 25.0 - 35.0 .01472 -.1 28 717 -1067 351 22.5 - 32.5 .01460 -.6 29 630 - 979 350 20.0 - 30.0 .01458 -1.0 30 544 - 893 350 17.5 -. 27.5 .01438 -1.5 31 461 - 804 344 15.0 - 25.0 .01506 -2.2 32 379 - 717 339 12.5 - 22.5 .01728 -3.5 33 295 - 630 336 10.0 - 20.0 .01533 -4.7 34 219 - 544 326 7.5 ■- 17.5 .01378 -5.6 35 140 - 461 322 5.0 - 15.0 .01361 -5.8 36 71 - 379 309 2.4 - 12.5 .01732 -6.6
=== LINEAR P-CMOD ANALYSIS ===
Range = 20.0 to 40.0 (% of Pmax) .191 to .383 (kips)
= 630 to 1328 (points)
Compliance = 48.624 mil/kip Intercept = -.475 mil Coef Var = .72
Predicted Crack Length (in): Modulus 0.9E E LIE 1.2E ACTUAL 1.019
PREDICTED 1.028 1.074 1.113 1.148 PRED:ACT 1.009 1.054 1.092 1.127
=== TOUGHNESS ANALYSIS ===
Pmax = .958 kips Line Fit:
slope = .02057 kips/mil intercept = .00977 kips
P5 = .609 kips Pq = .609 kips Kq - 35.380 ksi-in~0.5
STATUS:
Crack Length OK Thickness INVALID (too thin) Pmax:Pq Ratio INVALID Pmax/Pq= 1.572160
Gl-12

<
I-
T3N
O
"cö LL
o o d o
o o d 00
w
o o ♦^
o c CO CD
E CD u at Q.
o « o •o o Q
Ü
o o d CM
o CM
O 0)
O CD
O CO
O O
o d o d
(sdi>|) pBoi
Gl-13

***** KIC DIGITAL DATA ANALYZER ***** Version 3.0
TEST: fAIRCHILD PROJ: 06-8520 SPEC: FC2
SPECIMEN/MATERIAL PROPERTIES: Width W - 1.998 in
Thickness B = .123 in Crack Length = .990 in
Youngs Modulus = 11.000 10*3 ksi Yield Strength = 60.700 ksi
I/O PARAMETERS: Analysis File = FC2.TXT Data/Plot File « FC2.ASC Input Data File = FC2.DAT
Header =3 rows Data - 2 cols
LOAD: Col 1 with 200 kips/volt CMOD: Col 2 with 10.000 mil/volt and Offset = .57 mil
== INPUT DATA SCAN ===
Total Points = 3592 Pmax = 1.040 kips imax Pmean = .496 kips Pmin = .004 kips imin
CMODmax = 100.563 mil CMODmean = 25.924 mil CMODmin = 1.515 mil
=== LINEARITY SUMMARY =—
Offset based on 10.0%-50.0% slope Compliance = 45.141 mil/kip Stan. Dev. = .06371
3572
216
SEG Pt Range # PTS % LOAD StD SL OFF % 1 3218 -3572 355 90.0 - 100.0 1.52103 276.1 2 3134 -3473 340 87.5 - 97.5 .38387 162.0 3 3050 -3384 335 85.0 - 95.0 .17129 127.1 4 2968 -3300 333 82.5 - 92.5 .10325 108.9 5 2884 -3218 335 80.0 - 90.0 .13883 93.3 6 2801 -3134 334 77.5 - 87.5 .11239 79.1 7 2717 -3050 334 75.1 - 85.0 .06662 66.2 8 2634 -2968 335 72.6 - 82.5 .07659 57.6 9 2551 -2884 334 70.1 - 80.0 .03619 51.7
10 2468 -2801 334 67.6 - 77.5 .05242 47.8 11 2384 -2717 334 65.1 - 75.1 .06766 42.6 12 2302 -2634 333 62.6 - 72.6 .05851 35.3 13 2217 -2551 335 60.1 - 70.1 .03468 30.7 14 2134 -2468 335 57.6 - 67.6 .05790 24.9 15 2052 -2384 333 55.1 - 65.1 .07628 16.7 16 1969 -2302 334 52.6 - 62.6 .05721 8.2
Gl-14

17 1888 -2217 330 50.2 - 60.1 .02388 4.4 18 1802 -2134 333 47.7 - 57.6 .01928 4.5 19 1720 -2052 333 45.2 - 55.1 .01523 5.6 20 1638 -1969 332 42.7 - 52.6 .01528 5.7 21 1554 -1888 335 40.2 - 50.2 .01662 4.4 22 1469 -1802 334 37.7 - 47.7 .01623 3.3 23 1387 -1720 334 35.2 - 45.2 .01415 2.4 24 1303 -1638 336' 32.7 - 42.7 .01504 1.6 25 1221 -1554 334 30.2 - 40.2 .01567 .6 26 1138 -1469 332 27.7 - 37.7 .01346 -.1 27 1054 -1387 334 25.3 - 35.2 .01380 -.4 28 971 -1303 333 22.7 - 32.7 .01493 -.8 29 888 -1221 334 20.3 - 30.2 .01372 -1.1 30 804 -1138 335 17.8 - 27.7 .01359 -1.4 31 722 -1054 333 15.3 - 25.3 .01405 -1.8 32 637 - 971 335 12.8 - 22.7 .01393 -2.4 33 555 - 888 334 10.3 - 20.3 .01368 -2.6 34 472 - 804 333 7.8 - 17.8 .01432 -2.6 35 400 - 722 323 5.3 - 15.3 .01493 -2.7 36 306 - 637 332 2.8 - 12.8 .01917 -3.9
=== LINEAR P-CMOD ANALYSIS ===
Range = 10.0 to 50.0 (% of Pmax) .104 to .520 (kips)
= 543 to 1882 (points)
Compliance = 45.141 mil/kip Intercept = .958 mil Coef Var =1.52
Predicted Crack Length (in): Modulus 0.9E E LIE 1.2E ACTUAL .990
PREDICTED 1.001 1.047 1.088 1.123 PRED:ACT 1.011 1.058 1.099 1.135
=== TOUGHNESS ANALYSIS ===
Pmax = 1.040 kips Line Fit:
slope = .02215 kips/mil intercept = -.02122 kips
P5 = .725 kips Pq = .725 kips Kq = 39.742 ksi-inÄ0.5
STATUS:
Crack Length Thickness Pmax:Pq Ratio
INVALID (too short) INVALID (too thin) INVALID Pmax/Pq= 1.434481
Gl-15

<
I- Q T3
ü
"cö LL.
CO ü LL
O q d o
o q d 00
o o d CD
o q d
O O d CM
w
c CD E CD ü
Q. •S2
a o ü
o CM
O o CD
O co
o o
o d o
(sdpO puoi
Gl-16

***** Klc DIGITAL DATA ANALYZER ***** Version 3.0
TEST: Fairchild PROJ: 06-8520 SPEC: fc4
SPECIMEN/MATERIAL PROPERTIES: Width W = 1.996 in
Thickness B = .121 in Crack Length = .978 in
Yoüngs Modulus - 11.000 10*3 ksi Yield Strength = 60.700 ksi
I/O PARAMETERS: Analysis File = fc4.txt Data/Plot File = fc4.asc Input Data File = fc4.dat
Header = 3 rows Data = 2 cols
LOAD: Col 1 with ,200 kips/volt CMOD: Col 2 with 10.000 mil/volt and Offset = .52 mil
===== INPUT DATA SCAN ==
Total Points Pmax
■Pmean Pmin
CMODmax CMODmean CMODmin
3734 1.055 kips .489 kips .008 kips
100.517 mil 24.288 mil
.651 mil
imax = 3720
lmin 265
== LINEARITY SUMMARY ===
Offset-based on 10.0%-50.0% slope Compliance = 44.994 mil/kip Stan. Dev. = .06466
SEG Pt Range # PTS % LOAD StD SL OFF '• 1 3362 -3720 359 90.0 - 100.0 2.13790 275.3 2 3284 -3617 334 87.5 - 97.5 .22909 144.7 3 3194 -3530 337 85.1 - 95.0 .34981 155.7 4 3110 -3447 338 82.6 - 92.5 .38573 151.4 5 3025 -3362 338 80.2 - 90.0 .53876 125.1 6 2941 -3284 344 77.7 - 87.5 .27335 74.6 7 2858 -3194 337 75.2 - 85.1 .06848 54.9 8 2773 -3110 338 72.7 - 82.6 .04269 47.9 9 2690 -3025 336 70.2 - 80.2 .04108 42.6
10 2606 -2941 336 67.8 - 77.7 .04648 37.1 11 2523 -2858 336 65.3 - 75.2 .03866 35.0 12 2438 -2773 336 62.8 - 72.7 .04204 32.7
13 2353 -2690 338 60.3 - 70.2 .08245 27.2 14 2269 -2606 338 57.8 - 67.8 .08282 17.2
15 2186 -2523 338 55.3 - 65.3 .03813 9.5
16 2101 -2438 338 52.8 - 62.8 .01666 7.1
Gl-17

17 2017 -2353 337 50.3 - 60.3 .01670 7.4 18 1933 -2269 337 47.9 - 57.8 .01585 7.6 19 1848 -2186 339 45.4 - 55.3 .01711 6.7 20 1767 -2101 335 42.9 - 52.8 .01592 5.3 21 1681 -2017 337 40.4 - 50.3 .01472 4.2 22 1597 -1933 337 37.9 - 47.9 .01452 3.3 23 1512 -1848 337 35.5 - 45.4 .01385 2.4 24 1428 -1767 340* 33.0 - 42.9 .01450 1.5 25 1345 -1681 337 30.5 - 40.4 .01466 .8 26 1262 -1597 336 28.0 - 37.9 .01385 .3 27 1177 -1512 336 25.6 - 35.5 .01390 -.2 28 1092 -1428 337 23.0 - 33.0 .01315 -.6 29 1008 -1345 338 20.6 - 30.5 .01269 -.9 30 926 -1262 337 18.1 - 28.0 .01357 -1.3 31 842 -1177 336 15.7 - 25.6 .01448 -1.9 32 757 -1092 336 13.1 - 23.0 .01442 -2.5 33 673 -1008 336 10.7 - 20.6 .01459 -2.9 34 589 - 926 338 8.2 - 18.1 .01561 -3.5 35 507 - 842 336 5.7 - 15.7 .01517 -4.3 36 422 - 757 336 3.2 - 13.1 .01574 -5.0
== LINEAR P-CMOD ANALYSIS ===
Range = 10.0 to 50.0 (% of Pmax) .105 to .527 (kips)
= 650 to 2004 (points)
Compliance = 44.994 mil/kip Intercept = -.162 mil Coef Var =2.14
Predicted Crack Length (in): Modulus 0.9E E 1.1E 1.2E ACTUAL .978
PREDICTED .991 1.038 1.078 1.114 PRED:ACT 1.013 1.061 1.103 1.139
=== TOUGHNESS ANALYSIS =
Pmax = 1.055 kips Line Fit:
slope = .02223 kips/mil intercept — .00360 kips
P5 - .742 kips Pq = .742 kips Kq = 40.645 ksi-inA0.5
STATUS:
Crack Length Thickness Pmax:Pq Ratio
INVALID (too short) INVALID (too thin) INVALID Pmax/Pq= 1.422361
Gl-18

<
Q
= £ o 1—
"cö
o q d o
o o d 00
CO
o o
c +•"
o c CO <D
E © o CJ CL
o (0 o "O o n "fr O
Ü
o o d
o CM
o o CO
o CO
o o o d o d
(sdi>|) pucq
Gl-19

***** KIc DIGITAL DATA ANALYZER ***** Version 3.0
TEST: Fairchild PROJ: 06-8520 SPEC: fc3
SPECIMEN/MATERIAL PROPERTIES: Width W = 1.997 in
Thickness B = .121 in Crack Length = .988 in
Youngs Modulus = 11.000 10*3 ksi Yield Strength = 60.700 ksi
I/O PARAMETERS: Analysis File = fc3.txt Data/Plot File * fc3.asc Input Data File = fc3.dat
Header = 3 rows Data « 2 cols
LOAD: Col 1 With 200 kips/volt CMOD: Col 2 with 10.000 mil/volt and Offset = -10.25 mil
—= INPUT DATA SCAN ==
Total Points = 3504 Pmax = 1.020 kips imax Pmean = .488 kips Pmin = .009 kips imin
CMODmax = 88.929 mil CMODmean = 22.285 mil CMODmin = -.005 mil
== LINEARITY SUMMARY ===
Offset based on 5.0%-55.0% slope Compliance = 43.566 mil/kip Stan. Dev. = .02913
3473
219
SEG Pt Range # PTS % LOAD StD SL OFF 1 3142 -3473 332 90.1 - 100.0 1.53316 240.1 2 3059 -3402 344 87.6 - 97.5 .61249 103.3 3 2980 -3305 326 85.1 - 95.0 .06718 68.6 4 2898 -3221 324 82.6 - 92.5 .04025 62.9 5 2817 -3142 326 80.2 - 90.1 .02531 59.3 6 2735 -3059 325 77.7 - 87.6 .04159 56.8 7 2653 -2980 328 75.2 - 85.1 .04664 54.4 8 2572 -2898 327 72.7 - 82.6 .07425 48.9 9 2491 -2817 327 70.2 - 80.2 .11206 37.6
10 2411 -2735 325 67.7 - 77.7 .10495 24.7 11 2330 -2653 324 65.3 - 75.2 .03600 14.6 12 2251 -2572 322 62.8 - 72.7 .02184 11.7 13 2168 -2491 324 60.3 - 70.2 .01632 11.0 14 2087 -2411 325 57.9 - 67.7 .01627 11.0 15 2006 -2330 325 55.3 - 65.3 .01793 10.2 16 1924 -2251 328 52.9 - 62.8 .01690 8.6
Gl-20

17 1842 -2168 327 50.4 - 60.3 .01906 7.0 18 1762 -2087 326 47.9 - 57.9 .01894 5.2 19 1681 -2006 326 45.5 - 55.3 .01689 3.6 20 1600 -1924 325 43.0 - 52.9 .01729 1.8 21 1518 -1842 325 40.5 - 50.4 .02136 -.4 22 1436 T-1762 327 38.0 - 47.9 .01788 -2.5 23 1356 -1681 326 35.5 - 45.5 .01826 -2.5 24 1275 -1600 326 33.1 - 43.0 .02105 -1.0 25 1192 -1518 327 30.6 - 40.5 .01403 .5 26 1111 -1436 326 28.1 - 38.0 .01356 .3 27 1031 -1356 326 25.6 - 35.5 .01330 .0 28 949 -1275 327 23.2 - 33.1 .01359 .0 29 870 -1192 323 20.7 - 30.6 .01351 .4 30 789 -1111 323 18.2 - 28.1 .01348 .5 31 707 -1031 325 15.7 - 25.6 .01308 .5 32 626 - 949 324 13.2 - 23.2 .01370 .2 33 544 - 870 327 10.7 20.7 .01364 .0 34 464 - 789 326 8.3 .- 18.2 .01425 .1 35 381 - 707 327 5.7 - 15.7 .01419 .4 36 302 -. 626 325 3.3 - 13.2 .01897 -.5
=== LINEAR P-CMOD ANALYSIS =
Range = 5.0 to 55.0 (% of Pmax) .051 to .561 (kips)
= 356 to 1993 (points)
Compliance - 43.566 mil/kip Intercept = -.517 mil Coef Var = 1.53
Predicted Crack Length (in): Modulus 0.9E E LIE 1.2E ACTUAL .988
PREDICTED .977 1.024 1.065 1.102 PRED:ACT .989 1.037 1.078 1.115
=== TOUGHNESS ANALYSIS ===
Pmax - 1.020 kips Line Fit:
slope = .02295 kips/mil intercept = .01186 kips
P5 = .787 kips Pq = .787 kips Kq = 43.763 ksi-in"0.5
STATUS:
Crack Length Thickness Pmax:Pq Ratio
INVALID (too short) INVALID (too thin) INVALID Pmax/Pq= 1.295897
Gl-21

Fatigue Crack Growth Tests
11 tests: CC-lto-2 C(T) CM-1 to -3 M(T) CE-lto-6 ESE(T)
Gl-22

1e-3 2014-T6511 (R-ratio = -0.2)
■ CM-1 (K-grad = ±3.50) • CM-2 (K-grad = ±3.50) A CM-3 (K-grad = ±3.50)
A
1e-4 i
^ 1e-5 © 13 >» u
z
1e-6
A A
A A
A K™
A
K.
£ /f
A
1e-7
1e-8 10
AK (ksWin)
50
Gl-23

10-
10^
2014-T6511 (R-ratio = 0.2) ESE(T) specimens (valid tests)
■ CE-3 (K-grad = ±3.50) • CE-4 (K-grad = ±3.50)
C(T) specimens (invalid data due to non-coplanar crack growth)
A CC-1 (K-grad = +3.50) A
Kmax = Kq
~ 10^ © O >% o
5 10-6
10
10^ -I 1 1 1 1 1 - .y—
10 AK (ksiVin)
50
Gl-24

1e-3
1e-4
^^ 1e-5 : 0) - Ü . >» . u E
■•<«•*
z -a re "0 1e-6 :
.
1e-7
1e-8
2014-T6511 (R-ratio = 0.5)
■ CE-1(K-grad = +3.50) • CE-2(K-grad = ±3.50)
1
max q
v
10
AK (ksh/in)
50
Gl-25

-to-3
2014-T6511 (R-ratio = 0.8) ESE(T> specimens (valid tests)
B CE-5(K-grad = ±3.50) • CE-6(K-grad=±3.50)
10^ A
C(T) specimens (invalid data due to non-coplanar crack growth) CC-2(K-grad = ±3.50)
t ^ 10-5
«) o >» o
z (C
10^
H
KmaX = ^q
10 ■7 .
10^ "i r 1 r-'-i 1—i—r*
10
AK (ksiVin)
50
Gl-26

CO
10 CO +
in CO
in CO +
CM + D o II q
6 ^ CE o
1P"
O o ■
O O UJ CM Q_ IS co CO
CD r: o ^ "* 3 O"« < < ° a, «< 1.
0
;si/i
n
D o <+ < cc a <
1- fc 0
Q X LU
"O ZZL T~ .C CM Ü T-
.b: to co co
LL 1- o 1
tf in < D r T"~ ( i
o < i
D ( 1 i
O l JJ in l U L U
CM « D < D « O < =>
epAo/ipm 'NV/BV
Gl-27

AUTOMATED FATIGUE CRACK GROWTH RATE ANALYSIS
Specimen Id. Contract * Material Temperature (F) Environment
CC1 06-8520 2014-T6511
75 LA
Geometrv Orientation Yield Iksi) Initial A0 (PD) Initial PD
CT LT 60.7 0.534
%1000.00
Specimen Dimensions (in)
Thickness 0.124 Width 2.002 Height 0.000
Notch depth Gase leneth
0.525 0.000
Precrack Parameters
Pmax (lbs) 350.0 Final a (in) 0.584
Stress Kmax
ratio (R) 0.20 10.92
Test Parameters
K-eradient a (in) 0. 584 Ini tial K 10.90 nt -3 .50 Stress ratio (R) 0.20
K Coeff PD Coeff Analvsis Codes 0.886000 0.272840 KRPP 1 0 4.640000 0.488940 13.320000 0.000000 14.720000 0.000000 -5.600000 0.000000 0.000000 0.000000
Visual Observations
PD Crack (PD) Crack (visual) Error PDAF 38.26 0.583 0.584 0.000 0.995 127.74 0.664 0.664 0.000 0.942
Comments
Date of test: 12-12-1997
Gl-28

Soecimen Id. CC1 Pase
Pmax PD a N da d.\: da/dN dK 1 lbs) (1E-6)
38.3
i in)
0.5835
(XI )
6
(in) (XI) (in/cyc' (ksilin
321 54.6 0.5989 13722 0.0333 41236 8.087E-07 8.18 295 74.1 0.6168 41241 0.0356 55111 6.454E-07 7.69 268 93.6
115.2 0.6344 0.6533
68833 111911
0.0364 70670 5.158E-07 7.15
Gl-29
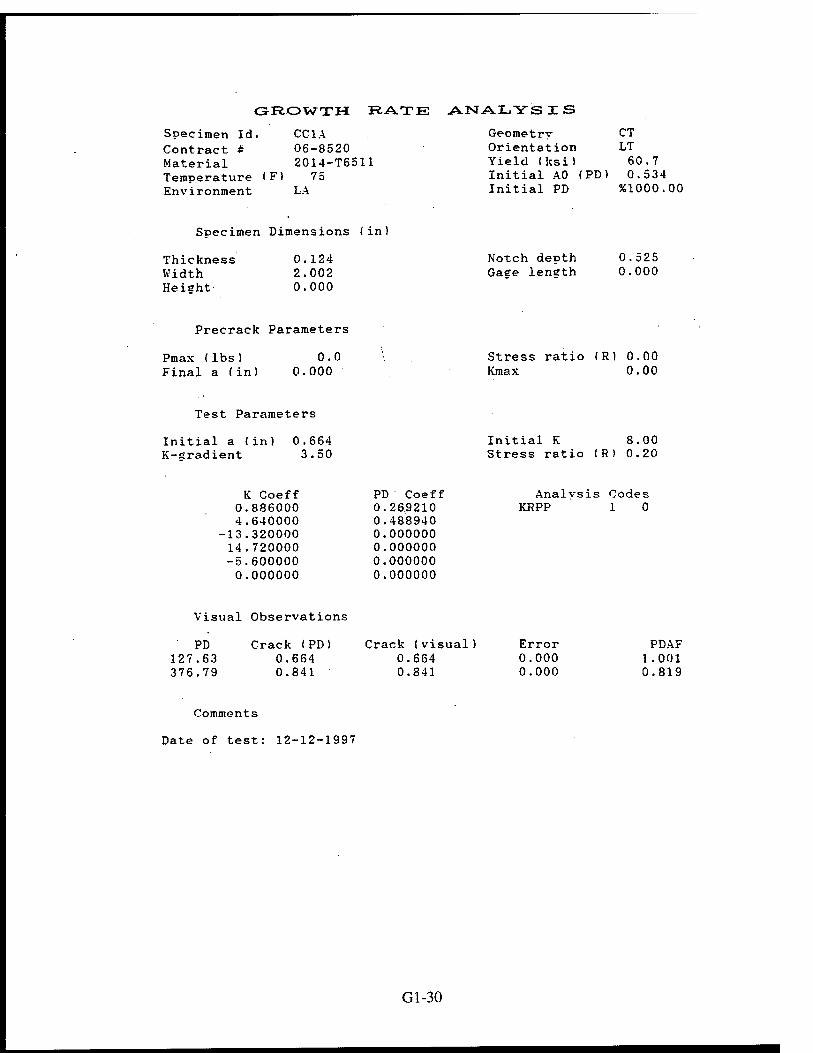
GROWTH RATE ANALYSIS
Geometry CT Orientation LT Yield (ksi) 60.7 Initial A0 (PD ) 0.534 Initial PD %1000.00
Specimen Id. CC1A Contract * 06-8520 Material 2014-T6511 Temperature (Fl 75 Environment LA
Specimen Dimensions (in)
Thickness 0.124 Width 2.002 Heieht 0.000
Notch depth 0.525 Gasre leneth 0.000
Precrack Parameters
Pmax (lbs) 0.0 Final a (in) 0.000
Stress ratio Kmax
(R) 00 00
Test Parameters
Initial a ( in) 0. 664 K-eradient 3 .50
K Coeff PD Coeff 0.886000 0.26.9210 4.640000 0.488940
-13.320000 0.000000 14.720000 0.000000 -5.600000 0.000000 0.000000 0.000000
Initial K 8.00 Stress ratio (R) 0.20
Analysis Codes KRPP 1 0
Visual Observations
PD Crack (PD) Crack (visual) Error 127.63 0.664 0.664 0.000 376.79 0.841 0.841 0.000
PDAF 1.001 0.819
Comments
Date of test: 12-12-1997
Gl-30
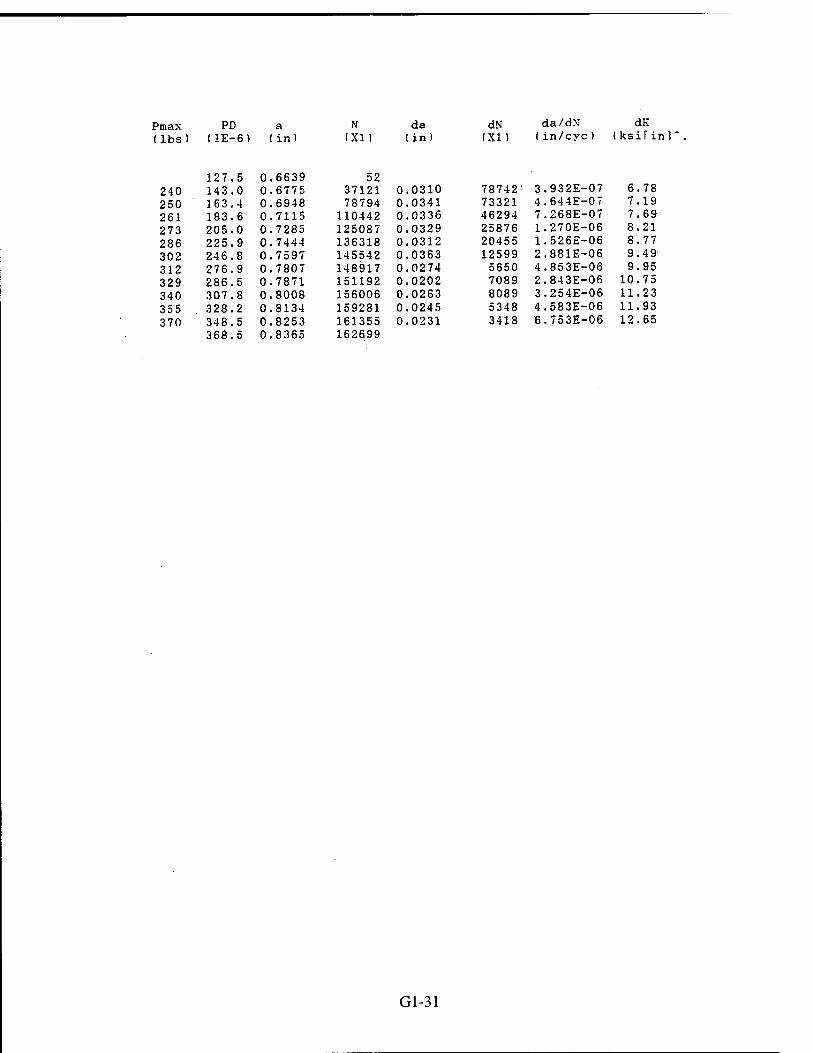
Pmax PD a N da dN da/dNT dK (lbs) I1E-6)
127.5 0
in)
6639
1X1 )
52
in) (XI ) (in/cyc) (ksif inl
240 143.0 0 6775 37121 0 0310 78742' 3.932E-07 6.78
250 163.4 0 6948 78794 0 0341 73321 4.644E-07 7.19
261 183.6 0 7115 110442 0 0336 46294 7.268E-07 7.69
273 205.0 0 7285 125087 0 0329 25876 1.270E-06 8.21
286 225.9 0 7444 136318 0 0312 20455 1.526E-06 8.77
302 246.8 0 7597 145542 0 0363 12599 2.881E-06 9.49
312 276.9 0 7807 148917 0 0274 5650 4.853E-06 9.95
329 286.5 0 7871 151192 0 0202 7089 2.843E-06 10.75
340 307.8 0 8008 156006 0 .0263 8089 3.254E-06 11.23
355 328.2 0 8134 159281 0 0245 5348 4.583E-06 11.93 370 348.5
368.5 0 0
8253 8365
161355 162699
0 0231 3418 6.753E-06 12.65
Gl-31

AUTOMATED FATIGUE CRACK GROWTH RATE ANALYSIS
Specimen Id. CC1B Contract # 06-8520 Material 2014-T6511 Temperature (F) 75 Environment LA
Geometry CT Orientation LT yield (ksi) 60.7 Initial A0 (PD) 0.534 Initial PD %1000.00
Specimen Dimensions (in)
Thickness 0.124 Width . 2.002 Height 0.000
Notch depth Gage length
0.525 0.000
Precrack Parameters
Pmax (lbs) Final a (in)
0.0 0.000
Stress ratio (R) 0.00 Kmax 0.00
Test Parameters
Initial a (in) 0.841 K-gradient -3.50
Initial K 18.80 Stress ratio (R) 0.20
K Coeff 0.886000 4.640000
-13.320000 14.720000 -5.600000 0.000000
PD Coeff 0.228800 0.491630 0.000000 0.000000 0.000000 0.000000
Analysis Codes KRPP 1 0
Visual Observations
PD 393.45 662.40
Crack (PD) 0.841 1.048
Crack (visual) 0.841 1.048
Error 0.000 0.000
PDAF 0.989 0.905
Comments
Date of test: 12-15-1997
Gl-32

Pmax (lbs)
387 357 324 293 268 241 219 198 180 162 147 131
PD (1E-6)
393.4 407.2 429.5 449.5 467.5 489.4 508.7 529.3 549.8 569.9 587.8 609.8 629.0 652.5
(in)
0.8410 0.8527 0.8714 0.8878 0.9024 0.9199 0.9352 0.9511 0.9667 0.9818 0.9950 1.0110 1.0247 1.0412
N (XI) (in)
da dN da/dN dK (XI) (in/cyc) (ksi[in]".5)
12 1013 2409 3522 5006 7316
10378 15391 21689 31007 52305 80858 125171 177779
0.0304 0.0351 0.0310 0.0321 0.0328 0.0312 0.0315 0.0307 0.0283 0.0292 0.0297 0.0301
2397 2510 2597 3794 5372 8074 11311 15616 30616 49852 72866 96920
1.267E-05 1.398E-05 1.196E-05 8.473E-06 6.097E-06 3.863E-06 2.789E-06 1.965E-06 9.249E-07 5.865E-07 4.076E-07 3.111E-07
13.79 12.97 12.04 11.14 10.39 9.60 8.90 8.24 7.65 7.05 6.56 5.99
Gl-33

AUTOMATED FATIGUE CRACK GROWTH RATE ANALYSIS
Specimen Id, Contract # Material Temperature Environment
(F)
CC1C 06-8520 2014-T6511
75 LA
Geometrv CT Orientation LT Yield (ksi) 60 .7 Initial A0 (PD) 0. 534 Initial PD %1000. 00
Suecimen Dimensions (in)
Thickness Width Height
,124 ,002 ,000
Notch depth 0.525 Gage length 0.000
Precrack Parameters
Pmax (lbs ) Final a (in)
0.0 0.000
Stress ratio (R) 0.00 Kmax 0.00
Test Parameters
Initial a (in) 1.048 K-gradient 3.50
Initial K 7.40 Stress ratio (R) 0.20
K Coeff 0.886000 4.640000
-13.320000 14.720000 -5.600000 0.000000
PD Coeff 0.202560 0.488940 0.000000 0.000000 0.000000 0.000000
Analysis Codes KRPP 1 0
Visual Observations
PD Crack (PD) Crack (visual) Error PDAF 657.49 1.048 1 048 0.000 0.998 924.94 1.273 1 273 0.000 0.959
Comments
Date of test: 12-14-1997
Gl-34

Specimen Id. CC1C Paee
Pma:: (lbs)
PD (lE-e
a (in)
N da dN da/dN: dK (XI) (in) (XI) (in/cyc) (ksifinF.5
129 134 139 144 149 153 159 163 169 174 179 183 188 192
657 672 689 713 735 754 772 790 817.0 836.3 857.5 876 897 917 938 950
0480 0608 0762 0969 1155 1317 1472 1625 1849 2010 2186 2338 2512 2676 2858 2973
o 19488 43451 59936 67109 76950 84612 94576
103980 107183 110235 112847 114633 116220 117530 118036
0.0282 0.0361 0.0393 0.0348 0.0317 .0308 ,0377 .0385 .0336 .0328 .0327 .0337 .0346 .0298
0. 0. 0. 0. 0. 0. 0. 0. 0.
43446 40448 23657 17014 17503 17626 19369 12608 6255 5664 4398 3373 2896 1816
6.501E-07 8.923E-07 .661E-06 .047E-06 .810E-06 746E-06 .948E-06 .053E-06 ,373E-06 ■791E-06
7.434E-06 1.001E-05 1.193E-05 1.641E-05
25 65 09 59
8.09 8.58
20 75
10.50 11.13 11.87 12.58 13.41 14.08
Gl-35

in CO CO
+ 10
CO*
to CO* +
CM Ü o o CM
00 . a
o I!
CC
+ D
Ü LU Q-
< GC
5 x LU
!E CM ü T- ±1 LO as co
i
o CM
LL
'. .
3t*
"3- o UJ o
o o
o ^ • w O X.
in o ill o
CO o LU O
o LU O
CO o UJ o
epÄo/uoiM 'NV/BV
Gl-36

AUTOMATED FATIGUE CRACK GROWTH RATE ANALYSIS
Specimen Id. CC2 Contract # 06-8520 Material 2014-T6511 Temperature (F) 75 Environment LA
Geometry CT Orientation LT Yield (ksi) 60.7 Initial A0 (PD) 0.553 Initial PD %1000.00
Specimen Dimensions (in)
Thickness Width Height
0.124 1.995 0.000
Notch depth Gage length
0.518 0.000
Precrack Parameters
Pmax (lbs) Final a (in)
500.0 0.614
Stress ratio (R) 0.80 Kmax 16.42
Test Parameters
Initial a (in) 0.614 K-gradient -3.50
Initial K 16.40 Stress ratio (R) 0.80
K Coeff 0.886000 4.640000
-13.320000 14.720000 -5.600000
0.000000
PD Coeff 0.282770 0.490560 0.000000 0.000000 0.000000 0.000000
Analysis Codes KRPP 1 0
Visual Observations
PD Crack (PD) Crack (visual) Error PDAF 50.94 0.632 0.632 0.000 1.357
130.54 0.680 0.680 0.000 0.907
Comments
Date of test: 12-16-1997
Gl-37

Specimen Dd. 0C2
Pmax PD a (]bs) (1E-6) (in)
N (XI)
da (in)
d] (XI)
50.9 0.6318 459 66.1 0.6464 422 86.5 0.6620 393 107.1 0.6731
116.9 0.6767 •
9 78443
201484 399923 518864
0.0302 0.0267 0.0147
201476 321480 317380
Page 1
r da/dN dK (in/cyc) (ksi£in]~.5)
1.501E-07 3.15 8.298E-08 2.94 4.642E-08 2.77
Gl-38

AUTOMATED FATIGUE CRACK GROWTH RATE ANALYSIS
Specimen Id. CC2A Contract # 06-8520 Material 2014-T6511 Temperature (F) 75 Environment LA
Geometry CT Orientation LT Yield (ksi) 60.7 Initial A0 (PD) 0.553 Initial PD %1000.00
Specimen Dimensions (in)
Thickness 0.124 Width 1.995 Height 0.000
Notch depth Gage length
0.518 0.000
Precrack Parameters
Pmax (lbs) Final a (in)
500.0 0.614
Stress Kmax
ratio (R) 0.80 16.42
Test Parameters
Initial a.(in) 0.680 K-gradient 3.50
K Coeff PD Coeff 0.886000 0.276820 4.640000 0.490560
-13.320000 0.000000 14.720000 0.000000 -5.600000 0.000000
0.000000 0.000000
Initial K 12.50 Stress ratio (R) 0.80
Analysis Codes KRPP 1 0
Visual Observations
PD Crack (PD) Crack (visual) Error PDAF 131.37 0.680 0.680 0.000 0.994 333.77 0.788 0.789 0.000 0.723
Comments
Date of test: 12-17-1997
Gl-39

Specimen Id. CC2A Page
Pmax PD a N da dN da/dN Obs) (1E-6) (in) (XI) (in) • (XI) (in/cyc) (ksifin]
131.4 0.6800 33 364 143.7 0.6896 146929 0.0265 312882 8.468E-08 2.65 377 166.5 0.7065 312915 0.0308 345515 8.920E-08 2.78 395 187.0 0.7205 492444 0.0270 322234 8.380E-08 2.97 413 207.7 0.7335 635149 0.0245 261307 9.361E-08 3.16 431 227.6 0.7449 753752 0.0223 226967 9.842E-08 3.35 450 248.5 0.7558 862116 0.0205 200374 1.022E-07 3.55 471 268.9 0.7654 954126 0.0181 188106 9.629E-08 3.76 492 289.6 0.7739 1050222 0.0161 158383 1.015E-07 3.97 508 310.5
320.6 0.7815 0.7847
1112509 1146566
0.0108 96344 1.118E-07 4.13
dK
Gl-40

AUTOMATED FATIGUE CRACK GROWTH RATE ANALYSIS
Specimen Id. CC2B Geometry CT Contract # 06-8520 Orientation LT Material 2014-T6511 Yield (ksi) 60.7 Temperature (F) 75 Initial A0 (PD) 0.553 Environment LA Initial PD %1000.00
Specimen Dimensions (in)
Thickness Width Height
0.124 1.995 0.000
Notch depth Gage length
0.518 0.000
Precrack Parameters
Pmax (lbs) Final a (in)
500.0 0.614
Stress ratio (R) 0.80 Kmax 16.42
Test Parameters
Initial a (in) 0.789 K-gradient -3.50
K Coeff PD Coeff 0.886000 0.227670 4.640000 0.490560
-13.320000 0.000000 14.720000 0.000000 -5.600000 0.000000
0.000000 0.000000
Initial K 25.00 Stress ratio (R) 0.80
Analysis Codes KRPP 1 0
Visual Observations
PD Crack (PD) Crack (visual) Error PI 339.13 0.788 0.789 0.000 1.007 541.49 0.902 0.902 0.000 0.846
Comments
Date of test: 12-18-1997
Gl-41

Specimen id. CC2ß Page
Pmax PD a N da dfl da/dN Obs) (1E-6) (in) (XI) (in) (XI) (in/cyc) (ksi[an]
339.7 0.7889 86 563 354.1 0.7991 26913 0.0246 56864 4.325E-07 4.72 519 375.2 0.8135 56949 0.0273 84182 3.239E-07 4.42 471 395.1 0.8264 111095 0.0254 112192 2.266E-07 4.08 428 415.3 0.8389 • 169142 0.0247 130720 1.886E-07 3.77 388 436.0 0.8511 241815 0.0232 139951 1.655E-07 3.48 352 455.9 0.8621 309093 0.0218 141648 1.536E-07 3.20 319 476.4 0.8728 383463 0.0207 170920 1.211E-07 2.95 290 496.7 0.8828 480013 0.0192 212994 9.015E-08 2.71 269 516.8
527.4 0.8920 0.8966
596458 658294
0.0138 178282 7.768E-08 2.54
dK
Gl-42

AUTOMATED FATIGUE CRACK GROWTH RATE ANALYSIS
Specimen Id. CC2C Contract # 06-8520 Material 2014-T6511 Temperature (F) 75 Environment LA
Geometry CT Orientation LT Yield (ksi) 60.7 Initial A0 (PD) 0.553 Initial PD %1000.00
Specimen Dimensions (in)
Thickness Width Height
0.124 1.995 0.000
Notch depth 0.518 Gage length 0.000
Precrack Parameters
Pmax (lbs) Final a (in)
500.0 0.614
Stress ratio (R) 0.80 Kmax 16.42
Test Parameters
Initial a (in) 0.902 K-gradient 3.50
Initial K 12.50 Stress ratio (R) 0.80
K Coeff 0.886000 4.640000
-13.320000 14.720000 -5.600000
0.000000
PD Coeff 0.185250 0.490560 0.000000 0.000000 0.000000 0.000000
Analysis Codes KRPP 1 0
Visual Observations
PD Crack (PD) Crack (visual) Error PDAF 541.26 0.902 0.902 0.000 1.006 795.97 0.967 0.967 0.000 0.768
Comments
Date of test: 12-18-1997
Gl-43

specimen xu. cuzc Fage
Praax PD a N da dii [ da/dN (Jbs) (1E-6) (in) (XI) (in) (XI) (in/cyc) (ksi[in]
541.8 0.9027 17 267 556.4 0.9097 43485 0.0154 110626 1.394E-07 2.60 277 575.5 0.9182 110643 0.0171 122202 1.396E-07 2.73 288 596.6 0.9267 165687 0.0155 98782 1.571E-07 2.86 304 615.4 0.9337 ■ 209425 0.0184 63786 2.888E-07 3.07 312 651.2 0.9451 229473 0.0136 29696 4.567E-07 3.17 329 658.7 0.9472 239121 0.0071 34078 2.083E-07 3.38 338 678.3 0.9522 263551 0.0098 35314 2.776E-07 3.50 350 700.4 0.9570 274435 0.0081 29020 2.793E-07 3.64 364 718.8 0.9603 292571 0.0062 29302 2.111E-07 3.81 376 738.7 0.9632 303737 0.0049 22863 2.159E-07 3.95 388 757.4 0.9653 315434 0.0034 20272 1.659E-07 4.09 399 774.5
788.3 0.9666 0.9673
324009 327341
0.0020 11907 1.660E-07 4.21
dK
Gl-44

■
o I
II I— DC 4^
o ■
O o CM LU
00 co CO H O o
< oc 1- H- Q X "TS LU
Ü
"c5 U-
C\l T—
in CD
■
T— o CM
o
o
in CO
+
in cö +
in CO
in CO +
D
fc_ «1+ o
o o
*<ft* f". < J°c
in o
i in o
CO o LU o
O
UJ O
CO O
• UJ o
epAo/upm 'NV/BV
Gl-45

AUTOMATED FATIGUE CRACK GROWTH RATE ANALYSIS
Specimen Id. CMl Geometry MT Contract # 06-8520 Orientation LT Material 2014-T6511 Yield (ksi) 60.7 Temperature (F) 75 Initial A0 (PD) 0.364 Environment LA Initial PD %1000.00
Specimen Dimensions (in)
Thickness 0.114 Width 1.700 Height 0.000
Notch depth Gage length
0.403 0.000
Precrack Parameters
Pmax (lbs) Final a (in)
3300.0 0.459
Stress Kmax
ratio (R)-0.20 10.74
Test Parameters
Initial a (in) 0.459 K-gradient -3.50
Initial K 10.70 Stress ratio (R)-0.20
K Coeff PD Coeff 0.223282 0.578970 0.000000 0.000000 0.000000 0.000000
Analysis Codes KRCP 1 0
Visual Observations
PD Crack (PD) Crack (visual) Error PDAF 80.58 0.454 0.454 0.000 0.936
257.14 0.641 0.641 0.000 1.034
Comments
Date of test: 12-18-1997
Gl-46

Specimen Id. CM1
Pmax PD a (lbs) (1E-6) (in)
N (XI) (in)
da
Page 1
dN da/dN dK (XI) (in/cyc) (ksi[in]Ä.5)
80.6 0.4538 12 3055 94.7 0.4675 4092 0.0303 9287 3.265E-06 10.08 2838 111.5 0.4841 9299 0.0341 11932 2.855E-06 9.55 2624 128.8 0.5016 16024 0.0349 16916 2.061E-06 9.02 2417 145.7 0.5190 26215 0.0364 24558 1.482E-06 8.49 2238 163.9 0.5380 40582 0.0363 36028 1.008E-06 8.03 2062 180.1 0.5553 62243 0.0364 57824 6.286E-07 7.56 1911 197.7 0.5743 98405 0.0379 83507 4.535E-07 7.15 1763 214.8 0.5932 145750 0.0387 103274 3.749E-07 6.75 1632 232.5
249.4 0.6131 0.6323
201679 280766
0.0391 135016 2.899E-07 6.38
Gl-47

AUTOMATED FATIGUE CRACK GROWTH RATE ANALYSIS
Specimen Id. CM1A Geometry MT Contract # 06-8520 Orientation LT Material 2014-T6511 Yield (ksi) 60.7 Temperature (F) 75 Initial A0 (PD) 0.364 Environment LA Initial PD %1000.00
Specimen Dimensions (in)
Thickness 0.114 Width 1.700 Height 0.000
Notch depth Gage length
0.403 0.000
Precrack Parameters
Pmax (lbs) Final a (in)
3300.0 0.459
Stress ratio (R)-0.20 Kmax 10.74
Test Parameters
Initial a (in) 0.641 K-gradient 3.50
Initial K 5.80 Stress ratio (R)-0.20
K Coeff PD Coeff 0.228290 0.578970 0.000000 0.000000 0.000000 0.000000
Analysis Codes KRCP 1 0
Visual Observations
PD Crack (PD) Crack (visual) Error PDAF 257.50 0.641 0.641 0.000 0.999 480.61 0.834 0.834 0.000 0.942
Comments
Date of test 12-19-1997
Gl-48

Specimen Id. CM1A Page 1
Pmax PD a H da dN da/dN (]bs) (1E-6) • (in) (XI) (in) (XI) (in/cyc) (ksi[in]
257.5 0.6413 6 1491 269.9 0.6527 62443 0.0275 134667 2.039E-07 6.11 1545 287.6 0.6688 134673 0.0317 126773 2.501E-07 6.42 1611 305.0 0.6844 189216 0.0312 100539 3.107E-07 6.81 1679 322.5 0.7000 235212 0.0309 73765 4.183E-07 7.22 1750 339.8 0.7152 262981 0.0301 49803 6.036E-07 7.64 1826 356.8 0.7301 285015 0.0302 39666 7.610E-O7 8.10 1907 374.6 0.7454 302647 0.0316 26743 1.180E-06 8.60 1988 393.5 0.7616 311757 0.0305 11826 2.576E-06 9.11 2080 410.4 0.7759 314473 0.0298 4751 6.281E-06 9.69 2159 429.0 0.7915 316509 0.0271 6776 3.992E-06 10.19 2256 442.8 0.8029 321248 0.0261 10684 2.439E-06 10.82 2318 460.6
469.2 0.8175 0.8245
327193 329295
0.0216 8046 2.683E-06 11.23
dK
Gl-49

AJt*.J>P,5ir&tyE:D FATIGUE CRACK GROWTH RATE ANALYSIS
Specimen Id. CM1B Geometry MT Contract # 06-8520 Orientation LT Material 2014-T6511 YieM (ksi) 60.7 Temperature (F) 75 Initial A0 (PD) 0,364 Environment LA Initial PD %1000.00
Specimen Dimensions (in)
Thickness 0.114 Width 1.700 Height 0.000
Notch depth Gage length
0.403 0.000
Precrack Parameters
Pmax (lbs) Final a (in)
3300.0 0.459
Stress ratio (R)-0.20 Kmax 10.74
Test Parameters
Tnitial a (in) 0.834 Initial K 12.50 K-gradient -3.50 Stress ratio (R)-0.20
K Coeff PD Cceff Analysis Codes 0.212230 KRCP 1 0 0.578970 0.000000 0.000000 0.000000 0.000000
Visual Observations
PD 481.21 746.94
Crack (PD) 0.834 1.154
Crack (visual) 0.834 1.155
Error 0.000 0.000
PDAF 0.999 1.080
Comments
Date of test: 12-21-1997
Gl-50

Specimen Id. C M1B P age 1
Pmax PD a N da dN da/dN (lbs) (1E-6) (in) (XI) (in) (XI) (in/cyc) (ksi£in]'
481.2 0.8338 9 2355 494.5 0.8488 1900 0.0343 6242 5.494E-06 11.86 2200 511.4 0.8681 6251 0.0392 10915 3.591E-06 11.28 2037 528.7 0.8879 12815 0.0399 14868 2.684E-06 10.67 1886 545.9 0.9080 21120 0.0402 18936 2.122E-06 10.09 1746 563.1 0.9281 31750 0.0403 24028 1.677E-06 9.54 1616 580.2 0.9483 45148 0.0407 35068 1.161E-06 9.03
1492 597.4 0.9688 66818 0.0425 50239 8.469E-07 8.53
1382 615.7 0.9908 95387 0.0421 59184 7.111E-07 8.08
1278 632.3 1.0109 126003 0.0402 71384 5.625E-07 7.65 1181 648.7 1.0310 166771 0.0425 77524 5.487E-07 7.24 1094 666.9 1.0535 203527 0.0438 92065 4.761E-07 6.87 1010 684.1 1.0748 258836 0.0425 128468 3.308E-07 6.50 932 701.0 1.0960 331995 0.0438 123551 3.544E-07 6.16 862 718.9
736.0 1.1186 1.1404
382387 446847
0.0444 114852 3.866E-07 5.85
dK
Gl-51

AUTOMATED FATIGUE CRACK GROWTH RATE ANALYSIS
Specimen Id. CM1C Geometry MT Contract # 06-8520 Orientation LT Material 2014-T6511 Yield (ksi) 60.7 Temperature (F) 75 Initial A0 (PD) 0.364 Environment LA Initial PD %1000.00
Specimen Dimensions (in)
Thickness 0.114 Width 1.700 Height 0.000
Notch depth 0.403 Gage length 0.000
Precrack Parameters
Pmax (lbs) Final a (in)
3300.0 0.459
Stress ratio (R)-0.20 Kmax 10.74
Test Parameters
Initial a (in) 1.155 Initial K 5.00 K-gradient 3.50 Stress ratio (R)-0.20
K Coeff PD Coeff Analysis Codes 0.246650 KRCP 1 0 0.578970 0.000000 0.000000 0.000000 0.000000
Visual Observations
PD Crack (PD) Crack (visual) Error PDAF 747.19 1.154 1.155 0.000 1.000 814.34 1.192 1.192 0.000 0.964
Comments
Date of test 12-22-1997
Gl-52

Specimen Id. CM1C Page 1
Pmax PD (lbs) (1E-6)
a (in)
N (XI)
da (in)
dN da/dN (XI) (in/cyc) (ksi[in]'
747.2 729 760.0 753 777.8 775 794.6
804.0
1.1545 1.1620 1.1722 1.1814 1.1865
9 76931
162567 233848 260544
0.0177 0.0195 0.0143
162558 1.088E-07 5.23 156917 1.241E-07 5.46
97977 1.463E-07 5.68
dK
Gl-53

CM
in cö
in co"
w CO CO
O i
II CM CL 2> Ü m
o o CM ID
LU CL
CO CO
CO H- O S
< 0C H h- Q X T3 LU
+ o □
Ü
"05 LL
CM
in CO I-
I
o CM
«a- o UJ o
^1
O O
4-0 + a
o ^ . CO
O -ü
<
in o W o
CD o ill o
o 1X1 o
CO o
I
UJ o
epAo/ipin 'NV/ev
Gl-54

AUTOMATED FATlGuE CJRACJtC GROWTH RATE ANALYSIS
Specimen Id. CM2 Contract # 06-8520 Material 2014-T6511 Temperature (F) 75 Environment LA
Geometry MT Orientation LT Yield (ksi) 60.7 Initial A0 (PD) 0.350 Initial PD % 1000.00
Specimen Dimensions (in)
Thickness Width Height
0.105 1.699 0.000
Notch depth 0.405 Gage length 0.000
Precrack Parameters
Pmax (lbs) Final a (in)
3050.0 0.476
Stress ratio (R)-0.20 Kmax 11.00
Test Parameters
Initial a (in) 0.476 K-gradient -3.50
K Coeff PD Coeff 0.208740 0.579310 0.000000 0.000000 0.000000 0.000000
Initial K 11.00 Stress ratio (R)-0.20
Analysis Codes KRCP 1 0
Visual Observations
PD Crack (PD) Crack (visual) Error PDAF 124.13 0.476 0.476 0.000 0.993 307.92 0.654 0.654 0.000 0.987
Comments
Date of test 12-23-1997
Gl-55

Specimen Id. CM2 Page
Pmax PD a H da dN da/dN (lbs) (1E-6) (in) (XI) (in) (XI) (in/cyc) (ksiTin]
125.5 0.4774 287 2825 137.2 0.4887 3761 0.0274 9480 2.894E-06 10.38 2639 153.7 0.5048 9767 0.0332 16269 2.038E-06 9.87 2440 171.3 0.5219 20030 0.0339 24645 1.376E-06 9.31 2255 188.7 0.5387 34412 0.0328 32596 1.007E-06 8.78 2080 205.2 0.5547 52625 0.0332 34098 9.744E-07 8.26 1927 223.0 0.5719 68509 0.0335 48494 6.913E-07 7.80 1777 239.9 0.5882 101119 0.0334 72894 4.582E-07 7.33 1645 257.6 0.6053 141403 0.0336 84285 3.988E-07 6.91 1520 274.7 0.6218 185404 0.0329 94112 3.493E-07 6.51 1433 291.7
300.9 0.6382 0.6471
235516 265354
0.0252 79951 3.155E-07 6.22
dK
Gl-56

AUTOMATED FATIGUE CRACK GROWTH RATE ANALYSIS
Specimen Id. CM2A Geometry MT Contract # 06-8520 Orientation LT Material 2014-T6511 Yield (ksi) 60.7 Temperature (F) 75 Initial A0 (PD) 0.350 Environment LA Initial PD %1000.00
Specimen Dimensions (in)
Thickness 0.105 Width 1.699 Height 0.000
Notch depth 0.405 Gage length 0.000
Precrack Parameters
Pmax (lbs) Final a (in)
3050.0 0.476
Stress ratio (R)-0.20 Kmax 11.00
Test Parameters
Initial a (in) 0.654 K-gradient 3.50
K Coeff PD Coeff 0.206430 0.579310 0.000000 0.000000 0.000000 0.000000
Initial K . 5.80 Stress ratio (R)-0.20
Analysis Codes KRCP 1 0
Visual Observations
PD Crack (PD) Crack (visual) Error PDAF 308.20 0.654 0.654 0.000 0.999 538.84 0.853 0.854 0.000 0.948
Comments
Date of test: 12-28-1997
Gl-57

Specimen id. CM2.A Page
Pmax PD a N da dN da/dN dK Obs) (1E-6) (in) (XI) (in) (XI) (in/cyc) (ksitiniT.S)
308.2 0.6538 9 1357 320.3 0.6648 43198 0.0272 83304 3.265E-07 6.10 1406 338.1 0.6810 83313 0.0321 64748 4.955E-07 6.42 1469 355.8 0.6969 107946 0.0325 43071 7.555E-07 6.82 1528 374.5 0.7135 126384 0.0302 39946 7.571E-07 7.21 1597 389.9 0.7272 147892 ■ 0.0291 40390 7.215E-07 7.66 1662 407.6 0.7427 166774 0.0309 29586 1.043E-06 8.10 1737 425.2 0.7580 177477 0.0316 17276 1.832E-06 8.60 1808 444.2 0.7743 184050 0.0298 13120 2.274E-06 9.10 1888 460.0 0.7878 190597 0.0277 12278 2.254E-06 9.65 1970 476.7 0.8020 196327 0.0304 8928 3.401E-06 10.22 2047 496.1 0.8182 199525 0.0289 6530 4.427E-06 10.78 2122 511.3
521.7 0.8309 0.8395
202857 204137
0.0213 4612 4.614E-06 11.32
Gl-58

AUTOMATED FATIGUE CRACK. GROWTH RATE ANALYSIS
Specimen Id. CM2B Geometry MT Contract # 06-8520 Orientation LT Material 2014-T6511 Yield (ksi) 60.7 Temperature (F) 75 Initial A0 (PD) 0.350 Environment LA Initial PD %1000.00
Specimen Dimensions (in)
Thickness 0.105 Width 1.699 Height 0.000
Notch depth Gage length
0.405 0.000
Precrack Parameters
Pmax (lbs) Final a (in)
3050.0 0.476
Stress ratio (R)-0.20 Kmax 11.00
Test Parameters
Initial a (in) 0.854 Initial K 12.50 K-gradient -3.50 Stress ratio (R)-0.20
K Coeff PD Coeff Analysis Codes 0.190180 KRCP 1 0 0.579310 0.000000 0.000000 0.000000 0.000000
Visual Observations
PD Crack (PD) Crack (visual) Error PDAF 543.01 0.853 0.854 0.000 0.992 760.15 1.051 1.051 0.000 0.973
Com ments
Date of test 12-29-1997
Gl-59

Specimen Id. GM2B Page
Pmax PD a N da dN da/dN Obs) (1E-6) (in) (XI) (in) (XI) (in/cyc) (ksifin]
543.0 0.8535 11 2115 551.7 0.8615 1992 0.0241 6394 3.771E-06 11.72 1996 569.0 0.8776 6405 0.0318 9746 3.261E-06 11.20 1847 586.1 0.8933 11738 0.0317 12064 2.631E-06 10.54 1709 603.5 0.9093 18468 0.0320 14919 2.143E-06 9.92 1582 620.9 0.9253 26656 0.0314 17320 1.811E-06 9.34 1462 637.8 0.9407 35789 0.0314 21614 1.454E-06 8.78 1353 655.4 0.9567 48270 0.0317 32640 9.713E-07 8.27 1251 672.7 0.9724 68429 0.0311 56031 5.557E-07 7.78 1157 689.7 0.9878 104301 0.0310 86626 3.574E-07 7.32 1070 707.0 1.0034 155055 0.0310 112255 2.764E-07 6.88 989 724.2 1.0189 216556 0.0312 119903 2.601E-07 6.47 931 741.7
750.6 1.0346 1.0425
274958 306010
0.0236 89454 2.639E-07 6.18
dK
Gl-60

AUTOMATED FATIGUE CRACK GROWTH RATE ANALYSIS
Specimen Id. Contract # Material Temperature Environment
CM2C 06-8520
2014-T6511 (F) 75
LA
Geometry MT Orientation LT Yield (ksi) 60.7 Initial A0 (PD) 0.350 Initial PD %1000.00
Specimen Dimensions (in)
Thickness Width Height
0.105 1.699 0.000
Notch depth 0.405 Gage length 0.000
Precrack Parameters
Pmax (lbs) Final a (in)
3050.0 0.476
Stress ratio (R)-0.20 Kmax 11.00
Test Parameters
Initial a (in) 1.051 K-gradient 3.50
Initial K 5.80 Stress ratio (R)-0.20
K Coeff PD Coeff 0.178280 0.579310 0.000000 0.000000 0.000000 0.000000
Analysis Codes KRCP 1 0
Visual Observations
PD Crack (PD) Crack (visual) Error PDAF 760.27 1.051 1.051 0.000 1.000 935.32 1.265 1.265 0.000 1.045
Comments
Date of test: 12-30-1997
Gl-61

specimen id. cttac Page 1
Pmax PD a N da dfl da/dN (lbs) (1E-6) ' (in) (XI) (in) (XI) (in/cyc) (ksi[in]
760.3 1.0510 25 884 772.2 1.0650 31232 0.0347 89417 3.880E-07 6.12 915 789.5 1.0857 89442 0.0420 100117 4.199E-07 6.47 953 807.4 1.1071 131348 0.0438 68246 6.420E-07 6.92 991 826.0 1.1295 157688 0.0429 41398 1.035E-06 7.38
1030 842.8 1.1500 172746 0.0400 24141 1.657E-06 7.87 1070 858.8 1.1695 181828 0.0418 18265 2.287E-06 8.41 1153 876.8 1.1917 191012 0.0875 11533 7.590E-06 9.58 1183 929.0
935.3 1.2570 1.2650
193361 194096
0.0733 3084 2.375E-05 10.04
dK
Gl-62

CM
in CO
10
CO +
o + < 1
O
II ö CO cc
o
2 o . _ O O IJJ
m 4: «««, 00 CO
4
■ *< CD H- \l c o s 'X o 5
. CO <>* ^ o ^c
-w + < 1—
_« •" +x i£
< CE 4 <<v. <
\r i- V+
Q X -O UJ
ü CNI 1_ T—
2? o | T™
*■ i r> tf w < O f *»» ■? < D O < o < D
T- 1 ii i h ill i 11 1 11 o < D ( D q < D < D
CM ' I— * p-
©pÄo/ipin 'NV/BV
Gl-63

AUTOMATED FATIGUE CRACK GROWTH RATE ANALYSIS
Specimen Id. CM3 Geometry MT Contract # 06-8520 Orientation LT Material 2014-T6511 Yield (ksi) 60.7 Temperature (F) 75 Initial A0 (PD) 0.345 Environment LA Initial PD %1000.00
Specimen Dimensions (in)
Thickness 0.109 Width 1.701 Height 0.000
Notch depth 0.404 Gage length 0.000
Precrack Parameters
Pmax (lbs) Final a (in)
3300.0 0.492
Stress ratio (R)-0.20 Kmax 11.64
Test Parameters
Initial a (in) 0.492 Initial K 11.20 K-gradient -3.50 Stress ratio (R)-0.20
K Coeff PD Coeff Analysis Codes 0.213290 KRCP 1 0 0.578630 0.000000 0.000000 0.000000 0.000000
Visual Observations
PD Crack (PD) Crack (visual) Error PDAF 131.98 0.492 0.492 0.000 0.997 366.06 0.727 0.727 0.000 1.011
Comments
Date of test: 01-05-1998
Gl-64

Specimen Id. CM3 Page
Pmax PD a N da dN da/dN Obs) (1E-6) (in) (XI) (in) (XI) (in/cyc) (ksilinT
132.0 0.4923 9 2952 145.1 0.5053 3457 0.0300 8766 3.425E-06 10.61 2755 162.3 0.5223 8774 0.0337 11075 3.039E-06 10.08 2544 179.0 0.5389 14532 0.0339 13384 2.533E-06 9.50 2354 196.4 0.5562 22159 0.0343 17101 2.007E-06 8.96 2175 213.5 0.5733 31633 0.0342 24444 1.400E-06 8.45 2009 230.7 0.5904 46602 0.0348 38352 9.069E-07 7.96 1859 248.2 0.6080 69985 0.0347 57610 6.024E-07 7.51 1717 265.3 0.6252 104212 0.0345 75637 4.565E-07 7.07 1589 282.6 0.6426 145621 0.0350 84652 4.129E-07 6.67 1472 300.0 0.6601 188864 0.0343 109454 3.133E-07 6.29 1359 316.6 0.6769 255075 0.0349 141131 2.472E-07 5.92 1259 334.5 0.6950 329995 0.0358 171276 2.091E-07 5.59 1187 352.0
360.4 0.7127 0.7212
426351 476031
0.0262 146036 1.795E-07 5.34
dK
Gl-65

AUTOMATED FATIGUE CRACK GROWTH RATE ANALYSIS
Specimen Id. CM3A Contract # 06-8520 Material 2014-T6511 Temperature (F) 75 Environment LA
Geometry MT Orientation LT Yield (ksi) 60.7 Initial A0 (PD) 0.345 Initial PD %1000.00
Specimen Dimensions (in)
Thickness Width Height
0.109 1.701 0.000
Notch depth Gage length
0.404 0.000
Precrack Parameters
Pmax (lbs) Final a (in)
3300.0 0.492
Stress Kmax
ratio (R)-0.20 11.64
Test Parameters
Initial a (in) 0.727 K-gradient 3.50
Initial K 5.00 Stress ratio (R)-0.20
K Coeff PD Coeff 0.215586 0.578630 0.000000 0.000000 0.000000 0.000000
Analysis Codes KRCP 1 0
Visual Observations
PD Crack (PD) Crack (visual) Error PDAF 366.10 0.725 0.727 0.002 0.994 632.05 0.984 0.977 -.007 0.992 878.64 1.223 1.228 0.005 0.990
Comments
Date of test: 01-06-1998
Gl-66

specimen id. CM3A Pa$e
Pmax PD a (lbs) (1E-6) (in)
N da dN da/dN dK (XI) (in) (XI) (in/cyc) (ksatin]~.5)
366.1 0.7251 384 1130 379.3 0.7379 55125 0.0301 118310 2.543E-07 5.26 1172 397.0 0.7552 118694 0.0340 121744 2.796E-07 5.54 1223 414.2 0.7720 176869 0.0341 98363 3.462E-07 5.89 1276 431.9 0.7892 217058 0.0344 70659 4.865E-07 6.25 1331 449.5 0.8063 247527 0.0339 44024 7.704E-07 6.64 1390 466.7 0.8232 261081 0.0345 25824 1.337E-06 7.06 1446 484.9 0.8409 273351 0.0330 32689 1.008E-06 7.47 1511 500.6 0.8561 293770 0.0329 38357 8.584E-07 7.95 1571 518.8 0.8738 311708 0.0343 31243 1.097E-06 8.41 1642 535.8 0.8904 325014 0.0342 18081 1.893E-06 8.95 1708 554.0 0.9080 329789 0.0333 11417 2.920E-06 9.48 1782 570.1 0.9237 336431 0.0324 12501 2.589E-06 10.07 1855 587.2 0.9404 342290 0.0337 10156 3.317E-06 10.67 1931 604.7 0.9574 346587 0.0333 8723 3.815E-06 11.31 2012 621.5 0.9737 351013 0.0330 7989 4.132E-06 12.00 2096 638.7 0.9904 354575 0.0342 6793 5.034E-06 12.74 2183 656.7 1.0079 357806 0.0342 5470 6.253E-06 13.51 2275 673.9 1.0246 360045 0.0334 3812 8.762E-06 14.35 2366 691.1 1.0413 361618 0.0329 2777 1.185E-05 15.21 2465 707.8 1.0575 362822 0.0338 2357 1.434E-05 16.16 2561 726.0 1.0751 363975 0.0338 2040 1.656E-05 17.11 2669 742.7 1.0913 364862 0.0339 1648 2.060E-05 18.21 2768 761.0 1.1090 365623 0.0327 1417 2.308E-05 19.24 2886 776.4 1.1240 366279 0.0333 1132 2.943E-05 20.50 2991 795.4 1.1423 366754 0.0347 900 3.860E-05 21.67 3109 812.3 1.1587 367179 0.0324 847 3.819E-05 23.02 3231 828.8 1.1747 367601 0.0340 740 4.591E-05 24.46 3346 847.4 1.1927 367918 0.0337 553 6.106E-05 25.86 3475 863.6 1.2084 368154 0.0324 397 8.162E-05 27.49 3601 880.8 1.2250 368315 0.0341 310 1.100E-04 29.14 3732 898.8
916.8 1.2425 1.2602
368464 368537
0.0351 223 1.578E-04 30.94
Gl-67

CO
lO
CO
LO + <
II o tr d
o T— T-
LU
o 6 i
CM TZ LO CO
°? H <
CD O < C O UJ <
< < 9 1
»3 ■'• <
< *
< DC < <
<
< + ■
+ 4 + <
T3 LU < +
++
ü ^ U T—
1
o T—
*■
"* i lO < £> r^ < x> 9 ' O Z> o < 3
O LLJ 1 o <
XI 1 o
LLJ O
til i o <
±1
(M -
epAo/nom 'NV/^V
Gl-68

AUTOMATED FATIGUE CRACK GROWTH RAT E ANAL Y SIS
Specimen Id. Contract # Material
CEl 06-8520 2024-T6511
Temperature (F) Environment
74 LA
Geometry ECT Orientation LT Yield (ksi) 60.7 Initial A0 (PD) 0.576 Initial PD %1000. 00
Specimen Dimensions (in)
Thickness 0.116 Width 2.506 Height 0.000
Notch depth 0.614 Gage length 0.000
Precrack Parameters
Pmax (lbs) Final a (in)
600.0 0.760
Stress ratio (R) 0.50 Kmax 11.79
Test Parameters
Initial a (in) 0.760 K-gradient -3.50
Initial K 12.00 Stress ratio (R) 0.50
K Coeff PD Coeff 0.237470 0.471310 0.000000 0.000000 0.000000 0.000000
Analysis Codes KREP 1 0
Visual Observations
PD Crack (PD) Crack (visual) Error PDAF 139.74 0.759 0.760 0.000 0.996 347.07 0.999 0.999 0.000 0.987
Comments
Date of test: 01-21-1998
Gl-69

Specimen Id. CE1 Page 1
Pmax PD' a H da dN da/dN dK (lbs) (1E-6)
139.7
(in)
0.7595
(XI)
6
(in) (XI) (in/cyc) (ksi[in]
548 155.3 0.7777 11881 0.0433 33230 1.303E-06 5.54 495 176.9 0.8028 33236 0.0493 50020 9.849E-07 5.14 438 197.6 0.8269 61901 0.0494 70453 7.017E-07 4.69 389 219.4 0.8522 103688 0.0499 115354 4.325E-07 4.30 345 240.6 0.8768 177255 0.0488 196114 2.487E-07 3.94 306 261.5 0.9010 299802 0.0490 305322 1.605E-07 3.60 272 283.0 0.9258 482577 0.0489 439348 1.113E-07 3.30 241 303.9 0.9499 739150 0.0484 598821 8.084E-08 3.02 220 325.0
336.2 0.9742 0.9870
1081398 1279479
0.0371 540329 6.868E-08 2.82
.5)
Gl-70

AUTOMATED FATIGUE CRACK GROWTH RATE ANALY SIS
Specimen Id. CE1A Contract # 06-8520 Material 2024-T6511 Temperature (F) 74 Environment LA
Geometry ECT Orientation LT Yield (ksi) 60.7 Initial A0 (PD) 0.576 Initial PD %1000. 00
Specimen Dimensions (in)
Thickness Width Height
0.116 2.506 0.000
Notch depth Gage length
0.614 0.000
Precrack Parameters
Pmax (lbs) Final a (in)
600.0 0.760
Stress ratio (R) 0.50 Kmax 11.79
Test Parameters
Initial a (in) 0.999 K-gradient 3.50
Initial K 5.30 Stress ratio (R) 0.50
K Coeff PD Coeff 0.218000 0.471310 0.000000 0.000000 0.000000 0.000000
Analysis Codes KREP 1 0
Visual Observations
PD Crack (PD) Crack (visual) Error PDAF 347.16 0.964 0.999 0.036 1.018 619.73 1.295 1.164 -.131 1.023 876.25 1.610 1.706 0.096 1.028
Comments
Date of test: 01-23-1998
Gl-71

Specimen Id. CE1A Page 1
Pmax PD a N da dN da/dN dK (lbs) (1E-6)
388.2
(in)
1.0136
(XI)
1080
(in) (XI) (in/eye) (ksi[in]~ -5)
212 405.7 1.0347 231489 0.0528 500066 1.055E-07 2.99 224 431.7 1.0663 501145 0.0602 458825 1.311E-07 3.26 241 455.3 1.0949 690314 0.0691 318767 2.169E-07 3.69 263 488.6 1.1354 819912 0.0974 363821 2.676E-07 4.27 283 535.3 1.1923 1054136 0.0869 253439 3.430E-07 4.83 309 560.0 1.2224 1073351 0.0602 36941 1.630E-06 5.61 324 584.7 1.2525 1091076 0.0476 35935 1.326E-06 6.09 346 599.0 1.2700 1109286 0.0517 30847 1.678E-06 6.80 363 627.0 1.3042 1121923 0.0654 21543 3.034E-06 7.39 382 652.5 1.3354 1130829 0.0507 15285 3.315E-06 8.11 409 668.4 1.3549 1137209 : 0.0591 13500 4.378E-06 9.16 427 700.7 1.3945 1144328 ' 0.0641 12144 5.277E-06 9.89 455 720.7 1.4190 1149352 0.0538 6947 7.741E-06 11.13 476 744.6 1.4482 1151275 0.0538 3082 1.744E-05 12.12 506 764.5 1.4727 1152434 0.0630 1909 3.299E-05 13.62 529 795.8 1.5112 1153184 0.0645 1627 3.966E-05 14.87 566 817.0 1.5373 1154061 0.0657 1026 6.400E-05 17.02 578 849.1 1.5769 1154210 0.0382 500 7.636E-05 17.76 608 848.0
865.3 1.5754 1.5968
1154561 1154877
0.0199 667 2.987E-05 19.74
Gl-72

in o II
cc CM LU O
■
o O CM
LU DL
LO CO 00
i h- CO o o 111
< €L h- \- D X "D LU
Ü
"c5 LL
CM
LO CO H
I
T— O CM
o LU O
CO i
+
CO +
10 CO
I
in CO +
D
D D
<? *"
o o
lO o ■
LU O
CO o LU O
o LU o
GO o I
LU o
ep/fo/L|0ui 'NV/^v
Gl-73

AUTOMATED FATIGUE CRACK GROWTH RAT E ANAL Y S I S
Specimen Id. CE2 Contract # 06-8520 Material 2024-T6511 Temperature (F) 74 Environment LA
Geometry ECT Orientation LT Yield (ksi) 60.7 Initial A0 <PD) 0.539 Initial PD %1000.00
Specimen Dimensions (in)
Thickness 0.116 Width 2.503 Height 0.000
Notch depth 0.614 Gage length 0.000
Precrack Parameters
Pmax (lbs) Final a (in)
600.0 0.737
Stress ratio (R) 0.50 Kmax 11.43
Test Parameters
Initial a (in) 0.737 K-gradient -3.50
Initial K 11.50 Stress ratio (R) 0.50
K Coeff PD Coeff .219250 .471870 000000 ,000000 000000 ,000000
Analysis Codes KREP ' 1 0
Visual Observations
PD Crack (PD) Crack (visual) Error PDAF 159.60 0.737 0.737 0.000 0.998 307.72 0.898 0.898 0.000 0.961
Comments
Date of test: 01-15-1998
Gl-74

Specimen Id. CE2 Page 1
Pmax PD a N da dN da/dN dK (lbs) (1E-6)
159.6
(in)
0.7370
(XI)
6
(in) (XI) (in/cyc) (ksi[in]
543 175.6 0.7550 13269 0.0414 36496 1.135E-06 5.31 489 196.6 0.7784 36502 0.0468 59548 7.854E-07 4.91 434 217.7 0.8017 72817 0.0467 89919 5.196E-07 4.49 385 239.2 0.8251 126421 0.0465 148354 3.133E-07 4.10 342 260.6 0.8482 221171 0.0447 245600 1.822E-07 3.75 303 281.0
302.9 0.8699 0.8930
372021 580545
0.0448 359374 1.246E-07 3.42
5)
Gl-75

AUTOMATED FATIGUE CRACK GROWTH RAT E ANALYSIS
Specimen Id. CE2A Contract # 06-8520 Material 2024-T6511 Temperature (F) 74 Environment LA
Geometry ECT Orientation LT Yield (ksi) 60.7 Initial A0 (PD) 0.539 Initial PD %1000. 00
Specimen Dimensions (in)
Thickness 0.116 Width 2.503 Height 0.000
Notch depth Gage length
0.614 0.000
Precrack Parameters
Pmax (lbs) Final a (in)
600.0 0.737
Stress ratio (R) 0.50 Kmax 11.43
Test Parameters
Initial a (in) 0.898 K-gradient 3.50
Initial K 6.20 Stress ratio (R) 0.50
K Coeff PD Coeff ,213520 ,471870 000000 000000 .000000 000000
Analysis Codes KREP 1 0
Visual Observations
PD Crack (PD) Crack (visual) 307.67 0.898 0.89S 469.67 1.073 i •
Errar ?\>*F
Comments
Date of test: 01-1^-|?98
Gl-76

Specimen Id. CE2A Paae
Pmax PD 3 N da dtf da dN / dH
fibs) (1E-6)
397.7
/in)
0.8960
fxi)
i
(in) (XI) (in/cyc)- (kstCm^.5)
273 32-3*0 Ö.9150 1517Ö5 0.0402 333904 1.205E-07 3.33 292 344.0 0.9382 333910 0,0473 361550 1.309E-07 3.60 308 366.0 0.9623 513256 0.0462 250717 1.844E-07 3.91 327 386.4 0.9844 584627 0.0476 137943 3.450E-07 4.28 346 410.1 1.0099 651199 0.0519 90970 5.701E-07 4.68 366 434,8 1.0363 675598 0.0471 45131 1.044E-06 5.11 381 454.5
461.9 1.0570 1.0649
696330 704523
0.0286 28926 9.884E-07 5.44
Gl-77

AUTOMATED FATIGUE CRACK GROWTH RATE ANALYSIS
Specimen Id. CE2B Contract # 06-8520 Material 2024- -T6511 Temperati ire (F) 74 Environment LA
Geometry ECT Orientation LT Yield (ksi) 60.7 Initial A0 (PD) 0.539 Initial PD %1000.00
Specimen Dimensions (in)
Thickness 0.116 Width 2.503 Height 0.000
Notch depth Gage length
0.614 0.000
Precrack Parameters
Pmax (lbs) Final a (in)
600.0 0.737
Stress ratio (R) 0.50 Kmax 11.43
Test Parameters
Initial a (in) 1.073 K-gradient -3.50
Initial K 12.00 Stress ratio (R) 0.50
K Coeff PD Coeff ,206000 ,471870 .000000 ,000000 ,000000 ,000000
Analysis Codes KREP 1 0
Visual Observations
PD Crack (PD) Crack (visual) Error PDAF 473.99 1.073 1.073 0.000 0.996 640.99 1.275 1.275 0.000 1.003
Comments
Date of test: 01-18-1998
Gl-78

Specimen Id. CE2B Page
Pmax PD a N da dN da/dN dK (lbs) (1E-6)
474.0
(in) ,
1.0730
(XI)
8
(in) (XI) (in/cyc) (ksi[in]~.5)
367 487.5 1.0893 10427 0.0394 33950 1.162E-06 5.54 333 506.8 1.1124 33957 0.0470 59286 7.926E-07 5.18 297 526.6 1.1363 69713 0.0496 99180 5.003E-07 4.76 265 547.9 1.1620 133138 0.0486 183014 2.656E-07 4.40 233 566.8 1.1849 252728 0.0518 312694 1.658E-07 4.01 206 590.7 1.2139 445831 0.0564 427524 1.318E-07 3.69 187 613.3
623.5 1.2412 1.2537
680252 817578
0.0398 371747 1.071E-07 3.44
Gl-79

AUTOMATED FATIGUE CRACK GROWTH RATE ANALYSIS
Specimen Id. CE2C Contract # 06-8520 Material 2024-T6511 Temperature (F) 74 Environment LA
Geometry ECT Orientation LT Yield (ksi) 60.7 Initial A0 (PD) 0.539 Initial PD %1000. 00
Specimen Dimensions (in)
Thickness 0.116 Width 2.503 Height 0.000
Notch depth 0.614 Gage length 0.000
Precrack Parameters
Pmax (lbs) Final a (in)
600.0 0.737
Stress ratio (R) 0.50 Kmax 11.43
Test Parameters
Initial a (in) 1.275 K-gradient 3.50
Initial K 6.00 Stress ratio (R) 0.50
K Coeff PD Coeff 0.202000 0.471870 0.000000 0.000000 0.000000 0.000000
Analysis Codes KREP -1 0
Visual Observations
PD Crack (PD) Crack (visual) Error PDAF 652.42 1.275 1.275 0.000 0.998 819.83 1.456 1.457 0.000 0.982
Comments
Date of test: 01-19-1998
Gl-80

Specimen Id. CE2C Page 1
Pmax PD- a N da dN da/dN dK (lbs) (1E-6)
652.4
(in)
1.2750
(XI)
15
(in) (XI) (in/cyc) (ksi[in]".5)
160 662.2 1.2858 289322 0.0332 524120 6.335E-08 3.19 167 682.6 1.3082 524134 0.0510 381326 1.338E-07 3.43 175 708.8 1.3368 670648 0.0534 258002 2.071E-07 3.74 183 731.6 1.3616 782136 0.0386 206551 1.871E-07 4.04 195 744.4 1.3754 877199 0.0494 150724 3.275E-07 4.52 208 777.3 1.4110 932860 0.0798 68167 1.170E-06 5.03 216 818.7 1.4552 945366 0.0489 25614 1.910E-06 5.41 231 822.8 1.4599 958474 0.0284 14132 2.007E-06 6.12 234 843.2 1.4836 959498 0.0334 5134 6.498E-06 6.27 247 851.6 1.4932 963607 0.0453 20929 2.163E-06 6.96
• 254 882.2 1.5288 980427 0.0572 20139 2.842E-06 7.35 268 900.9 1.5505 983747 ■ 0.0460 11231 4.099E-06 8.17 2S5 921.9 1.5749 991657 0.0772 10501 7.349E-06 9.30 289 967.4 1.6276 994248 0.0427 3976 1.074E-05 9.54 306 958.7
976.1 1.6176 1.6376
995634 997048
0.0100 2801 3.570E-06 10.83
Gl-81

CM
1! DC
CO UJ o O o CM
UJ LO-
LO CO GO
1 h- CO O o LU
< (T h- h- Q X ■o LU
Ü
"cö LL
CM T—
LO CO I-
o CM
o LÜ O
CO
+
lO
CO +
lO
CO
O
o +° < + o <
+ <J> °
O O
q d V)
o 111 o
CO o tu o
o ill o
CO o ■
UJ o
epÄo/uom 'NV/ev
Gl-82

AUTOMATED FATIGUE CRACK GROWTH RAT E ANALYSIS
Specimen Id. CE3 Contract # 06-8520 Material 2024-T6511 Temperature (F) 74 Environment LA
Geometry ECT Orientation LT Yield (ksi) 60.7 Initial A0 (PD) 0.537 Initial PD %1000. 00
Specimen Dimensions (in)
Thickness 0.116 Width 2.504 Height 0.000
Notch depth 0.618 Gage length 0.000
Precrack Parameters
Pmax (lbs) Final a (in)
600.0 0.717
Stress ratio (R) 0.20 Kmax 11.18
Test Parameters
Initial a (in) 0.717 K-gradient -3.50
Initial K 11.00 Stress ratio (R) 0.20
K Coeff PD Coeff 0.220500 0.471690 0.000000 0.000000 0.000000 0.000000
Analysis Codes KREP 1 0
Visual Observations
PD Crack (PD) Crack (visual) Error PDAF 140.33 0.717 0.717 0.000 0.995 329.82 0.928 0.929 0.000 0.966
Comments
Date of test: 01-12-1998
Gl-83

Specimen Id. CE3 Page 1
Pmax PD a K da dN da/dN dK (lbs) (1E-6)
140.3
(in)
0.7170
(XI)
6
(in) (XI) (in/eye) (ksi[in]~ .5)
531 155.0 0.7339 5128 0,0414 13927 2.975E-06 8.12 479 176.6 0.7584 13933 0.0493 21281 2.315E-06 7.53 425 198.4 0.7831 26409 0.0483 31300 1.544E-06 6.88 377 219.4 0.8068 45232 0.0470 52245 9.003E-07 6.29 335 240.3 0.8302 78654 0.0467 88480 5.283E-07 5.76 297 261.3 0.8535 133713 0.0470 155979 3.013E-07 5.27 264 282.8 0.8771 234633 0.0465 277737 1.676E-07 4.82 234 303.7
325.0 0.9001 0.9233
411450 635865
0.0461 401232 1.150E-07 4.40
Gl-84

AUTOMATED FATIGUE CRACK GROWTH RATE ANALYSIS
Specimen Id. CE3A Contract # 06-8520 Material 2024-T6511 Temperature (F) 74 Environment LA
Geometry ECT Orientation LT Yield (ksi) 60.7 Initial A0 (PD) 0.537 Initial PD %1000. 00
Specimen Dimensions (in)
Thickness 0.116 Width 2.504 Height 0.000
Notch depth Gage length
0.618 0.000
Precrack Parameters
Pmax (lbs) Final a (in)
600.0 0.717
Stress ratio (R) 0.20 Kmax 11.18
Test Parameters
Initial a (in) 0.929 K-gradient 3.50
Initial K 5.00 Stress ratio (R) 0.20
K Coeff PD Coeff 0.215210 0.471690 0.000000 0.000000 0.000000 0.000000
Analysis Codes KREP • 1 0
Visual Observations
PD 329.86 552.00
Crack (PD] 0.928
' 1.157
Crack (visual) Error 0.929 0.000 1.158 0.000
PDAF 1.000 0.949
Comments
Date of test: 01-13-1998
Gl-85

Specimen Id. CE3A Page 1
Pmax PD- a N da dN da/dN dK (lbs) (1E-6)
329.8
(in)
0.9284
(XI)
12
(in) (XI) (in/eye) (ksi[in]".5)
215 345.9 0.9460 182953 0.0401 381472 1.052E-07 4.31 226 366.9 0.9686 381484 0.0454 342180 1.326E-07 4.64 239 388.3 0.9913 525133 0.0478 228116 2.095E-07 5.07 252 412.1 1.0164 609601 0.0438 120666 3.626E-07 5.49 267 430.0 1.0351 645799 0.0421 90257 4.664E-07 6.01 281 452.7 1.0584 699858 0.0444 82423 5.392E-07 6.49 297 473.4 1.0795 728221 0.0441 53272 8.283E-07 7.09 314 496.3 1.1026 753129 0.0442 37256 1.187E-06 7.69 331 517.6
537.6 1.1237 1.1435
765478 776405
0.0409 23276 1.758E-06 8.36
Gl-86

AUTOMATED FATIGUE CRACK GROWTH RATE ANALYSIS
Specimen Id. CE38 Contract # 06-8520 Material 2024- ■T6511 Temperature (F) 74 Environment LA
Geometry Orientation
ECT LT
Yield (ksi) 60.7 Initial A0 (PD) 0.537 Initial PD %1000. 00
Specimen Dimensions (in)
Thickness 0.116 Width 2.504 Height 0.000
Notch depth 0.618 Gage length 0.000
Precrack Parameters
Pmax (lbs) Final a (in)
600.0 0.717
Stress ratio (R) 0.20 Kmax 11.18
Test Parameters
Initial a (in) 1.158 K-gradient -3.50
Initial K 12.30 Stress ratio (R) 0.20
K Coeff PD Coeff 0.201870 0.471690 0.000000 0.000000 0.000000 0.000000
Analysis Codes KREP 1 0
Visual Observations
PD Crack (PD) Crack (visual) Error PDAF 552.32 1.157 1.158 0.000 0.999 723.78 1.354 1.354 0.000 0.993
Comments
Date of test: 01-13-1993
Gl-87

Spe cimen Id. CE3B Page l
Pmax PD a N da dN da/dN dK (lbs) (1E-6)
552.3
(in)
1.1575
(XI)
7
(in) (XI) (in/eye) (ksi[in]
333 564.7 1.1717 3204 0.0434 13147 3.299E-06 9.08 301 590.0 1.2009 13153 0.0543 21708 2.499E-06 8.46 265 611.8 1.2260 24912 0.0468 29229 1.600E-06 7.71 235 630.7 1.2476 42383 0.0431 56966 7.573E-07 7.08 220 649.4 1.2691 81878 0.0264 • 106504 2.480E-07 6.75 200 653.7 1.2740 148887 0.0197 171986 1.144E-07 6.31 181 666.6
697.1 1.2888 1.3236
253863 265586
0.0495 116699 4.244E-07 5.87
.5)
Gl-88

CM
O II
CC «tf LU O m
o o CM
HI Q.
10 CO 00
1 K CO O o LLI
< cc h- h- D X T3 LU
Ü
"5 CM T—
CD
o (M
o I
LU O
CO
+
in CO +
w CO
I
O
in CO +
D
o o
+ *
o i - CO
in o 111 o
o LÜ o
o LLI o
CO o LLJ o
e|OÄo/qoU! 'NV/BV
Gl-89

AUTOMATED FATIGUE CRACK GROWTH RATE ANALYSIS
Specimen Id. Contract # Material
CE4 06-8520 2024-T6511
Temperature Environment
(F) 74 LA
Geometry ECT Orientation LT Yield (ksi) 60.7 Initial A0 (PD) 0.561 Initial PD %1000.00
Specimen Dimensions (in)
Thickness 0.116 Width 2.503 Height 0.000
Notch depth 0.623 Gage length 0.000
Precrack Parameters
Pmax {lbs) Final a (in)
600.0 0.717
Stress ratio (R) 0.20 Kmax 11.12
Test Parameters
Initial a (in) 0.717 K-gradient -3.50
Initial K 10.90 Stress ratio (R) 0.20
K Coeff PD Coeff Analysis Codes 0.231786 KREP ' 1 0 0.471870 0.000000 0.000000 0.000000 0.000000
Visual Observations
PD Crack (PD) Crack (visual) Error PDAF 117.30 0.717 0.717 0.000 0.991 264.58 0.883 0.883 0.000 0.971
Comments
Date of test: 12-31-1997
Gl-90

Sp< äcimen Id. CE4 Page 1
Pmax PD - a N da dN da/dH dK (lbs) (1E-6)
117.3
(in)
0.7175
(XI)
5
(in) (XI) (in/eye) (ksi[in]
527 132.1 0.7345 5932 0.0419 15316 2.733E-06 8.03 476 153.9 0.7594 15321 0.0491 25790 1.903E-06 7.45 422 175.2 0.7836 31722 0.0479 43042 1.113E-06 6.81 375 196.2 0.8073 58363 0.0474 67584 7.015E-07 6.23 333 217.3 0.8310 99306 0.0473 120706 3.921E-07 5.70 296 238.5
259.3 0.8546 0.8777
179069 322319
0.0467 223013 2.092E-07 5.22
.5)
Gl-91

AUTOMATED FATIGUE CRACK GROWTH RATE ANAL Y S I S
Specimen Id. CE4A Contract # Material
06-8520 2024-T6511
Temperature (F) 74 Environment LA
Geometry ECT Orientation LT Yield (ksi) 60.7 Initial A0 (PD) 0.561 Initial PD %1000.00
Specimen Dimensions (in)
Thickness 0.116 Width 2.503 Height 0.000
Notch depth 0.623 Gage length 0.000
Precrack Parameters
Pmax (lbs) Final a (in)
600.0 0.717
Stress ratio (R) 0.20 Kmax 11.12
Test Parameters
Initial a K-gradi'ent
(in) 0.883 Initial K 5.90 3.50 Stress ratio (R) 0.20
K Coeff PD Coeff Analysis Codes 0.228170 KREP 1 0 0.471870 0.000000 0.000000 0.000000 0.000000
Visual Observations
PD Crack (PD) Crack (visual) Error PDAF 264.71 0.883 0.883 0.000 0.999 448.23 1.079 1.079 0.000 0.959
Comments
Date of test: 01-05-1998
Gl-92

Specimen Id. CE4A Page 1
Pmax PD a N da dN da/dN dK (lbs) (1E-6)
264.7
(in)
0.8835
(XI)
5
(in) (XI) (in/cyc) (ksi[in]
270 280.7 0.9012 110465 0.0375 209195 1.794E-07 5.06 284 298.7 0.9210 209200 0.0472 183100 2.579E-07 5.49 301 323.9 0.9484 293565 0.0536 124894 4.295E-07 5.98 318 348.3 0.9747 334093 0.0464 62591 7.413E-07 6.53 338 367.2 0.9948 356156 0.0433 36611 1.183E-06 7.16 356 389.2 1.0180 370705 0.0452 27235 1.658E-06 7.76 376 410.3 1.0400 383392 0.0444 19711 2.254E-06 8.45 390' 432.0
438.4 1.0624 1.0689
390416 393146
0.0289 9755 2.963E-06 8.92
Gl-93

AUTOMATED FATIGUE CRACK GROWTH RATE ANALYSIS
Specimen Id. CE4B Contract # 06-8520 Material 2024-T6511 Temperature (F) 74 Environment LA
Geometry ECT Orientation LT Yield (ksi) 60.7 Initial A0 (PD) 0.561 Initial PD %1000.00
Specimen Dimensions (in)
Thickness 0.116 Width 2.503 Height 0.000
Notch depth 0.623 Gage length 0.000
Precrack Parameters
Pmax (lbs) Final a (in)
600.0 0.717
Stress ratio (R) 0.20 Kmax 11.12
Test Parameters
Initial a (in) 1.079 K-gradient -3.50
Initial K 12.60 Stress ratio (R) 0.20
K Coeff PD Coeff 0.219550 0.471870 0.000000 0.000000 0.000000 0.000000
Analysis Codes KREP 1 0
Visual Observations
PD Crack (PD) Crack (visual) Error PDAF 452.17 1.079 1.079 0.000 0.991 681.39 1.366 1.366 0.000 1.015
Comments
Date of test: 01-07-1998
Gl-94
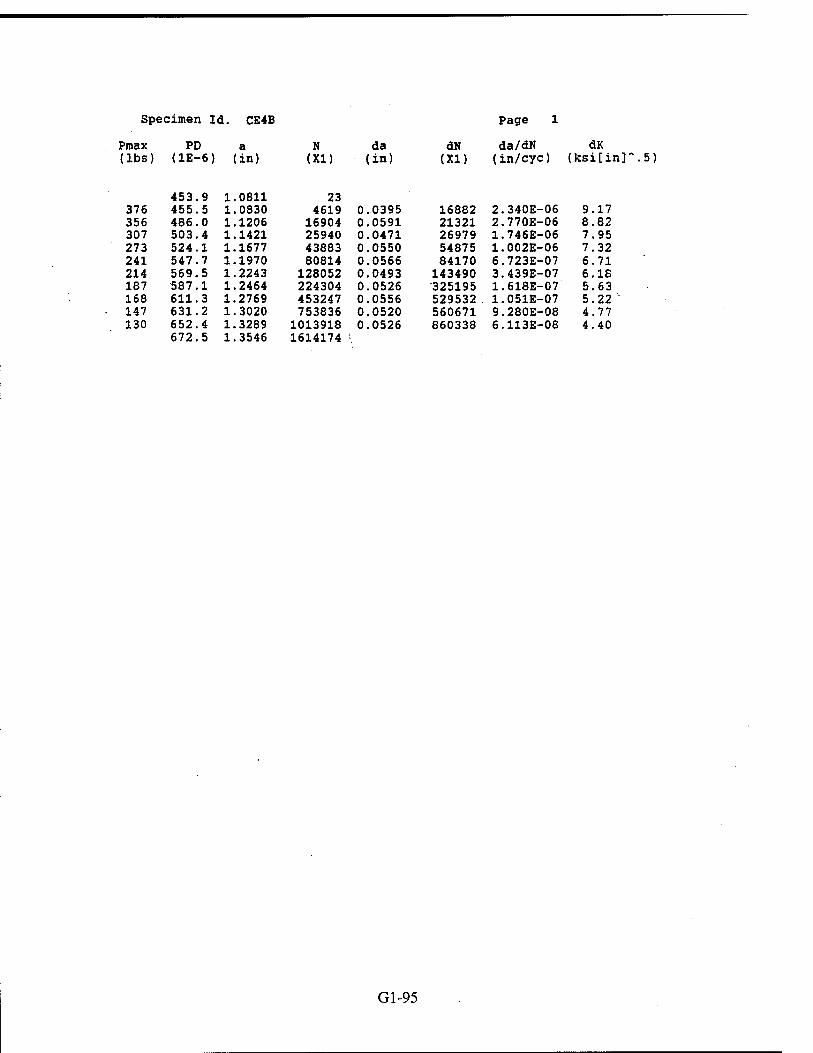
Specimen Id. CE4B Page 1
Pmax PD a N da dN da/dK dK (lbs) (1E-6)
453.9
(in)
1.0811
(XI)
23
(in) (XI) (in/cyc) (ksi[in]
376 455.5 1.0830 4619 0.0395 16882 2.340E-06 9.17 356 486.0 1.1206 16904 0.0591 21321 2.770E-06 8.82 307 503.4 1.1421 25940 0.0471 26979 1.746E-06 7.95 273 524.1 1.1677 43883 0.0550 54875 1.002E-06 7.32 241 547.7 1.1970 80814 0.0566 84170 6.723E-07 6.71 214 569.5 1.2243 128052 0.0493 143490 3.439E-07 6.18 187 587.1 1.2464 224304 0.0526 •325195 1.618E-07 5.63 168 611.3 1.2769 453247 0.0556 529532 1.051E-07 5.22 147 631.2 1.3020 753836 0.0520 560671 9.280E-08 4.77 130 652.4
672.5 1.3289 1.3546
1013918 1614174
0.0526 860338 6.113E-08 4.40
5)
Gl-95

AUTOMATED FATIGUE CRACK GROWTH RAT E ANALY SIS
Specimen Id. CE4C Contract # 06-8520 Material 2024-T6511 Temperature (F) 74 Environment LA
Geometry ECT Orientation LT Yield (ksi) 60.7 Initial A0 (PD) 0.561 Initial PD %1000.00
Specimen Dimensions (in)
Thickness 0.116 Width 2.503 Height 0.000
Notch depth 0.623 Gage length 0.000
Precrack Parameters
Pmax (lbs) Final a (in)
600.0 0.717
Stress ratio (R) 0.20 Kmax 11.12
Test Parameters
Initial a (in) 1.366 K-gradient 3.50
Initial K 5.00 Stress ratio (R) 0.20
K Coeff PD Coeff 0.224500 0.471870 0.000000 0.000000 0.000000 0.000000
Analysis Codes KREP 1 0
Visual Observations
PD Crack (PD) Crack (visual) Error PDAF 680.85 1.367 1.367 0.000 1.001 918.21 1.625 1.625 0.000 0.981
Comments
Date of test: 01-11-1998
Gl-96

Specimen Id. CE4C Page 1
Pmax PD' a N da dH da/dN dK (lbs) (1E-6)
680.3
(in)
1.3659
(XI)
21
(in) (XI) (in/cyc) (ksi[in]".5)
116 684.0 1.3701 198568 0.0366 588487 6.227E-08 4.27 120 713.2 1.4026 588508 0.0574 607488 9.452E-08 4.50 126 735.8 1.4275 806056 0.0479 316526 1.515E-07 4.98 132 756.7 1.4505 905034 0.0446 355765 1.255E-07 5.41 138 776.4 1.4721 1161821 0.0421 346490 1.214E-07 5.86 146 795.1 1.4926 1251524 0.0543 134882 4.022E-07 6.48 152 826.1 1.5264 1296703 0.0548 69480 7.887E-07 6.99 159 845.5 1.5474 1321004 0.0328 38631 8.481E-07 7.59 172 856.4
918.2 1.5591 1.6255
1335334 1352997
0.0781 31993 2.442E-06 8.90
Gl-97

00
o ii
oc LO UJ o ■
Ü o CM
UJ Q.
LO C/) 00
1 1- CD o O UJ
< DC H H D X ■o UJ
Ü 1—
LL
C\l
LO CD
T—
o CM
in CO
+
in CO +
.in CO
O
W
CO +
D
o LiJ O
en <P
O O
o -— - CO o m
<
in o ill o
to o UJ o
o LLJ o
00 o UJ o
epAo/qou! 'NV/^V
Gl-98

AUTOKATED FATIGUE CRACK GROWTH RAT E ANALY SIS
Specimen Id. CE5 Contract # 06-8520 Material 2024-T6511 Temperature (F) 74 Environment LA
Geometry ECT Orientation LT Yield (ksi) 60.7 Initial A0 (PD) 0.587 Initial PD %1000. 00
Specimen Dimensions (in)
Thickness 0.116 Width 2.506 Height 0.000
Notch depth Gage length
0.614 0.000
Precrack Parameters
Pmax {lbs) Final a (in)
600.0 0.717
Stress ratio (R) 0.80 Kmax 11.14
Test Parameters
Initial a (in) 0.717 K-gradient -3.50
Initial K 11.20 Stress ratio (R) 0.80
K Coeff PD Coeff .243010 .471310 .000000 .000000 .000000 .000000
Analysis Codes KREP 1 0
Visual Observations
PD Crack (PD) Crack (visual) Error PDAF 92.02 0.717 0.717 0.000 0.998
134.33 0.762 0.762 0.000 0.968
Comments
Date of test: 01-07-1998
Gl-99

Specimen Id. CE5 page l
Pmax PD a N da dN da/dW dK (lbs) (1E-6) (in) (xi) (in) (XI) (in/cyc) (ksi[in]~.5)
92.0 0.7175 10 542 108.1 0.7349 234398 0.0405 595311 6.797E-08 2.06
129.9 0.7580 595320
Gl-100

AUTOMATED FATIGUE CRACK GROWTH RATE ANALYSIS
Specimen Id. CE5A Contract # 06-8520 Material 2024-T6511 Temperature (F) 74 Environment LA
Geometry ECT Orientation LT Yield (ksi) 60 .7 Initial A0 (PD) 0. 587 Initial PD %1000. 00
Specimen Dimensions (in)
Thickness 0.116 Width 2.506 Height 0.000
Notch depth 0.614 Gage length 0.000
Precrack Parameters
Pmax (lbs) 600.0 Final a (in) 0.717
Stress ratio (R) 0.80 Kmax 11.14
Test Parameters
Initial a (in) 0.762 K-gradient 3.50
Initial K 9.50 Stress ratio (R) 0.80
K Coeff PD Coeff 0.240980 0.471310 0.000000 0.000000 0.000000 0.000000
Analysis Codes KREP 1 0
Visual Observations
PD Crack (PD) Crack (visual) Error PDAF 134.38 0.762 0.762 0.000 0.999 314.70 0.977 0.977 0.000 1.003
Comments
Date of test: 01-09-1998
Gl-101
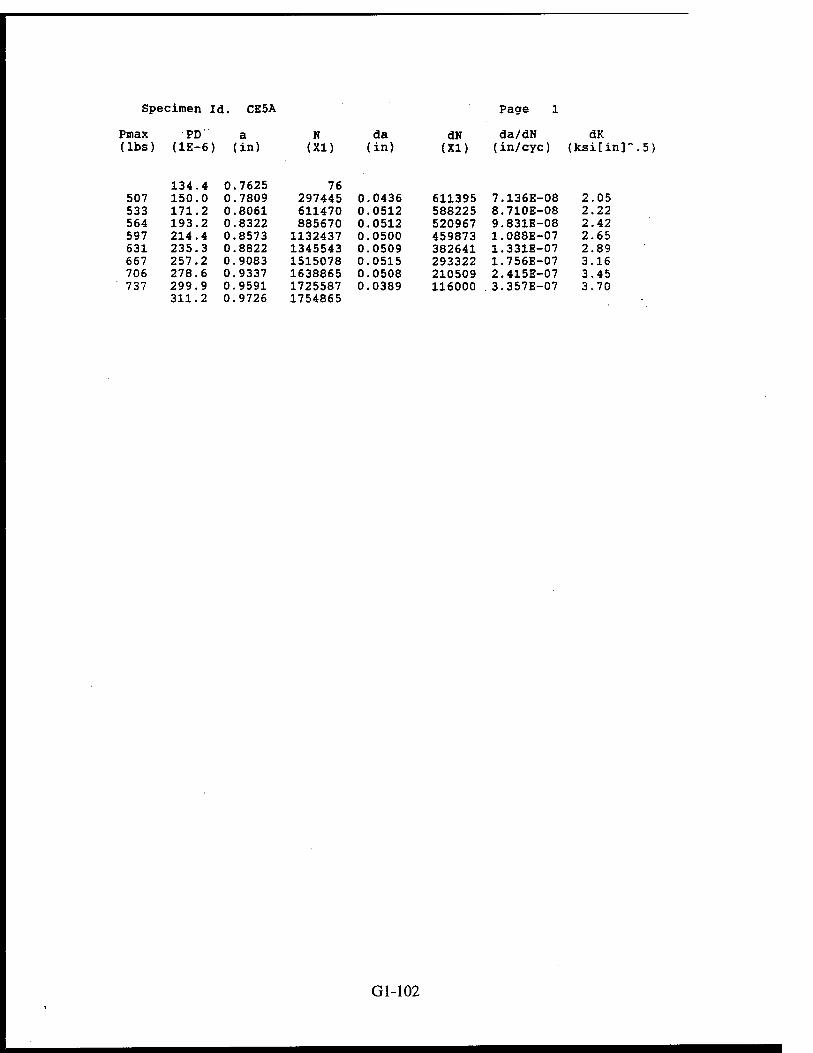
Specimen Id. CE5A Page 1
Pmax PD a K da dN da/dN dK (lbs) (1E-6)
134.4
(in)
0.7625
(XI)
76
(in) (XI) (in/eye) (ksifin]
507 150.0 0.7809 297445 0 .0436 611395 7.136E-08 2.05 533 171.2 0.8061 611470 0 0512 588225 8.710E-08 2.22 564 193.2 0.8322 885670 0 0512 520967 9.831E-08 2.42 597 214.4 0.8573 1132437 0 0500 459873 1.088E-07 2.65 631 235.3 0.8822 1345543 0 0509 382641 1.331E-07 2.89 667 257.2 0.9083 1515078 0 0515 293322 1.756E-07 3.16 706 278.6 0.9337 1638865 0 0508 210509 2.415E-07 3.45 737 299.9
311.2 0.9591 0.9726
1725587 1754865
0 0389 116000 3.357E-07 3.70
5)
Gl-102

AUTOMATED FATIGUE CRACK GROWTH RATE ANALYSIS
Specimen Id. CE5B Contract # 06-8520 Material 2024-T6511 Temperature (F) 74 Environment LA
Geometry ECT Orientation LT Yield (ksi) 60.7 Initial A0 (PD) 0.587 Initial PD %1000. 00
Specimen Dimensions (in)
Thickness 0.116 Width 2.506 Height 0.000
Notch depth 0.614 Gage length 0.000
Precrack Parameters
Pmax (lbs) Final a (in)
600.0 0.717
Stress ratio (R) 0.80 Kmax 11.14
Test Parameters
Initial a (in) 0.977 K-gradient -3.50
Initial K 20.00 Stress ratio (R) 0.80
K Coeff PD Coeff 0.240980 0.471310 0.000000 0.000000 0.000000 0.000000
Analysis Codes KREP 1 0
Visual Observations
PD Crack (PD) Crack (visual) Error PDAF 314.70 0.977 0.977 0.000 1.003 473.40 • 1.167 1.168 0.000 1.008
Comments
Date of test: 01-11-1998
Gl-103

Specimen Id. CE5B Page 1
Pmax PD a N da dN da/dN dK (lbs) (1E-6)
315.5
(in)
0.9777
(XI)
773
(in) (XI) (in/eye) (ksi[in]
696 332.0 0.9974 49157 0.0450 138597 3.248E-07 3.71 626 353.1 1.0228 139370 0.0503 207592 2.425E-07 3.44 554 374.0 1.0478 256748 0.0504 293562 1.718E-07 3.15 491 395.1 1.0732 432932 0.0518 398702 1.299E-07 2.89 435 417.1 1.0996 655450 0.0513 495089 1.036E-07 2.65 384 437.7
459.4 1.1245 1.1506
928021 1285755
0.0510 630304 8.097E-08 2.42
■ 5)
Gl-104

AUTOMATED FATIGUE CRACK GROWTH RATE ANALYSIS
Specimen Id. CE5C Contract # Material
06-8520 2024-T6511
Temperature (F) 74 Environment LA
Geometry ECT Orientation LT Yield (lesi) 60.7 Initial A0 (PD) 0.587 Initial PD %1000.00
Specimen Dimensions (in)
Thickness 0.116 Width 2.506 Height 0.000
Notch depth Gage length
0.614 0.000
Precrack Parameters
Pmax (lbs) Final a (in)
600.0 0.717
Stress ratio (R) 0.80 Kmax 11.14
Test Parameters
Initial a (in) 1.168 K-gradient 3.50
Initial K 10.40 Stress ratio (R) 0.80
K Coeff PD Coöff 242760 ,471310 ,000000 ,000000 ,000000 ,000000
Analysis Codes KREP 1 0
Visual Observations
PD Crack (PD) Crack (visual) Error PDAF 473.46 1.168 1.168 -.001 1.001 686.94 1.430 1.433 0.003 1.013 799.51 1.571 1.569 -.002 1.019
Comments
Date of test: 01-13-1998
Gl-105

Specimen Id. CE5C Page 1
Pmax PD a N da dN da/dN dK (lbs) (1E-6)
473.5
(in)
1.1681
(XI)
11
(in) (XI) (in/cyc) {ksi[in]" .5)
326 489.7 1.1879 255607 0.0450 574805 7.835E-08 2.25 341 510.5 1.2131 574816 0.0515 581824 8.847E-08 2.43 359 531.9 1.2393 837431 0.0526 482024 1.092E-07 2.66 379 553.6 1.2658 1056840 0.0538 406754 1.324E-07 2.92 398 575.9 1.2932 1244185 0.0518 338043 1.534E-07 3.18 420 595.8 1.3176 1394882 0.0519 263265 1.973E-07 3.50 440 618.1 1.3451 1507450 0.0529 184323 2.868E-07 3.81 463 638.7 1.3705 1579205 0.0502 124673 4.026E-07 4.16 486 658.7 1.3953 1632122 0.0536 79355 6.755E-07 4.57 510 681.9 1.4241 1658560 0.0561 40264 1.393E-06 4.99 535 703.9 1.4514 1672387 0.0521 24885 2.093E-06 5.47 561 723.8 1.4762 1683445 0.0509 18528 2.745E-06 6.00 587 744.7 1.5023 1690914 0.0533 12303 4.335E-06 6.55 614 766.4 1.5295 1695748 0.0545 7857 6.936E-06 7.18 642 788.2 1.5568 1698771 0.0522 4802 1.087E-05 7.85 670 808.4 1.5817 1700549 0.0507 3856 1.315E-05 8.61 699 829.8 1.6075 1702627 0.0520 2847 1.826E-05 9.41 728 851.6 1.6337 1703396 0.0507 1595 3.175E-05 10.28 757 871.9 1.6581 1704222 0.0495 1402 3.530E-05 11.24 782 892.7
907.1 1.6832 1.7006
1704798 1704944
0.0425 721 5.889E-05 12.10
Gl-106

00
O 1!
OC CO ULI O •
Ü
o CM
LU
LO CO 00
i h- CO o o LU
< cc h- h- Q X "O LU
Ü
"as LL
CM
LO CO
o CM
o LU o
in CO
+
U) CO +
4 4
3 4
4 4
4 4
4 4
4 4 4 4 4
4 >
\
o o
° I O X.
<
to o O
CO o O
LU O
ÜJ O
CO o LU O
epAo/qou! 'NV/ev
Gl-107

AUTOMATED FATIGUE CRACK GROWTH RAT E ANALY SIS
Specimen Id. Contract # Material
CE6 06-8520 2024-T6511
Temperature Environment
(F) 74 LA
Geometry ECT Orientation LT Yield (ksi) 60.7 initial A0 (PD) 0.599 Initial PD %1000. 00
Specimen Dimensions (in)
Thickness 0.116 Width 2.503 Height 0.000
Notch depth Gage length
0.620 0.000
Precrack Parameters
Pmax (lbs) Final a (in)
600.0 0.717
Stress ratio (R) 0.80 Kmax 11.16
Test Parameters
Initial a (in) 0.768 K-gradient -3.50
Initial K 12.00 Stress ratio (R) 0.80
K Coeff PD Coeff .247340 .471870 .000000 .000000 .000000 .000000
Analysis Codes KREP 1 0
Visual Observations
PD Crack (PD) Crack (visual) Error PDAF 126.52 0.768 0.768 0.000 1.000 238.54 0.897 0.897 0.000 0.986
Comments
Date of test: 01-26-1998
Gl-108

Spe cimen Id. CE6 Page 1
Pmax PD a N da dN da/dN dK (lbs) (1E-6)
126.5
(in)
0.7685
(XI)
5
(in) (XI) (in/cyc) (ksi[in]
544 142.5 0.7870 204076 0.0433 495287 8.735E-08 2.22 490 163.9 0.8118 495291 0.0492 669261 7.358E-08 2.05 435 185.2 0.8362 873337 0.0488 834159 5.849E-08 1.88 386 206.5 0.8606 1329450 0.0480 1012256 4.744E-08 1.72 355 227.3
235.5 0.8843 0.8936
1885593 2145227
0.0330 815777 4.050E-08 1.62
5)
Gl-109

AUTOMATED FATIGUE CRACK GROWTH RAT E ANAL YSIS
Specimen Id. CE6A Contract # 06-8520 Material 2024-T6511 Temperature (F) 74 Environment LA
Geometry ECT Orientation LT Yield (ksi) 60.7 Initial A0 (PD) 0.599 Initial PD %1000.00
Specimen Dimensions (in)
Thickness 0.116 Width 2.503 Height 0.000
Notch depth Gage length
0.620 0.000
Precrack Parameters
Pmax (lbs) Final a (in)
600.0 0.717
Stress ratio (R) 0.80 Kmax 11.16
Test Parameters
Initial a (in) 0.897 K-gradient 3.50
Initial K 7.80 Stress ratio (R) 0.80
K Coeff PD Coeff 0.247340 0.471870 0.000000 0.000000 0.000000 0.000000
Analysis Codes KREP 1 0
Visual Observations
PD Crack (PD) Crack (visual) Error 238.51 0.896 0.897 0.001 466.43 1.179 1.172 -.007 635.18 1.400 1.405 0.005
PDAF 0.981 1.015 1.041
Comments
Date of test: 01-30-1998
Gl-110

Specimen Id. CE6A Page 1
Pmax PD a M da dN da/dN dK (lbs) (1E-6)
238.5
(in)
0.8956
(XI)
6
(in) (XI) (in/cyc) (ksi[in]~ .5)
353 254.0 0.9142 410374 0.0441 886120 4.973E-08 1.69 370 275.0 0.9396 886126 0.0506 912919 5.540E-08 1.83 391 295.6 0.9647 1323292 0.0519 757716 6.855E-08 2.00 413 317.5 0.9916 1643841 0.0529 593149 8.924E-08 2.18 437 338.7 1.0177 1916441 0.0529 517766 1.023E-07 2.39 461 360.3 1.0445 2161608 0.0524 430368 1.219E-07 2.61 487 380.8 1.0701 2346809 0.0534 364743 1.464E-07 2.86 513 403.0 1.0979 2526351 0.0529 319007 1.659E-07 3.12 542 422.9 1.1230 2665816 0.0521 311023 1.675E-07 3.42 570 444.1 1.1500 2837374 0.0541 300463 1.801E-07 3.73 604 465.4 1.1772 2966279 0.0591 217838 2.715E-07 4.12 635 490.2 1.2091 3055212 0.0562 126822 4.431E-07 4.49 672 509.0 1.2334 3093100 0.0527 57272 9.202E-07 4.96 704 530.9 1.2618 3112483 0.0541 32740 1.653E-06 5.39 743 550.5 1.2875 3125840 0.0548 26417 2.075E-06 5.93 780 572.6 1.3167 3138900 0.0574 21967 2.613E-06 6.48 821 594.0 1.3449 3147807 0.0571 14145 4.037E-06 7.14 863 615.7 1.3738 3153045 0.0569 8651 6.581E-06 7.83 906 636.8 1.4018 3156457 0.0534 5539 9.645E-06 8.58 954 657.4 1.4272 3158584 0.0550 3643 1.511E-05 9.47
1000 681.6 702.1
1.4569 1.4821
3160100 3160658
0.0549 2073 2.650E-05 10.33
Gl-lll/Gl-112

APPENDIX G2
Spectrum Crack Growth Tests
Data: Simple Coupon Geometry Results Complex Coupon Geometry Results
Data: Simple Coupon Geometry Results • Spectrum Crack Growth Plots (a vs SFH) Complex Coupon Geometry Results • Spectrum Crack Growth Plots (a vs SFH) • Analysis of Non-Visual Crack Length Measurements • Graphical Compliance and Strain Data • Analyzed Compliance Data

Simple Coupon Geometry Tests
2 tests: SS-2 SS-3
G2-1

0.40
0.35
0.30
~ 0.25 ü c
c 0.20
O
° 0.15
0.10
0.05
0.00
Sim Die Geometrv SCG test SS-2 e o
®
.I..I.
..1 .
....
i.1
.1
i,i,,
o ® • •
short ligament (front) short ligament (back) long ligament (front) long ligament (back)
■
o
- ®
_ o
- •
-
•
•
•
•
•
•
• •
•
• • • « •
©
o
©
o
•
• •
•
•
®
o
0 o
r i i J t > i i -1 -■'''' ■' ■ i ■ ■' '' r-ri ' i ' ■ ■ i' i ITTTTl* i i i i i , i i
20 40 60 80 100 120 140
Spectrum Flight Hours (x1000)
G2-2

0.30
0.25
0.20
sz o c
c 0.15 © -J
O
o 0.10
0.05
Simple Geometry SCG test SS-3
® short ligament (front) © short ligament (back) © long ligament (front) o long ligament (back)
9
0
•
c • « •
« • ©
0
• • ®
0
® ©
® ©
©
© ® o [
® © 0
©
4» &
■ A® ® ®
o
; 0
- 1 1 1 M 1 | 1 ' 1 1 1 1 1 1 1 l 1 ' | 1 1 1 1 U 1 . 1 | 1 1 1 1 1 t 1 ■ 1 | 1 l 1 1 1 L 1 1 1 | 1 1 1 1 1 H 1 1 ) 1 1 1 1 T 1 1 1 t | I n T' T"."T"i my rvrvrrm ■rTrrrrriTr
0 10 20 30 40 50 60 70 80 90 100
Spectrum Flight Hours (x1000)
G2-3

Complex Coupon Geometry Tests
3 tests: CS-lto-3
G2-4

0.300
0.275
0.250
0.225
0.200
Complex Geometry SCG Test CS1 ® Fracture surface measurement
—— KRAK gage (non-visual) measurement
.£ 0.175 X CD c © 0.150
o CO
O 0.125
0.100
0.075
0.050
0.025
0.000
Average difference between the fracture surface measurement
and the KRAK gage measurement = 0.020 inch
25000 50000 75000 100000 125000
Spectrum Flight Hours
G2-5

0.30
Complex Geometry SCG Test CS2 ® Fracture surface measurement KRAK gage (non-visual) measurement
0.25
0.20
0) c 03 c 0.15
o (8
o
0.10
0.05
Average difference between the fracture surface measurement
and the KRAK gage measurement = 0.013 inch
0.00 i ' •' ' ' '' •' '' '''''"'' '''' •' •' ''' ''' '' '' '''» ' '' 0 40000 80000 120000 160000 200000
Spectrum Flight Hours
G2-6

0.30
0.25
0.20
c 0) c 0.15
u o
0.10
0.05
Complex Geometry SCG Test CS3
© Fracture surface measurement KRAK gage (non-visual) measurement
Average difference between the fracture surface measurement
and the KRAK gage measurement = 0.018 inch
Q fill "j",c,fi i "i'-r-i-i : ; , r r !■ i,n r t i r ; i i i i i-i"1; IT| I ■I'"I ■ i I i cr'ryif rrrTr-rr}11!"!1 n i'Ti'T't'
9 25000 50000 75000 100000 125000 150000
Spectrum Flight Hours
G2-7

Analysis of Non-Visual Crack Length Measurements
Due to the unusually large difference found between the KRAK gage and markerband measurements, an investigation into possible causes for this discrepancy was undertaken. The KRAK gage position relative to the fastener hole was measured and the resulting offset added to the non-visual crack length measurements
Balancing or zeroing of all KRAK gages was performed after the complex joint had been assembled but prior to any applied loading cycles. Fractomat output was checked by performing a controlled crack growth experiment using a KRAK gage and two Fractomats (one of which was the Fractomat use for this project). Both Fractomats were zeroed using the gage, and then the KRAK gage was cut incrementally using a scalpel, with indicated voltage output measured for both Fractomats. Only an average difference of 0.001-inch was measured between the two Fractomats. Therefore the Fractomat was not considered a contributor to the crack length offsets found.
Upon further investigation of the procedure used to attach the gages to the test section of the complex joint, it was found that on two of the three test coupons the front of the foil gage was trimmed back from the fastener hole. A comparison of an original gage and that found on the test coupon CS1 is shown in Figure B.l. Clearly there is a difference in the initial portion of the KRAK gage. For tests CS1 and CS3 the amount of foil removed on the mid-section was measured as 0.013 inch and 0.005 inch, respectively.
However, damage or cutting of the foil gage could result in incorrect crack lengths, when using the assigned calibration coefficients for this gage. A controlled experiment found that after trimming approximately 0.012 inch of foil from the KRAK gage, an average error of approximately 0.010 inch was found between the physical crack lengths and those calculated using the calibration coefficients, as shown in Figure B.2. All procedures mirrored those used in the complex geometry tests. When the crack length error in the controlled experiment is compared with the error obtained in the complex tests (Figure B.3), it is apparent that trimming the gages does not account for the total error observed. Also the gage on coupon CS2 was not trimmed and an error was still recorded.
It is also possible for the crack in the gage to lag behind the physical crack on the specimen if the glue line between the KRAK gage and the specimen is larger than normal, for example, not enough clamping force is used during attachment of the gages. This also relates to the type of backing used on the KRAK gage. The backing used for the complex geometry test was an epoxy- phenolic with fiberglass reinforcement. In hindsight it may have been advisable to use the -CE (or cast epoxy) backing. This backing is a very thin and brittle cast epoxy with no reinforcement, and is used for crack growth testing requiring utmost response and sensitivity such as in near- threshold testing or possibly when using benign civil aircraft spectra. However, due to it's inherent fragility it was decided against using the -CE backing.
G2-8

One final point with regard to the attachment method used in the complex geometry testing, is that a thin layer of teflon tape was placed between the extension tab and the KRAK gage, so that the gage was only attached to the test section and not the extension tab. This could possibly have wedged the gage away from the test section, resulting in a thicker glue line being applied. This may then have resulted in a crack length lag between the non-visual and physical crack length during spectrum testing.
In conclusion, the differences found between the non-visual (KRAK gage) and visual (markerband) crack length measurements could be explained in terms of the following:
• For tests CS1 and CS3, cutting of the foil gage resulted in incorrect crack length calculations using the supplied calibration equation.
• It is possible that a combination of glue line thickness and KRAK gage backing material decreased the sensitivity of the KRAK gage to measure the physical crack length accurately.
G2-9

(a)
original KRAKgage ; profile
0.013 inch '
3?8
^F$sr
(b)
Figure B.1. Comparison of KRAK gages KG-BH5616-X08 (a) unused and (b) test CS1.
G2-10

10
9
8 -I
I 6 3 a § 5
2 4 o OS v. u.
KRAK gage KG-BH5616-X08 crack length (calibration coefficients) crack length (physical measurement)
0.00 0.05 0.10 0.15 0.20 0.25
crack length (inch)
0.30 0.35
Figure B.2 Comparison of calculated and physically measured crack length for the controlled KRAK gage experiment
G2-11

0.04
0.03
0.02
ü £ 0.01 a <
0.00
-0.01
-0.02
a B
■ V
vv V V A
VBJ^ä AA A A
a
'AÄ
@ Controlled experiment (trimmed) B CS1 (trimmed) A CS2 (untrimmed) v CS3 (trimmed)
0.00 0.05 0.10 0.15 0.20 0.25 0.30
physical crack length (inch)
0.35
Figure B.3 Comparison of crack length error between markerbands and KRAK gage
G2-12

Graphical Compliance and Strain Data
G2-13

o ,*_s, " o
en /I 11/ o . o 3 •an ® <l i©<
CO ] I B . Q) »on $ 4i en
L. j fi -
CD KID «i < 1
1 03(11 ■ o " o Ü >
s Ij " o C I0CD © <l 0(8 . o .2 j i . o
ii an S < T-
Q. l \
E /
s a 111 I 1
■
0 ill - o o k an 0 l
|| - o - o
CO
*» i > CXD i l L JJ
i I - o
00 3 o
SD £
o i i an < I l - *J 17 - JZ
i > an i ) « j [ - .5?
> i o £ .b > QD < 1 i
1 ii
o - o o E
<u c 05 35 c c n> on c c
O) 05 c e 0) e j 3
E S 5 T3 =g =5 TJ "O T3 1 > cm <i 1 4 f Ö to -*J
C6 (IS CO ca n 5 5 J i; u o o 0 0 a o o o — — ;! o 0) 5 c "E
3 3 c c 3 3 3 3
C 1 3
i an 4
i an «
a ' f ii a O N M <0 f» • ' ) < i A
i II - o
CA
x 1 1 ! 1 i J. j - o o t a a a a a a a
i i an « i ( i 4* II - o o
a I : *■
E i > DU C i
t 1 <Q II
0 i ► DTI Cg < I,
1 o . ü ' j o 2 *-». /«^. *■■■*
CD U) 09 o5 3 cS © i on i < i 4< o C C C c c c c *•■ | - o
a «HI V TS '-V
CO £5 CG T3 TJ T5 T3
(0 CO . an e < i 4" o
- CM o 0 .O O 0 O 0 o o '; >■»* <ta^
LL
T- C
1 j
«3 r~
i i i ;
00 ' i cm e 1 SI i
(1 < i 4 o ^ [
O 1 OJ3 € 1 C( i
o i i i 1 1 1 1
O
■ lit
O
! 1 1 ! IB ;—l—K«m» 1 l l l 1 | 1 l—l l l l i i | <«J
3 O O o O O c 3 O IC > "fr CO c M T-
(d\m3ri) doue;|diuoQ
G2-14

T-CMCO<sfrUOCDN-CO
o X U. CO
3 a 3 o a CO O
CO
CO
CO a c
£ • «IB
u a) a CO
o o
o o CM
o o o
o o CO
o o CO
o o
o o CM
E +-» CO =1
o O o o O O o o o o o o O O o o o u> o to O CO o in <sf CO CO CM CM T- V*
(sq|) peo|
G2-15

T-{Mm*fLOtßN»{0
o ©
o o CM
o o o
o o 00
o © CO
o o
o o CM
r ©
03
0)
o o o o o o o o o o o o o o o o o to Ö U) o to o to ^f CO CO CM CM T- T~
(sqj) peoj
G2-16

T-CMtO^-WtON-00
10
lO 00 CO
X UL CO
+■* 3 a
+■» 3 o a O) (0 O c a L.
+-» CO r- CO Ü C a E "o a
CO
o o
© o
O O o
o o 00
o o
O O
o o
ca •4-1 w
o o o o o o Q © o o o o o o O o o in o in o w O u> rr CO CO ca CM v- T*
(sq|) peo|
G2-17

T-weosj-wcor-co
O O
o o CM
O O O
O O CO
O O
o o
o o CM
1
I I I I | I I I I ( I I—l""l | I (' I I—j I I—I 1 | I I 'T I j I I I I |' l l I I
o o o o o o o o o o o o o o o o o 10 © 10 o to o io <fr <0 CO CM CM T- V
(sq|) peo|
G2-18

CM to CM 00
X LL CO
a O 0 O) CO O
CO
CO
a c a E 5 o a
CO
o o o
rNW^lOtOS»
O o
o o CM
© o o
o o 00
o o <0
o o
o o CM
v. « =1
O o to CO
o o o CO
© o Iß CM
O O O CM
O O in
o o o o o 10
(sq|) peo|
G2-19

T-CMP3'<rtß<DKCD
CM CM O 0) 0) I u. CO
•♦-»
a 4-» 3 o <D CO (C O c '5 CO
CO Ü
c © E o a
CO
o o
o o CM
O © O
O O oo
o o o
o o
o o CM
A3 u tn zL
■ri"i' i | t I i I | ) i i "i "i1 i i ) i | )—r—I—I" (' I'"I—I "rM -| r i i—i [ i ii i
o o o o o o o O o o o o o o o o o to o Ift o in o W ■* CO CO CM CM T- r*
(sq|) peo|
G2-20

T-CSJOM-lOtON-»
00 T- o T- CM
X Li. CO
4-* 3 a
+•> 3 o
CD ro CO O c ro L.
-¥•* CO
co Ü c CD
E O Q a
CO
o o
o o CM
O O o
o o 00
O o CO
o o
o o CM
L.
w
o o o o o 10 CO
o o o CO
o o IO CM
o o o CM
o o 10
o o o o o 10
(sq|) peo|
G2-21

C/5 -M
3 (A 0} u 03 Ü C .5 a E o a
CM CO o
E o o
CD x ® a E o ü
JC a &.
*<5 LL
O) O) O! CO U) c c c c c '■5 5 5 15 g g § | g E C C C C 3 3 3 3 3
01 C 5 re E 3
0) oi
T3
J C 3
(0 o c 3
CM « "* «> «O N- 00
D a HOB
u> © D! Ö) O) o> m 0) c c C c c c c c
T3 T3 ■o ■D •a T3 ■o T3 as BJ fl> (IS to re IB « 0 0 O 0 0 0 0 O
r- « « V «5 (0
• ©©00© Tii IT
N i i
© !
es
IIC3
3D «I
5 5 A
i i i i i i i
CD a
(03 0
03 <?
£13 0
CD 6
03 J3
H ta a
03 a
03 0
03
T*f-ta-
O o o o
o o o o o SN
o o o o
o o o o o
r-ÖÖrCH
3 o X
X
CM
E 3 i. *J U 0) a
o o o o in
TTTTTT
O O
(djH/3rl) aouBijdujoo
G2-22

r-CMCOTriOODN-CO
o o
o o CM
O o o
o o
o o
o o
o o CM
o
as
I I 1 I—I"'I" I I I I "I I I I I I—I I I I I I I—I f 'I I i f I I ( 1 I I I I I I
o o o o © O o o o o o o o O o o o in o in o m o m *■ CO « CM CM ■ «^ T-
(sq|) peo|
G2-23

T-caco^iotoN-oo
O T** o
X ÜL CO
3 a 4-» 3 o Q) O) (0 o c CG i-
CO CM CO ü c © E "5 a
co
o o
o o CM
O o o
o o 00
o o (0
o o "fr
o o CSJ
i-
03 3.
-i—i—n—pi—' ' '—I i i—i—i | i—i—i i | i i—i—i—i—n—i—i | i—i—i—r-[' t i—i—r
o o o o o o o o o o o o o © o o o io o in o in o Iß ■^r CO (0 <M Ol T* ^
(sq|) peoj
G2-24

r-NCO^lOtO^OO
O co 00
LL co +•> 3 a ■♦-» 3 o CD ö)
O c
"(5
CO CM CO ü c CD
E ü o a
€0
o o
o o CM
O O o
o o
o o to
o o
o o CM
=J.
o o o o o O O o o o o o o O o o o 10 o IT» o Id o 10 ■*• co co CM CM r- T-
(sq|) peo|
G2-25

rNW^UXDNM
O o
o o CM
o o
o o CO
o o CD
o o
o o CM
V) a.
o o O o o O o o o o O © o O o o o W O to o 10 o w ■tf 00 CO CM CM ^ T-
(sq|) peo|
G2-26

■r-cacO^WON-00
CM O O Iß CO
LL CO
*-» 3 a
4-» 3 o 0) D) CO O E '5 L_
+-> CO CM CO o c CD
Ü O CL
CO
o o
o o CM
O O o
o o 00 c
(6 i_ 4J CO
o Ä o <£>
O o <<fr
o o CM
O O o o o O o o O O o o o O o o O in o in o in o in Tt CO CO CM CM T" T*
(sq|) peo|
G2-27

T-OJW*frl/><ON*CO
o o
o o CM
o o o
o o
*cs
« o =*- o to
o o
o o
o o o o o o o o o o o Q o o o o o in o to o to o IO ■*• CO CO OJ w V T"
(sq|) peoj
G2-28

w
3
© u 0) Ü c CO
"5. E o Ü
CO CO o
CD E o O X o a E o ü TJ
IE o '5 LL
I
mn G> f
? c c O) c ■D TS "0 XI T3 « ffl a «5 s O 0 0 0 c c c c C 3 3 s 3 3
CM CO
tJ g 3
ff to tt>
TJ a o c 3
X) as o c 3
c> eo
■ B 13 a 8
U) O) O) B) 0) n> O) 0) c c c c c e c c
TJ TJ xs xs T5 XI XJ X5 as as as as RJ as as n 0 0 o 0 O o 0 o
rNM'ifttltBN»
0 G H i ° t
<ps e
<p s
d 3
<D 9
O p
CD 0
d a
i i i i i i i i i i J » i • i i i i 1%-P-iO 'i r rr»
o o o o 1*
o o o o CM
O o o o 2 «
3 O
o -c
§ § 00 5=
o o o o CO
o o o o
o o o o
3 s_
4-* o o (A
<OM»
o o in
o o o o CO
o o o o f
—JI , j J_
(dj>|/3rl) aouBi|dujoo
G2-29

■r-estto'twajf^oo
O o
o o CM
O O O
O O oo
o o CO
o o
o o CNJ
E
o o © o o © o o o o o o o O o o o m o 10 o Iß o to <tf CO CO CM CM T- T-
(sq|) peoj
G2-30

rNW^IflCDNM
CO CM yr CM CM
I W
a o
CD O CO O c u
■+-» CO
CO CO Ü c CD
E *o a
CO
o o
o o CM
o o o
o o 03 c
CO l_ •*•* »
O =L O CO
O o •sr
o o eg
o o o © o O o O o o o B o O o O o in o o o o to * CO CO «N CM V r»
(sq|) peo|
G2-31

CM M "<fr IÄ CO h- 00
o o
o o CM
O O O
o o CO £
(C s_
■M (0
o n o to
o o «tf
o o CM
- o
T—i—n—pi—ii i | i—i—i—I—[-1—i—i—I—| r 'i i—i—|—i—i—f"f" ) "'""i <—i—|—i—r
o o o o o O o o o o o o o O o o o IO o ID o U5 © »n <* CO CO CM CM T" ^
(sq|) peo|
G2-32

CM CO <tf lA CD r- 00
CD
O CD CD
I LL CO
3 o o Ui CO O c CO u -H co CO CO o C CD E '5 CD a
CO
o o
O O <N
O O O
O o 00
o o CO
o o
o o CM
2
o o o © © o © o o o o © © o o © o \n o to o in o in rf CO CO CM CM T" T-
(sqj) peo|
G2-33

vWCO^toCOP^OO
o o
© o 04
© O O
O O 00
O O CO
O O
o o CM
CO
i i i i I i i i i I 'i i—i 'i"i' "i ii i | i i ii -f ) i i I | i—iiijiiii
o o o o o o © o © o o o o o O © o w o in o to O m "fr CO CO 04 04 r* T"
o
(sq|) peoj
G2-34

rNW^inCDSffl
o o
o o CM
o o o
O O 00
O O
O O
O o
CO u (fi
o o o o O o O o o o o o O o O o o in o U) o in o m <fr m » CM CM T~ T-
(sq|) peoj
G2-35

CM CO -tf in <D N- 00
o o
o o CM
O O O
O O 00
O o so
o o
o o CM
C6
o o o o o o o o o o o o o o o o o w o IO o in o w «fr co CO CM CM T" T-
(sq|) peo)
G2-36

Analyzed Compliance Data
G2-37

STRAIN LOAD/UNLOAD ANALYZER
File Prefix = csl-1 Current Flight Hours = 0.0
Number of Files = 3 with Number of Strain Gages = 8
6 junk lines each
LOADING:
jJL — eivej .dges o
stm SLOPE INTER STAND chan ms/kip mstrn DEV
1 313.9 17.5 1.419 2 202.8 -19.5 1.554 3 265.4 6.1 1.175 4 295.1 6.6 1.338 5 167.6 -6.6 0.990 6 161.1 -2.4 1.136 7 175.8 26.3 2.562 8 287.8 11.0 1.620
3 files
UNLOADING: strn SLOPE INTER STAND chan ms/kip mstrn DEV
1 314.4 12.5 1.259 2 203.1 -21.1 1.392 3 264.5 9.5 1.062 4 294.5 8.0 1.193 5 . 169.3 -5.8 0.971 6 159.1 10.3 0.948 7 168.2 46.9 1.416 8 285.0 14.7 1.080
STRAIN LOAD/UNLOAD ANALYZER
File Prefix = csl-2 Current Flight Hours = 5525.0
Number of Files = 3 with Number of Strain Gages = 8
6 junk lines each
LOADING:
JJL — csvei .ciyetj u
strn SLOPE INTER STAND chan ms/kip mstrn DEV
1 312.0 38.0 1.807 2 204.5 -42.9 1.389 3 265.3 10.5 1.241 4 294.6 13.1 1.231 5 168.5 -37.2 1.033 6 162.1 -28.2 1.464 7 171.1 38.8 2.244 8 287.9 20.1 1.627
3 files
UNLOADING: strn SLOPE INTER STAND chan ms/kip mstrn DEV
1 313.0 23.1 1.214 2 201.6 -28.7 0.957 3 264.2 14.2 1.117 4 294.3 10.1 1.288 5 168.9 -25.1 0.985 6 157.9 -1.9 1.085 7 170.9 46.1 1.714 8 284.7 24.9 1.214
G2-38

STRAIN LOAD/UNLOAD ANALYZER
File Prefix = csl-3 Current Flight Hours = 11014.0
Number of Files = 3 with Number of Strain Gages = 8
6 junk lines each
LOADING:
JCJ — avci ayeo u
strn SLOPE INTER STAND chan ms/kip mstrn DEV
1 310.5 43.8 1.710 2 203.8 -42.3 1.479 3 264.4 13.2 1.244 4 294.4 13.5 1.265 5 167.9 -42.7 1.199 6 162.0 -27.7 1.881 7 170.4 33.3 1.731 8 287.2 21.9 1.524
3 files
UNLOADING: strn SLOPE INTER STAND chan ms/kip mstrn DEV
1 313.4 23.7 1.288 2 201.4 -29.3 1.032 3 264.4 14.0 1.204 4 293.4 12.0 1.369 5 169.4 -30.3 1.032 6 158.4 0.8 0.938 7 171.0 38.8 1.750 8 284.0 24.8 1.178
STRAIN LOAD/UNLOAD ANALYZER
File Prefix = csl-4 Current Flight Hours = 16515.0
Number of Files = 3 with Number of Strain Gages = 8
6 junk lines each
LOADING:
j£i — eivm ayes» o
strn SLOPE INTER STAND chan ms/kip mstrn DEV
1 311.4 38.4 1.641 2 203.7 -41.4 1.636 3 265.0 9.3 1.158 4 293.6 18.0 1.200 5 168.3 -43.5 1.146 6 162.3 -25.8 1.598 7 173.2 38.9 2.449 8 288.5 25.6 1.668
3 files
UNLOADING: strn SLOPE INTER STAND chan ms/kip mstrn DEV
1 313.5 21.5 1.259 2 202.7 -31.6 1.114 3 264.6 11.6 1.187 4 294.8 10.8 1.281 5 169.6 -33.0 0.960 6 158.2 -0.9 0.992 7 170.0 50.1 1.415 8 284.5 31.7 1.215
G2-39

STRAIN LOAD/UNLOAD ANALYZER
File Prefix = csl-5 Current Flight Hours = 22013.0
Number of Files = 3 with Number of Strain Gages = 8
6 junk lines each
LOADING:
JUJ — avej reiges oz a XJ. J rixes
UNLOADING: strn SLOPE INTER •STAND'.. strn SLOPE INTER STAND chan ms/kip mstrn DEV chan ms/kip mstrn DEV
1 311.1 42.6 1.659 1 313.3 25.1 1.042 2 204.3 -44.8 1.439 2 202.7 -34.0 1.356 3 265.1 10.5 1.193 3 264.0 13.7 1.017 4 294.7 15.8 1.270 4 295.5 9.8 1.252 5 168.9 -50.1 1.242 5 169.3 -37.2 0.915 6 162.7 -29.9 1.605 6 158.0 -4.9 0.944 7 172.2 33.7 2.238 7 170.3 41.0 1.286 8 287.4 27.9 1.590 8 284.1 31.5 1.041
STRAIN LOAD/UNLOAD ANALYZER
File Prefix = csl-6 Current Flight Hours = 27512.0
Number of Files = 3 with Number of Strain Gages = 8
6 junk lines each
p- iii ja — avei rages o
LOADING: strn SLOPE INTER STAND chan ms/kip mstrn DEV
1 310.8 37.6 1.464 2 204.9 -40.6 1.549 3 264.1 7.6 1.075 4 293.9 18.2 1.240 5 168.5 -36.8 1.016 6 163.9 -29.0 1.842 7 171.5 40.4 1.895 8 288.4 25.7 1.362
3 files
UNLOADING: strn SLOPE INTER STAND chan ms/kip mstrn DEV
1 313.2 20.9 1.116 2 203.0 -28.7 1.028 3 264.4 9.0 1.057 4 295.5 12.0 1.131 5 169.4 -24.4 0.870 6 158.6 -0.9 0.897 7 170.4 47.3 1.547 8 285.3 29.1 0.998
G2-40
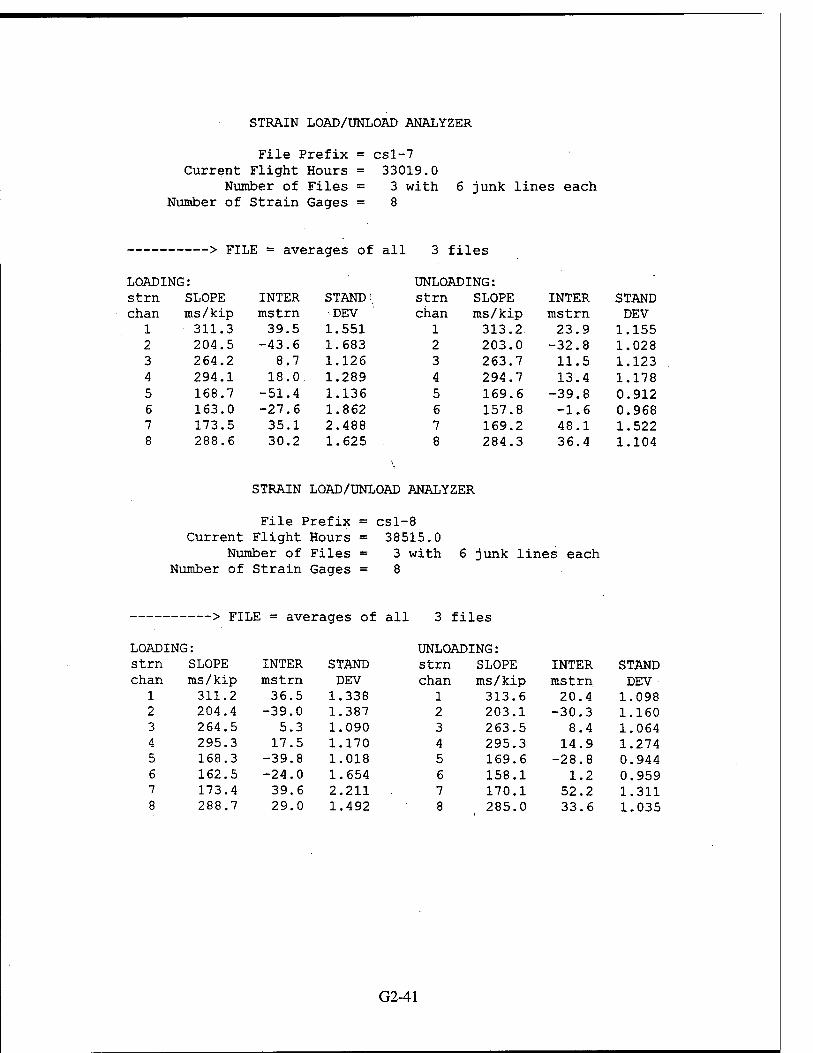
STRAIN LOAD/ÜNLOAD ANALYZER
File Prefix = csl-7 Current Flight Hours = 33019.0
Number of Files = 3 with Number of Strain Gages = 8
6 junk lines each
LOADING:
JEJ — avei ages o
strn SLOPE INTER STAND chan ms/kip mstrn DEV
1 311.3 39.5 1.551 2 204.5 -43.6 1.683 3 264.2 8.7 1.126 4 294.1 18.0. 1.289 5 168.7 -51.4 1.136 6 163.0 -27.6 1.862 7 173.5 35.1 2.488 8 288.6 30.2 1.625
3 files
UNLOADING: strn SLOPE INTER STAND chan ms/kip mstrn DEV
1 313.2 23.9 1.155 2 203.0 -32.8 1.028 3 263.7 11.5 1.123 4 294.7 13.4 1.178 5 169.6 -39.8 0.912 6 157.8 -1.6 0.968 7 169.2 48.1 1.522 8 284.3 36.4 1.104
STRAIN LOAD/UNLOAD ANALYZER
File Prefix = csl-8 Current Flight Hours = 38515.0
Number of Files = 3 with Number of Strain Gages = 8
6 junk lines each
LOADING:
je* — dvex ages o
strn SLOPE INTER STAND chan ms/kip mstrn DEV
1 311.2 36.5 1.338 2 204.4 -39.0 1.387 3 264.5 5.3 1.090 4 295.3 17.5 1.170 5 168.3 -39.8 1.018 6 162.5 -24.0 1.654 7 173.4 39.6 2.211 8 288.7 29.0 1.492
3 files
UNLOADING: strn SLOPE INTER STAND chan ms/kip mstrn DEV
1 313.6 20.4 1.098 2 203.1 -30.3 1.160 3 263.5 8.4 1.064 4 295.3 14.9 1.274 5 169.6 -28.8 0.944 6 158.1 1.2 0.959 7 170.1 52.2 1.311 8 285.0 33.6 1.035
G2-41

STRAIN LOAD/UNLOAD ANALYZER
File Prefix = csl-9 Current Flight Hours = 45725.0
Number of Files = 3 with Number of Strain Gages = 8
6 junk lines each
LOADING:
JEI — avej rages o
strn SLOPE INTER STAND chan ms/kip mstrn DEV
1 310.9 42.1 1.642 2 204.6 -46.3 1.682 3 264.2 7.5 1.218 4 295.3 16.5 1.309 5 168.9 -56.8 1.193 6 163.4 -31.7 1.722 7 173.1 32.1 2.624 8 288.4 31.0 1.801
3 files
UNLOADING: strn SLOPE INTER STAND chan ms/kip mstrn DEV
1 312.4 27.7 1.357 2 203.8 -37.6 1.095 3 263.3 10.8 •1.113 4 295.4 14.1 1.215 5 169.6 -43.1 0.924 6 157.9 -2.7 0.951 7 169.5 43.8 1.367 8 284.6 35.2 1.118
STRAIN LOAD/UNLOAD ANALYZER
File Prefix = csl-10 Current Flight Hours = 49517.0
Number of Files = 3 with Number of Strain Gages = 8
6 junk lines each
— — —>» rxi
LOADING:
JE. — avei rages o
strn SLOPE INTER STAND chan ms/kip mstrn DEV
1 311.0 34.7 1.623 2 204.5 -37.3 1.302 3 263.9 0.9 1.207 4 293.7 23.5 1.182 5 167.8 -38.7 0.985 6 162.6 -20.9 1.727 7 173.6 34.5 1.978 8 288.4 31.8 . 1.489
3 files
UNLOADING: strn SLOPE INTER STAND chan ms/kip mstrn DEV
1 312.8 17.9 1.109 2 202.9 -27.1 1.146 3 262.6 4.3 1.076 4 296.0 16.9 1.146 5 168.1 -24.5 0.891 6 159.3 6.4 0.880 7 171.4 49.4 1.335 8 285.0 36.9 1.084
G2-42

STRAIN LOAD/UNLOAD ANALYZER
File Prefix = csl-11 Current Flight Hours = 55014.0
Number of Files = 3 with Number of Strain Gages = 8
6 junk lines each
> FILE = averages of all 3 files
LOADING: UNLOADING: strn SLOPE INTER STAND \ strn SLOPE INTER STAND chan ms/kip mstrn DEV chan ms/kip mstrn DEV
1 310.6 39.7 1.761 1 312.1 24.5 1.327 2 205.7 -44.6 1.337 2 203.2 -34.0 1.370 3 263.5 5.6 1.302 3 262.2 8.2 1.182 4 295.4 18.8 1.238 4 295.1 16.1 1.373 5 168.1 -55.0 1.396 5 168.8 -42.4 1.046 6 163.9 -31.0 1.926 6 157.3 -2.8 1.221 7 174.0 33.2 2.457 7 169.5 46.5 1.386 8 288.5 35.0 1.854 8 284.4 40.1 1.240
STRAIN LOAD/UNLOAD ANALYZER
File Prefix = csl-12 Current Flight Hours = 60520.0
Number of Files = 3 with Number of Strain Gages = 8
6 junk lines each
LOADI* IG:
j£, — civei d(je& u
strn SLOPE INTER STAND chan ms/kip mstrn DEV
1 310.6 35.2 1.504 2 204.7 -39.3 1.349 3 263.2 0.9 1.138 4 296.5 16.5 1.251 5 167.7 -46.5 1.461 6 162.5 -25.5 1.244 7 173.0 38.2 2.696 8 288.3 34.8 1.634
3 files
UNLOADING: strn SLOPE INTER STAND chan ms/kip mstrn DEV
1 312.2 20.7 1.143 2 203.6 -31.8 1.123 3 262.4 2.6 1.088 4 295.5 16.4 1.169 5 168.8 -35.5 0.932 6 157.6 0.6 0.880 7 169.5 49.4 1.274 8 284.5 38.9 1.103
G2-43

STRAIN LOAD/UNLOAD ANALYZER
File Prefix = csl-13 Current Flight Hours = 66022.0
Number of Files = 3 with Number of Strain Gages = 8
6 junk lines each
- — — -» ru je. — avej rages o
LOADI1 strn
«3: SLOPE INTER STAND
chan ms/kip mstrn DEV 1 310.5 36.1 1.529 2 204.6 -40.4 1.374 3 262.4 0.8 1.187 4 294.6 22.2 1.203 5 167.5 -49.7 1.110 6 162.9 -25.0 1.857 7 172.5 37.2 2.186 8 288.8 32.4 1.511
3 files
UNLOADING: strn SLOPE INTER STAND chan ms/kip mstrn DEV
1 312.5 18.6 1.121 2 202.8 -27.8 1.189 3 261.9 1.6 1.168 4 295.8 17.8 1.360 5. 167.9 -30.7 0.962 6 157.5 9.2 0.971 7 171.8 44.6 1.492 8 284.7 36.0 1.205
STRAIN LOAD/UNLOAD ANALYZER
File Prefix = csl-14 Current Flight Hours = 71527.0
Number of Files = 3 with Number of Strain Gages = 8
6 junk lines each
jt - avei rages o
LOADING: strn SLOPE INTER STAND chan ms/kip mstrn DEV
1 310.3 32.6 1.433 2 204.5 -35.3 1.510 3 262.7 -3.4 1.158 4 295.8 23.1 1.246 5 166.7 -45.5 1.016 6 163.2 -25.3 1.560 7 173.1 38.8 2.260 8 288.9 36.9 1.513
3 files
UNLOADING: strn SLOPE INTER STAND chan ms/kip mstrn DEV
1 311.9 18.8 1.201 2 203.5 -27.2 1.112 3 261.7 -1.6 1.153 4 295.9 20.3 1.174 5 167.8 -34.3 0.937 6 158.9 -0.1 0.940 7 170.8 50.1 1.413 8 285.5 41.3 1.117
G2-44

STRAIN LOAD/UNLOAD ANALYZER
File Prefix = csl-15 Current Flight Hours = 77024.0
Number of Files = 3 with Number of Strain Gages = 8
6 junk lines each
LOADING:
JC — avci
strn SLOPE INTER STAND;
chan ms/kip mstrn DEV 1 310.8 35.2 1.696 2 205.3 -38.4 1.460 3 262.3 -4.0 1.202 4 296.2 25.2 1.265 5 166.5 -50.9 1.049 6 164.1 -26.2 1.813 7 174.8 33.0 2.416 8 289.4 37.1 1.791
3 files
UNLOADING: strn SLOPE INTER STAND chan ms/kip mstrn DEV
1 313.0 15.2 1.258 2 203.5 -24.9 1.267 3 261.7 -5.2 1.170 4 296.6 22.3 1.249 5 167.3 -33.2 0.994 6 158.8 6.9 0.986 7 172.5 45.3 1.496 8 285.4 40.4 1.252
STRAIN LOAD/UNLOAD ANALYZER
File Prefix = csl-16 Current Flight Hours = 82521.0
Number of Files = 3 with Number of Strain Gages = 8
6 junk lines each
LOADING:
l£i — OVCl
UNLOADING: strn SLOPE INTER STAND strn SLOPE INTER STAND chan ms/kip mstrn DEV chan ms/kip mstrn DEV
1 310.9 31.3 1.419 1 312.3 15.8 1.245 2 204.6 -32.5 1.471 2 204.4 -27.1 1.109 3 261.9 -8.8 1.160 3 261.1 -7.7 1.127 4 297.1 26.4 1.183 4 296.5 25.1 1.151 5 165.6 -47.0 0.982 5 166.8 -37.3 0.918 6 162.6 -23.1 1.282 6 158.6 0.6 0.926 7 174.6 40.7 2.266 7 170.3 54.6 1.333 8 289.7 39.7 1.405 8 285.1 46.1 1.181
G2-45

STRAIN LOAD/UNLOAD ANALYZER
File Prefix = csl-17 Current Flight Hours = 88004.0
Number of Files = 3 with Number of Strain Gages = 8
6 junk lines each
LOADI1 JG:
id — aval oyco v
strn SLOPE INTER STAND chan ms/kip mstrn DEV
1 304.9 55.5 1.286 2 209.7 -52.3 1.305 3 259.7 4.5 1.189 4 296.2 35.1 1.272 5 169.6 -75.5 1.342 6 172.3 -31.7 1.302 7 176.6 27.2 1.756 8 288.0 22.7 1.435
3 files
UNLOADING: strn SLOPE INTER STAND chan ms/kip mstrn DEV
1 311.6 22.8 1.424 2 204.3 -28.8 1.129 3 260.3 -1.9 1.247 4 296.5 33.7 1.382 5 164.8 -42.0 1.055 6 162.4 18.2 1.118 7 174.9 43.9 1.578 8 286.5 20.8 1.375
STRAIN LOAD/UNLOAD ANALYZER
File Prefix = csl-18 Current Flight Hours = 93514.0
Number of Files - 3 with Number of Strain Gages = 8
6 junk lines each
LOADING:
JCJ — avei ayes u
strn SLOPE INTER STAND chan ms/kip mstrn DEV
1 309.7 34.0 1.428 2 206.0 -39.4 1.125 3 260.8 -10.6 1.149 4 296.7 28.0 1.272 5 165.0 -49.7 0.965 6 164.7 -9.0 1.283 7 174.5 43.6 2.308 8 290.5 14.9 1.466
3 files
UNLOAI strn
)ING: SLOPE INTER STAND
chan ms/kip mstrn DEV 1 312.3 15.6 1.109 2 204.7 -30.1 1.108 3 260.3 -11.0 1.242 4 296.1 29.5 1.157 5 165.4 -36.9 0.900 6 159.3 20.2 0.889 7 171.9 56.6 1.501 8 285.5 23.3 1.324
G2-46

STRAIN LOAD/UNLOAD ANALYZER
File Prefix = csl-19 Current Flight Hours = 99022.0
Number of Files = 3 with 6 junk lines each Number of Strain Gages = 8
^ TTTTTT — ^rrar ■artoc of all 3 files
LOADING:
j uvu^u^^u \s ^ bl JU Jm *S ^ ^ «A» ^P* V
UNLOADING: strn SLOPE INTER STAND\ strn SLOPE INTER STAND
chan ms/kip mstrn DEV chan ms/kip mstrn DEV
1 309.4 35.1 1.691 1 311.7 15.7 1.231
2 206.4 -42.0 1.723 2 204.7 -29.2 1.179
3 259.8 -11.7 1.348 3 259.1 -14.1 1.216
4 297.3 33.9 1.328 4 297.6 33.4 1.367
5 164.4 -60.9 1.609 5 163.9 -46.7 0.986
6 164.4 -9.8 1.839 6 161.0 17.2 1.120
7 174.8 42.1 2.128 7 174.0 51.1 1.696
8 290.1 21.8 1.588 8 287.3 25.2 1.280
STRAIN LOAD/UNLOAD ANALYZER
File Prefix = csl-20 Current Flight Hours = 104501.0
Number of Files = 3 with Number of Strain Gages = 8
6 junk lines each
LOADING: UNLOADING: strn SLOPE INTER STAND strn SLOPE INTER STAND
chan ms/kip mstrn DEV chan ms/kip mstrn DEV
1 310.6 25.4 1.658 1 311.8 12.1 1.220
2 205.2 -26.7 1.289 2 204.5 -20.6 1.195
3 259.4 -29.2 1.204 3 258.3 -27.6 1.114
4 298.9 42.2 1.105 4 298.2 41.6 1.219
5 162.9 -30.7 0.937 5 163.1 -25.7 0.944
6 164.7 8.0 0.888 6 160.5 29.9 1.003
7 179.4 45.4 2.587 7 175.0 64.0 1.825
8 293.7 6.7 1.477 8 288.5 19.2 1.188
G2-47

STRAIN LOAD/UNLOAD ANALYZER
File Prefix = csl-21 Current Flight Hours = 110003.0
Number of Files - 3 with Number of Strain Gages = 8
6 junk lines each
LOADING:
JCJ — avtsi .ayeo u
strn SLOPE INTER STAND chan ms/kip mstrn DEV
1 309.4 30.7 1.455 2 205.8 -31.8 1.495 3 257.8 -33.7 1.210 4 299.2 45.2 1.266 5 160.7 -52.5 1.068 6 163.5 4.9 1.332 7 176.0 45.1 2.445 8 292.6 13.7 1.481
3 files
UNLOADING: strn SLOPE INTER STAND chan ms/kip mstrn DEV
1 311.7 12.8 1.310 2 204.7 -22.6 1.122 3 257.2 -35.2 1.210 4 299.3 44.6 1.182 5 160.8 -48.5 0.922 6 161.2 24.0 0.969 7 175.5 53.5 1.880 8 288.6 23.4 1.227
STRAIN LOAD/UNLOAD ANALYZER
File Prefix = csl-22 Current Flight Hours =115501.0
Number of Files = 3 with Number of Strain Gages = 8
6 junk lines each
LOADING:
JEJ — avtii ayes u
strn SLOPE INTER STAND chan ms/kip mstrn DEV
1 310.0 21.7 1.404 2 206.4 -23.1 1.392 3 256.6 -52.4 1.209 4 300.6 53.1 1.237 5 157.3 -54.0 0.905 6 164.9 7.4 0.994
' 7 179.6 47.3 1.979 8 294.5 16.2 1.391
3 files
UNLOADING: strn SLOPE INTER STAND chan ms/kip mstrn DEV
1 311.6 5.2 1.121 2 205.8 -15.2 1.162 3 255.2 -55.0 1.149 4 300.6 54.9 1.220 5 157.2 -51.8 0.907 6 161.0 28.2 1.019 7 176.2 63.8 1.785 8 289.8 28.4 1.251
G2-48

STRAIN LOAD/UNLOAD ANALYZER
File Prefix = csl-23 Current Flight Hours = 121018.0
Number of Files = 3 with Number of Strain Gages = 8
6 junk lines each
LOADING:
JJEJ — civei .ayes u
strn SLOPE INTER STAND chan ms/kip mstrn DEV
1 -7.1 4.0 9.787 2 215.3 -28.6 2.269 3 223.7 -98.7 5.874 4 0.0 -2500.0 0.003 5 116.2 -152.1 3.275 6 169.7 -21.7 2.068 7 181.3 54.7 1.873 8 304.2 37.0 1.549
3 files
UNLOAI strn
)ING: SLOPE INTER STAND
chan ms/kip mstrn DEV 1 0.7 -6.9 5.027 2 210.1 4.5 1.032 3 228.5 -175.6 1.480 4 0.0 -2500.0 0.003 5 112.6 -168.9 0.935 6 165.0 11.6 1.350 7 181.3 67.7 1.497 8 299.4 50.8 1.542
G2-49

STRAIN LOAD/UNLOAD ANALYZER
File Prefix = cs2- -2 Current Flight Hours = 0.0
Number of Files = 3 with 6 junk lines each Number of Strain Gages = 8
JE = averages of all 3 files
LOADING: UNLOADING: strn SLOPE INTER STAND\ strn SLOPE INTER STAND chan ms/kip mstrn DEV ' chan ms/kip mstrn DEV
1 303.4 15.2 1.267 1 303.0 14.2 1.284
2 211.1. -18.0 0.996 2 211.1 -18.0. 1.063
3 262.8 4.7 1.064 3 262.6 6.5 1.039
4 288.4 0.4 1.121 4 286.8 6.8 1.166
5 163.9 -3.4 1.050 5 164.2 -0.8 1.044 6 152.1 -1.0 0.929 6 150.0 11.5 1.048 7 169.5 31.1 1.285 7 164.1 52.5 1.265 8 286.8 5.1 1.048 8 283.8 19.1 1.200
STRAIN LOAD/UNLOAD ANALYZER
File Prefix = cs2-3 Current Flight Hours = 11014.0
Number of Files = 3 with Number of Strain Gages = 8
6 junk lines each
LOADING:
JCJ — a vex ayco ui a
UNLOADING: strn SLOPE INTER STAND strn SLOPE INTER STAND chan ms/kip mstrn DEV chan ms/kip mstrn DEV
1 302.8 28.4 1.488 1 304.3 17.7 1.064 2 211.8 -33.5 1.423 2 211.2 -27.6 1.257 3 264.1 13.9 1.071 3 264.8 12.6 1.131 4 287.6 4.1 1.200 4 287.2 6.8 1.120 5 164.5 -43.9 1.197 5 166.2 -33.6 1.163 6 152.0 -16.5 1.009 6 150.3 4.2 0.978 7 165.2 33.1 1.361 7 166.3 34.1 0.929 8 286.6 2.0 1.133 8 283.3 14.6 1.119
G2-50

STRAIN LOAD/UNLOAD ANALYZER
File Prefix = cs2-4 Current Flight Hours = 22017.0
Number of Files = 3 with Number of Strain Gages = 8
6 junk lines each
LOADING:
JEJ — a»ci
UNLOADING:
strn SLOPE INTER STAND; strn SLOPE INTER STAND
chan ms/kip mstrn . DEV l chan ms/kip mstrn DEV
1 304.4 9.0 1.332 1 304.6 1.5 1.335
2 211.9 -19.6 1.411 2 210.7 -13.4 1.149
3 263.7 -1.4 1.137 3 264.2 -1.2 1.145
4 287.9 0.8 1.149 4 286.6 5.6 1.124
5 163.0 7.7 0.988 5 163.2 21.2 1.156
6 152.3 13.9 0.906 6 150.0 37.8 0.993
7 166.9 78.6 1.804 7 166.5 83.2 0.884
8 287.6 -7.0 1.239 . 8 283.3 9.4 1.325
STRAIN LOAD/UNLOAD ANALYZER
File Prefix = cs2- 5 Current Flight Hours = 33050.0
Number of Files = 3 with 6 junk lines each Number of Strain Gages. = 8
[JE = averages of all 3 files
LOADING: UNLOADING: strn SLOPE INTER STAND strn SLOPE INTER STAND chan ms/kip mstrn DEV chan ms/kip mstrn DEV
1 303.4 11.5 1.292 1 303.9 4.6 1.219
2 210.9 -21.3 1.254 2 210.9 -17.2 1.277
3 262.9 -0.7 1.146 3 263.7 -1.2 1.096 4 287.9 -1.2 1.117 4 287.4 2.3 1.115
5 163.1 5.8 1.098 5 164.4 11.8 1.053 6 152.3 9.9 0.870 6 149.9 25.6 0.919 7 166.4 73.8 2.195 7 164.4 80.5 0.910
8 287.5 -4.8 1.228 8 284.1 9.3 1.237
G2-51

STRAIN LOAD/UNLOAD ANALYZER
File Prefix = cs2-6 Current Flight Hours = 44019.0
Number of Files = 3 with Number of Strain Gages = 8
6 junk lines each
LOADING:
J£j — OVC1 aijco u
strn SLOPE INTER STAND chan ms/kip mstrn DEV
1 302.8 16.8 1.597 2 211.7 -23.2 1.459 3 262.5 0.2 1.090 4 287.6 2.9 1.156 5 163.9 1.2 1.087 6 152.9 1.3 1.034 7 165.5 72.7 1.791 8 286.8 -0.3 1.146
3 files
UNLOADING: strn SLOPE INTER STAND chan ms/kip mstrn DEV
1 303.8 7.1 1.125 2 211.6 -18.9 1.256 3 263.4 -0.4 1.100 4 286.8 5.9 1.192 5 164.5 12.9 1.291 6 150.1 23.5 0.959 7 165.4 76.8 0.924 8 283.5 12.6 1.222
STRAIN LOAD/UNLOAD ANALYZER
File Prefix = cs2-7 Current Flight Hours = 55047.0
Number of Files = 3 with Number of Strain Gages = 8
6 junk lines each
LOADING:
JEJ — avei
strn SLOPE INTER STAND chan ms/kip mstrn DEV
1 303.5 12.4 1.188 2 211.6 -20.1 1.380 3 262.4 -3.1 1.047 4 287.6 3.9 1.044 5 162.5 10.6 1.118 6 153.7 10.0 1.028 7 168.5 70.6 1.385 8 288.1 -5.1 1.098
3 files
UNLOADING: strn SLOPE INTER STAND chan ms/kip mstrn DEV
1 304.1 3.3 1.141 2 210.9 -14.2 1.271 3 263.0 -1.7 1.078 4 287.8 5.6 1.096 5 164.0 20.3 0.954 6 151.1 35.9 0.910 7 166.9 84.7 0.897 8 283.4 13.6 1.188
G2-52

STRAIN LOAD/UNLOAD ANALYZER
File Prefix = cs2-8 Current Flight Hours = 66024.0
Number of Files = 3 with Number of Strain Gages = 8
6 junk lines each
LOADING:
ijii — a vex
stm SLOPE INTER STAND chan ms/kip mstrn DEV
1 302.9 19.3 1.258 2 212.0 -23.8 1.384 3 262.8 -0.4 1.083 4 288.3 6.2 1.093 5 164.0 1.4 1.150 6 153.0 1.5 1.061 7 165.5 74.7 2.313 8 287.0 4.0 1.100
3 files
UNLOADING: strn SLOPE INTER STAND chan ms/kip mstrn DEV
1 303.5 9.8 0.980 2 210.5 -16.0 1.036 3 262.1 2.4 1.022 4 288.0 8.8 1.002 5 163.9 12.3 1.102 6 149.9 24.3 0.885 7 164.4 79.1 0.808 8 282.4 19.3 1.017
STRAIN LOAD/UNLOAD ANALYZER
File Prefix = cs2- ■9 Current Flight Hours = 77074.0
Number of Files = 3 with 6 junk lines each Number of Strain Gages = 8
r-arroc nf all 1 fi 1 P<?
LOADING:
ULI UV \>l-UUVi^ ^/ ■*-
UNLOADING: strn SLOPE INTER STAND strn SLOPE INTER STAND
chan ms/kip mstrn DEV chan ms/kip mstrn DEV
1 301.8 28.4 1.586 1 303.9 15.2 1.096
2 212.0 -29.5 1.262 2 211.7 -23.2 1.189
3 262.3 4.7 1.077 3 263.0 4.3 1.075
4 288.6 9.7 1.183 4 288.0 12.6 1.085
5 164.5 -21.5 1.318 5 163.1 -5.2 1.002
6 153.1 -7.6 1.127 6 150.5 13.7 1.000
7 164.4 61.5 1.732 7 167.3 57.0 0.888
8 286.8 8.0 1.174 8 283.4 21.8 1.161
G2-53

STRAIN LOAD/UNLOAD ANALYZER
File Prefix = cs2-10 Current Flight Hours = 88041.0
Number of Files = 3 with Number of Strain Gages = 8
6 junk lines each
LOADING:
J£J — a vex oyco <_>
strn SLOPE INTER STAND chan ms/kip mstrn DEV
1 302.3 23.8 1.366 2 211.8 -26.9 1.496 3 260.8 2.3 1.108 4 287.1 13.6 1.128 5 161.4 -4.1 1.305 6 152.4 -1.5 1.220 7 163.6 72.5 1.474 8 285.9 8.5 1.112
3 files
UNLOADING: strn SLOPE INTER STAND chan ms/kip mstrn DEV
1 304.1 10.2 1.048 2 211.3 -19.4 1.441 3 261.9 1.8 1.233 4 288.2 14.4 1.136 5 162.8 10.5 1.618 6 152.0 26.1 1.024 7 169.3 69.6 1.014 8 283.5 19.8 1.446
STRAIN LOAD/UNLOAD ANALYZER
File Prefix = cs2-ll Current Flight Hours = 99005.0
Number of Files = 3 with Number of Strain Gages = 8
6 junk lines each
LOADING:
iZi — avei ayeo u
strn SLOPE INTER STAND chan ms/kip mstrn DEV
1 300.9 21.7 1.322 2 214.6 -24.4 1.104 3 262.8 -7.6 1.181 4 287.6 12.1 1.188 5 165.7 -1.4 1.278 6 164.4 -17.1 2.467 7 171.0 55.9 1.290 8 287.0 -3.5 1.084
3 files
UNLOADING: strn SLOPE INTER STAND chan ms/kip mstrn DEV
1 304.6 3.4 0.983 2 211.5 -11.4 1.188 3 262.1 -5.1 0.920 4 288.2 14.6 0.991 5 163.6 19.0 0.936 6 151.5 33.2 0.981 7 169.7 69.6 0.811 8 284.3 11.3 1.175
G2-54

STRAIN LOAD/UNLOAD ANALYZER
File Prefix = cs2-13 Current Flight Hours = 121036.0
Number of Files = 3 with Number of Strain Gages = 8
6 junk lines each
LOADING:
JCJ — avBi ayco UJ
strn SLOPE INTER STAND chan ms/kip mstrn DEV
1 302.7 26.1 1.405 2 212.8 -28.4 1.541 3 261.0 2.8 1.079 4 289.3 11.7 1.180 5 162.6 -10.9 1.180 6 153.5 -7.4 1.207 7 167.2 68.2 1.522 8 287.4 10.2 1.087
3 files
UNLOADING: strn SLOPE ' INTER STAND chan ms/kip mstrn DEV
1 303.0 16.8 1.159 2 211.2 -19.5 1.147 3 261.3 2.7 1.115 4 287.7 18.2 1.181 5 164.4 -2.1 1.161 6 149.6 17.5 1.032 7 167.7 70.0 0.886 8 283.5 25.3 1.218
STRAIN LOAD/UNLOAD ANALYZER
File Prefix = cs2- 14 Current Flight Hours = 132055.0
Number of Files = 3 with 6 junk lines each Number of Strain Gages = 8
> FILE = averages of all 3 i files
LOADING: UNLOADING: strn SLOPE INTER STAND strn SLOPE INTER STAND chan ms/kip mstrn DEV chan ms/kip mstrn DEV
1 302.9 25.1 1.216 1 303.5 14.6 1.122 2 212.9 -28.1 1.161 2 211.8 -21.6 1.142 3 261.1 -0.7 1.018 3 261.5 -1.0 1.138 4 289.6 15.0 1.054 4 288.3 20.3 1.076 5 163.7 -14.2 0.986 ■ 5 163.2 -1.8 1.141 6 152.9 2.0 0.901 6 150.7 25.8 1.068 7 166.6 72.8 1.811 7 168.2 70.5 0.878 8 287.6 11.0 1.163 8 283.3 25.8 1.254
G2-55

STRAIN LOAD/UNLOAD ANALYZER
File Prefix = cs2-15 Current Flight Hours = 143035.0
Number of Files = 3 with Number of Strain Gages = 8
6 junk lines each
all 3 fi Lies
LOADING: UNLOADING: strn SLOPE INTER STAND. strn SLOPE INTER STAND chan ms/kip mstrn DEV ' chan ms/kip mstrn DEV
1 303.5 19.6 1.463 1 303.0 10.3 1.170 2 212.9 -21.5 1.187 2 211.2 -13.0 1.179 3 261.2 -8.2 1.194 3 260.6 -6.7 1.224 4 290.3 14.4 1.212 4 287.6 22.9 1.205 5 162.8 -3.3 1.544 5 . 163.8 6.3 1.164 6 153.8 5.1 1.067 6 150.6 31.7 0.934 7 168.8 73.4 1.771 7 168.0 79.2 1.052 8 288.6 5.2 1.324 8 283.9 22.4 1.240
STRAIN LOAD/UNLOAD ANALYZER
File Prefix = cs2-16 Current Flight Hours = 154033.0
Number of Files = 3 with Number of Strain Gages = 8
6 junk lines each
> FILE = averages of all 3 files
LOADING: UNLOADING: strn SLOPE INTER STAND strn SLOPE INTER STAND chan ms/kip mstrn DEV chan ms/kip mstrn DEV
1 301.4 31.5 1.607 1 302.5 16.2 1.160 2 214.9 -32.5 . 1.340 2 213.1 -19.7 1.083 3 260,1 -2.7 1.196 3 259.8 -6.4 1.094 4 289.5 21.6 1.257 4 289.6 27.3 1.077 5 160.6 -21.3 1.442 5 163.7 -8.2 1.352 6 153.6 -0.8 1.333 6 152.7 28.8 1.003 7 167.9 41.3 1.823 7 171.9 41.8 1.029 8 287.4 8.6 1.279 8 284.2 22.7 1.268
G2-56

STRAIN LOAD/UNLOAD ANALYZER
File Prefix = cs2-17 Current Flight Hours = 165002.0
Number of Files = 3 with Number of Strain Gages = 8
6 junk lines each
LOADING:
j£i — avejL ayco ui a
UNLOADING:
strn SLOPE INTER STAND\ strn SLOPE INTER STAND
chan ms/kip mstrn DEV chan ms/kip mstrn DEV
1 303.0 24.6 1.349 1 302.2 16.9 1.126
2 213.8 -26.8 1.585 2 211.9 -17.1 1.203
3 259.7 -11.9 1.129 3 258.4 -9.7 1.064
4 291.7 22.1 1.191 4 289.1 31.4 1.204
5 160.8 -1.0 1.117 5 161.9 4.0 1.035
6 153.3 17.0 0.962 6 150.8 32.8 0.994
7 169.0 72.1 1.630 7 171.4 68.3 1.010
8 288.7 7.6 1.170 . 8 285.2 24.0 1.297
STRAIN LOAD/UNLOAD ANALYZER
File Prefix = cs2-18 Current Flight Hours = 176050.0
Number of Files = 3 with Number of Strain Gages = 8
6 junk lines each
LOADING:
JEJ — OVCJ.
UNLOADING: strn SLOPE INTER STAND strn SLOPE INTER STAND chan ms/kip mstrn DEV chan ms/kip mstrn DEV
1 302.4 17.5 1.500 1 302.5 6.2 1.221
2 213.1 -17.3 1.583 2 211.9 -7.7 1.108
3 258.6 -20.1 1.183 3 258.0 -21.5 1.162
4 291.0 26.8 1.134 4 289.6 35.2 1.219
5 159.2 -6.2 1.055 5 160.1 2.3 1.047 6 153.4 7.8 1.024 6 151.1 34.5 1.133 7 169.1 75.4 1.402 7 171.8 75.8 0.883 8 289.4 7.9 1.211 8 285.5 24.5 1.381
G2-57

STRAIN LOAD/UNLOAD ANALYZER
File Prefix = cs2-19 Current Flight Hours = 187008.0
Number of Files = 3 with Number of Strain Gages = 8
6 junk lines each
LOADING:
J£J — avei ayea u
strn SLOPE INTER STAND chan ms/kip mstrn DEV
1 298.1 34.9 1.499 2 217.1 -28.3 1.303 3 255.6 -17.1 1.281 4 291.6 35.9 1.360 5 162.0 -39.8 1.015 6 162.7 -16.2 2.214 7 172.6 59.1 1.745 8 289.9 15.9 1.105
3 files
UNLOADING: strn SLOPE INTER STAND chan ms/kip mstrn DEV
1 303.4 9.3 1.293 2 213.4 -9.9 1.309 3 256.8 -26.7 1.160 4 291.9 42.7 1.337 5 157.7 -18.0 1.179 6 153.0 28.3 1.201 7 175.1 62.3 1.116 8 286.4 31.2 1.385
STRAIN LOAD/UNLOAD ANALYZER
File Prefix = cs2-20 Current Flight Hours = 198018.0
Number of Files = 3 with Number of Strain Gages = 8
6 junk lines each
LOADING:
JJCJ — avei ayes UJ
strn SLOPE INTER STAND chan ms/kip mstrn DEV
1 301.0 16.1 1.592 2 215.1 -14.7 1.842 3 253.6 -45.1 1.466 4 294.1 44.7 1.311 5 154.4 -41.1 1.118 6 153.9 4.6 1.012 7 171.9 71.5 1.359 8 292.4 14.2 1.203
3 files
UNLOAI strn
)ING: SLOPE INTER STAND
chan ms/kip mstrn DEV 1 301.7 0.4 1.248 2 213.7 -0.2 1.088 3 252.8 -56.9 1.171 4 293.2 58.4 1.235 5 153.9 -33.0 1.044 6 151.9 31.6 1.141 7 174.9 72.1 0.903 8 287.9 33.3 1.462
G2-58

STRAIN LOAD/UNLOAD ANALYZER
File Prefix = cs2-21 Current Flight Hours = 201229.0
Number of Files = 3 with Number of Strain Gages = 8
6 junk lines each
LOADING:
JJL — a vex ayco ui a. -LJ. *J J.XXCÜ
UNLOADING: strn SLOPE INTER STAND., strn SLOPE INTER STAND
chan ms/kip mstrn DEV ' chan ms/kip mstrn DEV
1 300.1 14.3 1.952 ' 1 301.6 -6.0 1.195
2 217.3 -15.3 1.686 2 215.9 2.1 1.149
3 248.7 -65.3 2.241 3 248.3 -88.2 1.159
4 296.2 60.8 1.488 4 297.0 75.1 1.240
5 151.3 -90.5 1.040 5 148.5 -80.8 0.975 6 157.8 -11.2 3.181 6 154.3 16.0 1.169 7 171.2 66.1 1.733 7 178.5 60.3 1.005 8 293.2 28.0 1.131 8 290.8 43.9 1.282
G2-59

STRAIN LOAD/UNLOAD ANALYZER
File Prefix = cs3- 4 Current Flight Hours = 0.0
Number of Files = 3 with 6 junk lines each Number of Strain Gages = 8
•> TTTT JE = averages of all 3 files
LOADING: UNLOADING: strn SLOPE INTER STAND1- strn SLOPE INTER STAND chan ms/kip mstrn DEV chan ms/kip mstrn DEV
1 301.8 15.2 1.575 1 303.6 2.8 1.076 2 208.5 -12.9 1.335 2 209.0 -7.0 0.967 3 264.7 -3.4 1.114 3 264.2 0.2 1.078 4 286.3 -3.9 1.096 4 287.0 -3.7 1.098 5 153.1 -8.7 1.306 5 152.2 2.5 1.053 6 164.6 -7.1 1.186 6 164.6 7.9 1.155 7 169.8 8.9 1.253 7 167.5 19.9 0.898 8 287.2 -3.3 1.052 8 284.5 10.2 1.205
STRAIN LOAD/UNLOAD ANALYZER
File Prefix = cs3- 5 Current Flight Hours = 11093.0
Number of Files = 3 with 6 junk lines each Number of
N. T7«T1
Strain Gages = 8
all 3 files -*■ £ XJ-II^ — avej-ctyeo ui
LOADING: UNLOADING: strn SLOPE INTER STAND strn SLOPE INTER STAND chan ms/kip mstrn DEV chan ms/kip mstrn DEV
1 301.8 16.9 1.464 1 302.8 4.6 1.477 2 210.2 -18.3 1.319 2 210.2 -9.7 1.084 3 265.4 -8.2 1.180 3 265.4 -7.9 1.226 4 286.5 -1.7 1.177 4 285.7 3.6 1.258 5 152.7 0.5 1.299 5 154.7 11.5 1.242 6 164.9 -2.4 1.112 6 162.4 27.6 1.054 7 166.2 9.6 1.048 7 168.0 12.8 0.855 8 287.0 -4.8 1.207 8 284.0 4.0 1.087
G2-60

STRAIN LOAD/UNLOAD ANALYZER
File Prefix = cs3-6 Current Flight Hours = 22126.0
Number of Files = 3 with Number of Strain Gages = 8
6 junk lines each
LOADING:
iz> — avei ayes u
strn SLOPE INTER STAND chan ms/kip mstrn DEV
1 300.9 26.4 1.553 2 210.9 -27.9 1.474 3 265.3 -2.6 1.109 4 286.8 0.7 1.153 5 154.3 -28.2 1.770 6 167.9 -14.7 2.608 7 166.2 -1.8 1.510 8 286.6 2.2 1.314
3 files
UNLOADING: strn SLOPE INTER STAND chan ms/kip mstrn DEV
1 302.6 12.4 0.994 2 210.4 -17.7 0.786 3 265.3 -3.2 0.983 4 286.5 5.4 1.103 5 154.2 -9.8 1.202 6 162.6 21.8 1.072 7 167.3 2.9 0.853 8 283.8 10.0 1.068
STRAIN LOAD/UNLOAD ANALYZER
File Prefix = cs3-7 Current Flight Hours = 33001.0
Number of Files = 3 with Number of Strain Gages = 8
6 junk lines each
LOADING:
JEJ — a vex ayca UJ
strn SLOPE INTER STAND chan ms/kip mstrn DEV
1 298.7 26.7 1.236 2 213.1 -27.7 1.278 3 263.4 -3.0 1.151 4 287.1 1.3 1.110 5 157.2 -20.5 1.749 6 172.4 -20.1 1.414 7 168.0 3.0 1.491 8 285.0 9.0 1.279
3 files
UNLOADING: strn SLOPE INTER STAND chan ms/kip mstrn DEV
1 302.0 8.7 1.313 2 210.0 -9.7 0.940 3 264.6 -6.8 1.121 4 286.9 6.7 1.195 5 152.8 11.9 1.136 6 164.0 26.8 1.385 7 171.2 8.9 1.109 8 285.2 11.2 1.395
G2-61

STRAIN LOAD/UNLOAD ANALYZER
File Prefix = cs3-8 Current Flight Hours = 44026.0
Number of Files = 3 with Number of Strain Gages = 8
6 junk lines each
LOADING:.
j£i — avcj ay co u
strn SLOPE INTER STAND chan ms/kip mstrn DEV
1 301.0 24.9 1.584 2 212.4 -31.3 1.327 3 264.2 -1.6 1.097 4 287.0 . 1.2 1.106 5 155.3 -31.7 2.290 6 167.6 -10.5 2.606 7 167.8 -5.9 1.266 8 287.1 4.5 1.466
3 files
UNLOADING: strn SLOPE INTER STAND chan ms/kip mstrn DEV
1 . 303.1 9.4 0.921 2 211.1 -17.3 0.854 3 265.3 -5.6 0.993 4 286.7 6.5 1.082 5 . 156.9 -15.9 1.084 6 162.7 26.7 1.078 7 168.2 1.2 0.887 8 284.0 13.2 0.996
STRAIN LOAD/UNLOAD ANALYZER
File Prefix = cs3-9 Current Flight Hours = 55041.0
Number of Files = 3 with Number of Strain Gages = 8
6 junk lines each
LOADII *G:
JC — avu ay cci \j
strn SLOPE INTER STAND chan ms/kip mstrn DEV
1 300.7 18.5 1.407 2 211.1 -21.1 1.328 3 264,6 -12.3 1.224 4 286.7 0.5 1.194 5 154.1 -3.7 1.251 6 165.8 6.8 1.266 7 168.6 7.4 1.132 8 288.1 1.7 1.334
3 files
UNLOADING: strn SLOPE INTER STAND chan ms/kip mstrn DEV
1 302.5 3.3 1.159 2 210.7 -10.4 0.913 3 264.9 -13.9 1.137 4 286.0 7.1 1.182 5 155.5 10.7 1.205 6 161.9 41.8 1.117 7 168.4 16.7 0.927 8 283.9 13.5 1.243
G2-62

STRAIN LOAD/UNLOAD ANALYZER
File Prefix = cs3-10 Current Flight Hours = 66046.0
Number of Files = 3 with Number of Strain Gages = 8
6 junk lines each
LOADING:
JEJ — o»ei
UNLOADING: strn SLOPE INTER STAND\ strn SLOPE INTER STAND
chan ms/kip mstrn DEV chan ms/kip mstrn DEV
1 300.4 15.0 1.808 1 301.2 2.3 1.234
2 211.4 -21.5 1.319 2 210.9 -10.0 0.939
3 263.9 -14.1 1.213 3 264.0 -17.3 1.196
4 287.5 1.4 1.271 4 286.0 9.7 1.232
5 153.8 5.8 1.224 5 154.4 25.7 1.309
6 165.7 18.7 1.184 6 161.6 56.0 1.202
7 168.5 9.7 1.096 7 169.0 18.9 0.965
8 288.3 0.2 1.378 8 283.6 11.9 1.339
STRAIN LOAD/UNLOAD ANALYZER
File Prefix = cs3-ll Current Flight Hours = 77047.0
Number of Files = 3 with Number of Strain Gages = 8
6 junk lines each
-> FILE = averages of all 3 files
LOADING: strn SLOPE chan
1 2 3 4 5 6 7
ms/kip 300.7 212.2 263.9 287.0 155.1 168.2 168.4 286.7
INTER mstrn 21.9
-27.8 -9.7 4.0
-24.1 7.6 1.3
STAND DEV 1.668 1.493 1.143 1.122 2.369 2.698 1.644
UNLOADING: strn SLOPE
11.6 1.663
chan 1 2 3 4 5 6 7 8
ms/kip 302.2 212.0 263.4 285.9 155.8 162.6 169.5 284.6
INTER mstrn
5.8 -16.5 -11.8
10.8 -7 46
7 17
STAND DEV
1.099 0.883 1.034 1.151 0.951 1.190 0.964 1.163
G2-63

STRAIN LOAD/UNLOAD ANALYZER
File Prefix = cs3-13 Current Flight Hours = 99052.0
Number of Files = 3 with Number of Strain Gages = 8
6 junk lines each
> FILE = averages of all 3 files
LOADING: UNLOADING: strn SLOPE INTER STAND\ strn SLOPE INTER STAND chan ms/kip mstrn DEV chan ms/kip mstrn DEV
1 299.2 16.1 1.579 ' 1 300.6 1.8 1.301 2 212.2 -22.5 1.324 2 211.8 -9.3 0.939 3 261.6 -15.7 1.259 .3 262.7 -21.3 1.207 4 287.3 6.2 1.299 4 286.9 12.5 1.272 5 152.0 2.4 1.113 5 153.3 16.7 1.242 6 165.6 25.8 1.203 6 161.6 62.3 1.122 7 169.4 7.9 1.350 7 170.8 15.9 0.932 8 288.6 7.4 1.368 8 284.7 17.7 1.336
STRAIN LOAD/UNLOAD ANALYZER
File Prefix = cs3-14 Current Flight Hours = 109997.0
Number of Files = 3 with Number of Strain Gages = 8
6 junk lines each
- ^ in
LOADING:
j£, — avei .ages o
strn SLOPE INTER STAND chan ms/kip mstrn DEV
1 299.0 18.8 1.373 2 212.1 -21.2 1.365 3 261.5 -17.2 ■ 1.091 4 288.2 9.2 1.146 5 151.4 -3.1 1.189 6 166.4 29.0 1.174 7 169.9 0.8 1.953 8 288.0 9.5 1.182
3 files
UNLOADING: strn SLOPE INTER STAND chan ms/kip mstrn DEV
1 301.0 2.2 1.245 2 212.5 -10.2 0.928 3 261.0 -21.1 1.145 4 288.6 15.1 1.195 5 152.9 13.2 1.179 6 164.3 55.5 1.521 7 172.7 10.1 1.058 8 285.7 19.2 1.407
G2-64

STRAIN LOAD/UNLOAD ANALYZER
File Prefix = cs3-14 Current Flight Hours = 109997.0
Number of Files = 3 with Number of Strain Gages = 8
6 junk lines each
LOADING:
JEJ — a vex
UNLOADING:
strn SLOPE INTER • STAND'. strn SLOPE INTER STAND
chan ms/kip mstrn DEV chan ms/kip mstrn DEV
1 299.0 18.8 1.373 1 301.0 2.2 1.245
2 212.1 -21.2 1.365 2 212.5 -10.2 0.928
3 261.5 -17.2 1.091 3 261.0 -21.1 1.145
4 288.2 9.2 1.146 4 288.6 15.1 1.195
5 151.4 -3.1 1.189 5 152.9 13.2 1.179
6 166.4 29.0 1.174 6 164.3 55.5 1.521
7 169.9 0.8 1.953 7 172.7 10.1 1.058
8 288.0 9.5 1.182 8 285.7 19.2 1.407
STRAIN LOAD/UNLOAD ANALYZER
File Prefix = cs3- 15 Current Flight Hours = 121020.0
Number of Files = 3 with 6 junk lines each
Number of Strain Gages = 8
rarrflc r*-f all 3 -F-ilPR
LOADING:
UU u V\^XU^\<^ W J-
UNLOADING:
strn SLOPE INTER STAND strn SLOPE INTER STAND
chan ms/kip mstrn DEV chan ms/kip mstrn DEV
1 299.0 15.1 1.601 1 299.4 0.0 1.261
2 214.5 -24.4 1.533 2 213.8 -9.3 0.936
3 258.0 -25.1 1.272 3 257.4 -33.9 1.112
4 290.5 10.7 1.421 4 289.4 22.0 1.263
5 150.1 -12.5 1.819 5 151.5 0.4 1.307
6 167.4 26.6 2.150 6 162.2 65.9 1.228
7 172.0 0.1 1.580 7 174.3 7.3 0.915
8 290.4 10.5 1.500 8 286.7 20.7 1.357
G2-65

STRAIN LOAD/UNLOAD ANALYZER
File Prefix = cs3-16 Current Flight Hours = 132075.0
Number of Files = 3 with Number of Strain Gages = 8
6 junk lines each
LOADING:
j£< — flVBi .ayea u.
strn SLOPE INTER STAND chan ms/kip mstrn DEV
1 296.7 19.4 1.943 2 214.8 -22.3 1.759 3 252.7 -24.5 1.558 4 292.6 13.5 1.366 5 147.8 -17.1 2.666 6 170.3 29.1 3.286 7 171.6 8.0 2.203 8 289.5 17.9 1.785
3 files
UNLOADING: strn SLOPE INTER STAND chan ms/kip mstrn DEV
1 298.8 0.0 1.210 2 214.9 -7.5 0.983 3 253.9 -42.9 1.178 4 292.5 24.9 1.192 5 147.7 -0.9 1.155 6 164.4 70.2 1.333 7 176.3 12.3 1.084 8 288.5 23.3 1.416
STRAIN LOAD/UNLOAD ANALYZER
File Prefix = cs3-17 Current Flight Hours = 142663.0
Number of Files = 3 with Number of Strain Gages = 8
6 junk lines each
LOADING:
jCi — flVBI aLjes u
strn SLOPE INTER STAND chan ms/kip mstrn DEV
1 291.3 18.8 2.203 2 221.5 -20.9 2.318 3 231.2 -62.9 3.743 4 304.0 37.1 2.456 5 126.8 -101.2 1.182 6 170.5 24.0 3.135 7 179.4 -12.9 2.075 8 296.9 26.3 1.658
3 files
UNLOADING: strn SLOPE INTER STAND chan ms/kip mstrn DEV
1 292.2 -2.2 1.271 2 221.8 -2.0 1.154 3 230.2 -104.8 2.103 4 305.1 61.4 1.493 5 126.5 -108.6 1.011 6 164.7 64.2 1.327 7 179.0 1.3 0.952 8 295.0 33.6 1.304
G2-66

APPENDIX G3
Crack Growth Analysis Data Files
Page
NASGRO Batch File for Simple Coupon Analysis G3-1 Spectrum File for Simple Coupon Analysis G3-2 NASGRO Batch File for Complex Coupon Analysis G3-3 Spectrum File for Complex Coupon Analysis G3-4

NASGRO Batch File for Simple Coupon Analysis
simple.out Output file name 1 1»US units; 2»SI units
d FCL HI, Test Spectrum (Tension), K6 tc Crack Model Type
(Title)
Crack Model Number 1.00000000000000
0.125000000000000 0.190000000000000 0.350000000000000
ü « user defined; 5.00O000000000OO0E-002
Width Thickness Hole diameter Hole center to edge
m standard USE Initial a
Ochange; BTN=continue; S»start over 1 Hum of materials
2014-T6511 SwBI da/dN data Mod of McMaster Fit (M6, w/o closure: alpha=5.845, S/So-1.0)
74.0000000000000 UTS, Matl 65.0000000000000 Yield Str, matl 27.0000000000000 KIE matl 27.0000000000000 K1C, matl 1.00000000000000 Ak - matl 1.00000000000000 Bk - matl
2.000000000000000E-009 C 3.70000000000000 n 0.500000000000000 P 1.00000000000000 1 2.70000000000000 DKO 0.700000000000000 Bel 5.84500000000000 alpha
1.000000000000000 Smaz/SIGo N No saving matl file in batch run
Ochange; BTN'continue; S'start over Single Block Schedule for Wl Coupon Test (Simple) n Flag for indentifying steps
100000 No. times to apply sched 1 No. distinct blocks
n Yes or No 73 No. steps - blk 1 2 Schedule option
TENSION Block Name Ochange; ETN=continue
n Yes or No 0 Schedule option
exchange, BTN»continue, S=»start over 1.06000000000000 SF( 1, O.OOOOOOOOOOOOOOOE+000 SF( 2,
exchange, BTN'continue, S'start over n Bef Load Factor ABEF( 1)
1 SBlk Case 1 No. of times to apply 0 SBlk Case
exchange, BTN=continue, S=»start over Ochange; BTN»continue; S'start over
1 Print opt. - Sched interval 1 Print opt. - Block interval 0 Print opt. - Indiv step intr
Ochange; BTN'continue; S«start over 3 Plot option
Ochange; BTN'continue; S»start over 3 Plot Device No. 0 Termination option
(Heading)
1) 1)
G3-1

Spectrum File for Simple Coupon Analysis
PENSION HI Coupon Single Block (550 br) Equiv. Tei ision Spectrum
190.0000 -5.0879 -9.4489 0.0000 0.0000 0.0000 0.0000 0.0000 0.0000
9.0000 -4.3610 -10.1758 0.0000 0.0000 0.0000 0.0000 0.0000 o.oooo 1.0000 -3.6833 -10.6119 0.0000 0.0000 0.0000 0.0000 0.0000 0.0000
957.0000 2.6612 5.3225 0.0000 0.0000 0.0000 0.0000 o.oooo 0.0000
114.0000 1.7742 6.2096 0.0000 0.0000 0.0000 0.0000 0.0000 0.0000
57.0000 1.3306 6.6531 0.0000 0.0000 o.oooo 0.0000 0.0000 0.0000
11.0000 0.4435 7.5402 0.0000 0.0000 0.0000 0.0000 o.oooo 0.0000
2.0000 -0.4435 8.4273 o.oooo 0.0000 o.oooo 0.0000 0.0000 0.0000
l.oooo -1.3306 9.3143 o.oooo 0.0000 0.0000 o.oooo 0.0000 0.0000
1.0000 1.1089 6.8749 0.0000 0.0000 0.0000 o.oooo 0.0000 0.0000
28.0000 3.3432 3.3766 0.0000 0.0000 0.0000 0.0000 0.0000 0.0000
44.0000 2.7080 3.5438 0.0000 0.0000 0.0000 0.0000 0.0000 0.0000
22.0000 2.0728 3.7444 0.0000 0.0000 0.0000 0.0000 0.0000 0.0000
6.0000 1.4180 3.9450 0.0000 0.0000 0.0000 0.0000 0.0000 0.0000
1.0000 -1.3B10 -9.0855 0.0000 0.0000 0.0000 0.0000 0.0000 0.0000
190.0000 -5.0879 -9.4489 0.0000 0.0000 0.0000 0.0000 0.0000 0.0000
9.0000 -4.3610 -10.1758 0.0000 0.0000 0.0000 0.0000 0.0000 0.0000
1.0000 -3.6833 -10.6119 0.0000 0.0000 0.0000 0.0000 0.0000 0.0000
1914.0000 2.6635 5.3270 0.0000 0.0000 0.0000 0.0000 0.0000 0.0000
229.0000 1.7757 6.2149 0.0000 0.0000. 0.0000 0.0000 0.0000 0.0000
114.0000 1.3318 6.6588 0.0000 0.0000 0.0000 0.0000 0.0000 0.0000
23.0000 0.4439 7.5466 0.0000 0.0000 0.0000 0.0000 0.0000 0.0000
4.0000 -0.4439 8.4345 0.0000 0.0000 0.0000 0.0000 0.0000 0.0000
1.0000 -1.3318 9.3223 0.0000 0.0000 0.0000 0.0000 0.0000 0.0000
1.0000 -2.9717 10.9554 0.0000 0.0000 0.0000 0.0000 0.0000 0.0000
28.0000 3.3432 3.3766 0.0000 0.0000 0.0000 0.0000 0.0000 0.0000
44.0000 2.7080 3.5438 0.0000 0.0000 0.0000 0.0000 0.0000 0.0000
22.0000 2.0728 3.7444 0.0000 0.0000 0.0000 0.0000 0.0000 0.0000
6.0000 1.4180 3.9450 0.0000 0.0000 0.0000 0.0000 0.0000 o.oooo 190.0000 -5.0879 -9.4489 0.0000 0.0000 0.0000 0.0000 0.0000 o.oooo
9.0000 -4.3610 -10.1758 0.0000 0.0000 0.0000 0.0000 0.0000 0.0000 1.0000 -3.6833 -10.6119 0.0000 0.0000 0.0000 0.0000 0.0000 0.0000
1914.0000 2.6635 5.3270 0.0000 0.0000 0.0000 0.0000 0.0000 0.0000 229.0000 1.7757 6.2149 0.0000 0.0000 ■ 0.0000 0.0000 0.0000 0.0000 114.0000 1.3318 6.6588 0.0000 0.0000 0.0000 0.0000 0.0000 0.0000 23.0000 0.4439 7.5466 0.0000 0.0000 0.0000 0.0000 0.0000 0.0000 4.0000 -0.4439 8;4345 0.0000 0.0000 0.0000 0.0000 0.0000 0.0000 1.0000 -1.3318 9.3223 0.0000 0.0000 0.0000 0.0000 0.0000 o.oooo
28.0000 3.3432 3.3766 0.0000 o.oooo 0.0000 0.0000 0.0000 0.0000 44.0000 2.7080 3.5438 0.0000 0.0000 0.0000 0.0000 0.0000 o.oooo 22.0000 2.0728 3.7444 0.0000 0.0000 0.0000 0.0000 0.0000 o.oooo 6.0000 1.4180 3.9450 o.oooo 0.0000 o.oooo 0.0000 0.0000 0.0000 1.0000 1.1089 6.8749 0.0000 0.0000 o.oooo 0.0000 0.0000 0.0000
190.0000 -5.0879 -9.4489 0.0000 0.0000 0.0000 0.0000 0.0000 0.0000 9.0000 -4.3610 -10.1758 0.0000 0.0000 0.0000 o.oooo 0.0000 0.0000 1.0000 -3.6833 -10.6119 0.0000 0.0000 0.0000 0.0000 0.0000 0.0000
1914.0000 2.6635 5.3270 0.0000 0.0000 0.0000 0.0000 0.0000 0.0000 229.0000 1.7757 6.2149 0.0000 0.0000 0.0000 0.0000 o.oooo 0.0000 114.0000 1.3318 6.6588 0.0000 0.0000 0.0000 0.0000 0.0000 0.0000 23.0000 0.4439 7.5466 0.0000 0.0000 0.0000 0.0000 0.0000 0.0000 4.0000 -0.4439 8.4345 0.0000 0.0000 0.0000 0.0000 o.oooo 0.0000 1.0000 -1.3318 9.3223 0.0000 0.0000 0.0000 o.oooo o.oooo 0.0000 1.0000 -2.9717 10.9554 0.0000 0.0000 0.0000 0.0000 0.0000 0.0000
28.0000 3.3432 3.3766 0.0000 0.0000 o.oooo 0.0000 0.0000 o.oooo 44.0000 2.7080 3.5438 0.0000 o.oooo 0.0000 0.0000 o.oooo o.oooo 22.0000 2.0728 3.7444 0.0000 0.0000 o.oooo 0.0000 0.0000 0.0000 6.0000 1.4180 3.9450 0.0000 0.0000 o.oooo o.oooo 0.0000 0.0000
190.0000 -5.0879 -9.4489 0.0000 0.0000 o.oooo 0.0000 0.0000 0.0000 9.0000 -4.3610 -10.1758 0.0000 0.0000 0.0000 0.0000 0.0000 0.0000 1.0000 -3.6833 -10.6119 0.0000 0.0000 0.0000 0.0000 0.0000 0.0000
3829.0000 2.6612 5.3225 0.0000 o.oooo 0.0000 o.oooo 0.0000 0.0000 457.0000 1.7742 6.2096 0.0000 o.oooo 0.0000 0.0000 0.0000 0.0000 229,0000 1.3306 6.6531 0.0000 0.0000 0.0000 0.0000 0.0000 0.0000 46.0000 0.4435 7.5402 0.0000 0.0000 0.0000 0.0000 0.0000 0.0000 8.0000 -0.4435 8.4273 0.0000 0.0000 0.0000 0.0000 0.0000 0.0000 2.0000 -1.3306 9.3143 o.oooo 0.0000 0.0000 0.0000 0.0000 0.0000 1.0000 -2.2177 10.2014 0.0000 0.0000 0.0000 0.0000 0.0000 0.0000 1.0000 1.1089 6.8749 0.0000 0.0000 0.0000 0.0000 0.0000 0.0000
28.0000 3.3432 3.3766 0.0000 0.0000 0.0000 0.0000 0.0000 0.0000 44.0000 2.7080 3.5438 0.0000 0.0000 0.0000 0.0000 0.0000 0.0000 22.0000 2.0728 3.7444 0.0000 0.0000 o.oooo 0.0000 0.0000 0.0000 6.0000 1.4180 3.9450 0.0000 0.0000 0.0000 0.0000 0.0000 o.oooo 1.0000
0/ -1.3810 -9.0855 o.oooo 0.0000 0.0000 0.0000 0.0000 0.0000
G3-2

NASGRO Batch File for Complex Coupon Analysis
CXlt.out Output file name »DS units; 2-SI units
FCL Ml, Complex lest. Spectrum « H1C0UP, M6 tc Crack Model Type
(Title)
Crack Model Number 1.43400000000000
0.125000000000000 0.159000000000000 0.375000000000000
U ■ user defined; 6.800000000000000E-002
Width Thickness Hole diameter Bole center to edge ■ Standard NDE Initial a
Cchange; ETN=«continue; S»start over 1 Num of materials
2014-T6511 SwEI da/dN data d of McMaster Fit (M6, w/o closuret alpha"5 .845, S/So-1.0) 74.0000000000000 UTS, Matl 1 65.0000000000000 Yield Str, mati 1 27.0000000000000 KIE matl 1 27.0000000000000 K1C, matl 1 1.00000000000000 Ak - matl 1 1.00000000000000 Bk - matl 1
2.000000000000000E -009 C 3.70000000000000 n o.soooooooooooooo P 1.00000000000000 q 2.70000000000000 DKo 0.700000000000000 Bel 5.S4500000000000 alpha 1.000000000000000 Sraax/SIGo
H
W1COUP
No saving matl file in batch run exchange; ETN«continue; S=start over
Single Block Schedule for Wl Coupon Test (Simple) n Flag for indentifying steps
100000 No. times to apply sched 1 Do. distinct blocks
n Yes or No 73 No. steps - blk 1 2 Schedule option
Block Name exchange; BTN»continue Yes or No
0 Schedule option exchange, BTN*>continue,
1.00000000000000 SF( 1.000000000000000E+000 SF(
exchange, BTN'Continue, Bef Load Factor ABEF( 1)
1 SBlk Case 1 No. of times to apply 0 SBlk Case
exchange, BTN*continue, S'start over Cchange; BTN'Continue; S'start over
1 Brint opt. - Sched interval 1 Print opt. - Block interval 0 Print opt. - Indiv step intr
Cchange; BTN«continue; S'start over 3 Plot option
Cchange; ETN»continue; S=start over 3 Blot Device No. 0 Termination option
(Heading)
S'start over IF 2,
S'start over
1) 1)
G3-3

Spectrum File for Complex Coupon Analysis
J1COUP Single Block Spectrum (550 hra) for HI Co upons 190.00000 -2.1140 -3.9260 -15.6520 -29.0680
9.00000 -1.8120 -4.2280 -13.4160 -31.3040 1.00000 -1.3892 -4.4092 -12.0744 -32.6456
557.00000 1.1040 2.2080 8.1960 16.3920 114.00000 0.7360 2.5760 5.4640 19.1240 57.00000 0.5520 2.7600 4.0980 20.4900 11.00000 0.1840 3.1280 1.3660 23.2220 2.00000 -0.1840 3.4960 -1.3660 25.9540 1.00000 -0.5520 3.8640 -4.0980 28.6860 1.00000 0.4600 2.8520 3.4150 21.1730
28.00000 1.3900 1.4039 10.2800 10.3828 44.00000 1.1259 1.4734 8.3268 10.8968 22.00000 0.8618 1.5568 6.3736 11.5136 6.00000 0.5977 1.6402 4.3176 12.1304 1.00000 -0.5738 -3.7750 -4.2484 -27.9500
190.00000 -2.1140 -3.9260 -15.6520 -29.0680 9.00000 -1.8120 -4.2280 -13.4160 -31.3040 1.00000 -1.3892 -4.4092 -12.0744 -32.6456
1914.00000 1.1040 2.2080 8.2080 16.4160 229.00000 0.7360 2.5760 5.4720 19.1520 114.00000 0.5520 2.7600 4.1040 20.5200 23.00000 0.1840 3.1280 1.3680 23.2560 4.00000 -0.1840 3.4960 -1.3680 25.9920 1.00000 -0.5520 3.8640 -4.1040 28.7280 1.00000 -1.2328 4.5448 -9.1522 33.7402
28.00000 1.3900 1.4039 10.2800 10.3828 44.00000 1.1259 1.4734 8.3268 10.8968 22.00000 0.8618 1.5568 6.3736 11.5136 6.00000 0.5977 1.6402 4.3176 12.1304
190.00000 -2.1140 -3.9260 -15.6520 -29.0680 9.00000 -1.8120 -4.2280 -13.4160 -31.3040 1.00000 -1.3892 -4.4092 -12.0744 -32.6456
1914.00000 1.1040 2.2080 8.2080 16.4160 229.00000 0.7360 2.5760 5.4720 19.1520 114.00000 0.5520 2.7600 4.1040 20.5200 23.00000 0.1840 3.1280 1.3680 23.2560 4.00000 -0.1840 3.4960 -1.3680 25.9920 1.00000 -0.5520 3.8640 -4.1040 28.7280
28.00000 1.3900 1.4039 10.2800 10.3828 44.00000 1.1259 1.4734 8.3268 10.8968 22.00000 0.8618 1.5568 6.3736 11.5136 6.00000 0.5977 1.6402 4.3176 12.1304 1.00000 0.4600 2.8520 3.4150 21.1730
190.00000 -2.1140 -3.9260 -15.6520 -29.0680 9.00000 -1.8120 -4.2280 -13.4160 -31.3040 1.00000 -1.3892 -4.4092 -12.0744 -32.6456
1914.00000 1.1040 2.2080 8.2080 16.4160 229.00000 0.7360 2.5760 5.4720 19.1520 114.00000 0.5520 2.7600 4.1040 20.5200 23.00000 0.1840 3.1280 1.3680 23.2560 4.00000 -0.1840 3.4960 -1.3680 25.9920 1.00000 -0.5520 3.8640 -4.1040 28.7280 1.00000 -1.2328 4.5448 -9.1522 33.7402
28.00000 1.3900 1.4039 10.2800 10.3828 44.00000 1.1259 1.4734 8.3268 10.8968 22.00000 0.8618 1.5568 6.3736 11.5136 6.00000 0.5977 1.6402 4.3176 12.1304
190.00000 -2.1140 -3.9260 -15.6520 -29.0680 9.00000 -1.8120 -4.2280 -13.4160 -31.3040 1.00000 -1.3892 -4.4092 -12.0744 -32.6456
3829.00000 1.1040 2.2080 8.1960 16.3920 457.00000 0.7360 2.5760 5.4640 19.1240 229.00000 0.5520 2.7600 4.0980 20.4900 46.00000 0.1840 3.1280 1.3660 23.2220 8.00000 -0.1840 3.4960 -1.3660 25.9540 2.00000 -0.5520 3.8640 -4.0980 28.6860 1.00000 -0.9200 4.2320 -6.8300 31.4180 1.00000 0.4600 2.8520 3.4150 21.1730
28.00000 1.3900 1.4039 10.2800 10.3828 44.00000 1.1259 1.4734 8.3268 10.8968 22.00000 0.8618 1.5568 6.3736 11.5136 6.00000 0.5977 1.6402 4.3176 12.1304 1.00000 -0.5738 -3.77S0 -4.2484 -27.9500
0.0000 0.0000 0.0000 0.0000 0.0000 0.0000 0.0000 0.0000 0.0000 0.0000 0.0000 0.0000 0.0000 0.0000 0.0000 0.0000 0.0000 0.0000 0.0000 .0000 .0000 .0000 .0000 .0000
0.0000 0.0000 0.0000 0.0000 0.0000 0.0000 0.0000 0.0000 .0000 .0000 .0000 .0000 .0000 .0000 .0000 .0000 .0000
0.0000 0.0000 0.0000 0.0000 0.0000 0.0000 0.0000 0.0000 0.0000 0.0000 0.0000 0.0000 0.0000 0.0000 .0000 .0000 .0000 .0000 .0000 .0000 .0000 .0000
0.0000 0.0000 0.0000 0.0000 0.0000 0.0000 0.0000 0.0000 0.0000 0.0000
0.0000 0.0000 0.0000
0.0000 0.0000 0.0000
0.0000 0.0000 0.0000
0.0000 0.0000 0.0000 0.0000 0.0000 0.0000
0.0000 0.0000 0.0000
0.0000 0.0000 0.0000 0.0000 0.0000 0.0000 0.0000 0.0000 0.0000 0.0000 0.0000 0.0000 0.0000 0.0000 0.0000 0.0000 0.0000 0.0000 0.0000 0.0000 0.0000 0.0000 0.0000 0.0000 0.0000 0.0000 0.0000 0.0000 0.0000 . 0.0000 0.0000 0.0000 0.0000 0.0000 0.0000 0.0000
0.0000 0.0000 0.0000 0.0000 0.0000 0.0000 0.0000 0.0000 0.0000 0.0000 0.0000 0.0000
0.0000 0.0000 0.0000 0.0000 0.0000 0.0000
0.0000 0.0000 0.0000 0.0000 0.0000 0.0000 0.0000 0.0000 0.0000 0.0000 0.0000 0.0000 0.0000 0.0000 0.0000 q.oooo 0.0000 0.0000 0.0000 0.0000 0.0000 0.0000 0.0000 0.0000 0.0000 0.0000 0.0000 0.0000 0.0000 0.0000 0.0000 0.0000 0.0000 0.0000 0.0000 0.0000 0.0000 0.0000 0.0000 0.0000 0.0000 0.0000 0.0000 0.0000 0.0000 0.0000 0.0000 0.0000 0.0000 0.0000 0.0000 0.0000 0.0000 0.0000 0.0000 0.0000 0.0000 0.0000 0.0000 0.0000 0.0000 0.0000 0.0000 o.oooo 0.0000 0.0000 0.0000 0.0000 Q.OOOO 0.0000 0.0000 0.0000 0.0000 0.0000 0.0000 0.0000 0.0000 0.0000 0.0000 0.0000 0.0000 0.0000 0.0000 0.0000 0.0000 0.0000 0.0000 0.0000 0.0000 0.0000 0.0000 0.0000 0.0000 0.0000 0.0000 0.0000 0.0000 0.0000 0.0000 0.0000 0.0000 0.0000 0.0000 0.0000 0.0000 0.0000 0.0000 0.0000 0.0000 0.0000 0.0000 0.0000 0.0000 0.0000 0.0000 0.0000 0.0000 0.0000 0.0000 0.0000 0.0000 0.0000 0.0000 0.0000 0.0000 0.0000 0.0000 0.0000 0.0000 0.0000 0.0000 0.0000 0.0000 0.0000 0.0000 0.0000 0.0000 0.0000 0.0000 0.0000 0.0000 0.0000 0.0000 0.0000 0.0000 0.0000 0.0000
0/
G3-4


