DOT/FAA/AR-08/37,P2 Explicit Finite Element Modeling of ... · Explicit Finite Element Modeling of...
41
DOT/FAA/AR-08/37,P2 Air Traffic Organization Operations Planning Office of Aviation Research and Development Washington, DC 20591 Explicit Finite Element Modeling of Multilayer Composite Fabric for Gas Turbine Engine Containment Systems, Phase II Part 2: Ballistic Impact Testing February 2009 Final Report This document is available to the U.S. public through the National Technical Information Service (NTIS), Springfield, Virginia 22161. U.S. Department of Transportation Federal Aviation Administration
Transcript of DOT/FAA/AR-08/37,P2 Explicit Finite Element Modeling of ... · Explicit Finite Element Modeling of...
DOT/FAA/AR-08/37,P2 Air Traffic Organization Operations Planning Office of Aviation Research and Development Washington, DC 20591
Explicit Finite Element Modeling of Multilayer Composite Fabric for Gas Turbine Engine Containment Systems, Phase II Part 2: Ballistic Impact Testing February 2009 Final Report This document is available to the U.S. public through the National Technical Information Service (NTIS), Springfield, Virginia 22161.
U.S. Department of Transportation Federal Aviation Administration
NOTICE
This document is disseminated under the sponsorship of the U.S. Department of Transportation in the interest of information exchange. The United States Government assumes no liability for the contents or use thereof. The United States Government does not endorse products or manufacturers. Trade or manufacturer's names appear herein solely because they are considered essential to the objective of this report. This document does not constitute FAA certification policy. Consult your local FAA aircraft certification office as to its use. This report is available at the Federal Aviation Administration William J. Hughes Technical Center’s Full-Text Technical Reports page: actlibrary.tc.faa.gov in Adobe Acrobat portable document format (PDF).
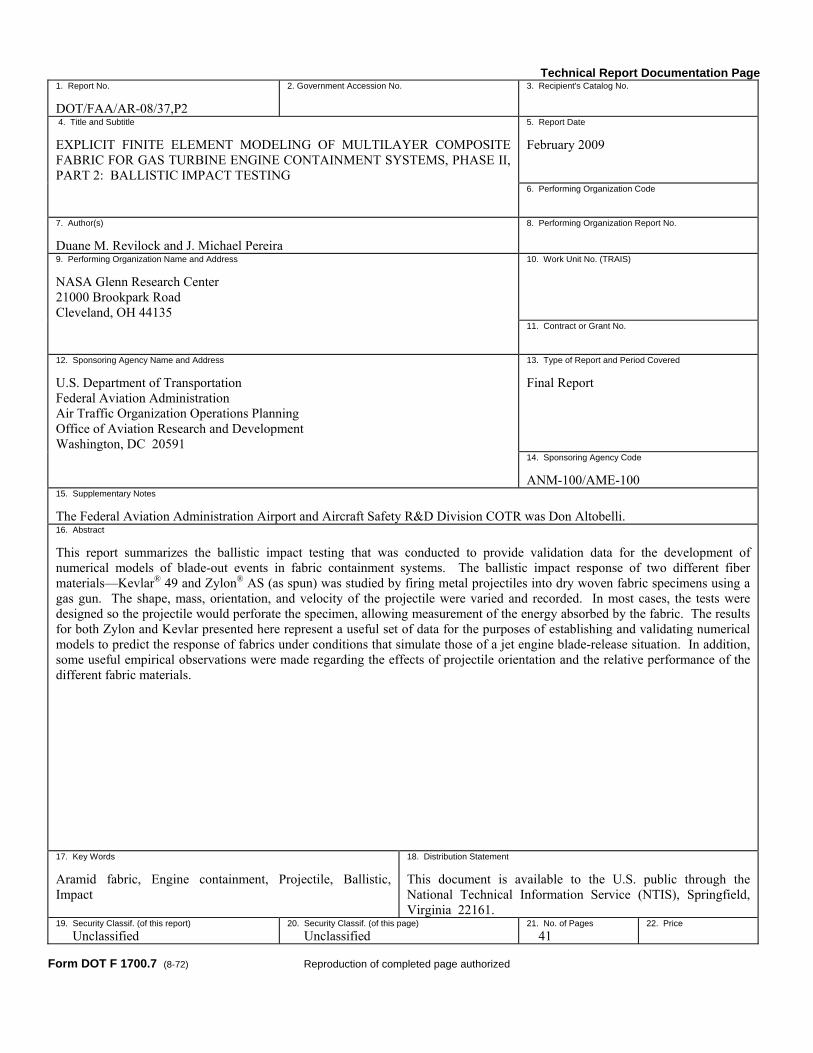
Technical Report Documentation Page
1. Report No. DOT/FAA/AR-08/37,P2
2. Government Accession No. 3. Recipient's Catalog No.
4. Title and Subtitle EXPLICIT FINITE ELEMENT MODELING OF MULTILAYER COMPOSITE FABRIC FOR GAS TURBINE ENGINE CONTAINMENT SYSTEMS, PHASE II, PART 2: BALLISTIC IMPACT TESTING
5. Report Date February 2009
6. Performing Organization Code
7. Author(s) Duane M. Revilock and J. Michael Pereira
8. Performing Organization Report No.
9. Performing Organization Name and Address NASA Glenn Research Center 21000 Brookpark Road Cleveland, OH 44135
10. Work Unit No. (TRAIS)
11. Contract or Grant No.
12. Sponsoring Agency Name and Address U.S. Department of Transportation Federal Aviation Administration Air Traffic Organization Operations Planning Office of Aviation Research and Development Washington, DC 20591
13. Type of Report and Period Covered Final Report
14. Sponsoring Agency Code ANM-100/AME-100
15. Supplementary Notes The Federal Aviation Administration Airport and Aircraft Safety R&D Division COTR was Don Altobelli. 16. Abstract This report summarizes the ballistic impact testing that was conducted to provide validation data for the development of numerical models of blade-out events in fabric containment systems. The ballistic impact response of two different fiber materials—Kevlar® 49 and Zylon® AS (as spun) was studied by firing metal projectiles into dry woven fabric specimens using a gas gun. The shape, mass, orientation, and velocity of the projectile were varied and recorded. In most cases, the tests were designed so the projectile would perforate the specimen, allowing measurement of the energy absorbed by the fabric. The results for both Zylon and Kevlar presented here represent a useful set of data for the purposes of establishing and validating numerical models to predict the response of fabrics under conditions that simulate those of a jet engine blade-release situation. In addition, some useful empirical observations were made regarding the effects of projectile orientation and the relative performance of the different fabric materials. 17. Key Words Aramid fabric, Engine containment, Projectile, Ballistic, Impact
18. Distribution Statement This document is available to the U.S. public through the National Technical Information Service (NTIS), Springfield, Virginia 22161.
19. Security Classif. (of this report) Unclassified
20. Security Classif. (of this page) Unclassified
21. No. of Pages 41
22. Price
Form DOT F 1700.7 (8-72) Reproduction of completed page authorized

TABLE OF CONTENTS
Page EXECUTIVE SUMMARY vii 1. INTRODUCTION 1
2. METHODS 2
2.1 Materials 2 2.2 Test Configuration 2 2.3 Test Matrix 7
3. RESULTS 7
4. DISCUSSION AND CONCLUSIONS 14
5. REFERENCES 15
APPENDICES
A—Procedure for Computing Euler Angles B—Simple Test Results: Evaluating NASA’s Zylon AS 1500 D Fabric
iii

iv
LIST OF FIGURES Figure Page 1 Fabric Specimen Wrapped Around Ring Fixture 3
2 Stainless Steel Projectiles (Left View - Projectile A; Right View - Projectile B) 4
3 Gas Gun Used for Ballistic Impact Testing 5
4 Three Still Images From Typical Tests 6
5 Projectile During Flight 6
6 Normalized Absorbed Energy as a Function of the Projectile Yaw Angle 9
7 Normalized Absorbed Energy as a Function of the Projectile Projected Area 10
8 Normalized Absorbed Energy as a Function of the Number of Fabric Layers 10
9 Comparison of Energy Absorbed by Low-Tension Specimens and Nominal- Tension Specimens 14

LIST OF TABLES Table Page 1 Fabric Properties 2 2 Results From Impact Tests With Varying Projectile Orientation and Aspect Ratio 8 3 Results of Impact Tests on 1500 D Zylon 11 4 Low-Tension Test Results 13
v

LIST OF ACRONYMS
AS As spun ASU Arizona State University D Denier FE Finite element NASA-GRC National Aeronautics and Space Administration Glenn Research Center
vi

EXECUTIVE SUMMARY
A team consisting of Arizona State University (ASU), Honeywell Engines, Systems & Services, the National Aeronautics and Space Administration Glenn Research Center (NASA-GRC) and SRI International (SRI) collaborated to develop computational models and verification testing for designing and evaluating turbine engine fan blade fabric containment structures. This research was conducted under the Federal Aviation Administration Airworthiness Assurance Center of Excellence and sponsored by the Aircraft Catastrophic Failure Prevention Program. The research was directed toward improving the modeling of a turbine engine fabric containment structure for an engine blade-out containment demonstration test required for certification of aircraft engines. In Phase I, progress was made in testing and computational analysis. A material model was developed for Kevlar® and Zylon® fabrics. Static testing of containment wraps subjected to loads through a blunt-nose impactor was performed at ASU. Ballistic testing of containment wraps subjected to a high-velocity blunt projectile was performed at NASA-GRC. These tests provided test cases (benchmark results) to validate the developed finite element (FE) methodology. While the work performed in Phase I met the stated objectives, improvements in robustness and confidence of the FE simulations and predictions were desired. The research conducted in Phase II brought a new level of capability to design and develop fan blade containment systems for turbine engines. To achieve the program objectives, a plan consisting of the following four technical tasks was developed and implemented: • Task 1: Robust FE Model Development. The objective of this task was to increase
confidence and robustness in the material models for the Kevlar and Zylon material models developed in Phase I.
• Task 2: Improve FE Modeling Capability for Multiple Layers of Fabric. In Phase I, most of the LS-DYNA® models used a single-element through the thickness to model the fabric, ranging from 1 to 24 layers.
• Task 3: 1500 Denier (D) Zylon Material Model Development. In Phase I, limited ballistic and static tests of 1500 D Zylon indicated this configuration of Zylon might have the potential to offer a 60-percent weight advantage over a similar configuration of Kevlar 49 fabric for the same fragment energy. The objective of this task was to develop and validate a material model for 1500 D Zylon. It should be noted that during this research, it was discovered that Zylon was found to have excessive deterioration due to heat and humidity. As a result, it was decided that the remainder of this research would focus only on Kevlar fabrics.
• Task 4: Engine Simulations. As in Phase I, the objective of this task was to validate improvements to the material models and FE methods developed under Phase II as they relate to propulsion engine fan blade containment. Existing fabric material models and modeling methods and their improvements were validated using fan containment test data.
vii
Each member of the team developed a comprehensive report describing the details of the research task and the findings. The comprehensive report consists of the following four report parts: • Arizona State University Department of Civil Engineering, Part 1: Fabric Material Tests
• NASA-Glenn Research Center, Part 2: Ballistic Testing
• SRI International, Part 3: Material Model Development and Simulation of Experiments
• Honeywell Engines, Systems & Services, Part 4: Model Simulation for Ballistic Tests, Engine Fan Blade-Out and Generic Engine Model
This report (Part 2) contains a description and the results of the ballistic impact tests conducted at NASA-GRC. In addition, a summary of a fabric aging study is included as an appendix.
viii
1. INTRODUCTION. In the last 30 years, the use of aramid fabrics in jet engine blade containment systems has become common. It is recognized that high-strength and high-elongation fabrics, combined with innovative structural concepts can provide a lightweight, effective fan case system that provides the strength required to safely handle impact loads, blade-rub loads, and the large dynamic loads caused by rotor imbalance. Aramid and other high-strength fibers and fabrics were studied extensively due to their application in a wide range of products such as bulletproof vests, cut-resistant gloves, tires, and sports equipment. However, relatively small amounts of data exist in the public domain for the impact response of fabrics in configurations that are similar to those used in jet engine applications. To address the lack of data and to improve the material models in the range of jet engine applications, the Federal Aviation Administration recently completed a project aimed at developing improved computational tools for designing fabric-based engine containment systems [1-4]. This study was done on Kevlar® 49 and Zylon® as spun (AS) fabric and involved static testing and modeling conducted by Arizona State University (ASU), ballistic impact testing of fabric rings conducted by the National Aeronautics and Space Administration Glenn Research Center (NASA-GRC), material model development and simulation of experiments conducted by SRI International, and model simulations of ballistic tests, fan blade-out, and generic engine modeling conducted by Honeywell Engines, Systems & Services. As a follow-up, Phase II was conducted with the objective of increasing the confidence and robustness of the material models. This involved additional finite element (FE) model development and additional static and ballistic impact testing. This report summarizes the ballistic impact testing that was conducted to provide validation data for the numerical model development. In addition, some useful empirical observations were made regarding the effects of projectile orientation and the relative performance of the different materials. Currently, containment design is largely based on empirical methods, but there is strong motivation on the part of jet engine manufacturers to develop numerical models that can be used to help in the design process of fan containment systems, thereby reducing the cost of testing and increasing the confidence and reliability of the design. A number of research and commercial computer programs are available that can simulate the impact of a released fan blade on the engine case (a blade-out event). These are generally transient, explicit integration FE codes [5 and 6]. The codes themselves are accurate and have been validated by years of use, but the constitutive, failure, and contact models are still the subjects of active research. A large body of data and research studies exist with regard to high strain rate behavior and impact response and constitutive and failure models for metals [7-9]. While there is data available in the literature on the impact response of fabrics [10-12], and models have been developed to simulate fabric impact response [13-15], the body of literature is much smaller than for metals. In addition, studies tend to focus on applications other than jet engines (such as body armor) and generally consider impacts by small high-velocity projectiles. Jet engine fan containment impact involves a larger projectile at subsonic velocities.
1

2. METHODS. The ballistic impact response of fabrics was studied by firing metal projectiles into dry woven fabric specimens using a gas gun. The shape, mass, orientation, and velocity of the projectile were varied and recorded. In most cases, the tests were designed so that the projectile would perforate the specimen, allowing measurement of the energy absorbed by the fabric. 2.1 MATERIALS.
Fabrics woven from two different fiber materials were tested: Kevlar 49 (E.I. DuPont Nemours and Company) and Zylon AS (Toyobo Co., Ltd.). Kevlar is an aramid material with a long history of use in impact applications in general and particularly fan containment systems [16 and 17]. Zylon is relatively new in terms of development; however, a number of studies have demonstrated that, when stored and tested under laboratory conditions, Zylon demonstrates superior performance over Kevlar [18 and 19]. This study considered a single fabric architecture for Kevlar and two architectures for Zylon. The fibers and architecture were selected so two materials of similar architecture could be compared. Two different architectures of the same material (Zylon) were also compared. The fiber and weave parameters of the materials tested are shown in table 1 [14].
Table 1. Fabric Properties
Zylon AS Poly-Benzobisoxazol
Kevlar 49 P-Aramid
Light Heavy Standard Volume density g/cm3 1.54 1.54 1.44 Yarn denier (measured) [3] g/9km 500 1500 1490 Yarn linear density mg/cm 0.556 1.654 1.656 Yarn count yarns/in. 35x35 17x17 17x17 Yarn count yarns/cm 13.8x13.8 6.7x6.7 6.7x6.7 Fabric ply thickness Mm 0.21 0.28 0.28 Fabric areal density g/cm2 0.01575 0.0223 0.02275 Degree of crimp warp yarns % 3.1 2.2 1.1 Degree of crimp fill yarns % 0.6 0.9 0.8
2.2 TEST CONFIGURATION.
The test specimens consisted of layers of 0/90 plain woven cloth, 25 cm (10 in.) wide, wrapped around a ring-shaped steel fixture, as shown in figure 1. The fixture had an outer diameter of 102 cm (40 in.), a thickness of 2.5 cm (1 in.), and was the same height as the fabric width of 25.4 cm (10 in.). The fabric was rolled around the fixture under a controlled tension of 25 N (5.5 lb) until the desired number of layers was achieved. The fixture had a 25.4-cm (10 in.) circumferential gap at the impact location. It was placed in front of the gun barrel at an incline of 15º so the projectile, after exiting the gun barrel, passed over the front edge of the ring, passed through the gap in the ring fixture, and then impacted the fabric from the general direction of the center of the ring. Because of the circumferential gap and the tension on the specimen, the fabric
2
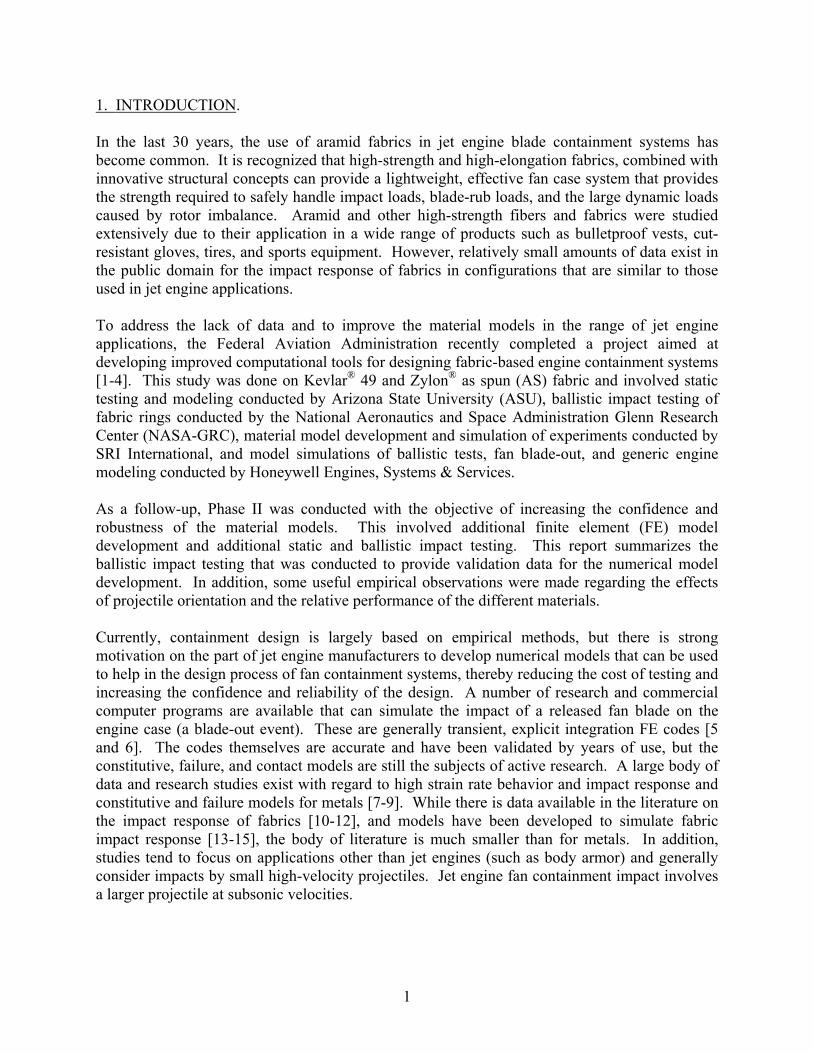
was flat at the region where impact occurred, rather than following the curved shape of the ring fixture. This configuration was chosen rather than a flat specimen held in a square or a rectangular fixture because experience has shown that, in this latter configuration, the boundary conditions play a major role in the response of the fabric specimen.
Note: The arrow shows the location of the impact.
Figure 1. Fabric Specimen Wrapped Around Ring Fixture
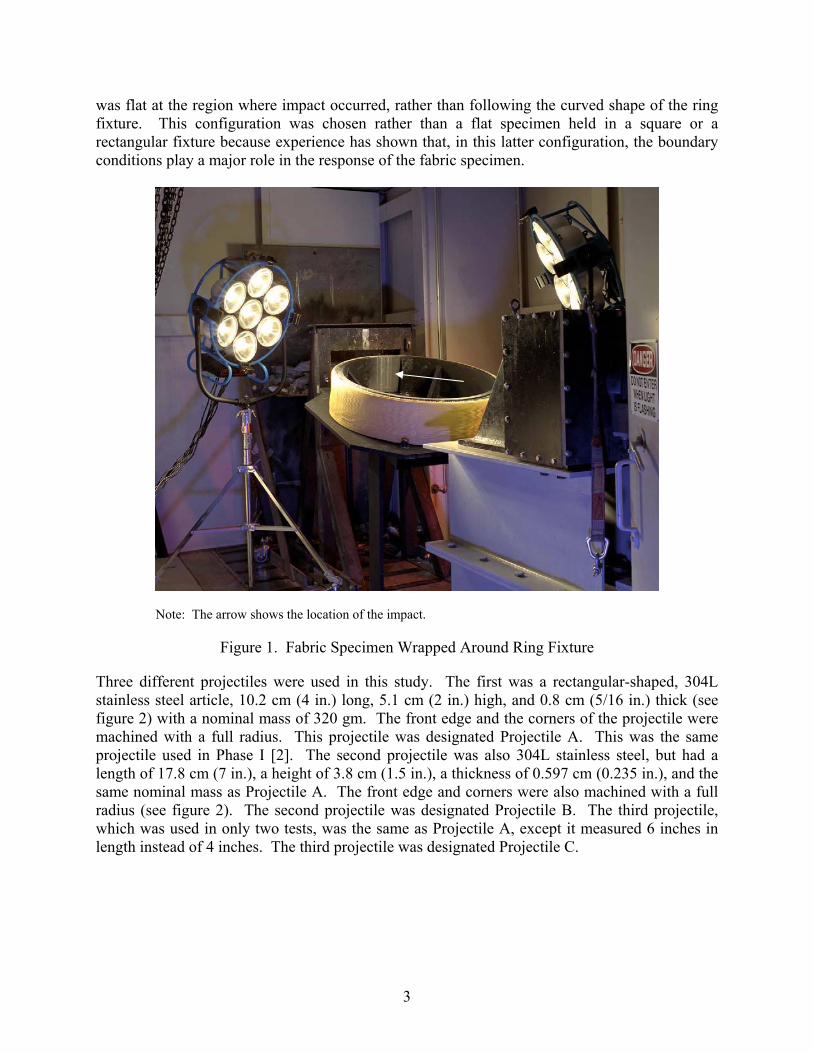
Three different projectiles were used in this study. The first was a rectangular-shaped, 304L stainless steel article, 10.2 cm (4 in.) long, 5.1 cm (2 in.) high, and 0.8 cm (5/16 in.) thick (see figure 2) with a nominal mass of 320 gm. The front edge and the corners of the projectile were machined with a full radius. This projectile was designated Projectile A. This was the same projectile used in Phase I [2]. The second projectile was also 304L stainless steel, but had a length of 17.8 cm (7 in.), a height of 3.8 cm (1.5 in.), a thickness of 0.597 cm (0.235 in.), and the same nominal mass as Projectile A. The front edge and corners were also machined with a full radius (see figure 2). The second projectile was designated Projectile B. The third projectile, which was used in only two tests, was the same as Projectile A, except it measured 6 inches in length instead of 4 inches. The third projectile was designated Projectile C.
3

Figure 2. Stainless Steel Projectiles (Left View - Projectile A; Right View - Projectile B)
The gas gun used to accelerate the projectile consisted of a pressure vessel with a volume of 0.35 m3 (12.5 ft3), a gun barrel with a length of 12.2 m (40 ft) and an inner diameter of 20.32 cm (8 in.). A photograph of the gun is shown in figure 3. The pressure vessel and the gun barrel were mated by a flange on each side, with a number of layers of Mylar® sheets sandwiched between the flanges to seal the pressure vessel and to act as a burst valve. Helium gas was used as the propellant. The pressurized helium was released into the gun barrel by applying a voltage across a Nichrome™ wire embedded in the Mylar sheets, causing the Mylar sheets to rupture. The projectile was supported inside an aluminum can-shaped, cylindrical sabot that was machined to fit snugly inside the gun barrel. The orientation of the projectile was controlled by supporting the projectile either with rigid foam or with an aluminum wedge welded to the bottom of the sabot. The sabot was stopped at the end of the gun barrel by a thick steel plate with a rectangular slot large enough to allow the projectile to pass through. The gun barrel was evacuated to reduce blast loading on the specimen and to reduce the amount of pressure required to achieve the desired impact velocity.
4
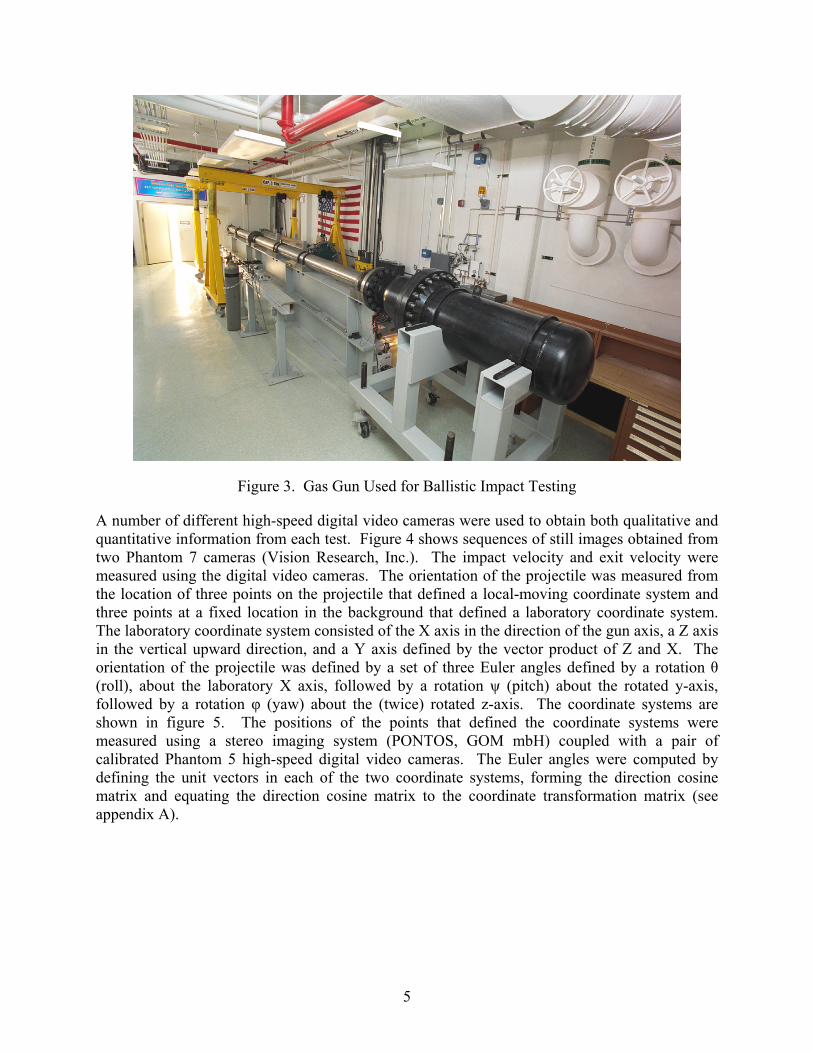
Figure 3. Gas Gun Used for Ballistic Impact Testing
A number of different high-speed digital video cameras were used to obtain both qualitative and quantitative information from each test. Figure 4 shows sequences of still images obtained from two Phantom 7 cameras (Vision Research, Inc.). The impact velocity and exit velocity were measured using the digital video cameras. The orientation of the projectile was measured from the location of three points on the projectile that defined a local-moving coordinate system and three points at a fixed location in the background that defined a laboratory coordinate system. The laboratory coordinate system consisted of the X axis in the direction of the gun axis, a Z axis in the vertical upward direction, and a Y axis defined by the vector product of Z and X. The orientation of the projectile was defined by a set of three Euler angles defined by a rotation θ (roll), about the laboratory X axis, followed by a rotation ψ (pitch) about the rotated y-axis, followed by a rotation φ (yaw) about the (twice) rotated z-axis. The coordinate systems are shown in figure 5. The positions of the points that defined the coordinate systems were measured using a stereo imaging system (PONTOS, GOM mbH) coupled with a pair of calibrated Phantom 5 high-speed digital video cameras. The Euler angles were computed by defining the unit vectors in each of the two coordinate systems, forming the direction cosine matrix and equating the direction cosine matrix to the coordinate transformation matrix (see appendix A).
5

Figure 4. Three Still Images From Typical Tests (top and side views)
I3
I1
e1
e2
e3
Figure 5. Projectile During Flight (The local and laboratory coordinate systems are shown.)
6
7
2.3 TEST MATRIX.
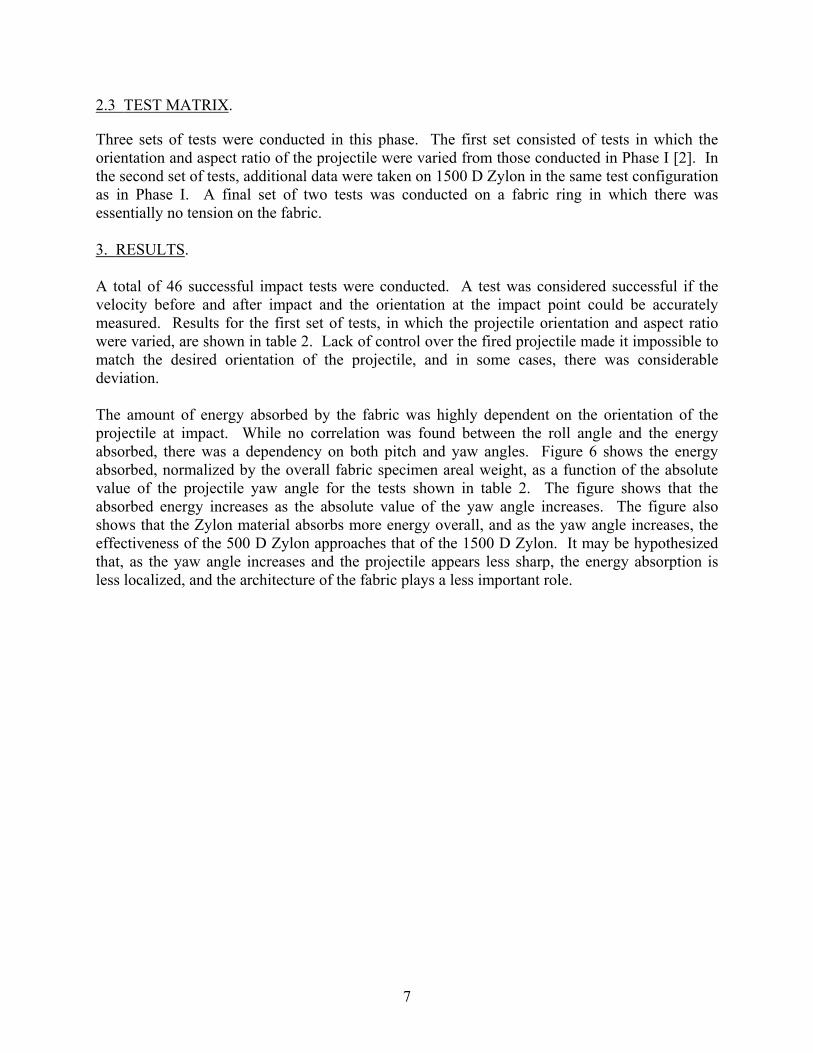
Three sets of tests were conducted in this phase. The first set consisted of tests in which the orientation and aspect ratio of the projectile were varied from those conducted in Phase I [2]. In the second set of tests, additional data were taken on 1500 D Zylon in the same test configuration as in Phase I. A final set of two tests was conducted on a fabric ring in which there was essentially no tension on the fabric. 3. RESULTS. A total of 46 successful impact tests were conducted. A test was considered successful if the velocity before and after impact and the orientation at the impact point could be accurately measured. Results for the first set of tests, in which the projectile orientation and aspect ratio were varied, are shown in table 2. Lack of control over the fired projectile made it impossible to match the desired orientation of the projectile, and in some cases, there was considerable deviation. The amount of energy absorbed by the fabric was highly dependent on the orientation of the projectile at impact. While no correlation was found between the roll angle and the energy absorbed, there was a dependency on both pitch and yaw angles. Figure 6 shows the energy absorbed, normalized by the overall fabric specimen areal weight, as a function of the absolute value of the projectile yaw angle for the tests shown in table 2. The figure shows that the absorbed energy increases as the absolute value of the yaw angle increases. The figure also shows that the Zylon material absorbs more energy overall, and as the yaw angle increases, the effectiveness of the 500 D Zylon approaches that of the 1500 D Zylon. It may be hypothesized that, as the yaw angle increases and the projectile appears less sharp, the energy absorption is less localized, and the architecture of the fabric plays a less important role.
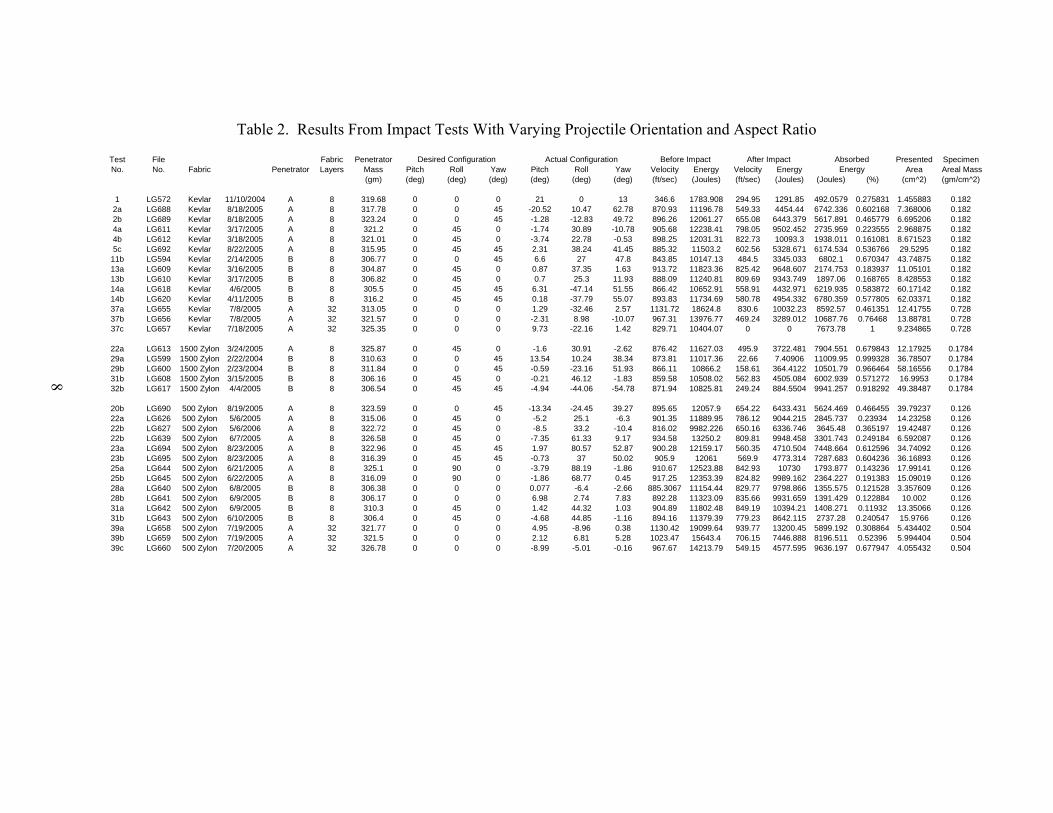
Table 2. Results From Impact Tests With Varying Projectile Orientation and Aspect Ratio
8
39c LG660 500 Zylon 7/20/2005 A 32 326.78 0 0 0 -8.99 -5.01 -0.16 967.67 14213.79 549.15 4577.595 9636.197 0.677947 4.055432 0.504
Test File Fabric Penetrator Presented SpecimenNo. No. Fabric Penetrator Layers Mass Pitch Roll Yaw Pitch Roll Yaw Velocity Energy Velocity Energy Area Areal Mass
(gm) (deg) (deg) (deg) (deg) (deg) (deg) (ft/sec) (Joules) (ft/sec) (Joules) (Joules) (%) (cm^2) (gm/cm^2)
1 LG572 Kevlar 11/10/2004 A 8 319.68 0 0 0 21 0 13 346.6 1783.908 294.95 1291.85 492.0579 0.275831 1.455883 0.1822a LG688 Kevlar 8/18/2005 A 8 317.78 0 0 45 -20.52 10.47 62.78 870.93 11196.78 549.33 4454.44 6742.336 0.602168 7.368006 0.1822b LG689 Kevlar 8/18/2005 A 8 323.24 0 0 45 -1.28 -12.83 49.72 896.26 12061.27 655.08 6443.379 5617.891 0.465779 6.695206 0.1824a LG611 Kevlar 3/17/2005 A 8 321.2 0 45 0 -1.74 30.89 -10.78 905.68 12238.41 798.05 9502.452 2735.959 0.223555 2.968875 0.1824b LG612 Kevlar 3/18/2005 A 8 321.01 0 45 0 -3.74 22.78 -0.53 898.25 12031.31 822.73 10093.3 1938.011 0.161081 8.671523 0.1825c LG692 Kevlar 8/22/2005 A 8 315.95 0 45 45 2.31 38.24 41.45 885.32 11503.2 602.56 5328.671 6174.534 0.536766 29.5295 0.182
11b LG594 Kevlar 2/14/2005 B 8 306.77 0 0 45 6.6 27 47.8 843.85 10147.13 484.5 3345.033 6802.1 0.670347 43.74875 0.18213a LG609 Kevlar 3/16/2005 B 8 304.87 0 45 0 0.87 37.35 1.63 913.72 11823.36 825.42 9648.607 2174.753 0.183937 11.05101 0.18213b LG610 Kevlar 3/17/2005 B 8 306.82 0 45 0 0.7 25.3 11.93 888.09 11240.81 809.69 9343.749 1897.06 0.168765 8.428553 0.18214a LG618 Kevlar 4/6/2005 B 8 305.5 0 45 45 6.31 -47.14 51.55 866.42 10652.91 558.91 4432.971 6219.935 0.583872 60.17142 0.18214b LG620 Kevlar 4/11/2005 B 8 316.2 0 45 45 0.18 -37.79 55.07 893.83 11734.69 580.78 4954.332 6780.359 0.577805 62.03371 0.18237a LG655 Kevlar 7/8/2005 A 32 313.05 0 0 0 1.29 -32.46 2.57 1131.72 18624.8 830.6 10032.23 8592.57 0.461351 12.41755 0.72837b LG656 Kevlar 7/8/2005 A 32 321.57 0 0 0 -2.31 8.98 -10.07 967.31 13976.77 469.24 3289.012 10687.76 0.76468 13.88781 0.72837c LG657 Kevlar 7/18/2005 A 32 325.35 0 0 0 9.73 -22.16 1.42 829.71 10404.07 0 0 7673.78 1 9.234865 0.728
22a LG613 1500 Zylon 3/24/2005 A 8 325.87 0 45 0 -1.6 30.91 -2.62 876.42 11627.03 495.9 3722.481 7904.551 0.679843 12.17925 0.178429a LG599 1500 Zylon 2/22/2004 B 8 310.63 0 0 45 13.54 10.24 38.34 873.81 11017.36 22.66 7.40906 11009.95 0.999328 36.78507 0.178429b LG600 1500 Zylon 2/23/2004 B 8 311.84 0 0 45 -0.59 -23.16 51.93 866.11 10866.2 158.61 364.4122 10501.79 0.966464 58.16556 0.178431b LG608 1500 Zylon 3/15/2005 B 8 306.16 0 45 0 -0.21 46.12 -1.83 859.58 10508.02 562.83 4505.084 6002.939 0.571272 16.9953 0.178432b LG617 1500 Zylon 4/4/2005 B 8 306.54 0 45 45 -4.94 -44.06 -54.78 871.94 10825.81 249.24 884.5504 9941.257 0.918292 49.38487 0.1784
20b LG690 500 Zylon 8/19/2005 A 8 323.59 0 0 45 -13.34 -24.45 39.27 895.65 12057.9 654.22 6433.431 5624.469 0.466455 39.79237 0.12622a LG626 500 Zylon 5/6/2005 A 8 315.06 0 45 0 -5.2 25.1 -6.3 901.35 11889.95 786.12 9044.215 2845.737 0.23934 14.23258 0.12622b LG627 500 Zylon 5/6/2006 A 8 322.72 0 45 0 -8.5 33.2 -10.4 816.02 9982.226 650.16 6336.746 3645.48 0.365197 19.42487 0.12622b LG639 500 Zylon 6/7/2005 A 8 326.58 0 45 0 -7.35 61.33 9.17 934.58 13250.2 809.81 9948.458 3301.743 0.249184 6.592087 0.12623a LG694 500 Zylon 8/23/2005 A 8 322.96 0 45 45 1.97 80.57 52.87 900.28 12159.17 560.35 4710.504 7448.664 0.612596 34.74092 0.12623b LG695 500 Zylon 8/23/2005 A 8 316.39 0 45 45 -0.73 37 50.02 905.9 12061 569.9 4773.314 7287.683 0.604236 36.16893 0.12625a LG644 500 Zylon 6/21/2005 A 8 325.1 0 90 0 -3.79 88.19 -1.86 910.67 12523.88 842.93 10730 1793.877 0.143236 17.99141 0.12625b LG645 500 Zylon 6/22/2005 A 8 316.09 0 90 0 -1.86 68.77 0.45 917.25 12353.39 824.82 9989.162 2364.227 0.191383 15.09019 0.12628a LG640 500 Zylon 6/8/2005 B 8 306.38 0 0 0 0.077 -6.4 -2.66 885.3067 11154.44 829.77 9798.866 1355.575 0.121528 3.357609 0.12628b LG641 500 Zylon 6/9/2005 B 8 306.17 0 0 0 6.98 2.74 7.83 892.28 11323.09 835.66 9931.659 1391.429 0.122884 10.002 0.12631a LG642 500 Zylon 6/9/2005 B 8 310.3 0 45 0 1.42 44.32 1.03 904.89 11802.48 849.19 10394.21 1408.271 0.11932 13.35066 0.12631b LG643 500 Zylon 6/10/2005 B 8 306.4 0 45 0 -4.68 44.85 -1.16 894.16 11379.39 779.23 8642.115 2737.28 0.240547 15.9766 0.12639a LG658 500 Zylon 7/19/2005 A 32 321.77 0 0 0 4.95 -8.96 0.38 1130.42 19099.64 939.77 13200.45 5899.192 0.308864 5.434402 0.50439b LG659 500 Zylon 7/19/2005 A 32 321.5 0 0 0 2.12 6.81 5.28 1023.47 15643.4 706.15 7446.888 8196.511 0.52396 5.994404 0.504
AbsorbedEnergy
Actual ConfigurationDesired Configuration Before Impact After Impact

0
10
20
30
40
50
60
70
0 10 20 30 40 50 60
Absolute Value of Yaw Angle (deg)
Ener
gy A
bsor
bed
(KJ-
cm^2
/g)
70
Kevlar, Projectile A500d Zylon, Projectile AKevlar, Projectile B1500d Zylon, Projectile BLinear (500d Zylon, Projectile A)Linear (Kevlar, Projectile B)Linear (1500d Zylon, Projectile B)Linear (Kevlar, Projectile A)
Figure 6. Normalized Absorbed Energy as a Function of the Projectile Yaw Angle
Of the three angles, yaw has the biggest effect on the projected area of the projectile on the fabric. The projected area of the projectile can be computed from the planar area of the projectile multiplied by the scalar product of the unit vectors normal to the projectile and normal to the fabric. That is,
(1) 2( )p nA A e i= ⋅
Where is the projected area of the projectile, is the planar area of the projectile, pA A 2e is the
unit normal vector to the projectile (figure 6), and ni is the unit normal to the fabric specimen at
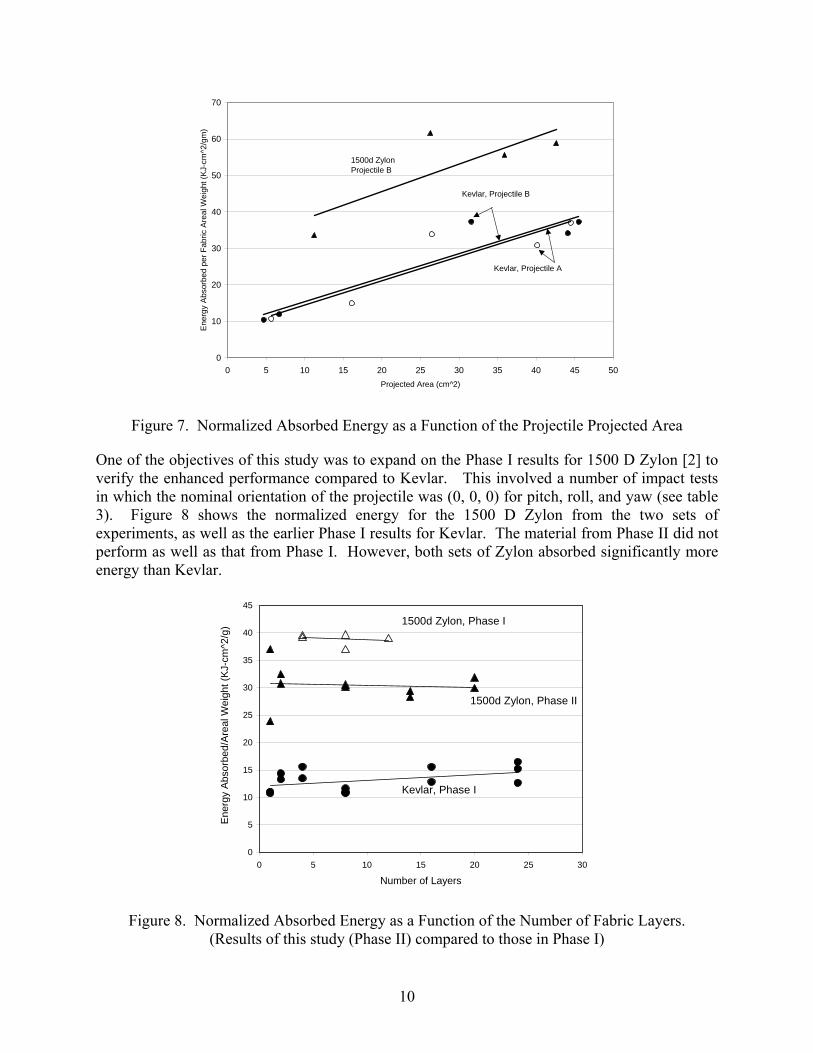
the impact point. In this case, )15sin()15cos( 31 IIin += 1I where and 3I are shown in figure 6. The effect of the projectile’s projected area on the energy absorbed, normalized by the total areal weight of the fabric specimen, is shown in figure 7 for the Kevlar and 1500 D Zylon. While there is some scatter in the results, there appears to be a linear relationship between the normalized absorbed energy and the projected area of the projectile. In addition, it appears that the actual shape of the projectile had less of an effect than the presented area itself. Figure 7 also shows that the normalized energy absorbed by Zylon is approximately twice as much as for Kevlar with the same areal weight and architecture.
9
10
0
10
20
30
40
50
60
70
0 5 10 15 20 25 30 35 40 45 50Projected Area (cm^2)
Ene
rgy
Abs
orbe
d pe
r Fab
ric A
real
Wei
ght (
KJ-
cm^2
/gm
)
Kevlar, Projectile A
Kevlar, Projectile B
1500d ZylonProjectile B
Figure 7. Normalized Absorbed Energy as a Function of the Projectile Projected Area
One of the objectives of this study was to expand on the Phase I results for 1500 D Zylon [2] to verify the enhanced performance compared to Kevlar. This involved a number of impact tests in which the nominal orientation of the projectile was (0, 0, 0) for pitch, roll, and yaw (see table 3). Figure 8 shows the normalized energy for the 1500 D Zylon from the two sets of experiments, as well as the earlier Phase I results for Kevlar. The material from Phase II did not perform as well as that from Phase I. However, both sets of Zylon absorbed significantly more energy than Kevlar.
0
5
10
15
20
25
30
35
40
45
0 5 10 15 20 25 30
Ene
rgy
Abs
orbe
d/A
real
Wei
ght (
KJ-
cm^2
/g)
Kevlar, Phase I
1500d Zylon, Phase I
1500d Zylon, Phase II
Number of Layers
Figure 8. Normalized Absorbed Energy as a Function of the Number of Fabric Layers. (Results of this study (Phase II) compared to those in Phase I)

Table 3. Results of Impact Tests on 1500 D Zylon
Actual Configuration Before Impact After Impact Absorbed Energy Test
No. Fabric Penetrator Test Date Fabric Layers
Penetrator Mass (gm)
Pitch (deg)
Roll (deg)
Yaw (deg)
Velocity (ft/sec)
Energy (ft lb)
Velocity (ft/sec)
Energy (ft lb) (ft lb) (%)
LG661 1500 Zylon A 7/21/2005 8 320.57 -13.59 1.25 3.25 886.9700 8640.657 652.0700 4670.005 3970.652 0.459531 LG663 1500 Zylon A 7/22/2005 8 321.59 2.64 -27.19 3.56 875.9700 8454.483 634.3800 4434.121 4020.362 0.475530 LG662 1500 Zylon A 7/21/2005 1 325.6 -6.41 -48.01 -4.98 623.7400 4340.079 578.3600 3731.530 608.549 0.140216 LG664 1500 Zylon A 7/22/2005 1 326.76 1.69 -3.37 0.52 615.0300 4234.748 585.7800 3841.528 393.2195 0.092855 LG698 1500 Zylon A 8/25/2005 2 323.77 0.47 -13.19 4.94 597.4192 3959.141 515.4869 2947.664 1011.478 0.255479 LG702 1500 Zylon A 8/31/2005 2 320.23 0.51 11.55 10.59 604.0339 4003.046 517.2067 2934.920 1068.126 0.266828 LG700 1500 Zylon A 8/26/2005 14 318.46 2.32 12.06 -2.75 1012.4560 11184.420 653.473v 4659.253 6525.165 0.583416
11

The difference in impact strength between Phase I and Phase II for the 1500 D Zylon was considered significant and worthy of investigation. It was hypothesized that the difference was due to the known age-related degradation in the mechanical properties of Zylon. In Phase I of this study [2], the 1500 D Zylon was fabricated in March 2002 and the impact testing was conducted May 9-21, 2002, a period of two to three months later. In the Phase II study, the material was manufactured in June 2004 and the impact testing was conducted between July 21 and August 30, 2005, over a year later. During the period between manufacturing and testing in both phases, the material was stored under normal indoor laboratory conditions in a closed container to prevent any light exposure. A test program was conducted at the ASU Department of Civil Engineering to investigate age-related changes in strength, modulus, and toughness of 1500 D Zylon stored in laboratory conditions. A summary of this study is included in appendix B of this report. The study concluded that there is a statistically significant decrease in the strength and toughness of the fabric with age, and a small decrease in the stiffness. Over a 12-month period, the strength decreased by 9%, the toughness decreased by 22%, and the stiffness decreased by 2%. In addition, tests conducted on virgin (before weaving) fabric, 8 months after delivery to the weaver, showed a 40% decrease in the measured strength compared to the manufacturer’s published value. These results support the hypothesis that the reduction in the impact energy absorption capacity of the 1500 D Zylon between Phase I and Phase II was, in fact, due to age-related changes in mechanical properties. The final set of tests was performed to look at the effect of fabric tension. In these tests, eight layers of 500 D Zylon were wrapped around the fixture with essentially no tension and impacted using Projectile A with a desired orientation of (0, 0, 0) pitch, roll and yaw, respectively. The results of these tests are shown in table 4. The results were compared with the 500 D Zylon tests (Projectile A) from table 2 and are shown in figure 9. Figure 9 shows the increase in absorbed energy per fabric areal weight as a function of projectile projected area for the specimens under the nominal tension. Results from the two tests at low tension showed no significant difference. However, it should be noted that only two tests were conducted at low specimen tension, and more tests are needed to gain more confidence in this conclusion.
12
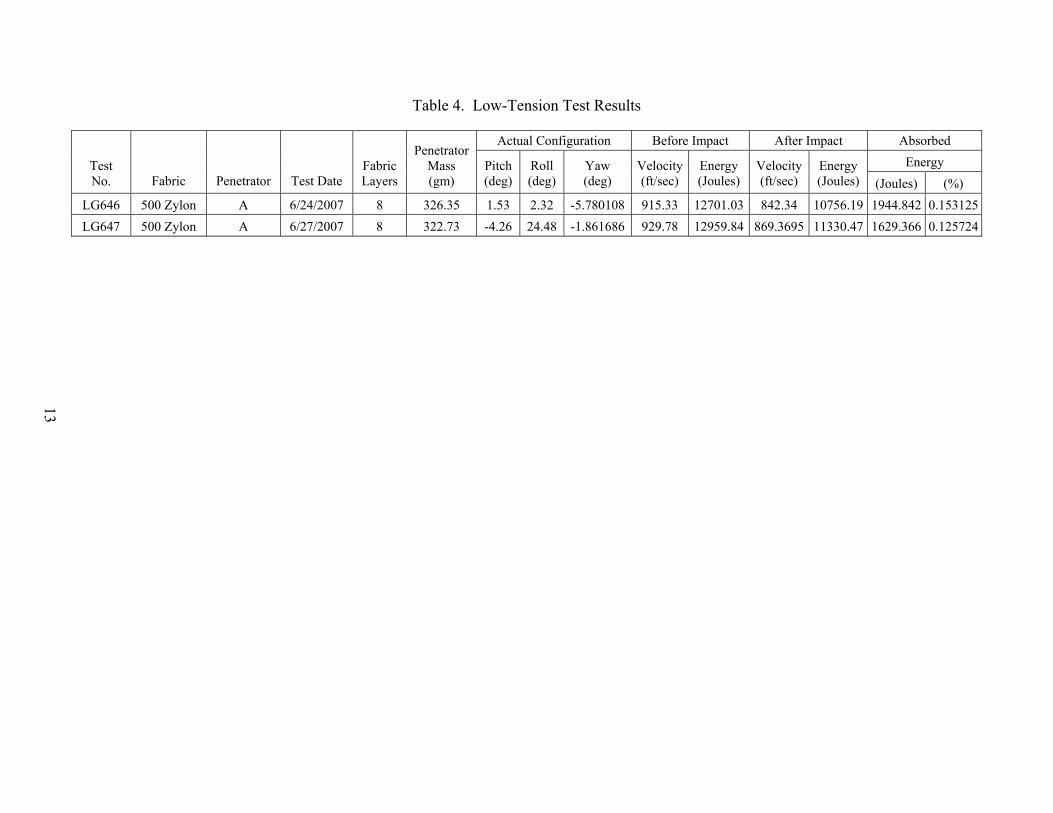
Table 4. Low-Tension Test Results
Actual Configuration Before Impact After Impact Absorbed Energy Test
No. Fabric Penetrator Test Date Fabric Layers
Penetrator Mass (gm)
Pitch (deg)
Roll (deg)
Yaw (deg)
Velocity(ft/sec)
Energy (Joules)
Velocity (ft/sec)
Energy (Joules) (Joules) (%)
LG646 500 Zylon A 6/24/2007 8 326.35 1.53 2.32 -5.780108 915.33 12701.03 842.34 10756.19 1944.842 0.153125LG647 500 Zylon A 6/27/2007 8 322.73 -4.26 24.48 -1.861686 929.78 12959.84 869.3695 11330.47 1629.366 0.125724
13

0
10
20
30
40
50
60
70
0 5 10 15 20 25 30 35 40
Presented Area (cm^2)
Ene
rgy
Abs
orbe
d pe
r Fab
ric A
real
Wei
ght (
KJ-
cm^2
/gm
))
500d Zylon, Old ProjectileLow TensionLinear (500d Zylon, Old Projectile)
Figure 9. Comparison of Energy Absorbed by Low-Tension Specimens and
Nominal-Tension Specimens
4. DISCUSSION AND CONCLUSIONS. The test configuration described in this report was designed to be somewhat representative of fabric containment systems used in jet engines, while maintaining repeatability and simplicity in the test. The results show that under the conditions of this test, Zylon was able to absorb over twice the energy than Kevlar when compared on an overall weight basis. The normalized energy absorbed is relatively insensitive to the number of layers of material. These results are consistent with Phase I [2]. This allows for a fairly simple design procedure if the assumption is made that the amount of energy absorbed per unit weight is independent of the number of layers of material. Except in cases where the yaw angle was high, the heavier-weight Zylon material performed better than the lighter material with the same overall weight. This is consistent with the results of Phase I. The energy absorbed by the fabric when normalized by the overall areal weight of the fabric ring is approximately linearly related to the presented area of the projectile at impact and, within the parameters of this study, is independent of the actual shape of the projectile. The data presented here were collected using Zylon that was stored without exposure to extreme temperature and humidity for several months under normal laboratory conditions. It has been reported widely that the performance of Zylon degrades significantly under certain temperature and humidity conditions, which are likely to be encountered in many applications. However, these results indicate that degradation in the mechanical properties of Zylon occurred even under
14
15
favorable conditions. The deterioration of strength observed over time in the current Zylon fabric makes the fabric impractical for long-term use in engine containment systems. The limited tests performed under conditions of no fabric tension indicate that there is no significant difference in energy absorption between the two tested conditions. However, this should be validated by additional testing. The results for both Zylon and Kevlar presented in this report represent a useful set of data for the purposes of establishing both empirical and numerical models to predict the response of fabrics under conditions that simulate those of a jet engine blade release situations. 5. REFERENCES. 1. Rajan, S.D., Mobashir, B., Sharda, J., Yanna, V., Deenadaylu, C., Lau, D., and Shah, D.,
“Explicit Finite Element Modeling of Multilayer Composite Fabric for Gas Turbine Engine Containment Systems, Part 1: Static Tests and Modeling,” FAA report DOT/FAA/AR-04/40,P1, November 2004.
2. Pereira, J.M. and Revilock, D.M., “Explicit Finite Element Modeling of Multilayer Composite Fabric for Gas Turbine Engine Containment Systems, Part 2: Ballistic Impact Testing,” FAA report, DOT/FAA/AR-04/40,P2, November 2004.
3. Simons, J., Erlich, D., and Shockey, D., “Explicit Finite Element Modeling of Multilayer Composite Fabric for Gas Turbine Engine Containment Systems, Part 3: Model Development and Simulation of Experiments,” FAA report, DOT/FAA/AR-04/40,P3, November 2004.
4. Gomuc, R., “Explicit Finite Element Modeling of Multilayer Composite Fabric for Gas Turbine Engine Containment Systems, Part 4: Model Simulation for Ballistic Tests, Engine Fan Blade-Out, and Generic Engine,” FAA report, DOT/FAA/AR-04/40,P4, November 2004.
5. “LS-DYNA Theoretical Manual,” Livermore Software Technology Corp., Livermore, CA, 1998.
6. “ABAQUS/Explicit User’s Manual,” ABAQUS, Inc., Pawtucket, Rhode Island, 2003.
7. Wong, A.K and Connors, M.L., “A Literature Survey on Correlation of Laboratory Tests and the Ballistic Resistance of Rolled Homogeneous Steel and Aluminum Armors,” Technical Report AMMRC SP 72-10, Army Materials and Mechanics Research Center, Watertown, Massachusetts, September 1971.
8. Clifton, R.J., “Response of Materials Under Dynamic Loading,” International Journal of Solids and Structures, Vol. 37, 2000, pp. 105-113.
9. Johnson, G.R. and Cook, W.H., “Fracture Characteristics of Three Metals Subjected to Various Strains, Strain Rates, Temperatures, and Pressures,” Engineering Fracture Mechanics, Vol. 21(1), pp. 31-48, 1985.
10. Roylance, D. and Wang, S.S., Penetration Mechanics of Textile Structures in Ballistic Materials and Penetration Mechanics, R.C. Laible, ed., Elsevier, 1980.
11. Cunniff, P.M., “A Semi-Empirical Model for the Ballistic Impact Performance of Textile-Based Personnel Armor,” Textile Research Journal, Vol. 56, pp. 45-60, 1996.
12. Figucia, F., “Energy Absorption of Kevlar Fabrics Under Ballistic Impact,” Technical Report A090390, Defense Technical Information Center, 1980.
13. Tabiei, A. and Ivanov, I., “Computational Micro-Mechanical Model of Flexible Woven Fabric for Finite Element Impact Simulation,” International Journal of Numerical Methods in Engineering, Vol. 53, pp. 1259-1276, 2002.
14. Lim, C.T., Shim, V.P.W., and Ng, Y.H., “Finite-Element Modeling of the Ballistic Impact of Fabric Armor,” International Journal of Impact Engineering, Vol. 28, pp. 13-31, 2003.
15. Zohdi, T.I., “Modeling and Simulation of Progressive Penetration of Multilayered Ballistic Fabric Shielding,” Computational Mechanics, Vol. 29, No. 1, 2002, pp. 61-67.
16. Scala, P.E., “A Brief History of Composites in the U.S.—The Dream and the Success,” JOM, Vol. 48, No. 2, pp. 45-48, 1996.
17. Stotler, C.L., “Development of Advanced Lightweight Containment Systems,” NASA CR-165212, National Aeronautics and Space Administration, 1981.
18. Shockey, D.A., Erlich, D.C., and Simons, J.W., “Lightweight Fragment Barriers for Commercial Aircraft,” 18th International Symposium on Ballistics, San Antonio, Texas, 15-19 November 1999.
19. Pereira, J.M., Roberts, G.D., and Revilock, D.M., “Elevated Temperature Ballistic Impact Testing of PBO and Kevlar Fabrics for Application in Supersonic Jet Engine Fan Containment Systems,” NASA TM-107532, August 1997.
20. Simons, J.W., Erlich, D.C., and Shockey, D.A., “Explicit Finite Element Modeling of Multilayer Composite Fabric for Gas Turbine Engine Containment Systems, Phase II, Part 3: Material Model Development and Simulation of Experiments,” FAA report DOT/FAA/AR-08/37,P3, February 2009.
21. Cunniff, P.M., “An Analysis of the System Effects in Woven Fabrics Under Ballistic Impact,” Textile Research Journal, Vol. 62, No. 9, 1992.
16

APPENDIX A—PROCEDURE FOR COMPUTING EULER ANGLES
A-1
Using the 3-D photogrammetry system the position of three points on the projectile and three points on a fixed background can be measured. The points on the fixed background are used to define unit orthogonal vectors ( ) in the laboratory system. The points on the projectile are used to define a moving system of unit orthogonal vectors attached to the projectile. At any time, the position of the projectile can be described as a translation plus a sequence of three rotations:
321ˆ,ˆ,ˆ III
1. Roll (θ ) about the projectile x-axis 2. Pitch (ψ ) about the projectile rotated y-axis 3. Yaw (ϕ ) about the projectile twice-rotated z-axis
For the purposes of defining the orientation of the projectile we can ignore the translation terms. Imagine the projectile initially in a position where the projectile coordinate system lines up with the lab coordinate system. The position of a point, R, on the projectile can be described by:
(A1)
Where ( ) are the unit vectors attached to the projectile. If the projectile is rotated by the
angle 321ˆ,ˆ,ˆ iii
θ about the laboratory X axis, the vector R becomes R′ , given by =′R ererer ˆˆˆ 32211 ++ = (A2) 332211
ˆˆˆ iririr ′+′+′ The unit vectors ( ) are the rotated unit vectors in the projectile (x, y, z) directions. These
unit vectors can be found in terms of the ( vectors from 321 ˆ,ˆ,ˆ eee
)ˆ,ˆ,ˆ321 iii
1 2 2 3 3r I r I+ +
3
1 1 1 1 1 2 2 1 3 3ˆ ˆ ˆ ˆ ˆ ˆˆ ˆ ˆ ˆ( ) ( ) ( )e e i i e i i e i i= ⋅ + ⋅ + ⋅
1
2
3
rrr
1 1 2 2 3 3 1ˆ ˆˆ ˆ ˆR ri r i r i r I= + + =
(A3) 2 2 1 1 2 2 2 2 3
ˆ ˆ ˆ ˆ ˆ ˆˆ ˆ ˆ ˆ( ) ( ) ( )e e i i e i i e i i= ⋅ + ⋅ + ⋅
3332231133ˆ)ˆˆ(ˆ)ˆˆ(ˆ)ˆˆ(ˆ iieiieiiee ⋅+⋅+⋅=
Inserting (A3) into (A2) and equating the vector components leads to
(A4)
1 1 1 2 1 3 1
2 1 2 2 2 3 2
3 1 3 2 3 3 3
ˆ ˆ ˆˆ ˆ ˆˆ ˆ ˆˆ ˆ ˆˆ ˆ ˆˆ ˆ ˆ
r e i e i e ir e i e i e ir e i e i e i
⎡ ⎤′ ⋅ ⋅ ⋅⎧ ⎫ ⎧ ⎫⎢ ⎥⎪ ⎪ ⎪ ⎪′ = ⋅ ⋅ ⋅ ⋅⎨ ⎬ ⎨ ⎬⎢ ⎥
⎪ ⎪ ⎪ ⎪⎢ ⎥′ ⋅ ⋅ ⋅⎩ ⎭ ⎩ ⎭⎣ ⎦
A-2

In terms of the rotation angle,θ , this is
(A5) 1 1
2 2
3 3
1 0 00 cos( ) sin( )0 sin( ) cos( )
r rr rr r
θ θθ θ
′⎧ ⎫ ⎡ ⎤ ⎧ ⎫⎪ ⎪ ⎪ ⎪⎢ ⎥′ = − ⋅⎨ ⎬ ⎨ ⎬⎢ ⎥⎪ ⎪ ⎪ ⎪′ ⎢ ⎥⎩ ⎭ ⎣ ⎦ ⎩ ⎭
Assume that the projectile goes through another rotation,ψ , about the projectile y-axis, so that the vector R′ becomes R ′′ and the unit vectors ( ) become ( ). The vector 321 ˆ,ˆ,ˆ eee 321
ˆ,ˆ,ˆ fff R ′′ can be written as:
3322113*
32*
21*
1332211ˆˆˆˆˆˆˆˆˆ iririrerererfrfrfrR ″+″+″=++=++=′′ (A6)
Similar to Eqn. (A3), the components of can be written in terms of the components of as: f e
3312211111 ˆ)ˆˆ(ˆ)ˆˆ(ˆ)ˆˆ(ˆ eefeefeeff ⋅+⋅+⋅=
(A7) 3332221122 ˆ)ˆˆ(ˆ)ˆˆ(ˆ)ˆˆ(ˆ eefeefeeff ⋅+⋅+⋅=
3332231133 ˆ)ˆˆ(ˆ)ˆˆ(ˆ)ˆˆ(ˆ eefeefeeff ⋅+⋅+⋅= The twice rotated vector R ′′ can then be written in terms of the unit vectors ( ): 321 ˆ,ˆ,ˆ eee
[ ] [ ]
[ ] 3333322311
23332222111133122111
ˆ)ˆˆ()ˆˆ()ˆˆ(
ˆ)ˆˆ()ˆˆ()ˆˆ(ˆ)ˆˆ()ˆˆ()ˆˆ(
eefrefrefr
eefrefrefreefrefrefrR
⋅⋅+⋅+⋅
+⋅⋅+⋅+⋅+⋅⋅+⋅+⋅=′′ (A8)
Equating this to the components of *r in Eqn. (A6) gives
(A9) ⎪⎭
⎪⎬
⎫
⎪⎩
⎪⎨
⎧⋅⎥⎥⎥
⎦
⎤
⎢⎢⎢
⎣
⎡
⋅⋅⋅⋅⋅⋅⋅⋅⋅
=⎪⎭
⎪⎬
⎫
⎪⎩
⎪⎨
⎧
3
2
1
333231
222211
131211
*3
*2
*1
ˆˆˆˆˆˆˆˆˆˆˆˆˆˆˆˆˆˆ
rrr
efefefefefefefefef
rrr
In terms of the rotation angle ψ this is:
(A10) ⎪⎭
⎪⎬
⎫
⎪⎩
⎪⎨
⎧⋅⎥⎥⎥
⎦
⎤
⎢⎢⎢
⎣
⎡
−=
⎪⎭
⎪⎬
⎫
⎪⎩
⎪⎨
⎧
3
2
1
*3
*2
*1
cos0sin010
sin0cos
rrr
rrr
ψψ
ψψ
A-3
But the components of R ′′ in the laboratory coordinate system can be given in terms of , and using Eqn. (A6) and (A3):
*1r
*2r
*3r
(A11) ⎪⎭
⎪⎬
⎫
⎪⎩
⎪⎨
⎧
⋅⎥⎥⎥
⎦
⎤
⎢⎢⎢
⎣
⎡−=
⎪⎭
⎪⎬
⎫
⎪⎩
⎪⎨
⎧
′′′′′′
*3
*2
*1
3
2
1
)cos()sin(0)sin()cos(0
001
rrr
rrr
θθθθ
Substituting Eqn. (A11) into (A10) gives:
(A12) ⎪⎭
⎪⎬
⎫
⎪⎩
⎪⎨
⎧⋅⎥⎥⎥
⎦
⎤
⎢⎢⎢
⎣
⎡
−⋅⎥⎥⎥
⎦
⎤
⎢⎢⎢
⎣
⎡−=
⎪⎭
⎪⎬
⎫
⎪⎩
⎪⎨
⎧
′′′′′′
3
2
1
3
2
1
cos0sin010
sin0cos
)cos()sin(0)sin()cos(0
001
rrr
rrr
ψψ
ψψ
θθθθ
Finally, let the projectile go through a third rotation,ϕ , about the twice rotated projectile z-axis, so that the vector R ′′ is rotated to R ′′′ given in the lab coordinate system by
332211ˆˆˆ iririrR ⋅′′′+⋅′′′+⋅′′′=′′′
Following a similar procedure that led to Eqn. (A12) leads to
(A13) ⎪⎭
⎪⎬
⎫
⎪⎩
⎪⎨
⎧
⎥⎥⎥
⎦
⎤
⎢⎢⎢
⎣
⎡ −
⎥⎥⎥
⎦
⎤
⎢⎢⎢
⎣
⎡
−⎥⎥⎥
⎦
⎤
⎢⎢⎢
⎣
⎡−=
⎪⎭
⎪⎬
⎫
⎪⎩
⎪⎨
⎧
′′′′′′′′′
3
2
1
3
2
1
1000cossin0sincos
cos0sin010
sin0cos
cossin0sincos0001
rrr
rrr
ϕϕϕϕ
ψψ
ψψ
θθθθ
or
(A14)
1 1
2 2
3 3
cos cos cos sin sincos sin sin sin cos cos cos sin sin sin sin cossin sin cos sin cos sin cos cos sin sin cos cos
r rr rr r
ψ φ ψ φ ψθ φ θ ψ φ θ φ θ ψ φ θ ψθ φ θ ψ φ θ φ θ φ ψ θ ψ
′′′ −⎧ ⎫ ⎡ ⎤ ⎧ ⎫⎪ ⎪ ⎪ ⎪⎢ ⎥′′′ = + − −⎨ ⎬ ⎨ ⎬⎢ ⎥⎪ ⎪ ⎪ ⎪′′′ ⎢ ⎥− +⎩ ⎭ ⎣ ⎦ ⎩ ⎭
The unit vectors defining the projectile and laboratory coordinate systems were defined using markers placed in the high speed video field of view, as shown schematically in Figure A1. The unit vectors on the projectile were defined as )(/)(1 abab rrrri −−= (A15)
[ ]1
12 ˆ)(
ˆ)(irrirri
ac
ac
×−×−
= (A16)
A-4

(A17) 213ˆˆˆ iii ×=
The unit vectors in the laboratory coordinate system were defined as: )(/)(1 ABAB rrrrI −−= (A18) )(/)(3 ACAC rrrrI −−= (A19) (A20) 132
ˆˆˆ III ×= Any vector, R , in the laboratory coordinate system can be obtained from the components in the blade coordinate system: (A21) 332211332211
ˆˆˆˆˆˆ IRIRIRiririrR ++=++=
[ ] [ ]
[ ]3332231133
33222211223312211111
ˆ)ˆˆ(ˆ)ˆˆ(ˆ)ˆˆ(
ˆ)ˆˆ(ˆ)ˆˆ(ˆ)ˆˆ(ˆ)ˆˆ(ˆ)ˆˆ(ˆ)ˆˆ(
IIiIIiIIir
IIiIIiIIirIIiIIiIIirR
⋅⋅+⋅⋅+⋅⋅+
⋅⋅+⋅⋅+⋅⋅+⋅⋅+⋅⋅+⋅⋅= (A22)
and therefore
(A23) ⎪⎭
⎪⎬
⎫
⎪⎩
⎪⎨
⎧⋅⎥⎥⎥
⎦
⎤
⎢⎢⎢
⎣
⎡
⋅⋅⋅⋅⋅⋅⋅⋅⋅
=⎪⎭
⎪⎬
⎫
⎪⎩
⎪⎨
⎧
3
2
1
333231
232221
131211
3
2
1
ˆˆˆˆˆˆˆˆˆˆˆˆˆˆˆˆˆˆ
rrr
IiIiIiIiIiIiIiIiIi
RRR
The matrix in Eqn. (A-23) can be easily computed and is the same as that in Eqn. (A14). Our procedure for computing the Euler angles was to compute the terms in the matrix of Eqn. (A23) from the positions of points a, b, c, A, B, C, utilizing Eqns. (A15) – (A20) and then equate the terms of that matrix with those of Eqn. (A14). For example, equating component (1, 3) in the two matrices gives )ˆˆ(sin 13
1 Ii ⋅= −ψ (A24) Using this result and equating components (1, 2) gives
⎥⎦
⎤⎢⎣
⎡ ⋅−= −
)cos()ˆˆ(sin 121
ϕϕ Ii (A25)
A-5
A-6
Using components (3, 3) and Eqn. (A24) gives
⎥⎦
⎤⎢⎣
⎡ ⋅= −
)cos()ˆˆ(cos 331
ψθ Ii (A26)
Care must be taken since the above formulas do not have unique solutions on their own. For example sin(θ ) = sin(180-θ ).
Figure A-1. Projectile (left) and Background Coordinate Systems
a b
c
A
B1I
2I
3I
3i1i
2i
C

APPENDIX B—SIMPLE TEST RESULTS: EVALUATING NASA’S ZYLON AS 1500 D FABRIC
B-1/B-2

Technical Report
Simple Tension Test Results:
Evaluating NASA’s Zylon AS 1500D Fabric
Dept. of Civil Engineering
Arizona State University
Tempe, AZ 85287
February 2006
B-3/B-4

Overview
Tension tests of the NASA Zylon 1500 Denier (D) fabrics were carried out to find out the fabric properties. Questions were raised about the NASA ballistic test results involving Zylon 1500D fabric from Phase I of this research. The recent Phase II NASA ballistic test results showed a decrease in energy absorption from the Phase I tests. These tension tests were conducted at Arizona State University (ASU) to try to understand the differences in the NASA test results. The basic properties of the fabric as tested are shown in Table 1.
Table 1. Specimen Properties for Zylon AS–1500D
Yarn Count
Bulk
Density
(lb/in3)
Linear Density (lb/in)
c/s Area per Yarn (in2)
Specimen Size (in)
17 x 17 0.00567358 9.13395(10-7) 1.61(10-4) 2.5 x 10.25
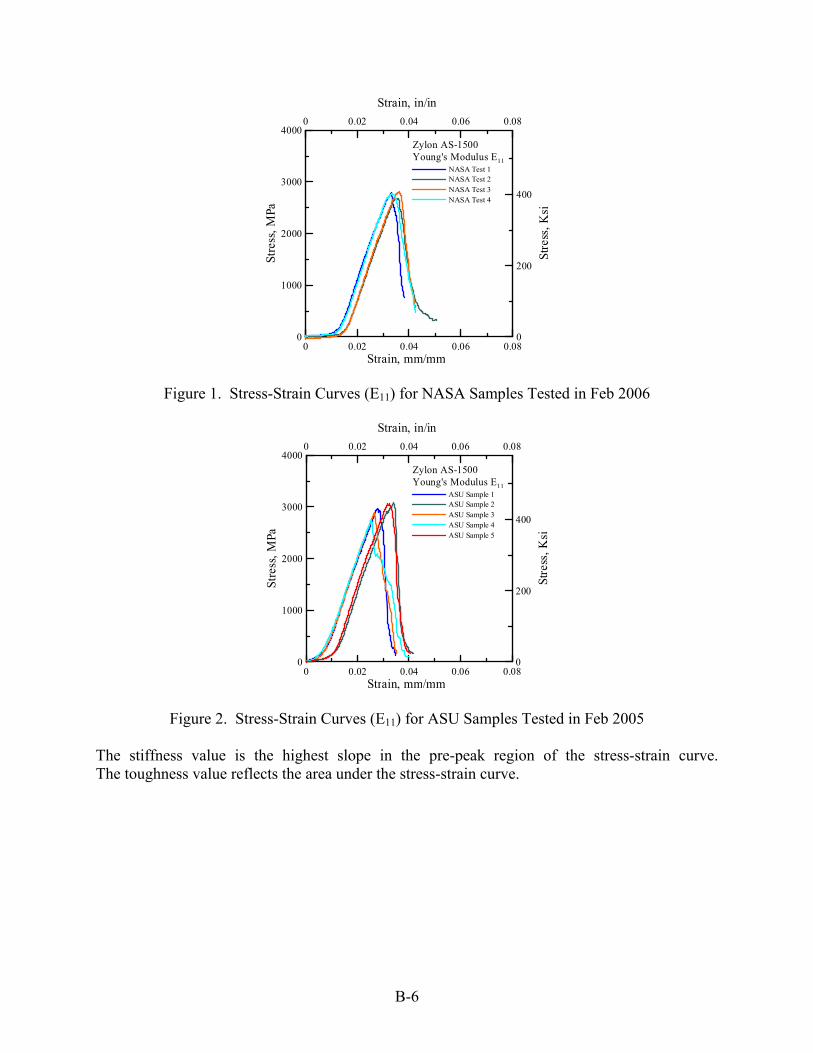
Test Results All samples referred to in this report were manufactured by Toyobo. Warp and fill yarns were all taken from fabric weaved at Lincoln Fabrics Ltd. The samples referred to as NASA samples were woven in March 2002 and used by NASA in the Phase I ballistic testing. In addition, the Boeing tested samples [1] mentioned in this report were all taken from the same lot of weaved fabric used in the NASA Phase 1 ballistic testing. The samples referred to as ASU samples were woven in June 2004 and used by NASA in the Phase II ballistic testing. All tests conducted at ASU reflect the warp direction properties of the fabric – warp direction is also referred to as the 1 direction. Figure 1 shows the stress-strain curves for four (NASA) replicates tested in Feb 2006. Figure 2 shows the stress-strain curves for five (ASU) replicates tested in Feb 2005. Tables 2, 3 and 4 contain the summary of the test results for the ASU Samples (Test Date Feb 2005), NASA Samples (Test Date Feb 2006), and the ASU Samples (Test Date Feb 2006) respectively.
B-5
0 0.02 0.04 0.06 0.08Strain, mm/mm
0
1000
2000
3000
4000
Stre
ss, M
Pa
0 0.02 0.04 0.06 0.08
Strain, in/in
0
200
400
Stre
ss, K
si
Zylon AS-1500Young's Modulus E11
NASA Test 1NASA Test 2NASA Test 3NASA Test 4
Figure 1. Stress-Strain Curves (E11) for NASA Samples Tested in Feb 2006
0 0.02 0.04 0.06 0.08Strain, mm/mm
0
1000
2000
3000
4000
Stre
ss, M
Pa
0 0.02 0.04 0.06 0.08
Strain, in/in
0
200
400
Stre
ss, K
si
Zylon AS-1500Young's Modulus E11
ASU Sample 1ASU Sample 2ASU Sample 3ASU Sample 4ASU Sample 5
Figure 2. Stress-Strain Curves (E11) for ASU Samples Tested in Feb 2005 The stiffness value is the highest slope in the pre-peak region of the stress-strain curve. The toughness value reflects the area under the stress-strain curve.
B-6
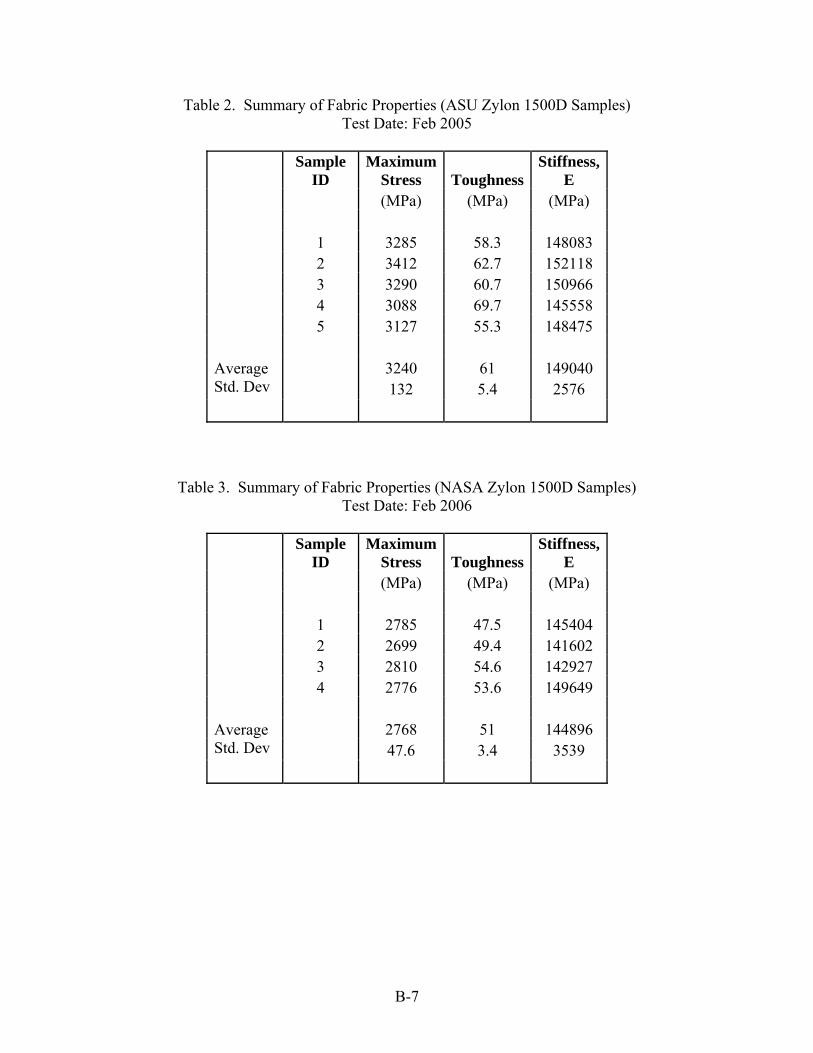
Table 2. Summary of Fabric Properties (ASU Zylon 1500D Samples) Test Date: Feb 2005
Sample
ID Maximum
Stress ToughnessStiffness,
E (MPa) (MPa) (MPa) 1 3285 58.3 148083 2 3412 62.7 152118 3 3290 60.7 150966 4 3088 69.7 145558 5 3127 55.3 148475 Average 3240 61 149040
132 5.4 2576 Std. Dev
Table 3. Summary of Fabric Properties (NASA Zylon 1500D Samples) Test Date: Feb 2006
Sample
ID Maximum
Stress ToughnessStiffness,
E (MPa) (MPa) (MPa) 1 2785 47.5 145404 2 2699 49.4 141602 3 2810 54.6 142927 4 2776 53.6 149649 Average 2768 51 144896
47.6 3.4 3539 Std. Dev
B-7

Table 4. Summary of Fabric Properties (ASU Zylon 1500D Samples) Test Date: Feb 2006
Sample
ID Maximum
Stress ToughnessStiffness,
E (MPa) (MPa) (MPa) 1 2978 44.2 144898 2 3083 48.2 144482 3 2888 44.2 148025 4 2748 48.3 144507 5 3064 52.4 149795 Average 2952 47.5 146341
137.9 3.4 2432.5 Std. Dev
Comparison of Tests Results The test results show a noticeable decrease in the strength of the fabric with age. In a 12 month period, the maximum stress value shows a 9% decrease, the toughness a 22% decrease, and stiffness a small 2% decrease. Table 5 shows the properties obtained from various tests and sources for the Zylon 1500D fabric and the published fiber strength from Toyobo [1, 2]. It should noted that the Boeing values are from tests of a single warp or fill yarn whereas the ASU values reflect test results from a swatch of fabric. Additional tests were run by Boeing on 500 denier Zylon samples from the same manufacturing lot. Table 6 summarizes the results which show the decrease in strength associated with the weaving process.
Table 5. Comparison of Fabric Properties Obtained From Various Sources
Data Source
Sample Description
Weave date
Test Date Time (mo)
Max stress (MPa)
Toughness (MPa)
Stiffness (MPa)
ASU 1500D ASU (phase II) Warp
June 04 Feb 05 8 3240 61 149040
ASU 1500D ASU (phase II) Warp
June 04 Feb 06 20 2952 47.5 146341
Boeing 1500D NASA (phase I) Warp
Mar 02 Nov 02 8 3448 140556
B-8

Table 5. Comparison of Fabric Properties Obtained From Various Sources (Continued)
Data Source
Sample Description
Weave date
Test Date Time (mo)
Max stress (MPa)
Toughness (MPa)
Stiffness (MPa)
Boeing 1500D NASA (phase I) Fill
Mar 02 Nov 02 8 3291 146035
ASU 1500D NASA (phase I) Warp
Mar 02 Feb 06 47 2768 51 144896
Toyobo Web site fiber properties
5800 180000
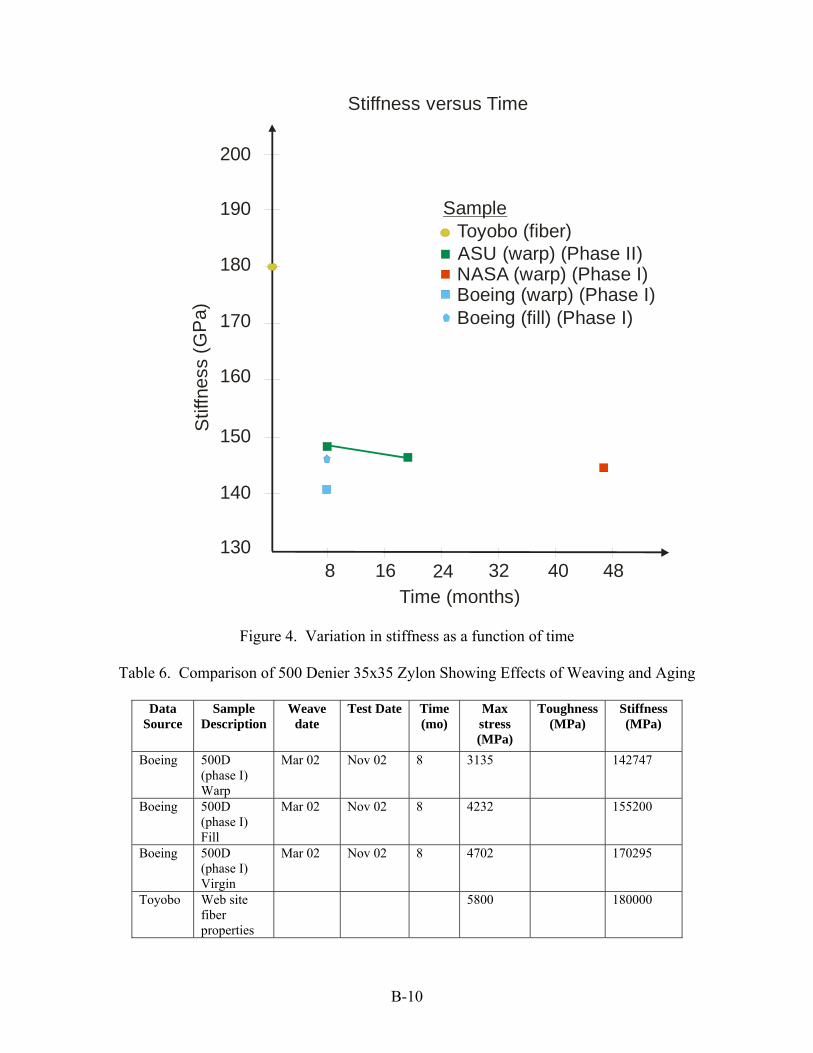
Information in Table 5 is presented in a graphical form in figures 3 and 4. The effects of weaving and aging are shown in Table 6.
Time (months)
Max
. Stre
ss (M
Pa)
8 16 24 32 40 482500
3000
3500
4000
4500
5000
5500
6000
Max. Stress versus Time
Toyobo (fiber)ASU (warp) (Phase II)NASA (warp) (Phase I)
Sample
Boeing (warp) (Phase I)Boeing (fill) (Phase I)
Figure 3. Variation in max. stress as a function of time
B-9
Time (months)
Stif
fnes
s (G
Pa)
8 16 24 32 40 48130
140
150
160
170
180
190
200
Stiffness versus Time
Toyobo (fiber)ASU (warp) (Phase II)NASA (warp) (Phase I)
Sample
Boeing (warp) (Phase I)Boeing (fill) (Phase I)
Figure 4. Variation in stiffness as a function of time
Table 6. Comparison of 500 Denier 35x35 Zylon Showing Effects of Weaving and Aging
Data Source
Sample Description
Weave date
Test Date Time (mo)
Max stress (MPa)
Toughness (MPa)
Stiffness (MPa)
Boeing 500D (phase I) Warp
Mar 02 Nov 02 8 3135 142747
Boeing 500D (phase I) Fill
Mar 02 Nov 02 8 4232 155200
Boeing 500D (phase I) Virgin
Mar 02 Nov 02 8 4702 170295
Toyobo Web site fiber properties
5800 180000
B-10
Hypothesis Testing (t-Test) Hypothesis testing (t-Test) is conducted on the ASU Test results to ascertain if the mean of the maximum stress value in the sample sets can be assumed to be the same or if they are different. The two hypotheses considered are as follows. Null Hypothesis, H0: Mean of Samples 1 = Mean of Samples 2 Alternate Hypothesis, H1: Mean of Samples1 ≠ Mean of Samples 2 A 95% confidence level corresponding to a significance level as 0.05 is used in the following analysis. Two tests are carried out - the difference in mean between ASU Samples tested in Feb 05 and NASA Samples tested in Feb 06, and the difference in mean between ASU Samples tested in Feb 05 and ASU Samples tested in Feb 06. Test 1 (ASU Samples tested in Feb 05 and NASA Samples tested in Feb 06) Since, the standard deviation of maximum stress from NASA samples (47.6) is significantly less than the ASU samples’ standard deviation (132), t-Test model for different standard deviations is adopted. Sample size of ASU Samples tested in Feb 05, 1 5n = Sample size of NASA Samples tested in Feb 06, 2 4n = Standard deviation of ASU Sample set tested in Feb 05, 1 132.2s = Standard deviation of NASA Sample set tested in Feb 06, 2 47.6s = ASU Sample (max. stress), 1 3240.3m M= Pa
PaNASA Sample (max. stress), 2 2767.5m M=
( )1 20 2 2
1 2
1 2
m mt
s sn n
−=
⎛ ⎞+⎜ ⎟
⎝ ⎠
(B-1)
( ) ( )
2 21 2
1 22 22 2
1 1 2 2
1 21 1
s sn n
s n s nn n
ν
⎛ ⎞+⎜ ⎟
⎝ ⎠=⎛ ⎞⎜ ⎟+⎜ ⎟− −⎝ ⎠
(B-2)
tα/2,v can found from the t-table where α is the significance level (taken as 0.05). Rejection criteria for NULL hypothesis is |t0| > tα/2,v.
B-11

B-12
ected and alternate hypothesis H1 holds good. Thus e two samples have different mean values.
ss for these two sample sets are identical, t-Test odel for same standard deviation is adopted.
From above data, t0 = 7.417 and tα/2,v = 2.447. Since |t0| > tα/2,v, the Null hypothesis H0 is rejth Test 2 (ASU Samples tested in Feb 05 and ASU Samples tested in Feb 06) Since, the standard deviation of maximum strem
1 5n = . Sample size of ASU Samples tested in Feb 05,
2 5n = . Sample size of ASU Samples tested in Feb 06,
1 132.2s = . Standard deviation of ASU Samples tested in Feb 05,
2 137.9s = . Standard deviation of ASU Samples tested in Feb 06, ASU Sample tested in Feb 05 (max. stress), a1 3240.3m MP= . ASU Sample tested in Feb 06 (max. stress), Pa2 2952m M= .
( )1 20
1 2
1 1p
m mt
sn n
−=
⎛ ⎞+⎜ ⎟
⎝ ⎠
where ( ) ( )21 1 2 2
1 2
1 12p
n s n ss
n n⎛ − + −
= ⎜ ⎟+ −⎝ ⎠
2 ⎞ (B-3)
1 2 2n nν = + − (B-4)
α is the significance level (taken as 0.05). Rejection riteria for Null hypothesis is |t0| > tα/2,v
rom above data, t0 = 3.37 and tα/2,v = 2.306.
cted and alternate hypothesis H1 holds good. Thus e two samples have different mean values.
eferences
ercial Aircraft. Part 3: Zylon Yarn Tests”, FAA report DOT/FAA/AR-05/45, P3, July 005.
[2] http://www.toyobo.co.jp/e/seihin/kc/pbo/menu/fra_menu_en.htm
tα/2,v can found from the t-table wherec F Since |t0| > tα/2,v, NULL hypothesis H0 is rejeth R [1] Juris Verzemnieks, “Lightweight Ballistic Protection of Flight-Critical Components on Comm2