
DOT US Department of Transportation OPS Office of Pipeline...
131
Page 1 of 13 DOT US Department of Transportation PHMSA Pipelines and Hazardous Materials Safety Administration OPS Office of Pipeline Safety Western Region Principal Investigator Regional Accident Coordinator Peter J. Katchmar Peter J. Katchmar Region Director Chris Hoidal Date of Report October 30, 2012 Subject ExxonMobil Silvertip Pipeline Crude Oil Release into the Yellowstone River in Laurel, MT on 7/1/2011 Operator, Location, & Consequences Date of Failure 7/01/2011 Commodity Released Crude Oil City/County & State Laurel/Yellowstone/Montana OpID & Operator Name 4906 – ExxonMobil Pipeline Company (EMPCo) Unit # & Unit Name 1255 MO-SILVERTIP PIPELINE SMART Activity # 135086 Milepost / Location MP 21.10/Yellowstone River Crossing in Laurel, MT Type of Failure Outside Force Damage/Washout of Pipeline in Extended Flooding Conditions – Debris Caught on line caused excessive stress Fatalities 0 Injuries 0 Description of area impacted The Yellowstone River Property Damage $135,000,000 Estimated Combined Cost (source: EMPCo Filed 7000-1; 30 Day Written Report)
Transcript of DOT US Department of Transportation OPS Office of Pipeline...

Page 1 of 13
DOT US Department of Transportation PHMSA Pipelines and Hazardous Materials Safety Administration OPS Office of Pipeline Safety Western Region
Principal Investigator Regional Accident Coordinator
Peter J. Katchmar
Peter J. Katchmar
Region Director Chris Hoidal
Date of Report October 30, 2012
Subject ExxonMobil Silvertip Pipeline Crude Oil Release into the Yellowstone River in Laurel, MT on 7/1/2011
Operator, Location, & Consequences
Date of Failure 7/01/2011
Commodity Released Crude Oil
City/County & State Laurel/Yellowstone/Montana
OpID & Operator Name 4906 – ExxonMobil Pipeline Company (EMPCo)
Unit # & Unit Name 1255 MO-SILVERTIP PIPELINE
SMART Activity # 135086
Milepost / Location MP 21.10/Yellowstone River Crossing in Laurel, MT
Type of Failure Outside Force Damage/Washout of Pipeline in Extended Flooding Conditions – Debris Caught on line caused excessive stress
Fatalities 0
Injuries 0
Description of area impacted
The Yellowstone River
Property Damage $135,000,000 Estimated Combined Cost (source: EMPCo Filed 7000-1; 30 Day Written Report)

Page 2 of 13
Executive Summary On July 1, 2011, at approximately 10:40 p.m. mountain daylight time (MDT), a failure occurred on ExxonMobil Pipeline Company’s (EMPCo) Silvertip Pipeline in Yellowstone County, Montana, resulting in the release of approximately 1500 barrels of crude oil into the Yellowstone River. The river flows eastward from the release site through the City of Billings and eventually discharges into the Missouri River. The failure occurred in the vicinity of the city of Laurel, Montana just downstream of the Highway 212 Bridge. The failure was reported to the National Response Center on July 2, 2011, at approximately 12:19 a.m. MDT. The leak was detected by ExxonMobil controllers in Houston, Texas. Controllers shut down the pumps and valves at the beginning of the line (Silvertip Pump Station) within 10 minutes. The remote controlled valve, #4462, just upstream of the Yellowstone River, however, was not closed for an additional 46 minutes. The cause of the release was determined to be a severed pipeline near the south shore of the Yellowstone River that occurred after a prolonged period of high runoff and flooding. Debris caught on the pipe over time increased the stresses until ultimately the critical stress of the pipe was exceeded. System Details The Silvertip Pipeline is a 12-inch nominal diameter pipeline, approximately 69 miles in length that transports crude oil from the Silvertip pump station near Elk Basin, Wyoming production fields north to the ExxonMobil refinery in Billings, Montana. The line is also able to take Canadian Crude at an intermediate pump station in Edgar, MT. The line generally slopes downward at a 5% to 7% grade so the line will gravity drain into the ExxonMobil Refinery at the end of the line in Billings, MT. There are four river crossings all installed utilizing a standard open cut crossing technique. Each of the river crossings has a remote controlled valve/motor operated valve (RCV/MOV) on the upstream side of the crossing and a hand operated valve on the downstream side. Note: RCVs and MOVs are a subset of Emergency Flow Restriction Devices (EFRD). Each valve is equipped with a bypass line and a relief valve which is designed to relieve surges that may be caused by the rapid closing of a valve and prevent over pressurization of the pipeline beyond design limits. Normal operation of the Silvertip Pipeline is to originate crude oil from tankage at the beginning of the line near Elk Basin or to originate crude from tankage at the Edgar Pump Station. When originating from Elk Basin, pumps at the Edgar Station are utilized to boost the flow rate. When originating from Edgar Station, the flow from Elk Basin is shut off and the pumps at Edgar Station are utilized to pull crude oil out of tankage for delivery to downstream refineries. Relevant Background Downstream of the Highway 212 Bridge over the Yellowstone River in Laurel, MT, there are four pipeline crossings--two hazardous liquid pipelines and two natural gas pipelines--all of which were originally installed by the standard open cut crossing method to a minimum depth of four to six feet. From upstream to downstream (west to east) the lines are an 8” crude oil line, an 8” natural gas line, a 16” natural gas line and the EMPCo 12” crude oil line. The lines are a minimum of 50’ to 100’ apart laterally and were originally installed a minimum of four to five feet below the bottom of the Yellowstone River. All of the lines had negative buoyancy derived from either concrete coating or river weights. Also, per Montana State permits, each line was

Page 3 of 13
covered with a layer of rock to protect the lines from river scour. The Highway 212 Bridge over the Yellowstone River was upgraded in the early 1990s. At that time, ExxonMobil was required by the state to movee their line from being supported on the old bridge to being installed under the Yellowstone River, downstream of the other three pipeline crossings.
On June 7, 2009, the 8” natural gas line failed in the river. This failure was caused by the pipe being undermined by flooding conditions in the river. The exposed pipe was impacted by stresses induced by the water that ultimately caused the pipeline to separate at a girth weld. Natural gas escaped from the failed pipe for a few hours before valves were able to be closed and the line blown down. The operator of the failed natural gas line chose to replace that 8” line with a 16” horizontal directional drilled (HDD) crossing. The HDD technology is relatively new (used heavily since 1984) and it allows a pipeline to be drilled to depths of 20’ to 70’ below the bottom of a river. Following the EMPCo release, the natural gas pipeline operator installed a second HDD in 2012 to replace their other 16” open cut crossing pipeline that had been originally installed in the 1980’s.
In early 2010, the operator of the 8” hazardous liquid line decided to purge their crude oil pipeline with nitrogen which displaced any oil that was in the line. The line was left with 40 psig of pressure inside the line. The operator stated that this was an economic decision made because the flow in this 8” line was unnecessary and so the line was a liability in case of a failure. Following the EMPCo release and after the river level dropped, it was learned that this line also had failed due to the 2011 flooding. No one knew of this failure because the line remained submerged under the flood water. This line failure was discovered after the water receded in September.
Events Leading up to the Failure On August 6, 2010, a meeting took place in Riverside Park which is located on the south side of the Yellowstone River just east of the Highway 212 Bridge in Laurel, MT. In attendance were representatives from the City of Laurel, the US Corps of Engineers (USACE), ExxonMobil Pipeline (EMPCo), Cenex Pipeline Company (CHS), ConocoPhillips Pipeline and Williston Basin Interstate Pipeline. The meeting was called by the City of Laurel. The purpose of the meeting was to look at the river bank in Riverside Park to make sure everyone who had an interest was advised about the erosion of the south bank of the Yellowstone River. Also, the City was hoping one of the entities would assist in the fortification of the south bank of the Yellowstone River to protect the park. No fortification of the bank occurred.
In October 2010, personnel from the City of Laurel contacted PHMSA’s Western Region (WR) to express concerns for the pipeline crossings downstream of the Highway 212 Bridge due to the flooding that took place during that year’s seasonal flooding of the river. PHMSA’s WR staff contacted the three operators of the pipelines that cross the river in Laurel, MT. As the first liquid line was laid up in nitrogen and the other two lines transport natural gas, the WR staff focused on the ExxonMobil pipeline since its failure would cause severe environmental impact.
PHMSA’s queries regarding potential pipeline exposures resulted in ExxonMobil conducting a depth-of-cover survey on the ExxonMobil Pipeline crossing. This survey was completed on December 1, 2011. The final report was submitted to PHMSA’s WR office on January 19, 2011. The survey showed that the pipeline met the required minimum depth of cover for new pipelines, and that the bottom of the river had not changed significantly since the last crossing survey performed in 2002.

Page 4 of 13
The survey was conducted with a remote electronic line locator which has a published depth accuracy of 5% for depths up to 10 feet and 10% for depths up to 16 feet deep. This equates to plus or minus 6 inches at 10 foot depths and 19 inches at 16 foot depths. The survey indicated that the pipe depth on December 1, 2010 was a minimum of 5.3 feet of cover. If one deducts the tool accuracy of 5% from this figure that equates to a minimum pipe depth of approximately 5 feet. The federal minimum depth of cover for the installation of a new pipeline in a river is four feet. PHMSA’s WR staff counseled ExxonMobil to maintain vigilance with respect to the annual flooding of the Yellowstone River especially in the vicinity of their pipeline crossing in Laurel, MT.
PHMSA personnel in Montana again became aware of the annual flooding of the Yellowstone River in the spring of 2011. PHMSA monitored the erosion of the south bank of the Yellowstone River just downstream of the Highway 212 Bridge. It was evident that the erosion on the south bank was extensive and was continuing. The continued erosion of the south bank of the river would allow the river to breach the park and, if this happened, the pipelines that run under the park would be in peril of being undermined by the flowing water. The following is a more detailed accounting of specific times and events that occurred prior to the pipeline failure.
On May 25, 2011, City of Laurel e-mailed PHMSA’s WR staff based near Billings, MT, and ExxonMobil with concerns about the continued erosion of the south bank of the Yellowstone River. PHMSA contacted ExxonMobil representatives who responded to Riverside Park. EMPCo shut down their pipeline for approximately five hours while they assessed site conditions and reevaluated their data. ExxonMobil restarted the pipeline and decided to conduct daily monitoring of the river. This was a daily drive-by to check the general river area and not specifically to check the actual pipeline crossing. The PHMSA inspector conducted several visits to check the erosion of the south bank of the Yellowstone River at Riverside Park for approximately two weeks. Due to the high water levels and stream velocities, no monitoring of the river bottom could be conducted visually.
On May 31, 2011, PHMSA’s WR staff began monitoring all Montana pipelines because of the extended flood conditions in the state. WR staff contacted all major pipeline operators in an attempt to understand if any of their operational pipelines were being negatively impacted by the flooding. PHMSA personnel were informed that some of the pipeline operators had discovered a few washouts but it was reported that they were taking appropriate actions to mitigate any integrity concerns.
On June 1, 2011, the City of Laurel e-mailed ExxonMobil photos of Yellowstone River. City of Laurel personnel recommended that ExxonMobil staff again come to Laurel to assess the situation. PHMSA’s WR also requested that ExxonMobil staff assess the condition of the crossing. ExxonMobil personnel, via e-mail, stated that the depth of cover of their pipeline at the south bank of the Yellowstone River averaged twelve feet.
On June 6, 2011, PHMSA’s WR conducted an inspection of ExxonMobil’s implementation of its integrity management program on the Silvertip Pipeline. As part of this review, the most recent in-line-inspections which occurred in 2009 were reviewed. In-line-inspection results provide information on pipe wall conditions, including corrosion and deformation features. No actionable anomalies, as defined by the DOT Pipeline Safety Code, were found on the Yellowstone River crossing.
Page 5 of 13
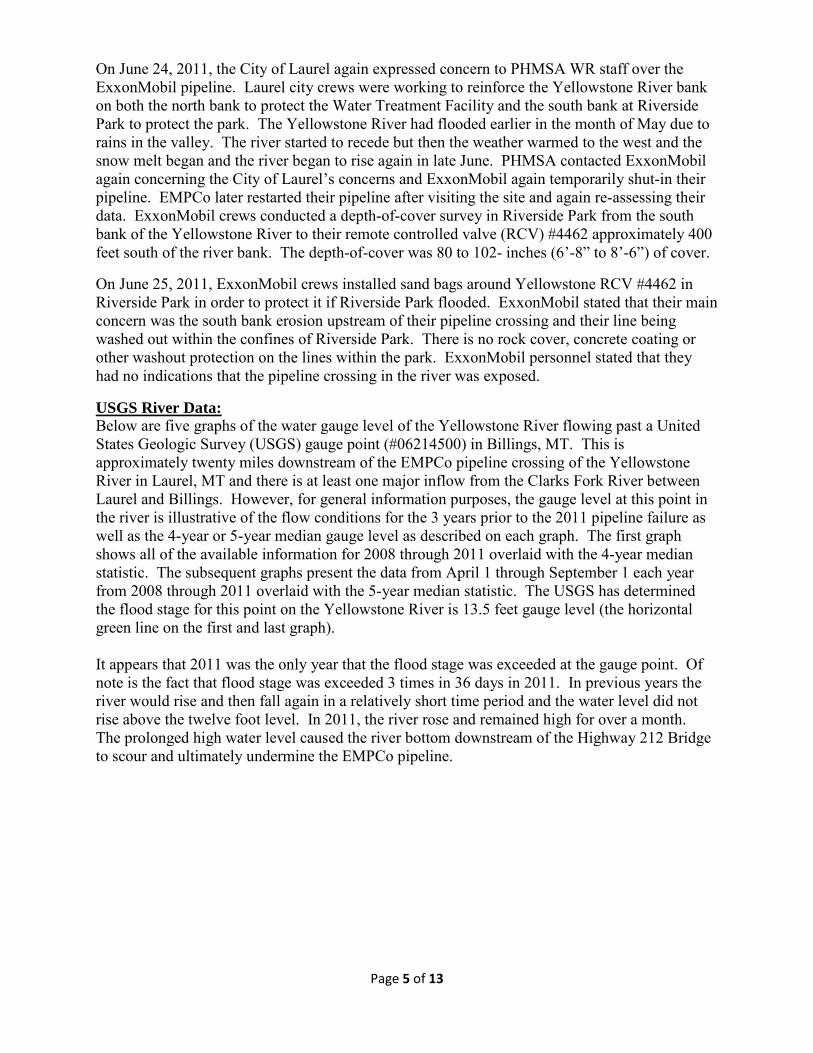
On June 24, 2011, the City of Laurel again expressed concern to PHMSA WR staff over the ExxonMobil pipeline. Laurel city crews were working to reinforce the Yellowstone River bank on both the north bank to protect the Water Treatment Facility and the south bank at Riverside Park to protect the park. The Yellowstone River had flooded earlier in the month of May due to rains in the valley. The river started to recede but then the weather warmed to the west and the snow melt began and the river began to rise again in late June. PHMSA contacted ExxonMobil again concerning the City of Laurel’s concerns and ExxonMobil again temporarily shut-in their pipeline. EMPCo later restarted their pipeline after visiting the site and again re-assessing their data. ExxonMobil crews conducted a depth-of-cover survey in Riverside Park from the south bank of the Yellowstone River to their remote controlled valve (RCV) #4462 approximately 400 feet south of the river bank. The depth-of-cover was 80 to 102- inches (6’-8” to 8’-6”) of cover.
On June 25, 2011, ExxonMobil crews installed sand bags around Yellowstone RCV #4462 in Riverside Park in order to protect it if Riverside Park flooded. ExxonMobil stated that their main concern was the south bank erosion upstream of their pipeline crossing and their line being washed out within the confines of Riverside Park. There is no rock cover, concrete coating or other washout protection on the lines within the park. ExxonMobil personnel stated that they had no indications that the pipeline crossing in the river was exposed.
USGS River Data: Below are five graphs of the water gauge level of the Yellowstone River flowing past a United States Geologic Survey (USGS) gauge point (#06214500) in Billings, MT. This is approximately twenty miles downstream of the EMPCo pipeline crossing of the Yellowstone River in Laurel, MT and there is at least one major inflow from the Clarks Fork River between Laurel and Billings. However, for general information purposes, the gauge level at this point in the river is illustrative of the flow conditions for the 3 years prior to the 2011 pipeline failure as well as the 4-year or 5-year median gauge level as described on each graph. The first graph shows all of the available information for 2008 through 2011 overlaid with the 4-year median statistic. The subsequent graphs present the data from April 1 through September 1 each year from 2008 through 2011 overlaid with the 5-year median statistic. The USGS has determined the flood stage for this point on the Yellowstone River is 13.5 feet gauge level (the horizontal green line on the first and last graph). It appears that 2011 was the only year that the flood stage was exceeded at the gauge point. Of note is the fact that flood stage was exceeded 3 times in 36 days in 2011. In previous years the river would rise and then fall again in a relatively short time period and the water level did not rise above the twelve foot level. In 2011, the river rose and remained high for over a month. The prolonged high water level caused the river bottom downstream of the Highway 212 Bridge to scour and ultimately undermine the EMPCo pipeline.

Page 6 of 13
Graph of gage height for 2008 through 2011 overlaid with the 4 year median statistic.
Graph of gauge height April 1, 2008 through September 1, 2008.

Page 7 of 13
Graph of gauge height April 1, 2009 through September 1, 2009.
Graph of gauge height April 1, 2010 through September 1, 2010.

Page 8 of 13
Graph of gauge height April 1, 2011 through September 1, 2011.
A review and analysis of the graphs shows that in years 2008 through 2010 the river rose above the median usually during the spring runoff or summer snow melt. However, the river receded in a relatively short amount of time. There were times when the river would rise multiple times during the high water season but it would always recede within a week or two. Also, the water never reached actual flood stage in the three years preceding 2011. In 2011, however, the river reached flood stage on May 25th, again on June 25th, and for a third time on July 1st. The May 25th high river level primarily occurred because of rain storms in the greater Yellowstone River Valley. Just when the river started to drop, the weather warmed in the west or upstream on the Yellowstone River which caused the snow in the mountains to start to melt. This caused the river to rise to flood stage again in late June. The river again started to recede a little but rose again to above flood stage on July 1, 2011, the day of the pipeline failure.
Emergency Response Note: EMPCo’s Operations Control Center (OCC) is in Houston, Texas which is in the Central Time Zone. The Silvertip Pipeline is in Wyoming and Montana and is in the Mountain Time Zone. All data received from the OCC is based on Central Time. Local time for Montana is Mountain Time which is one hour earlier. All reported times have been changed to Mountain Daylight Time (MDT) to aid in the analysis of this accident. The SCADA OCC/Console #2 Set Up The EMPCo OCC houses the Supervisory Control and Data Acquisition (SCADA) system for all of EMPCo’s pipelines. The pipelines are segregated by a management policy to have similar pipeline types operated from a single console. Each console has approximately seven computer monitors on which a Controller can place different operational screens depending on the specific pipelines and configurations of those pipelines being operated at any given moment. The screens are interchangeable with respect to the different monitors and each Controller can set the screens as he/she see fit; normally showing initiating and delivery points for the pipelines being operated. Most Controllers keep the alarm screen up on the middle monitor. All alarms come

Page 9 of 13
into this screen and a Controller can see which pipeline is alarming, where the alarm is occurring, and a descriptor concerning the alarm. Controllers are able to review historical alarms from this screen as well. The console that monitors and controls the Silvertip Pipeline System is known as console #2 or “Montana Crude Pipeline System and Offshore Crude Oil” console. Twelve different pipeline systems are operated from this console. When asked about the apparent large number of systems operated from this one console, EMPCo stated that not all of the pipeline systems are running at the same time and each system has different complexities. Further analysis revealed that there are three pipelines that are started 2-3 times per week and that are only run for up to two hours to drain a tank. Other lines are direct lines from one start point to one delivery point with no intermediate pump stations. Besides the Billings System, there is one additional complex line that is operated from console #2. It is in Louisiana and is described as the most complex pipeline system on console #2. It has numerous initiation points and numerous delivery points. All lines are batched meaning that a scheduler purchases and sells crude oil at different points around the country where EMPCo has pipelines. The scheduler provides the Controller with a list of deliveries to be made and the Controller carries out the scheduler’s agenda. On the night of July 1, 2011, the Controller who was operating console #2 reported in a post-accident interview that it was a usual night, not too busy and not overly slow either. This Controller was relatively new and had recently completed his training on console #2. As of early June 2011, the Controller was allowed complete operation of all pipelines on console #2 by himself. Note: The design and policies of the EMPCo OCC are such that many Controllers are cross-trained on multiple consoles. While it is not imperative, there are usually more senior Controllers on-duty with newer Controllers. Also, there is always an OCC Supervisor on duty with the Controllers. This allows for support for newer Controllers when abnormal situations arise.
Failure Occurs On the evening of July 1, 2011, console #2 was being controlled by Controller “A”. Controller A noticed from the alarm screen that the booster pump at the Edgar Pump Station had automatically shut down because of a “low suction pressure” alarm. The alarm log from the Supervisory Control and Data Acquisition (SCADA) operating system shows that the Edgar pump shut down occurred at 10:41:14 pm MDT. Controller A immediately called up different screens that trend pipeline flow rates and pressures. The trends showed a drastic drop in the suction pressure at Edgar just before the pump went off. There was also small increase in flow rate at the beginning of the line just after the Edgar pump went down. The flow rate at the Billings refinery also dropped from 2300 barrels per hour (BPH) to 300 BPH. Based on this information, Controller A believed that he might have a leak and so he shut down the pumps and closed the originating valve (RCV 1066) at the Silvertip Pump Station to stop the flow of crude oil into the pipeline. The SCADA Alarm Log indicated that the pump was shut down at 10:47:39 and that the RCV 1066 closure occurred at 10:50:39 pm MDT. Controller A then closed valve number 1067 (Laurel Valve located approximately one-half mile downstream of the Yellowstone River Crossing) at 10:57:15 pm MDT.

Page 10 of 13
He then asked a fellow Controller “B” at a nearby console to come and check what he was seeing. Controller B asked if Controller A had notified the OCC Supervisor yet. Controller A had not but at 11:00 pm he called the Supervisor over and made him aware of the situation. A review of the operating instructions for the Silvertip Pipeline showed that the Controller followed the procedures as written. The OCC Area Supervisor expressed to PHMSA interviewers that he was proud of and impressed by the way the new Controller A handled the situation. From the time Controller A noticed the situation until he had the pump shut down and closed the originating mainline valve (RCV 1066) per the EMPCo operating instructions was 9 minutes and 15 seconds. Further review of the alarm logs showed that the first alarm that came in was a drop in line pressure at RCV 4462 (which is located immediately upstream and south of the Yellowstone River crossing) that occurred at 10:40:43 pm MDT. Controller A did not remember seeing this alarm before turning over the event to the OCC supervisor. This adds 31 seconds to the event. Therefore, Controller A actually shut down the line in 9 minutes and 56 seconds after the release occurred. At the flow rate at the time of failure (2300 BPH), this would equate to approximately 381 barrels of crude discharged into the Yellowstone River prior to pump shutdown. Immediately after the OCC Supervisor became aware of the event, he reviewed the trends and alarm logs and at 11:07:32 MDT he directed Controller A to open Valve 1067 to allow oil to drain into the Billings refinery. At approximately 11:10 to 11:15 pm MDT the OCC Supervisor called the first line supervisor (FLS) in the field to notify him of the situation. The FLS called a Senior Operations Technician and conferenced him onto the call with the OCC Supervisor. The OCC supervisor related all of the previous information again and the technician was asked what would cause the Edgar pumps to go down on low suction. The Technician told the supervisors that there were many potential causes for a pump going down on low suction including a leak upstream of the pump, a faulty transmitter, a closed valve, a leak downstream of the pump, etc. At 11:28:12 MDT Valve 1067 was again closed by request of the FLS. After further review of SCADA data, the OCC Supervisor noticed and reported that the first alarm received was a pressure drop at RCV 4462 just upstream of the Yellowstone River. At that time both the FLS and the technician asked the OCC Supervisor to close the RCVs upstream of all of the river crossings. RCV 4462 was closed at 11:36:51 pm MDT which stopped gravity flow of crude oil into the Yellowstone River. This occurred 46 minutes and 12 seconds after RCV 1066 was closed at the Silvertip Station or approximately 56 minutes after the first alarm. At an estimated drain up volume of 23 barrels per minute through a 12-inch pipeline, this would equate to an additional 1063 barrels of crude oil that could potentially drain into the river for a total of approximately 1444 barrels released. (381 pumping + 1063 drain up). Note: The final spill volume calculated by EMPCo after restarting the line and measuring the volume of crude that was released from the line was 1509 barrels. At approximately 11:45 pm MDT, the OCC received a telephone call from the Laurel Fire Department stating that there was a crude oil smell in the vicinity of Riverside Park. The OCC Supervisor was still on the call with the FLS and the Senior Operations Technician when the call came in. The FLS dropped off the call and immediately notified the ExxonMobil Refinery Strike

Page 11 of 13
Team and told them to bring equipment and personnel to Laurel. Other notifications inside EMPCo were made and the EMPCo emergency response plan was implemented. Summary of initial start-up plan and return-to-service, including preliminary safety measures PHMSA issued a Corrective Action Order (CAO) to ExxonMobil on July 5, 2011, directing the company to take a number of measures, both immediate and long term, to ensure the failed pipeline was safe to re-start, and to ensure continued safe operation. The other major water crossings were evaluated for existing or potential damage, the operation and emergency response procedures were reviewed and revised, a process to monitor the pipeline during flooding conditions was established, and the facility response plan was revised to reflect lessons learned from the July spill. In addition, the Yellowstone River crossing near Laurel was ordered to be replaced with a horizontally directionally drilled (HDD) pipeline replacement deep under the river. The Clarks Fork and Rock Creek water crossings were also determined to be too shallow to withstand future flooding events, and were required to be replaced by HDD before the 2012 spring runoff. Following PHMSA inspection of all modifications, field work and required amendments to the Silvertip Operating Instructions, including the immediate closure of all RCVs after any abnormal event; the pipeline was allowed to go back to full service on September 23, 2011. All CAO items, including the replacement of the Clarks Fork and Rock Creek crossing by deep horizontal direction drilled pipe crossings, were completed by January 2012. The final CAO item was the submission of the Final Engineering and Metallurgical Report by the third party laboratory contracted by EMPCo to perform the analysis. This report was submitted on August 6, 2012. The terms of the CAO were considered complete and the case was closed by PHMSAWR Director on August 8, 2012. Investigation Findings & Contributing Factors PHMSA gathered procedures and records from the installation of the EMPCo pipeline crossing of the Yellowstone River at Laurel, MT in 1991/1992, overlays of each depth-of-cover survey, integrity management procedures and records including in-line-inspection survey data, operational data and operating instructions for field personnel as well as for the EMPCo operational control center (OCC), Supervisory Control and Data Acquisition (SCADA) data from the OCC including raw data for the time period surrounding the release for all of the pipelines being operated by the Controller on the console where the Silvertip Pipeline was being operated as well as design documentation, process and instrument diagrams, surge analysis reports, alignment sheets and elevation profile. In addition, PHMSA interviewed the following EMPCo personnel who were involved with operations and decision making during and after the crude oil release including:
• The OCC Controller who was operating the Silvertip Pipeline during the release, • The OCC Supervisor who was on duty during the release, • The OCC Area Manager, • The Field Superintendent, • The First Line Supervisor, • The Senior Field Operations Technician.

Page 12 of 13
Other EMPCo personnel were tasked to assist PHMSA in the gathering and dissemination of relevant operational data, procedures and pertinent records. EMPCo contracted with a third party laboratory familiar with pipeline failures to perform a full engineering stress analysis and metallurgical analysis on the failed pipe to determine probable failure mechanisms. The report concluded that the pipe failed due to excessive abnormal stresses being induced on the pipe by a combination of bending forces, vibration, and debris accumulation. The failure scenario was hypothesized to occur as follows. The pipeline was undermined in the river by the extensive flooding resulting in an unsupported span. Also, the concrete coating that provided negative buoyancy for the pipeline failed under oscillating vibrational forces caused by the water flowing over the pipe. Calculations provided in the consultant’s report, however, show that these stresses placed on the pipe were still below the critical stress required to cause the failure. The report suggests that additional forces or loads were necessary to cause pipe failure. These additional loads are hypothesized to have been imparted by the additional forces caused by the river current impinging on the increased cross-sectional area of debris that accumulated on the pipe during flooding. PHMSA agrees with the conclusions of the third party laboratory that the cause of the release was determined to be a severed pipeline near the south shore of the Yellowstone River, and occurred after a prolonged period of high runoff and flooding. PHMSA believes that EMPC0’s field observations and their December 2011 depth of cover survey took reasonable precautions to address the flooding of the Yellowstone River in the spring and early summer of 2011. Based on the lack of historical flooding impacts to this pipeline since 1991, EMPCo may not have known that the river bottom could change sufficiently to undermine their pipeline. Furthermore, because of the high water levels in the river, EMPCo could not perform any additional testing of the crossing until the water receded. The failure occurred during the third flood stage event on July 1, 2012. Personnel from the City of Laurel repeatedly contacted PHMSA and EMPCo personnel concerning the erosion of the north and especially the south bank of the Yellowstone River immediately downstream of the Highway 212 Bridge. The EMPCo pipeline crossing is the last crossing downstream of the bridge and is on the downstream side of a slight bend in the river. There was little erosion of the south bank at the EMPCo pipeline crossing. There was much concern about the failure of the south bank immediately downstream of the bridge but there was little concern of the river undermining the EMPCo pipeline crossing. PHMSA finds the following contributing factors added to the release volume:
1. Procedural and Training Issue - EMPCo’s lack of use of elevation profiles in Controller and supervisor training.
a. The Silvertip Pipeline System was designed with RCV’s on the upstream side of the four major river crossings each with a pressure relief bypass. This allows for rapid valve closure.
b. Had EMPCo’s emergency shutdown procedures included the requirement that these RCV’s were to be closed immediately after an abnormal event, the crude oil release volume would have been much less and the location of the release would have been identified more quickly by observing the static pressure upstream of the closed RCVs.

Page 13 of 13
2. Emergency Response Training Issue - The time taken by the OCC Supervisor, the FLS and the Senior Field Operations Technician during their telephone conversation and SCADA data/Alarm Analysis allowed crude oil to drain into the Yellowstone River for 46 minutes and 12 seconds after the line was shut down and isolated by valve 1066.
3. Emergency Response Training Issue - EMPCo personnel interviewed by PHMSA staff discussed what they believed was proper valve closure procedures for the RCVs after a release. All EMPCo personnel made similar statements. Combining and paraphrasing those statements, EMPCo’s position was they need to protect the public along the pipeline and except for a guillotine failure; draining product away from a release point is the correct action to take. PHMSA agrees with EMPCo’s general assessment for draining product away from a release, however in this case the following facts applied:
a. The only public along the Silvertip right-of-way is immediately upstream of the Yellowstone River RCV number 4462 and upslope from the right-of-way.
b. The release was a guillotine failure. c. There is no added risk to closing all RCVs on the pipeline in sequence from south
to north (upstream to downstream) because they were designed with bypass surge relief.
d. The elevation profile of the line is generally downslope. Once the RCVs are closed, pressure will build up on the upstream side of each valve and this pressure can be compared with full line static pressure. This will tell one which line section to check for a leak.
e. PHMSA required EMPCo to modify their operating instructions for the Silvertip Pipeline to include that Controllers are required to close all RCVs immediately after an abnormal event occurs.
4. Emergency Response Training and Procedural Issue – EMPCo did not have a specific written procedure to notify all appropriate personnel, including the OCC, of localized conditions that may impact their pipeline system.
a. The Controller was generally aware that there had been some flooding in Montana but there was no specific notification required nor was there any contingency training in anticipation of possible problems to be encountered from excessive flooding.
Appendices
1. Maps and Photographs
2. NRC Report
3. Operator Accident/Incident Report to PHMSA
4. Metallurgical Analysis

Maps, Pictures and pertinent data for PHMSA’s Report on the ExxonMobil Silvertip Pipeline Rupture and Release of Crude Oil into the Yellowstone River at Laurel, Montana on July 1, 2011
Page 1 of 11
Google Map Aerial View of the Yellowstone River at normal flow conditions.
Maps, Pictures and pertinent data for PHMSA’s Report on the ExxonMobil Silvertip Pipeline Rupture and Release of Crude Oil into the Yellowstone River at Laurel, Montana on July 1, 2011
Page 2 of 11
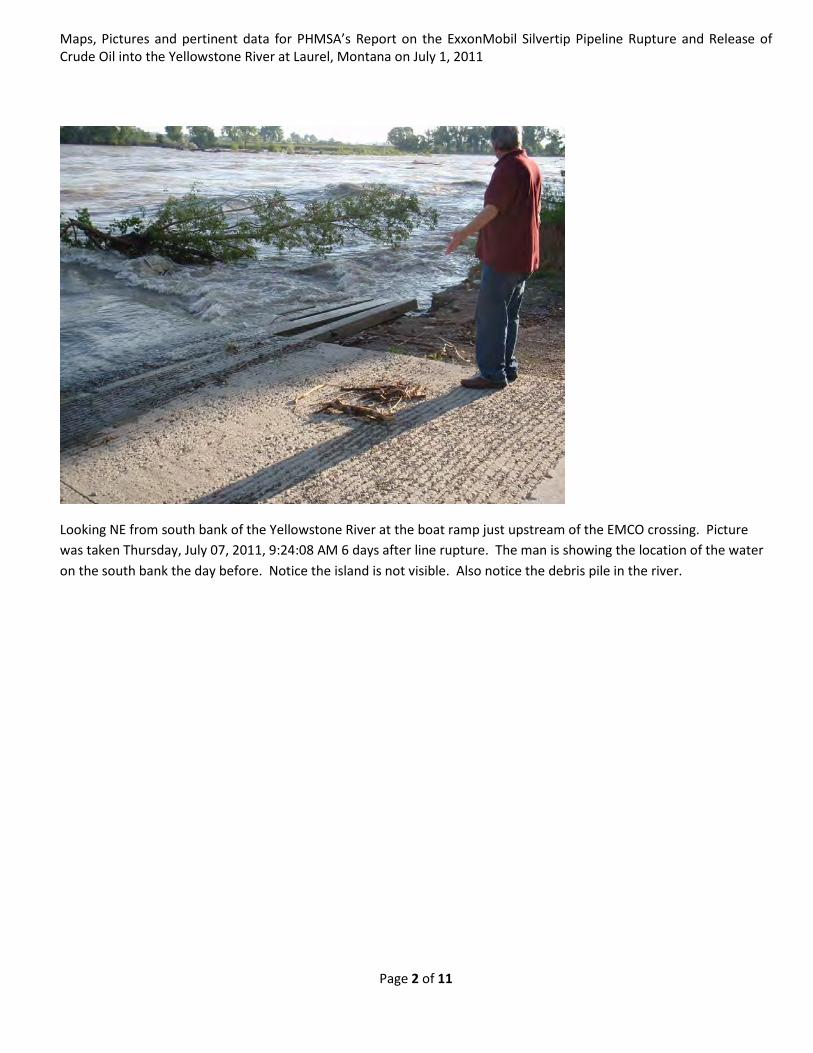
Looking NE from south bank of the Yellowstone River at the boat ramp just upstream of the EMCO crossing. Picture was taken Thursday, July 07, 2011, 9:24:08 AM 6 days after line rupture. The man is showing the location of the water on the south bank the day before. Notice the island is not visible. Also notice the debris pile in the river.

Maps, Pictures and pertinent data for PHMSA’s Report on the ExxonMobil Silvertip Pipeline Rupture and Release of Crude Oil into the Yellowstone River at Laurel, Montana on July 1, 2011
Page 3 of 11
Looking NE from south bank of the Yellowstone River at the boat ramp just upstream of the EMCO crossing. Picture was taken Thursday, September 29, 2011, 2:52:11 PM after the river level dropped. One can see the same debris pile in the river as was in the last picture. The concrete seen in the foreground of this picture is the boat ramp in the previous picture. The buoy furthest to the right is marking the north end of the rupture from the south bank. The next buoy is marking the south end of the rupture from the north side of the main channel off of the island.

Maps, Pictures and pertinent data for PHMSA’s Report on the ExxonMobil Silvertip Pipeline Rupture and Release of Crude Oil into the Yellowstone River at Laurel, Montana on July 1, 2011
Page 4 of 11
Picture taken from the south bank looking north on Thursday, September 29, 2011, 2:55:09 PM. One can see the pipe deflection downstream under the water. The buoy is marking the north end of the ruptured pipe from the south bank. The two lath tied together with pink ribbon are in line with the original pipeline right-of-way alignment from south to north. One can see a root ball that appears to be hung up on the pipeline. The red abrasive resistant fusion bonded epoxy (FBE) coating can be seen on the pipe. The pipe was originally concrete coated over the FBE coating.

Maps, Pictures and pertinent data for PHMSA’s Report on the ExxonMobil Silvertip Pipeline Rupture and Release of Crude Oil into the Yellowstone River at Laurel, Montana on July 1, 2011
Page 5 of 11
Picture taken on Thursday, September 29, 2011, 2:56:30 PM. Close up of the pipe from the south bank. Buoy is marking the north end of the rupture from the south bank pipe.

Maps, Pictures and pertinent data for PHMSA’s Report on the ExxonMobil Silvertip Pipeline Rupture and Release of Crude Oil into the Yellowstone River at Laurel, Montana on July 1, 2011
Page 6 of 11
Looking NE from the south bank. Picture taken on Thursday, September 29, 2011, 2:59:16 PM. EMCO pipeline is visible under the water.

Maps, Pictures and pertinent data for PHMSA’s Report on the ExxonMobil Silvertip Pipeline Rupture and Release of Crude Oil into the Yellowstone River at Laurel, Montana on July 1, 2011
Page 7 of 11
Looking north along original pipeline right-of-way alignment from the south bank taken Thursday, September 29, 2011, 2:55:19 PM. One can see the pipeline marked with lath and ribbon across the island and the first buoy to the south from the island that marks the pipe location being deflected downstream.

Maps, Pictures and pertinent data for PHMSA’s Report on the ExxonMobil Silvertip Pipeline Rupture and Release of Crude Oil into the Yellowstone River at Laurel, Montana on July 1, 2011
Page 8 of 11
This is a schematic of the mainline valves, surge relief devices and meters on the Silvertip Pipeline from Silvertip to the CHS refinery in Laurel, Montana. Miles between facilities are also shown.

Maps, Pictures and pertinent data for PHMSA’s Report on the ExxonMobil Silvertip Pipeline Rupture and Release of Crude Oil into the Yellowstone River at Laurel, Montana on July 1, 2011
Page 9 of 11
This is a schematic of the mainline valves, surge relief devices and meters on the Silvertip Pipeline from the CHS refinery in Laurel, Montana to the ExxonMobil Refinery in Billings, Montana. Miles between facilities are also shown.

Maps, Pictures and pertinent data for PHMSA’s Report on the ExxonMobil Silvertip Pipeline Rupture and Release of Crude Oil into the Yellowstone River at Laurel, Montana on July 1, 2011
Page 10 of 11
Elevation profile of the Silvertip Pipeline System.

Maps, Pictures and pertinent data for PHMSA’s Report on the ExxonMobil Silvertip Pipeline Rupture and Release of Crude Oil into the Yellowstone River at Laurel, Montana on July 1, 2011
Page 11 of 11
The following was submitted to PHMSA by EMCO personnel on July 5, 2011:
“Control Room Time Line for Yellowstone River Incident Times shown are in Central Standard Time Time Event 23:40:43 Line press at the Yellowstone River dropped 447 psi 23:40:43 Line press at Laurel dropped 424 psi 23:40:43 Line press at Laurel/Cenex dropped 387 psi 23:41:04 Edgar Booster Station low suction alarm 0 psi 23:41:14 Edgar Booster pump in s/d sequence 23:41:26 Billings Line Flow dropped from 2390 bph to 363 bph 23:42 to 23:47 Controller investigates pump shutdown at Edgar by doing the following:
· Trended suction pressure at Edgar and discovering suction pressure had dropped beginning at 23:39 · Trended line pressure at Edgar and determined it had decreased in unison with suction pressure at Edgar. · Trended flow rate at Silvertip to determine whether the flow had increased. Flow rate at Silvertip increased slightly · Trended flow rate at Billings and discovered flow rate had dropped.
23:47:39 EMPCo Controller shut down pumps at Silvertip 23:50:39 EMPCo Controller closed Silvertip block valve 23:57:15 EMPCo Controller closed Laurel block valve 1067 00:00 Controller Supervisor Notified of low pressure / low suction event 00:07:32 EMPCo Controller opened Laurel block valve 1067 - per Controller Supervisor 00:10 Controller Supervisor called field operation Supervisor to discuss events 00:28:12 EMPCo Controller closed Laurel block valve 1067 per field operations Supervisor 00:35:37 EMPCo Controller closed Clark Fork block valve per field operations Supervisor 00:36:51 EMPCo Controller closed Yellowstone River block valve per field operations Supervisor 00:37:26 EMPCo Controller closed Rock Creek block valve per field operations Supervisor 00:38:38 EMPCo Controller closed Billings valve per field operations Supervisor 00:45:02 EMPCo Controller opened Billings block valve per field operations Supervisor 00:45:19 EMPCo Controller opened Laurel block valve per field operations Supervisor 00:45 EMPCo Console 3 Controller received call from Doug Fox, Fire Dept. 406-860-1666. Reported
Hydrocarbon smell on Yellowstone River 02:26:35 EMPCo Controller closed Laurel block valve per field operations Technician 02:26:48 EMPCo Controller closed Billings block valve per field operations Technician”

NATIONAL RESPONSE CENTER 1-800-424-8802 *** For Public Use *** Information released to a third party shall comply with any applicable federal and/or state Freedom of Information and Privacy Laws Incident Report # 981503 INCIDENT DESCRIPTION *Report taken at 02:19 on 02-JUL-11 Incident Type: PIPELINEIncident Cause: FLOOD Affected Area: YELLOWSTONE RIVEThe incident occurred on 01-JUL-11 at 22:45 local time.Affected Medium: WATER YELLOW STONE RIVER____________________________________________________________________________
SUSPECTED RESPONSIBLE PARTY
Organization: EXXON MOBIL PIPELINE HOUSTON, TX Type of Organization: PRIVATE ENTERPRISE____________________________________________________________________________
INCIDENT LOCATIONYELLOWSTONE RIVER County: YELLOWSTONE City: LAUREL State: MT
____________________________________________________________________________
RELEASED MATERIAL(S)CHRIS Code: OIL Official Material Name: OIL: CRUDEAlso Known As: Qty Released: 0 UNKNOWN AMOUNT Qty in Water: 0 UNKNOWN AMOUNT________________________________________________________________________
DESCRIPTION OF INCIDENTCALLER IS REPORTING THAT A PIPELINE HAS BROKEN IN THE RIVER RELEASING CRUDE OIL. THE DAMAGE WAS CAUSED BY RIVER FLOODING.
____________________________________________________________________________INCIDENT DETAILS
Pipeline Type: TRANSMISSION DOT Regulated: YES Pipeline Above/Below Ground: BELOW Exposed or Under Water: YES Pipeline Covered: YES
---WATER INFORMATION--- Body of Water: YELLOWSTONE RIVER Tributary of: Nearest River Mile Marker: Water Supply Contaminated: UNKNOWN ____________________________________________________________________________
DAMAGESFire Involved: NO Fire Extinguished: UNKNOWNINJURIES: NO Hospitalized: Empl/Crew: Passenger: FATALITIES: NO Empl/Crew: Passenger: Occupant: EVACUATIONS: NO Who Evacuated: Radius/Area:
Damages: NO
Length of Direction of
Closure Type Description of Closure Closure ClosureAir: N
Road: N Major Artery: N
Waterway: N
Track: N
Passengers Transferred: NO Environmental Impact: UNKNOWN
Page 1 of 2
8/28/2012http://www.nrc.uscg.mil/reports/rwservlet?standard_web+inc_seq=981503

Media Interest: NONE Community Impact due to Material:
____________________________________________________________________________REMEDIAL ACTIONS
VALVES WERE CLOSED TO STOP THE FLOW OF THE PIPELINE.Release Secured: YES Release Rate: Estimated Release Duration: ____________________________________________________________________________
WEATHER
Weather: RAINY, ºF ____________________________________________________________________________
ADDITIONAL AGENCIES NOTIFIED
Federal: NONEState/Local: FDState/Local On Scene: FDState Agency Number: NONE
____________________________________________________________________________NOTIFICATIONS BY NRC
DHS NOC (NOC)02-JUL-11 02:29
USCG ICC (ICC ONI)02-JUL-11 02:29
DOT CRISIS MANAGEMENT CENTER (MAIN OFFICE)02-JUL-11 02:29
U.S. EPA VIII (MAIN OFFICE)02-JUL-11 03:55
FEDERAL EMERGENCY MANAGEMENT AGENCY (MAIN OFFICE)02-JUL-11 02:29
INFO ANALYSIS & INFRA PROTECTION (MAIN OFFICE)02-JUL-11 02:29
MT DEPT OF ENVIRONMENTAL QUALITY (MAIN OFFICE)02-JUL-11 02:29
NATIONAL INFRASTRUCTURE COORD CTR (MAIN OFFICE)02-JUL-11 02:29
NATIONAL INFRASTRUCTURE COORD CTR (INFRASTRUCTURE PROTECTION)02-JUL-11 02:29
NOAA RPTS FOR MT (MAIN OFFICE)02-JUL-11 02:29
NRC SENIOR WATCH OFFICER (SWO)05-JUL-11 16:32
NTSB PIPELINE (MAIN OFFICE)02-JUL-11 17:00
PIPELINE & HAZMAT SAFETY ADMIN (OFFICE OF PIPELINE SAFETY (AUTO))02-JUL-11 02:29
DOI/OEPC DENVER (MAIN OFFICE)02-JUL-11 02:29
____________________________________________________________________________ADDITIONAL INFORMATION
NO ADDITIONAL INFORMATION.___________________________________________________________________________
*** END INCIDENT REPORT # 981503 ***
Page 2 of 2
8/28/2012http://www.nrc.uscg.mil/reports/rwservlet?standard_web+inc_seq=981503

Page 1 of 14
Reproduction of this form is permitted
NOTICE: This report is required by 49 CFR Part 195. Failure to report can result in a civil penalty not to exceed $100,000 for each violation for each day that such violation persists except that the maximum civil penalty shall not exceed $1,000,000 as provided in 49 USC 60122.
OMB NO: 2137-0047EXPIRATION DATE: 01/31/2013
U.S Department of TransportationPipeline and Hazardous Materials Safety Administration
Report Date: 07/29/2011
No. 20110262 - 16884--------------------------
(DOT Use Only)
ACCIDENT REPORT - HAZARDOUS LIQUIDPIPELINE SYSTEMS
A federal agency may not conduct or sponsor, and a person is not required to respond to, nor shall a person be subject to a penalty for failure to comply with a collection of information subject to the requirements of the Paperwork Reduction Act unless that collection of information displays a current valid OMB Control Number. The OMB Control Number for this information collection is 2137-0047. Public reporting for this collection of information is estimatedto be approximately 10 hours per response (5 hours for a small release), including the time for reviewing instructions, gathering the data needed, and completing and reviewing the collection of information. All responses to this collection of information are mandatory. Send comments regarding this burden estimate or any other aspect of this collection of information, including suggestions for reducing this burden to: Information Collection Clearance Officer, PHMSA, Office of Pipeline Safety (PHP-30) 1200 New Jersey Avenue, SE, Washington, D.C. 20590.
INSTRUCTIONS
Important: Please read the separate instructions for completing this form before you begin. They clarify the information requested and provide specific examples. If you do not have a copy of the instructions, you can obtain one from the PHMSA Pipeline Safety Community Web Page at http://www.phmsa.dot.gov/pipeline.
PART A - KEY REPORT INFORMATION
Report Type: (select all that apply) Original: Supplemental: Final:Yes Yes
Last Revision Date: 09/06/20121. Operator's OPS-issued Operator Identification Number (OPID): 49062. Name of Operator EXXONMOBIL PIPELINE CO3. Address of Operator:
3a. Street Address P.O.BOX 22203b. City HOUSTON3c. State Texas3d. Zip Code 77252
4. Local time (24-hr clock) and date of the Accident: 07/01/2011 22:405. Location of Accident:
Latitude: 45.655486Longitude: -108.75724
6. National Response Center Report Number (if applicable): 9815037. Local time (24-hr clock) and date of initial telephonic report to the National Response Center (if applicable): 07/02/2011 00:19
8. Commodity released: (select only one, based on predominant volume released) Crude Oil
- Specify Commodity Subtype:- If "Other" Subtype, Describe:
- If Biofuel/Alternative Fuel and Commodity Subtype is Ethanol Blend, then % Ethanol Blend:
%:- If Biofuel/Alternative Fuel and Commodity Subtype is
Biodiesel, then Biodiesel Blend (e.g. B2, B20, B100):B
9. Estimated volume of commodity released unintentionally (Barrels): 1,509.0010. Estimated volume of intentional and/or controlled release/blowdown (Barrels):11. Estimated volume of commodity recovered (Barrels):12. Were there fatalities? No- If Yes, specify the number in each category:
12a. Operator employees 12b. Contractor employees working for the Operator12c. Non-Operator emergency responders12d. Workers working on the right-of-way, but NOT associated with this Operator12e. General public 12f. Total fatalities (sum of above)
13. Were there injuries requiring inpatient hospitalization? No- If Yes, specify the number in each category:
13a. Operator employees13b. Contractor employees working for the Operator13c. Non-Operator emergency responders13d. Workers working on the right-of-way, but NOT

Page 2 of 14
Reproduction of this form is permitted
associated with this Operator13e. General public 13f. Total injuries (sum of above)
14. Was the pipeline/facility shut down due to the Accident? Yes- If No, Explain:
- If Yes, complete Questions 14a and 14b: (use local time, 24-hr clock)14a. Local time and date of shutdown: 07/01/2011 22:4814b. Local time pipeline/facility restarted: 09/24/2011 07:00 - Still shut down? (* Supplemental Report Required)
15. Did the commodity ignite? No16. Did the commodity explode? No17. Number of general public evacuated: 4018. Time sequence (use local time, 24-hour clock):
18a. Local time Operator identified Accident: 07/01/2011 23:4518b. Local time Operator resources arrived on site: 07/02/2011 00:10
PART B - ADDITIONAL LOCATION INFORMATION1. Was the origin of Accident onshore? Yes
If Yes, Complete Questions (2-12)If No, Complete Questions (13-15)
- If Onshore:2. State: Montana3. Zip Code: 590444. City Laurel5. County or Parish Yellowstone6. Operator-designated location: Milepost/Valve Station
Specify: 21.17. Pipeline/Facility name: Silvertip to Billings 12 inch Crude Oil Pipeline8. Segment name/ID: Edgar to Laurel9. Was Accident on Federal land, other than the Outer Continental Shelf(OCS)? No
10. Location of Accident: Pipeline Right-of-way11. Area of Accident (as found): Underground
Specify: - If Other, Describe:
Depth-of-Cover (in):12. Did Accident occur in a crossing? Yes- If Yes, specify below:
- If Bridge crossing Cased/ Uncased:
- If Railroad crossingCased/ Uncased/ Bored/drilled
- If Road crossing Cased/ Uncased/ Bored/drilled
- If Water crossing YesCased/ Uncased Uncased
- Name of body of water, if commonly known: Yellowstone River - Approx. water depth (ft) at the point of the Accident: 13
- Select: Below water, pipe buried below bottom (NOT in bored/drilled crossing)
- If Offshore:13. Approximate water depth (ft) at the point of the Accident:14. Origin of Accident:
- In State waters - Specify: - State: - Area: - Block/Tract #: - Nearest County/Parish:
- On the Outer Continental Shelf (OCS) - Specify: - Area: - Block #:
15. Area of Accident:
PART C - ADDITIONAL FACILITY INFORMATION1. Is the pipeline or facility: Interstate2. Part of system involved in Accident: Onshore Pipeline, Including Valve Sites
- If Onshore Breakout Tank or Storage Vessel, Including Attached Appurtenances, specify:
3. Item involved in Accident: Weld, including heat-affected zone

Page 3 of 14
Reproduction of this form is permitted
- If Pipe, specify:3a. Nominal diameter of pipe (in):3b. Wall thickness (in):3c. SMYS (Specified Minimum Yield Strength) of pipe (psi):3d. Pipe specification:3e. Pipe Seam , specify:
- If Other, Describe:3f. Pipe manufacturer: 3g. Year of manufacture:
3h. Pipeline coating type at point of Accident, specify: - If Other, Describe:
- If Weld, including heat-affected zone, specify: Pipe Girth Weld - If Other, Describe:
- If Valve, specify:- If Mainline, specify:
- If Other, Describe:3i. Manufactured by: 3j. Year of manufacture:
- If Tank/Vessel, specify: - If Other - Describe:
- If Other, describe:4. Year item involved in Accident was installed: 19915. Material involved in Accident: Carbon Steel
- If Material other than Carbon Steel, specify:6. Type of Accident Involved: Rupture
- If Mechanical Puncture Specify Approx. size:in. (axial) by
in. (circumferential)- If Leak - Select Type:
- If Other, Describe:- If Rupture - Select Orientation: Circumferential
- If Other, Describe: Approx. size: in. (widest opening) by
in. (length circumferentially or axially)- If Other Describe:
PART D - ADDITIONAL CONSEQUENCE INFORMATION 1. Wildlife impact: Yes
1a. If Yes, specify all that apply:- Fish/aquatic Yes- Birds Yes- Terrestrial Yes
2. Soil contamination: Yes3. Long term impact assessment performed or planned: Yes4. Anticipated remediation: Yes
4a. If Yes, specify all that apply:- Surface water Yes- Groundwater- Soil Yes- Vegetation Yes- Wildlife Yes
5. Water contamination: Yes5a. If Yes, specify all that apply:
- Ocean/Seawater- Surface Yes- Groundwater- Drinking water: (Select one or both)
- Private Well- Public Water Intake
5b. Estimated amount released in or reaching water (Barrels): 1,509.005c. Name of body of water, if commonly known: Yellowstone River
6. At the location of this Accident, had the pipeline segment or facility been identified as one that "could affect" a High Consequence Area (HCA) as determined in the Operator's Integrity Management Program?
Yes
7. Did the released commodity reach or occur in one or more High Consequence Area (HCA)? Yes
7a. If Yes, specify HCA type(s): (Select all that apply)- Commercially Navigable Waterway:
Was this HCA identified in the "could affect"

Page 4 of 14
Reproduction of this form is permitted
determination for this Accident site in the Operator's Integrity Management Program?
- High Population Area: YesWas this HCA identified in the "could affect" determination for this Accident site in the Operator's Integrity Management Program?
Yes
- Other Populated Area YesWas this HCA identified in the "could affect" determination for this Accident site in the Operator's Integrity Management Program?
Yes
- Unusually Sensitive Area (USA) - Drinking Water YesWas this HCA identified in the "could affect" determination for this Accident site in the Operator's Integrity Management Program?
Yes
- Unusually Sensitive Area (USA) - EcologicalWas this HCA identified in the "could affect" determination for this Accident site in the Operator's Integrity Management Program?
8. Estimated Property Damage: 8a. Estimated cost of public and non-Operator private property damage $ 7,500,000
8b. Estimated cost of commodity lost $ 150,0008c. Estimated cost of Operator's property damage & repairs $ 5,000,0008d. Estimated cost of Operator's emergency response $ 100,000,0008e. Estimated cost of Operator's environmental remediation $ 08f. Estimated other costs $ 22,350,000
Describe: Environmental & Emergency Response combinedOther Cost: Explained in Section H
8g. Total estimated property damage (sum of above) $ 135,000,000
PART E - ADDITIONAL OPERATING INFORMATION
1. Estimated pressure at the point and time of the Accident (psig): 525.002. Maximum Operating Pressure (MOP) at the point and time of the Accident (psig): 960.00
3. Describe the pressure on the system or facility relating to the Accident (psig): Pressure did not exceed MOP
4. Not including pressure reductions required by PHMSA regulations (such as for repairs and pipe movement), was the system or facility relating to the Accident operating under an established pressure restriction with pressure limits below those normally allowed by the MOP?
No
- If Yes, Complete 4.a and 4.b below:4a. Did the pressure exceed this established pressure restriction?4b. Was this pressure restriction mandated by PHMSA or theState?
5. Was "Onshore Pipeline, Including Valve Sites" OR "Offshore Pipeline, Including Riser and Riser Bend" selected in PART C, Question 2?
Yes
- If Yes - (Complete 5a. 5f. below)5a. Type of upstream valve used to initially isolate release source: Automatic
5b. Type of downstream valve used to initially isolate release source: Check Valve
5c. Length of segment isolated between valves (ft): 1,7095d. Is the pipeline configured to accommodate internal inspection tools? Yes
- If No, Which physical features limit tool accommodation? (select all that apply)- Changes in line pipe diameter- Presence of unsuitable mainline valves- Tight or mitered pipe bends- Other passage restrictions (i.e. unbarred tee's, projecting instrumentation, etc.)- Extra thick pipe wall (applicable only for magnetic flux leakage internal inspection tools)- Other -
- If Other, Describe:5e. For this pipeline, are there operational factors which significantly complicate the execution of an internal inspection tool run?
No
- If Yes, Which operational factors complicate execution? (select all that apply)

Page 5 of 14
Reproduction of this form is permitted
- Excessive debris or scale, wax, or other wall buildup- Low operating pressure(s)- Low flow or absence of flow- Incompatible commodity - Other -
- If Other, Describe:5f. Function of pipeline system: > 20% SMYS Regulated Trunkline/Transmission
6. Was a Supervisory Control and Data Acquisition (SCADA)-based system in place on the pipeline or facility involved in the Accident? Yes
If Yes -6a. Was it operating at the time of the Accident? Yes6b. Was it fully functional at the time of the Accident? Yes6c. Did SCADA-based information (such as alarm(s), alert(s), event(s), and/or volume calculations) assist with the detection of the Accident?
Yes
6d. Did SCADA-based information (such as alarm(s), alert(s), event(s), and/or volume calculations) assist with the confirmation of the Accident?
Yes
7. Was a CPM leak detection system in place on the pipeline or facility involved in the Accident? Yes
- If Yes:7a. Was it operating at the time of the Accident? Yes7b. Was it fully functional at the time of the Accident? Yes7c. Did CPM leak detection system information (such as alarm(s), alert(s), event(s), and/or volume calculations) assist with the detection of the Accident?
Yes
7d. Did CPM leak detection system information (such as alarm(s), alert(s), event(s), and/or volume calculations) assist with the confirmation of the Accident?
Yes
8. How was the Accident initially identified for the Operator? Notification from Emergency Responder- If Other, Specify:
8a. If "Controller", "Local Operating Personnel", including contractors", "Air Patrol", or "Guard Patrol by Operator or its contractor" is selected in Question 8, specify the following:
9. Was an investigation initiated into whether or not the controller(s) or control room issues were the cause of or a contributing factor to the Accident?
No, the Operator did not find that an investigation of the controller(s) actions or control room issues was necessary due to: (provide an explanation for why the Operator did notinvestigate)
- If No, the Operator did not find that an investigation of the controller(s) actions or control room issues was necessary due to:(provide an explanation for why the operator did not investigate)
Controller recognized the incident and took steps necessaryto mitigate the situation.
- If Yes, specify investigation result(s): (select all that apply)- Investigation reviewed work schedule rotations, continuous hours of service (while working for the Operator), and other factors associated with fatigue - Investigation did NOT review work schedule rotations, continuous hours of service (while working for the Operator), and other factors associated with fatigue
Provide an explanation for why not:- Investigation identified no control room issues - Investigation identified no controller issues - Investigation identified incorrect controller action or controller error - Investigation identified that fatigue may have affected the controller(s) involved or impacted the involved controller(s) response- Investigation identified incorrect procedures- Investigation identified incorrect control room equipment operation- Investigation identified maintenance activities that affectedcontrol room operations, procedures, and/or controller response- Investigation identified areas other than those above:
Describe:
PART F - DRUG & ALCOHOL TESTING INFORMATION1. As a result of this Accident, were any Operator employees tested under the post-accident drug and alcohol testing requirements of DOT's Drug & Alcohol Testing regulations?
No
- If Yes:1a. Specify how many were tested:

Page 6 of 14
Reproduction of this form is permitted
1b. Specify how many failed: 2. As a result of this Accident, were any Operator contractor employees tested under the post-accident drug and alcohol testing requirements of DOT's Drug & Alcohol Testing regulations?
No
- If Yes: 2a. Specify how many were tested: 2b. Specify how many failed:
PART G APPARENT CAUSE
Select only one box from PART G in shaded column on left representing the APPARENT Cause of the Accident, and answer the questions on the right. Describe secondary, contributing or root causes of the Accident in the narrative (PART H).
Apparent Cause: G2 - Natural Force Damage
G1 - Corrosion Failure - only one sub-cause can be picked from shaded left-hand column
External Corrosion:Internal Corrosion:- If External Corrosion:1. Results of visual examination:
- If Other, Describe:2. Type of corrosion: (select all that apply)
- Galvanic- Atmospheric- Stray Current- Microbiological- Selective Seam- Other:
- If Other, Describe:3. The type(s) of corrosion selected in Question 2 is based on the following: (select all that apply)
- Field examination- Determined by metallurgical analysis- Other:
- If Other, Describe:4. Was the failed item buried under the ground?
- If Yes :4a. Was failed item considered to be under cathodic
protection at the time of the Accident?If Yes - Year protection started:
4b. Was shielding, tenting, or disbonding of coating evident atthe point of the Accident?4c. Has one or more Cathodic Protection Survey been conducted at the point of the Accident?
If "Yes, CP Annual Survey" Most recent year conducted:If "Yes, Close Interval Survey" Most recent year conducted:
If "Yes, Other CP Survey" Most recent year conducted:- If No:
4d. Was the failed item externally coated or painted?5. Was there observable damage to the coating or paint in the vicinity ofthe corrosion?- If Internal Corrosion:6. Results of visual examination:
- Other:7. Type of corrosion (select all that apply): -
- Corrosive Commodity- Water drop-out/Acid- Microbiological- Erosion- Other:
- If Other, Describe:8. The cause(s) of corrosion selected in Question 7 is based on the following (select all that apply): -
- Field examination - Determined by metallurgical analysis- Other:
- If Other, Describe:9. Location of corrosion (select all that apply): -
- Low point in pipe- Elbow

Page 7 of 14
Reproduction of this form is permitted
- Other:- If Other, Describe:
10. Was the commodity treated with corrosion inhibitors or biocides?11. Was the interior coated or lined with protective coating?12. Were cleaning/dewatering pigs (or other operations) routinely utilized?13. Were corrosion coupons routinely utilized?Complete the following if any Corrosion Failure sub-cause is selected AND the "Item Involved in Accident" (from PART C, Question 3) is Tank/Vessel.14. List the year of the most recent inspections:
14a. API Std 653 Out-of-Service Inspection- No Out-of-Service Inspection completed
14b. API Std 653 In-Service Inspection- No In-Service Inspection completed
Complete the following if any Corrosion Failure sub-cause is selected AND the "Item Involved in Accident" (from PART C, Question 3) is Pipe or Weld.15. Has one or more internal inspection tool collected data at the point of theAccident?
15a. If Yes, for each tool used, select type of internal inspection tool and indicate most recent year run: -- Magnetic Flux Leakage Tool
Most recent year:- Ultrasonic
Most recent year:- Geometry
Most recent year:- Caliper
Most recent year:- Crack
Most recent year:- Hard Spot
Most recent year:- Combination Tool
Most recent year:- Transverse Field/Triaxial
Most recent year:- Other
Most recent year:Describe:
16. Has one or more hydrotest or other pressure test been conducted since original construction at the point of the Accident?If Yes -
Most recent year tested:Test pressure:
17. Has one or more Direct Assessment been conducted on this segment?- If Yes, and an investigative dig was conducted at the point of the Accident::
Most recent year conducted:- If Yes, but the point of the Accident was not identified as a dig site:
Most recent year conducted:18. Has one or more non-destructive examination been conducted at the point of the Accident since January 1, 2002?18a. If Yes, for each examination conducted since January 1, 2002, select type of non-destructive examination and indicate most recent year the examination was conducted:
- RadiographyMost recent year conducted:
- Guided Wave UltrasonicMost recent year conducted:
- Handheld Ultrasonic ToolMost recent year conducted:
- Wet Magnetic Particle TestMost recent year conducted:
- Dry Magnetic Particle TestMost recent year conducted:
- OtherMost recent year conducted:
Describe:
G2 - Natural Force Damage - only one sub-cause can be picked from shaded left-handed column
Natural Force Damage Sub-Cause: Heavy Rains/Floods
- If Earth Movement, NOT due to Heavy Rains/Floods:

Page 8 of 14
Reproduction of this form is permitted
1. Specify:- If Other, Describe:
- If Heavy Rains/Floods:2. Specify: Washouts/Scouring
- If Other, Describe:- If Lightning:3. Specify:- If Temperature:4. Specify:
- If Other, Describe:- If High Winds:
- If Other Natural Force Damage:5. Describe:Complete the following if any Natural Force Damage sub-cause is selected.6. Were the natural forces causing the Accident generated in conjunction with an extreme weather event? Yes
6a. If Yes, specify: (select all that apply)- Hurricane - Tropical Storm - Tornado- Other Yes
- If Other, Describe: Heavy Rains and Flood.
G3 - Excavation Damage - only one sub-cause can be picked from shaded left-hand column
Excavation Damage Sub-Cause:
- If Excavation Damage by Operator (First Party):
- If Excavation Damage by Operator's Contractor (Second Party):
- If Excavation Damage by Third Party:
- If Previous Damage due to Excavation Activity:Complete Questions 1-5 ONLY IF the "Item Involved in Accident" (from PART C, Question 3) is Pipe or Weld.1. Has one or more internal inspection tool collected data at the point of the Accident?
1a. If Yes, for each tool used, select type of internal inspection tool and indicate most recent year run: -- Magnetic Flux Leakage
Most recent year conducted:- Ultrasonic
Most recent year conducted:- Geometry
Most recent year conducted:- Caliper
Most recent year conducted:- Crack
Most recent year conducted:- Hard Spot
Most recent year conducted:- Combination Tool
Most recent year conducted:- Transverse Field/Triaxial
Most recent year conducted:- Other
Most recent year conducted:Describe:
2. Do you have reason to believe that the internal inspection was completed BEFORE the damage was sustained? 3. Has one or more hydrotest or other pressure test been conducted sinceoriginal construction at the point of the Accident?
- If Yes:Most recent year tested:
Test pressure (psig):4. Has one or more Direct Assessment been conducted on the pipeline segment?
- If Yes, and an investigative dig was conducted at the point of the Accident:Most recent year conducted:
- If Yes, but the point of the Accident was not identified as a dig site:

Page 9 of 14
Reproduction of this form is permitted
Most recent year conducted:5. Has one or more non-destructive examination been conducted at the point of the Accident since January 1, 2002?
5a. If Yes, for each examination, conducted since January 1, 2002, select type of non-destructive examination and indicate most recent year the examination was conducted:
- RadiographyMost recent year conducted:
- Guided Wave UltrasonicMost recent year conducted:
- Handheld Ultrasonic ToolMost recent year conducted:
- Wet Magnetic Particle TestMost recent year conducted:
- Dry Magnetic Particle TestMost recent year conducted:
- OtherMost recent year conducted:
Describe:
Complete the following if Excavation Damage by Third Party is selected as the sub-cause.6. Did the operator get prior notification of the excavation activity?
6a. If Yes, Notification received from: (select all that apply) -- One-Call System- Excavator- Contractor - Landowner
Complete the following mandatory CGA-DIRT Program questions if any Excavation Damage sub-cause is selected.
7. Do you want PHMSA to upload the following information to CGA-DIRT (www.cga-dirt.com)?8. Right-of-Way where event occurred: (select all that apply) -
- Public- If "Public", Specify:
- Private- If "Private", Specify:
- Pipeline Property/Easement- Power/Transmission Line- Railroad- Dedicated Public Utility Easement - Federal Land- Data not collected- Unknown/Other
9. Type of excavator:10. Type of excavation equipment:11. Type of work performed:12. Was the One-Call Center notified?
12a. If Yes, specify ticket number:12b. If this is a State where more than a single One-Call Center exists, list the name of the One-Call Center notified:
13. Type of Locator: 14. Were facility locate marks visible in the area of excavation? 15. Were facilities marked correctly? 16. Did the damage cause an interruption in service?
16a. If Yes, specify duration of the interruption (hours)17. Description of the CGA-DIRT Root Cause (select only the one predominant first level CGA-DIRT Root Cause and then, where available as a choice, the one predominant second level CGA-DIRT Root Cause as well):
Root Cause:- If One-Call Notification Practices Not Sufficient, specify:- If Locating Practices Not Sufficient, specify:- If Excavation Practices Not Sufficient, specify:- If Other/None of the Above, explain:
G4 - Other Outside Force Damage - only one sub-cause can be selected from the shaded left-hand column
Other Outside Force Damage Sub-Cause:- If Nearby Industrial, Man-made, or Other Fire/Explosion as Primary Cause of Incident:
- If Damage by Car, Truck, or Other Motorized Vehicle/Equipment NOT Engaged in Excavation:1. Vehicle/Equipment operated by: - If Damage by Boats, Barges, Drilling Rigs, or Other Maritime Equipment or Vessels Set Adrift or Which Have Otherwise Lost

Page 10 of 14
Reproduction of this form is permitted
Their Mooring:2. Select one or more of the following IF an extreme weather event was a factor:
- Hurricane - Tropical Storm- Tornado- Heavy Rains/Flood- Other
- If Other, Describe:- If Routine or Normal Fishing or Other Maritime Activity NOT Engaged in Excavation:
- If Electrical Arcing from Other Equipment or Facility:
- If Previous Mechanical Damage NOT Related to Excavation:Complete Questions 3-7 ONLY IF the "Item Involved in Accident" (from PART C, Question 3) is Pipe or Weld.3. Has one or more internal inspection tool collected data at the point ofthe Accident?3a. If Yes, for each tool used, select type of internal inspection tool and indicate most recent year run:
- Magnetic Flux LeakageMost recent year conducted:
- UltrasonicMost recent year conducted:
- GeometryMost recent year conducted:
- CaliperMost recent year conducted:
- CrackMost recent year conducted:
- Hard SpotMost recent year conducted:
- Combination ToolMost recent year conducted:
- Transverse Field/TriaxialMost recent year conducted:
- OtherMost recent year conducted:
Describe:4. Do you have reason to believe that the internal inspection was completed BEFORE the damage was sustained? 5. Has one or more hydrotest or other pressure test been conducted since original construction at the point of the Accident?
- If Yes:Most recent year tested:
Test pressure (psig):6. Has one or more Direct Assessment been conducted on the pipeline segment?- If Yes, and an investigative dig was conducted at the point of the Accident:
Most recent year conducted:- If Yes, but the point of the Accident was not identified as a dig site:
Most recent year conducted:7. Has one or more non-destructive examination been conducted at the point of the Accident since January 1, 2002?
7a. If Yes, for each examination conducted since January 1, 2002, select type of non-destructive examination and indicate most recent year the examination was conducted:
- RadiographyMost recent year conducted:
- Guided Wave UltrasonicMost recent year conducted:
- Handheld Ultrasonic ToolMost recent year conducted:
- Wet Magnetic Particle TestMost recent year conducted:
- Dry Magnetic Particle TestMost recent year conducted:
- OtherMost recent year conducted:
Describe:- If Intentional Damage:8. Specify:
- If Other, Describe:- If Other Outside Force Damage:

Page 11 of 14
Reproduction of this form is permitted
9. Describe:
G5 - Material Failure of Pipe or Weld - only one sub-cause can be selected from the shaded left-hand column
Use this section to report material failures ONLY IF the "Item Involved in Accident" (from PART C, Question 3) is "Pipe" or "Weld."Material Failure of Pipe or Weld Sub-Cause:1. The sub-cause selected below is based on the following: (select all that apply)
- Field Examination- Determined by Metallurgical Analysis- Other Analysis
- If "Other Analysis", Describe:- Sub-cause is Tentative or Suspected; Still Under Investigation (Supplemental Report required)
- If Construction, Installation, or Fabrication-related:2. List contributing factors: (select all that apply)
- Fatigue or Vibration-relatedSpecify:
- If Other, Describe:- Mechanical Stress:- Other
- If Other, Describe:- If Original Manufacturing-related (NOT girth weld or other welds formed in the field):2. List contributing factors: (select all that apply)- Fatigue or Vibration-related:
Specify:- If Other, Describe:
- Mechanical Stress:- Other
- If Other, Describe:- If Environmental Cracking-related:3. Specify:
- Other - Describe:
Complete the following if any Material Failure of Pipe or Weld sub-cause is selected.
4. Additional factors: (select all that apply):- Dent- Gouge- Pipe Bend- Arc Burn- Crack- Lack of Fusion- Lamination- Buckle- Wrinkle- Misalignment- Burnt Steel- Other:
- If Other, Describe:5. Has one or more internal inspection tool collected data at the point of the Accident?
5a. If Yes, for each tool used, select type of internal inspection tool and indicate most recent year run:- Magnetic Flux Leakage
Most recent year run:- Ultrasonic
Most recent year run:- Geometry
Most recent year run:- Caliper
Most recent year run:- Crack
Most recent year run:- Hard Spot
Most recent year run:- Combination Tool
Most recent year run:- Transverse Field/Triaxial
Most recent year run:- Other

Page 12 of 14
Reproduction of this form is permitted
Most recent year run:Describe:
6. Has one or more hydrotest or other pressure test been conducted sinceoriginal construction at the point of the Accident?
- If Yes:Most recent year tested:
Test pressure (psig):7. Has one or more Direct Assessment been conducted on the pipeline segment?
- If Yes, and an investigative dig was conducted at the point of the Accident -Most recent year conducted:
- If Yes, but the point of the Accident was not identified as a dig site -Most recent year conducted:
8. Has one or more non-destructive examination(s) been conducted at thepoint of the Accident since January 1, 2002?
8a. If Yes, for each examination conducted since January 1, 2002, select type of non-destructive examination and indicate most recent year the examination was conducted: -
- RadiographyMost recent year conducted:
- Guided Wave UltrasonicMost recent year conducted:
- Handheld Ultrasonic ToolMost recent year conducted:
- Wet Magnetic Particle TestMost recent year conducted:
- Dry Magnetic Particle TestMost recent year conducted:
- OtherMost recent year conducted:
Describe:
G6 Equipment Failure - only one sub-cause can be selected from the shaded left-hand column
Equipment Failure Sub-Cause:- If Malfunction of Control/Relief Equipment:1. Specify: (select all that apply) -
- Control Valve - Instrumentation - SCADA- Communications - Block Valve - Check Valve- Relief Valve - Power Failure - Stopple/Control Fitting - ESD System Failure- Other
- If Other Describe:- If Pump or Pump-related Equipment:2. Specify:
- If Other Describe:- If Threaded Connection/Coupling Failure:3. Specify:
- If Other Describe:- If Non-threaded Connection Failure:4. Specify:
- If Other Describe:- If Defective or Loose Tubing or Fitting:
- If Failure of Equipment Body (except Pump), Tank Plate, or other Material:
- If Other Equipment Failure:5. Describe:
Complete the following if any Equipment Failure sub-cause is selected.
6. Additional factors that contributed to the equipment failure: (select all that apply)- Excessive vibration- Overpressurization- No support or loss of support

Page 13 of 14
Reproduction of this form is permitted
- Manufacturing defect- Loss of electricity- Improper installation- Mismatched items (different manufacturer for tubing and tubing fittings)- Dissimilar metals- Breakdown of soft goods due to compatibility issues with transported commodity- Valve vault or valve can contributed to the release- Alarm/status failure- Misalignment- Thermal stress- Other
- If Other, Describe:
G7 - Incorrect Operation - only one sub-cause can be selected from the shaded left-hand column
Incorrect Operation Sub-Cause:Damage by Operator or Operator's Contractor NOT Related to Excavation and NOT due to Motorized Vehicle/Equipment Damage No
Tank, Vessel, or Sump/Separator Allowed or Caused to Overfill or Overflow No
1. Specify:
- If Other, Describe:Valve Left or Placed in Wrong Position, but NOT Resulting in a Tank, Vessel, or Sump/Separator Overflow or Facility Overpressure No
Pipeline or Equipment Overpressured No
Equipment Not Installed Properly No
Wrong Equipment Specified or Installed NoOther Incorrect Operation
No
2. Describe:Complete the following if any Incorrect Operation sub-cause is selected.3. Was this Accident related to (select all that apply): -
- Inadequate procedure- No procedure established- Failure to follow procedure - Other:
- If Other, Describe:4. What category type was the activity that caused the Accident?5. Was the task(s) that led to the Accident identified as a covered task in your Operator Qualification Program?
5a. If Yes, were the individuals performing the task(s) qualified for the task(s)?
G8 - Other Accident Cause - only one sub-cause can be selected from the shaded left-hand column
Other Accident Cause Sub-Cause:
- If Miscellaneous:1. Describe:- If Unknown:2. Specify:
PART H - NARRATIVE DESCRIPTION OF THE ACCIDENT
1. In reference to Part A9 and D5B, estimate of the release was changed to 1509 bbls. on 1-19-12 2. In reference to section B12, EMPCo was unable to determine the water depth at the location of the accident. The closest gauge downstream measured 13.91 ft.

Page 14 of 14
Reproduction of this form is permitted
3. In addition to the FBE coating the pipe has a 1 inch concrete "skin" for abrasion résistance in Reference Section 3h. 4. In reference to A4, A14a and A18a, the system pressure dropped at approximately 22:40. The Silvertip station pumps were shut down by the controller by approximately 22:48. Positive confirmation of the accident occurred at approximately 23:45 when EMPCo was notified by Laurel emergency responders.5. Supplemental Report created on 1-27-12 to change release amount from 1000 to 1509 bbls and provide additional Cost Information. 6. Emergency Response and Environmental remediation cost are combined in Section D. (8d & 8e) 7. Section D. 8F estimated other cost 22,350,000 includes the HDD's at Rock Creek and Clarks Fork, pipe extraction, and other Restart costs.8. Damaged segments of the ruptured pipeline were removed and shipped to a third party metallurgy laboratory for analysis. The Metallurgy Laboratory report was sent to PHMSA on 8-6-12.9. Part G-Apparent Cause Narrative On July 1, 2011, the Silvertip Pipeline suffered a loss of containment at a crossing of the Yellowstone River in Laurel, MT during flood and high water conditions that persisted for more than a month. Kiefner & Associates, Inc. conducted a metallurgical examination of the ruptured pipe and concluded that the pipeline failed at a girth weld as a result of the effects of external loading that occurred due to exposure to flood conditions.
File Full Name
PART I - PREPARER AND AUTHORIZED SIGNATUREPreparer's Name Larry HawthornePreparer's Title Pipeline Safety AdvisorPreparer's Telephone Number 903-654-5345Preparer's E-mail Address [email protected]'s Facsimile Number 903-654-5374Authorized Signature's Name Gary W. HartmannAuthorized Signature Title SHE ManagerAuthorized Signature Telephone Number 713-656-0227Authorized Signature Email [email protected] 09/06/2012

Kiefner & Associates, Inc. 585 Scherers Court (614) 888-8220 Worthington, Ohio 43085 www.kiefner.com
0273-1104
ExxonMobil Pipeline Company Final Report No. 12-110R1
Final Report
Investigation of the Silvertip-Billings Crude Oil Pipeline Failure at the Yellowstone River Crossing
M.J. Rosenfeld, P.E. and W.G. Morris, P.E. August 6, 2012

Intentionally blank

Final Report No. 12-110R1
Final Report
on
INVESTIGATION OF THE SILVERTIP-BILLINGS CRUDE OIL PIPELINE FAILURE AT THE YELLOWSTONE RIVER CROSSING
to
EXXONMOBIL PIPELINE COMPANY
August 6, 2012
by
M.J. Rosenfeld, P.E. and W.G. Morris, P.E.
Kiefner and Associates, Inc. 585 Scherers Court
Worthington, Ohio 43085
0273-1104

DISCLAIMER This document presents findings and/ or recommendations based on engineering services performed by employees of Kiefner and Associates, Inc. The work addressed herein has been performed according to the authors’ knowledge, information, and belief in accordance with commonly accepted procedures consistent with applicable standards of practice, and is not a guaranty or warranty, either expressed or implied.
The analysis and conclusions provided in this report are for the sole use and benefit of the Client. No information or representations contained herein are for the use or benefit of any party other than the party contracting with KAI. The scope of use of the information presented herein is limited to the facts as presented and examined, as outlined within the body of this document. No additional representations are made as to matters not specifically addressed within this report. Any additional facts or circumstances in existence but not described or considered within this report may change the analysis, outcomes and representations made in this report.

i
TABLE OF CONTENTS INTRODUCTION ................................................................................................................................ 1
CONCLUSIONS .................................................................................................................................. 1
BACKGROUND .................................................................................................................................. 2
METALLURGICAL INVESTIGATION ................................................................................................... 3
Protocol ......................................................................................................................................3
Visual Examination ....................................................................................................................4
Pipe Exterior ........................................................................................................................6
Pipe Interior .......................................................................................................................10
The Fracture .......................................................................................................................11
Non-destructive Examination ..................................................................................................13
Fractographic Examination ......................................................................................................17
SEM Examination ....................................................................................................................24
Metallographic Examination ....................................................................................................32
Microhardness Testing .............................................................................................................38
Pipe Properties Testing ............................................................................................................39
Brinell Hardness Test .........................................................................................................39
Pipe Strength ......................................................................................................................39
Chemistry Analysis ............................................................................................................40
Charpy V-Notch Impact Testing ........................................................................................42
Weld CTOD Testing ..........................................................................................................43
CTOD Specimen Crack .....................................................................................................45
Concrete Testing ......................................................................................................................51
Pipe Weight Coating Density Tests ...................................................................................51
Petrographic Analysis of Found Concrete .........................................................................52
EXTERNAL LOADS ANALYSIS ........................................................................................................ 52
Static Stresses...........................................................................................................................52
Operating Stress .................................................................................................................53
Buoyancy ...........................................................................................................................53
Drag Forces ........................................................................................................................53
Static Stress in the Pipe ......................................................................................................54
Dynamic Response...................................................................................................................55

ii
Susceptibility to Vortex-Induced Vibration .......................................................................55
Critical Load ......................................................................................................................57
DISCUSSION ................................................................................................................................... 58
APPENDIX 1 – EXAMINATION PROTOCOL ....................................................................................... 60
APPENDIX 2 – MATERIAL HANDLING RECORDS ............................................................................. 67
APPENDIX 3 – RADIOGRAPHY RESULTS ......................................................................................... 69
APPENDIX 4 – KAI EXAMINATION PHOTOGRAPHS ......................................................................... 71
APPENDIX 5 – SEM EXAMINATION PHOTOGRAPHS........................................................................ 73
APPENDIX 6 – KAI MATERIAL TEST RESULTS ............................................................................... 75
APPENDIX 7 – CTOD TEST RESULTS ............................................................................................. 77
APPENDIX 8 – PETROGRAPHIC ANALYSIS RESULTS ....................................................................... 79
APPENDIX 9 – METALLOGRAPHY AND STEREOMICROSCOPE PHOTOGRAPHS .................................. 81
LIST OF FIGURES Figure 1. River Crossing Profile ..................................................................................................... 3
Figure 2. Pipe samples in as-received condition ............................................................................. 5
Figure 3. Fractured end of Pipe 014 as received ............................................................................. 5
Figure 4. Area of coating erosion on Pipe 024 ............................................................................... 6
Figure 5. Debris impacted under edge of intact coating ................................................................. 7
Figure 6. Organisms on Surface of Pipe 024 .................................................................................. 8
Figure 7. Detail of organisms on surface of Pipe 024 ..................................................................... 8
Figure 8. Detail of organisms on pipe surface ................................................................................ 9
Figure 9. Corrosion under biotic mass ............................................................................................ 9
Figure 10. Internal surface of Pipe 024 ......................................................................................... 10
Figure 11. Interior Surface Pitting ................................................................................................ 11
Figure 12. Fractured end of Pipe 024............................................................................................ 12
Figure 13.Fractured end of Pipe 014............................................................................................. 12
Figure 14. Fractured ends of the pipe aligned............................................................................... 13
Figure 15. Magnetic Particle Examination Surface Features........................................................ 15
Figure 16. Burn-through Feature, Weld 026 ................................................................................. 16
Figure 17. Inadequate Penetration Feature, Weld 030 .................................................................. 16
Figure 18. Fit-up Across Weld 030............................................................................................... 17
Figure 19. Pipe rings containing fracture surfaces ........................................................................ 18

iii
Figure 20. Fracture surface of Pipe 024 ........................................................................................ 19
Figure 21. Fracture surface of Pipe 014 ........................................................................................ 20
Figure 22. Fracture surface of Pipe 014 showing Feature “S” ..................................................... 21
Figure 23. Fracture surface of Pipe 024 showing Feature “L” ..................................................... 21
Figure 24. T024-C showing location of features S and L ............................................................. 23
Figure 25. Specimens S1 and L1 after Cleaning........................................................................... 23
Figure 26. Fracture surface after cleaning with naphtha and Alconox (T014-C-1) ...................... 23
Figure 27. Fracture surface after cleaning with naphtha and Alconox (T014-C-2) ...................... 24
Figure 28. Detail of Pitting Under Biotic Adherent ...................................................................... 24
Figure 29. SEM Image, Feature S1, Origin (13X) ........................................................................ 25
Figure 30. SEM Image, Feature S1, Midwall ............................................................................... 26
Figure 31. SEM Image, Feature S1, Region Above Flat Feature ................................................. 26
Figure 32. SEM Image, Feature S1, Edge of Flat Feature ............................................................ 27
Figure 33. Detail of Banded Region at Edge of Flat Feature........................................................ 27
Figure 34. EDS Analysis of Dark Band Material ......................................................................... 28
Figure 35. EDS Analysis Between Dark Bands............................................................................ 28
Figure 36. SEM Image, Pitting on Flat Feature ............................................................................ 29
Figure 37. SEM Image, Surface of Pitted Area ............................................................................ 29
Figure 38. EDS Analysis, Pitted Surface ...................................................................................... 30
Figure 39. SEM Image, Specimen L1, Thumbnail Near Pipe ID ................................................. 30
Figure 40. SEM Image, Detail of Banded Feature, Backscatter Mode......................................... 31
Figure 41. SEM Image, Detail of Banded Feature, Normal Mode ............................................... 31
Figure 42. EDS Analysis of Banded Feature ................................................................................ 32
Figure 43. Location of metallographic section through feature S in sample T014-C-1.2 ............ 32
Figure 44. Location of metallographic section through feature S in sample T024-C-1.1 ............ 33
Figure 45. Location of metallographic sections through feature L ............................................... 33
Figure 46. Location of metallographic section through feature L (T014-C-2) ............................. 34
Figure 47. Location of metallographic section through feature L (T024-C-2) ............................. 34
Figure 48. Location of metallographic section in through-wall portion of feature L ................... 35
Figure 49. Location of metallographic section through shear portion of fracture ........................ 35
Figure 50. Metallographic section through Feature S ................................................................... 36
Figure 51. Metallographic section through Feature L .................................................................. 37
Figure 52. Metallographic section through Feature L (at through thickness location) ................. 37

iv
Figure 53. Metallographic section through shear area of fracture ................................................ 38
Figure 54. Distribution of CTOD Measurements ......................................................................... 45
Figure 55. Crack surface of Weld 026 CTOD specimen .............................................................. 45
Figure 56. Overview of Cracked CTOD Specimen Viewed on SEM .......................................... 46
Figure 57. Edge of fracture surface near intact corner .................................................................. 47
Figure 58. Detail of edge of fracture surface near intact corner ................................................... 47
Figure 59. Internal surface of Coupon T026-B-2 showing MT indication ................................... 48
Figure 60. Coupon T026-B-2 cut for additional examination ...................................................... 49
Figure 61. Metallographic section through crack in Coupon T026-B-2 ....................................... 50
Figure 62. Detail of flaw along crack path in Coupon T026-B-2 ................................................. 50
Figure 63. Crack surfaces, Coupon T026-B-2 after breaking open .............................................. 51
Figure 64. Coefficient of Drag ...................................................................................................... 54
Figure 65. Applied Loading on Pipe Due to River Current .......................................................... 54
Figure 66. Static Stresses Due to Spanning and Current Impingement ........................................ 55
Figure 67. Cross-flow Dynamic Response ................................................................................... 56
Figure 68. API 579 Critical Load Analysis .................................................................................. 57
LIST OF TABLES Table 1. Summary of Material Samples Received .......................................................................... 4
Table 2. Wall thickness measurements of Pipe 014 and Pipe 024 ................................................ 13
Table 3. Internal diameter measurements of Pipe 014 and Pipe 024 ............................................ 14
Table 4. Sequence of SEM Examination ...................................................................................... 22
Table 5. Summary of Microhardness Test Results ....................................................................... 39
Table 6. Brinell Hardness Measurements ..................................................................................... 39
Table 7. Longitudinal Tensile Test Results .................................................................................. 40
Table 8. Transverse Tensile Test Results ..................................................................................... 40
Table 9. Pipe Chemical Composition ........................................................................................... 41
Table 10. Girth Weld Chemical Composition .............................................................................. 42
Table 11. Pipe Body CVN Test Results........................................................................................ 43
Table 12. CTOD Test Results ....................................................................................................... 44
Table 13. CTOD Test Results by Category .................................................................................. 44
Table 14. Weight Coating Density Tests ...................................................................................... 52

Kiefner and Associates, Inc. August 2012
1
Investigation of the Silvertip-Billings Crude Oil Pipeline Failure at the Yellowstone River Crossing M.J. Rosenfeld, P.E. and W.G. Morris, P.E.
INTRODUCTION On July 1, 2011, the 12-inch Silvertip-to-Billings crude oil pipeline, operated by Exxon-Mobile Pipeline Company (EMPC), experienced a service failure at the Yellowstone River crossing. The failure occurred as a separation of the pipeline during exposure to flooding conditions. Approximately 235 ft of pipe from the crossing was removed and shipped to Kiefner & Associates, Inc. (KAI) for examination and testing in order to determine the probable cause of failure. This report presents the results and conclusions from those tests and examinations.
CONCLUSIONS The pipeline failed at a girth weld as a result of the effects of external loading that occurred due to exposure to flood conditions. The failure mechanism was fatigue crack growth adjacent to a girth weld, followed by ductile fracture of the remaining section due to tensile overload. The fatigue crack that precipitated the failure originated at the interior of the pipe adjacent to the weld root bead at the bottom of the pipe. A second, smaller fatigue crack originating adjacent to the root bead in the top quadrant of the pipe was present on the fracture surface. A fatigue crack was also discovered in the first downstream girth weld. The cracks initiated and grew by fatigue due to vortex-induced vibration (VIV) of the exposed pipe in the river current. The final fracture occurred due to tensile overload of the remaining uncracked pipe section.
The origin of the fatigue crack exhibited a minor geometric notch due to high-low and beveling of the interior edge of the pipe. There was no evidence of pre-existing welding workmanship defects (e.g., lack of fusion, slag, or porosity) or hydrogen-assisted cracking at the origin. The fit-up and deposition of the weld was of normal pipeline construction quality. There was no evidence that internal or external corrosion, stress-corrosion cracking, pipe manufacturing defects, or mechanical damage developed in service and contributed to the failure.
Analysis indicated that a wide range of water flow velocities could have induced periodic oscillation of the pipe primarily in the vertical plane, consistent with the observed positions of the fatigue cracks in the fractured weld. The position of the largest crack on the bottom quadrant suggests that the concrete coating was substantially intact at the time since the pipe would have

Kiefner and Associates, Inc. August 2012 2
been negatively buoyant. The estimated critical stress of the failed pipe section exceeded the static and dynamic stresses estimated for the effects of spanning and water flowing over the pipe, which suggested that other loads were also present. Such loads could have occurred as a result of flow water impinging on debris trapped against the pipe. The resulting load would have built up over time as additional debris accumulated.
BACKGROUND The following information was obtained from records supplied by EMPC. The Yellowstone River crossing was installed in 1991 as part of a relocation of 4,430 ft to accommodate construction of a new highway bridge in 1991 in the town of Laurel, MT. Approximately 670 ft of the relocation included the river crossing which consisted of two channels separated by a sand bar. The crossing pipe was 12.75-inch OD x 0.500-inch WT Grade B seamless pipe manufactured by US Steel. The pipe was coated with fusion-bonded epoxy (FBE) for corrosion prevention, and the girth welds were wrapped in heat-shrinkable polyethylene. The crossing pipe was coated with 1-inch concrete weight coating over the FBE and shrink-sleeves.
The river crossing was installed using the open trench method. The string of pipe was constructed on dry land. During construction, 100% of the welds made by each welder each day were inspected by radiographic testing (RT). Once the trench was prepared, the pipe string was pulled in as a single section. The installation specifications called for 72 inches minimum depth of cover below the bottom grade of the river. The Montana Soil Conservation Department required that the top 1 ft of backfill consist of boulders at least 1 foot in diameter, while the US Army Corps of Engineers’ permit specified that the top of the trench be covered with 2 ft of rock. Figure 1 is a cross section of the crossing from original construction plans.
The maximum operating pressure (MOP) of the pipe is 960 psig. The pressure at the time and location of the failure was 520 psig. On May 16-17, 1991, a hydrostatic pressure test was performed on 4,430 ft of replacement pipe for 8 hours at a minimum pressure 1,885 psig. On May 26, 1992, a hydrostatic pressure test was performed from Rock Creek to the Yellowstone River, including the crossing, for 8 hours at a minimum pressure of 1,225 psig.
The total length of pipe exposed by the flood was 207 ft. The failure occurred in the wider south channel, approximately 51 ft from the south bank.

Kiefner and Associates, Inc. August 2012 3
Figure 1. River Crossing Profile
METALLURGICAL INVESTIGATION The investigation was performed by Kiefner & Associates, Inc. according to a protocol that was developed with input from the affected stakeholders. The stakeholders included:
1. The State of Montana, represented at the investigation by Mr. David Blurton,
2. The Pipeline and Hazardous Materials Safety Administration (PHMSA) represented at the investigation by Mr. Joshua Johnson,
3. ExxonMobil, represented at the investigation by Mr. Wade Sharp.
The metallurgical investigation was performed by Kiefner & Associates, Inc. according to a protocol that was developed with input from all of the affected stakeholders. The on-site investigation began on May 7, 2012.
Protocol The complete investigation protocol is presented in Appendix 1. The protocol included the following primary investigation phases:
1. Visual Examination 2. Clean Specimen 3. Non-destructive Examination 4. Fractographic Examination 5. Metallographic Examination

Kiefner and Associates, Inc. August 2012 4
6. Materials Testing Each investigation phase is described in more detail below.
Visual Examination The investigation involved examination and testing of several samples of 12.75-in OD line pipe and several samples of concrete that were removed from the failure site. Metal identification tags were attached to each sample in the field. The tag numbers are identification numbers. Pipe samples were received on several different dates as shown in Table 1 below. The pipe deliveries were videotaped. Refer to the attached electronic storage for the videotaped material. Photographs of the deliveries, scans of the chain-of-custody forms, driver’s licenses of the truck drivers, and other related information are also included in Appendix 2.
Table 1. Summary of Material Samples Received
Tag No. Date Received Description (lengths are approximate) 012 Nov. 11, 2011 Concrete, 1 pc, approx. 2 ft x 2 ft x 0.5 ft 013 Nov. 11, 2011 Pipe, 38 inches long 014 Nov. 11, 2011 Pipe, 45 ft long, fractured end and first upstream girth weld 015 Nov. 11, 2011 Pipe, 8 ft long, concrete coated 016-019 Nov. 22, 2011 Concrete pieces, various sizes 022, 023 Nov. 22, 2011 Concrete pieces, various sizes 024 Nov. 22, 2011 Pipe, 16 ft long, fractured end 026 Dec. 12, 2011 Pipe, 45 ft long, first downstream girth weld 027 Dec. 12, 2011 Pipe, 45 ft long, girth weld 029 Dec. 16, 2011 Pipe, 42 ft long, curved, girth weld 030 Dec. 16, 2011 Pipe, 32 ft long, concrete coated, exemplar girth weld
The pipe samples as received are shown in Figure 2 below. The failure occurred at a girth weld joining Pipe 014 (Tag 014) and Pipe 024 (Tag 024). These two pipe samples arrived with the fractured ends covered with a heavy fabric tarp that was held in place with ratchet straps. The wrapping was removed from piece 024 to remove a rubber bladder that had been installed in the field during the removal process. The bladder had been frozen in place prior to shipment and KAI was requested to extract the bladder and return it to the field site. The removal of the bladder was also video recorded. Other than this activity, the pipe ends were not disturbed until the examination began on May 7. Select photographs from the investigation are presented below. All photographs taken during the investigation are presented in Appendix 4.

Kiefner and Associates, Inc. August 2012 5
Figure 2. Pipe samples in as-received condition
Figure 3. Fractured end of Pipe 014 as received
Pipe 014 Pipe 024
Pipe 030 Pipe 027
Pipe 026
Pipe 029

Kiefner and Associates, Inc. August 2012 6
Pipe Exterior The investigation began with an examination of Pipe 014 and Pipe 024 which each contained a portion of the failed girth weld. The overall lengths of the samples were as follows:
• Pipe 014 measured approximately 45 feet 5 inches long from the cut end to the failed girth weld end. The pipe contained an intact girth weld 41.5 inches from the cut end, and a 26-inch-long intact cylinder of concrete weight coating 12 inches from the failed girth weld end.
• Pipe 024 measured 16 feet long from the cut end to the failed girth weld.
Both pipe samples were coated with red fusion-bonded epoxy (FBE) coating that had apparently been worn away to bare metal over large areas along the length of the pipe samples. For example, there were two bare areas on Pipe 024 that spanned the full length of the sample and measured 11 to 16 inches wide, separated by a strip of intact coating that measured 24 to 29 inches wide. Figure 4 shows a typical area of eroded coating on Pipe 024. Debris was impacted under the edges of the intact coating, as shown in Figure 5.
Figure 4. Area of coating erosion on Pipe 024

Kiefner and Associates, Inc. August 2012 7
Figure 5. Debris impacted under edge of intact coating
At the ends of both pipe samples (i.e., Pipe 014 and Pipe 024) the FBE was covered with a black residue that appeared to be the remnants of a shrink-sleeve.
The bare steel surfaces were covered with numerous white colored elongated objects, each approximately 1/8 to 1/2 inch long, that appeared to be the remains of some type of fresh-water biota presenting worm-like or tube-like features emanating from adhered masses. We were unable to identify the species. The remains of the organisms (“worms”) were present in prolific quantities on most pipe exterior surfaces where the coating was absent, some interior surfaces, and the fracture surfaces of the failed girth weld. The adhered organisms are shown in Figure 6 through Figure 8 on the pipe exterior. The pipe surface was pitted underneath the individual masses associated with the organisms, as shown in Figure 9.

Kiefner and Associates, Inc. August 2012 8
Figure 6. Organisms on Surface of Pipe 024
Figure 7. Detail of organisms on surface of Pipe 024

Kiefner and Associates, Inc. August 2012 9
Figure 8. Detail of organisms on pipe surface
Figure 9. Corrosion under biotic mass

Kiefner and Associates, Inc. August 2012 10
Pipe Interior The protocol called for examining the interior surface of Pipe 014 and Pipe 024 near the fracture. The interior of the pipe was bare and was covered in a layer of orange-colored film, likely a surface rust from exposure to water and air, visible in Figure 10 as observed typically. The interior pipe surfaces exhibited light surface pitting, similar to the pitting observed on the exterior surface of the pipe where the coating had been removed. The metal loss was superficial in depth.
Figure 10. Internal surface of Pipe 024

Kiefner and Associates, Inc. August 2012 11
Figure 11. Interior Surface Pitting
The Fracture The failure occurred as a circumferential fracture in and adjacent to the girth weld joining Pipe 014 and Pipe 024. The fracture propagated in the girth weld for a distance of approximately 28 inches and in the adjacent pipe (Pipe 014) for a distance of approximately 12 inches. The fracture is shown in Figure 12 through Figure 14. The markings visible in the figures indicate the orientation of the pipe in service. The positioning in Figure 14 is approximately the same as in service.

Kiefner and Associates, Inc. August 2012 12
Figure 12. Fractured end of Pipe 024
Figure 13.Fractured end of Pipe 014

Kiefner and Associates, Inc. August 2012 13
Figure 14. Fractured ends of the pipe aligned
Non-destructive Examination The diameters and wall thicknesses of the pipe samples were measured at a number of different positions around the circumference of each end. The wall thickness was measured with a micrometer. The measurements, listed in Table 2 below, met the dimensional requirements of API 5L.
Table 2. Wall thickness measurements of Pipe 014 and Pipe 024
Position Pipe 014 Pipe 024 US DS US DS
12:00 0.494 0.520 0.498 0.530 1:30 0.503 0.522 0.527 0.534 3:00 0.511 0.496 0.554 0.529 4:30 0.518 0.503 0.548 0.517 6:00 0.507 0.480 0.523 0.498 7:30 0.493 0.466 0.480 0.502 9:00 0.492 0.493 0.467 0.505 10:30 0.503 0.495 0.479 0.524
The internal diameter measurements of the fractured ends of the pipe were made with a scissor-type caliper gage, whereas the measurements of the cut ends were made with a digital caliper.
Pipe 014 Pipe 024

Kiefner and Associates, Inc. August 2012 14
The diameter measurements are listed in Table 3. API 5L does not give dimensional tolerances on the inside diameter.
Table 3. Internal diameter measurements of Pipe 014 and Pipe 024
Position Pipe 014 Pipe 024 US DS US DS
12:00 11.791 11.768 11.726 11.729 1:30 11.777 11.684 11.596 11.725 3:00 11.699 11.617 11.642 11.715 4:30 11.740 11.767 11.730 11.714
The ends of Pipe 014 and Pipe 024 were examined adjacent to the fracture with magnetic particle testing (MT) where the steel was bare. To prepare the exterior portions of the pipe ends for MT, portions of the black girth weld coating (which appeared to be the remnants of a shrink sleeve) were removed by cutting through them with a utility knife and peeling the coating off of the bare pipe steel at the FBE-cutback area of both pipes. No attempt was made to remove the intact FBE coating beneath the black girth weld coating. The pipe was cleaned with naphtha to remove any remaining adhesive that still clung to pipe surface. The ends were inspected inside and out first with dry MT. The ends were then coated with white contrast paint and were inspected by a wet, black on white contrast MT method. Several features were found on the external surface of both pipe ends. The features were oriented longitudinally and measured less than 1/8-inch long. Several typical features are shown in Figure 15. The features were not located adjacent to the fracture surface, were not of a significant length, and resembled artifacts of pipe manufacturing, and therefore were not evaluated further at the time of the investigation.

Kiefner and Associates, Inc. August 2012 15
Figure 15. Magnetic Particle Examination Surface Features
The exemplar girth welds, the intact girth welds in Pipe 014, Pipe 026, and Pipe 030, were inspected by radiographic testing (RT). To expose the girth welds for RT, the concrete coating was removed from the girth weld on Pipe 30 using a circular saw equipped with a masonry cutting blade. The remnants of the concrete were preserved. The shrink sleeve coating material wrapped around each weld was removed by scoring the coating with a utility knife and a combination of peeling and scraping the coating from the pipe and FBE surfaces using a putty knife and pliers. The adhesive residue was removed by scrubbing the surfaces with naphtha.
The exemplar girth welds were radiographed to determine whether gross welding workmanship defects or other cracks were present. Minor imperfections were identified in all three welds. The weld from Pipe 026 was deemed not in compliance with API 1104 (17th Edition) due to burn-through, inadequate penetration, slag inclusions, and internal undercutting. No cracks were called out. The radiographer’s report is included in Appendix 3. Subsequently, the CTOD testing revealed a fatigue crack at the side position of Weld 026. Evidently the indication of the crack was interpreted by the radiographer as internal undercut adjacent to the root bead.
Figure 16 shows the burn-through feature in Weld 026. Figure 17 shows inadequate penetration in Weld 030. Minor interior beveling is shown in these views as well. Figure 18 exhibits the minor high-low across Weld 030, typical also of the failed weld.

Kiefner and Associates, Inc. August 2012 16
Figure 16. Burn-through Feature, Weld 026
Figure 17. Inadequate Penetration Feature, Weld 030

Kiefner and Associates, Inc. August 2012 17
Figure 18. Fit-up Across Weld 030
Fractographic Examination The fracture surfaces were reported to have been coated with a protective film in the field after the samples were extracted from the river. The surfaces indeed appeared to be coated with some type of film because the color of the surfaces was darker than is typical for iron-oxide on steel and the surface had a slight glossy appearance that was evident in the photographs of the fractures. The fracture surfaces also contained the biotic masses noted on the external surfaces of the pipe.
The fracture surfaces were cut from the parent pipe samples in stages. A short pup containing the fracture was cut from the longer pipe with a plasma torch. Hot cuts, such as those made with a plasma torch, were kept a minimum of 12 inches away from the fracture surfaces. The pups were put on a band saw to cut out the fracture surfaces. The resultant rings of pipe containing the fracture surfaces are shown in Figure 19 through Figure 21.
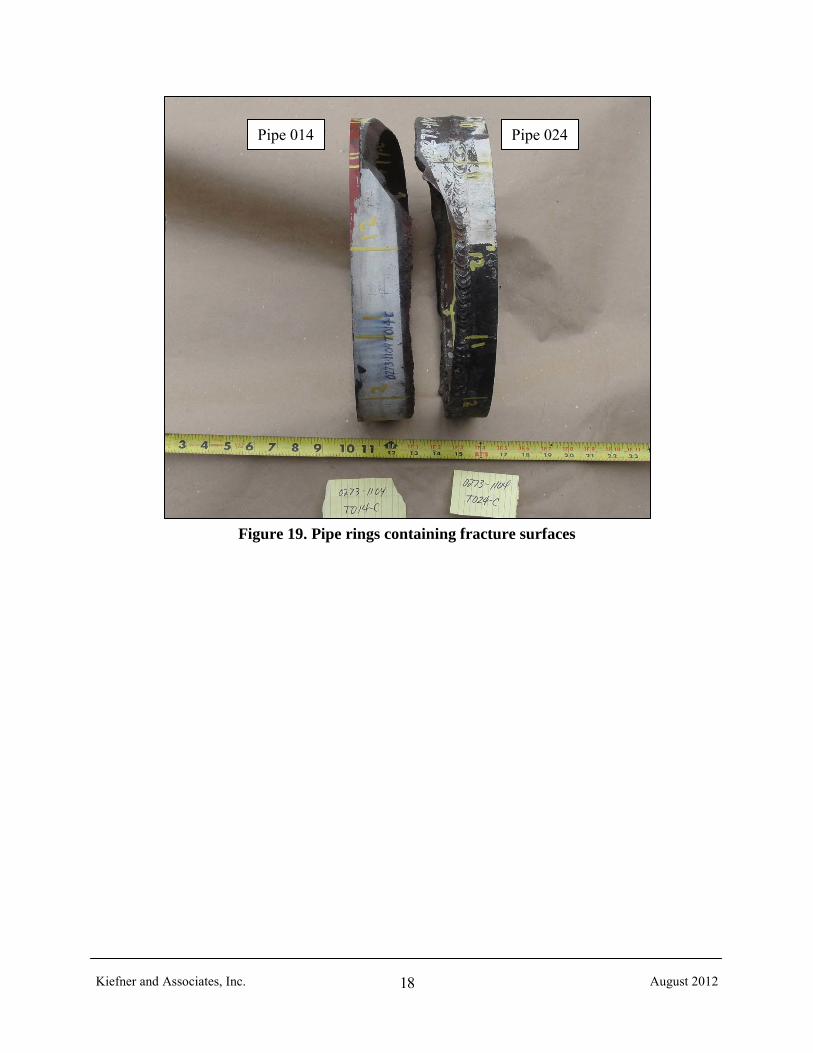
Kiefner and Associates, Inc. August 2012 18
Figure 19. Pipe rings containing fracture surfaces
Pipe 014 Pipe 024
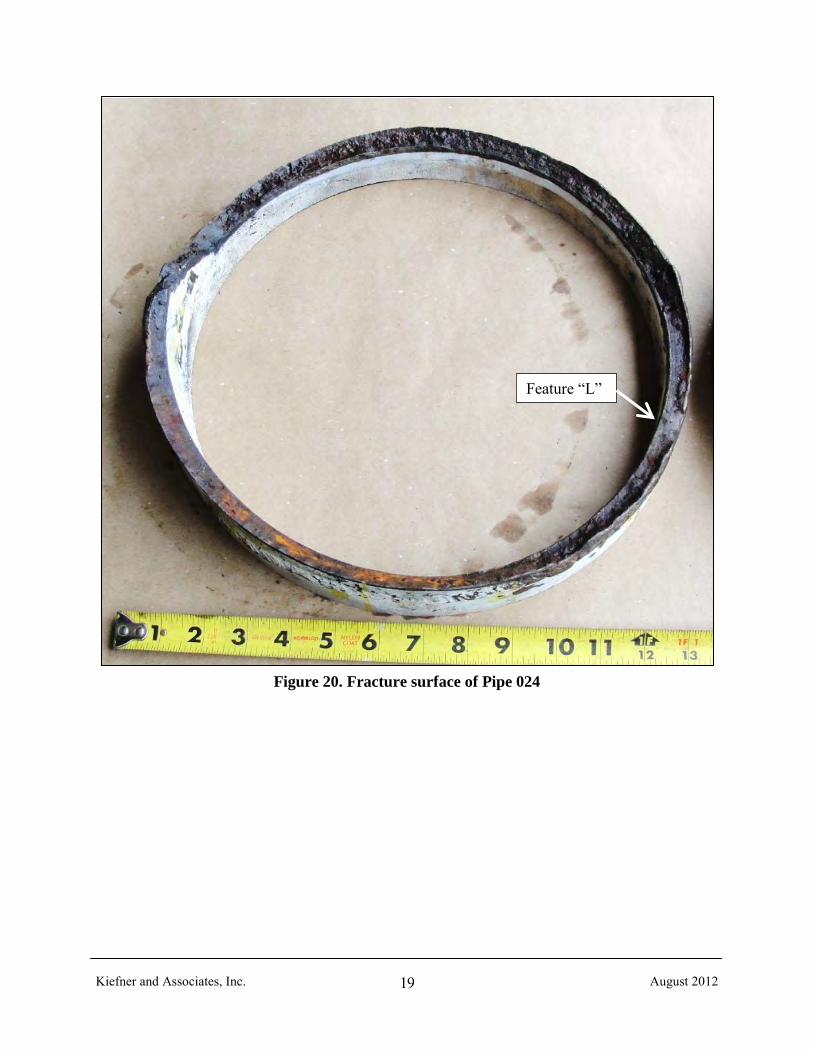
Kiefner and Associates, Inc. August 2012 19
Figure 20. Fracture surface of Pipe 024
Feature “L”

Kiefner and Associates, Inc. August 2012 20
Figure 21. Fracture surface of Pipe 014
The fracture surfaces were examined visually and with an optical microscope. The fracture appeared to propagate in the girth weld for a distance of approximately 28 inches and in the pipe base metal for a distance of 12 inches. The portion of the fracture that propagated in the pipe exhibited a ductile, 45 degree slant fracture appearance. The appearance of the portion of the fracture that propagated in the girth weld was ductile along the outer portion of the wall thickness, near the girth weld cap. The balance of the propagating fracture surface was too obscured by the biota masses, protective coating, and corrosion to determine the mode of fracture.
Feature “S”

Kiefner and Associates, Inc. August 2012 21
Two areas of relatively flat fracture were present on the fracture surfaces. The areas were not in equal condition, such that one feature was more visible on one side of the fracture, and the other feature was more visible on the opposite side. The larger of the two features, labeled feature “L”, is shown in Figure 20 and measured 10.5 inches long on the interior pipe surface. This feature was through-thickness near the mid-length. The smaller of the two features, labeled feature “S” is shown in Figure 21 and measured 3.1 inches long by approximately 70% of the wall thickness in depth.
Figure 22. Fracture surface of Pipe 014 showing Feature “S”
Figure 23. Fracture surface of Pipe 024 showing Feature “L”
One of the fracture surfaces (Pipe 024) was cleaned with a dilute solution of Alconox, a non-oxidizing detergent, and room temperature tap water. The cleaning solution had little to no effect on the fracture surfaces because of the protective coating applied to preserve them. The fracture surface (again Pipe 024) was cleaned with a nylon brush and a solvent (naphtha). After the

Kiefner and Associates, Inc. August 2012 22
surface was cleaned with naphtha to remove the protective coating, the surface was cleaned in the solution of Alconox and room temperature tap water. After several minutes of scrubbing, the sample was dried with compressed air and photographed.
Coupons containing Feature S and a portion of Feature L were cut from the fracture rings for examination in the scanning electron microscope (SEM). A coupon containing the entire length of Feature L would not fit in the SEM chamber, so it was cut approximately in half. Initially, the Feature L was labeled as 1 and 2 to designate each half of the feature length; however, later the labels were changed to indicate which pipe the samples came from. The coupons were examined in two different SEM sessions, as indicated in Table 4 below.
Table 4. Sequence of SEM Examination
Specimen Pipe Coupon SEM Exam Sequence S1 T014 T014-C-1 1 L T024 T024-C-2 1 S T024 T024-C-1 2
L1 T014 T014-C-2 2
The initial examination included coupons T014-C-1, Feature S from Pipe 014, and T024-C-2, Feature L from Pipe 024. These coupons were taken to the SEM laboratory for further cleaning and examination in the SEM. The coupons were cleaned in a solution of Alconox and water in an ultrasonic cleaner. The solution was changed frequently as it became dirty with the debris from the sample. The sample was cleaned for over an hour in this manner. Later, coupons T014-C-2 and T024-C-1 were cleaned in the same manner and examined on the SEM.
Figure 25 shows coupons T014-C-2 and T014-C-1, specimens L1 and S1 respectively, after cleaning. Bright pitted areas were present under each organism that was removed. The fracture surfaces of specimens S1 and L1 are shown in detail as they appear post-cleaning in Figure 26 and Figure 27, respectively.

Kiefner and Associates, Inc. August 2012 23
Figure 24. T024-C showing location of features S and L
Figure 25. Specimens S1 and L1 after Cleaning
Figure 26. Fracture surface after cleaning with naphtha and Alconox (T014-C-1)
Sample L
Sample S
T014-C-2 Specimen L1
T014-C-1 Specimen S1

Kiefner and Associates, Inc. August 2012 24
Figure 27. Fracture surface after cleaning with naphtha and Alconox (T014-C-2)
The samples were examined in an optical microscope after cleaning. The original fracture surface had a medium brown color. After cleaning, small light gray areas were visible. These light gray areas exhibited evidence of pitting when viewed on an optical microscope. A detail of pitting adjacent to the flat feature on specimen S1 is shown in Figure 28.
Figure 28. Detail of Pitting Under Biotic Adherent
SEM Examination Features S1 and L1 from T014-C-1 were examined in the scanning electron microscope (SEM) to study the fine features of the fracture surface in order to confirm the mode of fracture. Selected SEM photos are discussed in the following section. A photo log and all of the SEM photos are found in Appendix 5.

Kiefner and Associates, Inc. August 2012 25
A detail of the origin region of the flat feature S1 is shown in Figure 29. Radial fracture features are prominently visible. Figure 30 shows the surface of the flat region at midwall. It appears to be corroded and covered with adherent deposit. Figure 31 shows the outer edge of the flat feature. A striated or banded feature is prominently visible. Pitting is visible above the banded feature. Figure 32 and Figure 33 show details of the banded feature at higher magnification. Figure 34 and Figure 35 present an elemental analysis using energy-dispersive spectroscopy (EDS) of the dark and light regions in the banded feature. The EDS analysis shows that the dark bands are a foreign deposit consisting primarily of calcium (Ca), silicon (Si), and oxygen (O). The regions between the dark bands are primarily iron (Fe) with traces of oxide. Figure 36 is a detail of the pitted region above the banded feature. Figure 37 is a detail of the surface within the pit, showing primarily etched surface. An EDS analysis shows the pit surface to be exposed metal with no deposits, Figure 38.
Figure 29. SEM Image, Feature S1, Origin (13X)

Kiefner and Associates, Inc. August 2012 26
Figure 30. SEM Image, Feature S1, Midwall
Figure 31. SEM Image, Feature S1, Region Above Flat Feature

Kiefner and Associates, Inc. August 2012 27
Figure 32. SEM Image, Feature S1, Edge of Flat Feature
Figure 33. Detail of Banded Region at Edge of Flat Feature

Kiefner and Associates, Inc. August 2012 28
Figure 34. EDS Analysis of Dark Band Material
Figure 35. EDS Analysis Between Dark Bands

Kiefner and Associates, Inc. August 2012 29
Figure 36. SEM Image, Pitting on Flat Feature
Figure 37. SEM Image, Surface of Pitted Area

Kiefner and Associates, Inc. August 2012 30
Figure 38. EDS Analysis, Pitted Surface
Specimen L1 was also examined in the SEM. Its surface was in worse condition than Specimen S1 and yielded virtually no information about fracture modes. Traces of biotic residue were plentiful, e.g. Figure 39, typical. Figure 40 and Figure 41 show details of this feature in backscatter and normal modes. Figure 42 presents an EDS analysis of the feature.
Figure 39. SEM Image, Specimen L1, Thumbnail Near Pipe ID

Kiefner and Associates, Inc. August 2012 31
Figure 40. SEM Image, Detail of Banded Feature, Backscatter Mode
Figure 41. SEM Image, Detail of Banded Feature, Normal Mode

Kiefner and Associates, Inc. August 2012 32
Figure 42. EDS Analysis of Banded Feature
The SEM examination was unable to confirm a mode of crack growth and fracture, due to the corroded surfaces. Significant pitting occurred under regions where biotic species had adhered to the steel. The pitted surfaces were severely etched, suggesting a low-pH environment.
Metallographic Examination Metallographic sections were made through the Feature S and two locations through Feature L (near the end of the SEM sample and in the portion of the feature that was through-wall). Each section mated the halves of the fracture. The metallographic section through Feature S included matched portions of specimen S and specimen S1, and similarly for each section through Feature L. The locations from which the metallographic specimens were taken from pieces T014-C and T024-C are shown below in Figure 43 through Figure 49.
Figure 43. Location of metallographic section through feature S in sample T014-C-1.2

Kiefner and Associates, Inc. August 2012 33
Figure 44. Location of metallographic section through feature S in sample T024-C-1.1
Figure 45. Location of metallographic sections through feature L

Kiefner and Associates, Inc. August 2012 34
Figure 46. Location of metallographic section through feature L (T014-C-2)
Figure 47. Location of metallographic section through feature L (T024-C-2)

Kiefner and Associates, Inc. August 2012 35
Figure 48. Location of metallographic section in through-wall portion of feature L
Figure 49. Location of metallographic section through shear portion of fracture
The metallographic section through Feature S is shown in Figure 50. The feature, a crack, is seen to initiate at the toe of the root pass and propagate into the weld metal. The crack is relatively flat and straight (radial) through about 75% of the pipe wall thickness, and exhibits ductile shear fracture in the remaining 25% of the wall thickness.

Kiefner and Associates, Inc. August 2012 36
Figure 50. Metallographic section through Feature S
The metallographic section through Feature L, Figure 51, shows approximately the same morphology. The feature, a crack, initiated at the toe of the root pass and propagated relatively flat and straight through approximately 80% of the deposited girth weld metal thickness before exhibiting ductile shear fracture in the outer 20% of the weld thickness.
The second metallographic section through Feature L, shown in Figure 52, was taken where the feature propagated completely through the weld thickness. In this section, the crack is seen to propagate flat and straight through the weld metal. The metal on the left hand side of the figure shows evidence of damage near the surfaces and metal loss due to corrosion near mid-wall. However, the metal on the right hand side of the figure appears to be unaffected by such damage.

Kiefner and Associates, Inc. August 2012 37
Figure 51. Metallographic section through Feature L
Figure 52. Metallographic section through Feature L (at through thickness location)
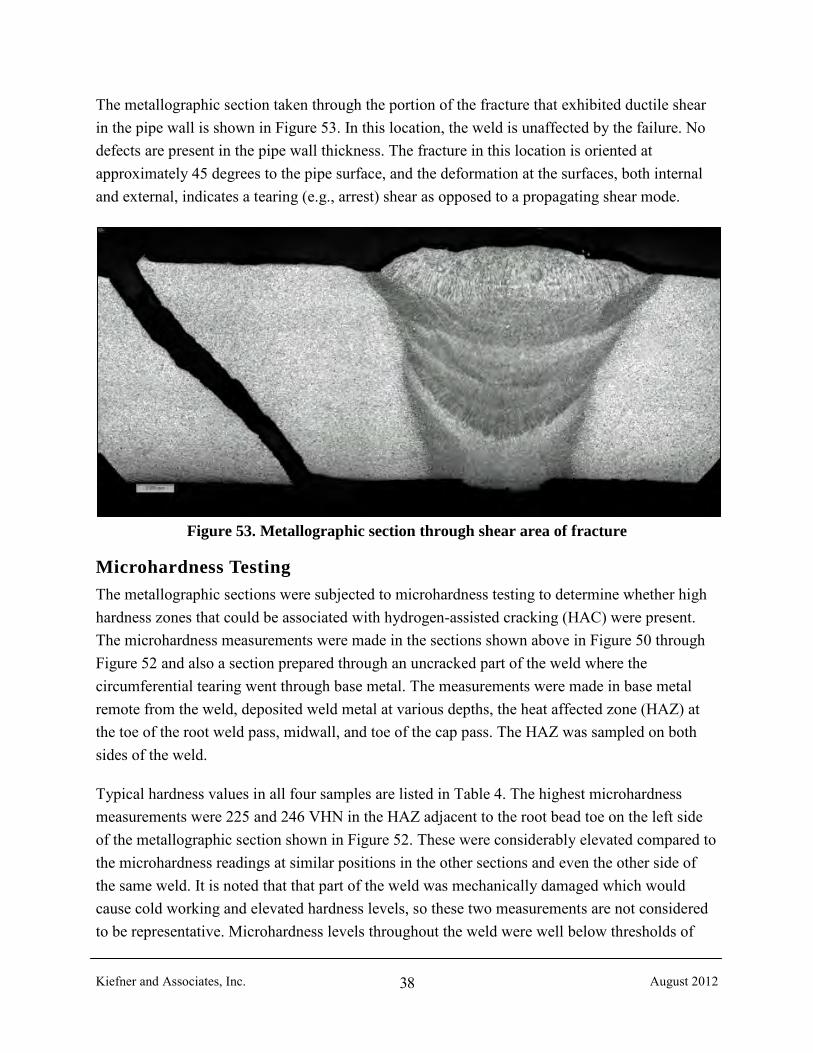
Kiefner and Associates, Inc. August 2012 38
The metallographic section taken through the portion of the fracture that exhibited ductile shear in the pipe wall is shown in Figure 53. In this location, the weld is unaffected by the failure. No defects are present in the pipe wall thickness. The fracture in this location is oriented at approximately 45 degrees to the pipe surface, and the deformation at the surfaces, both internal and external, indicates a tearing (e.g., arrest) shear as opposed to a propagating shear mode.
Figure 53. Metallographic section through shear area of fracture
Microhardness Testing The metallographic sections were subjected to microhardness testing to determine whether high hardness zones that could be associated with hydrogen-assisted cracking (HAC) were present. The microhardness measurements were made in the sections shown above in Figure 50 through Figure 52 and also a section prepared through an uncracked part of the weld where the circumferential tearing went through base metal. The measurements were made in base metal remote from the weld, deposited weld metal at various depths, the heat affected zone (HAZ) at the toe of the root weld pass, midwall, and toe of the cap pass. The HAZ was sampled on both sides of the weld.
Typical hardness values in all four samples are listed in Table 4. The highest microhardness measurements were 225 and 246 VHN in the HAZ adjacent to the root bead toe on the left side of the metallographic section shown in Figure 52. These were considerably elevated compared to the microhardness readings at similar positions in the other sections and even the other side of the same weld. It is noted that that part of the weld was mechanically damaged which would cause cold working and elevated hardness levels, so these two measurements are not considered to be representative. Microhardness levels throughout the weld were well below thresholds of

Kiefner and Associates, Inc. August 2012 39
hardness that are generally considered to indicate high susceptibility to HAC (above 350 VHN in plain carbon steel or above 290 VHN in HSLA steel).
Table 5. Summary of Microhardness Test Results
Region Microhardness range, VHN Base metal remote from weld 140-190 Deposited weld metal 140-210 HAZ, root bead toe 170-200 HAZ, midwall 160-190 HAZ, weld cap toe 180-240
Pipe Properties Testing A coupon of material was cut from Pipe 014 and Pipe 024 for obtaining specimens for testing the properties of the pipe as described below.
Brinell Hardness Test The harness of each pipe was measured with a Brinell hardness tester using a 1/16-in diameter steel indenter and a 3,000 kg load. The primary purpose of the Brinell testing was to verify that standard sized tensile coupons would be within the capacity of the tensile test equipment. The results are presented in Table 5. The cross-sectional area of the gage length of each tensile specimen was approximately 1.5-in wide by 0.439 to 0.504-in thick, or 0.66 to 0.76 square inches. The estimated tensile strengths of the specimens ranged from 79 to 84 ksi, resulting in an estimated total load of 55,000 lbs to 59,000 lbs (55 to 59 kips). The capacity of the tensile tester was 60 kips.
Table 6. Brinell Hardness Measurements
Brinell Hardness Numbers / Average (BHN)
Estimated Tensile Strength, psi
Pipe 014 159, 163, 163, 167 / 163 79,000 Pipe 024 163, 167, 159, 163 / 163 79,000 Pipe 030 163, 159, 179, 183 / 171 84,000
Pipe Strength The strength of both pipe specimens was determined by testing both a longitudinal and a transverse tensile strap removed from each pipe. The results of the longitudinal tensile tests are presented in Table 6. The results of the transverse tensile tests are presented in Table 7. The results were compared to the 39th Edition of API Specification 5L, the edition that was in effect

Kiefner and Associates, Inc. August 2012 40
at the time the pipeline was reported to have been constructed. The tensile test results met the strength requirements of API 5L for Grade B line pipe.
Table 7. Longitudinal Tensile Test Results
Yield Strength, psi (0.5 EUL Method)
Tensile Strength, psi Elongation, %
Pipe 014 44,700 72,500 42.4 Pipe 024 44,100 72,500 45.2 Pipe 030 45,600 73,000 42.8 API 5L 35,000 min 60,000 min 29.5 min
Table 8. Transverse Tensile Test Results
Yield Strength, psi (0.5 EUL Method)
Tensile Strength, psi Elongation, %
Pipe 014 47,900 73,000 39.3 Pipe 024 48,300 70,500 32.6 Pipe 030 50,500 74,000 42.6 API 5L 35,000 min 60,000 min 29.5 min
Chemistry Analysis The chemical composition of the base metal of three pipe samples 014, 024, and 030, and the chemical composition of the deposited weld metal in the fractured girth weld (from Pipe 024) were determined by optical emission spectroscopy (OES). The results from the base metal tests are presented in Table 8. The results met the requirements for Grade B seamless line pipe in the 39th Edition of API 5L. The computed carbon equivalent levels using the IIW formula ranged from 0.32 to 0.38%, were below the levels considered highly susceptible to HAC.
The results of the deposited weld metal test are presented in Table 9. The weld metal met the requirements in AWS 5.5-96 for E7010-P1 welding consumable, and conformed to typical deposited weld chemistry reported by Lincoln Electric, a manufacturer of welding electrodes widely used in pipeline construction.

Kiefner and Associates, Inc. August 2012 41
Table 9. Pipe Chemical Composition
Content (weight percent) Pipe 014 Pipe 024 Pipe 030
API 5L1 Grade B
Carbon 0.202 0.216 0.216 0.27 max Manganese 0.655 0.653 0.655 1.15 max Phosphorus 0.007 0.007 0.007 0.03 max Sulfur 0.006 0.007 0.007 0.03 max Silicon 0.223 0.223 0.224 --- Copper 0.015 0.015 0.015 --- Tin 0.001 0.000 0.001 --- Nickel 0.022 0.022 0.022 --- Chromium 0.038 0.040 0.038 --- Molybdenum 0.013 0.013 0.013 --- Aluminum 0.021 0.019 0.020 --- Vanadium 0.000 0.000 0.000 --- Niobium 0.001 0.001 0.001 --- Zirconium 0.000 0.000 0.000 --- Titanium 0.002 0.002 0.002 --- Boron 0.0001 0.0001 0.0001 --- Calcium 0.0016 0.0016 0.0017 --- Cobalt 0.005 0.005 0.006 --- CEIIW 0.324 0.338 0.338 --- CEPcm 0.247 0.261 0.261 --- 1API Specification 5L, 40th Edition, Nov 1992 for seamless Grade B pipe 2API Specification 5L, 39th Edition, Jun 1991 for seamless Grade B pipe (P=0.04max, S=0.05max)
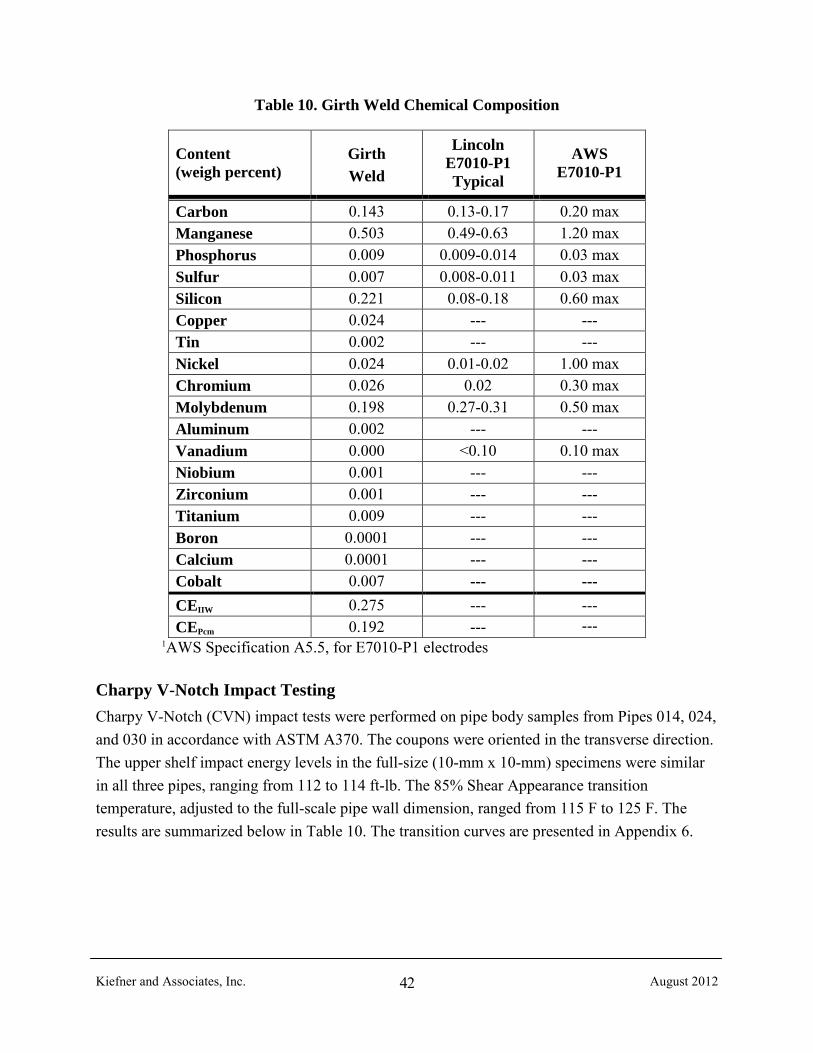
Kiefner and Associates, Inc. August 2012 42
Table 10. Girth Weld Chemical Composition
Content (weigh percent)
Girth Weld
Lincoln E7010-P1 Typical
AWS E7010-P1
Carbon 0.143 0.13-0.17 0.20 max Manganese 0.503 0.49-0.63 1.20 max Phosphorus 0.009 0.009-0.014 0.03 max Sulfur 0.007 0.008-0.011 0.03 max Silicon 0.221 0.08-0.18 0.60 max Copper 0.024 --- --- Tin 0.002 --- --- Nickel 0.024 0.01-0.02 1.00 max Chromium 0.026 0.02 0.30 max Molybdenum 0.198 0.27-0.31 0.50 max Aluminum 0.002 --- --- Vanadium 0.000 <0.10 0.10 max Niobium 0.001 --- --- Zirconium 0.001 --- --- Titanium 0.009 --- --- Boron 0.0001 --- --- Calcium 0.0001 --- --- Cobalt 0.007 --- --- CEIIW 0.275 --- --- CEPcm 0.192 --- ---
1AWS Specification A5.5, for E7010-P1 electrodes Charpy V-Notch Impact Testing Charpy V-Notch (CVN) impact tests were performed on pipe body samples from Pipes 014, 024, and 030 in accordance with ASTM A370. The coupons were oriented in the transverse direction. The upper shelf impact energy levels in the full-size (10-mm x 10-mm) specimens were similar in all three pipes, ranging from 112 to 114 ft-lb. The 85% Shear Appearance transition temperature, adjusted to the full-scale pipe wall dimension, ranged from 115 F to 125 F. The results are summarized below in Table 10. The transition curves are presented in Appendix 6.

Kiefner and Associates, Inc. August 2012 43
Table 11. Pipe Body CVN Test Results
Property Pipe 014 Pipe 024 Pipe 030
Pipe Wall Thickness 0.504 in 0.516 in 0.531 in Average Charpy Specimen Width 0.394 in 0.394 in 0.395 in Test Specimen Upper Shelf Energy 114 ft-lb 112 ft-lb 113 ft-lb Full Size Equivalent Upper Shelf Energy 114 ft-lb 112 ft-lb 113 ft-lb CVN Specimen Transition Temperature 115 F 125 F 120 F Full Pipe Wall Thickness* Transition Temperature 115 F 125 F 120 F
Shear Area Evaluation Method Measurement Weld CTOD Testing Crack-tip opening displacement (CTOD) tests were performed on intact girth welds removed from Pipes 014, 026, and 030. The CTOD test measures the resistance of the material to fracture initiation, which is an indication of the ductility of the weld. The CTOD results are used in girth weld fracture mechanics analyses to determine the critical axial load that could result in weld failure.
The CTOD tests in each weld were performed in deposited weld metal (WM) and heat-affected zone (HAZ) at the top, side, and bottom positions in accordance with the requirements of API 1104, Appendix A, with reference to BS 7910. CTOD tests are usually performed at the minimum expected service temperature. In this case, the tests were performed at a temperature of 50 F, coinciding with the temperature of the river water that the pipe was exposed to during the flood.
The results of the CTOD tests are given in Table 11 and Table 12. The CTOD test reports are presented in Appendix 7. The CTOD results were similar in WM and HAZ samples, and did not vary greatly among the three welds. The mean value was 0.013 inch with a standard deviation of 0.0028 inch. The minimum and maximum single observed CTOD were 0.006 and 0.020 inch, respectively, corresponding to the mean plus or minus 2.5 standard deviations (approximately). The distribution of observed CTOD appears to be normally distributed, as shown in Figure 54. All observed CTOD measurements were in the ductile range.

Kiefner and Associates, Inc. August 2012 44
Table 12. CTOD Test Results
Weld Specimen Clock Position Location CTOD, in. 14 14-12-1 12:00 Top HAZ 0.016 14 14-12-2 12:00 Top WM 0.013 14 14-3-1 3:00 Side WM 0.011 14 14-3-2 3:00 Side HAZ 0.013 14 14-6-1 6:00 Bottom WM 0.014 14 14-6-2 6:00 Bottom HAZ 0.014 26 26-12-1 12:00 Top HAZ 0.012 26 26-12-2 12:00 Top WM 0.013 26 26-3-1 3:00 Side WM 0.012 26 26-9-1 9:00 Side HAZ 0.010 26 26-6-1 6:00 Bottom WM 0.011 26 26-6-2 6:00 Bottom HAZ 0.020 30 30-12-1 12:00 Top HAZ 0.006 30 30-12-2 12:00 Top WM 0.012 30 30-3-1 3:00 Side HAZ 0.014 30 30-3-2 3:00 Side WM 0.014 30 30-6-1 6:00 Bottom WM 0.013 30 30-6-2 6:00 Bottom HAZ 0.014
Table 13. CTOD Test Results by Category
Category Mean CTOD, in. Standard Deviation All tests 0.0129 0.00278
Weld 014, all 0.0135 0.00164 Weld 026, all 0.0130 0.00358 Weld 030, all 0.0122 0.00313
All weld metal 0.0126 0.00113 All HAZ 0.0132 0.00387 All top 0.0143 0.00301 All side 0.0123 0.00163
All bottom 0.0120 0.00329

Kiefner and Associates, Inc. August 2012 45
Figure 54. Distribution of CTOD Measurements
CTOD Specimen Crack During machining of the CTOD test specimens, a crack was detected in the sample from the side position of Weld 026. The crack covered most of the cross-sectional area of the CTOD test specimen which caused the sample to break in half during machining. A replacement CTOD specimen was prepared from weld material on the opposite side of the pipe. The cracked CTOD specimen was retrieved for further examination.
The surface of the crack in the CTOD specimen is shown in Figure 55. The crack surface is relatively smooth and flat and exhibited characteristics similar to features S and L in the failed girth weld. Weld 26 was exposed during the flooding event but remained intact during the failure.
Figure 55. Crack surface of Weld 026 CTOD specimen
A portion of the CTOD specimen containing the crack surface was cut off to facilitate examination in the SEM. The surface was cleaned in an ultrasonic cleaner in a solution of Alconox and water. The surface exhibited features similar to those of feature S, including surface corrosion damage. Figure 56 shows an overview of the cracked surface of the CTOD sample. No
ID
OD

Kiefner and Associates, Inc. August 2012 46
weld defect was present on the surfaces. The upper left corner of the specimen was the intact portion that broke during machining. Figure 57 shows the leading edge of the crack near this corner at 100X magnification. A detail of this area is shown in Figure 58. The fracture surface shows evidence of corrosion damage even in the part of the crack that would have been expected to be tight and most protected from corrosion damage.
Figure 56. Overview of Cracked CTOD Specimen Viewed on SEM

Kiefner and Associates, Inc. August 2012 47
Figure 57. Edge of fracture surface near intact corner
Figure 58. Detail of edge of fracture surface near intact corner

Kiefner and Associates, Inc. August 2012 48
The remaining material coupon adjacent to the location where the CTOD specimen was taken was examined by MT. An indication was detected on the pipe interior that followed the toe of the root pass. The indication in the coupon is shown in Figure 59.
Figure 59. Internal surface of Coupon T026-B-2 showing MT indication
The coupon was cut to provide a sample for metallographic examination and the remaining portion was chilled and broken open. Figure 60 shows how the coupon was cut and the locations of the metallographic section and the sample that was broken open.

Kiefner and Associates, Inc. August 2012 49
Figure 60. Coupon T026-B-2 cut for additional examination
The metallographic section shown in Figure 61 revealed that the indication was caused by a crack that initiated at the weld root and propagated into the girth weld. Initially, the crack propagated along the heat affected zone of the root pass, and then as the crack deepened it propagated into deposited weld metal. The crack profile was relatively smooth and flat, similar to the features observed on the failed girth weld.
The metallographic section shows a lateral branch at approximately 1/3 of the crack depth. A detail of the branch is shown in Figure 62. The microstructure along the path of the branch crack shows a light-gray colored band of grains. The microstructure and overall shape of the crack path, e.g., predominantly radial with a slight lateral deviation near the branch crack, suggests that the lateral branch developed when the main (i.e., radial) crack intersected a weaker layer of grains in the pipe microstructure. The driving forces that caused the main crack apparently were sufficient to cause it to continue to propagate, leaving only a minor lateral deviation to the overall radial direction of propagation where the microstructural layer was intersected.
Chill and break open
Metallographic Section

Kiefner and Associates, Inc. August 2012 50
Figure 61. Metallographic section through crack in Coupon T026-B-2
Figure 62. Detail of flaw along crack path in Coupon T026-B-2

Kiefner and Associates, Inc. August 2012 51
A portion of the crack indication was chilled in liquid nitrogen to promote brittle behavior and broken open to reveal the surfaces of the crack. The exposed surfaces are shown in Figure 63 placed ID to ID. The crack is seen to be continuous along the internal pipe surface with varying depth along its length. The crack is stained a dark color and appears to contain crude oil along the deepest portion of the crack. The crack surfaces are relatively smooth and flat with radially-oriented features.
Figure 63. Crack surfaces, Coupon T026-B-2 after breaking open
Concrete Testing Pipe Weight Coating Density Tests Two samples of concrete weight coating were removed from the pipe body and from a girth weld to determine the coating density. The coating density was needed to estimate loads and stresses acting on the pipeline as discussed later in this report. The test procedure was: weigh the sample dry, place it in 1,000 ml water in a graduated cylinder, observe the rise in water level, leave the sample immersed for 1 hour, again observe the water level, and then remove the sample and weigh it wet. These tests were not part of the basic test protocol.
The results are summarized in Table 13. The specific gravity increased after immersion. The average weight density of the pipe body and field joint samples, after immersion, was 2.486 and 2.549, respectively. Considering 1 ft of field joint coating at each end of a 40-ft joint of pipe, the length-averaged specific gravity was 2.489.

Kiefner and Associates, Inc. August 2012 52
Table 14. Weight Coating Density Tests
Observation Body 1 Body 2 Joint 1 Joint 2 Dry weight, g 303.0 321.1 443.2 417.3 Level rise, ml 125 140 200 180 Dry SG 2.424 2.294 2.216 2.318 Level drop, ml 4 5 20 7 Wet weight, g 309.1 326.3 464.3 435.8 Wet SG 2.555 2.417 2.579 2.519 Petrographic Analysis of Found Concrete Several tagged pieces of the concrete were received by KAI along with the pipe specimens. Specimens tagged T012, T016, T018, T022, and T023 were selected by EMPC for further characterization. Specimens T012, T022, and T023 were found adjacent to the pipeline in the river. Specimens T016 and T018 were found at an upstream location.
Petrographic analysis was performed in accordance with ASTM C-856, and an air void analysis was performed in accordance with ASTM C-457. The testing was performed by American Petrographic Services, Inc. on cylindrical core samples prepared by CTL Engineering, Inc. The report of the testing is provided in Appendix 8. Test results pertaining to air void content, spacing factor, entrapped versus entrained air proportions, aggregate size, and aggregate consistency may indicate potential relatedness of samples.
EXTERNAL LOADS ANALYSIS The occurrence of circumferential fatigue cracks adjacent to girth welds suggested that dynamic loadings were present. That fatigue cracks occurred at the top and bottom positions on the fracture surface indicates that reversed cyclical bending loads occurred, consistent with vortex-induced vibration (VIV). An analysis was performed to determine what river flow conditions would be consistent with the observed fatigue cracks.
The failure stress of the remaining pipe section was calculated and compared to estimated static and dynamic stresses to determine whether additional external loads were likely necessary to cause the final failure.
Static Stresses Static stresses include those from operation, buoyancy effects, and the drag force associated with the river current impinging on the side of the exposed pipe. These are estimated below.

Kiefner and Associates, Inc. August 2012 53
Operating Stress The longitudinal stress due to internal pressure in a long restrained pipeline is computed as the hoop stress multiplied by Poisson’s ratio (equal to 0.3), or 𝜎𝑃 = 0.3𝑃𝐷 2𝑡⁄ . The longitudinal stress corresponding to the operating pressure of 520 psig is 1,989 psi and is additive to longitudinal stresses cause by spanning and the impingement of current. Thermal stresses were taken to be inconsequential owing to the method of pipe installation.
Buoyancy The crude oil was assumed to have a specific gravity of 0.9, which is typical for many grades of crude oil. The specific gravity of the concrete on the pipe body and on the field joints was determined from sample tests to be about 2.5. The estimated dry weight of the pipe, contents, and coating was 154.56 lb/ft. The estimated weight of the displaced water was 74.05 lb/ft, so the buoyant weight of the pipeline was 80.52 lb/ft.
Drag Forces The drag force caused by water flowing over the exposed pipe was calculated as 𝐹𝐷 =𝐶𝐷 𝜌𝑈2𝐷 2⁄ where CD is the fluid drag coefficient, U is the current velocity, ρ is the fluid mass density, and D is the pipe diameter. The drag coefficient varies with the nondimensional Reynolds Number, 𝑅𝑒 = 𝜌𝐷𝑈 𝜇⁄ = 𝐷𝑈 𝜈⁄ where μ is the dynamic viscosity, and ν is the kinematic viscosity, and other terms are as already defined. At a temperature of 15 C (59 F), clear fresh water has the following values for these physical properties:1 Density, ρ = 1.940 slugs/ft3; Dynamic Viscosity, μ = 2.391×10⁻⁵ lbf-sec/ft2; and Kinematic Viscosity, ν = 1.233×10⁻⁵ ft2/sec.
The drag coefficient CD was estimated in accordance with published data as summarized in the curve shown in Figure 64.2 The resultant of the steady drag force with the buoyant weight was determined, as shown in Figure 65. A gap between the pipe and the river bottom of less than one pipe diameter can reduce the velocity of the fluid acting against the pipe and the resulting drag forces. The actual bottom separation during the flood was not known so this effect, if present, was unaccounted for.
1 Hughes, W. F., and Brighton, J. A., Theory and Problems of Fluid Mechanics, Schaum's Outline Series, McGraw-Hill, 1967. 2 Hoerner, S. F., Fluid-dynamic drag; practical information on aerodynamic drag and hydrodynamic resistance, 1965.

Kiefner and Associates, Inc. August 2012 54
Figure 64. Coefficient of Drag
Figure 65. Applied Loading on Pipe Due to River Current
Static Stress in the Pipe Over a long span, the pipe behaves more like a flexible catenary structure rather than as a rigid
beam. The long-span deflections and axial tension were calculated as3 𝛿 = 𝐿 � 3𝑤𝐿64𝐸𝐴
�1/3
and
𝑇 = 𝑤𝐿2
8𝛿 where w represents the resultant buoyant and drag force acting along the pipe. The
bending component of the stress was computed using the classical beam equation for a partially-
fixed end condition with a correction factor to account for the catenary behavior4 as 𝜎𝑏 = 𝐶𝑀𝑤𝐿2
10
where CM is calculated as 𝐶𝑀 = �1 + 0.108 �𝑇𝐿2
𝐸𝐼��−1
.
3 Young. W. C., Roark's Formulas for Stress and Strain, Sixth Edition, McGraw-Hill, 1989. 4 Young.

Kiefner and Associates, Inc. August 2012 55
The stress due to buoyant weight acts in the vertical plane and produces a net stress of 15,524 psi and a sag or deflection of 2.29 ft in the 207-ft exposed span length. The axial and bending stress induced by flow impingement varies with the stream velocity, which acts in the horizontal plane. The resultant produces the net static stress due to spanning. These are shown in Figure 66, not including the axial stress due to internal pipe pressure. The effect of the flow-induced drag forces on total stress is minor with flow velocities below 10 ft/sec.
Figure 66. Static Stresses Due to Spanning and Current Impingement
Dynamic Response Susceptibility to Vortex-Induced Vibration The Reynolds Number, Re, defines the flow regime. Where Re is between 1x10⁵ and 3.5x10⁵, the wake generates vortices which shed from opposite sides of the pipe in a periodic alternating pattern. As vortices separate alternately from first the top and then from the bottom pipe surface, alternating positive and negative lift forces act on the pipe. For the concrete weight-coated pipe, this occurs in water velocities between 1.0 and 3.5 ft/sec. The lift force associated with vortex shedding is a periodic alternating inertial load acting on the pipe at the vortex-shedding frequency. The vortex shedding frequency fv was estimated from the Strouhal Number, St, as 𝑓𝑣 = 𝑆𝑡𝑈
𝐷 where 𝑆𝑡 ≈ 0.21 𝐶𝐷0.75⁄ .5
The onset of vortex-induced vibration (VIV) of the pipe span is characterized by the nondimensional Reduced Velocity, Vr, calculated as Vr=U/(fnD), where fn is the natural frequency of oscillation of the pipe and other terms are as already defined. The response
5 Mousselli, A. H., Offshore Pipeline Design, Analysis, and Methods, PennWell, 1993.

Kiefner and Associates, Inc. August 2012 56
amplitude applied in this analysis6 is shown in Figure 67 as a function of Reduced Velocity. Susceptibility to VIV is greatest where Vr is between values of 4 and 10.
Figure 67. Cross-flow Dynamic Response
The pipe natural frequency is needed in order to understand Reduced Velocity in terms of actual flow velocity. The pipe natural frequencies were estimated as for a catenary structure as𝑓𝑛 =𝑛2�
𝑇𝑔𝑤𝐿2
where T is the axial tension force.7 The effective mass is the combined mass of the pipe
(steel, contents, and coating) and the displaced water because the displaced water must also move around the pipe as it oscillates.8 The first, second, and third mode natural frequencies are 0.39 Hz, 0.79 Hz, and 1.18 Hz, respectively. The Reduced Velocity range of 4 to 10, where dynamic response is largest, corresponds to a water velocity range of 2 to 5 ft/sec for the first mode. If the velocity of the water acting against the pipe was in this range during the flood event, VIV would be likely.
The first-mode peak response of A/D = 0.8 from Figure 67 corresponds to a stress in the pipe of around 5.8 ksi based on the ratio of static stress and deflection. Second and third modes would broaden the response to higher water velocities with peak responses around 7 and 10 ft/sec, respectively. Concurrent excitation of higher modes would add to the dynamic stresses.
The USGS reported gage height (ft) and discharge rate (cubic feet per second, cfs) at Billings (Station 06214500)9 which is approximately 20 miles downstream of the failure site. Presumably, approximately the same discharge volume passed through Laurel. However, without information about the channel bottom profile during the flood event after the river bottom had
6 Chaudhury, G., “Vortex-Induced Vibration and Design of Pipelines in Deepwater”, OTC13018, Offshore Technology Conference, 2001. 7 Young. 8 Mousselli. 9 http://waterdata.usgs.gov/usa/nwis/uv?site_no=06214500

Kiefner and Associates, Inc. August 2012 57
been scoured out to expose the pipe, along with gage height data at Laurel, it is not possible to use the Billings data to determine water velocities acting on the pipe during the flood.
Critical Load API 579, a recognized fitness for service standard,10 was used to estimate the critical load that would cause failure in the remaining pipe cross section. The analysis applied the Failure Assessment Diagram (FAD) approach for a circumferentially-oriented surface crack on a pipe cross section, in accordance with Section C.13.5. Mechanical strength and weld ductility data from the exemplar welds, reported earlier, were used with the analysis. The analysis was performed for a circumferential flaw 10 inches long and having a depth of 80% of the wall thickness approximately representing the large fatigue crack at the 5:30 position. The smaller fatigue crack at the 1:00 position was not accounted for. The estimated critical stresses are presented in Figure 68.
Figure 68. API 579 Critical Load Analysis
The solid curve gives results considering the lowest observed yield strength (YS) and ultimate tensile strength (UTS), and using the mean CTOD (0.013 inch) plus or minus one, two, and three standard deviations, and also the lowest (0.006 inch) and highest (0.020 inch) measured CTOD. The square symbols above the curve represent results considering the highest YS and UTS, and the lowest, average, and highest CTOD. The triangle and circle symbols represent the same strength and ductility properties but with high-low across the weld joint of 0.03 inch (1/32 inch) and 0.06 inch (1/16 inch), respectively, which bracket the amount of high-low observed in metallographic cross sections where high-low was present.
10 Fitness for Service, API 579, 2001.

Kiefner and Associates, Inc. August 2012 58
API 579 is generally conservative. Actual stresses to cause failure could be greater than predicted by 25% to 50%.11,12 Taking this inherent conservatism into account, the results indicate that applied stresses on the order of 30 ksi or more would have been required to cause the final fracture, which exceeds the sum of static and dynamic stresses estimated above, unless water velocities were very high. This suggests that larger loads had developed on the pipe than what was estimated for the effects of spanning for water flowing over the pipe. Such loads could have developed from the effect of water flow impinging on debris trapped against the exposed pipe, such as trees and brush, building materials, or other items washed in from upstream. The debris might alter or stop the oscillation pattern of the pipe, but would increase the net tension acting on the pipe over time as more debris accumulates.
DISCUSSION The metallurgical examination of the fracture identified two flat features on the fracture surface. The flat features initiated at minor geometric stress concentrating features, grew along a relatively straight path through the weld with little to no branching, and exhibited a semi-elliptical crack front, Based on these characteristics the features were concluded to be fatigue cracks. The presence of the fatigue cracks is consistent with vortex-induced oscillation of the pipe in the vertical plane. VIV is known to have caused other pipelines to fail when the pipelines have become exposed to cross flowing fluid currents. An analysis determined that VIV could have occurred under a range of river flow conditions.
The stress that would cause the remaining pipe section to fail was estimated in accordance with an accepted fitness-for-service assessment method (the FAD approach in API 579). The estimated critical stress exceeded the estimated stress due to static and dynamic loadings acting on the pipe, which suggested greater loads than the estimated load had occurred. Larger loads than what was predicted could have occurred as a result of the build-up of current-borne debris against the pipe. Accumulated debris would increase the net cross section subjected to current impingement, increasing the drag-induced load and net tension in the pipe proportionately. Concrete discovered on or adjacent to the pipeline may be consistent with this possibility. The missing concrete weight coating and FBE on the upstream side of the pipe may indicate that debris had impinged on the pipe. Some debris trapped against the pipe could have washed away once the pipeline broke, leaving behind no evidence of their presence.
11 Rana, M.D. and Rawls, G.B., “Prediction of Fracture Stresses of High Pressure Gas Cylinders Containing Crack Like Flaws Using Various Methods”, Report Number(s) WSRC-MS-2006-00146, DOE Contract Number DE-AC09-96SR1850, June 1, 2006. 12 Motarjemi, A.K., “Fracture assessment of through-wall and surface cracked pipes by BS 7910 and API 579 assessment procedures - a comparative study”, ASME Pressure Vessels and Piping Conference, San Diego, CA July 25-29, 2004.

Kiefner and Associates, Inc. August 2012 59
The fracture surfaces were in extremely poor condition for purposes of detailed examination, due to having been exposed in the river from the failure date on July 1 until late November. A significant amount of corrosion damage was caused by freshwater biota that had attached in prolific quantities to exposed steel surfaces. Nevertheless, it was possible to conclude that there was no evidence on the fracture surface or in metallographic sections that pre-existing welding workmanship defects were present that could have caused or contributed to the failure, such as lack of penetration of the root pass, slag inclusions, or HAC. The fracture paths of the cracks that enlarged were straight, planar, and radially oriented, which was consistent with fatigue as the sole growth mechanism. The microhardness levels in the girth welds were well below threshold levels that indicate susceptibility to HAC. The fit-up and deposition of the weld appeared to be of normal quality for contemporaneous pipeline construction. There was also no evidence that degradation in service such as internal or external corrosion, environmental cracking, or mechanical damage contributed to the failure.

Intentionally blank

Kiefner and Associates, Inc. 60 August 2012
APPENDIX 1 – EXAMINATION PROTOCOL Testing and examination protocol for ExxonMobil Silvertip pipeline failure (Version 03-27-12) Objective: The purpose of this document is to describe tests and examinations to be performed on supplied material specimens associated with the failure of the ExxonMobil Silvertip pipeline. The purpose of tests and examinations described below is to establish the metallurgical or mechanical cause of failure with a high degree of certainty, to the extent possible with the available evidence.
Location: Tests and examinations will be performed primarily at the testing facility operated by Kiefner & Associates, Inc. (KAI) at 6384 Proprietors Rd., Worthington, OH 43085. Certain tests or examinations of material samples may be performed at offsite labs offering specialized services. These will be identified in the protocol, and/or during the execution of the investigation as the need for such offsite tests becomes apparent. Custody control practices for material leaving the site will be observed.
Safety: Representatives from EPA, PHMSA, State of Montana, and Exxon Mobil Pipeline Company (Stakeholders) are permitted in the test facility with the permission of the test facility supervisor, the lead investigator, or KAI management. Visitors are notified that the conduct of a metallurgical failure investigation necessarily involves procedures or conditions that could present certain hazards, including but not limited to: lifting or moving heavy loads with mechanized equipment, cutting steel with torches and saws, working around heavy material that may roll or shift, working around material having sharp edges or hot surfaces, application of cleaning chemicals that include acids or solvents that could cause injury if they come in contact with skin or if the fumes are inhaled, the operation of rotating equipment, and machining or cutting operations that produce airborne pieces, particles, or sparks. KAI personnel are appropriately trained in the use of equipment and procedures necessary for performing the proposed work, and which may present the above hazards. By entering the facility, visitors acknowledge and accept risks inherent to being present during the performance of such work. In order to minimize the risk of injury, personal protective equipment in the form of work gloves and eye protection will be made available to visitors. Visitors will be asked to respect safe boundaries around work areas involving hazards.
Scheduling: Advance notification will be provided to Stakeholders ten (10) or more days prior to any testing or examination activities will begin.
Chain of custody control: An evidence control log will be maintained for material leaving the facility and left in the possession or control of a non-KAI employee.
Material identification: Material associated with this project will be tracked by a unique project identification number. The unique identification number for this project is 02731104.
Each shipped item was identified with a brass tag and unique tag number prior to shipment to KAI. The items listed below have been received by KAI so far. According to information provided by ExxonMobil, not all tagged items have been or will be shipped to KAI. Dimensions are approximate and reported for specimen identification purposes only.

Kiefner and Associates, Inc. August 2012 61
Tag No. Date Received Description 012 Nov. 11, 2011 Concrete, 1 pc, approx. 2 ft x 2 ft x 0.5 ft 013 Nov. 11, 2011 Pipe, 38 inches long 014 Nov. 11, 2011 Pipe, 45 ft long, fractured end and first upstream girth weld 015 Nov. 11, 2011 Pipe, 8 ft long, concrete coated 016-019 Nov. 22, 2011 Concrete pieces, various sizes 022, 023 Nov. 22, 2011 Concrete pieces, various sizes 024 Nov. 22, 2011 Pipe, 15 ft long, fractured end 026 Dec. 12, 2011 Pipe, 45 ft long, first downstream girth weld 027 Dec. 12, 2011 Pipe, 45 ft long, girth weld 029 Dec. 16, 2011 Pipe, 42 ft long, curved, girth weld 030 Dec. 16, 2011 Pipe, 32 ft long, concrete coated, exemplar girth weld
The relative positions of pipe pieces as removed from the field is shown in the schematic below, provided by ExxonMobil.
Each received piece will be identified by the KAI project number and the tag number already assigned to each item, e.g “02731104-T014” identifies the 45-ft long piece of pipe with one

Kiefner and Associates, Inc. August 2012 62
fractured end and containing the first upstream girth weld. First level subdivision of the major tagged pieces will be identified by a letter sequence, e.g., “02731104-T014-A”, “02731104-T014-B”, and so on. Second level subdivisions will be identified by numbering, e.g., “02731104-T014-A-1”, “02731104-T014-A-2”, and so on. Third level subdivisions will be identified by decimal point numbering, e.g. “02731104-T014-A-1.1”, 02731104-T014-A-1.2”, and so on. All components that become divided into smaller components will be marked prior to separation, photographed intact as marked, and then photographed in relative position after separation. Groups of subdivided material may be assigned one number if they are kept together and their interrelationship is deemed by the lead investigator to be obvious or unimportant. Small pieces may be marked without the “02731104” code. Marking may be by means of paint pen, indelible ink, vibratory etcher, or adhesive label. A log will be maintained of identified components, serial numbers, and descriptions.
Pipes may be marked by footage for purposes of describing the location of features of interest. Footage marks will start from “zero” at the upstream end of a subject piece of pipe. Pipes may also be marked with “clock” positions around the circumference with “12:00” at the top of pipe position and clockwise viewed looking downstream.
Photography and video recording: KAI will take primary responsibility for photographic and video documentation. All specimens subjected to irreversible procedures, such as cutting or cleaning, will be photographed for the record in the “before” and “after” condition. Photos will generally be taken in a sequence of larger overall views down to smaller details. A ruler or tape measure will be included in photographs for dimensional scaling as appropriate and practical.
All handling or procedures that are consequential to the condition of the specimen or to the outcome of tests will be video recorded, within the limitations of recorder access, lighting, and duration of the operation or process. Operations that, in the judgment of the lead investigator, would be impeded by efforts to record or for which a video record offers little value, may not be video recorded. A photo log will be maintained. Stakeholders may take their own photographs provided they do not impede timely progress or cause unsafe conditions.
Preservation and storage: Separated pieces will be preserved in plastic evidence bags marked with the identifying code, unless the specimen size is prohibitively large. Several separate samples may be stored together in cardboard or plastic boxes or other containers on hand and which will bear the “02731104” identifier. Specimens that are too large to be bagged or boxed will be marked individually. Specimens and remnants will be stored indoors in a clean and dry environment until further instructions are provided for return or relocation. A master list of sample codes and material descriptions will be maintained.
Management of change: The tests and examinations described below are currently planned based on a preliminary and informal examination of materials shipped to KAI. As the investigation proceeds, currently unforeseen observations or test results could indicate that revisions to the testing protocol going forward may be appropriate. Given the potentially changeable nature of the investigation, any additions, deletions, or revisions to the tests or investigations may be necessary. Any revisions will be made in consultation with stakeholders and will be authorized in advance. The post-test protocol will show any revisions made during the investigation.
Investigation: The phases of the investigation are set forth below and will occur in the following order.

Kiefner and Associates, Inc. August 2012 63
A. Visual examination B. Clean specimen C. Nondestructive examination D. Fractographic examination E. Metallographic examination F. Materials testing
Given the location of the failure, tests and examinations suitable to investigating a girth weld failure have been proposed. Details of the expected examinations and tests are presented below.
A. Visual examination: 1. Unwrap specimen(s), photograph as received in accordance with the guidelines listed
above. 2. Note markings, overall physical condition, any damage, coating type, and condition. All
items of note will be photographed. 3. Measure length, diameter, wall thickness, and location of key features. Pipe wall
thickness will be measured at several locations around the circumference where pipe ends are already exposed near the fracture.
4. Top of pipe and direction of flow will be marked based on information from ExxonMobil, if not already so marked as received.
5. The pipe interior surface will be visually examined and photographed near open pipe ends, and on pieces that have been cut open.
B. Clean specimen:
1. Preserve sample of corrosion product in any corrosion pits, if present on exterior or interior surfaces. If they are present and in sufficient quantities, they will be tested using either energy dispersive spectroscopic methods in the scanning electron microscope, or x-ray fluorescence. Superficial atmospheric corrosion or “flash rust” that appears to be due to exposure of the specimens to the elements after removal from the site will not be sampled.
2. Use paint thinner or other solvent with nylon bristle brush to remove protective grease applied to fracture surface prior to shipment for preservation.
3. Use Alconox or other nonoxidizing detergent with nylon bristle brush to clean fracture surfaces followed by rinse with clean water. Parts will be photographed before and after each cleaning cycle in accordance with the general guidelines listed above.
4. Dry with compressed air or methanol. 5. If necessary small samples prepared in subsequent stages of the investigation may be
subjected to further cleaning ultrasonically in detergent or solvent. 6. Photograph specimen and fracture surface as cleaned.
C. Nondestructive examination (NDE):
1. NDE of the pipe surface adjacent to the fracture will be performed on the inside surface and on the outside surface of Tag 14 and 24 specimens for evidence of environmental cracking, if coating is missing or disbonded, within 4 inches of the fracture surface. No NDE will be performed on surfaces where the coating is intact and bonded to the pipe surface. NDE will be by dry and wet magnetic particle. All linear indications will be photographed and documented as to length, orientation, and position.

Kiefner and Associates, Inc. August 2012 64
2. The upstream girth weld (Tag 014), downstream girth weld (Tag 026) and exemplar girth weld (Tag 030) will be radiographed by a third party. Due to the hazard of exposure this task may be performed at a time prior to the main testing and examination activities. The radiographs will be evaluated by the third party inspector in accordance with API 1104, 17th Edition (the edition in effect at the time of construction in 1991). It may be necessary to remove concrete coating present over any girth weld being radiographed in order to obtain consistent radiographic image quality and sensitivity. Removed coating materials will be preserved. The width of the area to be radiographed will be the standard film width.
3. Where concrete coating must be removed, it will be removed by making segmenting cuts using a circular masonry blade, and then prying or chipping free of the undercoated pipe surface. The depth of cut will be controlled to limit damage to the pipe but some damage cannot be precluded.
4. The corrosion prevention coating will be evaluated qualitatively to determine whether it is well bonded to the pipe surface in selected areas.
D. Fractographic examination:
1. The fractured ends of the Tag 014 and 024 pipes will be cut with a plasma cutter at least 12 inches from the fracture surface. Hot cutting will only be used to reduce the long pieces of pipe to manageable size so that the materials can be safely subdivided for further examination and testing. A band saw with water cooling will be used for cuts near samples that will be used for testing and examination. The Tag 014 pipe has concrete coating near the fractured end, which will be preserved to the extent reasonably possible. Fracture surfaces will be protected by slit hoses or other padding material.
2. Clock positions or other references will be transferred to the cut samples as necessary. 3. The two shortened pieces of pipe produced in Step D-1 will be recut using the band saw
to remove a ring from each end containing the fracture surfaces. The rings will have an approximate width of 1 to 2 inches. Steps will be taken to avoid damaging the fracture surfaces during handling.
4. The rings with the fracture surfaces from Step D-3 will be photographed and recleaned if necessary.
5. If radiographic inspection of the upstream, downstream and exemplar intact welds (Tags 014, 026, or 030) in Step C-2 indicates the presence of crack-like features, the section of the weld containing the indicated crack will be cut out as a complete cylinder using the plasma cutter with at least 18 inches of base metal on either side of the weld for further examination.
6. A coupon incorporating the indicated crack-like feature identified in Step D-5, if applicable, will be removed from the affected girth weld(s). Cutting will be by band saw. The coupon will be chilled in liquid nitrogen to embrittle it, and then fractured open to expose the indicated feature. Note that the removal of any coupon from the intact welds will affect the performance of ductility testing outlined in Step F-6 and will need to be coordinated with that effort. Step D-6 may be deferred until after Step F-6 is completed.
7. The fracture surfaces from Step D-4 and from Step D-6 (if applicable) will be examined by optical microscope to identify fracture modes and features of interest. The extent and location of pre-existing anomalies, if any, will be determined.
8. Ring sections produced in Step D-3 containing possible fracture origins may be marked and subdivided to smaller pieces for examination by scanning electron microscope

Kiefner and Associates, Inc. August 2012 65
(SEM). A piece of exposed defect from the intact weld produced in Step D-6 will also be removed for SEM examination (if applicable). All cutting will be by band saw.
9. The SEM sample will be examined in the SEM at the facilities of Worthington Industries, 200 Old Wilson Bridge Rd., Columbus, Ohio 43085, located near our offices. SEM examination will include a survey of fracture surface features and may include an energy dispersive x-ray spectroscopic (EDAX) analysis of chemistry. The SEM specialist may elect to alternate between SEM examination and successive cleaning steps in accordance with his experience.
10. Pieces containing fracture surface will be stored with desiccant or in a desiccator after examinations are completed.
E. Metallographic examination:
1. One or more portions of the fracture surfaces from the rings cut from the Tag 014 and 024 pipes will be selected for metallographic sectioning. Metallographic sections will consist of both mating halves across the fracture.
2. One or more metallographic sections will be prepared across the upstream, downstream, and exemplar intact girth welds (from Tag 014, 026, and 030 pipes) and girth weld defects (if applicable). These sections will be removed using a band saw from the welds which were cut out as cylinders in Step D.6.
3. Metallographic sections will be prepared by mounting in resin, curing in place, polishing, and etching using standard techniques suitable for use on steel specimens.
4. Metallographic sections will be examined and photographed in the metallograph at selected magnifications.
5. Microhardness measurements will be made on all metallographic sections containing a girth weld. Measurements will be made at sufficient locations in the deposited weld metal, the pipe heat affected zones (HAZ), and base metal near the outside surface, mid-wall, and inside surfaces to identify variations and patterns in hardness.
6. Metallographic sections will be stored with desiccant or in a desiccator after examinations are completed.
F. Material properties testing:
1. Coupons will be marked and cut from the reduced length pieces of pipe for material properties testing. Cuts will be made using the band saw.
2. One transverse and one longitudinal tensile test coupon will be cut out of pipe body material from each of the two pipes (Tags 014 and 024) joined at the fractured girth weld. The coupons will be removed from the pipe rings between the hot cuts and band saw cuts. In addition, the same type of tests will be performed in the body of one pipe joined at the exemplar weld (Tag 030). The pipe from Tag 030 to be tested will be selected at the time of examination.
3. A Brinnell hardness test will be performed of pipe material to estimate tensile strength prior to testing the material to verify adequate test machine capacity.
4. The transverse pipe body tensile coupons will be flattened using a hydraulic press. Tensile coupons will be machined to standard dimensional specifications and tested on KAI’s premises in accordance with ASTM A370 and E8. The tensile test coupons will be prepared and tested on KAI’s premises.
5. Charpy V-notch (CVN) impact tests will be performed on pipe body material from adjacent to the fracture (pipes from Tags 014 and 024) in accordance with ASTM A370.

Kiefner and Associates, Inc. August 2012 66
CVN testing will also be performed on the pipe from Tag 030 selected for tensile testing. CVN bars will be oriented longitudinally, with the notch oriented radially. Sixteen samples will be prepared and tested over a sufficient range of temperatures to identify the upper shelf absorbed energy and transition temperature of each of the two joined pipes. The CVN test bars will be prepared and tested on KAI’s premises.
6. The ductility of the deposited weld metal and heat-affected zone (HAZ) in the upstream and downstream girth welds and the exemplar weld (Tags 014, 026, and 030), will be determined by the crack-tip opening displacement (CTOD) test method in accordance with BS 7448. The CTOD tests will be performed at Edison Welding Institute (EWI), 1250 Arthur E Adams Drive, Columbus, OH 43221. The welds will be cut out as complete cylinders if they have not already been so cut in Step D-5 in order to investigate crack-like defects indicated by radiography. Final preparation of CTOD test specimens involves several machining and other steps to be performed at EWI, with a typical turnaround time of least two weeks.
7. Small samples (maximum 1 inch square) will be removed from the upstream and downstream pipes near the fracture for chemistry analysis. Also, a sample of deposited weld metal approximately 1 inch long will be removed from the fractured weld for material chemistry analysis. The chemistry will be analyzed using optical emission spectroscopy at Worthington Steel Division, 200 Old Wilson Bridge Rd., Columbus, Ohio 43085. Turnaround time for chemistry analysis is typically 3 days. The chemistry analysis process may alter or consume the sample rendering it unusable for further testing or examination.
8. Material properties test coupons and machine drops or offcuts will be retained with the other material evidence. Some samples or coupons may be consumed or altered in the course of testing, for example the small pieces used for chemistry analysis. All materials will be preserved to the extent reasonably possible.
9. Samples of concrete discovered near the fracture, and at a site upriver, will be selected for petrographic analysis in accordance with ASTM C856. The petrographic analysis will be performed under the direction of CTL Engineering, 2860 Fisher Road, Columbus, OH 43204 with actual petrographic examination taking place at the premises of American Petrographic Services, Inc., 550 Cleveland Ave. N., St.Paul, MN 55114. Turnaround time for petrographic analysis is typically two weeks. Small quantities of the samples may be consumed by the testing. Sample remnants including the petrographic analysis wafers will be returned to KAI and retained with other materials.

Intentionally blank

Kiefner and Associates, Inc. August 2012 67
APPENDIX 2 – MATERIAL HANDLING RECORDS Refer to attached electronic storage.

Intentionally blank

Kiefner and Associates, Inc. August 2012 68
APPENDIX 3 – RADIOGRAPHY RESULTS Refer to attached electronic storage.

Intentionally blank

Kiefner and Associates, Inc. August 2012 69
APPENDIX 4 – KAI EXAMINATION PHOTOGRAPHS Refer to attached electronic storage.

Intentionally blank

Kiefner and Associates, Inc. 70 August 2012
APPENDIX 5 – SEM EXAMINATION PHOTOGRAPHS Refer to attached electronic storage.

Intentionally blank

Kiefner and Associates, Inc. 71 August 2012
APPENDIX 6 – KAI MATERIAL TEST RESULTS Refer to attached electronic storage.

Intentionally blank

Kiefner and Associates, Inc. 72 August 2012
APPENDIX 7 – CTOD TEST RESULTS Refer to attached electronic storage.

Intentionally blank

Kiefner and Associates, Inc. 73 August 2012
APPENDIX 8 – PETROGRAPHIC ANALYSIS RESULTS Refer to attached electronic storage.

Intentionally blank

Kiefner and Associates, Inc. 74 August 2012
APPENDIX 9 – METALLOGRAPHY AND STEREOMICROSCOPE PHOTOGRAPHS Refer to attached electronic storage.


