Doru Postica Self-image Congruence and Brand Preference...
76
Doru Postica Self-image Congruence and Brand Preference: analysis by product usage role and level of country development. Universidade Fernando Pessoa Porto 2015
Transcript of Doru Postica Self-image Congruence and Brand Preference...

Doru Postica
Self-image Congruence and Brand Preference: analysis by product usage role and level
of country development.
Universidade Fernando Pessoa
Porto 2015


Doru Postica
Self-image Congruence and Brand Preference: analysis by product usage role and level
of country development.
Universidade Fernando Pessoa
Porto 2015

Self-image Congruence and Brand Preference: analysis by product usage role and level of country
development
IV
Doru Postica
Self-image Congruence and Brand Preference: analysis by product usage role and level
of country development.
Work presented submitted to Universidade Fernando Pessoa as a requirement for the
attainment of the degree of Master in Business Sciences in 2015.
Supervisor: Prof. Dr. Paulo Ramos

Self-image Congruence and Brand Preference: analysis by product usage role and level of country
development
V
Abstract
Past research assumed and successfully proved self-image congruity to have a positive
impact on product/brand choice, purchase intentions, and brand preference. The purpose
of the research is to study the self-concept dimensions (actual and ideal) and their relation
to brand preference. Type of product (conspicuous and inconspicuous) and type of
country (Moldova as developing country and Portugal as developed country) were
examined in the relationship between actual/ideal self-image congruence and brand
preference. Hypotheses were formulated and data were collected through survey method.
A preliminary questionnaire was designed to test the instrument’s efficiency and choose
the most representative brands. Then, data were collected through student surveys, written
in Romanian for Moldova, in Portuguese for Portugal and in English for Erasmus
students. The perceptions of 208 respondents about their self-congruity and brand
preference were obtained for two types of products: clothes and toothpaste, with two
brands being compared for each type. An understanding of self-image congruence impact
can give clearer directions in developing better marketing programs. These notions are
also crucial in determining the relation between the person’s image and the final purchase
behavior. It was found that self-image congruence has a significant impact over brand
preference, while actual self-image congruence influencing more the inconspicuous
products and ideal self-image congruence – conspicuous ones. Other practical and
theoretical implications are also discussed. The work’s originality is in the cross-analysis
of products and countries.
Key words: Actual self, ideal self, brand preference, self-image congruence, type of
product usage, developed/developing country.

Self-image Congruence and Brand Preference: analysis by product usage role and level of country
development
VI
Resumo
Investigações anteriores provaram com êxito o impacto positivo da congruidade da auto-
imagem sobre a escolha do produto / marca, intenção de compra e preferência de marca.
O objetivo desta pesquisa é estudar as dimensões de auto-conceito (real e ideal) e sua
relação com a preferência de marca. O tipo de produto (conspícuos e discreto) e do tipo
de país (Moldávia como país em vias de desenvolvimento e Portugal como país
desenvolvido) foram examinados na relação entre a congruência entre a auto-imagem
real/ideal e a preferência da marca. As hipóteses foram formuladas e os dados foram
recolhidos por meio de sondagem. Um questionário preliminar foi elaborado para testar
a eficiência do instrumento de recolha e para escolher as marcas mais representativas. Em
seguida, os dados foram recolhidos por meio de uma sondagem a estudantes, escrita em
romeno para a Moldávia, e em português para Portugal, e em inglês para os estudantes
Erasmus. As perceções dos 208 inquiridos sobre a sua auto-congruência e a marca foram
obtidas através de dois tipos de produtos: roupa e pasta de dentes, com duas marcas
utilizadas respetivamente para cada tipo. Uma compreensão do impacto da congruência
da auto-imagem pode dar indicações mais claras no desenvolvimento de melhores
programas de marketing. Essas noções são também cruciais para determinar a relação
entre a imagem do consumidor e do comportamento de compra final. Verificou-se, assim,
que a congruência da auto-imagem tem um impacto significativo sobre a preferência de
marca, embora a congruência da auto-imagem real influencie mais os produtos discretos
e a congruência da auto-imagem ideal, os produtos conspícuos. Outras implicações
práticas e teóricas também são discutidos. A originalidade do trabalho reside na análise
cruzada de produtos e países.
Palavras-chave: auto-conceito real, auto-conceito ideal, preferência de marca,
congruência da auto-imagem, produto conspícuos, produto discreto, país em vias de
desenvolvimento, país desenvolvido.

Self-image Congruence and Brand Preference: analysis by product usage role and level of country
development
VII
Table of contents
List of figures ............................................................................................................... VIII
List of tables ................................................................................................................... IX
Introduction ...................................................................................................................... 1
Chapter I. Conceptual background and hypotheses development .................................... 3
1.1 Brand preference ..................................................................................................... 3
1.2 Relationship between self-image and product image ............................................. 4
1.3 Self-image congruence ........................................................................................... 7
1.4 Types of self-image congruence ........................................................................... 12
1.5 Product conspicuousness ...................................................................................... 13
1.6 Level of country development .............................................................................. 17
Chapter II. Methodology ................................................................................................ 20
2.1 Research aim ......................................................................................................... 20
2.2 Research hypotheses and model ........................................................................... 20
2.3 Research instrument, questions and scales. .......................................................... 23
2.4 Data gathering methods and sample ..................................................................... 25
Chapter III. Model Analysis. Analysis, implications and discussion of results. ............ 28
3.1 Sample descriptive statistics ................................................................................. 28
3.2 Descriptive analysis and normality of the variables ............................................. 30
3.3 Reliability tests ..................................................................................................... 32
3.4 Validity tests ......................................................................................................... 33
3.5 Model tests ............................................................................................................ 35
3.6 Hypothesis testing ................................................................................................. 37
Chapter IV. Conclusions ................................................................................................ 50
4.1 Results conclusion ................................................................................................ 51
4.2 Contribution for science ........................................................................................ 52
4.3 Practical implications. ........................................................................................... 53
4.4 Limitations of the research.................................................................................... 53
References ...................................................................................................................... 56
Appendix ........................................................................................................................ 62

Self-image Congruence and Brand Preference: analysis by product usage role and level of country
development
VIII
List of figures
Figure 1. Consumer as “black box” 5
Figure 2. GNI per capita in several countries (2013) 18
Figure 3. Model Representation for an Individual Brand 22
Figure 4: T-significance of general model 45
Figure 5: Standardized regression weights and R2 of general model 46

Self-image Congruence and Brand Preference: analysis by product usage role and level of country
development
IX
List of tables
Table 1. Summary of selected studies on self-concept / self-image congruence 5
Table 2. The effects of self-esteem and self-consistency motives on purchase
motivation
7
Table 3. Summary of relationships examined with respect to self-image
congruence
11
Table 4. Additional variables computed in initial data analysis 20
Table 5. Summary of research instruments used in self-concept / self-image
congruence
25
Table 6. Sample age distribution over countries 28
Table 7. Sample gender distribution over countries 28
Table 8. Sample income distribution across countries 29
Table 9. Number of family members in country samples 29
Table 10. Student percentage across country samples 30
Table 11. Descriptive statistics for individual variables 31
Table 12. Cronbach’s Alfa for individual variables: SPSS analysis 32
Table 13. Reliability values in other studies 33
Table 14. PLS: Composite Reliability 33
Table 15. PLS: Average Variance Extracted 34
Table 16. PLS: Significance Measures of the relationships towards Brand
Preference
34
Table 17. Total Variance Explained 34
Table 18. CFA Factor Loadings Range (PLS) 35
Table 19. Cross Loadings for general, conspicuous and inconspicuous models 36
Table 20. Cross Loadings for Individual Brand Models 37
Table 21. Pearson r coefficient for Self-Image congruence and Brand Preference 38
Table 22. Correlations and beta coefficient for actual and ideal self-image
congruence
39
Table 23. Individual brand actual-ideal self-image congruence correlations 40
Table 24. Significance test for differences between conspicuous and
inconspicuous products
41
Table 25. Analysis of general conspicuous and inconspicuous variables 42

Self-image Congruence and Brand Preference: analysis by product usage role and level of country
development
X
Table 26. Average congruence values in Moldova and Portugal 43
Table 27. Congruence-Preference correlations and significance tests of differences
between congruence variables in Moldova and Portugal
44
Table 28. Beta Coefficient of Self-Image Congruence to Brand Preference 44
Table 29. Significance test for congruence variables between Moldova and
Portugal
45
Table 30. Average congruence variable values for genders 46
Table 31. R2 of Self-Image Congruence to Brand Preference in Genders 46
Table 32. Significance tests for congruence variables in Male and Female Groups 47
Table 33. Average congruence variable values for different family groups 47
Table 34. Beta Coefficient of Self-Image Congruence to Brand Preference in
Families
47
Table 35. Significance test for variable differences across family groups
(ANOVA)
48
Table 36. Average congruence variable values for different income groups 48
Table 37. Beta Coefficient of self-image congruence to brand preference in income
groups
48
Table 38. Welch and Brown-Forsynthe significance tests 49

Self-image Congruence and Brand Preference: analysis by product usage role and level of country
development
1
Introduction
Past studies have argued that self-congruence is an important influencing factor in
consumer preference formation. The self-congruity theory (Sirgy, 1982) suggests that
consumers compare their self-image with the product image. Thus, consumers are
expected to prefer a product that shares a similar image to their own. People prefer a
certain brand because they see themselves as similar to the type of individuals that they
generally thought to use this product. Self-image congruence is supported by several
studies (Wu, 2011; Peng, Wong and Wan, 2012; Upamannyu, Mathur and Bhakar, 2014).
To our knowledge, past studied did not make any type of cross-country comparisons.
Therefore it seems relevant to see if the relationship between the variables holds up in
different countries.
Previous studies tried to demonstrate that product conspicuousness influences the
relationship between type of self-concept and consumer’s behavior (Khan and Bozzo,
2012; Upamannyu, Mathur and Bhakar, 2014). Researchers hypothesized that ideal self-
concept is associated more with a preference for conspicuous products than actual self-
concept, and that actual self-concept is more associated with a preference for
inconspicuous products. It might sound like an obvious statement that should be easy to
prove, but literature review shows controversy among results. The current study deals
with two separate facets of self-image: “actual self-image” - the way individuals see
themselves, and “ideal self-image” - the way individuals would ideally like to see
themselves.
According to Curtis (2001), behavioral economic principles state that in the purchase
process you could get people to behave irrationally, if they link products to their desires
and feelings. Any object can become a symbol of how you want to be seen by other
people, and then the value of the good increases. It is not an arguable economic theory,
rather than a type of human behavior which manifests in the presence of abundance. Our
economy requires consumption to be our way of live, to transform the purchase and use
of goods in rituals, to seek spiritual satisfaction through it. Measurements of social status,
prestige and acceptance is now found in consumption terms. The more the pressure over
the individual to conform to socially accepted standards, the more he tends to express his
aspirations in terms of what clothes he wears, what food he eats, hobbies etc. The central
idea is that a great variety of needs can be satisfied through consumption. It has the
capacity to reinstall emotional balance by offering symbolical benefits that make the

Self-image Congruence and Brand Preference: analysis by product usage role and level of country
development
2
consumer fulfill his personal wants. The modern individual is more and more preoccupied
with his self-image, image that he perfects as he can. From this tendency resides the desire
to take care of one’s self image, by acquiring clothes, mainly brands that have a positive
reputation for the public, sustaining the idea of wealth, comfort and social status (Curtis,
2001).
The research aim is to elaborate an empirical investigation of actual/ideal self-image
congruence and measure the relationship between self-image congruence and brand
preference.
First, the conceptual background is argued and hypotheses are developed. The reviewed
literature explains the different types of self-image congruence, the relationship between
self-image and the product’s image, and the possible impact of several grouping variables.
Then, methodology is described. The development of the questionnaire and its
measurement scales are presented along with the data collection procedure. The methods
that were used for the data analysis are discussed. The third chapter provides a
demographic description on the current sample and examines validity and reliability of
the scales used. Each hypothesis is tested and conclusions are made.

Self-image Congruence and Brand Preference: analysis by product usage role and level of country
development
3
Chapter I. Conceptual background and hypotheses development
“Since appearance tyrannizes over truth and is the lord of happiness, to appearance I
must devote myself.” (Plato)
Introduction. The theoretical chapter is aimed to help the reader get a better grasp on the
concepts mentioned in the analysis later on, to see similar findings of other authors and
be able to compare them with the present findings. First, the notion of brand preference
is debated as viewed by different authors. Then, the chapter examines how important
researchers see the relationship between self-image and the product’s image by showing
past studies. Self-image congruence is discussed later on, along with its different types.
A series of findings are put together to improve the reader’s understanding. Several
studies are included to show the relationship between self-image congruence and brand
preference. The last sub-chapters refer to different grouping variables over which
differences in this relationship will be examined.
1.1 Brand preference
If you have a good story and enough money to make it heard, you could build awareness
on any matter rather quickly. It is a slower process, however, to build brand preference.
We are what we repeatedly do. Excellence is then not an act, but a habit (Durant, 1991).
Transposed to brands, it is important not only to attain, but to sustain preference, loyalty
and attitude. This will increase the company’s market share, make more revenues and get
the company one step ahead its competitors.
Bronnenberg, Dube and Gentzkow (2012) define brand preference simply as willingness
to pay. This term includes all channels such as learning that are not seen in the utility
function. It is a measure of brand loyalty in which a consumer will choose a particular
brand in presence of competing brands, but will accept substitutes if that brand is not
available (Online Business Dictionary). It is a biasness toward a certain company’s brand,
in which the consumer favors it over another. Brand preference is manifested differently
depending on the salient beliefs that are present at a certain time; the consumer biasness
towards it; the extent to which a consumer favors one brand over another (Ebrahim,
2011).
Through this concept it is understood that the consumer’s predisposed to evaluate in a
specific way a product compared to other products. Therefore the consumer formulates
an attitude towards each of the available brands, after which he chooses the one that

Self-image Congruence and Brand Preference: analysis by product usage role and level of country
development
4
fulfilled his prerequisites. In this process, the consumer expresses a multitude of
preferences. These factors can be of cognitive nature (all the beliefs based on knowledge),
affective nature (positive feelings and emotions, indifference or negative feelings which
a product generates) and conative nature (making a conclusion by evaluating the goods
and manifesting the desire to act).
Individuals are ready to pay for a specific brand, even though its physical features are not
much different from other brands. Research shows that most of consumers typically buy
a single brand of beer, cola, or margarine (Dekimpe et al., 1997), even though the price
may change significantly in the course of time, and consumers often cannot tell their
preferred brand apart from others in blind “taste tests” (e.g. Pepsi Challenge, blind tasting
between Pepsi and Coca-Cola). It happens because consumers want to ease their
purchasing process. They develop brand preferences so they wouldn’t have to analyze all
available goods every time.
The associations consumers have with brands make them distinctive. It goes beyond
perceived quality that the brand promises. It relates to the intangible properties. In the
minds of consumers, Coca-Cola is “All American” and Mercedes is ''prestigious” (Aaker,
1997). The brand is a distinguishing feature of a product and is often important to
customers.
Usually, brand preference is built when the company has been for a long time on the
market. Research shows that individuals could have a preference for a good sold by a
company, just because that company has a name on the market during its long presence
(Dinlersoz and Pereira, 2007). Consumers can exhibit little brand preference toward a
new and unfamiliar brand when exposed to it.
1.2 Relationship between self-image and product image
The root of the self-image congruence comes from social psychology, where
interpersonal relations are analyzed. People perceive others they like to be more similar
to themselves than the people they don’t like. The opposite relation was also proven:
people like more the people that are similar to them and like less those who are different
(Newcomb 1961, Broxton 1963). If we transpose these conclusions in the context of
consumer behavior, we could predict that people would prefer brands which they think
people similar to them use.

Self-image Congruence and Brand Preference: analysis by product usage role and level of country
development
5
According to Rosenberg (1979), self-concept is “the totality of the individual's thoughts
and feelings having reference to himself as an object”. The self-concept is the totality of
all the beliefs an individual holds about himself. It is the way he defines himself. The
self-concept might serve as an anchor for comparison and evaluation.
If we take a behaviorist perspective, we can see the consumer as a “black box”. This is
due to the fact that companies do not fully understand what drives a consumer’s
motivation, i.e. what really stimulates an individual’s desire to buy a specific item. They
can only project a stimulus, and check the response, to evaluate the stimulus’ efficiency.
There are multiple factors that influence consumer behavior: cultural, social, personal and
psychological (Kotler 2003, Solomon 2014, Kardes, Cronley and Cline 2014).
Figure 1. Consumer as “black box”
The self-concept is also inside that black box. This is why it would be of interest for
marketers to understand the way a consumer makes choices.
The literature on the subject of “self” concept is fragmented and not coherent (Sirgy,
1982). In different papers, it may be found either as a single construct or as consisting of
multiple constructs. Some authors do not make any classification on the “self” concept,
others (the majority) treat it as having two components: actual self (as one sees himself)
and ideal self (as one would like to see himself ideally). Table 1 presents different
concepts analyzed in a multitude of papers.
Table 1. Summary of selected studies on self-concept / self-image congruence
Authors Actual self Ideal self Social self Ideal social self
Birdwell (1968) X
Dolich (1969) X X
Landon (1974) X X
Belch and Landon (1977) X X
Malhotra (1988) X X X
Hong and Zinkhan (1995) X X
Ericksen (1996) X X

Self-image Congruence and Brand Preference: analysis by product usage role and level of country
development
6
Sirgy et al. (1997) X
Quester et al. (2000) X X
Ekinci and Riley (2003) X X
Back (2005) X X
Kressmann et al. (2006) X X
He and Mukherjee (2007) X X X X
Jamal and Al-Marri
(2007)
X
Ekinci et al. (2008) X X
Han and Back (2008) X X
Ibrahim and Naijar
(2008)
X X
Kwak and Kang (2009) X X
Source: Hosany and Martin (2012)
Individuals are searching to maintain and enhance their self-concept (Graeff, 1996), and
want to be in a position where their actual self-image is so good, that it matches their
relevant ideal self (Higgins, 1987). In the present environment, brands act as symbols,
means through which consumers can express their identity and interact easier with others
of similar interests (Sirgy 1982). Research in the past shows that consumers of a specific
brand have a similar self-concept with others that use the same brand, and a significantly
different self-concept than those that use a different brand (Grubb & Hupp, 1968). This
implies that consumers seek brands that would match their self-image (Sirgy 1982).
The self-image of the individual is formed based on the reactions he gets from the
surrounding people: friends, family, colleagues etc. It is natural for the person to want
positive reactions from these groups of people. But the interaction between them does not
happen in an isolated environment. Rather, they are affected by the environmental setting
and personal opinions of each of the persons involved. A person tries to transmit
information about himself through the use of products that can be used as symbols (Grubb
& Hupp 1968).
In the literature, that are more perspectives over the notion of “self” concept. As described
by Sirgy (1982), it has been seen through different lenses, such as psychoanalytic theory
(a system with a conflict between what we are and what we want to be), behavioral theory

Self-image Congruence and Brand Preference: analysis by product usage role and level of country
development
7
(the totality of the responses to stimulus), cognitive theory (a conceptual system that
processes information about the self), and as symbolic interactionism (a system formed
from the totality of interpersonal interactions). The current research treats the “self”
concept as a construct with different types of selves. Some presume that “self” is
conditioned by consistency (because the individual tends to behave consistently with his
view of himself) and by esteem (because the individual tends to improve his image).
1.3 Self-image congruence
For consumers, brands have symbolic attributes, which construct the brand-user image,
meaning how would a typical user of this brand look like and behave. To decide if they
like the brand, individuals try to match their own perceived image with that of the typical
user. This is called “self-image congruence”. If these two have a lot of things in common,
the individual will have a positive attitude towards the brand. Everybody has a particular
identity, preference and habit that they are aware of. And once their “self” is set,
individuals tend to protect it (Kressmann et al., 2006).
In the decision making process of the consumer, it is considered that a self-image belief
interacts with a product image perception, where the results lead to:
Table 2. The effects of self-esteem and self-consistency motives on purchase motivation
Self-
image
Product
image
Result
in
Self-
image/product
image
congruity
Mediating factors
Purchase
motivation Self-
esteem
motivation
Self-
consistency
motivation
Positive Positive Positive self-
congruity Approach Approach
Approach
purchase
motivation
Negative Positive Positive self-
incongruity Approach Avoidance Conflict
Negative Negative Negative self-
congruity Avoidance Approach Conflict
Positive Negative Negative self-
incongruity Avoidance Avoidance
Avoidance
purchase
motivation
Made from literature review of Sirgy (1982)
The purchase decision will be different in these cases. The strongest motivation to buy is
determined by positive self-congruity, followed by positive self-incongruity, negative

Self-image Congruence and Brand Preference: analysis by product usage role and level of country
development
8
self-congruity, and negative self-incongruity, respectively. These results can be explained
through the consistency and esteem criteria mentioned above. Referring to esteem, the
consumer wants to buy a product with good image to maintain a positive self-image
(positive self-congruity) or to improve himself by being close to his ideal image (positive
self-incongruity condition). He will avoid purchasing a negatively valued product to elude
self-abasement (negative self-congruity and self-incongruity conditions). Conversely,
consistency posits that the consumer will want to purchase a product with an image
(positive or negative) that is congruent with his image about himself. This happens in
order to keep consistency between behavior and self-image beliefs (positive and negative
self-congruity) and to avoid behavior/self-image belief discrepancies (positive and
negative self-incongruity). The overall result of motivation to buy is the net effect arising
from the esteem and consistency needs.
Levy (1959) was among the first to mention the relation between self-image and product
image. He focused his research upon what image different products had. What he found
is that we buy not only for the utility of the product, but also for what it means, what it
symbolizes for us. He presumed that consumers preferred goods with a perceived image
that matched theirs. As this topic became more and more popular in the academic
environment, more research shed light upon the matter.
Birdwell (1968) was the first one to actually try and prove these arguments (up until this
point academics had only hypothesized these relationships). Having chosen to analyze
car brands, he selected a sample of 100 car owners and divided them into 4 groups,
corresponding to 4 car brands. Respondents were given a questionnaire containing 22
bipolar scales (e.g. sophisticated-unsophisticated, exciting-dull etc.). He found there are
significant differences in each ownership group’s perception of cars and that there is a
high degree of congruity of how respondents perceive their cars and themselves.
Other researchers (Grubb & Hupp, 1968) tried to replicate the study. They chose
Volkswagen car owners and Pontiac car owners (they assumed the projected images for
these 2 brands are significantly different) and asked them to rate themselves and the 2
different brands according to 16 bipolar scales. The findings were similar to that of
Birdwell (1968): consumers of the two different brands of cars perceived themselves
significantly different one from another and they had specific stereotype perceptions of

Self-image Congruence and Brand Preference: analysis by product usage role and level of country
development
9
the owners of each brand. Also, they perceived themselves to be like others who owned
the same car brand and quite different from owners of competing brands.
However, there is one limitation in the studies mentioned above, pointed out by Evans
(1968). Both studies analyzed consumers that already owned cars included in the study.
It is a rational assumption that product ownership may have influenced on the product
image or the self-image, resulting in a higher relation.
Dolich (1969) tested the relationship on a sample of 200 students and found that preferred
brands of products were perceived to be more similar to self-concepts than least preferred
product brands. Graeff’s research (1996) has very similar findings: the greater the degree
of congruence between brand image and self-image, the more favorable were subjects'
brand evaluations.
There is also research that diminishes or denies the importance of self-image congruence
altogether. Hughes and Guerrero (1971) argue that you cannot put all types of consumers
into one basket. They make the point that brand preference of some individuals
(especially innovators) can be explained better by incongruity rather than congruity, as
they want to stand out of the crowd. They suggest examination not only of self-congruity,
but social congruity, social incongruity, and self-incongruity as well. In their research,
Green, Maheshwari and Rao (1969) fails to confirm the relationship between self-
congruity and consumer choice at all. However, self-image congruence is generally
supported in the academic environment.
Furthermore, this research examines recent studies on self-image congruence and its
impact other different pre-consumption and post-consumption variables similar to brand
preference: brand personality, purchase intention, intention to recommend.
Kressmann et al. (2006) researched brand loyalty by asking 600 respondents to complete
a questionnaire with respect to their car, by choosing from the 15 brand personality facets
(honest, down to earth, etc.) that were appropriate for them. He found a direct positive
effect of self-congruence on brand loyalty.
Li, Wang and Yang (2011) studied the effects of self-image congruence on purchase
intention. Their sample was made of 477 respondents from 4 major cities in China. They
found that the more congruent an individual’s self-image is with corporate-brand image,
the higher the purchase intention tends to be.

Self-image Congruence and Brand Preference: analysis by product usage role and level of country
development
10
Usakli and Baloglu (2011) analyzed tourist destinations instead of regular consumer
products and used another research instrument. While most of the research in the 80’s
employed semantic differential, this one uses a 5-point Likert scale with 29 items. They
found that self-congruity has a positive impact on tourists’ behavioral intentions, intention
to return and to recommend.
Hosany and Martin (2012) also analyzed a service to see if the assumption of self-image
congruence’s positive impact still holds. Their sample were 169 cruise passengers. The
research employed a 7-point bipolar scale to rate cruisers' self-concept, experiences,
satisfaction, and intention to recommend. Their findings confirm the general accepted
ideas: higher congruity between customers’ self-concept and perceived images of other
tourists taking the same cruise contribute to overall favorable experiences.
Choi and Rifon (2012) focused their attention on goods that were endorsed by celebrities.
They analyzed how the consumers’ self-image related to that celebrity can influence the
individual’s attitude. Respondents had to watch an ad where a celebrity endorsed a
product. Then they completed a questionnaire about the ad. Findings suggest that
congruence between consumer’s self-image and celebrity image plays an important role
in endorsement process. More than that, the positive attitude towards the ad was higher
when the celebrity’s image was more congruent to the product image.
Peng, Wong and Wan (2012) made an attempt to compare genuine and counterfeit
products. They measured brand attitude, self-image and product’s image to test for
possible differences. Results show that the greater the congruence level between brand
image and self-image, the more favorable were subjects’ product evaluations. Findings
are valid for both genuine and counterfeit products.
Wu (2011) studied the effect of self-image congruence as a moderating variable between
brand evaluation and brand crisis (e.g. Nike’s brand crisis). Wu found that self-image
congruence is a moderating variable in brand crisis. Consumers with high self-image
congruence tend to be less influenced by the negative information available, and still hold
preference to that brand.
As can be seen from the literature review, there is a significant amount of evidence for
self-image congruence’s impact on brand preference, brand attitude, brand evaluation and
brand personality not only on consumer goods, but on services as well.

Self-image Congruence and Brand Preference: analysis by product usage role and level of country
development
11
Table 3 shows the different relationships that were studied with respect to self-image
congruence. A difference in research directions over the years can be observed. The first
papers were looking at the relationship between self-image congruence and the factors
that influenced the buyer before its purchase (purchase intentions, product preferences
and product choice). The second direction (started mainly after Sirgy’s paper from 1997)
was to extend self-image congruence concept over what happened in the post-
consumption period, including variables like satisfaction, loyalty, perceived quality and
attitudes. Prior studies show that self-image congruence is associated with better product
evaluation, greater satisfaction, and even higher purchase intention (e.g. Sirgy, 1985).
Table 3. Summary of relationships examined with respect to self-image congruence
Authors Study settings Dependent variables
Birdwell (1968) Automobile Brand ownership
Dolich (1969) Various
products
Product preference
Landon (1974) Various
products
Purchase intention
Belch and Landon
(1977)
Various
products
Purchase intention
Malhotra (1988) Houses Product choice
Hong and Zinkhan
(1995)
Automobile and
shampoos
Product preference, purchase
intention, memory
Ericksen (1996) Automobile Product preference, purchase
intention
Sirgy et al. (1997) Various:
products and
services
Brand preference, consumer
satisfaction, brand attitude, choice
Quester et al. (2000) Functional and
status related
products
Product evaluation
Ekinci and Riley
(2003)
Hospitality
services
Satisfaction, attitude, service quality
and purchase intention
Back (2005) Hospitality
services
Satisfaction
Kressmann et al.
(2006)
Automobile Brand loyalty
He and Mukherjee
(2007)
Retailing Satisfaction, perceived value,
loyalty
Jamal and Al-Marri
(2007)
Automobile Satisfaction, brand preference
Ekinci et al. (2008) Hospitality
services
Satisfaction, attitudes, intention to
return
Han and Back (2008) Hospitality
services
Consumption emotion, loyalty

Self-image Congruence and Brand Preference: analysis by product usage role and level of country
development
12
Ibrahim and Naijar
(2008)
Retailing Attitudes
Kwak and Kang
(2009)
Sports
merchandise
Perceived quality, purchase
intention Source: Hosany and Martin (2012)
1.4 Types of self-image congruence
Self-image congruence can be deconstructed into multiple facets. Table 1 from
subchapter 1.2 shows the various elements researchers analyze when referring to self-
image congruence. As it can be seen, the majority of consumer studies in marketing treat
the self as a two-component construct: actual and ideal. Simply put, the actual self-
concept is how you view yourself, while the ideal self-concept is how you would like to
be perceived by others in an ideal state (Hong and Zinkhan, 1995).
Others, however, go beyond the duality dimension. He and Mukherjee (2007) included
in their research the notions of actual self-image, ideal self-image, social self-image, and
ideal social self-image. The social self-concept has been defined as the image that one
believes others hold, while the ideal social self-concept denotes the image that an
individual would like others to have of him.
The current research chooses the dual dimension (actual and ideal) of self-image
congruence, because it receives the most empirical support in research (Kressmann et al.
2006). It is established there is common acceptance over the impact of self-image
congruence over brand preference. However, there are different opinions of how actual
and ideal self-image as separate constructs influence it.
Some academics argue that ideal self-image is more important. For example, Hong and
Zinkhan (1995) researched the two facets of self-image congruence relationship with
brand memory, brand attitude and purchase intentions. Findings suggest that ideal self-
congruency has more effect than actual self-congruency on purchase intentions and brand
attitude, regardless of the discrepancy between self-concept and product image. This may
happen because the consumer does not want to express himself when buying a product,
especially when his own self-image is negative (consumer does not like himself). It could
be that the individual wants to project some specific image that is seen positively by
others, his ideal self (Landon, 1974). This superiority of ideal self-image over actual self-
image is supported by recent studies as well (i.e. Hosany and Martin, 2012).

Self-image Congruence and Brand Preference: analysis by product usage role and level of country
development
13
Other researchers reached different conclusions. Ross (1971) analyzed consumption
preferences for automobiles and magazines in relation to self-image congruence (also
using the dual facet: actual and ideal). While evidence supported the general idea of
congruence and that individuals preferred brands that were more similar to their own
image, actual self-concept was in fact more accurate to describe consumption preference
than ideal self-concept for each of the six brands of both products.
The third possible outcome that research suggests is that neither actual self-image, nor
ideal self-image was dominant, with no significant differences between them when
analyzing brand preference. These findings were taken as evidence of a useless attempt
to distinguish the self-concept components. In touristic destinations, both ideal and actual
self-congruity stimulate the likelihood of having favorable attitudes (Usakli & Baloglu,
2011). In Dolich’s paper (1969) there is also no evidence that ideal self-image was more
closely related to consumer choice decisions than the real self-image for most preferred
brands. That is why some even question the necessity and practicality of making a
distinction among the aspects of self-concept (Onkvisit and Shaw, 1987). However, it is
justified theoretically. By analyzing different facets we can see if consumer behavior is
more influenced by what the individual is or what he tends to be (actual or ideal self).
Given the various opinions on the 2 facets of the self-image congruence (actual and ideal),
we formulate the following hypotheses:
H1a: Actual self-congruence has a significant and positive effect on brand
preference.
H1b: Ideal self-congruence has significant and positive effect on brand preference.
H2: Actual and ideal self-congruence are significantly and positively correlated.
1.5 Product conspicuousness
The idea that consumption can be used as a signal if far from new. It is commonly
associated with the American economist Thorstein Veblen, in his 1899 classic “The
theory of the Leisure class”, who coined the term to describe consumption that is
motivated by an attempt to advertise wealth. However, more simplified views over the
matter were present in the literature two millennia before, exemplified by Plato’s quote
from the beginning of chapter I.

Self-image Congruence and Brand Preference: analysis by product usage role and level of country
development
14
On a historical perspective, Veblen (1899) argued that social status is based on wealth
rather than intelligence, ethics or moral integrity. In this case, rich people spend sums of
money that have no other objective than showing their wealth. He named this
“conspicuous consumption”. Veblen’s linguistic construct has by now become so widely
used in popular culture that it has an entry in the English dictionary. It is defined as “lavish
or wasteful spending thought to enhance social prestige” (Merriam Webster Dictionary).
As consumers, many of us engage in it. As members of society, we often recognize it
when we see it.
Consumer behavior is defined not only by satisfying needs, but obtaining a prestige as
well. In case of some products, if the price is higher - the consumer is more decided to
purchase it, given that other members of society know it as well. According to Veblen
(1899), individuals and groups have, obviously, a powerful influence over attitudes and
behavior, which tends to become the expression of an imitation consumption. According
to the theory of social diffusion formulated by Veblen, inferior social classes imitate those
situated above. The influence is transmitted from top to bottom, from the rich to the poor,
as the “poor” classes seek a way to improve. The environment influence is reflected by
other two concepts, which are also along the line of conspicuous consumption: the
bandwagon effect and the snobbism effect (Dobre, 2000). The bandwagon effect serves
to explain the social phenomena associated to fashion. The consumer feels the need to be
alike other members from his environment. To do that, he will imitate their behavior –
will buy and use specific products that others do. The snobbism effect is the consumer’s
tendency to differentiate himself, through consumption of goods perceived as having high
value. This effect allows takes into consideration the influence of prestigious brands over
consumer behavior. To be appreciated by others, people seek to offer a self-image that is
as advantageous as possible. In social interactions, the individual is preoccupied with
leaving the best impression possible. That is why he might be determined to adopt certain
behaviors, especially buying behavior, for the simple fact of having a flattering self-
image.
As Heffetz (2007) points out, we do not live isolated from the world. Society and
consumption, along with similar domains, surround us as a socio-cultural phenomenon.
In relation to our self-image concept, the following questions appear:

Self-image Congruence and Brand Preference: analysis by product usage role and level of country
development
15
- When a person engages in an act of consumption because he wants to impress others
with that act of consumption, is he more concerned in projecting his actual or ideal self?
- When he consumes something because it provides him physical utility and others are
not necessarily observing his consumption, is he more concerned with his actual or ideal
self? (Ross, 1971)
From our natural understanding, the answer to these questions are self-evident truths. We
presume that when consumption of a product takes place mainly in public, the consumer
will be more concerned of others’ responses. Meaning, ideal self-concept, the image an
individual wants others to have of him, is likely to be more significant than actual self-
concept. On the other hand, when a product is consumed inconspicuously (in private),
he/she will not think of the image he projects towards others.
These self-evident truths have been largely debated (Sirgy, 1982). Multiple different
results emerge from this hypothesis. Most of the researchers assumed actual self-image
congruence to be more related to inconspicuous consumption, whereas ideal self-image
congruence to be more related to conspicuous consumption. Here is a brief literature
review on the various findings that are not consistent one with another.
The first group of researchers, with the example of Dolich (1969) found no support for
these assumptions. In his study, using a sample of 200 students, he chose beer and
cigarettes as visible consumption, soap and toothpaste as private consumption. After
crunching the data, self-congruence with most preferred brands of socially consumed
products was equal to self-congruence with most preferred brands of privately consumed
products.
The second group of academics found partial support for the influence of product
conspicuousness.
Onkvisit and Shaw (1987) argued there is a higher congruence between self-concept and
images of publicly consumed products and lower congruence between the self-concept
and images of products consumed privately, without differentiating ideal or actual self-
image.
Munson's study (1974) showed that preference for conspicuous products was related to
ideal self-concept for upper social class respondents. However, the relationship did not

Self-image Congruence and Brand Preference: analysis by product usage role and level of country
development
16
hold for lower class respondents, where preference was not related to either actual or ideal
self-concepts for either conspicuous or inconspicuous products.
Graeff (1996) examined the congruence between brand image and two types of self-
images (actual self-image and ideal self-image) and consumers' evaluation of two types
of brands (publicly and privately consumed). His findings suggested that consumers'
evaluations of publicly consumed brands were more affected by the congruence between
brand image and ideal self-image as compared to actual self-image (as hypothesized),
whereas actual and ideal congruence have equal effects on consumers' evaluations of
privately consumed brands (no support for the second part).
In his research, Ross (1971) expected to prove the same hypothesis as Dolich (1969). His
results showed that actual self-concept was in fact more similar to consumption
preference than ideal self-concept for each of the six brands of both products analyzed
(magazines and cars), regardless of conspicuousness.
Hong, Zinkhan (1995) obtained the opposite results of Ross (1971). Their data showed
ideal self-congruity to be a better predictor for brand preference than actual self-congruity
with both product classes used. They attributed the result to the likelihood of the human
tendency to aspire toward upgrading oneself to an ideal state. Consumers can satisfy their
desire to approach an ideal state by preferring the product that has an appeal consistent
with their ideal self-image rather than actual self-image.
The third group of academics has found some evidence for both parts of this hypothesis.
Khan and Bozzo (2012) analyzed eight brands of shoes and eight brands of toothpaste.
Upamannyu, Mathur and Bhakar (2014) chose seven mobile phone brands and seven
brands of soap. The sample in both studies was 400 respondents. Actual self-congruence
has no positive impact on brand preference in the context of role of product usage
(conspicuous), whereas the positive result was found in respect to actual self-congruence
on brand preference. At the same time, ideal self-congruence had a positive significant
effect on brand preference in the context of role of product usage (conspicuous) and there
was no effect of ideal self-congruence on brand preference in the context of role of
product usage (inconspicuous).
Due to the fact that the most recent findings suggest this assumption to be valid, the
following hypotheses are formulated:

Self-image Congruence and Brand Preference: analysis by product usage role and level of country
development
17
H3: Self-image congruence is significantly higher for conspicuous products rather
than inconspicuous products.
H4a: Relationship between actual self-congruence and brand preference is
stronger for inconspicuous products compared to conspicuous products.
H4b: Relationship between ideal self-congruence and brand preference is stronger
for conspicuous products as compared to inconspicuous products.
These hypotheses found strong support in other studies. In Jamal and Goode’s research
(2001) results show self‐image congruity to be a very strong predictor of consumers’
brand preferences. Respondents with higher levels of self‐image congruity were more
likely to prefer the brand as compared to those with lower levels of self‐image congruity.
In the context of type of product usage, Upamannyu, Mathur and Bhakar (2014) proved
H3, H4a and H4b, but for different types of products. Their findings are aligned with
those of Khan and Bozzo (2012).
1.6 Level of country development
A developing country is “one in which the majority lives on far less money—with far
fewer basic public services—than the population in highly industrialized countries”
(World Bank definition). The International Statistical Institute classifies Moldova as a
developing country, as are all the countries with the Gross National Income (GNI) less
than 11.905 USD, condition specified by the World Bank in 2012 (International Statistical
Institute). Gross national income (GNI) is defined as the sum of value added by all
producers who are residents in a nation, plus any product taxes (minus subsidies) not
included in output, plus income received from abroad such as employee compensation
and property income (Investopedia definition).
Portugal’s GNI per capita in 2013 was 25360 USD and Moldova’s GNI was 5190 USD
(World Bank). For a better understanding, figure 2 offers more information on the
difference of GNI per capita in several European countries and compares European levels
of GNI to the same indicator in Moldova. Also, the requirement of being classified as a
developed country is included in the graph.

Self-image Congruence and Brand Preference: analysis by product usage role and level of country
development
18
Figure 2. GNI per capita in several countries (2013)
Made according to data from World Bank for 2013
Even though over the last 35 years academics studied the relationship between self-image
congruence and brand preference (or other similar behavioral concepts), an analysis
between countries, to our knowledge, has not been done yet. Therefore it is relevant to
analyze the possible differences in the two types of countries of the relationship between
self-image congruence and brand preference.
People are attracted to and are involved in aspects of conspicuous consumption before
they have adequate food, clothing and shelter. That is, at almost every class level,
consumers have the desire to consume for social status (Belk, 1988). That is what
conspicuous consumption represents: the desire to be recognized and obtain social status.
Evidence that conspicuous consumption is related to projecting the ideal self is given by
Kempen (2003). His research suggests that consumption of counterfeit goods (as status
signaling device) is popular among low-income consumers in developing countries.
Another research from India supports this relationship. Bloch, Rao and Desai (2004)
considered wedding celebrations as conspicuous consumption. They show how in rural
India, the wedding budget is a status signaling attempt. The celebration size is a signal of
the groom’s family wealth and, thus, the improved social status that the bride’s family
gets. Charles, Hurst and Roussanov (2009) present a model of status-seeking and
conspicuous consumption in which individuals use conspicuous spending as a signal of
income. There is growing theoretical literature that suggest visible consumption should
rise as poorer persons are added to a reference group. Research shows that visible
consumption both within and across races falls as the mean of reference group income
rises. These findings suggest conspicuous consumption patterns to be the same across
countries.

Self-image Congruence and Brand Preference: analysis by product usage role and level of country
development
19
In his book, Assael (2004) explains how cultures are becoming closer in terms of
consumer behavior. Tastes in music, fashion, and technology among the young are
similar across the world and this process will continue to deepen. It implies that self-
image congruence across countries would not be significantly different.
De Mooij’s (2003) findings are not completely aligned with those presented by Assael
(2004), the statement being true for only certain products. There is both convergence and
divergence in consumer behavior across countries. If products converge across countries,
convergence is weakest in economically heterogeneous regions and strongest in
economically homogeneous regions. Also, consumers in developing countries tend to
be less individualistic than in developed ones. They care more for a larger local
community, and like to be identified as part of it. This might suggest significant
differences in self-image congruence across countries.
Given the contradictory findings, we formulate the following hypotheses:
H5a: Relationship between self-image congruence and brand preference in a
developing country is significantly different than the one in a developed country.
H5b: Self-image congruence is significantly different for the two types of countries.
Conclusion. As discussed in the first chapter, a body of research shows self-image
congruence to have a significant impact over brand preference. Even though there are
multiple facets to self-image congruence, only two of them get the most attention in
academic research (actual and ideal), which is the main reason the current analysis will
focus on them. Product conspicuousness is seen to influence the relationship between
self-image congruence and brand preference, with the ideal being more important for
conspicuous products, and actual – with inconspicuous ones. However, results are mixed,
with some researchers supporting it, others - only partially. The level of country
development could be a cause for differences in self-image congruence. However,
research findings vary over this matter.
Self-image Congruence and Brand Preference: analysis by product usage role and level of country
development
20
Chapter II. Methodology
Introduction. The second chapter aims to describe the methodological approach used in
the research. The research aim, hypothesis and model are defined in more detail in relation
to the theoretical review from the first chapter. Furthermore, the development of the
questionnaire and its measurement scales are presented along with the data collection
procedure. Afterwards the methods that were used for the data analysis are discussed.
2.1 Research aim
The research aim is to elaborate an empirical investigation of actual/ideal self-image
congruence and measure the relationship between self-image congruence and brand
preference.
2.2 Research hypotheses and model
A research model involves a set of assumptions. It shows, more in a hypothesized form,
a formal representation of theory and the relationship between the main theoretical
constructs.
Actual self-congruence and ideal self-congruence are the independent variables and brand
preference is the dependent variable. The same model was created for each individual
brand, all together and for conspicuous and inconspicuous groups apart. With this
purpose, additional variables have been computed.
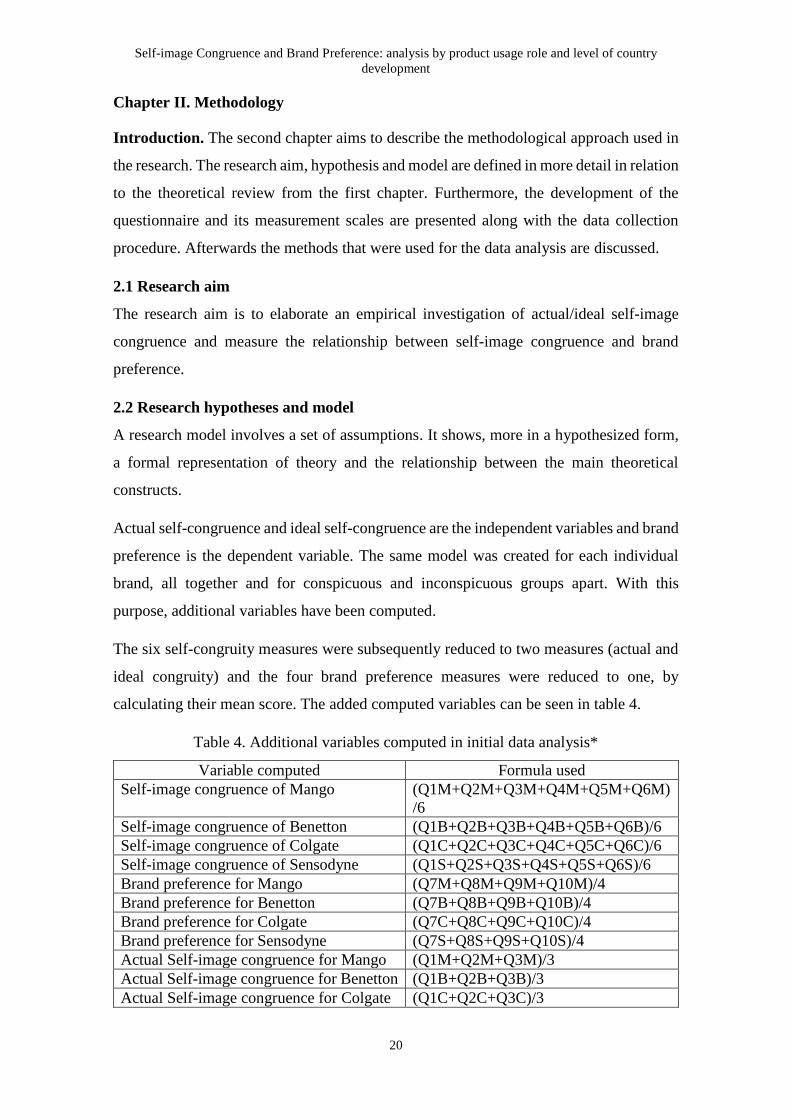
The six self-congruity measures were subsequently reduced to two measures (actual and
ideal congruity) and the four brand preference measures were reduced to one, by
calculating their mean score. The added computed variables can be seen in table 4.
Table 4. Additional variables computed in initial data analysis*
Variable computed Formula used
Self-image congruence of Mango (Q1M+Q2M+Q3M+Q4M+Q5M+Q6M)
/6
Self-image congruence of Benetton (Q1B+Q2B+Q3B+Q4B+Q5B+Q6B)/6
Self-image congruence of Colgate (Q1C+Q2C+Q3C+Q4C+Q5C+Q6C)/6
Self-image congruence of Sensodyne (Q1S+Q2S+Q3S+Q4S+Q5S+Q6S)/6
Brand preference for Mango (Q7M+Q8M+Q9M+Q10M)/4
Brand preference for Benetton (Q7B+Q8B+Q9B+Q10B)/4
Brand preference for Colgate (Q7C+Q8C+Q9C+Q10C)/4
Brand preference for Sensodyne (Q7S+Q8S+Q9S+Q10S)/4
Actual Self-image congruence for Mango (Q1M+Q2M+Q3M)/3
Actual Self-image congruence for Benetton (Q1B+Q2B+Q3B)/3
Actual Self-image congruence for Colgate (Q1C+Q2C+Q3C)/3

Self-image Congruence and Brand Preference: analysis by product usage role and level of country
development
21
Actual Self-image congruence for
Sensodyne
(Q1S+Q2S+Q3S)/3
Ideal Self-image congruence for Mango (Q4M+Q5M+Q6M)/3
Ideal Self-image congruence for Benetton (Q4B+Q5B+Q6B)/3
Ideal Self-image congruence for Colgate (Q4C+Q5C+Q6C)/3
Ideal Self-image congruence for Sensodyne (Q4S+Q5S+Q6S)/3
Self-image congruence conspicuous prod. (Q1M+Q2M+Q3M+Q4M+Q5M+Q6M
+Q1B+Q2B+Q3B+Q4B+Q5B+Q6B)/1
2
Self-image congruence inconspicuous prod. (Q1C+Q2C+Q3C+Q4C+Q5C+Q6C+Q
1S+Q2S+Q3S+Q4S+Q5S+Q6S)/12
Brand preference conspicuous products (Q7M+Q8M+Q9M+Q10M+Q7B+Q8B
+Q9B+Q10B)/8
Brand preference inconspicuous products (Q7C+Q8C+Q9C+Q10C+Q7S+Q8S+Q
9S+Q10S)/8
Ideal Self-image cong. conspicuous prod. (Q4M+Q5M+Q6M+Q4B+Q5B+Q6B)/
6
Actual Self-image cong. conspicuous prod. (Q1M+Q2M+Q3M+Q1B+Q2B+Q3B)/
6
Ideal Self-image cong. inconspicuous prod. (Q4C+Q5C+Q6C+ Q4S+Q5S+Q6S)/6
Actual Self-image cong. inconspicuous
prod.
(Q1C+Q2C+Q3C+Q1S+Q2S+Q3S)/6
General self-image congruence (Q1M+Q2M+Q3M+Q4M+Q5M+Q6M
+Q1B+Q2B+Q3B+Q4B+Q5B+Q6B+Q
1C+Q2C+Q3C+Q4C+Q5C+Q6C+Q1S
+Q2S+Q3S+Q4S+Q5S+Q6S)/24
General brand preference (Q7M+Q8M+Q9M+Q10M+Q7B+Q8B
+Q9B+Q10B+Q7C+Q8C+Q9C+Q10C
+Q7S+Q8S+Q9S+Q10S)/16
General actual self-image congruence (Q1M+Q2M+Q3M+Q1B+Q2B+Q3B+
Q1C+Q2C+Q3C+Q1S+Q2S+Q3S)/12
General ideal self-image congruence (Q4M+Q5M+Q6M+Q4B+Q5B+Q6B+
Q4C+Q5C+Q6C+ Q4S+Q5S+Q6S)/12 *Formula components are displayed according to Appendix 1 “Questions”
The current research’s model is represented in Figure 3, where “actual” = actual self-
image congruence, “ideal” = ideal self-image congruence, “pref” = Brand Preference;
each being constructed through a multitude of factors.

Self-image Congruence and Brand Preference: analysis by product usage role and level of country
development
22
Figure 3. Model Representation for an Individual Brand
The model will test the following hypotheses previously discussed in the literature
review:
H1a: Actual self-congruence has a significant and positive effect on brand preference.
H1b: Ideal self-congruence has a significant and positive effect on brand preference.
H2: Actual and ideal self-congruence are significantly and positively correlated.
H3: Self-image congruence is significantly higher for conspicuous products rather than
inconspicuous products.
H4a: Relationship between actual self-congruence and brand preference is stronger for
inconspicuous products compared to conspicuous products.
H4b: Relationship between ideal self-congruence and brand preference is stronger for
conspicuous products as compared to inconspicuous products.
H5a: Relationship between self-image congruence and brand preference in a developing
country is significantly different than the one in a developed country.
H5b: Self-image congruence is significantly different for the two types of countries.
Following the footsteps of Ross (1971), Hong and Zinkan (1995), the current research
analyzed clothing brands as goods consumed publicly and toothpaste brands as goods
consumed privately. Products were selected with a view that respondents are familiar with
them and these are accessible and affordable to all social classes and also used by all ages
and education levels. Two types of products on the basis of usage were selected:

Self-image Congruence and Brand Preference: analysis by product usage role and level of country
development
23
toothpaste (there is not no common awareness of what toothpaste your friends use) and
clothing (they are likely to be evaluated using symbolic criteria).
An exploratory research was conducted in order to find the right number of brands to use.
A pre-test questionnaire was first launched in Moldova with 5 brands in each category
(the most popular ones), to check for response rate and questionnaire reliability. Clothing
brands were Mango, Oodji, Benetton, Aridon and Motivi. Toothpaste brands were
Colgate, Blend a Med, Sensodyne, Aquafresh and 32 Ulybka. A sample of 55 responses
were collected. Even though choosing a large number of brands has the advantage of
increasing generalizability and robustness of the measurement scale, the preliminary
questionnaire contained evidence of subject fatigue and boredom, which potentially could
result in response bias. The dropout rate was 29% (out of 55 responses, 16 were only half-
way done). In addition, 3 more had to be dropped due to missing values.
To minimize this problem, two brands were chosen from each type to be included in the
research. For the remaining 36 responses a reliability analysis was done. The Cronbach’s
alpha was high for all brands, and we chose the two brands in each category that were
popular both in Moldova and Portugal (due to type of country as moderating variable).
Mango and Benetton were chosen as clothing brands and Colgate and Sensodyne - as
toothpaste brands.
2.3 Research instrument, questions and scales.
Before Sirgy’s paper from 1997, the common method of measuring the self-concept
involved the use of semantic differential scales or bipolar Likert-type scales (Grubb and
Hupp, 1968; Malhotra, 1981). In the case of semantic differential scales, the self-concept
profile of a person in terms of selected personality traits was generally obtained (e.g.
adventurous, young, classic, and stylish). The second part of the questionnaire collected
the individual’s perceptions of a brand on the same traits. In the case of bipolar Likert-
type scales, at one end of the scale was an attribute, while at the other – the opposite
characteristic (e.g. classic-modern, young-old, and adventurous-safe). By comparing the
two profiles, the researchers could identify the match/gap between the person’s self-
concept and his/her perception of the personality of the brand.
Sirgy et al. (1997) identified three important problems with traditional methods as
follows:

Self-image Congruence and Brand Preference: analysis by product usage role and level of country
development
24
- Use of discrepancy scores. The method only combined two constructs together: a list of
chosen adjectives about the respondent with a list of chosen adjectives about the
brand/product. It would be more reliable if researchers could measure self-congruity in a
more direct way.
- Possible use of irrelevant images. The research instrument also has a list of attributes
built in. This way, respondents have to indicate their possible congruence with images
that may or may not be relevant. It would be better if a research instrument could capture
self-congruity through images that are conjured up by subjects at the moment of response
and not predefined.
- Possible use of compensatory decision rule. Respondents feel self-congruity through a
multitude of images. It is not possible to include all of them in the research, or not to
include others that may seem appropriate, but do not really attribute to the product. The
predictive value could be increased if self-congruence was to be measured globally
instead of dimension-based.
Based on these shortcomings, Sirgy et al. (1997) proposed an alternative method. The
new method measured the self-image congruence directly rather than through the use of
a list of adjectives. The instrument guided respondents to rate their self-image congruence
globally. In their study, Sirgy et al. (1997) compared the predictive validity of these two
methods over six studies involving different customer groups, products, consumption
settings, and dependent variables. Their findings provide significant support for high
validity of the new method over and beyond the traditional one. This is the main reason
for us to choose the measures of self-image congruence and brand preference from the
new method reported by Sirgy et al. (1997).
The constructs of actual self-congruence and ideal self-congruence were measured on 3-
items scale for each. Whereas the construct ‘brand preference’ was measured on 4-item
scale adopted by Sirgy et al (1997). All questions can be seen in Appendix 1. The
expressions used in the questionnaire for actual self-congruence are: “The typical person
who uses this brand is very much like me”, “Having this brand is consistent with how I
see myself”, “The image of the typical customer of this brand is similar with how I see
myself”. The expressions used in the questionnaire for ideal self-image congruence are:
“The typical person who uses this brand is very much like the person I would like to
become”, “Having this brand is consistent with how I would like see myself”, “The image

Self-image Congruence and Brand Preference: analysis by product usage role and level of country
development
25
of the typical customer of this brand is similar with how I would like to see myself”. The
expressions used in the questionnaire for brand preference are: “I like this brand better
than any other brand”, “This brand is my preferred brand over all other brands”, “I would
be inclined to buy this brand over any other brand”, and “I would be inclined to buy this
brand over any other brand”.
All items used for this study were measured on 7-point Likert scale from strongly disagree
(1) to strongly agree (7). Table 5 shows a summary of research instruments used in
studying the self-concept or self-image congruence along the years.
Table 5. Summary of research instruments used in self-concept / self-image congruence
Authors Type of scale
Birdwell, A.E. (1968) Semantic differential scale
Grubb, L., Hupp, G. (1968) Semantic differential scale
Dolich, I. (1969) Semantic differential scale
Ross, I. (1971) Semantic differential scale
Malhotra (1981) Semantic differential scale
Hong and Zinkhan (1995) Combined a 7-point Likert scale
with bipolar evaluative items
Sirgy, J., Grewal, D., Mangleburg, T.F., Park,
J., Chon, K., Claiborne, C.B., Johar, J.S. and
Berkman, H. (1997)
Likert scale (from current paper
Sirgy et al., 1997)
Jamal, A., Al-Marri M. (2007) Likert scale (from Sirgy et al., 1997)
Li, Y., Wang, X. and Yang, Z. (2011) Likert scale (from Sirgy et al., 1997)
Wu, J. (2011). Likert scale (from Sirgy et al., 1997)
Khan, M., Bozzo, C. (2012). Likert scale (from Sirgy et al., 1997)
Upamannyu, N., Mathur, G. and Bhakar, S.
(2014)
Likert scale (from Sirgy et al., 1997)
Source: Made by author.
2.4 Data gathering methods and sample
The survey method was used for data collection. The sample of the current study is
divided into 3 sub-groups: students from Moldova, students from Portugal and Erasmus
students of different nationalities.

Self-image Congruence and Brand Preference: analysis by product usage role and level of country
development
26
The services of Qualtrics online platform were used for online collection of responses.
There were 3 versions of the questionnaire for the different subgroups: in English,
Romanian and Portuguese.
A sample of 114 respondents from Moldova was collected, out of which 11 responses
were dropped due to missing values. Subgroup sample was 103 responses.
The Portuguese questionnaire was distributed through the university’s e-mail list of
students enrolled in Fernando Pessoa. An application to the Ethics Commission was sent
to obtain approval of this action (see Appendix 2). As result, a sample of 87 respondents
was collected, out of which 7 responses were dropped due to missing values. Subgroup
sample was 80 responses.
The third sub-group consisted of foreign students that were once on Erasmus in Porto, but
are not anymore. The distribution of the questionnaire was made online through the
researcher’s friend list. A number of 35 respondents was collected, out of which 4
responses were dropped due to missing values. Subgroup sample was 31 responses.
When the data was imported in SPSS, the whole sample of 214 respondents was checked
for outliers. The software flagged 6 respondents, which upon a closer inspection, were
found to have only “1” scores from a 1 to 7 scale on all questions. They were deleted from
the sample. Final sample consisted of 102 respondents from Moldova, 76 respondents
from Portugal and 30 Erasmus students, a total of 208 answers.
Most of the respondents are students. Because of time, distance and money
considerations, students are often used as quick and convenient sources of information.
Although use of student samples and ‘young consumers’ is limited in representing the
broader population, it has been heavily debated that student samples are appropriate for
theory testing. Any sample is relevant if it permits operationalization within the domain
of the theory.
Studies were made to determine whether students can be used as sample to represent
another group. Enis, Cox and Stafford (1972), Shuptrine (1975) made studies to compare
the answers students and housewives gave. The accumulating empirical evidence shows
that sometimes students are good predictors of housewives’ behavior, and sometimes they
are not. The results tended to be inconclusive. Khera and Benson (1970) researched the

Self-image Congruence and Brand Preference: analysis by product usage role and level of country
development
27
potential of using student samples for the analysis of businessmen. They concluded that
students may be good substitutes for businessmen under certain conditions.
More recent studies also support use of student sample. Ok, Shanklin and Back’s (2008)
study encourage the use of student samples in theory testing and/or applied research
contributes to the body of literature. Following this line of thought, Herbst and Schwarz
(2011) researched student sample validity in negotiation research and concluded that
sampling with student groups is applicable in general — as soon as these groups have
received some kind of specific negotiation training.
For an MA candidate, the university supplies entire classrooms of potential respondents
that are available at little or no cost. They generally follow instructions rapidly and
accurately. Academics agree that usefulness of student subjects depends, in part, upon the
context of the research—its problem, objectives, and hypotheses. Given the present
research, a student sample is considered appropriate, as individuals aged 18-25 (which
most of the sample consists of) have the most product involvement when it comes to
conspicuous consumption of clothes. A teen is most concerned of projecting an image
towards other individuals.
Also, with a student sample, the issue of brand awareness is minimized. The questions
presume respondents know Mango, Benetton, Colgate and Sensodyne, and a student
sample has the highest chances of having an opinion towards them.
Conclusion. As discussed, the research model, questions and scales are adapted from
similar researches. The research instrument was taken from Sirgy (1997), which had
several advantages over the research instrument of Malhotra (1981): not using
discrepancy scores, avoiding possible use of irrelevant images and measuring the
constructs globally instead of dimension-based. Variable constructs are similar to those
of Khan & Bozzo (2012), and Upamannyu, Mathur & Bhakar (2014). Actual self-
congruence and ideal self-congruence are the independent variables and brand preference
is the dependent variable. The same model was created for each individual brand, all 4
brands together and for conspicuous and inconspicuous groups apart. Data gathering
methods and use of student samples were justified by previous research.

Self-image Congruence and Brand Preference: analysis by product usage role and level of country
development
28
Chapter III. Model Analysis. Analysis, implications and discussion of results.
Introduction. The chapter begins by providing a demographic description on the current
sample. To support the evidence obtained, validity and reliability of the scales used was
examined, along with model tests. SPSS IBM© and SmartPLS© softwares were used to
analyze the data. Confirmatory Factor Analysis (CFA) was used to test if measures of a
construct correspond with the researcher’s comprehension of the nature of that construct
(construct validity). Factor analysis allows to condense a large set of variables or scale
items down to a smaller, more manageable number of dimensions or factors. It does this
by summarizing the underlying patterns of correlation and looking for groups of closely
related items (Mulaik, 2009). The chapter concludes by testing each hypothesis and
analyzing its results in terms of relationship values between constructs and mean
differences.
3.1 Sample descriptive statistics
A brief analysis over the demographics of the sample is presented: country, age, income,
and number of family members.
Table 6. Sample age distribution over countries
Age Total Moldova sample Portugal sample Erasmus sample
18-25 75% 89,3% 47,35% 96,67%
26-35 14,4% 10,7% 23,7% 3,33%
36-45 5,7% 0% 15,8% 0%
>45 4,9% 0% 13,15% 0%
Most of the respondents are aged 18-25, as it is a student sample. The percentages for 36
years and older in Portugal is higher, as the questionnaire was distributed through the e-
mail database of the university, which included Alumni as well.
Table 7. Sample gender distribution over countries
Sex Total Moldova sample Portugal sample Erasmus sample
Male 28,8% 30,4% 22,4% 40%
Female 71,2% 69,6% 77,6% 60%

Self-image Congruence and Brand Preference: analysis by product usage role and level of country
development
29
Each country group has more female respondents than male respondents. The male-
female ratio does not vary significantly across countries, with 61%-77% females in each
country sample.
Table 8. Sample income distribution across countries
Income levels Total Moldova
sample
Portugal
sample
Interval 1 (<3000 MDL for Moldova and
>500€ for Portugal)
5,8% 6,9% 2,6%
Interval 2 (3001-5000 MDL for Moldova
and 501-1000€ for Portugal)
22,1% 12,7% 35,5%
Interval 3 (5001-7000 MDL for Moldova
and 1001-1500€ for Portugal)
25% 25,5% 23,7%
Interval 4 (7001-9000 MDL for Moldova
and 1501-2000€ for Portugal)
20,7% 26,5% 18,5%
Interval 5 (>9000 MDL for Moldova and
>2000€ for Portugal)
26,4% 28,4% 19,7%
*Exchange rate at the time of questioning was 18 MDL for 1 Euro. Intervals were chosen according to
national average income.
Income distribution intervals are the same in both Moldova and Portugal. In each group,
except group 1, there are around 20-25% of people.
Table 9. Number of family members in country samples
Nr. of family
members
Total Moldova
sample
Portugal
sample
Erasmus
sample
1 5,3% 1% 10,5% 6,7%
2 8,2% 5,9% 11,8% 6,6%
3 21,6% 14,7% 32,9% 16,7%
4 46,7% 54,9% 35,5% 46,7%
5 13,9% 17,6% 6,7% 20%
>5 4,3% 5,9% 2,6% 3,3%
The frequencies of each group are the same across countries. Most of the people have a
family of 4 members. A family with 3 members is the second least popular overall.

Self-image Congruence and Brand Preference: analysis by product usage role and level of country
development
30
Table 10. Student percentage across country samples
% of
students
Total Moldova
sample
Portugal
sample
Yes 73,1% 73,5% 68,4%
No 26,9% 26,5% 31,6%
As the table shows, most of the respondents are students, ranging from 68% to 73% in
country samples.
3.2 Descriptive analysis and normality of the variables
Prior to performing the statistical analyses to check our hypotheses (t-test, ANOVA,
correlations, regression), it is required to check that we are not violating any of the
assumptions made by the individual tests. Testing these assumptions means obtaining
descriptive statistics on our variables, like the mean, standard deviation, skewness and
kurtosis.
Standard deviation is needed in addition to the average, as it is a measure used to quantify
the amount of variation of a set of values.
The skewness value provides an indication of the symmetry of the distribution. If the
distribution is perfectly normal, a sample would have a skewness and kurtosis value of 0.
However, in real situations, it is an uncommon occurrence (Pallant, 2010).
Positive skewness values indicate positive skew (scores clustered to the left at the low
values). Negative skewness values indicate a clustering of scores at the high end (right-
hand side of a graph).
Kurtosis, on the other hand, provides information about the “peakedness” of the
distribution. Positive kurtosis values indicate that the distribution is rather peaked
(clustered in the center) with long thin tails. Kurtosis values below 0 indicate a
distribution that is relatively flat (too many cases in the extremes).
With reasonably large samples, skewness will not “make a substantive difference in the
analysis”. Kurtosis can result in an underestimate of the variance, but this risk is also
reduced with a large sample of more than 200 cases (Pallant, 2010).

Self-image Congruence and Brand Preference: analysis by product usage role and level of country
development
31
Table 11. Descriptive statistics for individual variables
Summated scales Mean Standard
Deviation
Skew
ness
Kurto
sis
Self-Image Congruence Mango 3.51 1.77 0.08 -1.15
Self-Image Congruence Benetton 3.09 1.59 0.38 -0.78
Self-Image Congruence Colgate 3.60 1.80 0.07 -1.03
Self-Image Congruence Sensodyne 3.74 1.74 -0.09 -1.03
Brand preference Mango 3.27 1.86 0.27 -1.14
Brand preference Benetton 2.74 1.68 0.74 -0.47
Brand preference Colgate 4.01 1.92 -0.12 -1.18
Brand preference Sensodyne 4.31 1.81 -0.22 -0.87
Actual Self-Image Congruence Mango 3.50 1.75 0.11 -1.02
Actual Self-Image Congruence Benetton 3.05 1.64 0.42 -0.84
Actual Self-Image Congruence Colgate 3.69 1.91 0.07 -1.12
Actual Self-Image Congruence Sensodyne 3.91 1.85 -0.11 -1.12
Ideal Self-Image Congruence Mango 3.53 1.93 0.13 -1.28
Ideal Self-Image Congruence Benetton 3.12 1.73 0.38 -0.95
Ideal Self-Image Congruence Colgate 3.50 1.90 0.12 -1.10
Ideal Self-Image Congruence Sensodyne 3.56 1.87 0.07 -1.07
As can be seen from the above table, most of the skewness varies between -0.22 and 0.42,
an exception being 0.74 for Benetton brand preference. Most of the values are positive,
which means that in most cases scores are clustered to the left.
All the Kurtosis values are negative, most of them ranging from -0.78 to -1.28, an
exception being again the distribution for Benetton brand preference scores (-0.47). It
means that distribution of scores for the variables is relatively flat in all the cases.
Many of the statistical techniques used later on assume that the distribution of scores on
the dependent variable is normal. Normal is used to describe a symmetrical, bell-shaped
curve, which has the greatest frequency of scores in the middle, with smaller frequencies
towards the extremes. It was assessed partially through skewness and kurtosis values
presented above.

Self-image Congruence and Brand Preference: analysis by product usage role and level of country
development
32
However, a more detailed perspective can be offered through the Kolmogorov-Smirnov
statistic. This assesses the normality of distribution of scores. A non-significant result
(Sig value of more than 0.05) indicates normality. In our cases, all ideal self-image
congruence, actual self-image congruence and brand preference variables have a sig value
of less than 0.05 (all of them scoring 0.000-0.001), suggesting violation of the assumption
of normality. This is quite common in larger samples (Cone and Foster, 2006).
Statistics writers argue that most of the approaches are fairly “robust”: that is, they will
tolerate minor violations of assumptions, particularly if the study has a good size sample.
Cone and Foster (2006) present an easy-to-follow review of the robustness of different
tests to defend this argument.
3.3 Reliability tests
An important aspect to a study is to find scales that are reliable. One of the main issues
concerns the scale’s internal consistency. This refers to the degree to which the items that
make up the scale “hang together”. One of the most commonly used indicators of internal
consistency is Cronbach’s alpha coefficient. Ideally, the Cronbach alpha coefficient of a
scale should be above 0.7. It is necessary to check that each of the scales are reliable with
this particular sample.
Table 12. Cronbach’s Alfa for individual variables: SPSS analysis
Cronbach’s Alfa
Actual self-image congruence Mango 0.921
Actual self-image congruence Benetton 0.916
Ideal self-image congruence Mango 0.939
Ideal self-image congruence Benetton 0.929
Brand preference Mango 0.955
Brand preference Benetton 0.950
Actual self-image congruence Colgate 0.938
Actual self-image congruence Sensodyne 0.922
Ideal self-image congruence Colgate 0.941
Ideal self-image congruence Sensodyne 0.935
Brand preference Colgate 0.968
Brand preference Sensodyne 0.957

Self-image Congruence and Brand Preference: analysis by product usage role and level of country
development
33
As can be seen, the three variables measured (actual self-image, ideal self-image and
brand preference) for each of the four brands have reliable scales, with the lowest value
being 0.916. Let’s compare the reliability values to the ones in similar research.
Table 13. Reliability values in other studies
Actual self-
congruence scale
Ideal self-
congruence scale
Brand
preference scale
Upamannyu, Mathur and
Bhakar (2014)
0.830 0.812 0.872
Khan, Bozzo (2012) 0.885 0.827 0.877
The reliability values of the current study are higher than previous ones, which is a
positive indicator.
Besides Cronbach’s Alfa, another reliability indicator is Composite Reliability. To
confirm validity, the composite reliability indicator has to be greater than 0.7. As can be
seen from Table 14, the condition is satisfied. The Composite Reliability ranges from
0.843 to 0.943.
Table 14. PLS: Composite Reliability
Model analyzed Actual Self-Image
Congruence
Ideal Self-Image
Congruence
Brand
Preference
Aggregated (all 4) 0.908 0.926 0.907
Conspicuous 0.910 0.919 0.943
Inconspicuous 0.865 0.912 0.843
3.4 Validity tests
The concept of "average variance extracted" (AVE) was introduced in 1981 (Fornell and
Larcker). This indicator measures the amount of variance that is explained by the
construct in relation to the amount of variance attributed to measurement error. If the
average variance extracted is less than 0.40 (Blunch, 2013), the convergent validity of the
construct is questionable.

Self-image Congruence and Brand Preference: analysis by product usage role and level of country
development
34
Table 15. PLS: Average Variance Extracted
Model analyzed Actual Self-Image
Congruence
Ideal Self-Image
Congruence
Brand
Preference
Aggregated (all 4) 0.455 0.513 0.398
Conspicuous 0.630 0.656 0.675
Inconspicuous 0.537 0.638 0.446
It can be observed that all AVEs are higher than 0.40, an exception being brand preference
in the aggregated model, which is very close to the limit.
The objective of Confirmatory Factor Analysis is to check if the data fits the pre-
established hypothesized measurement model (Jöreskog, 1969).The research instrument
aims to measure several constructs, with each construct measured using multiple items
which are combined in a smaller number of factor scores. Item cross-loadings indicate
how strongly each item loads on each other factor.
Table 16. PLS: Significance Measures of the relationships towards Brand Preference
Model analyzed Actual Self-Image
Congruence
Ideal Self-Image
Congruence
Aggregated (all 4) 3.218** 3.738***
Conspicuous 2.863** 5.630***
Inconspicuous 3.761*** 2.684**
Mango 2.529* 6.144***
Benetton 2.381* 5.598***
Colgate 5.030*** 5.032***
Sensodyne 4.271*** 3.400***
*Significant at 95% confidence level ** Significant at 99% confidence level
***Significant at 99.9% confidence level
Total Variance Explained is an indicator that shows the proportion to which a research
model accounts for the variation of a given data set. Across all models, Total Variance
Explained ranges from 0.44 to 0.66.
Table 17. Total Variance Explained
Model Aggregated Consp. Inconsp. Mango Benetton Colgate Sensodyne
Value 0.553 0.563 0.460 0.664 0.534 0.574 0.441

Self-image Congruence and Brand Preference: analysis by product usage role and level of country
development
35
We can observe the current model is working better for conspicuous rather than
inconspicuous products, as the difference between their total variances explained is 0.10.
3.5 Model tests
Table 18. CFA Factor Loadings Range (PLS)
Model analyzed Actual Self-Image
Congruence
Ideal Self-Image
Congruence
Brand
Preference
Aggregated (all 4) 0.54 – 0.77 0.62 – 0.77 0.35 – 0.79
Conspicuous 0.70 – 0.85 0.77 – 0.84 0.79 – 0.86
Inconspicuous 0.40 – 0.90 0.68 – 0.90 0.31 – 0.90
Mango 0.90 – 0.95 0.91 – 0.96 0.86 – 0.99
Benetton 0.87 – 0.97 0.92 – 0.95 0.64 – 0.99
Colgate 0.93 – 0.96 0.85 – 0.97 0.87 – 0.99
Sensodyne 0.91 – 0.94 0.92 – 0.95 0.93 – 0.95
The range is more volatile in case of factor loadings for brand preference in the aggregated
model and the inconspicuous model and for actual self-image congruence in the
inconspicuous model (because of Sensodyne measurement factors). More details are
shown in tables 19 and 20 below, where the cross loadings are shown.

Self-image Congruence and Brand Preference: analysis by product usage role and level of country
development
36
Table 19. Cross Loadings for general, conspicuous and inconspicuous models
A
G
G
R
E
G
A
T
E
D
M
O
D
E
L
Actual Ideal Pref Actual Ideal Pref
Q1B 0,617782 0,516343 0,413276 Q1B 0,701505 0,546737 0,450546
C
O
N
S
P
I
C
U
O
U
S
M
O
D
E
L
Q1C 0,581293 0,474961 0,455206 Q1M 0,808737 0,666734 0,592855
Q1M 0,727877 0,617749 0,562122 Q2B 0,763630 0,579480 0,460967
Q1S 0,545013 0,459481 0,303038 Q2M 0,847716 0,716902 0,615680
Q2B 0,674390 0,553725 0,438438 Q3B 0,792744 0,659693 0,515653
Q2C 0,639972 0,547221 0,484894 Q3M 0,838609 0,768384 0,635307
Q2M 0,768230 0,669752 0,593037 Q4B 0,607519 0,772083 0,545901
Q2S 0,666185 0,570658 0,403459 Q4M 0,687205 0,838680 0,644890
Q3B 0,725343 0,654602 0,500333 Q5B 0,639991 0,775731 0,540284
Q3C 0,633649 0,566788 0,471983 Q5M 0,674529 0,833029 0,639969
Q3M 0,776231 0,731225 0,613435 Q6B 0,703334 0,802677 0,562683
Q3S 0,695243 0,624667 0,444806 Q6M 0,738891 0,835842 0,630497
Q4B 0,602684 0,717236 0,519505 Q7B 0,584034 0,622604 0,790698
Q4C 0,583000 0,662781 0,449891 Q7M 0,639220 0,702845 0,837975
Q4M 0,678365 0,764554 0,622637 Q8B 0,542409 0,580836 0,818738
Q4S 0,643626 0,748066 0,433041 Q8M 0,564516 0,644846 0,859268
Q5B 0,607220 0,702368 0,509414 Q9B 0,529606 0,516171 0,803734
Q5C 0,546770 0,628901 0,442263 Q9M 0,582466 0,609942 0,836635
Q5M 0,644857 0,729983 0,607325 Q10B 0,536770 0,538834 0,808296
Q5S 0,598636 0,701037 0,397718 Q10M 0,574751 0,590240 0,815146
Q6B 0,682665 0,762125 0,561182 Q1C 0,876942 0,620565 0,641782
I
N
C
O
N
S
P
I
C
U
O
U
S
M
O
D
E
L
Q6C 0,569168 0,668606 0,490577 Q1S 0,404855 0,357280 0,171067
Q6M 0,696442 0,770034 0,626053 Q2C 0,924633 0,685416 0,626362
Q6S 0,601688 0,725941 0,424772 Q2S 0,552364 0,468334 0,230381
Q7B 0,552314 0,555323 0,735233 Q3C 0,905156 0,722810 0,623105
Q7C 0,397369 0,374925 0,522739 Q3S 0,556813 0,524305 0,271307
Q7M 0,601332 0,640082 0,783102 Q4C 0,727729 0,886395 0,555667
Q7S 0,356310 0,370874 0,420358 Q4S 0,476034 0,688566 0,275283
Q8B 0,536331 0,529341 0,764884 Q5C 0,707544 0,897609 0,644087
Q8C 0,373226 0,367520 0,537272 Q5S 0,468051 0,693225 0,299049
Q8M 0,536479 0,570081 0,789101 Q6C 0,742533 0,905358 0,638665
Q8S 0,338763 0,361752 0,440619 Q6S 0,450136 0,680437 0,289386
Q9B 0,486648 0,456408 0,751125 Q7C 0,632811 0,561348 0,883596
Q9C 0,281712 0,267113 0,456184 Q7S 0,233353 0,283277 0,330009
Q9M 0,541375 0,536707 0,769522 Q8C 0,593651 0,535674 0,900184
Q9S 0,284446 0,308163 0,355176 Q8S 0,211840 0,250680 0,352300
Q10B 0,539462 0,508593 0,776104 Q9C 0,539970 0,449604 0,860463
Q10C 0,335294 0,352458 0,512778 Q9S 0,186582 0,266162 0,312139
Q10M 0,539217 0,544646 0,758264 Q10C 0,562911 0,525751 0,888436
Q10S 0,289313 0,292169 0,373583 Q10S 0,205202 0,251453 0,348561

Self-image Congruence and Brand Preference: analysis by product usage role and level of country
development
37
Table 20. Cross Loadings for Individual Brand Models
Actual Ideal Pref Actual Ideal Pref
M
A
N
G
O
Q1M 0,905723 0,754544 0,680122 Q1C 0,961587 0,683289 0,689484
C
O
L
G
A
T
E
Q2M 0,947807 0,795070 0,711723 Q2C 0,926652 0,724711 0,664436
Q3M 0,931246 0,808309 0,699287 Q3C 0,927468 0,758753 0,665021
Q4M 0,772229 0,911173 0,732896 Q4C 0,737352 0,851267 0,597808
Q5M 0,781667 0,959242 0,771560 Q5C 0,711812 0,955008 0,670662
Q6M 0,841779 0,959974 0,772149 Q6C 0,752415 0,973154 0,683405
Q7M 0,734289 0,797911 0,988051 Q7C 0,712987 0,689041 0,988336
Q8M 0,652283 0,717111 0,885153 Q8C 0,667299 0,651385 0,929234
Q9M 0,687159 0,712740 0,894210 Q9C 0,653834 0,579964 0,872541
Q10M 0,659717 0,685481 0,859578 Q10C 0,663352 0,638516 0,917868
B
E
N
E
T
T
O
N
Q1B 0,888135 0,680818 0,579214 Q1S 0,914320 0,643706 0,612935
S
E
N
S
O
D
Y
N
E
Q2B 0,867977 0,724105 0,566068 Q2S 0,941616 0,712484 0,567394
Q3B 0,974515 0,770907 0,635548 Q3S 0,935811 0,761368 0,585456
Q4B 0,690636 0,918136 0,658226 Q4S 0,685327 0,919633 0,506601
Q5B 0,722966 0,926717 0,664379 Q5S 0,732671 0,955607 0,609185
Q6B 0,775803 0,953731 0,683746 Q6S 0,717948 0,946305 0,598993
Q7B 0,643721 0,713498 0,992927 Q7S 0,635992 0,596064 0,934325
Q8B 0,599336 0,640364 0,900474 Q8S 0,614632 0,566266 0,948219
Q9B 0,558334 0,594505 0,836816 Q9S 0,561073 0,583936 0,943739
Q10B 0,568558 0,599190 0,845925 Q10S 0,567142 0,550735 0,936936
Upon analyzing all models, all primary loadings are higher than other cross-loadings,
which means that each variable relates strongly to its corresponding construct.
3.6 Hypothesis testing
H1a. Actual self-image congruence has a significant and positive effect on brand
preference.
H1b. Ideal self-image congruence has a significant positive effect on brand
preference
Pearson r correlation is used when the strength of the relationship between two continuous
variables is examined. This gives an indication of both the direction (positive or negative)
and the strength of the relationship (by looking at the absolute value). A positive
correlation indicates that as one variable increases, so does the other. A negative
correlation indicates that as one variable increases, the other decreases.
Correlation provides an indication that there is a relationship between two variables; it
does not, however, indicate that one variable causes the other. The correlation between
two variables (self-image congruence and brand preference) could be due to the fact that
self-image congruence causes brand preference, that brand preference causes self-image
congruence (as a post-purchase impulse to reduce cognitive dissonance), or that an

Self-image Congruence and Brand Preference: analysis by product usage role and level of country
development
38
additional variable causes both self-image congruence and brand preference. The
possibility of a third variable that influences both of the observed variables should always
be considered. This is why understanding the difference between correlation and
causation is required.
Different authors suggest different interpretations. However, Cohen (2013) suggests the
following guidelines:
0.10-0.29 – small;
0.30-0.49 – medium;
0.50-1.00 – large;
The correlations presented in the following table are thus all considered to be large
correlations, with a positive value above 0.6. Investigation was made using Pearson r
product-moment correlation coefficient in SPSS.
Table 21. Pearson r coefficient for Self-Image congruence and Brand Preference
Relationship* Pearson r
Correlation
General Self-Image Congruence – General Preference 0.729*
Self-Image Congruence Mango – Brand Preference Mango 0.785*
Self-Image Congruence Benetton – Brand Preference Benetton 0.695*
Self-Image Congruence Colgate – Brand Preference Colgate 0.720*
Self-Image Congruence Sensodyne – Brand Preference Sensodyne 0.660*
* Correlations are significant at 0.01 level (2-tailed)
For additional analysis, statistical significance of the difference between correlation
coefficients needs to be calculated. The significance level shown under the table (marked
with *) provides a test of the null hypothesis that the correlation coefficient in the
population is 0. Another test is needed to assess the probability that the difference in the
correlations observed for the groups would occur as a function of a sampling error, when
in fact there was no real difference in the strength of the relationship for groups. It is
indicated as zobs in the tables and is calculated as
𝑍𝑜𝑏𝑠 =𝑧1−𝑧2
√1
𝑁1−3+
1
𝑁2−3

Self-image Congruence and Brand Preference: analysis by product usage role and level of country
development
39
N1 and N2 are sample frequencies, and z1, z2 – values corresponding to their r coefficient.
(r to z transformations are taken from Pallant, 2010).
The value of Zobs has to be outside the interval -1.96 and +1.96, to be able to say there is
a statistically significant difference between the two correlation coefficients.
Another test included in the table below is multiple regression. It is a more sophisticated
extension of correlation and is used when it is wanted to explore the predictive ability of
a set of independent variables on one continuous dependent measure. Current study uses
standard multiple regression, where all the independent variables are entered into the
equation simultaneously. Each independent variable is evaluated in terms of its predictive
power. This approach also tells how much unique variance in the dependent variable each
of the independent variables explained.
Multiple regression procedure assumes there is no multicollinearity or singularity
between the independent variables. Correlations were tested in the previous sub-chapter
and confirmed assumptions. Also, none of the independent variables is a combination of
other independent variables. The conditions are satisfied.
Table 22. Correlations and beta coefficient for actual and ideal self-image congruence
Actual Self-Image
Congruence –
Brand Preference
Correlations
Ideal Self-Image
Congruence –
Brand Preference
Correlations
zobs Standardized
coefficient
(Beta)
General 0.701* 0.705* -0.08 Actual = 0.361
Ideal = 0.394
Mango 0.729* 0.776* -1.05 Actual = 0.260
Ideal = 0.557
Benetton 0.624* 0.684* -1.06 Actual = 0.236
Ideal = 0.500
Colgate 0.699* 0.661* 0.75 Actual = 0.469
Ideal = 0.293
Sensodyne 0.631* 0.607* 0.40 Actual = 0.402
Ideal = 0.303
* Correlations are significant at 0.01 level (2-tailed)

Self-image Congruence and Brand Preference: analysis by product usage role and level of country
development
40
As the table above shows, both actual and ideal self-image congruence have a significant
and positive effect on brand preference, because all correlations are higher than 0.6 and
are significant at 0.01 level (2-tailed). Looking at the regression coefficients (beta), the
same conclusion is valid. All betas are positive, meaning an increase in self-image
congruence will trigger an increase in brand preference. Betas range from 0.236 to 0.500.
Another observation is that even though correlations are high and significant, there are
no significant differences between correlation of actual self-image congruence with brand
preference and correlation of ideal self-image congruence with brand preference. This is
valid for the overall average and over each brand in particular. None of the zobs values are
higher than 1.96 or lower than -1.96. It suggest that neither actual self-image, nor ideal
self-image is dominant.
There is sufficient evidence to support both H1a and H1b. Therefore the null hypotheses
for H1a and H1b are rejected.
H2. Actual and ideal self-congruence are significantly and positively correlated.
Table 23. Individual brand actual-ideal self-image congruence correlations
Actual Self-Image Congruence
– Ideal Self-Image Congruence
Correlation
Mango 0.844*
Benetton 0.776*
Colgate 0.784*
Sensodyne 0.757*
* Correlations are significant at 0.01 level (2-tailed)
All correlations are positive and higher than 0.750, significant at 0.01 level (2-tailed).
There is sufficient evidence to support H2. Therefore the null hypothesis for H2 is
rejected.
H3: Self-image congruence is significantly higher for conspicuous products rather
than inconspicuous products.
T-tests are used to compare the mean score on some continuous variable. Paired sample
t-tests (also called repeated measures) are used when samples are “related”, because they
are the same people tested each time. Independent sample t-tests are used when there are
two different (independent) groups of people (e.g. males and female) and their score has

Self-image Congruence and Brand Preference: analysis by product usage role and level of country
development
41
to be compared. In this case, paired samples t-tests were used, as there are measures from
the same person to two different sets of questions.
Table 24. Significance T test for differences between conspicuous and inconspicuous
products
Conspicuous
Mean Value
Inconspicuous
Mean Value
Sig. (2-tailed)
Total Self-Image
Congruence
3.30 3.67 0.000 (t= - 4.05, df = 207
Actual Self-Image
Congruence
3.27 3.80 0.000 (t= -5.28, df = 207)
Ideal Self-Image
Congruence
3.33 3.53 0.049 (t= -1.98, df = 207)
If sig 2-tailed value is less than 0.05, then we can conclude there is a significant difference
between the two scores. In the above table can be seen that general image, actual image
and ideal image self-congruence for the two types of products (clothes and toothpaste)
record significant differences, with sig. 2-tailed of 0.000, 0.000 and 0.049 respectively.
Having established that there is a significant different, the next step is to find out which
set of scores is higher, the one for clothing brands or for toothpaste brands. Comparing
the averages given in the table 24, we can conclude that general self-image congruence,
as well as actual and ideal self-image are significantly higher for conspicuous products
than for inconspicuous ones.
There is no evidence to support H3. Therefore the null hypotheses for H3 is accepted.
H4a: Relationship between actual self-congruence and brand preference is
stronger for inconspicuous products compared to conspicuous products.
H4b: Relationship between ideal self-congruence and brand preference is stronger
for conspicuous products as compared to inconspicuous products.

Self-image Congruence and Brand Preference: analysis by product usage role and level of country
development
42
Table 25. Analysis of general conspicuous and inconspicuous variables
Conspicuous Products Inconspicuous Products zobs
(sig)
Mean Brand Preference = 3.00 Mean Brand Preference = 4.16 -
Self-Image Congruence – Brand
Preference Pearson r correlation =
0.743*
Self-Image Congruence – Brand
Preference Pearson r correlation =
0.640*
2.01
Ideal Self-Image Congruence – Brand
Preference Pearson r correlation =
0.732*
Ideal Self-Image Congruence – Brand
Preference Pearson r correlation =
0.593*
2.53
Actual Self-Image Congruence –
Brand Preference Pearson r correlation
= 0.687*
Actual Self-Image Congruence –
Brand Preference Pearson r correlation
= 0.613*
1.30
Standardized coefficient (Beta):
Actual = 0.257
Ideal = 0.520
Standardized coefficient (Beta):
Actual = 0.384
Ideal = 0.297
-
* Correlations are significant at 0.01 level (2-tailed)
Inconspicuous products score higher ratings of both self-image congruence and brand
preference. The strength and relationship significance can be examined through the
correlation coefficient.
Relationship between actual self-image congruence and brand preference is stronger for
conspicuous products than for inconspicuous, with correlations of 0.687 and 0.613
respectively. However, this difference is not significant, as the zobs indicator has a value
of 1.30 (more than 1.96 confirms significance).
Through regression modelling, actual self-image congruence explains 25.7% of brand
preference variation for conspicuous products and 38.4% of brand preference variation
for inconspicuous products. Even though correlations are not significantly different,
regression beta coefficients show a stronger relation between actual self-image
congruence and brand preference for inconspicuous products rather than conspicuous
products.
There is partial support for H4a. Therefore the null hypothesis for H4a is rejected.
The table also shows the relationship between ideal self-image congruence and brand
preference is stronger for conspicuous products as compared to inconspicuous products,
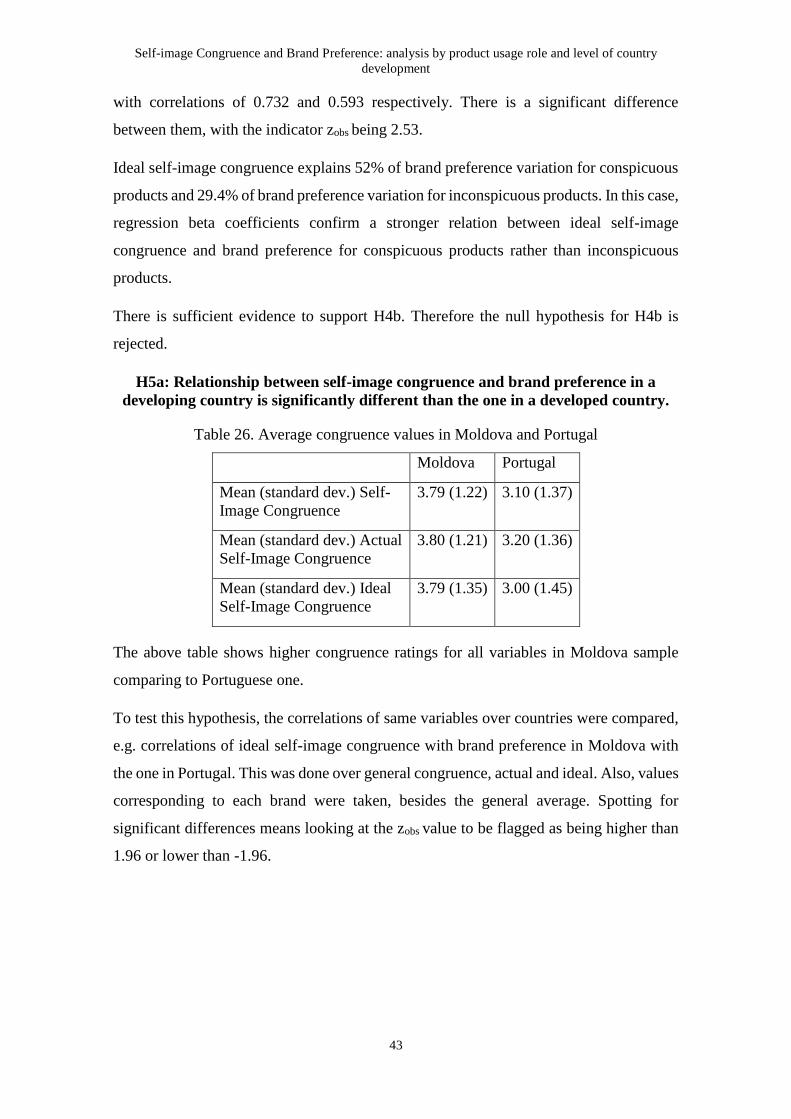
Self-image Congruence and Brand Preference: analysis by product usage role and level of country
development
43
with correlations of 0.732 and 0.593 respectively. There is a significant difference
between them, with the indicator zobs being 2.53.
Ideal self-image congruence explains 52% of brand preference variation for conspicuous
products and 29.4% of brand preference variation for inconspicuous products. In this case,
regression beta coefficients confirm a stronger relation between ideal self-image
congruence and brand preference for conspicuous products rather than inconspicuous
products.
There is sufficient evidence to support H4b. Therefore the null hypothesis for H4b is
rejected.
H5a: Relationship between self-image congruence and brand preference in a
developing country is significantly different than the one in a developed country.
Table 26. Average congruence values in Moldova and Portugal
Moldova Portugal
Mean (standard dev.) Self-
Image Congruence
3.79 (1.22) 3.10 (1.37)
Mean (standard dev.) Actual
Self-Image Congruence
3.80 (1.21) 3.20 (1.36)
Mean (standard dev.) Ideal
Self-Image Congruence
3.79 (1.35) 3.00 (1.45)
The above table shows higher congruence ratings for all variables in Moldova sample
comparing to Portuguese one.
To test this hypothesis, the correlations of same variables over countries were compared,
e.g. correlations of ideal self-image congruence with brand preference in Moldova with
the one in Portugal. This was done over general congruence, actual and ideal. Also, values
corresponding to each brand were taken, besides the general average. Spotting for
significant differences means looking at the zobs value to be flagged as being higher than
1.96 or lower than -1.96.

Self-image Congruence and Brand Preference: analysis by product usage role and level of country
development
44
Table 27. Congruence-Preference correlations and significance tests of differences
between congruence variables in Moldova (MD) and Portugal (PT)
General Self-
Image
Congruence –
Brand Preference
Correlations
Actual Self-Image
Congruence –
Brand Preference
Correlations
Ideal Self-Image
Congruence –
Brand Preference
Correlations
zobs (MD vs PT)
MD PT MD PT MD PT Gen Actual Ideal
General 0.768* 0.637* 0.749* 0.601* 0.722* 0.645* 1.75 1.81 0.91
Mango 0.761* 0.770* 0.691* 0.751* 0.735* 0.751* -0.16 -0.81 -0.21
Benetton 0.715* 0.673* 0.630* 0.655* 0.682* 0.657* 0.56 -0.28 0.29
Colgate 0.702* 0.681* 0.666* 0.649* 0.644* 0.675* 0.25 0.18 -0.34
Sensodyne 0.717* 0.671* 0.653* 0.675* 0.642* 0.637* 0.56 -0.23 0.05
*Correlations are significant at 0.01 level (2-tailed)
None of the correlations have significant differences over country samples. It means that
even though correlations are different between country samples, this difference is not
significant and can be easily attributed to sampling error.
Table 28. Beta Coefficient of Self-Image Congruence to Brand Preference
Actual Ideal
MD PT MD PT
General 0.482 0.059 0.323 0.591
Mango 0.311 0.392 0.498 0.398
Benetton 0.306 0.334 0.471 0.356
Colgate 0.419 0.232 0.334 0.469
Sensodyne 0.412 0.554 0.382 0.133
Table 28 further examines the relationship between the variables over country samples
by looking into the beta coefficients. Biggest differences for betas are seen in the general
model (0.43 difference for actual, 0.27 for ideal), Colgate model (0.19 difference for
actual, 0.14 for ideal) and Sensodyne model (0.14 difference for actual, 0.25 for ideal).
There is partial evidence to support H5a. Therefore the null hypothesis for H5a is rejected.
H5b: Self-image congruence is significantly different for the two types of countries.

Self-image Congruence and Brand Preference: analysis by product usage role and level of country
development
45
Table 29. Significance test for congruence variables between Moldova and Portugal
Sig 2-tailed (equal
variances assumed)
General Self-Image Congruence 0.001 (t = 3.54, df = 176)
Actual Self-Image Congruence 0.002 (t = 3.10, df = 176)
Ideal Self-Image Congruence 0.000 (t = 3.71, df = 176)
If sig 2-tailed value is less than 0.05, then we can conclude there is a significant difference
between the two scores. In the above table can be seen that general self-image, actual self-
image and ideal self-image congruence for the two types of countries (Moldova and
Portugal) record significant differences, with sig. 2-tailed of 0.001, 0.002 and 0.000
respectively.
Having established that there is a significant different, the next step is to find out which
set of scores is higher, the one for Moldova or for Portugal. Comparing the averages given
in table 26, we can conclude that general self-image congruence, actual and ideal self-
image are significantly higher for Moldova than for Portugal.
There is sufficient evidence to support H5b. Therefore the null hypothesis for H5b is
rejected.
The general model upon which hypothesis were tested can be found in figure 4 and 5.
Figure 4: T-significance of general model

Self-image Congruence and Brand Preference: analysis by product usage role and level of country
development
46
Figure 5: Standardized regression weights and R2 of general model
As the research instrument samples demographic information, the paper further examines
group differences which were not included as hypothesis. Upamannyu, Mathur and
Bhaakar (2014) analyzed income and gender in respect to self-image congruence and
brand preference. They found that the two gender groups did not have significant
differences in the perception of role of product usage (conspicuous & inconspicuous).
However, income as demographics elements had significant impact on brand preference
for conspicuous and inconspicuous product category. As the table shows, female scores
for all congruence variables are higher.
Table 30. Average congruence variable values for genders
Male Female
Self-Image congruence 3.19 3.60
Actual Self-Image congruence 3.24 3.66
Ideal Self-Image congruence 3.14 3.54
Table 31. R2 of Self-Image Congruence to Brand Preference in Genders
Male Female
Actual 0.328 0.344
Ideal 0.480 0.375
The beta coefficients are close in both samples. Actual self-image congruence explains
32.8% of brand preference variance for male group and 34.4% for female group. Ideal
self-image congruence explains 48% of brand preference variance for male group and
37.5% for female group.

Self-image Congruence and Brand Preference: analysis by product usage role and level of country
development
47
Table 32. Significance test (T-test) for congruence variables in Male and Female
Groups
Male-Female Sig 2-tailed (equal
variances assumed)
General Image 0.04 (t = -2.05, df = 206)
Actual Image 0.03 (t = -2.13, df = 206)
Ideal Image 0.06 (t=-1.85, df=206)
T-test shows significant differences for general self-image congruence and actual self-
image congruence between male and female groups, with sig values of 0.04 and 0.03
respectively. Even though the beta coefficient from table 31 shows the biggest difference
for ideal self-image congruence, the significance test does not give support to that
evidence.
Here are the general average scores for congruence variables in different family groups.
Table 33. Average congruence variable values for different family groups
Number of family members 1 2 3 4 5 >5
Self-Image Congruence 2.74 3.59 3.26 3.44 4.06 3.90
Actual Self-Image Congruence 2.75 3.74 3.67 3.45 4.10 4.08
Ideal Self-Image Congruence 2.73 3.44 3.15 3.43 4.02 3.72
Beta coefficients from table 34 do not show a definite picture, as they vary across groups
and a general trend is not evident.
Table 34. Beta Coefficient of Self-Image Congruence to Brand Preference in Families
1 2 3 4 5 >5
Actual Self-Image Congruence 0.871 0.291 0.199 0.529 -0.092 1.431
Ideal Self-Image Congruence -0.475 0.582 0.624 0.223 0.689 -0.663
One-way ANOVA (analysis of variance) is similar to a t-test, but is used when there are
more than two groups and their mean scores on a continuous variable are compared. In
our case, we have the number of family members and family income. ANOVA would let
us know whether the groups differ significantly.

Self-image Congruence and Brand Preference: analysis by product usage role and level of country
development
48
One-way ANOVA test assumes equal variances. To see if the assumption has not been
violated, Levene’s test is made (homogeneity of variances). If the number is greater than
0.05, there is homogeneity of the variances. In our case, Levene’s numbers are 0.363,
0.429 and 0.503 for general, actual and ideal image respectively. Given that all of them
are higher than 0.05, the assumption of homogeneity of variances is sustained.
Table 35. Significance test for variable differences across family groups (ANOVA)
Number of family members Sig.
Self-Image Congruence 0.038
Actual Self-Image Congruence 0.023
Ideal Self-Image Congruence 0.079
Significant differences have been found in general self-congruence and actual self-
congruence, as the sig are lower than 0.05. There are significant differences among groups
and table 33 reveals them to be between families with 1 and 5 members. No significant
differences have been found between groups for ideal self-congruence.
Here are the general average scores for congruence variables across the different income
groups.
Table 36. Average congruence variable values for different income groups
Income Group 1 2 3 4 5
Self-Image Congruence 3.64 3.23 3.65 3.48 3.50
Actual Self-Image Congruence 3.65 3.28 3.73 3.52 3.56
Ideal Self-Image Congruence 3.63 3.18 3.57 3.44 3.44
Beta coefficients from the table below do not show a definite picture, as they vary across
groups and a tendency cannot be spotted.
Table 37. Beta Coefficient of self-image congruence to brand preference in income
groups
1 2 3 4 5
Actual Self-Image Congruence 0.928 -0.087 0.432 -0.325 0.559
Ideal Self-Image Congruence -0.013 0.854 0.320 1.071 0.172

Self-image Congruence and Brand Preference: analysis by product usage role and level of country
development
49
Levene’s sig are 0.15, 0.059 and 0.023 for general self-image, actual and ideal self-image
respectively. As the assumption of homogeneity of variance is violated, robust tests of
equality of means are more reliable (Welch and Brown-Forsynthe tests).
Table 38. Welch and Brown-Forsynthe significance tests
Variable tested Test conducted Significance
level
General Self-Image Welch 0.544
Brown-Forsynthe 0.590
Ideal Self-Image Welch 0.461
Brown-Forsynthe 0.530
Actual Self-Image Welch 0.666
Brown-Forsynthe 0.692
None of the significance levels are lower than 0.05, which means there are no significant
differences of general, actual or ideal self-image congruence between groups of different
income.
Conclusion. The current model has good indicators of reliability (Cronbach’s alpha and
Composite Reliability) and validity. All Average Variance Extracted are more than 0.4,
which confirms the convergent validity. All constructs are significant and each of the sub-
models has a total variance explained indicator of minimum 0.44. Factor loadings also
show satisfactory values and cross loadings have been checked to make sure that each
factor measures the right construct. All this evidence allows us to continue with testing
hypotheses, as the current research model is deemed adequate. Individual hypothesis
testing present some findings aligned with the empirical evidence presented in the first
chapter, other having only partial support.

Self-image Congruence and Brand Preference: analysis by product usage role and level of country
development
50
Chapter IV. Conclusions
The current research shows the importance of self-image congruence in consumer
behavior and its effect on brand preference.
This chapter summarizes the study results. It presents the research importance through
listing its contribution for science and its practical implications for managers. Last but
not least, the research limitations are mentioned and directions for future studies are
recommended.
The research model treats actual self-congruence and ideal self-congruence as
independent variables and brand preference as the dependent variable. The constructs of
actual self-congruence and ideal self-congruence were measured on 3-items scale for
each; the construct ‘brand preference’ was measured on 4-item scale adopted by Sirgy et
al. (1997). All items used for this study were measured on a 7-point Likert scale. The six
self-congruity measures were subsequently reduced to two measures (actual and ideal
congruity) and the four brand preference measures were reduced to one, by calculating
their mean score. Clothing brands were considered goods consumed publicly and
toothpaste brands - goods consumed privately.
The model’s reliability was tested for each of the construct and for each individual brand.
All Cronbach alpha indicators are higher than 0.9 and all Composite Reliability indicators
are higher than 0.8. Validity was also tested. All Average Variances Extracted are higher
than 0.40, an exception being brand preference in the aggregated model, which is very
close to the limit. All significance measures of the relationships towards brand preference
are positive, being higher than the required values of 1.96 at 95% confidence level.
Data was collected through survey method. Final sample consisted of 102 respondents
from Moldova, 76 respondents from Portugal and 30 Erasmus students, a total of 208
answers. Most of the respondents are students, aged 18-25. Each country group has more
female respondents than male respondents. The male-female ratio does not vary
significantly across countries, with 61%-77% females in each country sample. Income
distribution intervals are the same in both Moldova and Portugal. Most of the people have
a family of 4 members. A family with 3 members is the second least popular overall.

Self-image Congruence and Brand Preference: analysis by product usage role and level of country
development
51
4.1 Results conclusion
Regarding the hypotheses H1a and H1b, both actual and ideal self-image congruence
were found to have a significant and positive effect on brand preference. Results suggest
that neither actual self-image, nor ideal self-image is dominant, with no significant
differences between them when analyzing brand preference. These findings can be
interpreted as evidence of a useless attempt to distinguish the self-concept components,
aligned with Dolich (1969) and Usakli & Baloglu (2011).
As for the second hypothesis, actual and ideal self-image congruence are significantly
and positively correlated. Findings are aligned with Usakli & Baloglu (2011), and
partially with Khan & Bozzo (2012) and Upamannyu, Mathur and Bhakar (2014), the
latter ones examining this correlation only through the facet of type of product usage
(conspicuous and inconspicuous). Individuals have an understanding of how a typical
user of a particular brand looks like and behaves. To decide if they like the brand, they
match their own perceived image or the one they would like to have with that of the
typical user. If these two have a lot of things in common, the individual will have a
positive attitude towards the brand.
Examining the third hypothesis, self-image congruence was not found to be significantly
higher for conspicuous products rather than inconspicuous products. In fact, evidence
suggests the opposite: inconspicuous products register a higher self-image congruence,
which is significantly different from the one of conspicuous products. These findings
contradict Onkvisit and Shaw (1987). It was assumed people try to match their image
with the image of that brand’s typical user as a signaling method for other people. It seems
the opposite is true.
H4a and H4b tested the impact of product usage type. Relationship between ideal self-
image congruence and brand preference was found to be stronger for conspicuous
products as compared to inconspicuous products. Partial evidence also suggests that
relationship between actual self-congruence and brand preference is stronger for
inconspicuous products when compared to conspicuous products (correlations were not
significantly different, but regression beta coefficients showed the hypothesized stronger
relation). These findings contradict Dolich (1969), who found no support of the assumed
relations; Ross (1971), who found actual self-image to explain more variance in both
conspicuous and inconspicuous consumption; Hong & Zinkhan (1995), who found ideal

Self-image Congruence and Brand Preference: analysis by product usage role and level of country
development
52
self-congruity to be a better predictor for brand preference than actual self-congruity with
both product classes used. They are also partially aligned with Graeff (1996), who had
evidence only for the relation between ideal self-image congruence and conspicuous
consumption; and are completely aligned with Khan & Bozzo (2012), and Upamannyu,
Mathur & Bhakar (2014). When consumption of a product takes place mainly in public,
the consumer will be more concerned of others’ responses. Meaning, ideal self-concept,
the image an individual wants others to have of him, is more significant than actual self-
concept. Conversely, when a product is consumed inconspicuously (in private), he/she
will not think of the image he projects towards others.
H5a and H5b tested the impact of country development level. Self-image congruence was
found to be significantly different for the two types of countries. Also, evidence partially
supports the assumption that the relationship between self-image congruence and brand
preference in a developing country is significantly different than the one in a developed
country (correlations were not significantly different, but regression beta coefficients
were different for the two groups). These findings contradict Assael (2004), who talks
about similar patterns in consumer behavior across countries and are partially aligned
with De Mooij (2003), who says there might be significant differences, but for certain
products only. Consumers in developing countries tend to be less individualistic than in
developed ones. They care more for a larger local community, and like to be identified as
part of it. This might account for the significant differences in self-image congruence.
4.2 Contribution for science
Even though products have almost the same properties, people choose one and not the
other. Identifying the reasons for a particular consumer behavior is one of the main tasks
for marketing. The consumer wants a product that gives him a feeling that it was made
exclusively for him, that it matches his personality, and that it responds to his needs.
The knowledge generated from the self-image congruence research contributes to
consumer attitude modeling and consumer decision-making research. Self-image
congruence concept is an integral part of attitude research and should be considered as
such. Researchers in this field are challenged to develop attitude theories that integrate
the social cognitive dynamics involved in explaining, describing, and predicting
consumption patterns.

Self-image Congruence and Brand Preference: analysis by product usage role and level of country
development
53
The current research offers a theoretical account and empirical evidence for the
importance of the actual and ideal self-image congruence in relation to brand preference
and sheds some light on how to accomplish the challenging task of understanding
consumer behavior through this perspective.
4.3 Practical implications.
Findings broadly apply to managers in retail and fashion industries. Marketers are under
pressure to understand consumers' experiences and the resulting influence on product
evaluations. The results show actual and ideal self-image congruence play important roles
in determining brand preference.
Congruity of self-image and brand image offers a significant perspective on the
understanding of consumer decision making. Consumers may decide not to buy a product
or not to shop at a particular store if they feel that these actions are not consistent with
their own perceptions of themselves. The results of this study will help marketing
managers understand about the self-image congruence of their consumer. They can later
use this insight for improving their marketing and promotional activities. According to
research, if marketers are planning a communications strategy, they should give more
importance to the ideal or actual self-congruence of their target market, depending on
what good is being advertised.
The present findings imply that it is useful and valid to represent the consumer’s self,
your brand’s self and your competitors’ brands in one network, and that the closeness of
the self to a brand will predict preference. Managers can do this in order to understand
the effect of new product introductions, new packaging or new communications.
Marketers can track the distance between their brand and the self and see how this is
altered by new initiatives. They can assess how their brand stands in relation to
(congruence) individual consumers, and where other brands may be doing a better job at
this.
4.4 Limitations of the research
As any other study, the present research has some limitations that readers have to take
into account when they consider the findings.

Self-image Congruence and Brand Preference: analysis by product usage role and level of country
development
54
- Due to budget and time constraints, the sample size consisted of 208 respondents.
Further research could be conducted on a larger sample, which will increase the study’s
robustness.
- Clothing brands were taken as conspicuous products and toothpaste brands were taken
as inconspicuous products. Further research could choose other types of goods that are
considered highly visible/private in consumption.
- The solely use of students may have increased the sample’s homogeneity of perceptions.
This might not happen if a representative sample would be used.
- Moldova was analyzed as developing country and Portugal – as a developed one. As
self-image congruence has not been extensively analyzed over different types of
countries, future studies could research other states, to see if the results can be replicated.
- Some respondents could guess what answers are expected to be found in their forms by
looking at how the questions are framed in the survey and tick those particular answers,
and not their own.
- Brand knowledge could be a potential mediator in the relationship between brand
preference and self-image congruence. Due to the cross country comparison, 2 brands
from each category were chosen, as to be well-known in both countries. A possible
interference with the study’s results could be brand knowledge. It is possible that some
of the respondents did not know anything about the brands they were asked.
- Brand involvement has also been identified as a potential factor that influences
consumers’ purchase decisions. Although buying clothes is a high-involvement situation,
there might exist different degrees of involvement with different brands, which may result
in various attitudes. Future research should include brand involvement.
- This study measured self-congruity directly, using the global measurement method
developed by Sirgy et. al. (1997). However, there has been a considerable debate about
whether to use the direct score formula (Sirgy’s instrument) or gap score formula
(Malhotra’s instrument) in measuring self-congruity. Future studies could measure self-
congruity using both the direct score and gap score formulas in order to compare the
results.
- Some researchers argue that expert customers are different from novice customers in
the way their self-images relate to their satisfaction judgments. It may be that experts may

Self-image Congruence and Brand Preference: analysis by product usage role and level of country
development
55
not always feel self-conscious about using some brands as they may be affected by other
functional attributes of the brand such as comfort or utility. A study done recently (Jamal
and Al-Marri, 2007) concluded that experts value functional attributes more than non-
functional attributes such as brand name, price and sales person’s opinions. The current
research did not divide the sample into sub-groups according to their expertise in the
analyzed brands. Further research could employ this, to test if the results of previous
studies can be confirmed.
- Finally, we recognize that there are other unexplored factors influencing brand
preference, such as personality characteristics, social contexts, and peer pressure. Further
research could offer a more complex understanding by including the examination of these
variables as well.
Self-image Congruence and Brand Preference: analysis by product usage role and level of country
development
56
References
Aaker, J.L. (1997). Dimensions of Brand Personality. Journal of Marketing Research,
34(3), pp. 347-356.
Assael, H. (2004). Consumer behavior: A strategic approach. Boston: Houghton Mifflin,
631 pages.
Belk, R.W. (1988). Possessions and the extended self. Journal of Consumer Research, 2,
September, pp. 139-168.
Birdwell, A.E. (1968). A study of influence of image congruence on consumer choice.
Journal of Business, Volume 41(1), pp. 76-88.
Bloch, F., Rao, V. and Desai, S. (2004) Wedding celebrations as conspicuous
consumption. Journal of Human Resources, volume 39(3), pp. 675-695.
Blunch, N. (2013). Introduction to structural equation modeling using IBM SPSS
statistics and AMOS. Second Edition. SAGE Publications, 312 pages.
Bronnenberg, B., Dube, J. and Gentzkow, M. (2012). The evolution of brand preferences:
evidence from consumer migration. American Economic Review, volume 102(6), pp.
2472-2508.
Broxton, J. (1963). A test of interpersonal attraction predictions derived from balance
theory. Journal of Abnormal and Social Psychology, volume 66, pp. 394-397.
Charles, K., Hurst, E. and Roussanov, N. (2009). Conspicuous consumption and race.
Quarterly Journal of Economics, volume 124(2), pp. 425-467.
Choi, S.M., Rifon, N.J. (2012). It is a match: the impact of congruence between celebrity
image and consumer ideal self on endorsement effectiveness. Psychology and Marketing,
volume 29(9), September, pp. 639-650.
Cohen, J. (2013). Statistical power Analysis for the behavioral Sciences. Second edition.
Lawrence Erlbaum Associates Publishing.
Cone, J., Foster, S. (2006). Dissertations and theses from start to finish: psychology and
related fields. American Psychological Association, 375 pages.
Curtis, A. (2001). Century of the self. BNU Publishing.

Self-image Congruence and Brand Preference: analysis by product usage role and level of country
development
57
De Mooij, M. (2003). Convergence and divergence in consumer behavior: implications
for global advertising. International Journal of Advertising, pp. 183-202.
Dekimpe, M., Steenkamp J., Mellens, M., Abeele, P. (1997). Decline and variability in
brand loyalty. International Journal of Research in Marketing, volume 14(5), December,
pp. 405-420.
Dinlersoz, E., Pereira, P. (2007). On the diffusion of electronic commerce. International
Journal of Industrial Organization, volume 25(3), June, pp. 541-574.
Dobre, C. (2000). Comportamentul consumatorului. Editura Orizonturi universitare,
Timisoara.
Dolich, I. (1969). Congruence relationships between self-images and product brands.
Journal of Marketing Research, volume 6(1), February, pp. 80-84.
Durant, W. (1991). The story of philosophy: The lives and opinions of the world’s greatest
philosophers. Simon & Schuster Pocket Books.
Ebrahim, R. (2011). A study of Brand preference: an experiential view. Paper presented
at Brunel Business School Doctoral Symposium, March.
Enis, B., Cox, K. and Stafford, J. (1972). Students as subjects in consumer behavior
experiments. Journal of Marketing Research, volume 9, pp. 72-74.
Evans, F. (1968). Automobiles and Self-Imagery: Comment. Journal of Business, volume
41, pp. 445-459.
Fornell C., Larcker, D. (1981) Evaluating structural equation models with unobservable
variables and measurement error. Journal of Marketing Research, volume 18(1), pp. 39-
50.
Graeff, T. (1996). Image congruence effects on product evaluations: the role of self-
monitoring and public/private consumption. Psychology & Marketing, volume 13(5), pp.
481-499.
Green, P., Maheshwari. A., Rao, V. (1969). Self-concept and brand preference: an
empirical application of multidimensional scaling. Journal of the Market Research
Society, volume 11(4), pp. 343-360.

Self-image Congruence and Brand Preference: analysis by product usage role and level of country
development
58
Grubb, L., Hupp, G. (1968). Perception of Self, Generalized Stereotypes, and Brand
selection. Journal of Marketing Research, volume 5, February, pp. 58-63.
He, H., Mukherjee, A. (2007). I am, Ergo I shop: does store image congruity explain
shopping behavior of Chinese consumers? Journal of Marketing Management, volume
23, pp. 443-460.
Heffetz, O. (2007). Conspicuous consumption and expenditure visibility: Measurement
and Application. Cornell University. [Online]. Available at
http://forum.johnson.cornell.edu/faculty/heffetz/papers/consp.pdf [Accessed on
25.10.2014].
Herbst, U., Schwarz, S. (2011). How valid is negotiation research based on student sample
groups? New insights into a long-standing controversy. Negotiation Journal, volume
27(2), pp. 147-170.
Higgins, E.T. (1987). Self-discrepancy: a theory relating self and affect. Psychological
Review, volume 94(3), pp. 319-340.
Hong J., Zinkhan, G. (1995). Self-Concept and Advertising Effectiveness: the influence
of Congruency, Conspicuousness, and Response Mode. Psychology & Marketing,
volume 12(1), January, pp. 53-77.
Hosany, S., Martin, D. (2012). Self-image congruence in consumer behavior. Journal of
Business Research, volume 65, pp. 685-691.
Hughes, D.G., Guerrero, J.L. (1971). Automobile self-congruity models reexamined.
Journal of Marketing Research, volume 8, February, pp. 125-127.
International Statistical Institute Developing Countries [Online]. Available at
http://www.isi-web.org/component/content/article/5-root/root/81-developing [Accessed
on 15.10.2014]
Investopedia definition of Gross National Income. [Online]. Available at
http://www.investopedia.com/terms/g/gross-national-income-gni.asp [Accessed at
23.10.2014].
Jamal, A., Al-Marri M. (2007). Exploring the effect of self-image congruence and brand
preference on satisfaction: the role of expertise. Journal of Marketing Management,
volume 23(7-8), pp. 613-629.

Self-image Congruence and Brand Preference: analysis by product usage role and level of country
development
59
Jamal, A., Goode, M. (2001). Consumers and brands: a study of the impact of self-image
congruence on brand preference and satisfaction. Marketing Intelligence & Planning,
volume 19(7), pp. 482-492.
Jöreskog, K. G. (1969). A general approach to confirmatory maximum likelihood factor
analysis. Psychometrika, 34(2), pp. 183-202.
Kardes, F., Cronley, M., Cline, T. (2014). Consumer behavior. Cengage Learning
Publication, 549 pages.
Kempen, L. (2003). Fooling the eye of the beholder: deceptive status signaling among the
poor in developing countries. Journal of International Development, volume 15(2), pp.
157-177.
Khan, M., Bozzo, C. (2012). Connection between “self” concept and brand preference
and the role of product usage. Paper presented at International IJAS Conference for
Academic Disciplines, 13-16 March, Las Vegas, USA.
Khera, I., Benson, J. (1970). Are students really poor substitutes for businessmen in
behavioral research? Journal of Marketing Research, volume 7, November, pp. 529-532.
Kotler, P. (2003). Marketing Management, 11th European edition, Prentice Hall.
Kressmann, F., Sirgy, J., Herrmann, A., Huber, F., Huber, S. and Lee, D. (2006). Direct
and indirect effects of self-image congruence on brand loyalty. Journal of Business
Research, volume 59, pp. 955-964.
Landon, L. (1974). Self-concept, Ideal self-concept, and Consumer Purchase Intentions.
Journal of Consumer Research, volume 1, September 1974, pp. 44-51.
Levy, S.J. (1959). Symbols for Sales. Harvard Business Review, volume 37(4), pp. 117-
124.
Li, Y., Wang, X. and Yang, Z. (2011). The effects of corporate-brand credibility,
perceived corporate-brand origin, and self-image congruence on purchase intention:
evidence from China’s auto industry. Journal of Global Marketing, volume 24, pp. 58-
68.
Malhotra, N.K. (1981). A scale to measure self-concepts, person concepts and product
concepts. Journal of Marketing Research, volume 18, pp. 456-464.

Self-image Congruence and Brand Preference: analysis by product usage role and level of country
development
60
Merriam Webster Online Dictionary and Thesaurus “Conspicuous Consumption”
definition. [Online]. Available at http://www.merriam-
webster.com/dictionary/conspicuous%20consumption [Accessed on 20.10.2014].
Mulaik, S. (2009). Foundations of factor analysis. CRC Press Publication, 524 pages.
Munson, M. (1974). Typological investigation of self-concept congruity and brand
preferences: toward a predictive model. Doctoral dissertation, University of Illinois at
Urbana-Champaign.
Newcomb, T. (1961). The acquaintance process. New York: Holt, Rineheart and Winston
Publishing.
Ok, C., Shanklin, C., Back, K. (2008). Generalizing survey results from student samples:
implications from service recovery research. Journal of Quality Assurance in Hospitality
and Tourism, volume 8(4), pp. 1-23.
Onkvisit, S., Shaw, J. (1987). Self-concept and image congruence: some research and
managerial implication. Journal of Consumer Marketing, volume 4(1), pp. 13-23.
Online Business Dictionary “Brand preference” definition. [Online]. Available at
http://www.businessdictionary.com/definition/brand-preference.html [Accessed on
22.10.2014].
Pallant, J. (2010). SPSS survival manual. Third edition.
Peng, L., Wong, A. and Wan, L. (2012). The effects of image congruence and self-
monitoring on product evaluations: a comparison between genuine and counterfeit
products. Journal of Global Marketing, volume 25, pp. 17-28.
Plato. (1955). The Republic, volume II. Heinemann Publishing.
Rosenberg, M. (1979). Conceiving the self. New York: Basic Books.
Ross, I. (1971) Self-concept and Brand preference. Journal of Business of the University
of Chicago. Vol. 44, pp. 38-50
Shuptrine, F. (1975). On the validity of using students as subjects in consumer behavior
investigations. Journal of Business, volume 48, pp. 383-390.
Sirgy, J. (1982). Self-concept in consumer behavior: a critical review. Journal of
Consumer Research, volume 9, December, pp. 287-300.

Self-image Congruence and Brand Preference: analysis by product usage role and level of country
development
61
Sirgy, J. (1985). Self-image/product-image congruity and consumer decision making.
International Journal of Management, volume 2, pp. 49-63.
Sirgy, J., Grewal, D., Mangleburg, T.F., Park, J., Chon, K., Claiborne, C.B., Johar, J.S.
and Berkman, H. (1997). Assessing the predictive validity of two methods of measuring
self-image congruence. Journal of the Academy of Marketing Science, volume 25(3), pp.
229-241.
Solomon, M. (2014). Consumer behavior: buying, having and being. Pearson Education
Publication, 608 pages.
Upamannyu, N., Mathur, G. and Bhakar, S. (2014). The connection between “self”
concept on brand preference. International Journal of Management Excellence, volume
3(1), April, pp. 308-319
Usakli, A., Baloglu, S. (2011). Brand personality of tourist destinations: an application of
self-congruity theory. Tourism Management, volume 32, pp. 114-127.
Veblen, T. (2012). The theory of the Leisure class. 1899. Start Publishing LLC, eBook
edition.
World Bank about Development. [Online]. Available at
http://web.worldbank.org/WBSITE/EXTERNAL/EXTSITETOOLS/0,,contentMDK:20
147486~menuPK:344190~pagePK:98400~piPK:98424~theSitePK:95474,00.html
[Accessed on 23.10.2014].
World Bank Data on GNI per capita. [Online]. Available at
http://data.worldbank.org/indicator/NY.GNP.PCAP.PP.CD [Accessed on 23.10.2014]
Wu, J. (2011). The effects of brand crisis on brand evaluation and consumer’s willingness
of brand relationship rebuilding: the moderating effect of self-image congruence.
Proceedings of China International Conference on Information Systems for Crisis
Response and Management.

Self-image Congruence and Brand Preference: analysis by product usage role and level of country
development
62
Appendix
Appendix 1. Questions
HOW TO COMPLETE THIS QUESTIONNAIRE
This questionnaire has the objective of collecting information about the European
consumer, for a Master Thesis made at Universidade Fernando Pessoa.
The information is confidential, your answers will be treated impersonally at group level.
It will only take about ten minutes to answer the questions.
Your response is very important for this research. Please respond sincerely.
Thank you in advance for choosing to help this research.
This questionnaire is made up of three sections. The first and second section is about
your relation toward several brands of clothes and toothpaste. The third section asks
questions about you, which will help us to classify the information you have given us.
Please answer all the questions by choosing a number on the scale where:
7 = totally agree 4 = neither agree nor disagree 1 = totally disagree
Clothing brands section
1. The typical person who uses this brand is very much like me.
[Q1M] Mango 1 2 3 4 5 6 7
[Q1B] Benetton 1 2 3 4 5 6 7
2. Having this brand is consistent with how I see myself.
[Q2M] Mango 1 2 3 4 5 6 7
[Q2B] Benetton 1 2 3 4 5 6 7
3. The image of the typical customer of this brand is similar with how I see myself.
[Q3M] Mango 1 2 3 4 5 6 7
[Q3B] Benetton 1 2 3 4 5 6 7
4. The typical person who uses this brand is very much like the person I would like to
become.
[Q4M] Mango 1 2 3 4 5 6 7
[Q4B] Benetton 1 2 3 4 5 6 7
5. Having this brand is consistent with how I would like see myself.
[Q5M] Mango 1 2 3 4 5 6 7

Self-image Congruence and Brand Preference: analysis by product usage role and level of country
development
63
[Q5B] Benetton 1 2 3 4 5 6 7
6. The image of the typical customer of this brand is similar with how I would like to see
myself.
[Q6M] Mango 1 2 3 4 5 6 7
[Q6B] Benetton 1 2 3 4 5 6 7
7. I like this brand better than any other brand.
[Q7M] Mango 1 2 3 4 5 6 7
[Q7B] Benetton 1 2 3 4 5 6 7
8. This brand is my preferred brand over all other brands.
[Q8M] Mango 1 2 3 4 5 6 7
[Q8B] Benetton 1 2 3 4 5 6 7
9. I would be inclined to buy this brand over any other brand.
[Q9M] Mango 1 2 3 4 5 6 7
[Q9B] Benetton 1 2 3 4 5 6 7
10. I would use this brand more than I would use any other brand.
[Q10M] Mango 1 2 3 4 5 6 7
[Q10B] Benetton 1 2 3 4 5 6 7
Toothpaste brands section
1. The typical person who uses this brand is very much like me.
[Q1S] Sensodyne 1 2 3 4 5 6 7
[Q1C] Colgate 1 2 3 4 5 6 7
2. Having this brand is consistent with how I see myself.
[Q2S] Sensodyne 1 2 3 4 5 6 7
[Q2C] Colgate 1 2 3 4 5 6 7
3. The image of the typical customer of this brand is similar with how I see myself.
[Q3S] Sensodyne 1 2 3 4 5 6 7
[Q3C] Colgate 1 2 3 4 5 6 7
4. The typical person who uses this brand is very much like the person I would like to
become.
[Q4S] Sensodyne 1 2 3 4 5 6 7
[Q4C] Colgate 1 2 3 4 5 6 7
5. Having this brand is consistent with how I would like see myself.
[Q5S] Sensodyne 1 2 3 4 5 6 7
[Q5C] Colgate 1 2 3 4 5 6 7

Self-image Congruence and Brand Preference: analysis by product usage role and level of country
development
64
6. The image of the typical customer of this brand is similar with how I would like to see
myself.
[Q6S] Sensodyne 1 2 3 4 5 6 7
[Q6C] Colgate 1 2 3 4 5 6 7
7. I like this brand better than any other brand.
[Q7S] Sensodyne 1 2 3 4 5 6 7
[Q7C] Colgate 1 2 3 4 5 6 7
8. This brand is my preferred brand over all other brands.
[Q8S] Sensodyne 1 2 3 4 5 6 7
[Q8C] Colgate 1 2 3 4 5 6 7
9. I would be inclined to buy this brand over any other brand.
[Q9S] Sensodyne 1 2 3 4 5 6 7
[Q9C] Colgate 1 2 3 4 5 6 7
10. I would use this brand more than I would use any other brand.
[Q10S] Sensodyne 1 2 3 4 5 6 7
[Q10C] Colgate 1 2 3 4 5 6 7
Personal information section:
[Age] 1. Age: 18-25 26-35 36-45 >45
[Sex] 2. Sex: Male Female
[Student] 3. Are you a student? Yes No
[Family] 4. How many members are there in your family?
1 2 3 4 5 >5
[Income] 5. What is your family’s net monthly income?
<500€ 501-1000€ 1001-1500€ 1501-2000€ >2000€

Self-image Congruence and Brand Preference: analysis by product usage role and level of country
development
65
Appendix 2. Research proposal for Ethics Commission of Universidade Fernando
Pessoa
POSTICA DORU
e-mail: [email protected]
Enrolled in MA in Business Sciences
Universidade Fernando Pessoa
1. The title of the project.
Master Thesis: “Connection between self-image congruence and brand preference and
the role of product usage and type of country development”
2. The objectives of the project.
Investigate the relationship between the self-congruence and brand preference;
Check the difference in actual self-congruence and ideal self-congruence;
See if type of product usage (conspicuous or inconspicuous) moderates this
relationship in a significant way;
Check if type of country development (developed or developing) moderates this
relationship in a significant way.
3. Information on the sample.
A sample of 103 students from Moldova and 31 Erasmus students has already been
gathered through the administration of an online questionnaire. Given the purpose of our
study to do a cross-country comparison, a sample of 100-150 Portuguese students is also
needed.
4. Information on methodology and instruments.
The master thesis analyzes clothing brands as goods consumed publicly and toothpaste
brands as goods consumed privately, with 2 brands of each type included in the
questionnaire.
The constructs of actual self-congruence and ideal self-congruence were measured on 3-
items scale for each. Whereas the construct ‘brand preference’ was measured on 4-item
scale adopted by Sirgy et al. (1997). Demographic information is also collected, for

Self-image Congruence and Brand Preference: analysis by product usage role and level of country
development
66
grouping the respondents by different characteristics. All items used for this study were
measured on 7-point Likert scale from strongly disagree (1) to strongly agree (7).
The full questionnaire can be seen in Appendix 1, and the online version that is to be
administered to the students can be found at
https://qtrial2013.qualtrics.com/SE/?SID=SV_9YMHacksTCJ1ywR
5. Information on procedures.
The intention is to distribute the online questionnaire through the database of students
registered at Fernando Pessoa. The information will remain confident and will be
aggregated into a data set.