Door-to-Door Mobility: Evaluating a Bus Rapid Transit ... · Door-to-Door Mobility 137 Door-to-Door...
25
Door-to-Door Mobility 137 Door-to-Door Mobility: Evaluating a Bus Rapid Transit Community Transport Concept Matthew Pahs, Minnesota Department of Transportation Mark Rohden, Tri-Met David Hampsten, City of Portland, Oregon Department of Transportation Seth Gallant, Paratransit Services Robert L. Bertini, Portland State University Abstract Portland, Oregon’s regional government, Metro, has designated specific commu- nities in outer Southeast Portland as areas that should be planned to accommodate future population growth. Both Metro and the Tri-County Metropolitan Transportation District of Oregon (Tri-Met) have expressed a desire for Bus Rapid Transit (BRT) ser- vice to this area from downtown Portland, within a corridor approximately following Southeast Powell Boulevard and Foster Road. A preliminary analysis of BRT alignment alternatives was completed for this study. After six possible alignment options linking downtown Portland with Pleasant Valley and Damascus Town Centers were identified, a multivariate corridor analysis was applied to each option. Criteria used to select the best alignment alternative included regional con- nectivity, local ridership, operational costs, trip duration, distance, right-of-way and political feasibility, environmental costs, and capital costs. In addition, recommendations have been made for possible station locations along the preferred alternative corridor. This analysis is intended to assist Tri-Met in its efforts to begin planning, design- ing, and implementing a BRT system in this area. The results of the analysis suggest that
Transcript of Door-to-Door Mobility: Evaluating a Bus Rapid Transit ... · Door-to-Door Mobility 137 Door-to-Door...
Door-to-Door Mobility
137
Door-to-Door Mobility:Evaluating a Bus Rapid TransitCommunity Transport Concept
Matthew Pahs, Minnesota Department of Transportation
Mark Rohden, Tri-Met
David Hampsten, City of Portland, Oregon Department of Transportation
Seth Gallant, Paratransit Services
Robert L. Bertini, Portland State University
AbstractPortland, Oregon’s regional government, Metro, has designated specific commu-
nities in outer Southeast Portland as areas that should be planned to accommodate
future population growth. Both Metro and the Tri-County Metropolitan Transportation
District of Oregon (Tri-Met) have expressed a desire for Bus Rapid Transit (BRT) ser-
vice to this area from downtown Portland, within a corridor approximately following
Southeast Powell Boulevard and Foster Road.
A preliminary analysis of BRT alignment alternatives was completed for this study.
After six possible alignment options linking downtown Portland with Pleasant Valley and
Damascus Town Centers were identified, a multivariate corridor analysis was applied to
each option. Criteria used to select the best alignment alternative included regional con-
nectivity, local ridership, operational costs, trip duration, distance, right-of-way and
political feasibility, environmental costs, and capital costs. In addition, recommendations
have been made for possible station locations along the preferred alternative corridor.
This analysis is intended to assist Tri-Met in its efforts to begin planning, design-
ing, and implementing a BRT system in this area. The results of the analysis suggest that

Journal of Public Transportation, Vol.5, No. 2, 2002
138
a BRT system is feasible for the Powell/Interstate 205/Foster alignment. The outcome
also suggests that BRT has the capacity to influence land use and could generate high
transit ridership. Overall, it is recommended that Tri-Met and Metro continue to evalu-
ate opportunities for BRT in this alignment.
IntroductionFor many people, buses have become a last resort transportation choice due
to their apparent reputation as an undesirable, poorly performing mode. However,as traffic congestion increases and light rail transit (LRT) construction costs esca-late, many transit properties have begun to take advantage of technologicaladvances and new concepts in vehicle design and corridor development.
BRT combines qualities of fixed-guideway transit with the flexibility of tra-ditional bus systems. A BRT system can use both general traffic lanes and/ordedicated guideways, smooth-riding vehicles, improved station amenities, andIntelligent Transportation Systems (ITS) technology to enhance the performanceof the system and encourage higher transit usage. By combining attributes of railand bus systems, BRT can achieve the benefits of both. The purpose of this cor-ridor analysis is to evaluate and prioritize BRT elements that are responsive tocommunity needs and the expected travel demand in Portland, Oregon’sSoutheast corridor.
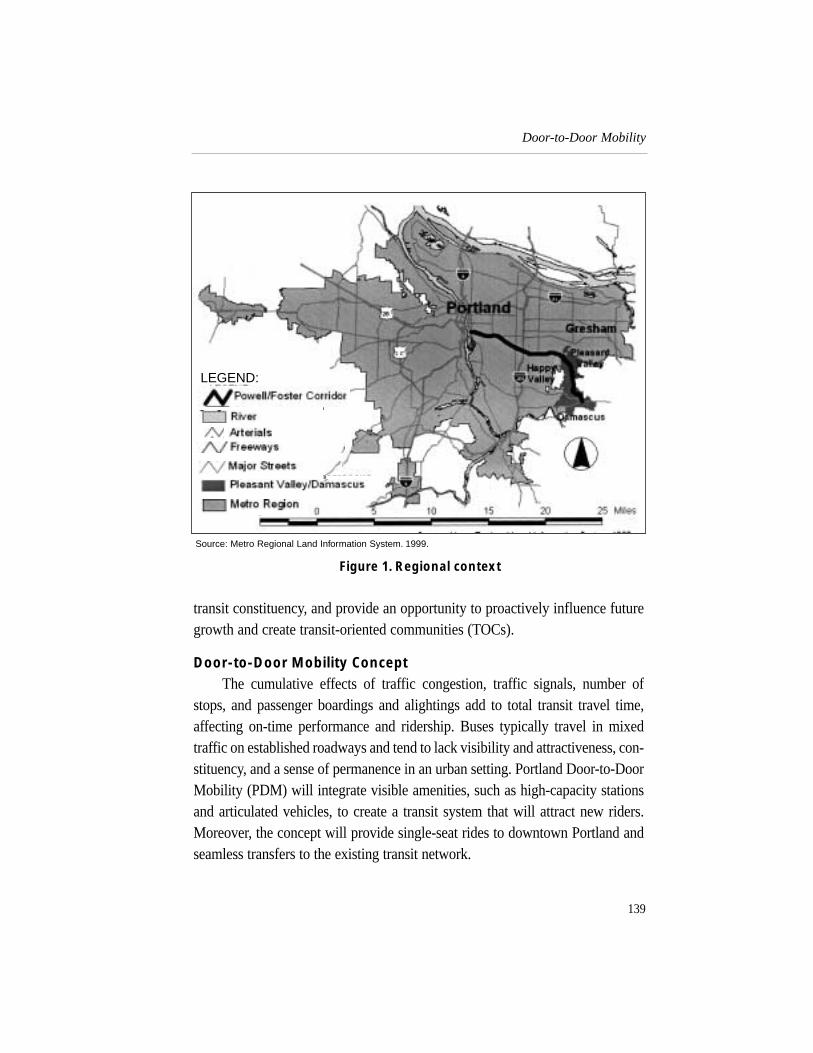
Purpose and NeedThe Portland region is delimited by an urban growth boundary (UGB),
which designates urban and rural lands. Metro has projected Southeast Portlandas one area for growth (see Figure 1). In particular, the communities of PleasantValley and Damascus are projected to grow in population from 13,000 to125,000 residents by 2020 (Metro 2000). Infrastructure is currently lacking andtransit service does not exist in these areas. Metro’s Regional TransportationPlan (RTP) has identified several potential BRT corridors for future study anddevelopment, including the Powell–Foster corridor extending from Portland’sdowntown to Pleasant Valley and Damascus. Consistent with regional planningpolicies, it is likely that development will be concentrated in town centers andalong major transportation routes. Implementing a BRT system in this corridorwould anticipate growth and demand for travel to downtown Portland, build a
Door-to-Door Mobility
139
Figure 1. Regional context
transit constituency, and provide an opportunity to proactively influence futuregrowth and create transit-oriented communities (TOCs).
Door-to-Door Mobility ConceptThe cumulative effects of traffic congestion, traffic signals, number of
stops, and passenger boardings and alightings add to total transit travel time,affecting on-time performance and ridership. Buses typically travel in mixedtraffic on established roadways and tend to lack visibility and attractiveness, con-stituency, and a sense of permanence in an urban setting. Portland Door-to-DoorMobility (PDM) will integrate visible amenities, such as high-capacity stationsand articulated vehicles, to create a transit system that will attract new riders.Moreover, the concept will provide single-seat rides to downtown Portland andseamless transfers to the existing transit network.
LEGEND:
Source: Metro Regional Land Information System. 1999.
Journal of Public Transportation, Vol.5, No. 2, 2002
140
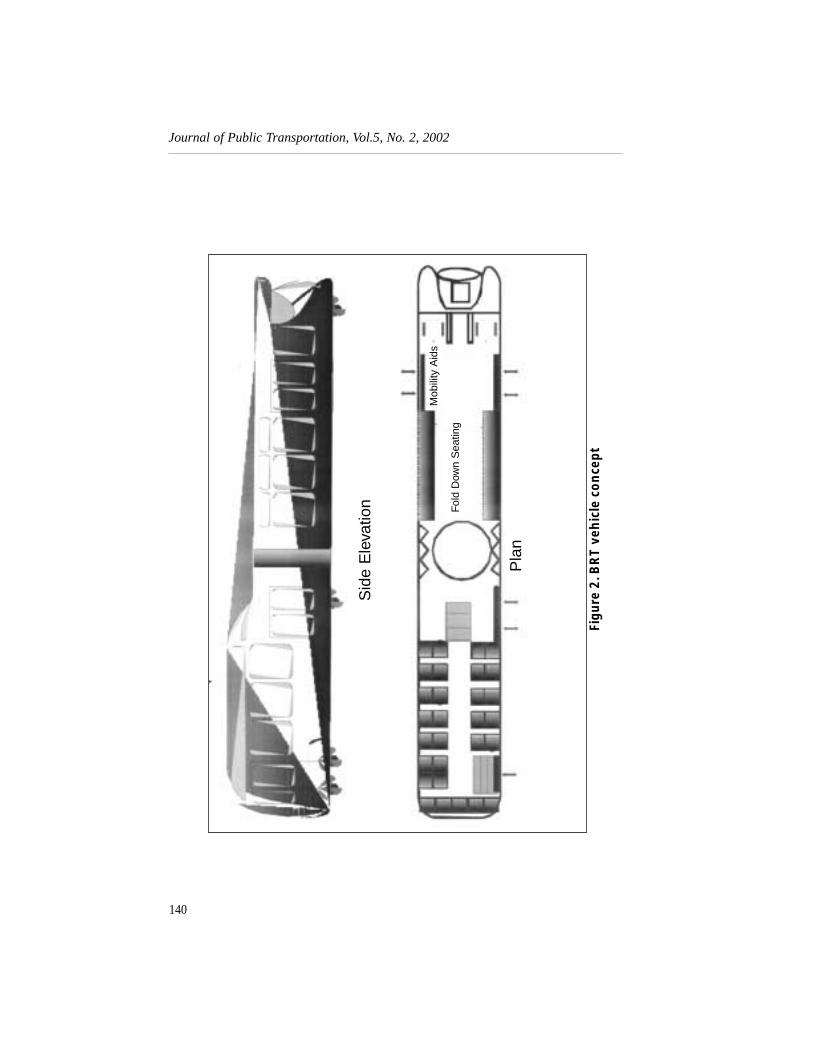
Figu
re 2
. BR
Tve
hic
le c
on
cep
t
Sid
e E
leva
tion Fol
d D
own
Sea
ting
Mob
ility
Aid
s
Pla
n
Door-to-Door Mobility
141
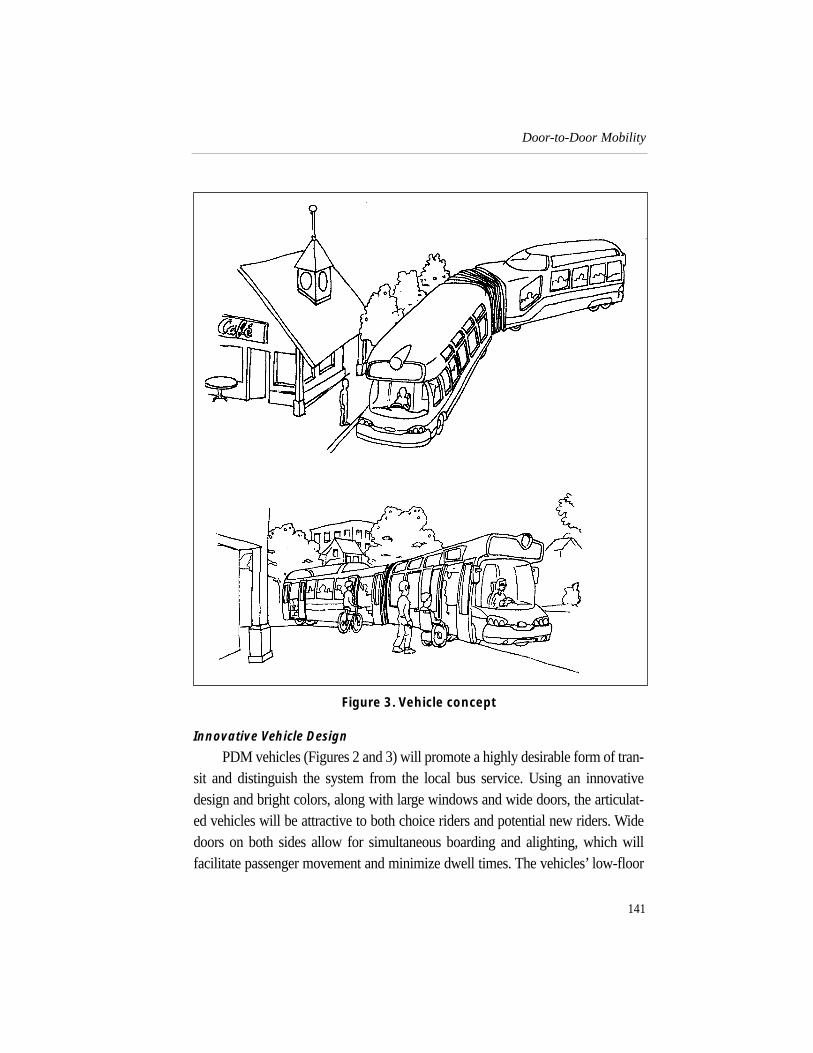
Figure 3. Vehicle concept
Innovative Vehicle Design
PDM vehicles (Figures 2 and 3) will promote a highly desirable form of tran-sit and distinguish the system from the local bus service. Using an innovativedesign and bright colors, along with large windows and wide doors, the articulat-ed vehicles will be attractive to both choice riders and potential new riders. Widedoors on both sides allow for simultaneous boarding and alighting, which willfacilitate passenger movement and minimize dwell times. The vehicles’ low-floor
Journal of Public Transportation, Vol.5, No. 2, 2002
142
design provides level boarding to all customers, including people using mobilityaids. As shown in Figure 2, the seating arrangement includes forward- and rear-fac-ing seats, individual foldout tables, and flip-down side-facing seats in the frontsection of the vehicle. Bicycles can be stored out of the way on wall or ceilingmounts. In addition, Americans with Disabilities Act (ADA) requirements will bemet by accommodations for up to two wheelchair units in the front section of thevehicle.
Intelligent Transportation Systems
The PDM concept vehicle will be equipped with advanced voice and datacommunication technologies and an automatic vehicle location (AVL) systemusing Global Positioning Systems (GPS) for fleet management and for providingreal-time information to all customers. A transit signal priority system will alsouse real-time vehicle information to predict vehicle arrival times, determinewhether that vehicle is on schedule, and provide either an extension of the greenphase or a truncation of the red phase.
Guideway
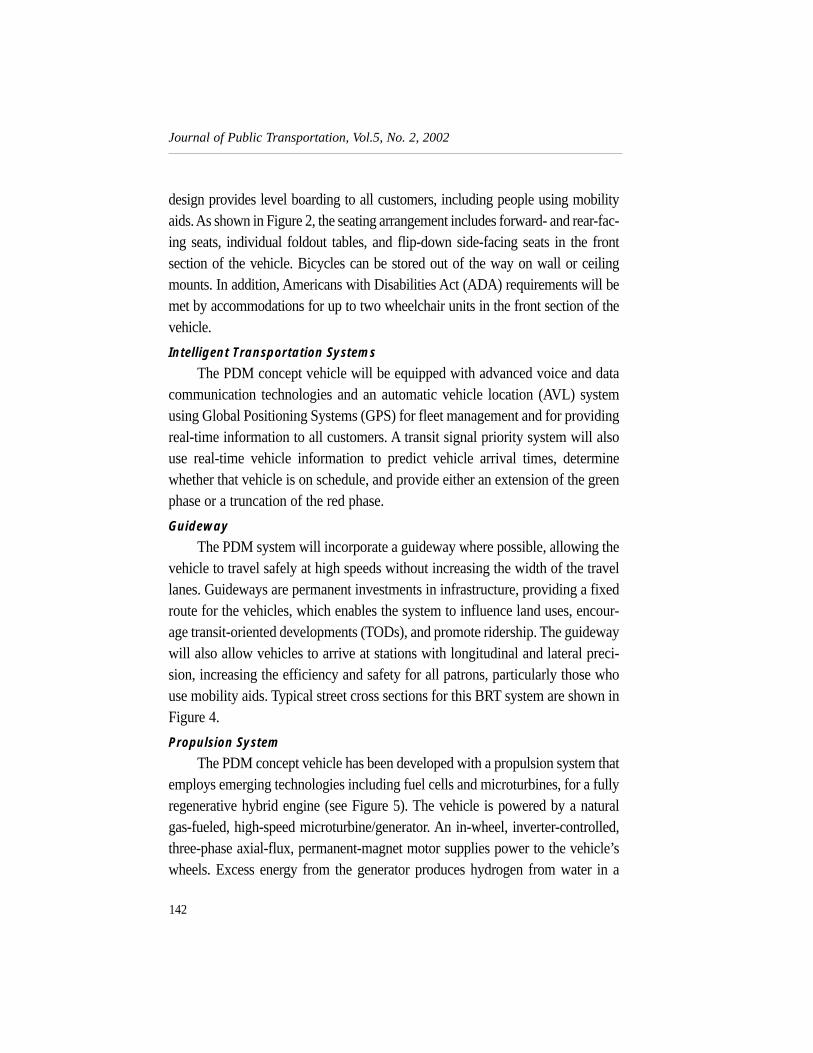
The PDM system will incorporate a guideway where possible, allowing thevehicle to travel safely at high speeds without increasing the width of the travellanes. Guideways are permanent investments in infrastructure, providing a fixedroute for the vehicles, which enables the system to influence land uses, encour-age transit-oriented developments (TODs), and promote ridership. The guidewaywill also allow vehicles to arrive at stations with longitudinal and lateral preci-sion, increasing the efficiency and safety for all patrons, particularly those whouse mobility aids. Typical street cross sections for this BRT system are shown inFigure 4.
Propulsion System
The PDM concept vehicle has been developed with a propulsion system thatemploys emerging technologies including fuel cells and microturbines, for a fullyregenerative hybrid engine (see Figure 5). The vehicle is powered by a naturalgas-fueled, high-speed microturbine/generator. An in-wheel, inverter-controlled,three-phase axial-flux, permanent-magnet motor supplies power to the vehicle’swheels. Excess energy from the generator produces hydrogen from water in a
Door-to-Door Mobility
143
Figu
re 4
. Cro
ss s
ecti
on
s
TY
PIC
AL
STA
TIO
N &
LA
NE
SE
CT
ION
S F
OR
116
’RIG
HT
S-O
F-W
AYO
N P
OR
TLA
ND
BU
S R
AP
ID T
RA
NS
IT C
OR
RID
OR
S
9’S
idew
alk
5’ Bik
eLa
ne
12’
Trav
el L
ane
12’
Trav
el L
ane
12’B
RT
Lane
12’B
RT
Lane
12’
Trav
el L
ane
12’
Trav
el L
ane
5’ Bik
eLa
ne
9’S
idew
alk
2’
AS
PH
ALT
CO
NC
RE
TE
RO
AD
SU
RFA
CE
2’2’
AS
PH
ALT
CO
NC
RE
TE
RO
AD
SU
RFA
CE
AS
PH
ALT
CO
NC
RE
TE
RO
AD
SU
RFA
CE
AS
PH
ALT
CO
NC
RE
TE
RO
AD
SU
RFA
CE
9’S
idew
alk
5’ Bik
eLa
ne
12’
Trav
el L
ane
12’
Trav
el L
ane
6’Pe
dIs
land
26’G
uide
dB
RT
Sto
p11
’Sta
tion
Pla
tform
26’G
uide
dB
RT
Sto
p6’
Ped
Isla
nd12
’Tr
avel
Lan
e12
’Tr
avel
Lan
e9’
Sid
ewal
k
TY
PIC
AL
LAN
E C
RO
SS
SE
CT
ION
SF
OR
106
’RIG
HT
S-O
F-W
AYO
N P
OR
TLA
ND
BU
S R
AP
ID T
RA
NS
IT C
OR
RID
OR
S
5’ Bik
eLa
ne
Sour
ce:D
esig
n by
prh
g co
nsul
ting.
200
1.
Journal of Public Transportation, Vol.5, No. 2, 2002
144
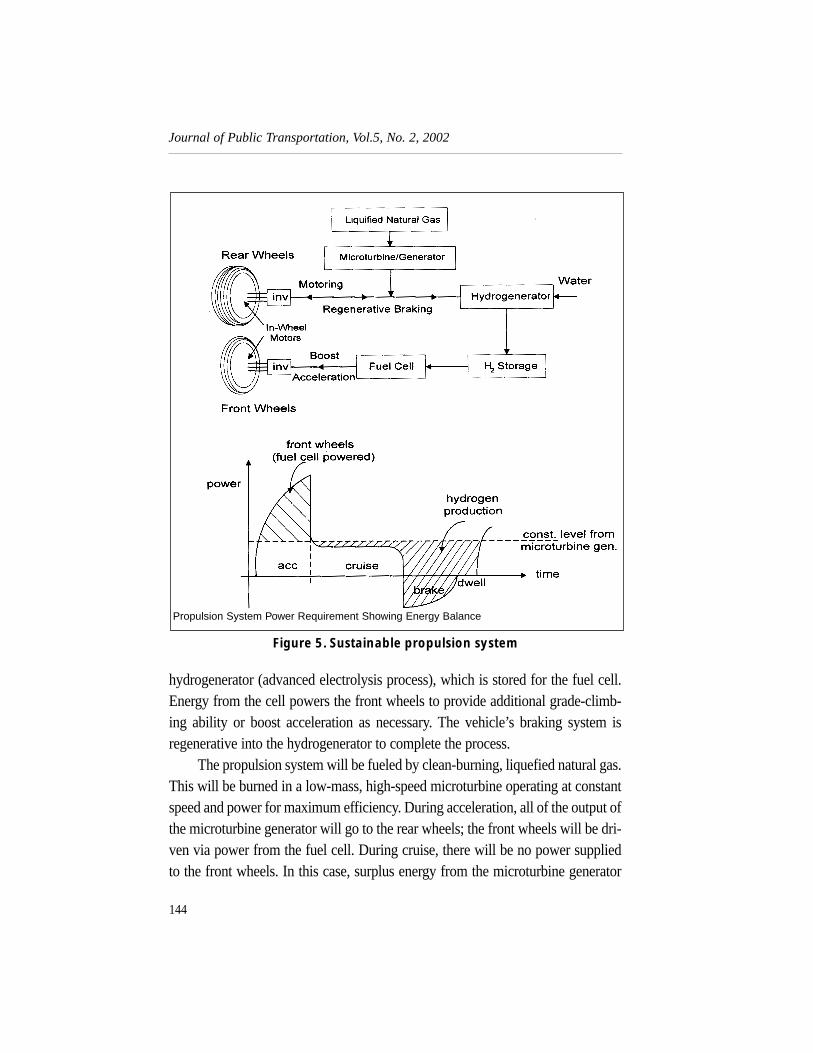
Figure 5. Sustainable propulsion system
hydrogenerator (advanced electrolysis process), which is stored for the fuel cell.Energy from the cell powers the front wheels to provide additional grade-climb-ing ability or boost acceleration as necessary. The vehicle’s braking system isregenerative into the hydrogenerator to complete the process.
The propulsion system will be fueled by clean-burning, liquefied natural gas.This will be burned in a low-mass, high-speed microturbine operating at constantspeed and power for maximum efficiency. During acceleration, all of the output ofthe microturbine generator will go to the rear wheels; the front wheels will be dri-ven via power from the fuel cell. During cruise, there will be no power suppliedto the front wheels. In this case, surplus energy from the microturbine generator
Propulsion System Power Requirement Showing Energy Balance
Door-to-Door Mobility
145
will be used to produce hydrogen by electrolysis. During deceleration, the brak-ing effort of the rear wheels will increase the level of hydrogen production. Cleanand quiet vehicles will establish a positive image for BRT and will set it apartfrom conventional city buses.Accessibility and Mobility
The PDM approach to accessibility issues is comprehensive. People withdisabilities will have two areas on the vehicle that will automatically secure themand their mobility aids (Figure 1). Standing passengers will be provided handlesand seat rests on internal sections. Both the front and rear areas of the vehicle willbe equipped with real-time passenger information systems, providing both audioand visual communications. Real-time information systems will interface withpersonal electronic devices (e.g., personal digital assistants, cellular phones) forcommuters who wish to download a schedule or route map. The vehicle is alsoequipped to support personal wireless communication systems for those whoneed to access the Internet during their trip. Station platforms will match thevehicle’s door level, making boarding trouble-free and efficient for all passen-gers. Platforms will also include shelters to protect passengers from the elementsand include electronic kiosks providing schedule information. Kiosks will alsohouse the fare system, which will allow passengers to prepay for their trip usinga smart card to ease boarding and alighting.Community BRT System
The PDM system will be integrated with Tri-Met’s transit operations in thesurrounding area and will also include its own neighborhood feeder service forunderserved areas of the community. Stations will be developed as communityassets, where amenities may include car sharing, neighborhood electric vehicles,or electric bicycle rentals, each of which will provide local connections for resi-dents. Pedestrian and bicycle access to the PDM system will be a priority, asencouraging these two modes will have a positive impact on ridership. Stationswill become neighborhood focal points, with opportunities for retail, packagedelivery, cafes, and community centers of all kinds.
BRT in Southeast PortlandImplementation of BRT in the Southeast Powell–Foster corridor poses sev-
eral challenges. In some areas, existing arterials have insufficient cross sections
Journal of Public Transportation, Vol.5, No. 2, 2002
146
necessary for providing an exclusive right-of-way for BRT. In addition, gener-al traffic flow must be maintained and local parking and air quality impactsmust be minimized. BRT could help create livable TOCs and encourage transitridership concurrent with the expected population growth in metropolitanPortland. Components of a BRT system in Southeast Portland would includesome or all of the following:
• Exclusive guideway/lanes: A lane on an urban arterial reserved for theexclusive use of BRT.
• Transit signal priority: Extension of green time or actuation of signalupon detection of an approaching BRT vehicle.
• Traffic management improvements: Low-cost infrastructure elementsto increase the speed and reliability of BRT service (e.g., signage, curbextensions).
• Faster boarding: Prepaid automatic fare collection systems at stationsallow passengers to board easily and help facilitate quick boarding.
• Integration of transit development with land-use policy: BRT and com-pact TOD support one another, use less land, and encourage creation ofneighborhood centers.
• Improved facilities and amenities: The advantages of separating BRTfrom traffic can be complemented with improved amenities such asshelters, stations, and real-time schedule data [Federal TransitAdministration (FTA) 2000].
AnalysisThis analysis is an adaptation of a process designed to elicit responses from
stakeholders, whereby those individuals are asked to judge the importance of cer-tain criteria in making transportation policy decisions. This corridor studyincludes the evaluation of six possible BRT alignments using a list of criteria andan initial study of potential station locations. In this case, the authors assessed theimportance and value of the criteria.
Door-to-Door Mobility
147
Each alignment alternative originates in the transit mall in downtownPortland and terminates at the Pleasant Valley and Damascus Town Centers(Figure 1). According to the FTA, a BRT system should consider the followingcriteria:
1 transit travel-time savings and ridership increases;
2. impacts on open spaces, wetlands, and historic resources;
3. compatibility with land-use policies and contribution to economicdevelopment; and
4. the cost-effectiveness of the project (FTA 2000).
This study attempts to adhere to these considerations where applicable.
Alignment Options
The original alignment considered for this analysis was the Powell/Fosterroute to Damascus. The primary constraints associated with this particular optionare two bottlenecks on Foster Road: one on Foster between 50th Avenue andInterstate 205; the second on Foster near 162nd Avenue and Jenne Road. Theseright-of-way constraints led to the consideration of five additional options (seeFigure 6), including:
1. Powell/Interstate 205/Foster option: Avoids narrow section of Fosterfrom 50th to Interstate 205; uses wide right-of-way on Powell between50th and Interstate 205; then joins freeway, using dedicated lane, andheads south, rejoining Foster.
2. McLoughlin/Sunnyside and McLoughlin/Highway 212 options: Usesproposed South Corridor down McLoughlin Boulevard from down-town Portland to Clackamas Regional Center, avoiding the bottleneckon Foster Road at 162nd; proceeding along Sunnyside Road orHighway 212 to the Pleasant Valley/Damascus area. Several studies forthis route are currently being assembled, most notably by Tri-Met andClackamas County. However, no final decisions or funding for suchprojects has been forthcoming.

Journal of Public Transportation, Vol.5, No. 2, 2002
148
3. Powell/Interstate 205/Sunnyside and Powell/Foster/Interstate205/Sunnyside options: Uses Interstate 205’s generous right-of-way.The two alternatives using this general route are nearly identical exceptthat the former follows Powell all the way to the freeway, while the lat-ter leaves Powell at 50th and follows Foster to the freeway. Despiteappearing indirect, these were chosen because they avoided environ-mentally sensitive areas in Pleasant Valley and because they connect tothe Clackamas Regional Center.
4. Powell/Division/182nd option: Uses Powell until Interstate 205, headsbriefly north on Interstate 205, and turns east on Division Street, witha very wide right-of-way to Gresham, turning south on 182nd toPleasant Valley/Damascus.
Figure 6. Alignment alternatives
Door-to-Door Mobility
149
5. Springwater Corridor option: Former railroad right-of-way (100 feetwide), now a recreational trail that joins with Foster Road near LentsTown Center. Despite potential opposition, the wide right-of-way mayprovide valuable comparison with other alignment alternatives.
Corridor AnalysisSeveral conditions were developed to assess the relative merits of each
alignment, and each criterion was weighted based on its relative importance. Thefinal score for each criterion was rated on a percentage scale and was weightedand totaled. An explanation of the criteria and their respective meanings follows.
Regional Connectivity (25% Weight)
The connectivity score was determined by estimating the presence and rela-tive importance of activity centers and trip generators along each alignment. Theseincluded retail and employment centers, schools, colleges, and hospitals. Majoractivity centers were then located and geo-coded in a Geographic InformationSystem (GIS). The trip-generation capacity of each activity node was qualitativelyestimated based on empirical data and several interviews with transportation pro-fessionals. Node scores were then compiled and divided by the entire length of theroute to generate a preliminary connectivity score for each corridor alignment.
Local Ridership (23% Weight)
To estimate current ridership on each corridor, the population for each seg-ment was multiplied by corresponding ridership rates [determined by a spatialsampling of 1998 Census tract populations (Metro 2000) within one-quarter mileof each segment] divided by the total daily transit boardings. Ridership rates forremaining corridor segments were interpolated based on density and Euclideandistance from downtown Portland. Using Metro data projecting metropolitangrowth rates from 1990 to 2010 (Gresham 1999), the projected 2020 populationfor each segment was estimated. The total local ridership score was calculated bycompiling the respective ridership populations for all segments and dividing thistotal by the route mileage.
Operations (26% Weight)
This variable includes estimated travel time for each option, number ofsharp turns the vehicle must make, number of stations, and approximate dwell
Journal of Public Transportation, Vol.5, No. 2, 2002
150
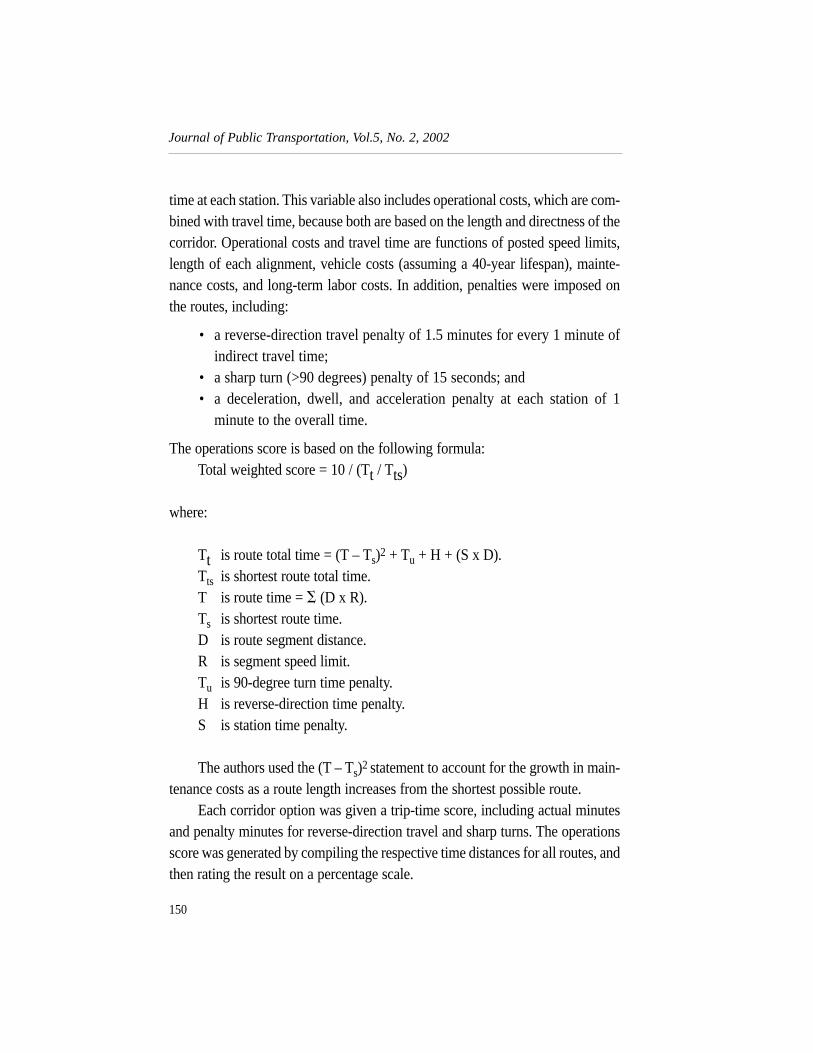
time at each station. This variable also includes operational costs, which are com-bined with travel time, because both are based on the length and directness of thecorridor. Operational costs and travel time are functions of posted speed limits,length of each alignment, vehicle costs (assuming a 40-year lifespan), mainte-nance costs, and long-term labor costs. In addition, penalties were imposed onthe routes, including:
• a reverse-direction travel penalty of 1.5 minutes for every 1 minute ofindirect travel time;
• a sharp turn (>90 degrees) penalty of 15 seconds; and• a deceleration, dwell, and acceleration penalty at each station of 1
minute to the overall time.
The operations score is based on the following formula:Total weighted score = 10 / (Tt / Tts)
where:
Tt is route total time = (T – Ts)2 + Tu + H + (S x D).Tts is shortest route total time.T is route time = � (D x R).Ts is shortest route time.D is route segment distance.R is segment speed limit.Tu is 90-degree turn time penalty.H is reverse-direction time penalty.S is station time penalty.
The authors used the (T – Ts)2 statement to account for the growth in main-tenance costs as a route length increases from the shortest possible route.
Each corridor option was given a trip-time score, including actual minutesand penalty minutes for reverse-direction travel and sharp turns. The operationsscore was generated by compiling the respective time distances for all routes, andthen rating the result on a percentage scale.
Right-of-Way Costs (14% Weight)
Right-of-way includes roadway, sidewalks, and generally all land betweenthe sidewalk and property line. For this BRT system, the ideal right-of-way (106feet) would include a 9-foot sidewalk with street trees, a 5-foot bike lane, two 12-foot auto travel lanes, and a 12-foot BRT lane with 2-foot buffers (Figure 4). Tofind the right-of-way score, a 106-foot right-of-way was assumed for all theroutes, with the exception of the Springwater route. The scores represent thecosts of purchasing land or obtaining easements from property owners to expandthe right-of-way and the political cost, which includes consideration of:
• resistance to growth, development, and loss of urban or rural aesthetics;• resistance to building demolition, specifically historic or community
structures and parks;• need to maintain existing auto- and bicycle-lane capacity and sidewalks;
and• need to minimize negative changes to traffic patterns.
The right-of-way score was calculated by compiling the qualitatively esti-mated costs of land and political feasibility for the routes, then rating the resulton a percentage scale.
Environmental Impacts (Weight 8%)
This criterion refers to the natural environment (creeks and wetlands in thePleasant Valley/Damascus area, and hillside cuts on Foster), and also to pedestriansafety mitigation measures. The chosen corridor should enable any negativeimpacts on either one to be mitigated at a relatively affordable cost. As there is lit-tle variation in negative pedestrian impacts among these corridor options, and theenvironmentally-sensitive areas are located in only a few places, it was determinedthat this criterion did not require substantial weighting. The environmental scorewas calculated by qualitatively estimating the costs of environmental and pedestri-an mitigation for the routes. For each alignment, the analysis qualitatively assessed:
• possible harm to the natural environment that must be mitigated;• estimated mitigation costs; and
Door-to-Door Mobility
151
• methods for minimizing negative impacts to the pedestrian environment(e.g., providing wide sidewalks, good signing, striping and lighting, pedes-trian refuge islands at crossings, and attractive and safe system access).
Construction Costs (Weight 4%)
Infrastructure costs include roadway reconstruction (earthwork, paving, andstriping), drainage, sidewalks, stations, signals, lighting, ITS enhancements,guideway if used, BRT lane pavement, and landscaping. Costs associated withacquiring land for right-of-way expansion are not included.
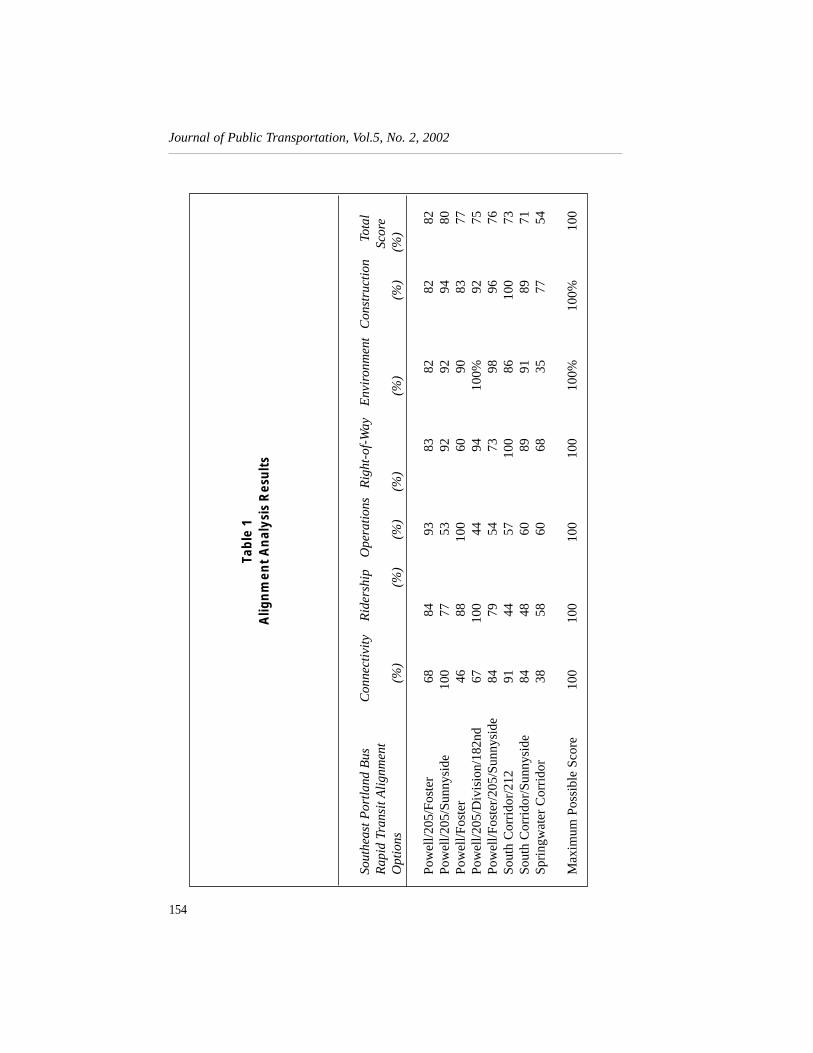
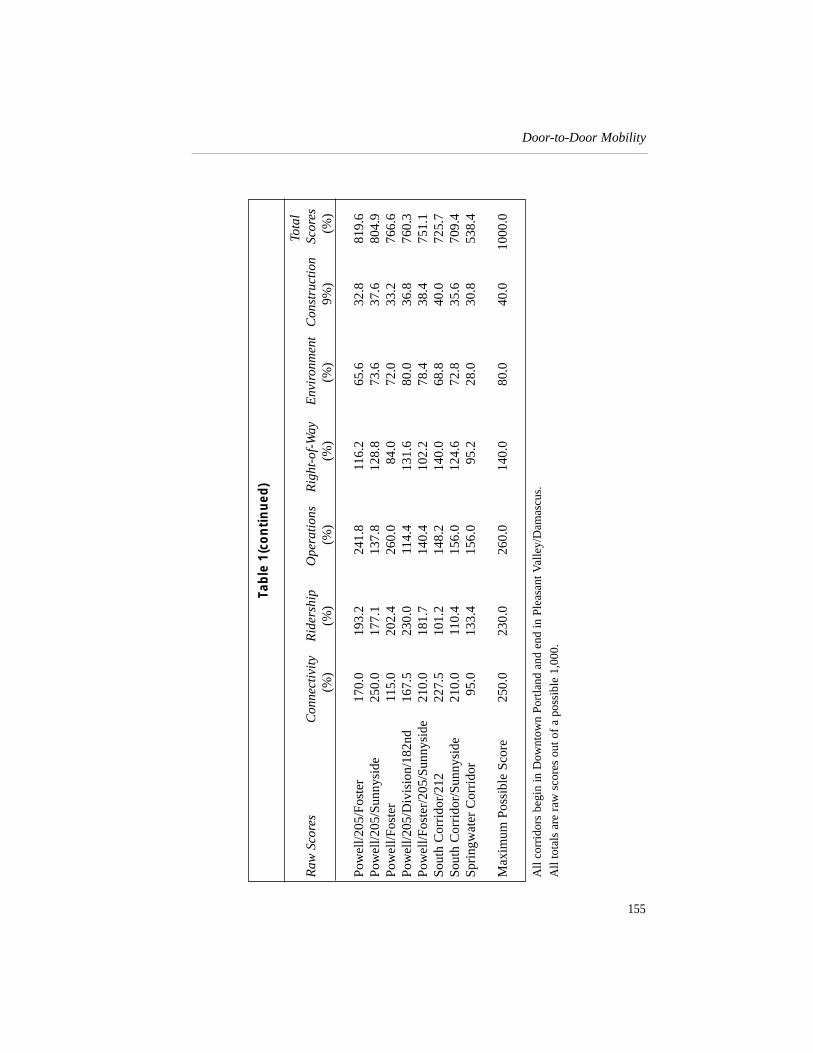
ResultsIn an analysis of six routes within the study corridor, the Powell/Interstate
205/Foster alignment was the best alternative, with a final score of 82 percent ofthe maximum weighted score of 100%. (Table 1 summarizes the overall results ofthe multivariate analysis.) This route, which is 15.8 miles in length, will serve theTransit Mall and Union Station in downtown Portland and cross the WillametteRiver on the Hawthorne Bridge. The route travels east on Powell Boulevard toInterstate 205, where it travels south to Foster Road within the Interstate corridor,and continues on Foster Road to the future Damascus Town Center. It is a rela-tively direct route to the Pleasant Valley/Damascus area and traverses densepopulation areas and activity centers where ridership would be strong.
Overall, the Powell/Interstate 205/Foster alignment was judged to be superi-or in this analysis because of its directness and connectivity to regional andemployment centers. Residential densities along Powell Boulevard provide ade-quate ridership for current bus routes that use this arterial, and projectedpopulation will further increase ridership. This route’s connections to activity cen-ters are better than those of the Powell/Foster alternative, and its use of a portionof the Interstate 205 right-of-way will allow the system to be more rapid. Its routealong Powell will have a wide right-of-way and will not be constrained by thedensely built-up areas on Foster Road between Southeast 50th and Interstate 205.
Because of its advantages in right-of-way width, construction and acquisi-tion costs will be somewhat minimized. For example, Interstate 205 wasoriginally constructed to accommodate a busway and includes a tunnel thatcrosses under from the northbound lanes to the southbound lanes, suggesting
Journal of Public Transportation, Vol.5, No. 2, 2002
152
that a high-capacity transit system was intended here. Due to future populationand employment growth in the area, Foster Road likely will need to be expand-ed to create access for residents. The entrance to Pleasant Valley is hindered bya natural bottleneck in the surrounding topography, located at the intersection ofSoutheast Foster and Jenne Road. Negative environmental impacts could poten-tially occur at this location, as well as further into the valley itself.
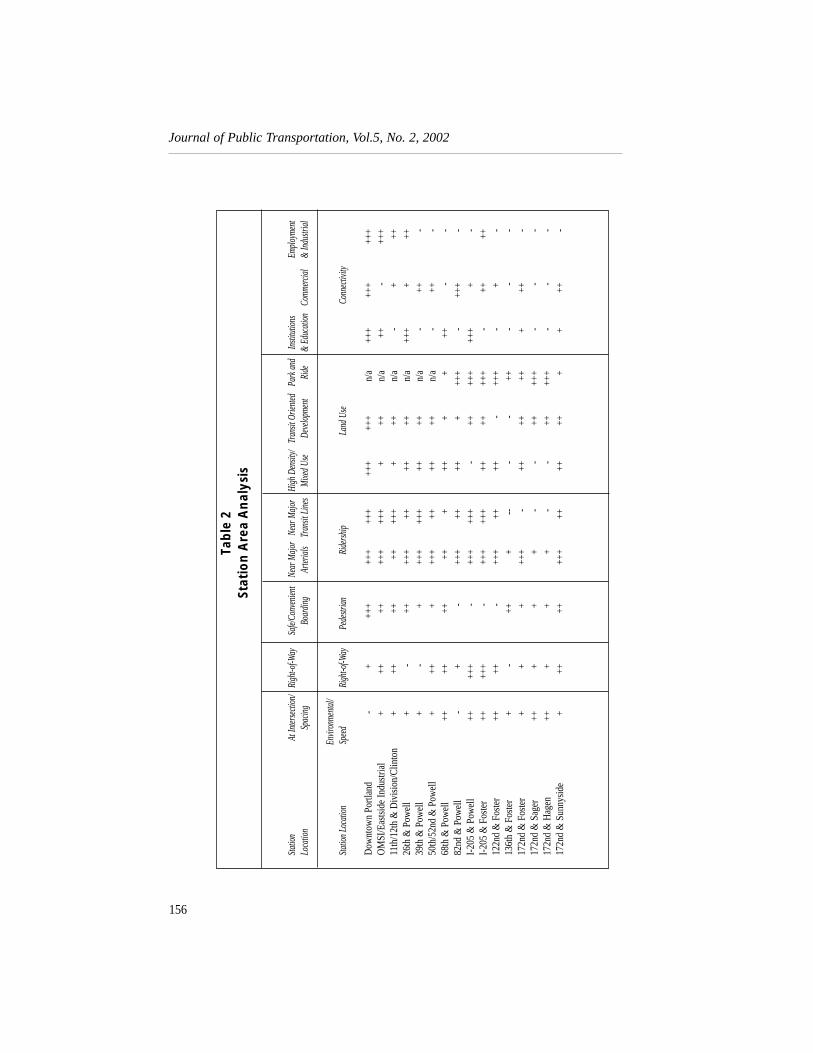
Station AnalysisOptimal locations for future BRT stations were analyzed based on the fol-
lowing criteria:
• Speed: Stations should be located near large intersections where speedwill be reduced and should be at least one mile apart.
• Right-of-way: Accommodate station platform while maintaining exist-ing infrastructure.
• Environmental and Pedestrian: Must allow for safe and convenientboarding.
• Ridership: Near intersections of major arterials and major transit corri-dors.
• Land Use: Near high-density, mixed-use areas; conducive to transit-ori-ented redevelopment; outer stations should accommodate park-and-ridefacilities.
• Connectivity: Near government and educational institutions; supportedby adequate commercial development; access to employment and indus-trial uses.
Based on the station analysis criteria, optimal station locations were deter-mined for the highest scoring alignment. Table 2 shows the rating scale used forthe Powell/Interstate 205/Foster Road alignment stations.
ConclusionsWhile the mean score for all six alternatives examined was 73.5 percent, the
Powell/Interstate 205/Foster alignment scored 82 percent since it includes adirect route with good local ridership potential. Although the Powell/Interstate
Door-to-Door Mobility
153
Journal of Public Transportation, Vol.5, No. 2, 2002
154
Tab
le 1
Alig
nm
ent
An
alys
is R
esu
lts
Sout
heas
t P
ortl
and
Bus
Con
nect
ivit
yR
ider
ship
Ope
rati
ons
Rig
ht-o
f-W
ayE
nvir
onm
ent
Con
stru
ctio
nTo
tal
Rap
id T
rans
it A
lign
men
tSc
ore
Opt
ions
(%)
(%)
(%)
(%)
(%)
(%)
(%)
Pow
ell/2
05/F
oste
r68
8493
8382
8282
Pow
ell/2
05/S
unny
side
100
7753
9292
9480
Pow
ell/F
oste
r46
8810
060
9083
77Po
wel
l/205
/Div
isio
n/18
2nd
6710
044
9410
0%92
75Po
wel
l/Fos
ter/
205/
Sunn
ysid
e84
7954
7398
9676
Sout
h C
orri
dor/
212
9144
5710
086
100
73So
uth
Cor
rido
r/Su
nnys
ide
8448
6089
9189
71Sp
ring
wat
er C
orri
dor
3858
6068
3577
54
Max
imum
Pos
sibl
e Sc
ore
100
100
100
100
100%
100%
100
Tab
le 1
(co
nti
nu
ed)
Tota
lR
aw S
core
sC
onne
ctiv
ity
Rid
ersh
ipO
pera
tion
sR
ight
-of-
Way
Env
iron
men
tC
onst
ruct
ion
Scor
es(%
)(%
)(%
)(%
)(%
)9%
)(%
)
Pow
ell/2
05/F
oste
r17
0.0
193.
224
1.8
116.
265
.632
.881
9.6
Pow
ell/2
05/S
unny
side
250.
017
7.1
137.
812
8.8
73.6
37.6
804.
9Po
wel
l/Fos
ter
115.
020
2.4
260.
084
.072
.033
.276
6.6
Pow
ell/2
05/D
ivis
ion/
182n
d16
7.5
230.
011
4.4
131.
680
.036
.876
0.3
Pow
ell/F
oste
r/20
5/Su
nnys
ide
210.
018
1.7
140.
410
2.2
78.4
38.4
751.
1So
uth
Cor
rido
r/21
222
7.5
101.
214
8.2
140.
068
.840
.072
5.7
Sout
h C
orri
dor/
Sunn
ysid
e21
0.0
110.
415
6.0
124.
672
.835
.670
9.4
Spri
ngw
ater
Cor
rido
r95
.013
3.4
156.
095
.228
.030
.853
8.4
Max
imum
Pos
sibl
e Sc
ore
250.
023
0.0
260.
014
0.0
80.0
40.0
1000
.0
All
corr
idor
s be
gin
in D
ownt
own
Port
land
and
end
in P
leas
ant V
alle
y/D
amas
cus.
All
tota
ls a
re r
aw s
core
s ou
t of
a po
ssib
le 1
,000
.
Door-to-Door Mobility
155
Journal of Public Transportation, Vol.5, No. 2, 2002
156
Tab
le 2
Stat
ion
Are
a A
nal
ysis
Statio
nAt
Inter
secti
on/
Righ
t-of-W
aySa
fe/Co
nven
ient
Near
Majo
rNe
ar M
ajor
High
Den
sity/
Tran
sit O
riente
dPa
rk an
dIn
stitut
ions
Emplo
ymen
tLo
catio
nSp
acing
Boar
ding
Arter
ials
Tran
sit L
ines
Mixe
d Use
Deve
lopme
ntRi
de&
Educ
ation
Comm
ercia
l&
Indu
strial
Envir
onme
ntal/
Statio
n Loc
ation
Spee
d
Righ
t-of-W
ay
Pede
strian
Ri
dersh
ip
L
and U
se
C
onne
ctivit
y
Dow
ntow
n Po
rtlan
d-
+++
+++
+++
+++
+++
+n/
a++
+++
+++
+O
MSI
/Eas
tsid
e In
dust
rial
+++
++++
+++
++
++n/
a++
-++
+11
th/1
2th
& D
ivis
ion/
Clin
ton
+++
++++
+++
+++
n/a
-+
++26
th &
Pow
ell
+-
++++
+++
++++
n/a
+++
+++
39th
& P
owel
l+
-+
+++
+++
++++
n/a
-++
-50
th/5
2nd
& P
owel
l+
+++
+++
++++
++n/
a-
++-
68th
& P
owel
l++
++++
+++
+++
+++
--
82nd
& P
owel
l-
+-
+++
++++
+++
+-
+++
-I-
205
& P
owel
l++
+++
-++
+++
+-
++++
+++
++
-I-
205
& F
oste
r++
+++
-++
+++
+++
++++
+-
++++
122n
d &
Fos
ter
++++
-++
+++
++-
+++
-+
-13
6th
& F
oste
r+
-++
+--
--
++-
--
172n
d &
Fos
ter
++
+++
+-
++++
+++
++-
172n
d &
Sag
er++
++
+-
-++
+++
--
-17
2nd
& H
agen
+++
++
--
++++
+-
--
172n
d &
Sun
nysi
de+
++++
+++
++++
+++
+++
-
Door-to-Door Mobility
157
205/Foster alignment did not score the highest on any single criterion, it didscore very well on most. Expanding Southeast Foster Road at 162nd and JenneRoad to four travel lanes will be very expensive due to high costs of either cut-ting into the steep hillside to widen Foster or tunneling underneath the ridge.Though plans to widen Foster at this section are presented in Metro’s RTP, theadditional costs of widening this by two additional lanes for BRT are potential-ly prohibitive. The lowest score for this alignment was 68 percent forconnectivity. Although it is a short and direct route and has a high ridershipscore, there is not as high a number of commercial centers and other activitylocations as the second best option, Powell/Interstate 205/Sunnyside.
Model Limitations
The model used for this analysis is not without its limitations. The connec-tivity and ridership variables together made up nearly half of the combined weightof the six criteria. A sensitivity analysis that included varying the weights for thesecriteria would likely result in a different final score for the Powell/Interstate205/Sunnyside corridor, for example. Given that this was a preliminary analysis,only basic ridership statistics were included, and only projected ridership of thoseliving within a quarter mile of the corridor was considered. The analysis did notinclude the influence of feeder bus routes bringing riders to the BRT corridor(though feeder service would be paramount to the success of this system); park-and-ride lots, which can have an extensive coverage area; and riders who walk orbike to a BRT station from more than a quarter mile away.
Recommendations
A fully implemented BRT system should include frequent service, with amaximum of 30-minute headways, and 10- to 15-minute headways during peakhours. The system should have a full-service day, from early morning com-mutes to late night service. Vehicles should be articulated and designed for levelboarding to allow for easy accessibility for all passengers, including those whorequire extra time to board, such as the elderly, people with disabilities, andusers with sight impairments. Wide doors should be included on both sides ofthe vehicle to allow quick and obstacle-free access. Vehicles and station plat-forms should have real-time audio and visual information systems to alert

Journal of Public Transportation, Vol.5, No. 2, 2002
158
passengers of departure and arrival times. Stations should be fully enclosedwhere possible, to act as a shield from both inclement weather and general traf-fic impacts. Stations should be equipped with amenities such as preboardpayment machines, real-time bus information, benches, and trash receptacles.
Implementation Strategy
The Powell/Interstate 205/Foster PDM system should be built incremental-ly. Since BRT utilizes existing roadways, it can be implemented initially withminor improvements, and then other infrastructure can be added as demandincreases and funding becomes available. A fleet of articulated vehicles that aredistinct from other vehicles in the system should be purchased for the BRT lineto give it its own identity prototype vehicle design is shown in Figures 2 and 3).Ultimately, vehicles would closely resemble those currently manufactured byCivis. Stations should be constructed in sections where median BRT lanes areadded. The first sections of dedicated lanes will most likely be built in the mid-dle of the route, around Powell and Interstate 205. Outer segments will bedeveloped in the future, as demand increases in those areas and roadway capac-ity increases. The innermost sections are relatively dense and present additionalphysical challenges, such as negotiating with railroads to share right-of-way;which Willamette River bridge it will use; and the obvious need to acquire prop-erty to provide adequate right-of-way for the system. In the meantime, even aseparated, dedicated lane from Southeast 50th and Powell to Southeast 122ndand Foster could dramatically reduce travel time in this corridor.
Ideally, there would be a complete system of dedicated median BRT lanesfrom the Hawthorne Bridge to Damascus Town Center by 2020. Due to right-of-way limitations, the completed infrastructure may necessitate single-laneoperation or operation in mixed-traffic lanes in limited sections. These includesections of Powell where there are parks or buildings at the edge of the right-of-way, and on Foster at the 162nd Avenue bottleneck.
Despite these limitations, a rapid, compelling, limited-stop BRT service canbe implemented in this corridor that would be competitive with peak-hour auto-mobile trips, as well as a pleasant way to travel around the region. Installing aguidance system, in addition to using dedicated lanes, can further enhance the
service by making it more convenient and attractive to potential riders. The com-bination of these amenities holds great promise for improving transit service andmaking it an appealing alternative to the automobile at a very affordable cost.
AcknowledgementsOur study team was assisted by Professors Kate Hunter-Zaworski, Annette
Von Jouanne, and Alan Wallace of Oregon State University; Professor JamesStrathman of Portland State University; Adrian Wallace of the Portland ArtInstitute; and Graham Carey of Lane Transit District. Conrad Wagner and DanSturges provided valuable feedback. Alan Lehto of Tri-Met was our projectclient. The advisory team was comprised of Tom Kloster and Kim White ofMetro. The Planning Workshop Faculty included Deborah Howe, ConnieOzawa, and Tom Sanchez of Portland State University.
Some of the ideas and images contained in this article were submitted aspart of an entry for the Bus Rapid Transit and the American Community NationalPlanning and Design Competition sponsored by WestStart and the FederalTransit Administration. We would like to thank Fred Silver of WestStart for hissupport and encouragement.
ReferencesBriggs, Kara. April 14, 1999. Urban creek holds good news: Salmon. The
Oregonian.Clackamas County Long Range Planning, Department of Transportation
and Development. November, 2000. Damascus concept planning study.Federal Transit Administration (FTA) Office of Research, Demonstration
and Innovation. 2000. Issues in bus-rapid transit.Giannopoulos, G. 1989. Bus planning and operation in urban areas: A
practical guide.Gilmore Research Group. November 2000. Tri-Met attitude and awareness
survey.Golias, Ronan. May/June 1997. Between bus and tramway. UTI: 31–34.Gresham, City of, Long Range Planning Team. 1999. Current socioeco-
nomic trends in the City of Gresham: 1.
Door-to-Door Mobility
159
Haywood, Howard M. October 1999. Massachusetts Bay TransportationAuthority Bus-Rapid Transit Silver Line.
Henke, Cliff. January/February 1998. Cities eye busways—again. MetroMagazine: 35-40.
Lane Transit District. 1999. Lane Transit District pilot East-West Bus-Rapid Transit corridor.
Lane Transit District. November, 2000. Lane Transit District Bus-RapidTransit, Draft Environmental Assessment.
Metro. July 1994. Region 2040, Decisions for tomorrow, transportationanalysis of the growth concept.
Metro. 2000. Regional land information system (RLIS). Portland, Oregon.Mortenson, Eric. February 8, 2001. Sides gather together to shape new
Pleasant Valley. The Oregonian.Patton, Carl V. et al. 1993. Basic methods of policy analysis and planning.
Englewood Cliffs, NJ: Prentice Hall.Pleasant Valley Concept Plan. March/April 2001. Public Comment Report,
Community Forums 1 & 2.Reed, Earl. March 2001. Portland Office of Transportation (informal inter-
view).Scannell, Ed. May 12, 2000. Los Angeles takes first step toward Bus-Rapid
Transit. The Urban Transportation Monitor: 1.Schwarz, Marcy and Constance Eichhorn. 1996. Collaborative decision-
making: use of multiattribute utility analysis to involve stakeholders inresolving controversial transportation issues.
Shen, L. David, et al. December. 1998. At-grade busway planning guide.Center for Urban Transportation Research, Florida International University.www.cutr.eng.usf.edu/research/nuti/busway/Busway.htm
Sneller, Joe. September/October 1997. Buses that run on rails. Mass Transit:50-55.
South Corridor Study, Transportation Alternatives. October 16, 2000. DraftSouth Corridor evaluation summary.
South/North Corridor Project. April 1999. Supplemental draftEnvironmental Impact Statement.
Journal of Public Transportation, Vol.5, No. 2, 2002
160
Transportation Research Board. National Academy Press. 1996. TCRPReport 19, guidelines for the location and design of bus stops. Washington,DC.
Tri-Met. 2000. five-year intelligent transportation system plan.Tri-Met. Mar 2001. Unpublished ridership numbers for 2000 received from
project client.WestStart. February 8, 2001. Bus-Rapid Transit and the American commu-
nity, a national planning and design competition.
About the AuthorsMATTHEW PAHS ([email protected]) is a graduate of the
Master of Urban and Regional Planning program at Portland State University.He is currently a planner for the Minnesota Department of Transportation.
MARK ROHDEN ([email protected]) is a graduate of the Master ofUrban and Regional Planning program at Portland State University. He is cur-rently a planner for Tri-Met.
DAVID HAMPSTEN ([email protected]) is a graduate of theMaster of Urban and Regional Planning program at Portland State University,with specializations in land use, transportation, and urban design. He is current-ly a cartographer/GIS mapper for the City of Portland, Oregon Office ofTransportation
SETH GALLANT ([email protected]) is a graduate of the Master ofUrban and Regional Planning program at Portland State University. He is cur-rently working with a transit advocacy group on expanding Portland’s MAXlight rail system.
ROBERT BERTINI ([email protected]) obtained his Ph.D. in transportationengineering at the University of California at Berkeley. He is an assistant pro-fessor of civil and environmental engineering and a research associate in theCenter for Urban Studies at Portland State University.
Door-to-Door Mobility
161