Donor Utilization: Making Use of a Precious Resource in Cardiac Transplant Jason W. Smith, MD...
33
Donor Utilization: Making Use of a Precious Resource in Cardiac Transplant Jason W. Smith, MD Assistant Professor of Surgery The University of Washington March 5, 2015
-
Upload
morgan-hoover -
Category
Documents
-
view
213 -
download
0
Transcript of Donor Utilization: Making Use of a Precious Resource in Cardiac Transplant Jason W. Smith, MD...

Donor Utilization:Making Use of a Precious Resource in
Cardiac Transplant
Jason W. Smith, MD
Assistant Professor of Surgery
The University of Washington
March 5, 2015

Prevalence of heart failure by sex and age (National Health and Nutrition Examination Survey: 2007–2010).
Go A S et al. Circulation. 2014;129:e28-e292
Copyright © American Heart Association, Inc. All rights reserved.

Hospital discharges for heart failure by sex (United States: 1980–2010).
Go A S et al. Circulation. 2014;129:e28-e292
Copyright © American Heart Association, Inc. All rights reserved.

Heart Failure StatisticsUS Population [1] 301,000,000
Target Population – 35-74 Age Cohort [1] 139,100,000
Diagnosed CHF Population [2]
All ages 5,520,00035 to 74 years 3,744,000NYHA Class IIIB and IV [3] in 35 – 74 Age Cohort
374,400
Co-morbidities estimated in this Cohort (280,800)
Potential Patients – 35 to 74 years 93,600
Simple Math: Patients per 100,000 Population 30
[1] US Census Bureau Statistics (2008)[2] Heart and Stroke Statistics, American Heart Association (2008) [3] Cardiovascular Roundtable research and analysis, The Advisory Board Company (2008)
(75%)
Jeevanandan V, Oral Presentation, Society of Thoracic Surgeons, 2011
Our Population
6,724,540
= 2017 pts
Washington state:

Orthotopic Heart Transplant

Two Decades of Stability
J Heart Lung Transplant, vol 33, 2014

Total heart transplants
SRTR

Increasing MCS use

The Journal of Heart and Lung Transplantation 2014 33, 555-564DOI: (10.1016/j.healun.2014.04.010) Copyright © 2014 International Society for Heart and Lung Transplantation Terms and Conditions
LVAD Survival

HEART TRANSPLANTSKaplan-Meier Survival
(Transplants: January 1982 - June 2010)
ISHLT 2012
Survival is based on adult and pediatric transplant recipients
N = 96,273 N at risk at 25 years
= 112
J Heart Lung Transplant. 2012 Oct; 31(10): 1045-1095

Patient survival among adult heart transplant recipients, 2005–2007
SRTR


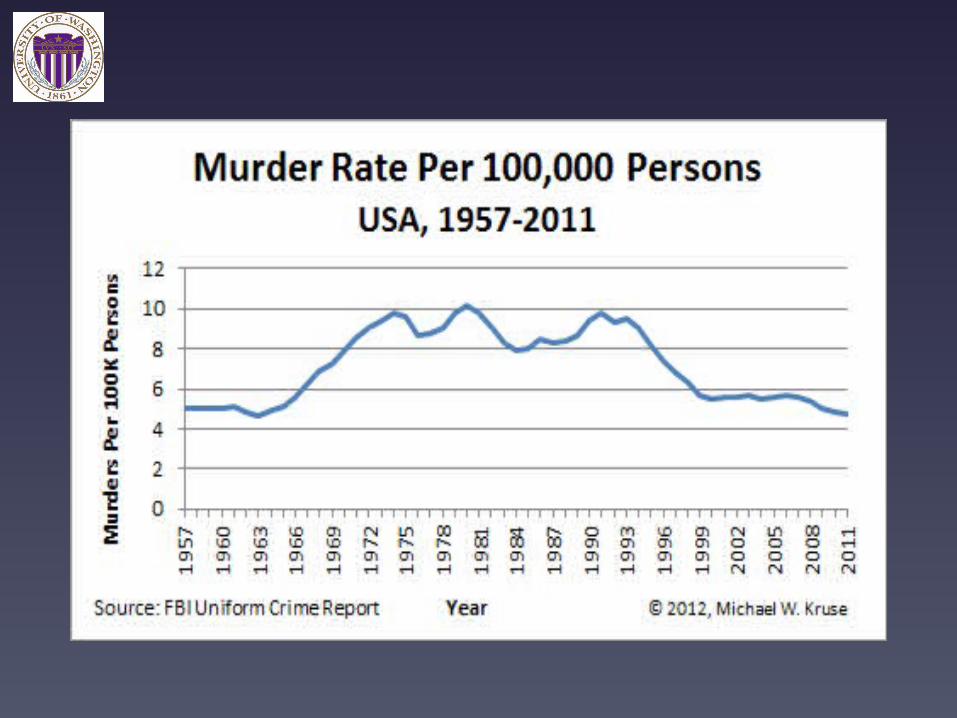
Suicide Rate in the US by Year
CDC. Web-based Injury Statistics Query and Reporting System (WISQARS). Atlanta, GA. 2013


But, It’s more complicated
Khush et al, 2015


So Why is That Happening?
• Decline in heart utilization from 44% to 29%
• Increasing age of the donor population
• Fear of “high risk” hearts
• Avoidance of LVH
• Fear of longer ischemic times
• Avoidance of gender and size mismatching

Deceased donor heart transplant rates per 100 patient years on the waiting
list
SRTR

Deceased donor heart donation rates (per 1,000 deaths), by
state: 2009-2011

UW Donor Stats
• 2012
– 325 Donor offers
– 78 Transplanted
hearts
– 20 Transplanted at
the UW
• 2012
– 6% overall
utilization
– 26% adjusted
utilization

The Plan
• Review every donor offer
• Identify missed opportunities
• Establish a Donor Review Conference
• Consensus for donor assessment
• Review our outcomes

Review every offer
• Careful review of
each donor offer
• Highlight hearts
transplanted by
other centers
• Identify reasons for
refusal

Missed Opportunities
• Initial Low EF that improves
• CPR positive donors with normal EF
• Obese donors with normal Echo and Angio
• Mild LVH in local donors
• Local older donors
• Young donors turned down for CDC high risk
status

Donor Conference
• Non-threatening, collaborative
• De-identified
• Thorough review of selected cases
• Discussion
• Literature review plan


Consensus
• Discussion leads to consensus
• Voting
• Summarize
• “newsletter”

Review Outcomes
• 2012
– 325 Donor offers
– 78 Transplanted hearts
– 20 Transplanted at the UW
• 2013
– 292 Donor offers
– 66 Transplanted hearts
– 31 Transplanted at the UW
• 2012
– 6% overall utilization
– 26% adjusted utilization
• 2013
– 11% overall utilization
– 47% adjusted utilization

1 2 3 4 5 6 7 8 9 10 11 12
25
27
15
10
22
19
22
29
15
23
29
38
UW Transplant Volumes
One year Survival increased from 80% to 94% over the same period

Jan
Feb
Mar AprMay Ju
n JulAug Se
pOct
Nov Dec
Jan
2014
Feb
2014
Mar 2
014
April
2014
May 2
014
June
201
4
July
201
4
Aug 2
014
Sept
201
4
Oct 2
014
Nov 2
014
Dec 2
014
Jan
2015
Feb
2015
Mar 2
015
0
5
10
15
20
25
30
35
40
45
UW Active Waitlist Vol
Waitlist VolLinear (Waitlist Vol)

Conclusions
• A small conservative program can
significantly change volumes
• Can do this safely
• This is a project about stewardship
• But………..

NEXT
• Increase organ donation rates
• Expand DCD
• Legislate Cortical Brain death
definition