DONATIEN,FINAL SUBMISSION OF RESEARCH PROJECT 5TH YEAR 2011- 2013
59
REPUBLIC OF RWANDA MINISTRY OF EDUCATION HIGHER INSTITUTE OF AGRICULTURE AND ANIMAL HUSBANDRY FACULTY OF AGRICULTURAL ENGINEERING AND ENVIRONMENTAL SCIENCES DEPARTMENT OF SOIL AND WATER MANAGEMENT Prepared by : Donatien HABUMUREMYI For partial fulfilment of the requirement of Bachelor’sdegree (A 0 ) in Soil and Water Management. Supervisor: Jules RUTEBUKA (Msc.) Busogo,June 2013 Assessment of soil carbon storage in different land use managements of Kinoni watershed, Musanze district.
-
Upload
donatien-habumuremyi -
Category
Documents
-
view
32 -
download
6
Transcript of DONATIEN,FINAL SUBMISSION OF RESEARCH PROJECT 5TH YEAR 2011- 2013
REPUBLIC OF RWANDA
MINISTRY OF EDUCATION
HIGHER INSTITUTE OF AGRICULTURE AND ANIMAL HUSBANDRY
FACULTY OF AGRICULTURAL ENGINEERING AND ENVIRONMENTAL
SCIENCES
DEPARTMENT OF SOIL AND WATER MANAGEMENT
Prepared by:
Donatien HABUMUREMYI
For partial fulfilment of the requirement of
Bachelor’sdegree (A0) in Soil and
Water Management.
Supervisor:
Jules RUTEBUKA (Msc.)
Busogo,June 2013
Assessment of soil carbon storage in different land
use managements of Kinoni watershed, Musanze
district.
i
DECLARATION
I declare that, this project work entitled, “assessment of soil carbon storage in different land
use managements of Kinoni Watershed” is an original and has never been submitted to any
university of other institution of higher learning. It is my own research whereby other scholar’s
writings were cited and references provided.
I, thus, declare this work is mine and was completed successfully under the supervision of
Mr.Jules RUTEBUKA.
Jules RUTEBUKA Date………………………..
Donatien HABUMUREMYI Date………………………..

ii
DEDICATION
This research project is dedicated
To:
My beloved parents,
My beloved sisters and brothers, My relatives,
Friends and colleagues.

iii
ACKNOWLEDGEMENT
First of all, I want to thank God Almighty through his Son Jesus Christ and his son’s mother
Saint Mary, he is just a light of my path.
Firstly, I express my gratitude to the government of Rwanda for giving me the opportunity of
sponsorship for reaching this level of studies.
I am deeply grateful to Mrs Laetitia NYINAWAMWIZA; acting rector, for the administrative
helps she made for finishing this study. I feel highly indebted to the staff and lecturers of higher
institute of agriculture and animal husbandry (ISAE), for making available an excellent
environment for pursuing my studies. I acknowledge the Dean of faculty of agricultural
engineering and environmental sciences Prof.M.SANKARANARAYANANfor his valuable way
of academic organization. I offer my sincere gratitude to all staff of soil and water management
for their kind preparation, encouragement and arrangement for reaching this work. My deep
sense of gratitude is addressed to the head of soil and water management Mr.Suresh Kumar
PANDE for sparing his time and useful advices he raised for arriving on this memoir work. A
great thanks is given to my memoir supervisor Mr. Jules RUTEBUKA for his guidance, advice
and corrections, he provided to me. My sincere gratitude goes to soil lab staffs: Kilyobo
MAKELELE, Chantal and Claver for their helpful interventions during laboratory activities. My
thanks are also specifiedto my friend Théoneste NIYIGABA for his valuable help on the field
during soil sampling. The five years stay in ISAE would have been a great challenge without
good friends I got here from different parts of the country especially my colleagues from soil and
water management department. I warmly express many thanks to all of you. I would like to
express my deeper gratitude to my parents Déogratias RWEMERA and Dancila MITEKE for
taking care and shaping life since my shildhood. I express my gratitude to my beloved sister
Constance NTEZIMANA for her care, support and advices she gave to me after my parent’s
death in order to reachthis academic level.
Finally, I also express gratitude to my brothers, sisters and other family members for their
encouragement and moral as well as physical support.
Busogo, June 2013.
Donatien HABUMUREMYI

iv
TABLE OF CONTENTS
DECLARATION .................................................................................................................... i
DEDICATION ....................................................................................................................... ii
ACKNOWLEDGEMENT ..................................................................................................... iii
TABLE OF CONTENTS ...................................................................................................... iv
LIST OF FIGURES .............................................................................................................. vii
LIST OF TABLES .............................................................................................................. viii
LIST OF APPENDICES ....................................................................................................... ix
LIST OF ABBREVIATIONS ..................................................................................................x
ABSTRACT.......................................................................................................................... xi
CHAPTER 1 INTRODUCTION .............................................................................................1
1.1 Background Information ....................................................................................................1
1.2 Problem Statement ............................................................................................................3
1.3 Objectives of the study ......................................................................................................3
1.3.1 General objective ............................................................................................................3
1.3.2 Specific objectives ..........................................................................................................3
1.3.3 Hypotheses of the study ..................................................................................................4
CHAPTER 2 LITERATURE REVIEW ...................................................................................5
2.1 Concept of carbon capture and storage ...............................................................................5
2.2 Carbon sequestration and sinks ..........................................................................................5
2.2.1 Terrestrial .......................................................................................................................6
2.2.2 Geologic .........................................................................................................................6
2.2.3 Ocean .............................................................................................................................6
2.3 The Global Carbon Cycle ..................................................................................................7
2.4 Fundamentals of soil organic carbon ..................................................................................8
2.5 Soil Carbon and Climate Change ..................................................................................... 10
2.6 Soils and carbon storage .................................................................................................. 11
2.7 Land use types and carbon storage ................................................................................... 12
2.7.1 Forest ecosystems ......................................................................................................... 12
2.7.2 Arable lands ................................................................................................................. 13
2.7.3 Fallowed Lands ............................................................................................................ 15

v
2.8 Rwandan Topsoil organic carbon stocks .......................................................................... 16
CHAPTER 3 MATERIALS AND METHODS...................................................................... 19
3.1 Study area description ..................................................................................................... 19
3.3 Soil sampling ................................................................................................................... 20
3.4 Laboratory soil sample analysis ....................................................................................... 21
3.4.1 Soil chemical analysis................................................................................................... 21
3.4.1.1 Soil pH water. ............................................................................................................ 21
3.4.1.2 Determination of organic carbon ................................................................................ 22
3.4.1.3 Determination of total Nitrogen by Kjeldahl Method ................................................. 22
3.4.1.4 Cation Exchange Capacity (CEC) determination by Kjeldahl Method. ....................... 22
3.4.1.5 Potassium by atomic absorption spectrophotometry method. ...................................... 22
3.4.1.6 Calcium and magnesium determination...................................................................... 23
3.4.1.7 Soil available phosphorous determination. ................................................................. 23
3.4.2 Soil Physical Analysis .................................................................................................. 23
3.4.2.1 Textural analysis of soil sample ................................................................................. 23
3.5 Data analysis ................................................................................................................... 24
CHAPTER 4 PRESENTATION OF RESULTS AND DISCUSSIONS ................................. 25
4.1 Presentation of results ...................................................................................................... 25
4.1.1 Results of analyzed soil parameters of Kinoni watershed. ............................................. 25
4.1.2 Soil characterization of Kinoni watershed ..................................................................... 25
4.1.2.1 pH in different land use types of Kinoni Watershed ................................................... 25
4.1.2.2 OC content in different land uses types of Kinoni Watershed ..................................... 26
4.1.2.3 Total Nitrogen in different land uses types of Kinoni Watershed ................................ 26
4.1.2.4 C/N ratio in different land use types of Kinoni Watershed.......................................... 26
4.1.2.5 CEC in different land uses types of Kinoni Watershed ............................................... 27
4.1.2.6 Soil texture in different land uses types of Kinoniwatershed ...................................... 27
4.1.2.7Available P in different land use types of Kinoni watershed ........................................ 27
4.1.2.8 Exchangeable basic cations in different land uses types of Kinoni Watershed ............ 27
4.1.3 The linear correlation of soil properties and soil organic carbon storage ........................ 28
4.1.3.1 Relatissssonship of soil pH and soil organic carbon storage ....................................... 28
4.1.3.2 Relationship of C/N ratio and soil organic carbon storage .......................................... 29

vi
4.1.3.3 Relationship of CEC and soil organic carbon storage ................................................. 29
4.2 Discussions of results ...................................................................................................... 30
4.2.1 Land use types and carbon storage in Kinoni watershed ................................................ 30
4.2.2 Effect of soil properties on carbon storage of three land uses ........................................ 31
CHAPTER 5 CONCLUSION AND RECOMMENDATIONS .............................................. 33
5.1 Conclusion ...................................................................................................................... 33
5.2 Recommendations ........................................................................................................... 34
REFERENCES ..................................................................................................................... 35
APPENDICES ...................................................................................................................... 39

vii
LIST OF FIGURES
Figure 1. Illustration of global carbon cycle.................................................................................7
Figure 2. Carbon balance within the soil (brown box) is controlled by carbon inputs from
photosynthesis and carbon losses by respiration. .........................................................................9
Figure 3.Soil carbon balance ……………………. .................................................................... 11
Figure 4.Estimated annual total carbon stocks (t C ha-1) in tropical and temperate forests ......... 12
Figure 5. Soil sampling at Kinoni .............................................................................................. 21
Figure 6: Relationship of soil pH and soil organic carbon storage .............................................. 28
Figure 7: Relationship of C/N ratio and soil organic carbon storage .......................................... 29
Figure 8 : Relationship of CEC and soil organic carbon storage................................................. 30

viii
LIST OF TABLES
Table 1.Total stocks of soil organic carbon (SOC) (Pg C) and mean C content (kg Cm-2
) by
major Agro-Ecological Zone (for upper 0.3 m and 1m) ............................................................. 14
Table 2.Topsoil (0-30 cm) organic carbon stocks (Mg/ha) of Rwanda stratified according to the
major soil reference groups and land use types. ......................................................................... 18
Table 3. Results of analyzed soil parameters of Kinoni watershed. ............................................ 25
ix
LIST OF APPENDICES
Appendix 1.Soil parameters for different land use types in Kinoni watershed ............................ 39
Appendix 2.Statistical Analysis Tables Using SPSS One WAY ANOVA .................................. 39
Appendix 3. Soil texture triangle. .............................................................................................. 42
Appendix 4. Five major pH classes for specific agronomic significance. ................................... 43
Appendix 5. Soil nutrient interpretation norms .......................................................................... 45

x
LIST OF ABBREVIATIONS
µg/ml: :Microgramm per milli litter
AGC and BGC :Above and Below Ground Carbon
AGD and BGD :Above and Below Ground Debris
AGNPP and BGNPP :Above and Below Ground Net Primary Production;
C :Carbon
C/N or C: N :Carbon Nitrogen Ratio
CCS :Carbon capture and storage
CL :Cultivated Land
CO : Carbone Organique
CS :Carbon Storage
FL :Forest Land
GHG(s) :Green House Gase(s)
HWSD : Harmonized World Soil Database
IPCC : Intergovernmental Panel on Climate Change
LF-OC : Light FractionOrganic Carbon
Mg C ha-1 yr-1 :Megagramm Carbon per Hectare per Year
NPP : Net Primary Productivity
OCS : Organic Carbon Storage
OM : Organic Matter
Pav : Available Phosphorus
Pg : Petagramm
REMA : Rwanda Environment Management Authority
SOC : Soil Organic Carbon
TN : Total Nitrogen
UL : Uncultivated (Fallow) land
UNFCCC : United Nations Framework Convention on Climate Change
USEPA : United states Environmental Protection Agency

xi
ABSTRACT
As the region located in highly elevated mountains areas with different land use types,
Kinoniwatershed may contributes to the C stocks and to the CO2 reduction from atmosphere
climate change stabilizations. Studies were mainly focused on the information related to other
types of C storage perhaps for fertility aspect, and probably no available studies focused on soil
carbon stock in the Kinoni watershed with an aspect of carbon sequestration. The aim of this
study was to assess the soil carbon storage in fallow, cultivated and eucalyptus forest land use
types of Kinoni watershed. Disturbed composite samples were taken in each land use type at a
depth of 30 cm.
The results showed that the soil C storage exhibited significant differences between the three
land use managements of Kinoni watershed. The C content(5.46±0.08%) were higher in the
arable land than Eucalyptus forestland(4.69±0.00 %) due to the application of organic manure,
inorganic fertilizers promoting biomass production and the contained higher clay content. The
C stock decreased sharply in uncultivatedland (2.60±0.53%) mostly because of the erosion factor
while a decrease of C storage in the eucalyptus forest linked to its lower pH, lignin and
polyphenols content delaying decomposition rate. The soil properties have shown more change
in the soil C stock in the watershed as the pH water (6.27±0.25), CEC (46.57±4.72 meq/100g),
TN (0.31%) where they were increased along with the higher OC for arable land. On the other
hand,the decrease in C storage corresponding to the decline of soil properties concentration in
eucalyptus forest land with (4.74±0.19)of pH, (18.65±2.25) of CEC and (0.30±0.04) of TN
whereas the uncultivated land values were (6.15±0.22) of pH, (20.5±0.1) of CEC and
(0.09±0.02) of TN. C/N ratio of forest land was higher compared to arable land and uncultivated
land with (28.21±7.0),(17.86±1.89) and (15.93±2.40) respectively.Moreover, from the results; C
storage showed to contribute to the land fertility increasewhereby the arable land released the
soil nutrients respectively as (5.8±0.00) of Mg, (13.97±0.67) of Ca (0.34±0.02) of K and
(45.5±3.5) of Pav more than the eucalyptus forest land with (0.2±0.00) of Mg, (0.93±0.06) of
Ca (0.09±0.01) of K and (16.33±4.04) of Pav and the uncultivated land with ( 1.77±1.27) of
Mg, (6.43±0.35) of Ca (0.20±0.01) of K and (25.67±10.69) of Pav .Altogether, the results from
this work have shown the C storages are in line with the land use management types where the
cultivated land was high, followed by eucalyptus forest land and lastly by the uncultivated land
in C stock and soil properties like C/N ratio, pH and CEC.
xii
RESUME
Alors que la région située dans les zones de montagnes très élevées avec différents types
d'utilisation des terres, le bassin versant de Kinoni peut contribuerau stockage de carbone et à la
réduction du CO2 atmosphèrique et aux stabilisations des changements climatiques. Des études
ont été principalement axées sur les informations relatives aux autres types de stockage du C en
dehors et rares dans le pays, et probablement pas d'études ont porté sur les stocks de carbone du
sol dans le bassin versant de Kinoni. Le but de cette étude était d'évaluer le stockage du carbone
du sol dans les types d'utilisation des terres en jachère, cultivées et d'eucalyptus forestières du
bassin versant de Kinoni. A échantillons composites perturbés ont été prises dans chaque type
d'utilisation du sol à une profondeur de 30 cm.
Les résultats ont montré que le stockage de carbone dans le sol présentait des différences
significatives entre les trois directions de l'utilisation des terres du bassin versant de Kinoni. La
teneur en C (5,46 ± 0,08%) était plus élevée dans les terres arables que de terres forestières
d'eucalyptus (4,69 ± 0,00%) en raison de l'application de la fumure organique, engrais minéraux
favorisant la production de biomasse et la teneur en argile plus contenue.
Le stock du C a fortement diminué dans les terres incultes (2,60 ± 0,53%) principalement en
raison du facteur d'érosion, tandis qu'une diminution de stockage en C dans la forêt d'eucalyptus
a été liée à son pH inférieur, la lignine et la teneur en polyphénols retarder la vitesse de
décomposition. Les propriétés du sol ont montré plus de changement dans le stock de C du sol
dans le bassin versant comme le pH en eau (6,27±0.25), CEC (46,57 ± 4,72 meq/100g), N
(0,31%), où ils ont été augmentés avec le CO plus élevé pour les terres arables . D'autre part, la
diminution du stockage en C correspondant à la diminution de la concentration des propriétés des
sols dans les terres de forêt d'eucalyptus à (4,74 ± 0,19) de pH, (18,65 ± 2,25) de la CEC et (0,30
± 0,04) de N que les terres incultes les valeurs étaient (6,15 ± 0,22) du pH, (20,5 ± 0,1) de la
CEC et (0,09 ± 0,02) de N. Le Rapport C / N de terres forestières a augmenté par rapport aux
terres arables et de terres incultes avec (28,21 ± 7,0), (17,86 ± 1,89) et (15,93 ± 2,40)
respectivement. En outre, d'après les résultats, le stockage du C a montré à contribuer à
l'augmentation de la fertilité des sols par laquelle les terres arables a publié les éléments nutritifs
du sol respectivement (5,8 ± 0,00) de Mg, (13,97 ± 0,67) de Ca, (0,34 ± 0,02) de K et ( 45,5 ±
3,5) du P disponible plus que ceux de la terre de forêt d'eucalyptus à (0,2 ± 0,00) de Mg, (0,93 ±
0,06) de Ca,(0,09 ± 0,01) de K et (16.33 ± 4.04) du P disponoble et les terres non cultivées avec
(1.77 ± 1,27) de Mg, (6,43 ± 0,35) de Ca (0,20 ± 0,01) et de K (25,67 ± 10,69) de Pav.Au total,
les résultats de ce travail ont montré que le stockage du C sont en ligne avec les types de gestion
de l'utilisation des terres où les terres cultivées était élevé, suivie par terre forêt d'eucalyptus et
enfin par la terre inculte en stock du C et les proprietes du sol comme pH,C/N et le CEC.
1
CHAPTER 1
INTRODUCTION
1.1 Background Information
Carbon-based molecules are crucial for life on earth, because it’s the main component of
biological compounds; it is also a major component of many minerals. It also exists in
variousforms in the atmosphere. Carbon dioxide (CO2) is partly responsible for the greenhouse
effect, it is the most important human contribute greenhouse gases
(http://en.wikipedia.org/wiki/Carbon_cycle/29/03/2013).
The concentration of carbon dioxide (CO2) in the atmosphere increased from 285 ppm at the end
of the 19th
century, before the industrial revolution, to about 366 ppm in 1998 (equivalent to a
28-percent increase) as a consequence of anthropogenic emissions of about 405 gigatonnes of
carbon (C) (± 60 gigatonnes C) into the atmosphere resulted from fossil-fuel combustion and
cement production (67 percent) and land-use change (33 percent). Land-use change and soil
degradation are major processes for the release of CO2 to the atmosphere. The increase in
greenhouse gases (GHGs) in the atmosphere is now recognized to contribute to climate change
(FAO, 2004).
Nabuurs et al. (2007).indicated that forests is considered as carbon sinks globally and store large
amounts of carbon sequestered from the atmosphere and retained in living and dead biomass and
soil. The estimated amount of carbon dioxide (CO2) in the atmosphere is equivalent to 810 Pg C,
but 500 and 1500 Pg C are stored in terrestrial biomass and soil, respectively, of which 60% is
stored in forest systems.
Adoption of the Kyoto Protocol in late 1997 encouraged individual countries to increase the rates
of carbon uptake and storage in forest biomass. Intergovernmental Panel on Climate Change
estimates of the global mitigation potential from forests are substantial, up to 3.8 PgC year-1
by
2030, but dependent on financial incentives for forest establishment (Nabuurs et al., 2007)
Tropical areas currently are threatened by deforestation where forests are transformed to an
agriculture land use. However, tropical forests comprise a large proportion of global terrestrial
carbon (C) storage and appear to play a critical role in buffering the atmosphere against the
increase of carbon dioxide (CO2) (Chave et al., 2008; Lewis et al., 2009) through C

2
sequestration. Tropical areas contribute to about 40% of the world’s forest biomass (Phillips et
al., 1998 and FAO, 2001) while Grace and Meir (2009) stated that tropical rainforests contribute
55% of the biomass of the terrestrial surface.
In the African tropics, Glenday (2006) found values of OCS up to 100 t ha-1 in Kenyan
ecosystem forests whether in the subtropical forests (Dupouey et al., 1999, IPCC, 2000,
Montagnini& Jordan 2002, Moretto et al., 2005) showed that OCS values have been reported to
be significantly lower, below 70 t ha-1(Enrique Peña et al.,2011).
Approximately 50% of the soil organic carbon (soil organic matter) has been lost from the soil
over a period of 50 to 100 years of cultivation. However, this loss of soil carbon also represents
the potential for storage of C in agricultural soils while in 1993, Kern and Johnson have reported
field studies with approximately 30% increases in soil C due to no-tillage when compared with
Conventional tillage (Charles W. Rice,www.oznet.ksu.edu/pr_sme/). Fallow significantly
increases the rate of soil organic carbon decomposition and results from Rothamsted (Jenkinson
and Rayner, 1977; Jenkinson, 1990) indicated that during fallow the rate is approximately 2 to
2.5 times faster than in a crop year and the fallow treatment often results in significantly more
soil organic carbon loss than continuously cropped treatment (Feng and Li, 2001).
Rwanda’sterrestrial carbon stocks total about 130 Mt, comprised of 67 Mt of carbon in above-
and below-ground biomass and about 63 Mt in soils to 1 m depth(UNEP-WCMC,2010).
Nsabimana (2009) showed that the mean annual CO2 efflux in the soil of Nyungwe forest was
10.2 Mg C ha-1 yr-1, which is lower than in the Ruhande arboretum forest plantation (13.5 Mg C
ha-1 yr-1) and the factors that influenced the C fluxes were precipitation patterns, soil water
content, air and soil temperature.
Countries are actively discussing and negotiating ways to deal with the climate change problem,
within the UNFCCC where the first task is to address the root cause by reducing greenhouse gas
emissions from human activity. The Government of Rwanda (GoR) has undertaken a number of
measures to address climate change, beginning with ratification of the United Nations
Framework Convention on Climate Change (UNFCCC) in 1992,developing a National
Adaptation Action Plan (NAPA) in 2000, and climate change and low carbon growth strategies
in 2010(REMA,2011).
3
Up to now there was no study related to carbon storage in the volcanic region of Rwanda about
carbon storage in the climate change mitigation context.
1.2 Problem Statement
There is global consensus that the world is becoming a warmer place, which is, evidenced by
increases in average air and ocean temperatures, widespread melting of snow and the rising
average sea level, rising precipitations with attendant storms and floods, and droughts in some
regions (Dowuona and Adjetey,2010). Thus, different domains including that of agriculture are
negatively affected because of different changes in soil such as soil structure and nutrients to
feed crops. This phenomenon is due largely to increasing atmospheric CO2 concentrations and
other greenhouse gases, as a result of fossil-fuel combustion,bad management of land and
deforestation. Rwanda were gradually fluctuated in these last days as the forests, which are the
main sequester, have been reduced by the high population growth observed in these days. For
finding a potential approach to mitigate rising CO2 concentrations such as improved storage or
sequestration of carbon in terrestrial ecosystems, have become the reason of choosing the
objective of this study on assessment of soil carbon storage in different land use managements of
Kinoni watershed.
1.3 Objectives of the study
1.3.1 General objective
The overall objective of this study was to assessthe soil carbon storage in different land
use managements of Kinoni Watershed located in Musanze district.
1.3.2 Specific objectives
For achieving the above general objective of this study, the following specific objectives
were formulated:
To assess the effect of land use type on SOC storage
To find out how the soil properties can affect the SOC change in the watershed

4
1.3.3 Hypotheses of the study
The following hypotheses were chosen:
Arable land stores lower SOC than other land use type.
Soil pH, C/N ratio and CEC affect the SOC storage.
5
CHAPTER 2
LITERATURE REVIEW
2.1 Concept of carbon capture and storage
Carbon capture and storage (CCS) (or carbon capture and sequestration), is the process of
capturing waste carbon dioxide (CO2) from large point sources, such as fossil fuel power plants,
transporting it to a storage site, and depositing it where it will not enter the atmosphere, normally
an undergroundgeological formation(http://en.wikipedia.org/wiki/Carbon_capture_and_storage).
It is the long-term isolation of carbon dioxide from the atmosphere through physical, chemical,
biological, or other engineered processes. This includes a range of approaches including soil-
carbon sequestration (e.g., through no-till farming), terrestrial-biomass sequestration (e.g.,
through planting forests), direct injection of CO2 onto the deep seafloor or into the intermediate
depths of the ocean, injection into deep geological formations, and even direct conversion of CO2
to carbonate minerals. All of these processes are considered in the 2005 special report by the
IPCC (http://www.answers.com/topic/carbon-capture-and-storage).
Carbon sequestration is again defined as the capture and secure storage of carbon that would
otherwise be emitted to or remain in the atmosphere (Pretty and Ball, 2001).
CCS is an integrated concept consisting of three distinct components named as CO2 capture,
transport and storage (including measurement, monitoring and verification). All three
components are currently found in industrial operation today, although mostly not for the
purpose of CO2 storage (http://www.sourcewatch.org/index.php/Carbon_Capture_and_Storage).
2.2 Carbon sequestration and sinks
Many ecosystems have natural mitigation processes, such as carbon sequestration and storage.
Appropriate management of carbon sinks is necessary to maintain this ecosystem service (Earth
watch Institute (Europe), section 5). Sequestration encompasses all forms of carbon storage.
Oceans, plants and underground geologic formations all function as significant reservoirs for
CO2. They all exchange CO2with the atmosphere. These reservoirs will act as carbon sinks if
more carbon is flowing into them (or stored in them) than flows out of them(USEPA, 2012) but
the main ones being soil, oceans and forests that store carbon dioxide in water, sediment, wood,
roots, leaves and the soil(Earth watch Institute (Europe), section 5)
6
Soils contain more carbon than is contained in vegetation and the atmosphere combined, but
soils’ organic carbon (humus) levels in many agricultural areas have been severely depleted
while the forest suffering high rates of destruction around the world, with about 35% lost
already, and will be one of the first ecosystems to be affected by sea level rises(Earth watch
Institute (Europe), section 5).
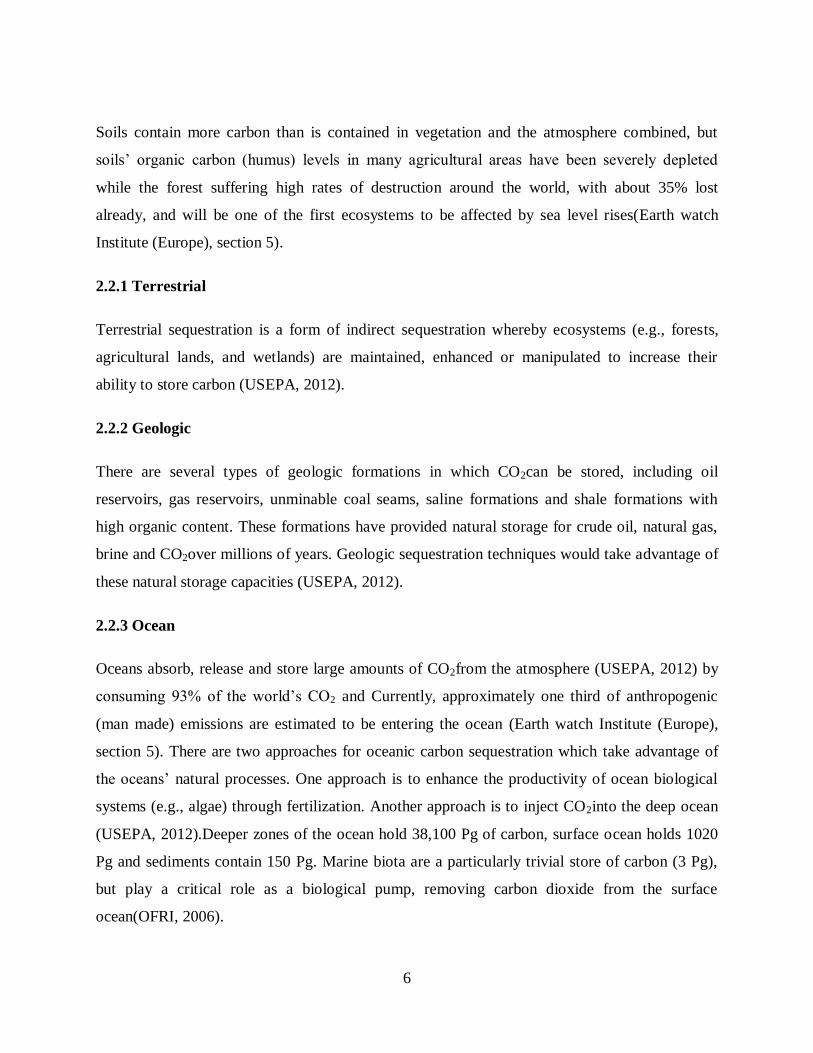
2.2.1 Terrestrial
Terrestrial sequestration is a form of indirect sequestration whereby ecosystems (e.g., forests,
agricultural lands, and wetlands) are maintained, enhanced or manipulated to increase their
ability to store carbon (USEPA, 2012).
2.2.2 Geologic
There are several types of geologic formations in which CO2can be stored, including oil
reservoirs, gas reservoirs, unminable coal seams, saline formations and shale formations with
high organic content. These formations have provided natural storage for crude oil, natural gas,
brine and CO2over millions of years. Geologic sequestration techniques would take advantage of
these natural storage capacities (USEPA, 2012).
2.2.3 Ocean
Oceans absorb, release and store large amounts of CO2from the atmosphere (USEPA, 2012) by
consuming 93% of the world’s CO2 and Currently, approximately one third of anthropogenic
(man made) emissions are estimated to be entering the ocean (Earth watch Institute (Europe),
section 5). There are two approaches for oceanic carbon sequestration which take advantage of
the oceans’ natural processes. One approach is to enhance the productivity of ocean biological
systems (e.g., algae) through fertilization. Another approach is to inject CO2into the deep ocean
(USEPA, 2012).Deeper zones of the ocean hold 38,100 Pg of carbon, surface ocean holds 1020
Pg and sediments contain 150 Pg. Marine biota are a particularly trivial store of carbon (3 Pg),
but play a critical role as a biological pump, removing carbon dioxide from the surface
ocean(OFRI, 2006).

7
2.3 The Global Carbon Cycle
The global carbon cycle describes the Earth’s four carbon reservoirs and the exchanges (or
flows) of carbon between these reservoirs. These flows are accomplished by various chemical,
physical, geological and biological processes. The four reservoirs are the atmosphere, terrestrial
biosphere (including freshwater systems) oceans and sediments (including fossil fuels). Figure
1illustrates the global carbon cycle. The large arrows represent natural flows of carbon. The
small arrows represent anthropogenic contributions to the carbon cycle. The numbers not in
arrows represent carbon sinks.
The flow of carbon is measured in billions of metric tons (gigatons). Annually, plants giveabout
60 billion metric tons of CO2 to the atmosphere through respiration andtake 61 billion metric
tons of CO2 that is turned into new plant biomass through photosynthesis. These carbon sinks
are immense. The atmosphere contains about 750 gigatons of CO2, the ground contains about
2,190 gigatons of CO2 and the oceans contain about 40,000 gigatons of CO2. (USEPA, 2012).
Figure 1. Illustration of global carbon cycle
(USEPA, 2012)

8
2.4 Fundamentals of soil organic carbon
Soil organic matter is composed of soil microbes including bacteria and fungi, decaying material
from once-living organisms such as plant and animal tissues, fecal material, and products formed
from their decomposition.
SOM is a heterogeneous mixture of materials that range in stage of decomposition from fresh
plant residues to highly decomposed material known as humus. SOM is made of organic
compound that are highly enriched in carbon. Soil organic carbon (SOC) levels are directly
related to the amount of organic matter contained in soil.
SOC levels result from the interactions of several ecosystem processes, of which photosynthesis,
respiration, and decomposition are the keys.
Photosynthesis is the fixation of atmospheric CO2 into plant biomass. SOC input rates
are primarily determined by the root biomass of a plant, but also include litter deposited
from plant shoots.
Decomposition of biomass by soil microbes results in carbon loss as CO2 from the soil
due to microbial respiration, while a small proportion of the original carbon is retained in
the soil through the formation of humus, a product that often gives carbon-rich soils their
characteristic dark color (Fig 2).Soil C results both directly from growth and death of
plant roots, as well as indirectly from the transfer of carbon-enriched compounds from
roots to soil microbes. For example, many plants form symbiotic associations between
their roots and specialized fungi in the soil known as mycorrhizae; the roots provide the
fungi energy in the form of carbon while the fungi provide the plant with often-limiting
nutrients such as phosphorus.
Various forms of SOC differ in their recalcitrance, or resistance to decomposition.
Humus is highly recalcitrant, and this resistance to decomposition leads to a long
residence time in soil. Plant debris is less recalcitrant, resulting in a much shorter
residence time in soil. Other ecosystem processes that can lead to carbon loss include soil
erosion and leaching of dissolved carbon into groundwater. When carbon inputs and
outputs are in balance with one another, there is no net change in SOC levels. When

9
carbon inputs from photosynthesis exceed C losses, SOC levels increase over time(Todd
&Schulte,2012).
Figure 2. Carbon balance within the soil (brown box) is controlled by carbon inputs from
photosynthesis and carbon losses by respiration.
Decomposition of roots and root products by soil fauna and microbes produces humus, a long-
lived store of SOC.
Photosynthesis, decomposition, and respiration rates are determined partly by climatic factors,
most importantly soil temperature and moisture levels. For example, in the cold wet climates of
the northern latitudes, rates of photosynthesis exceed decomposition resulting in high levels of
SOC. Arid regions have low levels of SOC mostly due to low primary production, while the
tropics often have intermediate SOC levels due to high rates of both primary productivity and
decomposition from warm temperatures and abundant rainfall (Todd &Schulte, 2012).
Temperate ecosystems can have high primary productivity during summer when temperature and
moisture levels are highest, with cool temperatures during the rest of the year slowing
decomposition rates such that organic matter slowly builds up over time. While climatic
conditions largely generate global patterns of soil carbon, other factors that vary on smaller
spatial scales interact with climate to determine SOC levels. For example, soil texture the
relative proportions of sand, silt, and clay particles that make up a particular soil or the
10
mineralogy of those soil particles can have a significant impact on soil carbon stocks.
Additionally, the processes of erosion and deposition act to redistribute soil carbon according to
the topography of the landscape, with low-lying areas such as floodplains often having increased
SOC relative to upslope positions (Todd &Schulte, 2012).
2.5 Soil Carbon and Climate Change
There is a growing body of evidence supporting the hypothesis that the earth's climate is rapidly
changing in response to continued inputs of CO2 and other greenhouse gases (GHGs) to the
atmosphere resulting from human activities (IPCC, 2007) and CO2 has the largest effect on
global climate as a result of enormous increases from the preindustrial era to today. Atmospheric
CO2 concentrations have risen from approximately 280 parts per million (ppm) prior to 1850, to
381.2 ppm in 2006 (WMO, 2006), with a current annual increase of 0.88 ppm (3.5 GT C/yr)
(IPCC 2007).
Approximately two-thirds of the total increase in atmospheric CO2 is a result of the burning of
fossil fuels, with the remainder coming from SOC loss due to land use change (Lal, 2004)and the
carbon released to the atmosphere through deforestation. The decomposition of SOM due to the
activity of the microbial decomposer community in the absence of continual rates of carbon input
from the growth of forest vegetation, as well as increased soil temperatures that result from
warming of the ground once the forest canopy has been removed. Although this soil carbon loss
has contributed to increased CO2 levels in the atmosphere, it also is an opportunity to store some
of this carbon in soil from reforestation.Current estimates are that carbon inputs from
photosynthesis by terrestrial vegetation fixes more carbon than carbon loss through soil
respiration, resulting in a soil storage rate of about 3 GT C/yr (Cullen & Boyd, 2008).
The goal of increased storage of carbon in soil has received much wider acceptance due to a
better understanding of the processes involved in SOC storage, more direct control of these
processes through human activities, and the other known ecosystem benefits to be obtained by
increasing SOC, including benefits to water quality and increased food security (Todd &Schulte
2012).
11
2.6 Soils and carbon storage
Soils are the largest carbon reservoir of the terrestrial carbon cycle. The quantity of C stored in
soils is highly significant; soils contain about three times more C than vegetation and twice as
much as that which is present in the atmosphere (Batjes and Sombroek, 1997). Soils contain
much more C (1 500 Pg of C to 1 m depth and 2 500 Pg of C to 2 m; 1 Pg = 1 gigatonne) than is
contained in vegetation (650 Pg of C) and twice as much C as the atmosphere (750 Pg of C)
(FAO, 2004).
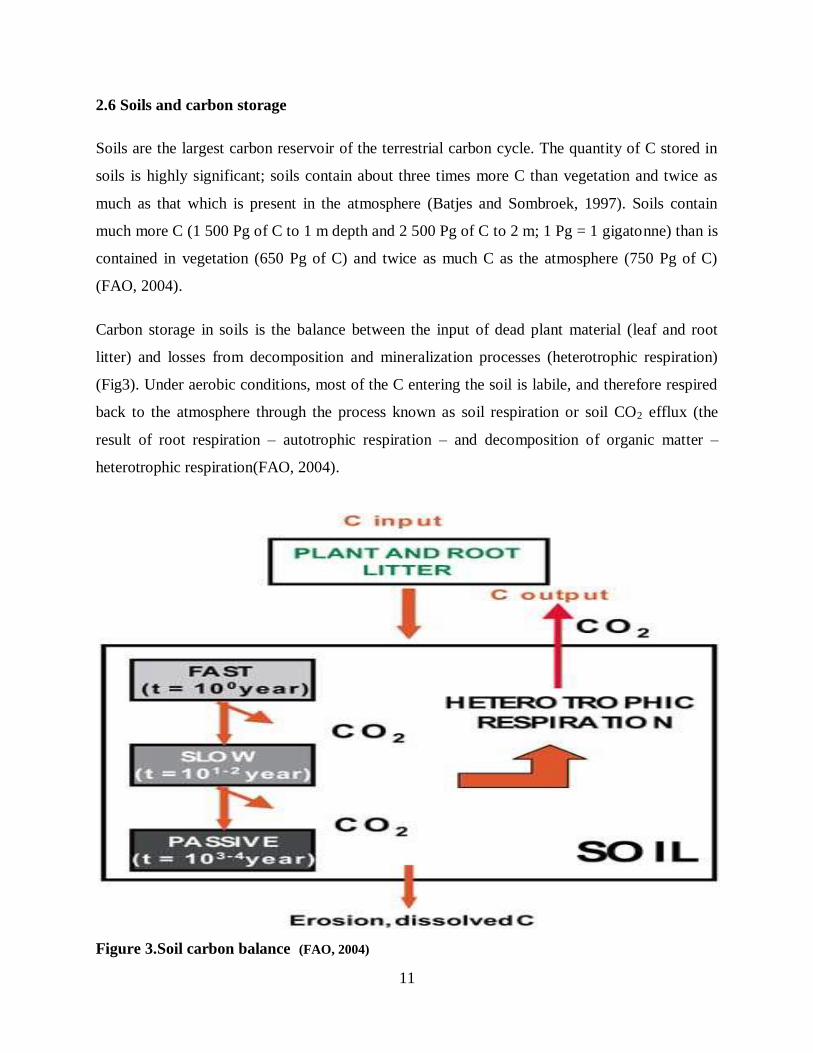
Carbon storage in soils is the balance between the input of dead plant material (leaf and root
litter) and losses from decomposition and mineralization processes (heterotrophic respiration)
(Fig3). Under aerobic conditions, most of the C entering the soil is labile, and therefore respired
back to the atmosphere through the process known as soil respiration or soil CO2 efflux (the
result of root respiration – autotrophic respiration – and decomposition of organic matter –
heterotrophic respiration(FAO, 2004).
Figure 3.Soil carbon balance (FAO, 2004)

12
2.7 Land use types and carbon storage
2.7.1 Forest ecosystems
Forests cover 29 percent of terrestrial lands and account for 60 percent of carbon in terrestrial
vegetation and Carbon stored in forest soils represents 36 percent of the total C soil pool to 1 m
depth (1 500 Pg) (FAO, 2001).
Recently, a complete C balance of French forests was undertaken by Dupoueyet al., 1999
covering 540 plots from the European forest monitoring network where the total mean carbon of
the ecosystem was 137 t C ha-1; of this total, soil represents 51 % (71 t), litter 6 %, roots 6 %
and were very close to those of Tennessee given by the IPCC 2000 while thedatafor tropical
rainforest near Manaos; the total C in thesystem is higher (447 t ha-1) and so isthe soil organic
stock (162 t, 36 % of the total) (Fig 4).
Figure 4.Estimated annual total carbon stocks (t C ha-1) in tropical and temperate
forests(from IPCC, 2000)

13
AGC and BGC = above and below ground carbon; AGD and BGD = above and below ground
debris; AGNPP and BGNPP = above and below ground net primary production; SOC = soil
organic carbon *not given in original
Forest ecosystems contain more carbon per unit area than any other land use type, and their soils
which contain around 40 percent of the total carbon - are of major importance when considering
forest management.
Normally, soil carbon is in steady-state equilibrium in natural forest, but as soon as deforestation
(or afforestation) occurs, the equilibrium will be affected. It is estimated that 15 to 17 million
ha/year are being deforested, mainly in the tropics (FAO, 1993) and very often part of the soil
organic C is lost, giving rise to considerable CO2 emission. Therefore, where deforestation
cannot be stopped, proper management is necessary to minimise carbon losses. Afforestation,
particularly on degraded soils with low organic matter contents, will be an important way of
long-term carbon sequestration both in biomass and in the soil (FAO, 2001).
The process of soil CS or flux of C into the soil forms part of the global carbon balance. Many of
the factors affecting the flow of C into and out of soils are affected by land-management
practices. Therefore, management practices should focus on increasing the inputs and reducing
the outputs of C in soils (FAO, 2004).
Various land-uses result in very rapid declines in soil organic matter (Jenny ,1941; Davidson and
Ackerman 1993). Much of this loss in soil organic carbon can be attributed to reduced inputs of
organic matter, increased decomposability of crop residues, and tillage effects that decrease the
amount of physical protection to decomposition (Post and Kwon, 1999).
2.7.2 Arable lands
The development of agriculture has involved a large loss of soil organic matter. There are
various ways in which different land management practices can be used to increase soil organic
matter content such as increasing the productivity and biomass (varieties, fertilization and
irrigation).Sources of OM also include organic residues, composts and cover crops((FAO, 2004).
When natural vegetation is converted to cultivated crops, rapid declines in soil organic matter are
partly due to a lower fraction of non-soluble material in the more readily decomposed crop

14
residues. Tillage, in addition to mixing and stirring of soil, breaks up aggregates and exposes
organo-mineral surfaces otherwise inaccessible to decomposers. This results in a reduction in the
amounts of intra-aggregate LF-OC and some organomineral SOC. Losses of SOC of as much as
50% in surface soils (20 cm) have been observed after cultivation for 30 to 50 years. Reductions
average around 30% of the original amount in the top 100 cm. The large and relatively rapid
changes in SOC with cultivation indicates that there is considerable potential to enhance the rate
of carbon sequestration in soil with management activities that reverse the effects of cultivation
on SOC pools (Post and Kwon, 1999).
The main ways to achieve an increase in organic matter in the soil are through conservation
agriculture, involving minimum or zero tillage and a largely continuous protective cover of
living or dead vegetal material on the soil surface (FAO, 2004).
Table 1.Total stocks of soil organic carbon (SOC) (Pg C) and mean C content (kg Cm-2
) by
major Agro-Ecological Zone (for upper 0.3 m and 1m)
Agro-ecological zone
Spatially weighted SOC pools
(Pg C )
Mean SOC density(kg/m-
2)
to 0.3 m depth| to 1 m depth
to 0.3 m depth| to 1 m.
Depth
Tropics, warm humid
92 - 95 176
- 182
5.2 - 5.4 10.0 -
10.4
Tropics, warm seasonally dry 63 - 67 122 – 128 3.6 - 3.8 7.0 - 7.3
Tropics, cool 29 - 31 56 - 59 4.4 - 4.7 8.4 - 8.9
Arid 49 - 55 91 - 100 2.0 - 2.2 3.7 - 4.1
Subtropics with summer rains 33 - 36 64 - 68 4.5 - 4.7 8.6 - 9.1
Subtropics with winter rains 18 - 20 37 - 41 3.6 - 3.9 7.2 - 8.0
Temperate oceanic 20 - 22 40 - 44 5.8 - 6.4 11.7 - 12.9
Temperate continental 21 - 126 1233 - 243 5.6 - 5.9 10.8 - 11.3
Boreal 203 - 210 478 – 435 9.8 - 10.2 23.1 - 24
Polar and Alpine (excl. land ice) 57 - 63 167 - 188 7.0 - 7.8 20.6 - 23.8
Source: Batjes, 1999

15
Batjes (1999) also discussed the total soil C stock distribution by major ecological zones. Such
zones show large differences in organic carbon storage (Table 1), mainly in relation to
temperature and rainfall. Soil C stocks down to 1 m depth range from about 4 kg m-2
(in the arid
zone) to 21-24 kg m-2
(in polar or boreal regions); with intermediate values of 8 to 10 kg m-2
in
tropical zones. The contribution of the tropical regions to the global pool of soil carbon is 384-
403 Pg C to 1 m and 616-640 Pg C to 2m depth (Batjes, 1996), compared to about 1 500 Pg C to
1 m for the world (2 736-2 456 Pg to 2 m depth).The arid zone, which covers 40 percent of the
global land surface, stocks only 5 percent (100 Pg) of the total. These agro-ecological zones,
developed by FAO, can constitute a referenceframework to evaluate and monitor soil C storage
in soils.
The Intergovernmental Panel on Climate Change (IPCC, 2000) quotes figures showing that
conservation tillage alone could store more than a ton of carbon per hectare per year while Uri
(2001) and Follett (2001) reported that others provide figures that range from a low of 3 to a high
of 500 kg C ha−1
yr−1
meaning that agriculture seems to have the potential to make an important
contribution to the mitigation of climate change (Manley et al., 2005).
2.7.3 Fallowed Lands
If the important decrease in SOC contents after deforestation in the tropics is well established
(Maass, 1995), the potential of fallows to increase C contents has also been demonstrated
(Manlay et al., 2002b). But the effect depends on soil texture, tree species, management, etc.
(Szott et al., 1999).
In the same time, calcium, magnesium and CEC increased with the age of fallows. With ageing
fallows, coarse root biomass increases while herbaceous biomass decreases. Thus, in sandy soils,
SOC increase with the age of the fallows is linked to an increase in tree root biomass and to more
important litter inputs (Asadu et al., 1997; Floret, 1998).
In most of agrosystems, especially those that are frequently burnt, roots represent the main SOC
source (Menaut et al., 1985; Manlay et al., 2000).
16
The installation of fallows rapidly led to increases in soil C content (by 30% in one year); this is
due to a rapid development of trees. Then, SOC content increase was not so rapid, may be
because of a poor protection of SOM against oxidation by biological activities in sandy soils;
thus the protection of SOM against mineralization, erosion and leaching is not very efficient
(Feller &Beare, 1997). In fact, mesh-bag experiment showed that 40 to 60% of woody roots
disappeared after 6 months of incubation (Manlay et al., 2004).
Fallowing mostly affected the >50 µm organic fraction whose contribution to total C doubled
after crop abandonment. It also allowed a rapid restoration of N and available P contents (Friesen
et al., 1997; Manlay et al., 2004).
The authors Feller (1995a) and Feller et al. (2001) demonstrated that in sandy soils, soil C
increase observed in fallows (after crops) on sandy soils was mainly due to C increase in the >50
µm fraction, while in clayey soils, C increase in <50 µm fraction was mainly responsible for total
soil C increase.
2.8 Rwandan Topsoil organic carbon stocks
For the topsoil C stocks calculated for 121 profiles, representing 99 soil series which spatially
cover 47% of the Rwandan soil scape. On average, 86.1 ± 4.7 Mg C/ha has been stored in the
Rwandan top soils.
The analysis of the results as a function of soil type and land use illustrated that the Andosols are
characterized by the highest C stock of 149.4 ± 44.2 Mg C/ha(table 2) as the humiferous topsoil
organic matter is stabilized by the presence of Al-humus complexes. Cropping activities reduce
the C stocks, through enhanced organic matter mineralisation and erosion losses, though the
topsoil stocks recorded in the 80's were still considerable. The lowest C stocks, on the other
hand, have been reported in the Luvisols and Ferralsols, characterized by average C stock values
of 55.5 and 59.4 Mg C/ha, respectively. Low topsoil stocks of the former 19 group are clearly
associated with agricultural land uses, whereas the Ferralsols are characterized by low stocks,
regardless of the land use type. The C stock values calculated from the Rwandan soil profile
database thus roughly correspond to the Central African estimates for Ferralsols (58 ± 47
Mg/ha), Acrisols (65 ± 48 Mg/ha), and Cambisols (81 ± 50 Mg/ha) reported by Batjes (2008).
17
The higher stocks measured in the Rwandan Acrisols and Cambisols can be explained by the
positive impact of the relatively cool climatic conditions of this high altitude country on soil
organic carbon contents. Variations in altitude, topographic position and soil texture furthermore
explain the moderate variation recorded within each reference group land use type
class(Verdoodt A et al., 2010)

18
Table 2.Topsoil (0-30 cm) organic carbon stocks (Mg/ha) of Rwanda stratified according to
the major soil reference groups and land use types.
Soil
reference
group
Land use
Forest Grassland Timber Cropland Savannah Average
Andosol 164.9 ± 2.5 158.1 ± 71.7 162.5 114.1 ± 3.8 44.2 ± 149.4 ۔۔
Cambisol 148.8 ± 63.8 95.8 ± 45.0 98.9 ± 39.2 98.9 ± 39.2 49.0 ± 100.8 ۔۔
Alisol 41.8 ± 95.5 ۔۔ 41.6 ± 87.7 24.8 ± 93.3 60.8 ± 124.4 ۔۔
Acrisol 95.5 ± 41.8 73.6 ± 25.8 76.2 ± 10.1 85.3 ± 44.3 34.4 86.2 ± 48.0
Ferralsol 52.9 ± 9.1 66.9 ± 26.7 68.3 ± 70.5 60.7 ± 20.1 43.6 ± 14.7 59.4 ± 25.0
Luvisol 33.0 ± 55.5 ۔۔۔ 14.6 ± 35.6 52 34.1 ± 89.8 ۔۔
Average 129.5 ± 68.7 92.7 ± 46.6 89.6 ± 37.3 71.8 ± 37.8 42.0 ±13.6 ۔۔۔
Source: Baseline organic carbon stocks of Rwandan top soils (2010) by Ann Verdoodt, Geert
Baert and Eric Van Ranst of Ghent University (Belgium).
19
CHAPTER 3
MATERIALS AND METHODS
3.1 Study area description
The study was carried out in the watershed of Kinoni watershed located in Busogo area,
district of Musanze, Northern Province.
The study area has a mean altitude of 2300 m with the highest point being at 2800 m a.s.l.
The climate has a mean temperature of 16.7ºC and much rain comprising between 1400
and 1800 mm. Four seasons are observed and divided as follows: short dry season from
mid December to mid February, heavy rainy season from mid February to the endof June,
heavy dry season extending from June to August, and short rainy season from August to
mid December. Soil of the study area is mainly volcanic soil which is very permeable
with low depth on mountains and moderate depth in lower altitude(Nahayo et.al, 2012;
http://www.sciencepub.net/nature). This kind of soil is subject to many erosion
phenomena in the area of abrupt slope. The population is around 15,795 inhabitants,
where 45.1% are male and 54.9% are female. The total surface area is 20.5 km2 with the
population density of 787.8 inhabitants per km2. Most of the people in the study area are
involved in agriculture and the main crops grown are potatoes, maize, beans and
vegetables (Nahayo et.al, 2012; http://www.sciencepub.net/nature).
In addition, Kinoni watershed is dominated with different types of land management. Its
marsh land is taken as the main source of land production in spite of the over
loggingappearingmost of the rainfallseasonswhere differentcrops are fallen down the
water causing the high production loss.
The soil is of volcanic type and is classified into Andisol (USDA) or Andosols (FAO).
According to Raymond (1990), Andisols are formed from volcanic eject (ash),
characterized by loose and well aerated physical status.

20
3.3 Soil sampling
Soil samples were taken in Kinoni watershed located in Musanze and Nyabihu districts.Careful
soil sampling was essential for accurate soil carbon storage results where the disturbed soil
samples were needed for the lab analysis. By tracing a transect in the area of study, three soil
composite samples were taken and ethe 1st sample was taken at the top, the second on the middle
and the third at the bottom of RUTOYI hill respectively by following the orientation of transect
line. For taking the composite sample in each site, zigzag method was used to take samples in
each land use type at depth of 30cm.
In addition, the first sample was taken in the fallowed or uncultivated land where the peas and
wheat were the crops grown in seven years ago. The second sample was taken in cultivated Irish
potatoes land and different types of fertilizers such as NPK and DAP and organic manure were
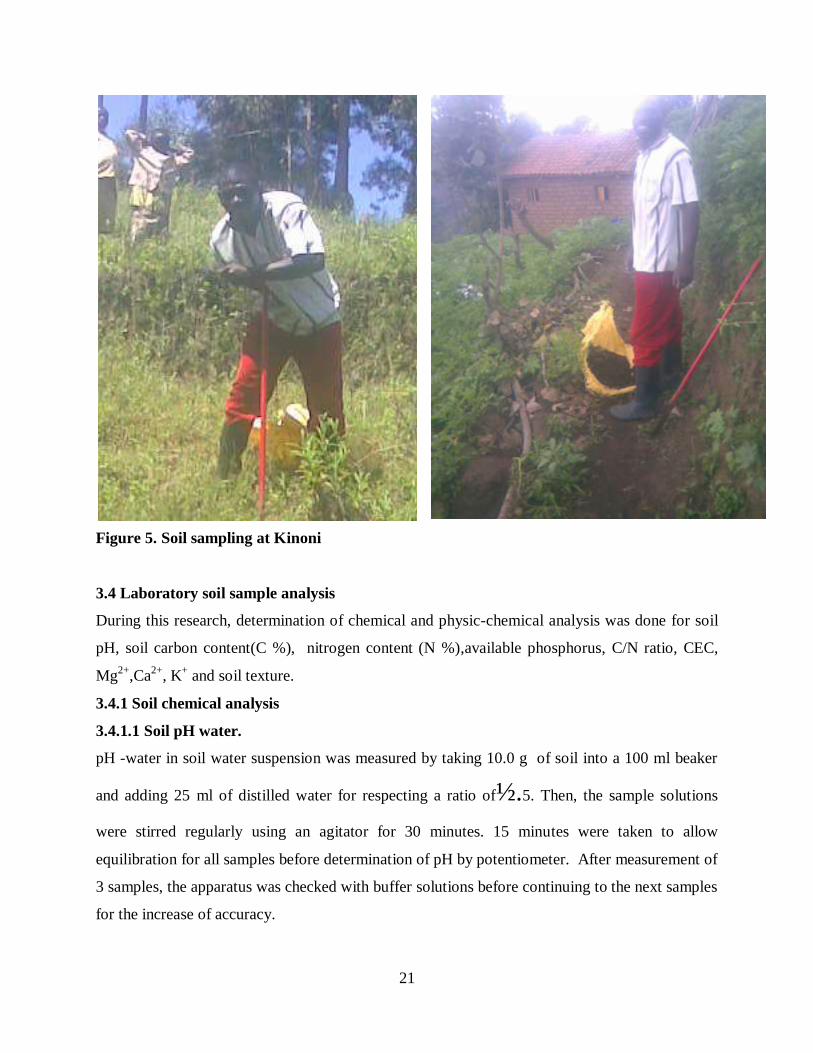
used. The third sample was taken in forest of eucalyptus species. The figure 5 indicates Soil
sampling at Kinoni watershed.
21
Figure 5. Soil sampling at Kinoni
3.4 Laboratory soil sample analysis
During this research, determination of chemical and physic-chemical analysis was done for soil
pH, soil carbon content(C %), nitrogen content (N %),available phosphorus, C/N ratio, CEC,
Mg2+
,Ca2+
, K+ and soil texture.
3.4.1 Soil chemical analysis
3.4.1.1 Soil pH water.
pH -water in soil water suspension was measured by taking 10.0 g of soil into a 100 ml beaker
and adding 25 ml of distilled water for respecting a ratio of½.5. Then, the sample solutions
were stirred regularly using an agitator for 30 minutes. 15 minutes were taken to allow
equilibration for all samples before determination of pH by potentiometer. After measurement of
3 samples, the apparatus was checked with buffer solutions before continuing to the next samples
for the increase of accuracy.

22
3.4.1.2 Determination of organic carbon
The soil organic carbon was determined by using 2 g ofsoil 0.5 mm dia sieve for each sample in
a clay pot. The clay potwas measured before and together with the sample. Clay pot with soil
sample was put in an oven dry at 105ºC for a period of 3 hours and the weigh was taken .Then
they were placed in a furnace at about 450 ºC for a period of 3 hours ,The weigh was again
taken. Lastly, theorganic matter to be converted into OC by using Van Bemmelm factor (1.724);
was calculated using the related formula (Glatzle,2012).
3.4.1.3 Determination of total Nitrogen by Kjeldahl Method
To determine the TN; 3 g of catalyst and 10 ml of H2SO4conc were added in 0.5 gof 0.5 mm
diameter sieve of air-dried soil which are both mineralized until the appearance of green color (at
300oC for 2 hours) and then cooled, transferred into a 100 ml volumetric flask and adjusted up to
100 ml with distilled water. 10 ml of the digested solution was mixed with10 ml of NaOH
(40%) into a distillation tube,distillatedup to the volume of 100ml in an Erlenmeyer flask of 250
ml containing 5 ml of Boric acid2%, titrated with H2SO4 0.1N by noting the quantity
H2SO4used(T). The blank solution was also prepared.
3.4.1.4 Cation Exchange Capacity (CEC) determination by Kjeldahl Method.
The soil CEC was determined by washing 5g of 2 mm soil sieve diameter with 50ml of alcohol
(recuperated) and 50 ml of NaCl 10% from there 10 ml was mixed with 10 ml of NaOH 40% in a
distillation tube and distillate in an Erlenmeyer flask of 250 ml up to the volume of 50 ml titrated
with H2SO4 0.1N note the quantity used (T). The blank solution was also prepared.
3.4.1.5 Potassium by atomic absorption spectrophotometry method.
Five grammesof soil2 mm dia. sieve was weighed and mixed in small plastic bottle with 50 ml of
ammonium acetate (NH4OAC) 1 M which were shaked at 300 tours/min shaker for a period of 5
minutes and then the solution was filtered in a 100 ml and diluted with distilled water up to the
gauge point, from that 15ml was taken for reading absorbance in a spectrophotometer.

23
3.4.1.6 Calcium and magnesium determination
The used solution was prepared by adding 50 ml of NH4OH 1M, pH 7.00 in 5g of soil sample
passed through 2 mm sieve in an Erlenmeyer flask of 250 ml, shaked for 30 minutes and filtered
by running the blank. Apart of that 10 drops of K4(CN)6Fe(2), 10 drops of hydroxylamine-
hydrochloride,15 ml of NaOH 10% and 3 drops of calcon were added into 10 ml of extract
solution diluted up to 100 ml with distilled water and titrated with EDTA 0.01 N until the color
was appeared for the determination of calcium while 15 ml of buffer (chloride ammonium-
ammonium hydroxide),10 drops of each solution of K4(CN)6Fe(2), hydroxylamine-
hydrochloride, and 3 drops of Eriochrome black T and both titrated with EDTA 0.01 N to
determine Ca+ Mg.
3.4.1.7 Soil available phosphorous determination.
Available P was determined using by Mehlich 3 Method by adding 30 ml of extraction solution
of Mehlich 3 into 3 g of soil passed through 2 mm sieve, shaked for5 minutes and filtered with
filter paper. From that, 10 ml was transferred into a volumetric flask (plastic bottle) of 100 ml,
adding 10 ml by shaking with hand and add 5ml of stannious chloride. Then latter solution was
mixed with distilled water up to 100ml and the absorbance was read after 10 minutes at 710 nm
spectrometer.
3.4.2 Soil Physical Analysis
3.4.2.1 Textural analysis of soil sample
Soil texture was determined by densimetric method of BOYOUCOUS. By mixing 100 ml of
hydrogen peroxide 10%(H2O2) with 51 gr of air dried soil passed through 2 mm sievein an
Erlenmeyer of 1 liter . left them stand for one night (12 hours) and then the suspension was
heated on the hot plate to destroy organic matter . left cool , add 50 ml of Sodium
Hexametaphosphate 5% and dilute with distilled water up to the mark of 1000 ml of graduated
cylinder.
The first reading was taken after puttingthe soil in suspension by successive reversals and
adjustments of about 10 times while the second readingwas takenafter 3 hours of standing using

24
the hydrometer and the thermometer.The firstreading is corresponding to the concentration of
clay and siltand the second to the concentration of clayalone (fraction≥2microns in suspension).
3.5 Data analysis
Data were analyzed using SPSS 16.0 software for Windows. Tests for normality of data
distribution and equality of variances were tested before performing analysis of variance.
Statistical significant difference was assigned at P ≤ 0.05 where soil sample data were analyzed
using one way ANOVA after fulfillment the normality assumptions.While linear correlation test
was used to check if soil properties affected the storage of SOC in KINONI watershed.

25
CHAPTER 4
PRESENTATION OF RESULTS AND DISCUSSIONS
4.1 Presentation of results
4.1.1 Results of analyzed soil parameters of Kinoni watershed.
The table 4 below indicates the data of pH, organic carbon, C/N ratio, CEC, Total nitrogen, Mg,
Ca, K and Pav (Mean±SD,n=3) in different land uses types of the Kinoni Watershed soil
samples for better understanding of the carbon storage process in Kinoni watershed.
Table 3. Results of analyzed soil parameters of Kinoni watershed.
Soil parameters Land use types
Fallow land Cultivated Forest land Average
pH 6.15±0.22 6.27±0.25 4.74±0.19 5.72±0.76
SOC (%) 2.60±0.53 5.46±0.08 4.69±0.00 4.25±1.31
N (%) 0.09±0.02 0.31±0.03 0.30±0.04 0.23±0.11
C/N 28.21±7.0 17.86±1.89 15.93±2.40 20.67±6.88
CEC(meq/100g) 20.5±0.1 46.57±4.72 18.65±2.25 28.57±13.77
Mg(meq/100g) 1.77±1.27 5.8±0.00 0.2±0.00 2.59±2.58
Ca(meq/100g) 6.43±0.35 13.97±0.67 0.93±0.06 7.11±5.68
K(meq/100g) 0.20±0.01 0.34±0.02 0.09±0.01 0.21±0.11
Pav(ppm) 25.67±10.69 45.5±3.5 16.33±4.04 29.17±14.22
Soil texture type Loamy sand Sandy loam Loamy sand -
4.1.2 Soil characterization of Kinoni watershed
4.1.2.1 pH in different land use types of Kinoni Watershed
The results (table 4) indicate that the pH mean values were 6.15±0.22,6.27±0.25, and 4.74±0.19
for respectively uncultivated /fallowed land, cultivatedand eucalyptus forested land. According
to (Mutwewingabo and Rutunga, 1987), the soils are classified from very acid to slightly acidic
soils.
The pH mean values of the three land use types of Kinoni watershed have shown to be
significantly different between fallow and eucalyptus forested land. The latter was significantly
different to the cultivated land (P<0.05) (appendix 2.2 and table 4).

26
4.1.2.2 OC content in different land uses types of Kinoni Watershed
Resultsindicate the OC mean percentages for top fallowed land (2.60±0.53), middle cultivated
land (5.46±0.08) and the downhill eucalyptus forested land (4.69±0.00). According to Landon
(1991), they were classified respectively asweak, middle for cultivated and eucalyptus forested
land in OC content. The mean OC percentage of the three land uses types of Kinoni watershed
have shown to be significantly different between them (P<0.05) as indicated by the appendix 2.2
and the table 4).
4.1.2.3 Total Nitrogen in different land uses types of Kinoni Watershed
The results indicate that the TN mean values of the soil are for top hill fallowed land
(0.09±0.02), middle hill cultivated land (0.31±0.03) and the downhill eucalyptus forested land
(0.30±0.04).They are respectivelyclassified as middle(0.075-0.2),high (0.2-0.5) and high(0.2-0.5)
(Mutwewingabo and Rutunga, 1987).
The TN mean values of top hill fallowed land showed to be significantly different with other
land uses types (P<0.05) while the cultivated and eucalyptus forested land were not significantly
different between them (P>0.05) (appendix 2.2 and the table 4).
4.1.2.4 C/N ratio in different land use types of Kinoni Watershed
The results (table 4) showed the mean C/N ratio values of the analyzed soil for top fallowed land
(28.21±7.0), middle cultivated land (17.86±1.89) and the downhill eucalyptus forested land
(15.93±2.40) which are respectively classified as Very low (≥ 25), low(17-25) and normal(12-
17) in the mineralization of organic matter (Mutwewingabo and Rutunga ,1987).
The mean C/N ratio of top hill fallowed land was not significantly different with mid cultivated
landand significantly different with the eucalyptus forested land (P<0.05) while the mean
comparisom between the cultivated and the eucalyptus forested land seemedto be the same
(Appendix 2.2 and table 4).
27
4.1.2.5 CEC in different land uses types of Kinoni Watershed
The results (table 4) indicated that CEC mean values were medium, high and medium for top
fallowed land (20.5±0.1), middle cultivated land (46.57±4.72) and the downhill eucalyptus
forested land (18.65±2.25) respectively (Mutwewingabo and Rutunga, 1987).
The CEC mean value of top hill fallowed land was not significantly different with eucalyptus
forest land and significantly different with the arable land (P<0.05) while the arable land was
significantly different to the forest land (P<0.05) in Kinoni watershed (appendix 2.2and table 4).
4.1.2.6 Soil texture in different land uses types of Kinoniwatershed
The figure 11 below illustrates the soil texture of Kinoni watershed land uses types.According to
the USDA soil texture triangle (Appendix3), the analyzed soil texture was Loamy sand for
fallow, Sandy loam for cultivated and Loamy sand for eucalyptus forested land use types.
4.1.2.7Available P in different land use types of Kinoni watershed
The figure 12 below indicates that available phosphorus mean values (Pav) were moderate in
each land use type (Mutwewingabo and Rutunga, 1987). The available P mean value of the
arable land (45.5±3.5) was significantly different to uncultivated(25.67±10.69) and eucalyptus
forest land(16.33±4.04) (P<0.05) while the uncultivated and eucalyptus forest land mean values
were not( appendix 2.2 and table 4).
4.1.2.8 Exchangeable basic cations in different land uses types of Kinoni Watershed
The results (table 4) indicated that Mg mean values were medium, high and very low for top
fallowed land (1.77±1.27), middle cultivated land (5.8±0.00) and the downhill eucalyptus
forested land (0.2±0.00) respectively(Mutwewingabo and Rutunga, 1987). The Mg mean value
of top hill fallowed land was not significantly different with eucalyptus forest land but it was
significantly different with the arable land (P<0.05) while the Mg of arable land was
significantly different to the forest land (P<0.05) in Kinoni watershed (Appendix 2.2 and table
4).

28
The results indicates that mean Ca values were high, high and very low for top fallowed land
(6.43±0.35), middle cultivated land (13.97±0.67)and the downhill eucalyptus forested land
(0.93±0.06) respectively ( Mutwewingabo and Rutunga 1987). The Ca mean value of the three
land use types showed to be significantly different between them (P<0.05) in Kinoni watershed
(appendix 2.2 and table 4).
Also,the results showed that K mean values were low, high and very low for top fallowed land
(0.20±0.01), middle cultivated land(0.34±0.02) and the downhill eucalyptus forested land
(0.09±0.01) respectively (Mutwewingabo and Rutunga,1987).The K mean values of the three
land use types was significantly different between them (P<0.05) (Appendix 2.2 and table 4).
4.1.3 The linear correlation of soil properties and soil organic carbon storage
To check the effect of soil properties on carbon storage the linaear correlation test was used
during this study as presented below;
4.1.3.1 Relationship of soil pH and soil organic carbon storage
As it is shownon the correlation graph (Figure 6), there is a negative relationship between pH
mean values and SOC. In fact SOC have been changing negatively across the land use types as
pH values changed. Results have revealed that at the highest pH values correspond to the lowest
SOC values and vice versa.
Figure 6: Relationship of soil pH and soil organic carbon storage
y = -0.328x + 6.127R² = 0.035
0
1
2
3
4
5
6
0 2 4 6 8
S0C
(%)
Soil pH water values
SOC(%)
Linear (SOC(%))

29
4.1.3.2 Relationship of C/N ratio and soil organic carbon storage
As it is shown on the correlation graph (Figure 7), there is a negative relationship between C/N
ratio mean values and SOC. In fact SOC have been changing negatively across the land use
types as C/N ratio mean values changed. Results have revealed that at the highest C/N Ratio
mean values correspond to the lowest SOC values and vice versa.
Figure 7: Relationship of C/N ratio and soil organic carbon storage
4.1.3.3 Relationship of CEC and soil organic carbon storage
As it is shown on the correlation graph (Figure 8), there is a positive relationship between CEC
mean values and SOC. In fact SOC have been changing positively across the land use types as
CEC mean values changed. Results have revealed that at the highest CEC mean values
correspond to the highest SOC values and vice versa.
y = -0.205x + 8.497R² = 0.841
0
1
2
3
4
5
6
0 10 20 30
SO
C(%
)
C/N ratio
SOC (%)
Linear (SOC (%))

30
Figure 8 : Relationship of CEC and soil organic carbon storage
4.2 Discussions of results
4.2.1 Land use types and carbon storage in Kinoni watershed
The fallowed land; cropped wheat and peasin 7 years ago,. it is located at the top of hill(elevation
of 2440m) andhas shown a low OC content compared to others; because of the erosion factor as
it is stated that the processes of erosion and deposition acts to redistribute soil carbon according
to the topography of the landscape, with low-lying areas often having increased SOC relative to
upslope positions(Todd & Schulte,2012; Quideau 2002).In addition, organic matter accumulation
is often favouredat the bottom of hills where the conditions are wetter than at mid- or upper-
slope positions, and organic matter is transported to the lowest point in the landscape through
runoff and erosion (FAO, 2005). Whilethe mid cultivated land(elevationof 2373 m), Sandy loam
as texture, where carrots and potatoes were grown and NPK,DAP,organic manure were applied,it
has shown a high soil carbon content because of the contained higher clay content(Sandy loam)
and fertilization.Heath et al.(2003) indicated that soil carbon stocks may be increased by as much
as 25% depending in the fertilization application
(http://www.ecoshift.com) .
Moreover,Lal et al.(1999) reported that the application of inorganic fertilizers promotes biomass
production, which consequently may get incorporated in soil and influence the C sequestration
y = 0.063x + 2.448R² = 0.442
0
1
2
3
4
5
6
0 10 20 30 40 50
SO
C (
%)
CEC(meq/100g)
SOC (%)
Linear (SOC (%))

31
process whereas Whalen and Chang(2002) and Six et al.(2002) proved it by saying that the
application of manure supplies organic matter, which in turn promotes C sequestration in
soil(Nair ,2011).
Lastly, the eucalyptus forested land (at elevation of 2196 m); no of any fertilizer application,
with loamy sand as texture,it is located at the bottom of the hillnear by the marshland of Kinoni.
It had been observed to have lower OC storage probably due to its lignin and polyphenols
content which retard decomposition (Rutebuka, 2012; FAO, 2005). Laclau et al. (2010) reported
that Eucalyptus plantations in tropical regions also have a higher water and nutrient uptake than
other species and thus reduction of moisture might fasten the decomposition of organic matter.
All the above explanations helps to get the differences between the land use types in soil carbon
storageas it is observed infallowed,cultivated and eucalyptus forest land location.
4.2.2 Effect of soil properties on carbon storage of three land uses
The correlation analysis results between OC and soil properties (pH, C/N and CEC) are shown
from figure 6 to figure 8. According to those results OC positively correlated with CEC while the
correlation was negative with soil pH and C/N ratio.
The higher values of OC storage were found under the eucalyptus forested land where soil pH
found to be low. This could have been due to slow decomposition of organic material due to low
pH as the growing conditions and nutrients for micro-organisms are poor. Also eucalyptus
forested land indicated a low pH (pH<5) like many tropical mountain rainforests have a low pH
(Rutebuka, 2012; Bruijnzel and Proctor, 1995). Nsabimana (2008) reported that Eucalyptus
stands at Ruhande (Rwanda) are most acidic compared to other plantation stands because of
increasing production of organic acids such as organic sulfur.It is known that organic carbon is
together with pH, the best simple indicator of the health status of the soil and moderate to high
amounts of organic carbon are associated with fertile soils of a good structure (FAO, 2009).
The observed low TN of the top fallowed land could have been due to low N Supply which
might have been caused by large C: N ratios from low mineralization rates and consequently
lower the level of total N (Nsabimana et al. 2008) and the OC is declined compared to other land

32
use types. Additionally, the higher TN content especially to cultivated land could be related to
applications of plant materials with low large C/N ratios which may cause nutrient mobilization
and increase total N content (FAO, 2005). It was found that the Eucalyptus forest plantation of
Nyungwe, the C and N contents in the upper layer was 8.4 ±0.7 % and 0.65 ±0.06 % respectively
(Rutebuka, 2012) compared to 4.69±0.00 % and 0.30±0.04 % in eucalyptus forested land of
Kinoni Watershed.
The CEC in cultivated was higher (46.57±4.72 meq/100g) compared to fallowed (20.5±0.1
meq/100g) and eucalyptus forested (18.65±2.25meq/100g) land use types because the Cation
exchange capacity increases in function of the increase in organic matter (FAO, 2001) and low
CEC values are characteristic of low activity clay soils which are dominated by kaolinite (
Dowuona and Adjetey,2010) while the higher CEC Nyungwe forest were 109 meq/100 of soil
corresponded with higher OC(Rutebuka, 2012).
The results show that the SOC stored in different land use types of Kinoni watershed ranged as
2.60±0.53, 4.69±0.00, and 5.46±0.08 for fallow, eucalyptus forested and cultivated land use
types respectively (table 4). But actually, the forest of andisols was reported in the Baseline
organic carbon stocks of Rwandan top soils(0-30 cm) to store high organic carbon (164.9 ± 2.5
Mg/ha) compared to other land use types including cropland (114.1 ± 3.8 Mg/ha) (Verdoodt A et
al., 2010).

33
CHAPTER 5
CONCLUSION AND RECOMMENDATIONS
5.1 Conclusion
Kinoni watershed is the taken as the main source of land for crop production and dominated with
different types of land management. This present study focused on assessment of soil carbon
storage in different land use managements of Kinoni watershed.
The results showed that the soil C content exhibited significant differences between the three
land use managements of Kinoni watershed. The C content(5.46±0.08%) were higher in the
arable land than Eucalyptus forest(4.69±0.00 %) land due to the application of organic manure,
inorganic fertilizers promoting biomass production and the higher clay content. It decreased in
uncultivatedland (2.60±0.53%) mainly because of the erosion factor while a decrease of C
storage in the eucalyptus forest could be related to lower pH, lignin and polyphenols content.
The soil properties have shown to affect more the soil C storage in the studied watershed as the C
content was changed in line with pH , C/N ratio and CEC.
In addition, the OC may contribute to the increase of land fertility whereby the arable
landreleased the soil nutrients respectively as (5.8±0.00meq/100g) of Mg, (13.97±0.67meq/100g)
of Ca (0.34±0.02meq/100g) of K, (45.5±3.5 ppm) of Pav more than the eucalyptus forest land
with (0.2±0.00meq/100g) of Mg, (0.93±0.06meq/100g) of Ca (0.09±0.01 meq/100g) of K,
(16.33±4.04ppm) of Pav and the uncultivated land with ( 1.77±1.27meq/100g) of Mg,
(6.43±0.35meq/100g) of Ca, (0.20±0.01meq/100g) of K, (25.67±10.69 ppm) of Pav and the
cause of those nutrients release was mainly based on its higher CEC(46.57±4.72 meq/100g),
compared to (20.5±0.1 meq/100g) of uncultivated land (18.65±2.25meq/100g) of eucalyptus
forested land.
Altogether, the results from this study have shown that the C content depends on the
management and land use types and soil properties.The cultivated land was observed to be high
in organic carbon, followed by eucalyptus forest land and the uncultivated land.

34
5.2 Recommendations
Kinoni watershed should be well protected against the erosions, mismanagement and
leaching process for increasing the C stock;and
Afforestation of trees species having high capacity of storing C should be planted in order to
increase the OC storage of Kinoni wareshed;
As further studies, we recommend further researches on above and below ground carbon
storage to understand better all the processes for more than one watersheds in Musanze-
Nyabihu districts.

35
REFERENCES
1. Batjes (1999).Management option for reducing CO2 -concentrations in the atmosphere by
increasing carbon sequestration in the soil. Report 410-200-031, Dutch National Research
programme on Global Air Pollution and Climate change & Technical Paper 30,
International Soil Reference and Information Center, Wageningen.
2. Charles W. Rice,www.oznet.ksu.edu/pr_sme.Sequestration of atmospheric CO2 into
soils: how and why.Department of agronomy, Kansas State University, Manhattan, KS
66506-5501.
3. Dowuona and Adjetey(2010). Assessment of carbon storage in some savanna soils under
different landuse systems in Ghana p.2,Department of Soil Science, University of
Ghana,Legon Ghana,/files/articles/1012/1281042320.pdf/27/03/2013.
4. Earthwatch Institute (Europe).Climate Change: Section 5, Conservation Education &
Research Trust (CERT), 267 Banbury Road, Oxford OX2 7HT UK. (Number:4373313
and 1094467).
5. Enrique Peña et al.(2011).Accounting the Carbon Storage in Disturbed and Non-
Disturbed Tropical Andean Ecosystems, Planet Earth 2011 - Global Warming Challenges
and Opportunities for Policy and Practice, Prof. Elias Carayannis (Ed.), ISBN: 978-953-
307-733-8, InTech.
6. FAO (2004).Assessing carbon stocks and modelling win–win scenarios of carbon
sequestration through land-use changes. Rome, Italy: ISBN 92-5-105158-5.
7. FAO (2004).Carbon sequestration in dry land soils, world soil resources reports, Rome,
p1- (ISBN 92-5-105230-1).
8. FAO (2005). The importance of soil organic matter (Key to drought-resistant soil and
sustained food and production): ISBN 92-5-105366-9, VialedelleTerme di Caracalla,
00100 Rome, Italy.
9. FAO (2009). Harmonized World Soil Database (version 1.1).FAO, Rome, Italy and
IIASA, Laxenburg, Austria.
36
10. FAO(2001). Soil carbon sequestration for improved land management.World Soil
Resources Reports. Italy: ISSN 0532-0488
11. Feng and Li (2001).Carbon Sequestration Potentials in Agricultural Soils. Environmental
Technologies Department of Renewable Resources, Alberta Research Council University
of Alberta Edmonton, Alberta, T6N 1E4, Canada Edmonton, Alberta, T6G 2E3, Canada)
12. Flora (2009). Effects of nitrogen and organic matter inputs on the soil carbon
cycle,Institute of Biogeochemistry and Pollutant Dynamics, Department of
Environmental Sciences, ETH Zürich.
13. Glatzle (2012).Relationship between vegetation type,soil type, soil moistureand carbon
stock in semiarid ethiopian savannahs. Msc. Thesis,Faculty Of Agricultural
Sciences,Hohenheim university.
14. http://en.wikipedia.org/wiki/Carbon_cycle/29/03/2013
15. http://www.ecoshift.com).Accounting for Carbon in Soils, Climate Action Reserve.
16. Manley ,Kooten and Moeltner (2005). Creating carbon offsets in agriculture through No-
till cultivation: a meta-analysis of costs and Carbon benefits. Climatic Change 68: 41–65,
2005, Department of Agricultural and Resource Economics, University of California,
Berkeley, California, U.S.A.
17. Nabuurs,GJ.,O.Maser,K.Andraskos et al. (2007).Part of a special issue on canopy
processes in a changing climate.
18. Nahayo,Nsengumuremyi and Ekise (2012).Application of Geographic Information
System (GIS) for mapping land use types in Musanze district, Higher Institute of
Agriculture and Animal Husbandry (ISAE)-Busogo; Department of Forestry and Nature
Conservation; Musanze, Rwanda,p.163-164, (ISSN: 1545-0740).
19. Nair (2011). Center for Subtropical Agroforestry, School of Forest Resources and
Conservation,University of Florida, P.O. Box 110410, Gainesville, FL 32611–0410,
USA.

37
20. Nsabimana , L. Klemedtson, B.A. Kaplin and G. Wallin (2008). Soil carbon and nutrient
accumulation under forest plantations in southern Rwanda.1Department of Plant and
Environmental Sciences, Göteborg University, P. O. Box 461, 405 30 Göteborg,
Sweden.2Department of Biology, National University of Rwanda, Rwanda.
21. OFRI (2006). Forests, Carbon and Climate Change; a synthesis of science findings,
Oregon State University College of Forestry ;Oregon Department of Forestry,Oregon
Forest Resources Institute 317 SW Sixth Avenue, Suite 400 Portland, Oregon 97204.
22. Phillips, O.L., Malhi, Y., Higuchi, N., Laurance, WF., Nunez, PV., Vasquez, RM.,
Laurance, SG., Ferreira, LV., Stern, M., Brown, S., Grace, J.(1998). Changes in the
carbon balance of tropical forests: evidence from long-term plots. Science 282:439–442.
23. Pretty and Ball (2001).Agricultural Influences on Carbon Emissions and Sequestration:
A Review of Evidence and the Emerging Trading Options, Centre for Environment and
Society and Department of Biological SciencesUniversity of Essex, UK, p.8.
24. REMA ( 2011). Guidelines for Mainstreaming Climate Change Adaptation and
Mitigation in the Agricultural Sector(FINAL VERSION).Kigali, Rwanda.
25. Rutebuka (2012).Carbon pools in the Nyungwe tropical mountain rain forest in
Rwanda,Ghent University, VrijeUniversiteitBrussel, Belgium.
26. Todd & Schulte (2012).Soil Carbon Storage Department of Natural Resource Ecology
and Management, Nature Education, Iowa State University, Ames, IA.
27. UNEP-WCMC(2010).Carbon, biodiversity&ecosystem services Climate Change and
Biodiversity Programme UNEP World Conservation Monitoring Centre 219 Huntingdon
Road, Cambridge, CB3 0DL, UK.
28. USEPA (2012). Carbon Sequestration through Reforestation.Office of Superfund
Remediation and Technology Innovation (OSRTI).
29. Verdoodt, Ann Baert and Ranst E(2010).Baseline organic carbon stocks of Rwandan top
soils, Ghent University, Ghent, Belgium.

38
30. W. M. Post and K. C. Kwon (1999). Soil Carbon Sequestration and Land-Use Change:
Processes and Potential;Environmental Sciences Division, Oak Ridge National
Laboratory, Oak Ridge, TN 37831-6335, USA/ Chemical Engineering Department,
Tuskeegee University, Tuskeegee, AL 36088, USA.

39
APPENDICES
Appendix 1.Soil parameters for different land use types in Kinoni watershed
SOIL
SAMPLE pH OC
C/N
RATION CEC TN Mg Ca K
Av
P SAND CLAY SILT
% meq/100g % meq/100g ppm %
ULS1 5.91 2.72 24.26 20.6 0.112 0.4 6.4 0.21 35 84.36 8.64 7
ULS2 6.2 3.05 36.31 20.4 0.084 2 6.1 0.2 14 85.36 8.64 6
ULS3 6.35 2.02 24.05 20.5 0.084 2.9 6.8 0.2 28 86.64 8.18 5.18
CLS1 6.4 5.46 17.77 48 0.31 5.8 14.3 0.36 42 74.72 11.28 14
CLS2 5.99 5.54 19.79 41.3 0.323 5.8 14.4 0.33 49 74.72 11.28 14
CLS3 6.43 5.38 16.01 50.4 0.336 5.8 13.2 0.33 45.5 74.72 11.28 14
FLS1 4.61 4.69 15.23 16.4 0.308 0.2 0.9 0.08 14 85.72 8.28 6
FLS2 4.65 4.69 18.61 18.65 0.252 0.2 1 0.1 14 86.36 8.64 5
FLS3 4.96 4.69 13.96 20.9 0.336 0.2 0.9 0.1 21 87.36 7.64 5
The appendix 1 above shows the basic data used during spss and some of them for linear
correlation analysis.
Appendix 2.Statistical Analysis Tables Using SPSS One WAY ANOVA
2.1 ANOVA tables
Sum of
Squares df Mean Square F Sig.
PH Between
Groups 4.363 2 2.182 44.470 .000
Within Groups .294 6 .049
Total 4.657 8
OC Between
Groups 13.174 2 6.587 69.817 .000
Within Groups .566 6 .094
Total 13.740 8
CNR Between
Groups 261.456 2 130.728 6.691 .030
Within Groups 117.227 6 19.538
Total 378.683 8

40
CEC Between
Groups 1462.234 2 731.117 80.296 .000
Within Groups 54.632 6 9.105
Total 1516.866 8
TN Between
Groups .088 2 .044 46.091 .000
Within Groups .006 6 .001
Total .094 8
Mg Between
Groups 50.082 2 25.041 46.854 .000
Within Groups 3.207 6 .534
Total 53.289 8
Ca Between
Groups 256.869 2 128.434 675.971 .000
Within Groups 1.140 6 .190
Total 258.009 8
K Between
Groups .092 2 .046 294.500 .000
Within Groups .001 6 .000
Total .093 8
Pav Between
Groups 1331.167 2 665.583 13.971 .006
Within Groups 285.833 6 47.639
Total 1617.000 8
2.2 Mean comparisons
Multiple Comparisons
Tukey HSD
Dependent
Variable (I) LUT (J) LUT
Mean Difference (I-
J) Std. Error Sig.
95% Confidence Interval
Lower Bound Upper Bound
PH 1 2 -.12000 .18084 .792 -.6749 .4349
3 1.41333* .18084 .001 .8585 1.9682
2 1 .12000 .18084 .792 -.4349 .6749
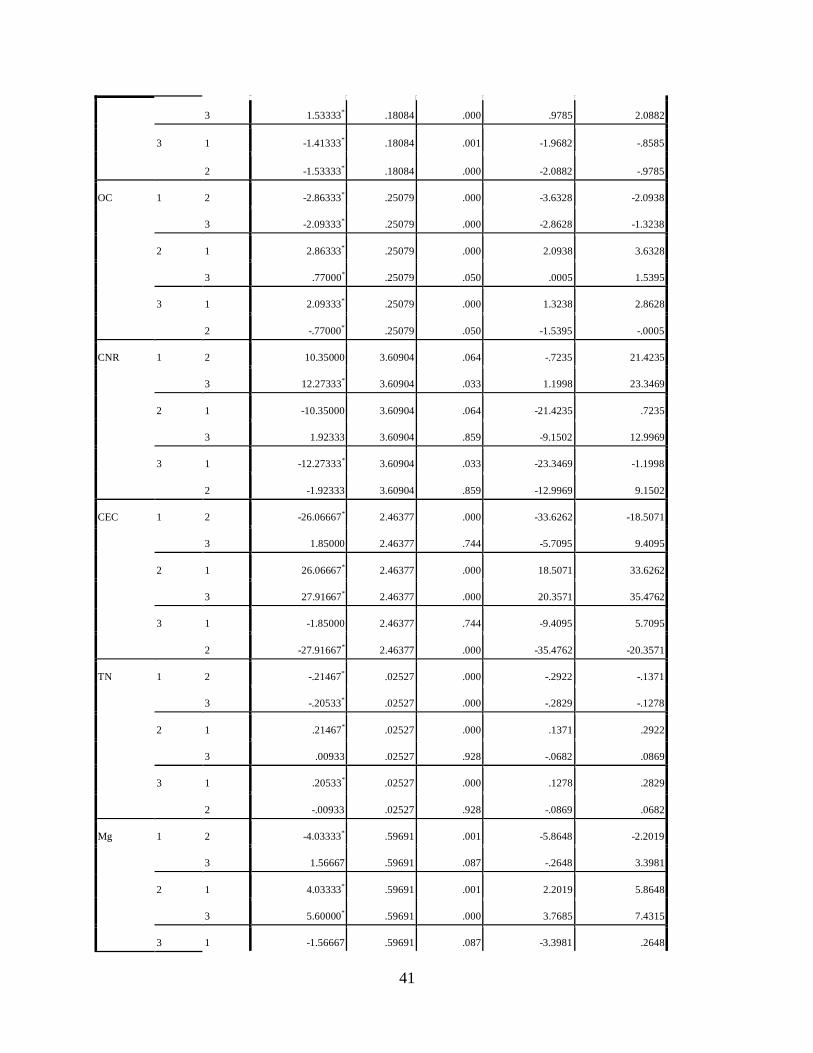
41
3 1.53333* .18084 .000 .9785 2.0882
3 1 -1.41333* .18084 .001 -1.9682 -.8585
2 -1.53333* .18084 .000 -2.0882 -.9785
OC 1 2 -2.86333* .25079 .000 -3.6328 -2.0938
3 -2.09333* .25079 .000 -2.8628 -1.3238
2 1 2.86333* .25079 .000 2.0938 3.6328
3 .77000* .25079 .050 .0005 1.5395
3 1 2.09333* .25079 .000 1.3238 2.8628
2 -.77000* .25079 .050 -1.5395 -.0005
CNR 1 2 10.35000 3.60904 .064 -.7235 21.4235
3 12.27333* 3.60904 .033 1.1998 23.3469
2 1 -10.35000 3.60904 .064 -21.4235 .7235
3 1.92333 3.60904 .859 -9.1502 12.9969
3 1 -12.27333* 3.60904 .033 -23.3469 -1.1998
2 -1.92333 3.60904 .859 -12.9969 9.1502
CEC 1 2 -26.06667* 2.46377 .000 -33.6262 -18.5071
3 1.85000 2.46377 .744 -5.7095 9.4095
2 1 26.06667* 2.46377 .000 18.5071 33.6262
3 27.91667* 2.46377 .000 20.3571 35.4762
3 1 -1.85000 2.46377 .744 -9.4095 5.7095
2 -27.91667* 2.46377 .000 -35.4762 -20.3571
TN 1 2 -.21467* .02527 .000 -.2922 -.1371
3 -.20533* .02527 .000 -.2829 -.1278
2 1 .21467* .02527 .000 .1371 .2922
3 .00933 .02527 .928 -.0682 .0869
3 1 .20533* .02527 .000 .1278 .2829
2 -.00933 .02527 .928 -.0869 .0682
Mg 1 2 -4.03333* .59691 .001 -5.8648 -2.2019
3 1.56667 .59691 .087 -.2648 3.3981
2 1 4.03333* .59691 .001 2.2019 5.8648
3 5.60000* .59691 .000 3.7685 7.4315
3 1 -1.56667 .59691 .087 -3.3981 .2648
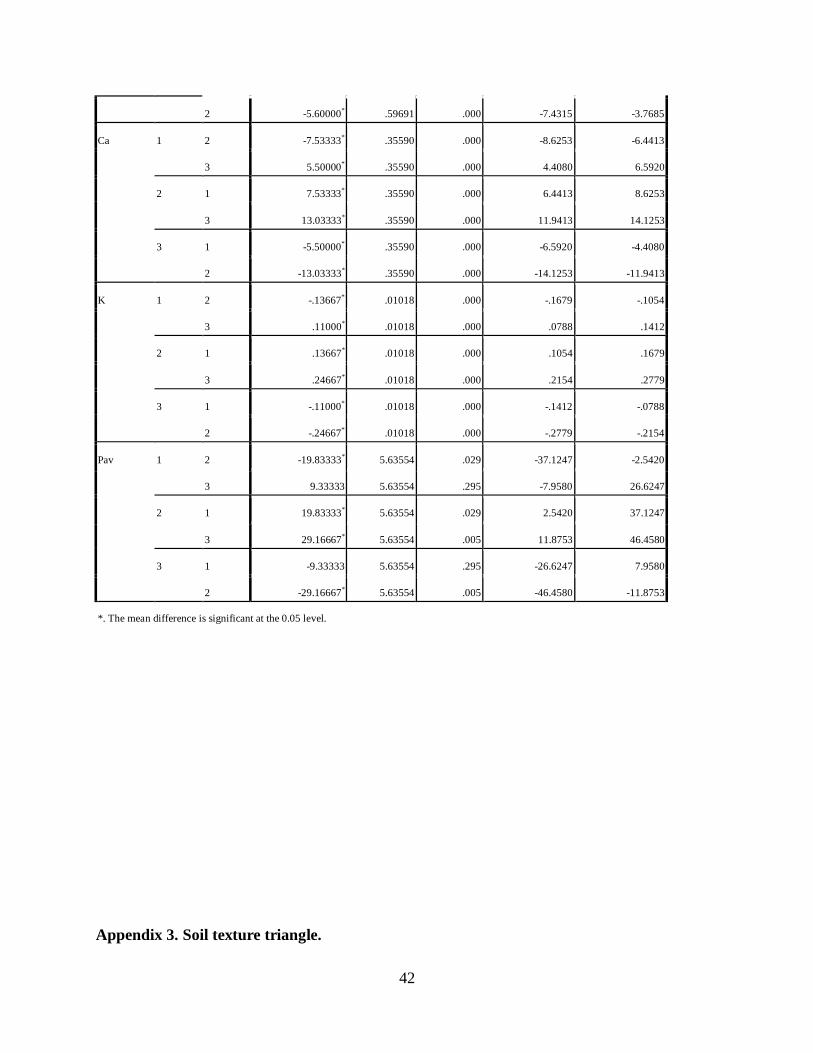
42
2 -5.60000* .59691 .000 -7.4315 -3.7685
Ca 1 2 -7.53333* .35590 .000 -8.6253 -6.4413
3 5.50000* .35590 .000 4.4080 6.5920
2 1 7.53333* .35590 .000 6.4413 8.6253
3 13.03333* .35590 .000 11.9413 14.1253
3 1 -5.50000* .35590 .000 -6.5920 -4.4080
2 -13.03333* .35590 .000 -14.1253 -11.9413
K 1 2 -.13667* .01018 .000 -.1679 -.1054
3 .11000* .01018 .000 .0788 .1412
2 1 .13667* .01018 .000 .1054 .1679
3 .24667* .01018 .000 .2154 .2779
3 1 -.11000* .01018 .000 -.1412 -.0788
2 -.24667* .01018 .000 -.2779 -.2154
Pav 1 2 -19.83333* 5.63554 .029 -37.1247 -2.5420
3 9.33333 5.63554 .295 -7.9580 26.6247
2 1 19.83333* 5.63554 .029 2.5420 37.1247
3 29.16667* 5.63554 .005 11.8753 46.4580
3 1 -9.33333 5.63554 .295 -26.6247 7.9580
2 -29.16667* 5.63554 .005 -46.4580 -11.8753
*. The mean difference is significant at the 0.05 level.
Appendix 3. Soil texture triangle.

43
Source: Harmonized World Soil Database (version 1.1)
Appendix 4. Five major pH classes for specific agronomic significance.
pH classes are considered here that have specific
agronomic significance: pH < 4.5
Extremely acid soils include Acid Sulfate
Soils (Mangrove soils, cat clays). Do not
drain because by oxidation sulfuric acid
will be produced and pH will drop lower
still.
pH 4.5 – 5.5 Very acid soils suffering often from Al
toxicity. Some crops are tolerant for these
conditions (Tea, Pineapple).
pH 5.5 –7.2 Acid to neutral soils: these are the best pH
conditions for nutrient availability and
suitable for most crops.
pH 7.2 – 8.5 These pH values are indicative of carbonate
rich soils. Depending on the form and

44
concentration of calcium carbonate they
may result in well structured soils which
may however have depth limitations when
the calcium carbonate hardens in an
impermeable layer and chemically forms
less available carbonates affecting nutrient
availability (Phosphorus, Iron).
pH > 8.5 Indicates alkaline soils often highly sodic
(Na reaching toxic levels), badly structured
(columnar structure) and easily dispersed
surface clays.
Source: Harmonized World Soil Database (version 1.1)
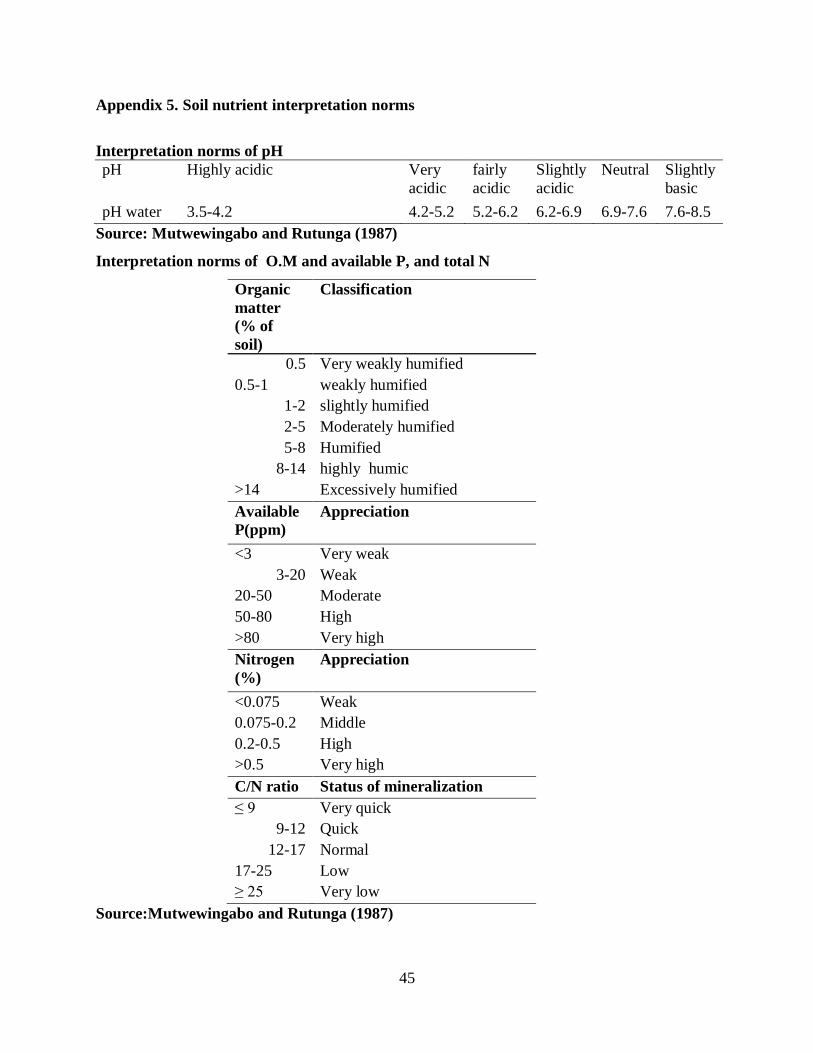
45
Appendix 5. Soil nutrient interpretation norms
Interpretation norms of pH
pH Highly acidic Very
acidic
fairly
acidic
Slightly
acidic
Neutral Slightly
basic
pH water 3.5-4.2 4.2-5.2 5.2-6.2 6.2-6.9 6.9-7.6 7.6-8.5
Source: Mutwewingabo and Rutunga (1987)
Interpretation norms of O.M and available P, and total N
Source:Mutwewingabo and Rutunga (1987)
Organic
matter
(% of
soil)
Classification
0.5 Very weakly humified
0.5-1 weakly humified
1-2 slightly humified
2-5 Moderately humified
5-8 Humified
8-14 highly humic
>14 Excessively humified
Available
P(ppm)
Appreciation
<3 Very weak
3-20 Weak
20-50 Moderate
50-80 High
>80 Very high
Nitrogen
(%)
Appreciation
<0.075 Weak
0.075-0.2 Middle
0.2-0.5 High
>0.5 Very high
C/N ratio Status of mineralization
≤ 9 Very quick
9-12 Quick
12-17 Normal
17-25 Low
≥ 25 Very low
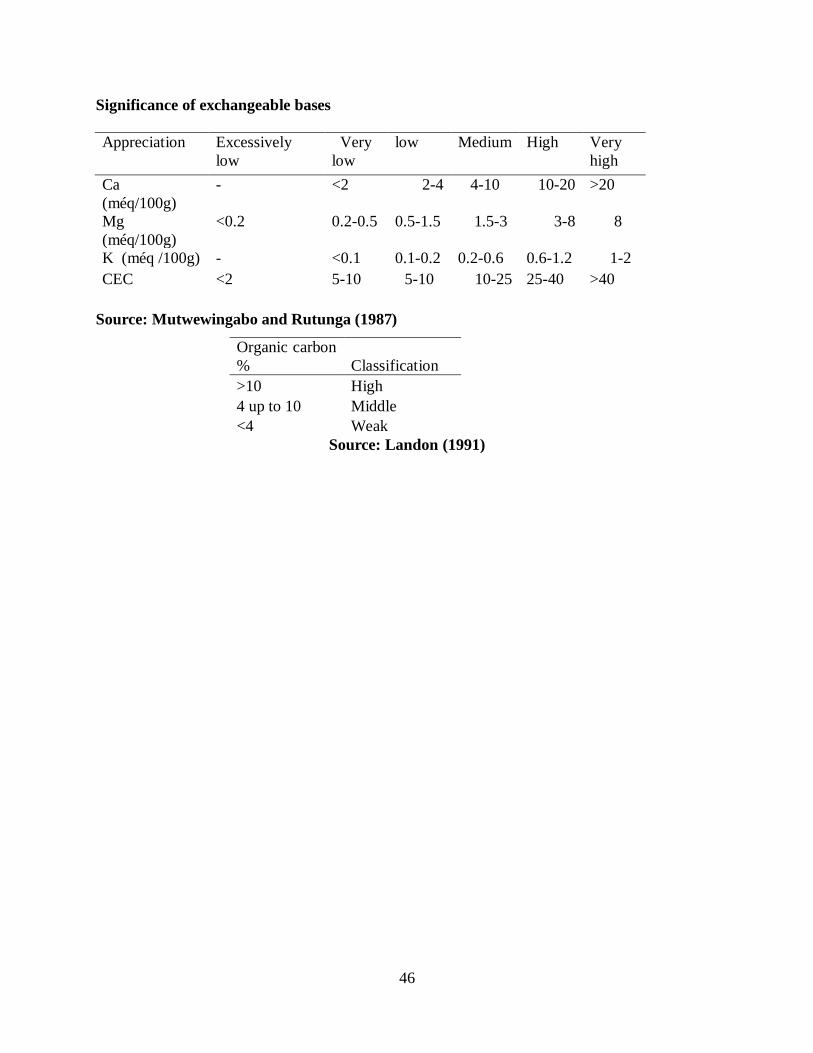
46
Significance of exchangeable bases
Appreciation Excessively
low
Very
low
low Medium High Very
high
Ca
(méq/100g)
- <2 2-4 4-10 10-20 >20
Mg
(méq/100g)
<0.2 0.2-0.5 0.5-1.5 1.5-3 3-8 8
K (méq /100g) - <0.1 0.1-0.2 0.2-0.6 0.6-1.2 1-2
CEC <2 5-10 5-10 10-25 25-40 >40
Source: Mutwewingabo and Rutunga (1987)
Organic carbon
% Classification
>10 High
4 up to 10 Middle
<4 Weak
Source: Landon (1991)


![Some document - Web viewPre-submission. Pre-submission. Pre-submission. EDCTP Application Form [Ref No] Pre-submission. Pre-submission. Pre-submission. CSA Strategic Action](https://static.fdocuments.us/doc/165x107/5a7884c87f8b9a1f128c31ac/some-document-web-viewpre-submission-pre-submission-pre-submission-edctp.jpg)