domestic Violence In Ohio 2015 - Ohio Department Of · The goal of this report is to provide...
41
Alan Wedd, M.S. 2015 This project was supported by Grant No. 2015-BJ-CX-K031, awarded by the Bureau of Justice Statistics, Office of Justice Programs, U.S. Department of Justice. Points of view in this document are those of the author and do not necessarily represent the official position or policies of the U.S. Department of Justice.
Transcript of domestic Violence In Ohio 2015 - Ohio Department Of · The goal of this report is to provide...

Alan Wedd, M.S.
2015
This project was supported by Grant No. 2015-BJ-CX-K031, awarded by the Bureau of Justice Statistics, Office of Justice Programs, U.S. Department of Justice. Points of view in this document are those of the author and do not necessarily represent the official position or policies of the U.S. Department of Justice.

This page intentionally left blank.

2
DOMESTIC VIOLENCE IN OHIO, 2015
Table of Contents & List of Figures Introduction ................................................................................................................................... 4
Overview ................................................................................................................................................................... 4
Data ........................................................................................................................................................................... 5
OIBRS Terminology ................................................................................................................................................. 6
Definition of Domestic Violence .............................................................................................................................. 7
Disclaimers ................................................................................................................................................................ 8
Summary of Findings ................................................................................................................................................ 9
Offenses ........................................................................................................................................ 10 Figure 1: Domestic Violence Victims per 100,000, 2011-2015 .............................................................................. 10
Figure 2: Domestic Violence Rate by County, 2015 ............................................................................................... 11
Figure 3: Change in Domestic Violence Rate Between 2011 and 2015 .................................................................. 12
Figure 4: Domestic Violence Offense Types .......................................................................................................... 13
Figure 5: Domestic Violence Locations .................................................................................................................. 14
Figure 6: Day and Time of Domestic Violence ....................................................................................................... 15
Victims ......................................................................................................................................... 16 Figure 7: Victim and Offender Relationship ........................................................................................................... 16
Figure 8: Percentage of Domestic Violence Victimizations by Sex ........................................................................ 17
Figure 9: Rate of Domestic Violence Victimizations by Sex .................................................................................. 18
Figure 10: Percentage of Domestic Violence Victimizations by Race .................................................................... 19
Figure 11: Rate of Domestic Violence Victimizations by Race .............................................................................. 20
Figure 12: Percentage of Domestic Violence Victimizations by Sex and Race ...................................................... 21
Figure 13: Rate of Domestic Violence Victimizations by Sex and Race ................................................................ 22
Figure 14: Percentage of Domestic Violence Victimizations by Age ..................................................................... 23
Figure 15: Rate of Domestic Violence Victimizations by Age ............................................................................... 24
Figure 16: Percentage of Domestic Violence Victimizations by Age and Sex ....................................................... 25
Figure 17: Rate of Domestic Violence Victimizations by Age and Sex ................................................................. 26
Figure 18: Percentage of Domestic Violence Victimizations by Age and Race ..................................................... 27
Figure 19: Rate of Domestic Violence Victimizations by Age and Race ............................................................... 28
Offenders ..................................................................................................................................... 29 Figure 20: Percentage of Domestic Violence Offenders by Sex ............................................................................. 29
Figure 21: Rate of Domestic Violence Offenders by Sex ....................................................................................... 30
Figure 22: Percentage of Domestic Violence Offenders by Race ........................................................................... 31
Figure 23: Rate of Domestic Violence Offenders by Race ..................................................................................... 32
Figure 24: Percentage of Domestic Violence Offenders by Sex and Race.............................................................. 33
Figure 25: Rate of Domestic Violence Offenders by Sex and Race ........................................................................ 34

3
DOMESTIC VIOLENCE IN OHIO, 2015
Figure 26: Percentage of Domestic Violence Offenders by Age ............................................................................ 35
Figure 27: Rate of Domestic Violence Offenders by Age ....................................................................................... 36
Figure 28: Percentage of Domestic Violence Offenders by Age and Sex ............................................................... 37
Figure 29: Rate of Domestic Violence Offenders by Age and Sex ......................................................................... 38
Figure 30: Percentage of Domestic Violence Offenders by Age and Race ............................................................. 39
Figure 31: Rate of Domestic Violence Offenders by Age and Sex ......................................................................... 40

4
DOMESTIC VIOLENCE IN OHIO, 2015
Introduction Overview Domestic violence is a serious crime that affects tens of thousands of Ohioans every year regardless of age, sex, race, socioeconomic status, education, religious belief, sexual orientation, gender identity, or any other demographic characteristic. Victims of domestic violence experience severe physical and psychological trauma that can affect them for a lifetime, and many victims experience a lifetime of abuse without ever receiving any help. Domestic violence does not just affect individual victims, as family members, friends, co-workers, and communities also suffer harsh and long-lasting consequences. For these reasons and more, it is important for everyone to work together to stop domestic violence.
The Office of Criminal Justice Services (OCJS) helps victims of domestic violence in several different ways. OCJS provides funding through the Edward Byrne Memorial Justice Assistance Grant Program (JAG), the Violence Against Women Act Program (VAWA), and the Family Violence Prevention & Services Act Grant Program (FVPSA) for law enforcement agencies, prosecutors, victim service providers, and other organizations that are dedicated to combatting domestic violence. Additionally, OCJS houses the Family Violence Prevention Center (FVPC), which is an information clearinghouse that supports organizations and individuals working to end family violence. The FVPC helps coordinate the activities of the Ohio Family Violence Prevention Advisory Council, which is a group of statewide domestic and family violence prevention experts. In 2014, the Advisory Council identified a statewide need for detailed data on domestic violence in Ohio, which led to the creation of this report.
The goal of this report is to provide accurate and detailed information about domestic violence in Ohio during 2015. It is hoped that the information in this report will help raise awareness of domestic violence, provide a better understanding of domestic violence in Ohio, and guide policy related to domestic violence. It should be noted that this is only a statistical report; it does not attempt to understand why these incidents occurred, or make recommendations about what should be done to combat domestic violence.

5
DOMESTIC VIOLENCE IN OHIO, 2015
Data Data for this report are taken from the Ohio Incident-Based Reporting System (OIBRS), a
voluntary crime reporting program that enables law enforcement agencies in Ohio to submit crime data directly to the state and federal government. OIBRS contains information about criminal incidents, including details about offenses, offenders, and victims that can be used to better understand crime in Ohio and guide public policy. Data in this report are from 511 law enforcement agencies covering approximately 77.3% of the Ohio population.
It is important to note that this report only contains information on domestic violence incidents reported to law enforcement agencies participating in OIBRS. Many cases of domestic violence are not reported at all, and other cases of domestic violence are reported to agencies that do not participate in OIBRS; this means that the rates presented in this report underestimate the true frequency of domestic violence in Ohio. Despite this limitation, it is important to understand the data from incidents that are reported to law enforcement because it provides meaningful information that can be used to better understand and help prevent domestic violence.

6
DOMESTIC VIOLENCE IN OHIO, 2015
OIBRS Terminology Each incident record in OIBRS can contain information about multiple offenses, victims, and
offenders:
An incident is one or more offenses committed by the same offender, or group of offenders acting in concert, at the same time and place.
An offense is a single crime by one individual (the offender) against another (the victim).
A single incident in OIBRS can have multiple offenders and/or victims. To ensure continuity throughout the report, data for the Offenses and Victims sections reflect the total number of victims, while data for the section on Offenders are based on the total number of offenders.

7
DOMESTIC VIOLENCE IN OHIO, 2015
Definition of Domestic Violence For the purposes of this report, domestic violence is defined in terms of the information
available through OIBRS. Two types of information in the OIBRS database were used to determine if an offense constituted an instance of domestic violence: 1) Information on the type of offense, and 2) the relationship between the offender and victim1.
Offenses occurring in 2015 from the following OIBRS categories were included in this report:
Homicide, including murder and non-negligent manslaughter, negligent manslaughter, justifiable homicide
Forcible Sex Offenses, including forcible rape, forcible sodomy, sexual assault with an object, forcible fondling
Non-forcible Sex Offenses, including incest, and statutory rape Assault, including aggravated assault, simple assault, intimidation Robbery Kidnapping/Abduction
Once offenses from these OIBRS categories were identified, the following offender-victim relationship codes were then used to find domestic violence incidents:
Spouse, common-law spouse, and ex-spouse Parent and stepparent Child, child of boyfriend/girlfriend, and stepchild Sibling and stepsibling Grandparent Grandchild In-law Other family member Boyfriend/girlfriend2 Homosexual relationship
1 These criteria were used in lieu of Ohio state statutes for two reasons: 1) defining domestic violence using these criteria enables other states with incident-based data to replicate this methodology, thereby facilitating comparisons of domestic violence at the state level, and 2) this method captures more instances of domestic violence, leading to a more accurate representation of domestic violence in this report. For example, a homicide involving a boyfriend and girlfriend is considered domestic violence, but it would likely be reported to OIBRS using one of several Ohio Revised Codes (ORCs) for homicide (e.g. 2903.02, 2903.03, 2903.04, etc.) instead of the ORC for domestic violence (e.g. 2919.25) because homicide is the more severe crime. Only looking at the ORC code for domestic violence would not capture this instance of domestic violence. 2 The domestic violence law in Ohio does not apply to individuals in a romantic or sexual relationship, or individuals who are dating or have recently dated. However, the boyfriend/girlfriend relationship code is still included in this analysis for two reasons: 1) to facilitate comparison with other domestic violence reports that include the boyfriend/girlfriend code in their analyses, and 2) to capture instances of cohabitation that would not be captured otherwise since there is no “cohabitation” code in the OIBRS system.

8
DOMESTIC VIOLENCE IN OHIO, 2015
Disclaimers Not all Ohio law enforcement agencies’ data are available through OIBRS because OIBRS is
a voluntary reporting system. For this reason, data are presented as rates and percentages instead of raw numbers. Percentages may not always sum to 100% due to rounding.
The accuracy of these crime statistics is based on the information reported by participating law enforcement agencies. Information in this report may change over time based on updated or new data sent to OIBRS in future crime data submissions.
Some technical aspects of this report (e.g. handling of missing data, confidence intervals) are omitted to make this report accessible for a wider audience; this information is available upon request.

9
DOMESTIC VIOLENCE IN OHIO, 2015
Summary of Findings The rate of domestic violence in Ohio increased by 5.1% from 2011 to 2015.
Though domestic violence occurred more frequently on weekends and during the evenings, it
still happened throughout the week and during all times of day.
Assaults accounted for 94.9% of all domestic violence offenses.
Domestic violence occurred most frequently in residential structures, followed by outside locations.
Intimate partner violence accounted for 33.2% of domestic violence offenses.
Domestic violence victims were most often female, white, and between the ages of 20-34.
Domestic violence offenders were most frequently male, white, and between the ages of 20-
34.
Black individuals between 20 and 34 were victimized at a higher rate than any other group; however, they also offended at a rate that was higher than any other group.

10
DOMESTIC VIOLENCE IN OHIO, 2015
Offenses Figure 1: Domestic Violence Victims per 100,000, 2011-2015
The domestic violence rate increased by 5.1% between 2011 (687.7 victims per 100,000 population) and 2015 (722.9 victims per 100,000 population, Figure 1).
County-level data suggest that 70.1% of counties3 had a domestic violence rate that was less than the statewide average; this indicates that statewide domestic violence rates are driven by large counties with high levels of domestic violence (Figure 2).
Counties with high levels of domestic violence are present throughout the state, suggesting
that domestic violence is not regionally concentrated in Ohio.
Despite the statewide increase in domestic violence, 59.7% of counties4 reported a decrease in the domestic violence rate (Figure 3).
3 Only includes counties with stable and available OIBRS data for 2015. 4 Only includes counties with stable and available OIBRS data from 2011-2015.
0
100
200
300
400
500
600
700
800
900
2011 2012 2013 2014 2015
Vict
imiz
atio
n R
ate
per 1
00,0
00
Year

11
DOMESTIC VIOLENCE IN OHIO, 2015
Figure 2: Domestic Violence Rate by County, 2015

12
DOMESTIC VIOLENCE IN OHIO, 2015
Figure 3: Change in Domestic Violence Rate Between 2011 and 2015
13
DOMESTIC VIOLENCE IN OHIO, 2015
Figure 4: Domestic Violence Offense Types
Assaults accounted for 94.9% of domestic violence offenses (Figure 4).
Most domestic violence offenses were either Simple Assault (51.7%) or Intimidation (37.6%). Aggravated Assaults accounted for an additional 5.5% of all offenses.
Out of the remaining offenses, 0.1% were homicides, 1.1% were kidnapping/abductions,
3.1% were forcible sex offenses, 0.5% were robberies, and 0.3% were non-forcible sex offenses.
0%
10%
20%
30%
40%
50%
60%
Simple Assault Intimidation AggravatedAssault
Other
Perc
enta
ge o
f Vic
tims
Offense Type
14
DOMESTIC VIOLENCE IN OHIO, 2015
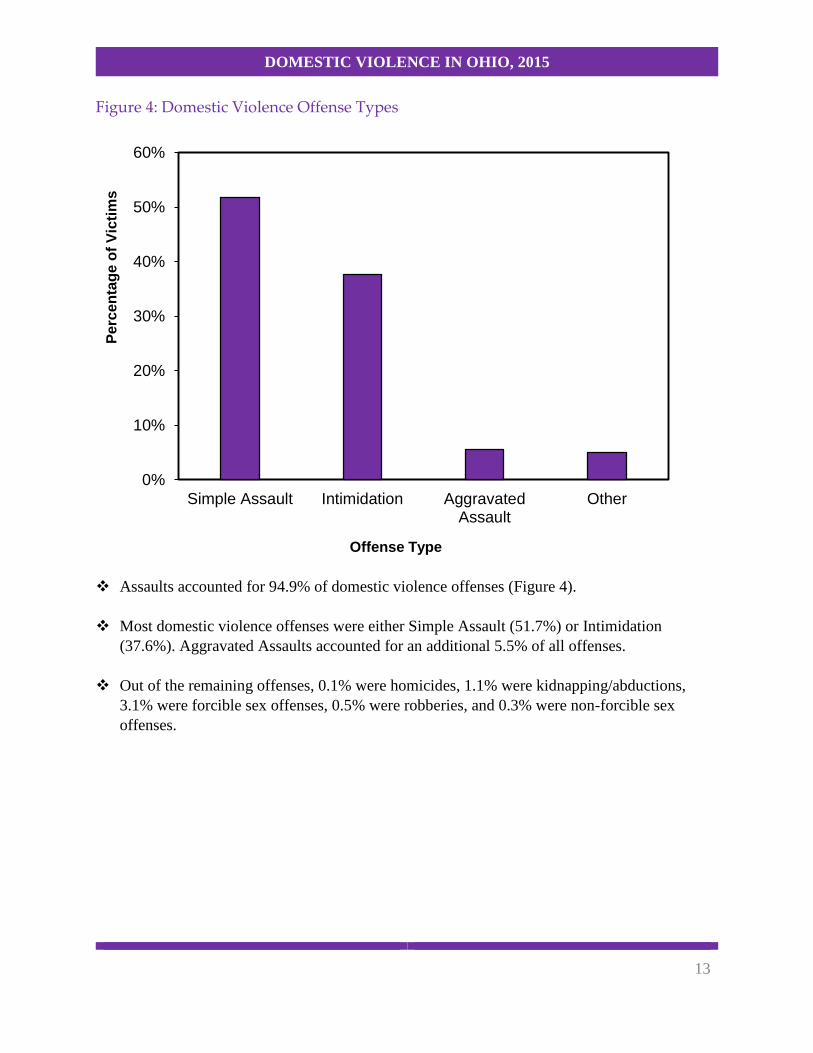
Figure 5: Domestic Violence Locations
Most domestic violence (82.1%) occurred in residential structures (single family homes, multiple dwellings, residential facilities, other residential locations, and garages/sheds, Figure 5).
An additional 11.2% of domestic violence offenses occurred outside, while another 6.6% of domestic violence offenses occurred in other locations such as public access structures, commercial service buildings, and retail establishments.
0%
10%
20%
30%
40%
50%
60%
70%
80%
90%
Residential Structure Outside Other
Perc
enta
ge o
f Vic
tims
Location

15
DOMESTIC VIOLENCE IN OHIO, 2015
Figure 6: Day and Time of Domestic Violence5 Sunday Monday Tuesday Wednesday Thursday Friday Saturday Total
1:00 AM 4.2% 2:00 AM 3.6% 3:00 AM 2.8% 4:00 AM 1.8% 5:00 AM 1.3% 6:00 AM 1.4% 7:00 AM 2.0% 8:00 AM 3.0% 9:00 AM 3.4%
10:00 AM 3.7% 11:00 AM 3.9% 12:00 PM 4.8% 1:00 PM 4.3% 2:00 PM 4.6% 3:00 PM 5.4% 4:00 PM 5.9% 5:00 PM 5.9% 6:00 PM 6.4% 7:00 PM 6.3% 8:00 PM 6.5% 9:00 PM 6.6%
10:00 PM 6.4% 11:00 PM 5.8%
Total 16.6% 13.9% 13.3% 13.5% 13.1% 13.9% 15.7%
Domestic violence occurred most frequently on Sunday (16.6% of all offenses, Figure 6) and Saturday (15.7%); however, there was little difference between the day with the most domestic violence, and the day with the least domestic violence (Thursday accounted for 13.1% of all offenses).
Domestic violence gradually became more frequent over the course of the day. In 2015, it occurred with the lowest frequency at 5 a.m. (1.3% of all offenses), and the highest frequency at 9:00 p.m. (6.6%).
5 For the heatmap in Figure 6, darker segments indicate that more domestic violence occurred during that day/time, while lighter segments indicate that less domestic violence occurred.

16
DOMESTIC VIOLENCE IN OHIO, 2015
Victims Figure 7: Victim and Offender Relationship
Intimate partner violence accounted for more domestic violence than any other relationship type6 (33.2%, Figure 7).
Spouses7 were the victim in 16.8% of domestic violence incidents, while children8 were the victim in 15.4% of incidents.
Parents9 were victimized in 10.5% of domestic violence incidents, and siblings10 were
victimized in an additional 7.1% of domestic violence incidents.
6 For the purposes of this report, a victim was considered an intimate partner if the offender-victim relationship field in OIBRS was either “Boyfriend/Girlfriend” or “Homosexual Relationship.” 7 Including both common law and ex-spouses 8 Including stepchildren and children of boyfriend/girlfriend 9 Including stepparents 10 Including stepsiblings
0%
5%
10%
15%
20%
25%
30%
35%
IntimatePartner
Spouse Child Parent Sibling OtherFamily
Perc
enta
ge o
f Vic
tims
"The victim was the offender's _____________"

17
DOMESTIC VIOLENCE IN OHIO, 2015
Figure 8: Percentage of Domestic Violence Victimizations by Sex
Females accounted for 71.6% of all domestic violence victims, and males accounted for 28.4% of domestic violence victims (Figure 8).
0%
10%
20%
30%
40%
50%
60%
70%
80%
Female Male
Perc
enta
ge o
f Vic
tims
Victim Sex

18
DOMESTIC VIOLENCE IN OHIO, 2015
Figure 9: Rate of Domestic Violence Victimizations by Sex
The victimization rate11 for females (1,011.6 victims per 100,000 population12, Figure 9) was more than twice as high as the victimization rate for males (418.6 victims per 100,000 population).
11 Census data are used throughout the Victim and Offender sections to calculate demographic-specific rates. Since OIBRS data do not cover the entire population of Ohio, Census estimates are multiplied by the percentage of the Ohio population covered by OIBRS (77.3%) to adjust population denominators for rate calculations. This procedure does not account for the specific demographic characteristics of the population covered by OIBRS, as ZIP code level, Census demographic estimates are not yet available for 2015. For that reason, please use caution when interpreting these data. Further analyses are needed to accurately determine which groups are disproportionately affected by domestic violence. 12 Population figures taken from: U.S. Census Bureau, Population Division (2014). Annual State Resident Population Estimates for 6 Race Groups (5 Race Alone Groups and Two or More Races) by Age, Sex, and Hispanic Origin: April 1, 2010 to July 1, 2014. Retrieved 4/29/2016.
0
200
400
600
800
1,000
1,200
Female Male
Vict
imiz
atio
n R
ate
per 1
00,0
00
Victim Sex
19
DOMESTIC VIOLENCE IN OHIO, 2015
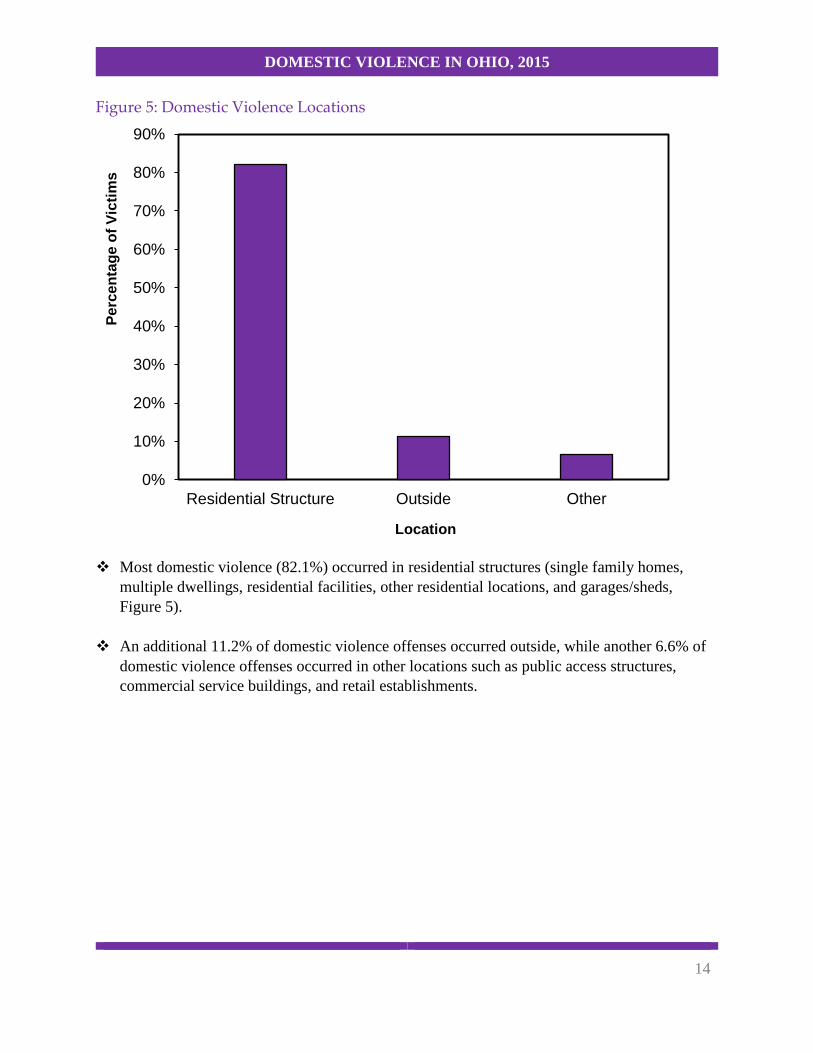
Figure 10: Percentage of Domestic Violence Victimizations by Race
61.2% of domestic violence victims were white, while 38.8% of domestic violence victims were black13 (Figure 10).
13 Total victim counts for all other races in the OIBRS database were too low to generate reliable estimates.
0%
10%
20%
30%
40%
50%
60%
70%
White Black
Perc
enta
ge o
f Vic
tims
Victim Race

20
DOMESTIC VIOLENCE IN OHIO, 2015
Figure 11: Rate of Domestic Violence Victimizations by Race
The domestic violence rate for black victims (2,159.4 per 100,000, Figure 11) was more than four times the domestic violence rate for white victims (519.2 per 100,000).
0
500
1,000
1,500
2,000
2,500
Black White
Vict
imiz
atio
n R
ate
per 1
00,0
00
Victim Race

21
DOMESTIC VIOLENCE IN OHIO, 2015
Figure 12: Percentage of Domestic Violence Victimizations by Sex and Race
Females accounted for a greater percentage of domestic violence victims across both race categories (Figure 12).
White victims were more frequent than black victims across both sex categories.
White females accounted for the largest percentage of domestic violence victims (43.4%), followed by black females (28.4%).
0%
5%
10%
15%
20%
25%
30%
35%
40%
45%
50%
White Black
Perc
enta
ge o
f Vic
tims
Victim Race
Male Female
22
DOMESTIC VIOLENCE IN OHIO, 2015
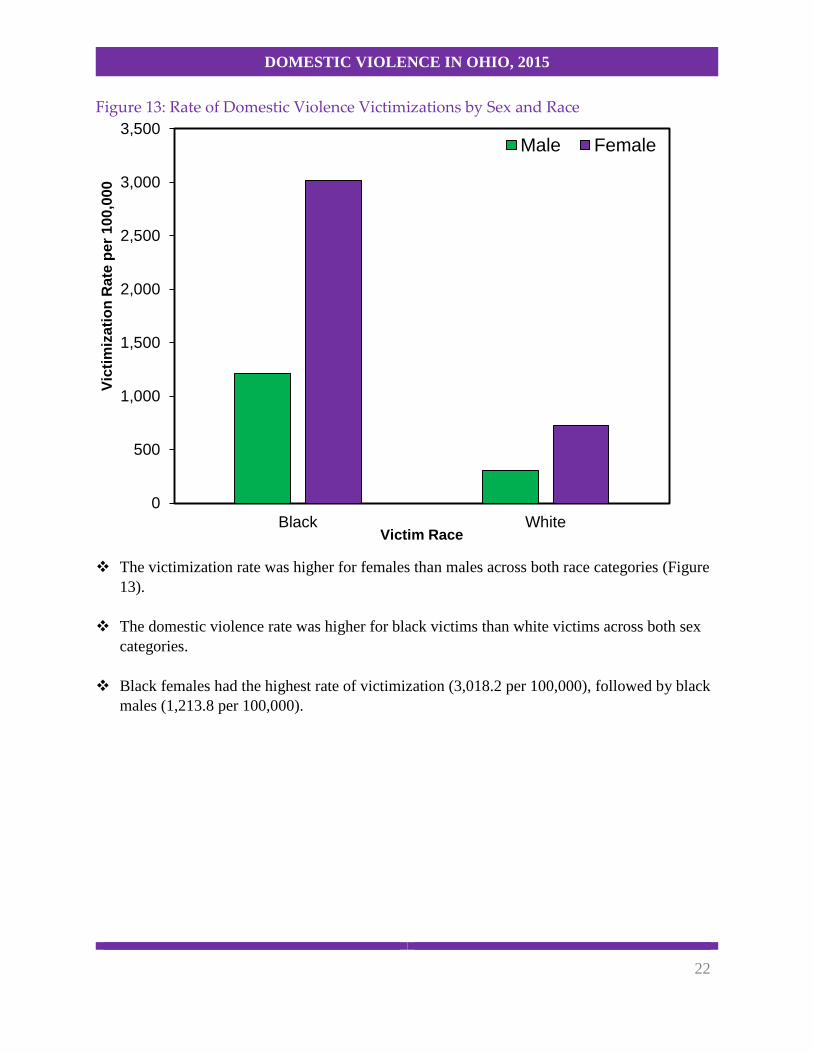
Figure 13: Rate of Domestic Violence Victimizations by Sex and Race
The victimization rate was higher for females than males across both race categories (Figure 13).
The domestic violence rate was higher for black victims than white victims across both sex categories.
Black females had the highest rate of victimization (3,018.2 per 100,000), followed by black
males (1,213.8 per 100,000).
0
500
1,000
1,500
2,000
2,500
3,000
3,500
Black White
Vict
imiz
atio
n R
ate
per 1
00,0
00
Victim Race
Male Female

23
DOMESTIC VIOLENCE IN OHIO, 2015
Figure 14: Percentage of Domestic Violence Victimizations by Age
The percentage of domestic violence victims increased from the “younger than 20” age range (24.2%) to the 20-34 age range (40.1%); it then decreased across the 35-49 (23.8%) and “older than 49” (12.0%) age ranges (Figure 14).
0%
5%
10%
15%
20%
25%
30%
35%
40%
45%
Younger than 20 20-34 35-49 Older than 49
Perc
enta
ge o
f Vic
tims
Victim Age

24
DOMESTIC VIOLENCE IN OHIO, 2015
Figure 15: Rate of Domestic Violence Victimizations by Age
The victimization rate was highest for persons between 20 and 34 years of age (1,489.4 per 100,000, Figure 15).
The next highest victimization rate was for individuals between 35-49 years of age (925.1 per 100,000), followed by individuals younger than 20 years of age (689.9 per 100,000).
0
200
400
600
800
1,000
1,200
1,400
1,600
Younger than 20 20-34 35-49 Older than 49
Vict
imiz
atio
n R
ate
per 1
00,0
00
Victim Age

25
DOMESTIC VIOLENCE IN OHIO, 2015
Figure 16: Percentage of Domestic Violence Victimizations by Age and Sex
Females accounted for a greater percentage of domestic violence victims than males across all age ranges (Figure 16).
The percentage of female domestic violence victims declined across each age range after the ages of 20-34.
The percentage of male domestic violence victims decreased across all age ranges, from
9.8% in the “younger than 20” range to 4.5% in the 50+ age range.
0%
5%
10%
15%
20%
25%
30%
35%
Younger than 20 20-34 35-49 Older than 49
Perc
enta
ge o
f Vic
tims
Victim Age
Male Female

26
DOMESTIC VIOLENCE IN OHIO, 2015
Figure 17: Rate of Domestic Violence Victimizations by Age and Sex
Females were victimized at higher rates than males across all age ranges (Figure 17).
Females between the ages of 20-34 had a higher rate of victimization than any other group (2,406.2 per 100,000). Females between the ages of 35-49 were the next most frequently victimized group (1,350.3 per 100,000).
Both males and females experienced the highest rate of domestic violence victimization
between the ages of 20 and 30; however, the second highest victimization rate for males occurred in the “younger than 20” age group, while the second highest victimization rate for females occurred between the ages of 35-49.
0
500
1,000
1,500
2,000
2,500
3,000
Younger than 20 20-34 35-49 Older than 49
Vict
imiz
atio
n R
ate
per 1
00,0
00
Victim Age
Male Female

27
DOMESTIC VIOLENCE IN OHIO, 2015
Figure 18: Percentage of Domestic Violence Victimizations by Age and Race
White victims were more frequent than black victims across all age ranges (Figure 18).
Individuals aged 20-34 accounted for the highest percentage of victims across both race categories.
The second most frequent age range for victimization was 35-49 for white victims, and
“younger than 20” for black victims.
0%
5%
10%
15%
20%
25%
Younger than 20 20-34 35-49 Older than 49
Perc
enta
ge o
f Vic
tims
Victim Age
White Black

28
DOMESTIC VIOLENCE IN OHIO, 2015
Figure 19: Rate of Domestic Violence Victimizations by Age and Race
The domestic violence rate was higher for black victims than white victims across all age ranges (Figure 19).
The highest rates of victimization for both race groups occurred between the ages of 20-34.
Black individuals between 20 and 34 were victimized at a higher rate than any other group included in this report (4,472.5 per 100,000). The second highest victimization rate was for black individuals between the ages of 35 and 49 (2,381.8 per 100,000).
0
500
1,000
1,500
2,000
2,500
3,000
3,500
4,000
4,500
5,000
Younger than 20 20-34 35-49 Older than 49
Vict
imiz
atio
n R
ate
per 1
00,0
00
Victim Age
White Black

29
DOMESTIC VIOLENCE IN OHIO, 2015
Offenders Figure 20: Percentage of Domestic Violence Offenders by Sex
Males accounted for 72.0% of domestic violence offenders, while females accounted for 28.0% of domestic violence offenders (Figure 20).
0%
10%
20%
30%
40%
50%
60%
70%
80%
Male Female
Perc
enta
ge o
f Offe
nder
s
Offender Sex
30
DOMESTIC VIOLENCE IN OHIO, 2015
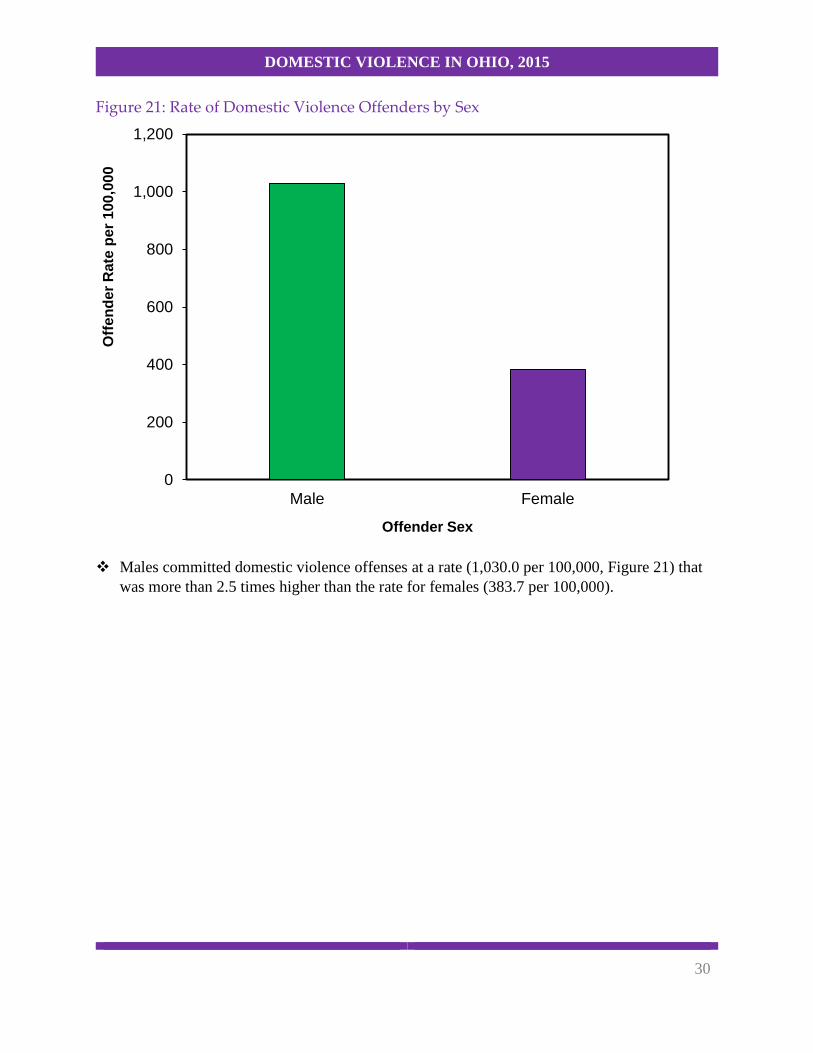
Figure 21: Rate of Domestic Violence Offenders by Sex
Males committed domestic violence offenses at a rate (1,030.0 per 100,000, Figure 21) that was more than 2.5 times higher than the rate for females (383.7 per 100,000).
0
200
400
600
800
1,000
1,200
Male Female
Offe
nder
Rat
e pe
r 100
,000
Offender Sex

31
DOMESTIC VIOLENCE IN OHIO, 2015
Figure 22: Percentage of Domestic Violence Offenders by Race
56.3% of all offenders were white, while 43.7% of all offenders were black (Figure 22).
0%
10%
20%
30%
40%
50%
60%
White Black
Perc
enta
ge o
f Offe
nder
s
Offender Race

32
DOMESTIC VIOLENCE IN OHIO, 2015
Figure 23: Rate of Domestic Violence Offenders by Race
The rate for black offenders (2,362.9 per 100,000, Figure 23) was more than five times higher than the rate for white offenders (464.0 per 100,000).
0
500
1,000
1,500
2,000
2,500
Black White
Offe
nder
Rat
e pe
r 100
,000
Offender Race
33
DOMESTIC VIOLENCE IN OHIO, 2015
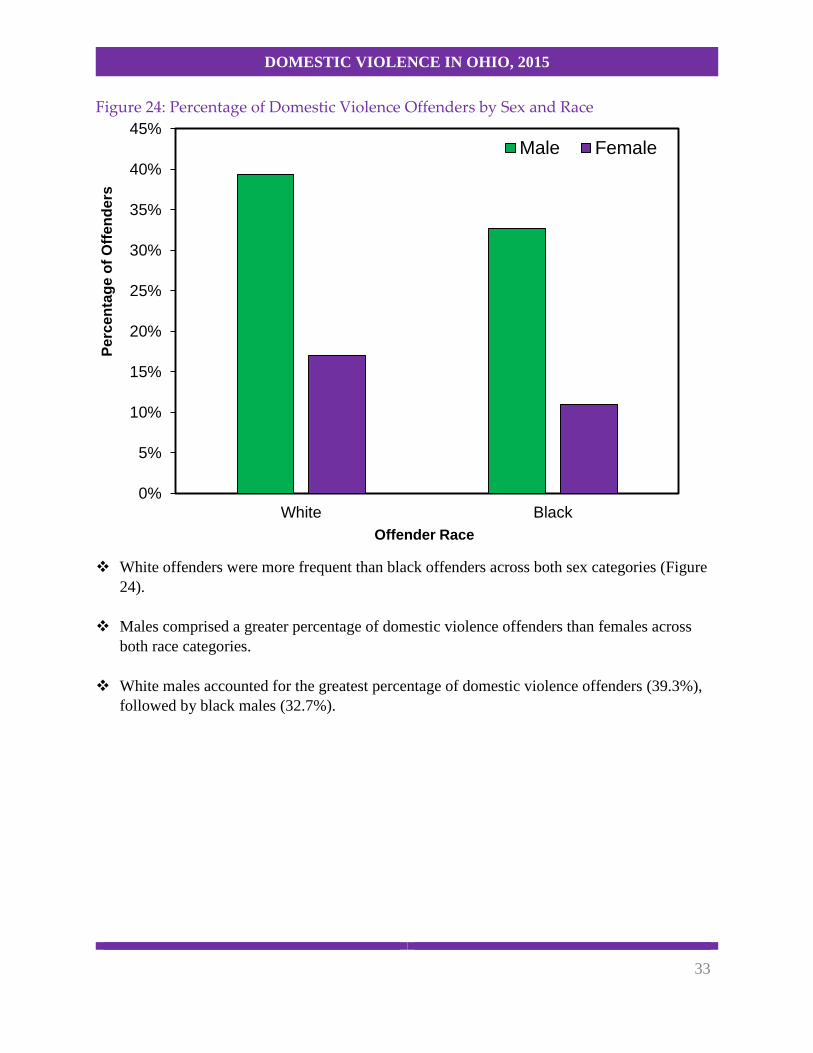
Figure 24: Percentage of Domestic Violence Offenders by Sex and Race
White offenders were more frequent than black offenders across both sex categories (Figure 24).
Males comprised a greater percentage of domestic violence offenders than females across both race categories.
White males accounted for the greatest percentage of domestic violence offenders (39.3%),
followed by black males (32.7%).
0%
5%
10%
15%
20%
25%
30%
35%
40%
45%
White Black
Perc
enta
ge o
f Offe
nder
s
Offender Race
Male Female

34
DOMESTIC VIOLENCE IN OHIO, 2015
Figure 25: Rate of Domestic Violence Offenders by Sex and Race
The rate for black offenders was higher than the rate for white offenders across both sexes (Figure 25).
Males had higher rates of offending than females across both race categories.
Black males had the highest offense rate (1,925.4 per 100,000), followed by black females (1,133.5 per 100,000).
0
500
1,000
1,500
2,000
2,500
Black White
Offe
nder
Rat
e pe
r 100
,000
Offender Race
Male Female

35
DOMESTIC VIOLENCE IN OHIO, 2015
Figure 26: Percentage of Domestic Violence Offenders by Age
The age trend for domestic violence offenders mirrored the age trend for domestic violence victims. The percentage of domestic violence offenders peaked between the ages of 20 and 34, then decreased across subsequent age ranges (Figure 26).
Individuals between the ages of 20 and 34 comprised the majority of domestic violence offenders (49.6%), followed by individuals between the ages of 35 and 49 (26.3%).
0%
10%
20%
30%
40%
50%
60%
Younger than20
20-34 35-49 Older than 49
Perc
enta
ge o
f Offe
nder
s
Offender Age

36
DOMESTIC VIOLENCE IN OHIO, 2015
Figure 27: Rate of Domestic Violence Offenders by Age
The highest rate of offending was for individuals between the ages of 20 and 34 (1,765.9 per 100,000, Figure 27), followed by individuals between the ages of 35 and 49 (978.0 per 100,000).
0
200
400
600
800
1,000
1,200
1,400
1,600
1,800
2,000
Younger than20
20-34 35-49 Older than 49
Offe
nder
Rat
e pe
r 100
,000
Offender Age
37
DOMESTIC VIOLENCE IN OHIO, 2015
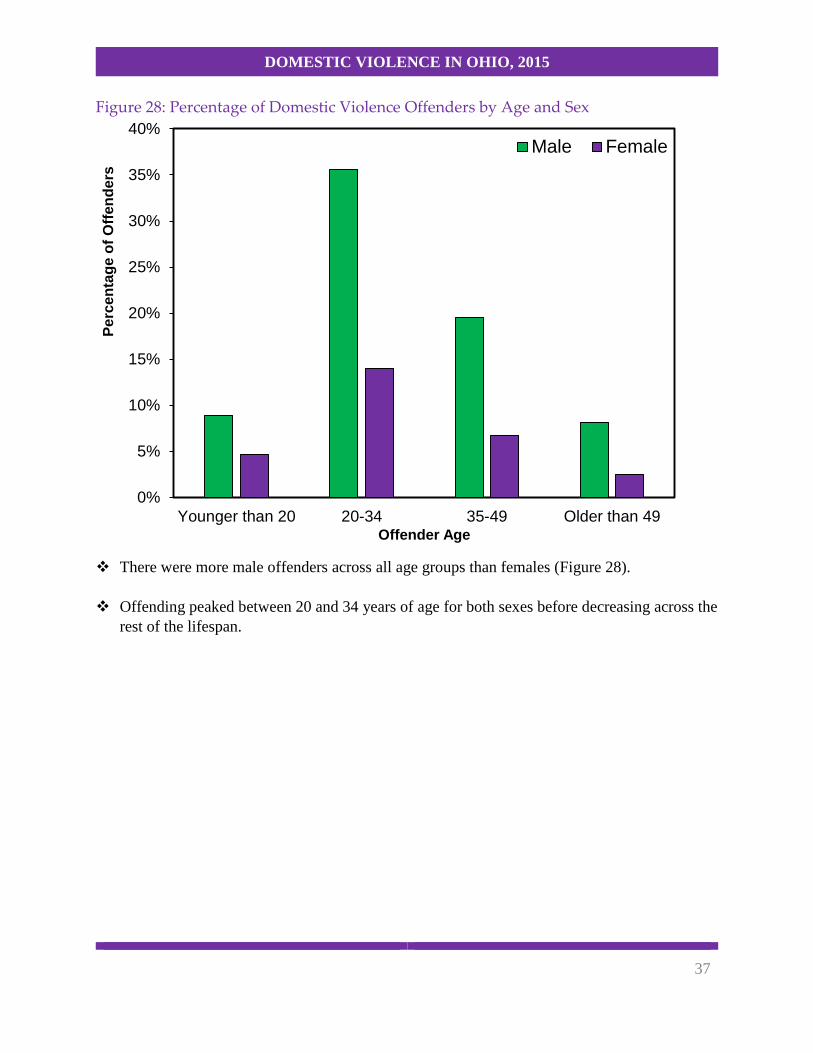
Figure 28: Percentage of Domestic Violence Offenders by Age and Sex
There were more male offenders across all age groups than females (Figure 28).
Offending peaked between 20 and 34 years of age for both sexes before decreasing across the rest of the lifespan.
0%
5%
10%
15%
20%
25%
30%
35%
40%
Younger than 20 20-34 35-49 Older than 49
Perc
enta
ge o
f Offe
nder
s
Offender Age
Male Female

38
DOMESTIC VIOLENCE IN OHIO, 2015
Figure 29: Rate of Domestic Violence Offenders by Age and Sex
The rate of offending was higher for males compared to females across all age ranges (Figure 29).
Offender rates for both sexes peaked between 20 and 34 years of age before decreasing across the rest of the lifespan.
Males between the ages of 20 and 34 had the highest offense rate (2,521.2 per 100,000),
followed by males between the ages of 35 and 49 (1,461.4 per 100,000).
0
500
1,000
1,500
2,000
2,500
3,000
Younger than 20 20-34 35-49 Older than 49
Offe
nder
Rat
e pe
r 100
,000
Offender Age
Male Female

39
DOMESTIC VIOLENCE IN OHIO, 2015
Figure 30: Percentage of Domestic Violence Offenders by Age and Race
White offenders were more frequent than black offenders across all age ranges (Figure 30).
For both race categories, the frequency of offending was highest between ages 20 and 34, followed by ages 35 through 49.
0%
5%
10%
15%
20%
25%
30%
Younger than 20 20-34 35-49 Older than 49
Perc
enta
ge o
f Offe
nder
s
Offender Age
White Black

40
DOMESTIC VIOLENCE IN OHIO, 2015
Figure 31: Rate of Domestic Violence Offenders by Age and Sex
The rate for black offenders was higher than the rate for white offenders across all age categories (Figure 31).
The offense rate was highest between the ages of 20 and 34 for both race categories.
Black individuals between the ages of 20 and 34 offended at the highest rate (5,698.9 per 100,000), followed by black individuals between the ages of 35 and 49 (2,979.9 per 100,000).
0
1,000
2,000
3,000
4,000
5,000
6,000
Younger than 20 20-34 35-49 Older than 49
Offe
nder
Rat
e pe
r 100
,000
Offender Age
White Black