Domestic Payments Gateway to Financial Inclusion? · Domestic Payments—Gateway to Financial...
24
Domestic Payments—Gateway to Financial Inclusion? Rodger Voorhies, Director Financial Services for the Poor Survey Data from 11 African Countries March 1, 2013
Transcript of Domestic Payments Gateway to Financial Inclusion? · Domestic Payments—Gateway to Financial...

Domestic Payments—Gateway to
Financial Inclusion?
Rodger Voorhies, Director
Financial Services for the Poor
Survey Data from 11 African Countries
March 1, 2013

We believe effective financial services for poor
people will reduce poverty
© 2013 Bill & Melinda Gates Foundation | 2
Poverty will be reduced
More people
move out of
poverty faster
Fewer
people fall
into poverty
… leading to reductions in poverty
Increased access to financial services …
… could potentially produce the following positive outcomes ...
Distribute risks over wider networks e.g., reach out to distant family and friends in an emergency through digital payments
Enable investments e.g., increased investment in farm productivity due to reduced cost of borrowing and time spent acquiring credit
Reduce direct costs of financial transactions e.g., reduced time and cost for clients to access services
Connect to the wider economy e.g., small business links efficiently to distant customers and suppliers through digital payments
Ability to efficiently
move money
to/from peers
Ability to efficiently
move money
to/from institutions
Access to better
value storage and
savings options
Access to better
credit and
insurance options
Value Proposition to the Poor
© 2013 Bill & Melinda Gates Foundation | 3
Customer Activation
Distribution Payments Front-End
Payments Back-End
Integration Products Analytics
© 2013 Bill & Melinda Gates Foundation | 3
What If: We could turn a 30 day sign up process into 30 seconds?
What If: Everyone was an agent?
What If: Anyone with a phone could send or receive money?
What If: Payment processing was digital and close to zero in cost?
What If: You could send money to any person in the world?
What If: Every mobile phone came with a savings account and insurance?
What If: Assessing risk for a billion new customers was cost-effective?
Current reality: the "jalopy-led" model of
financial inclusion?
© 2013 Bill & Melinda Gates Foundation | 4

© 2013 Bill & Melinda Gates Foundation | 5
>0.4
0.3
0.2
3,250 3,000 1,000 750 500 250 0 3,750 4,000 8,550 Electronic credit transfer, volume
Millions
0
0.1
3,500
Transactional costs per digital credit transfer USD
Example analysis—both scale and operational
effectiveness are essential to reach low costs
Minimum scale
needed
0.04
Operational
improvement
potential
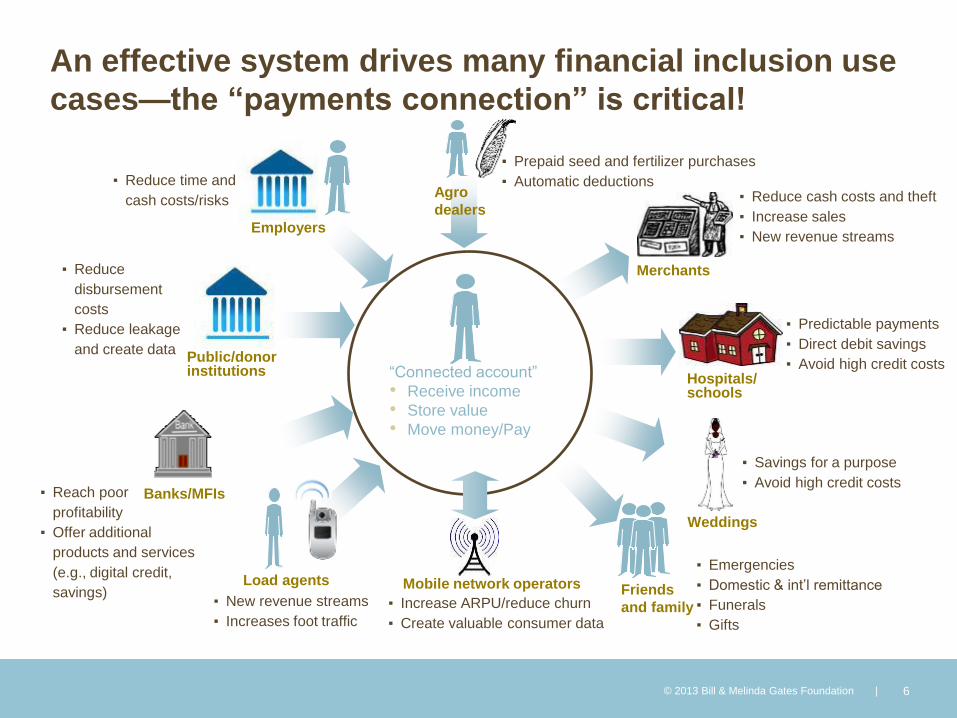
An effective system drives many financial inclusion use
cases—the “payments connection” is critical!
© 2013 Bill & Melinda Gates Foundation | 6
Public/donor institutions
Employers
Load agents Mobile network operators
Hospitals/ schools
Weddings
Agro
dealers
Merchants
Banks/MFIs
“Connected account”
• Receive income
• Store value
• Move money/Pay
▪ Emergencies
▪ Domestic & int’l remittance
▪ Funerals
▪ Gifts
▪ Savings for a purpose
▪ Avoid high credit costs
▪ Predictable payments
▪ Direct debit savings
▪ Avoid high credit costs
▪ Reduce cash costs and theft
▪ Increase sales
▪ New revenue streams
▪ Prepaid seed and fertilizer purchases
▪ Automatic deductions ▪ Reduce time and
cash costs/risks
▪ Reduce
disbursement
costs
▪ Reduce leakage
and create data
▪ Increase ARPU/reduce churn
▪ Create valuable consumer data
▪ New revenue streams
▪ Increases foot traffic
▪ Reach poor
profitability
▪ Offer additional
products and services
(e.g., digital credit,
savings) Friends
and family
Payment behavior survey methodology
Gallup World Poll of 1,000 adults (2,450 India) in each of 11 African and 7
South Asian countries (nationally representative, random walk)
o Botswana, the Democratic Republic of the Congo, Kenya, Mali, Nigeria,
Rwanda, Sierra Leone, South Africa, Tanzania, Uganda, and Zambia
o Afghanistan, Bangladesh, India, Indonesia, Nepal, Pakistan, and Sri Lanka
Transactions occurring in the last 30 days; payments to/from distant counter
parties (i.e., in “different areas or cities” in the same country)
Domestic money transfers, payments for goods, international remittances,
government and wage payments, and utilities and other bills
© 2013 Bill & Melinda Gates Foundation | 7
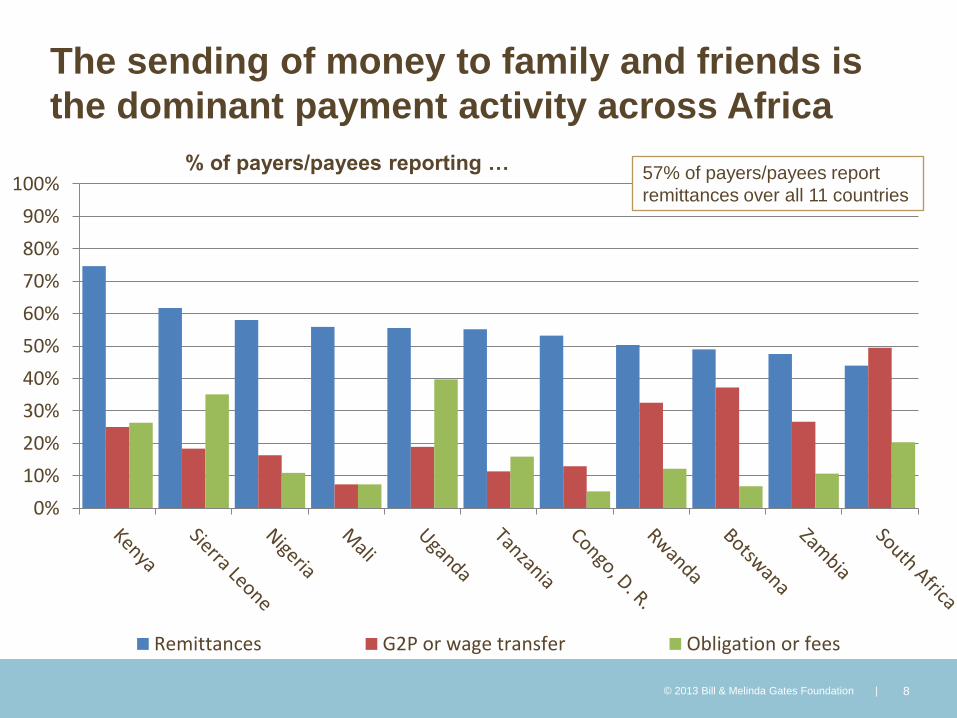
The sending of money to family and friends is
the dominant payment activity across Africa
© 2013 Bill & Melinda Gates Foundation | 8
% of payers/payees reporting …
0%
10%
20%
30%
40%
50%
60%
70%
80%
90%
100%
Remittances G2P or wage transfer Obligation or fees
57% of payers/payees report
remittances over all 11 countries

Broader reach: domestic remittances touch six times as many more
people than international remittances and are three times the
volume
© 2013 Bill & Melinda Gates Foundation | 9
Botswana (29.0%)
Congo, D. R. (20.6%)
Kenya (56.7%)
Mali (15.2%)
Nigeria (32.0%)
Rwanda (12.4%)
Sierra Leone
(36.9%)
South Africa (30.2%)
Tanzania (24.3%)
Uganda (29.4%)
Zambia (17.8%)
Not participating (69.9%)
Not participating (95.8%)
Domestic remittances touch
30.1% of population
Foreign remittances touch
4.8% of population

© 2013 Bill & Melinda Gates Foundation | 10
Channels Used To Send Money
How did you send this money?% by country
Total = population-weighted average* Less than 10% of respondents in these countries were asked this question
43
7
26 28 29 30
47 51 55
83 83 89
26
2
50 47
2 6
24
44
6
12 96
10
2017
5
24 39
3 8 521
90
3 8
6860
6 5 3 11 2
0
10
20
30
40
50
60
70
80
90
100
Cash (sent by bus or through someone else) Transfer from bank or financial institution
Money transfer service (e.g. Western Union) Mobile phone money transfer
Other Don't know/ Refused
Senders from bottom 40% of income:
• Bank senders, 8%
• Mobile senders, 21%
Different market types include the poor at different
rates: mobile payments are more inclusive than bank-
based

Comparison of market overviews for SSA and
South Asia and Indonesia
© 2013 Bill & Melinda Gates Foundation | 11
47%
31%
13%
9%
Sub-Sahara Africa
52%
33%
11%
4%
Made no transactions
Only informal cashpayments
Both electronic and cashpayments
Only non-cash (electronic)payments
South Asia and Indonesia

Differences in market overview among different
income groups between SSA and SA&I—draft
© 2013 Bill & Melinda Gates Foundation | 12
53% 61%
55% 56% 51% 50% 54%
45% 45% 39%
37% 30%
35% 30%
36% 34%
31%
28% 27%
27%
7% 5% 7% 9% 10%
9% 13%
17% 18% 23%
3% 4%
6%
3%
8%
3%
10% 10% 11%
0%
20%
40%
60%
80%
100%

Conclusions For policy makers
Domestic remittances should be higher on the development agenda in Africa because:
o They touch so many people (4.5 times as many as international)
o They reach the poor (1.7 times as often as international)
o Large flows may be good for economy (11% of GDP across 11 economies)
o Many are in cash—major pain point, and makes them a good inclusion “gateway”
The mobile players should be allowed to contest the payment space
o The poor don’t use banks for remittance services, but do use mobile
For market players
The market for payment services is large in Africa:
o 134M people sent and received payments in 11 countries in previous 30 days; 79M in cash
(should be easy to beat!)
o $134 Bn received annually in domestic remittances alone (is biggest use case in most markets)
o Market could be bigger if growth of remittances in Kenya after M-PESA is indicative
Senders tend to be richer and urban, work in salaried office jobs; Receivers are more evenly spread
over income, education, employment, and geography
SMEs are key group as they drive value chain adoption to “close the e-loop”
© 2013 Bill & Melinda Gates Foundation | 13
Thank You
© 2013 Bill & Melinda Gates Foundation. All Rights Reserved. Bill & Melinda Gates Foundation is a registered trademark in the United States and other countries.
Appendix
© 2013 Bill & Melinda Gates Foundation | 15

Example analysis—digital channels are cheapest and
have smallest cross-country variance
© 2013 Bill & Melinda Gates Foundation | 16
ATM
6.5 2.0 1.5 1.0 0.5 0
Branch
Call
center
Digital
Weighted
average
USD
Credit transfer transaction costs by channel
Min Max
0.16 0.04 0.30
0.43 0.11 4.00
4.0
0.75 0.40 1.30
0.61 0.30 0.90
2.36 1.00 6.50
0.17 0.05 0.20
Source: McKinsey Global Payments Map 2012 (2010 data)

Transactional frequency and size among rural
households in Kenya
© 2013 Bill & Melinda Gates Foundation | 17

Dynamic response? Incidence of remittances in Kenya
before and after M-PESA—FinScope 2006 and 2009
© 2013 Bill & Melinda Gates Foundation | 18
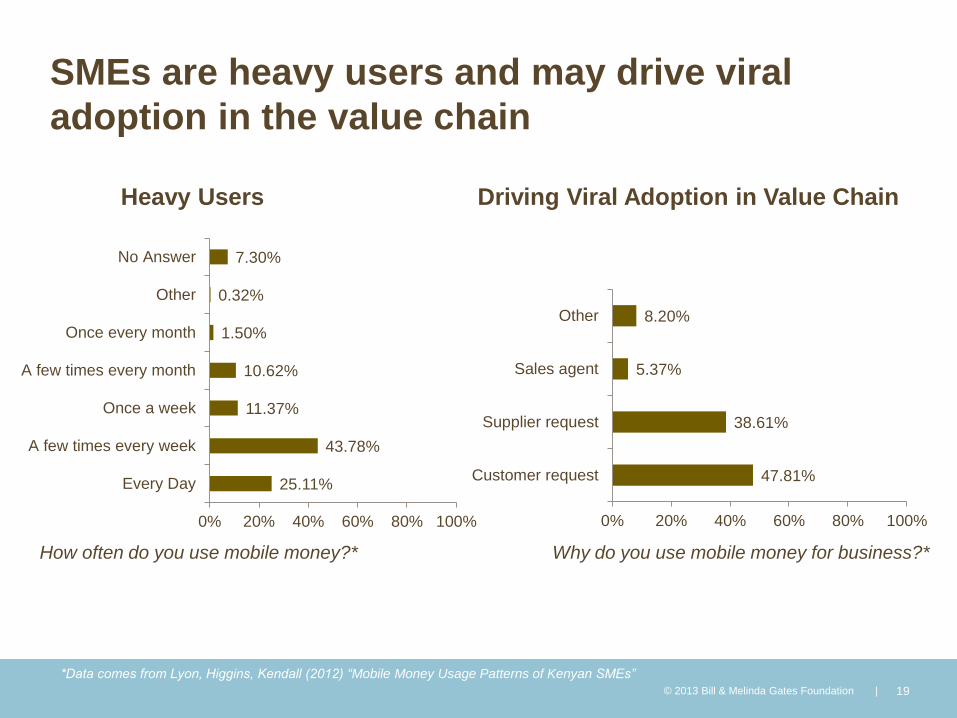
SMEs are heavy users and may drive viral
adoption in the value chain
© 2013 Bill & Melinda Gates Foundation | 19
25.11%
43.78%
11.37%
10.62%
1.50%
0.32%
7.30%
0% 20% 40% 60% 80% 100%
Every Day
A few times every week
Once a week
A few times every month
Once every month
Other
No Answer
47.81%
38.61%
5.37%
8.20%
0% 20% 40% 60% 80% 100%
Customer request
Supplier request
Sales agent
Other
Why do you use mobile money for business?* How often do you use mobile money?*
*Data comes from Lyon, Higgins, Kendall (2012) “Mobile Money Usage Patterns of Kenyan SMEs”
Heavy Users Driving Viral Adoption in Value Chain

Remittance sending behavior tends to increase with
income, receiving behavior is less correlated with
income
© 2013 Bill & Melinda Gates Foundation | 20
11% 14% 2%
7% 3%
8%
84% 71%
0%
25%
50%
75%
100%
Less than $2/day More than $2/day
21% 18%
2% 6% 4%
11%
73% 66%
0%
25%
50%
75%
100%
Less than $2/day More than $2/day
No money received
Receivedelectronically
Receivedelectronically andin cash/person
Received incash/person only
Receiving Sending

Women are not just remittance receivers, they
are active senders too
© 2013 Bill & Melinda Gates Foundation | 21
19 21
3 3
6 6
72 70
0
10
20
30
40
50
60
70
80
90
100
Men Women
12 11
4 3
5 3
79 82
0
10
20
30
40
50
60
70
80
90
100
Men Women
Receiving Sending

Deeper reach: domestic remittances receivers are more often poor
or in agriculture than are international remittance receivers
© 2013 Bill & Melinda Gates Foundation | 22
0%
10%
20%
30%
40%
50%
60%
70%
80%
90%
100%
Poor In Agriculture Women Rural Residents
% domestic remittance recievers % foreign remittance recievers

Sending behavior is more correlated with white collar, educated,
formal, employed full-time, receiving is more evenly distributed
© 2013 Bill & Melinda Gates Foundation | 23
0%
10%
20%
30%
40%
50%
Employed fulltime
Self employed,part time,
unemployed
0%
10%
20%
30%
40%
50%
Employed full time Self employed,part time,
unemployed
Receiving Sending
11 13 18 1 6 14
2 7
19
86 74
50
0102030405060708090
100
Primaryeducation
Secondaryeducation
Tertiaryeducation
21 20 12
2 5 10
3 10 14
74 66 64
0102030405060708090
100
Primaryeducation
Secondaryeducation
Tertiaryeducation

The market for better electronic payments is large: 134M
adults in 30 days, and not well-served; currently, it's
mostly in cash
© 2013 Bill & Melinda Gates Foundation | 24
Non-cash payments: 23M adults
9%
Cash and Non-Cash: 33M adults
13%
Only Cash payments: 79M adults
31%
No payments: 118M adults 47%
Conducted some form of distant payment to/from family and friends, government, or other formal
counterparty in the past 30 days; non-cash implies none of their reported payments were in cash