
Domestic heat demand study
26
Domestic heat demand study July 2020 Robert Sansom (Vendura Ltd) for Energy Systems Catapult REV2 – July 2020
Transcript of Domestic heat demand study

Domestic heat demand studyJuly 2020
Robert Sansom (Vendura Ltd) for Energy Systems Catapult
REV2 – July 2020

March 2019 2
CONTENTS
1. Executive summary
2. Introduction and process
3. UK domestic heat demand
4. Population and household projections
5. Housing insulation pathways
6. Daily temperature scenarios
7. Climate change adjustment
8. UK domestic heat scenarios
9. Climate change and peak heat demand
10. UK domestic cooling scenarios
11. Heating and cooling scenarios
12. Conclusions
13. References

March 2019 3
EXECUTIVE SUMMARY
Energy Systems Catapult commissioned a domestic heat study in 2017 (2017 Heat Study) [1]. The objective was to review and update the data
and assumptions incorporated in DECC’s 2050 Pathways report [2] for domestic heat and cooling for the period to 2050. These data and
assumptions are commonly used to support analysis but had not been reviewed or updated since publication in 2010. The study identified that
the revised projections of space heat were higher but were mostly offset by lower projections of water heat. The study also created insulation
pathways for UK housing to 2050 and a number of sensitivities including climate change adjustments based on UK Climate Projection 2009
(UKCP09) data. These adjustments examined the impact on heat demand and cooling. Finally the study presented revised heat and cooling
pathways to 2050. It concluded that space heat demand reductions are substantial and should be incorporated in design strategies. In terms of
cooling the study concluded that the prospective increase in summer temperatures from climate change will require consideration to be given to
household cooling with parts of the UK affected more than others. This could include design measures to keep buildings cool as well as the
installation of ventilation and air conditioning.
This study is an update to the 2017 Heat Study and includes the latest data. It also extends the study term from 2050 to 2100. This is because
although 2050 is the target date for the legislated reductions in the UK’s greenhouse gas emissions to be achieved, it is also important that the
strategies for delivering those reductions can be tested for their suitability for the period beyond. This is especially important when considering
climate change impacts which might result in continued reductions in space heat demand due to rising winter temperatures but also an increase
in building cooling to address rising summer temperatures. In 2018 UKCP09 was updated with UKCP18 and the results have been incorporated
here.
The updated heat demand scenarios are comparable to those from the 2017 Heat Study except with slightly higher water heat demand but offset
by lower space heat demand. Space heat demand continues to decline beyond 2050 as a result of climate induced temperature increases and UK
housing stock improvements. Water heat is not expected to change very much but as a proportion of total heat demand it becomes more
significant as space heat falls, particularly for the period beyond 2050. UKCP18 has stated that climate change will mean that in the future cold
weather events will be less cold. This will have important consequences for system capacity. So far the assumption has been that cold weather
events are independent of climate change. If this is no longer the case then there is scope to adjust design strategies accordingly resulting in
potential cost savings in infrastructure and other assets as well as implications for heating technology. This warrants further investigation.
UKCP18 has identified that climate change will result in a higher frequency of hot summers with temperature increases up to 6°C in the south of
the UK by 2080 and with higher temperatures in large towns and cities due to the urban heat island effect. As shown in the 2017 Heat Study this
will result in an increase in the demand for household cooling which could be met by passive measures, e.g. building insulation, shading
ventilation but also with air-conditioning. Projections of cooling energy demand indicate that they will be much less than heat and the impact on
energy demand is not significant.

March 2019 4
INTRODUCTION AND PROCESS
Each year BEIS publishes the Digest of UK Energy Statistics, referred to
as “Dukes”. This provides a detailed overview of the UK energy sector
for the previous year and is supported by a considerable volume of
accessible data including Energy Consumption in the UK (ECUK) [3]. It
includes:
1. Overall energy consumption
2. Transport sector
3. Domestic sector
4. Industry sector
5. Services sector
In addition to energy consumption there are also data covering other
parameters such as electrical appliances, housing stock and energy
efficiency measures. Data is also available from other Government
sources such as from the DCLG for the UK’s housing.
Figure 1 illustrates the overall process for this study. It commences by
collecting data from the relevant sources from which the scenarios
and sensitivities are revised and constructed. The climate change
sensitivities for both heat and cooling are based on UK Climate
Change Projections 2018 (UKCP18) [4] which are an update to UKCP09
and were used for the 2017 Heat Study. From these the heat demand
and cooling scenarios were constructed for the period up to 2100 but
with specific focus on 2050 and 2080.
Update• Data from ECUK and other
sources
• Identify and investigate
variances
Scenarios & sensitivities• Revise household insulation pathways
• Construct population and household numbers
projections
• Review household internal temperatures
sensitivities
• Construct scenarios and sensitivities to 2100
Climate change sensitivities• Revise climate change sensitivities to
incorporate UKCP18
• Construct temperature change sensitivities for:
➢Winter
➢Summer
➢2050 and 2080
Cooling scenarios• Construct regional cooling degree
day projections with sensitivities for
2050 and 2080
• Construct regional scenarios of
households with cooling for 2050 and
2080
• Construct cooling demand scenarios
Heat demand scenarios• Construct heat demand scenarios to
2100 and compare with 2017 Heat
Study projections
• Construct climate change
sensitivities
• Disaggregate demand across
housing sectors for 2050 and 2080
Figure 1 – Overview of heat study process

March 2019 5
UK DOMESTIC HEAT DEMAND (I)
Figure 2 – UK domestic heat by end use consumption
(the dashed lines show data available in 2017)
Figure 2 shows domestic space and water heat energy consumption “by end use”, i.e. delivered to the household [5]. The fuels covered include solid fuels,
petroleum, gas and electricity. Space heat is very sensitive to weather and so consumption can vary significantly from year to year. For example, 2010 was
exceptionally cold resulting in a peak in demand which was followed by a mild trough in 2011. This year has seen a revision in the data from 2012 to 2016
resulting in an increase in water heat demand mostly offset by a reduction in space heat (the dashed line on Figure 2 shows the data available in 2017).
The downward trend in demand since 2005 continues despite the increase in households (~25 million in 2005 to ~ 28 million in 2017). Improvements in
housing insulation and in particular the introduction of high efficiency condensing boilers from 2007 are most likely to be the main contributors to these
reductions.
Figure 3 shows average UK household demand corrected for weather and adjusted for heating appliance efficiency to give the heat delivered to the building
[6]. This shows that the average space heat demand has fallen by 25% since 2005 and is less than 10MWhpa in 2017. The demand for hot water heat has
declined steadily since 1970 and is now ~2.5MWhpa.
Demand for domestic heat peaked in ~2005 but has subsequently steadily fallen due to building and appliance efficiency improvements. Water heat
demand has seen a revised increase for the period 2012 to 2016 but is mostly offset by a reduction in space heat demand.
Figure 3 – UK average household heat (weather corrected)

March 2019 6
UK DOMESTIC HEAT DEMAND (II)
Figure 4 – UK hot water cylinders and combination boilers
Figure 4 shows the number of installed hot water cylinders and combination boilers in the UK [7]. As might be expected these are strongly (negatively)
correlated. Hot water cylinders have declined from ~20 million in 2000 to an estimated 11.3 million in 2017, i.e. ~39% of all UK households, whilst
combination boilers have increased from ~4 million in 2000 to just under 15 million in 2017. (Note: there is no data beyond 2012 and the estimate assumes
that hot water cylinders continue to be removed when combination boilers are installed.) Combination boilers are popular with consumers as they allow hot
water to be produced on demand and thereby remove the need for storage. This releases space in the building which can be used for other purposes and
also means that the losses from hot water storage are avoided improving energy efficiency. It is likely to mean that any retrofit heating technology that
cannot provide hot water on demand will require hot water storage to be re-installed.
Figure 5 shows the number of installed “wet” appliances (dishwashers, washing machines) in the UK by energy efficiency rating [8]. These have improved
dramatically since 2000 with less than 20% below “A” and more than 50% above. The higher rating means lower energy and water consumption but also
modern detergents permit washing at lower temperatures. “Wet” appliances are now cold water fill only and this would have contributed to the reduction in
hot water demand.
Combination boiler installations correlate strongly with reductions of installed hot water cylinders which have fallen to an estimated 11.3million or ~39% of all UK
households. Any retrofit heating technology that cannot provide hot water on demand will require hot water storage to be re-installed.
Figure 5 – UK “wet” appliances by energy rating

March 2019 7
POPULATION AND HOUSEHOLD PROJECTIONS
UK population and household projections are made by
each of the four UK Home Nations for the period up to
2039 [9], [10], [11] and [12]. For the period beyond and
up to 2100, UN population projections [13] have been
used here with household projections based on the
assumption that the Home Nations’ 2.27
person/household continues beyond 2039. Figure 6
shows these projections to 2100 and it can be seen
that population/ households for the median projection
reach a plateau of ~32 million by 2060 with a very
small reduction by 2100.
The number of households assumed for 2050 is ~10%
less than that used for 2017 Heat Study. However, the
overall impact on heat demand is much less as the
reduction results in fewer new build housing which
have a much lower demand than the UK average.
Based on UN median projections of UK population the number of UK households reaches a plateau of ~32 million by 2060 with a very small
reduction by 2100.
Figure 6 – UK population and households projections to 2100

March 2019 8
HOUSING INSULATION PATHWAYS (I)
Figure 7 shows the estimate of UK housing insulation pathway by date of
construction and number of houses [14] and [15]. This has been extended from
2050 to 2100 and includes new houses built to meet the peak in households in
2060, refer Figure 6. There is a steady improvement in housing insulation after
those built before 1945 but it was not until after 2003 that significant
improvements were made which more than halved heat loss and hence reduced
space heat demand.
Also shown is the weighted average housing insulation (dotted line) of
3.14W/m2K. Added to the figure are projections of future housing stock with
assumptions on insulation. With no further changes in existing stock the
weighted average housing insulation falls from 3.14W/m2K to 2.78W/m2K, i.e. a
reduction of ~11%. This improvement is slightly less than the projected increase
in households and so the overall impact would be an increase in space heat
demand.
In the 2017 Heat Study, three housing insulation pathways were proposed and
retained here. They are:
• “Limited ambition” – This is shown in Figure 7A and assumes a 10%
improvement in housing insulation levels by 2050 based on a modest
improvement from today’s levels.
• “Sustained ambition” – This is shown in Figure 7B and assumes 30%
improvement in housing insulation levels by 2050. It is comparable to the
technical potential identified in the UKERC report [16] and is consistent with
BEIS Clean Growth strategy of improving energy efficiency to an EPC “C” rating
(“where practical and affordable”) from current D/E levels.
• “Stretched ambition” - This is shown in Figure 7C and assumes a 50%
improvement in housing insulation levels by 2050. It assumes a radical
improvement in housing insulation arising from technology developments and
cost reductions and might also include a programme of extensive building
refurbishment/renovation.
Figure 7 – Housing insulation pathway with no further improvement in existing housing insulation.
Housing insulation for new build has improved substantially over the last 15 years and projected new housing will lead to further reductions in housing insulation performance. However, there will
be little impact on total UK space heat demand without improvements in the housing insulation performance of existing buildings, particularly those built before 1945. The three pathways for
housing insulation proposed in the 2017 Heat Study have been retained here supplemented by projections to 2100 which include an assumption on building demolishment and replacement.
Figure 7D includes the impact on the “Sustained ambition” housing
insulation pathway with the assumption that beyond 2050 a programme of
building demolition is implemented to replace poor quality housing built
before 2003 with new build. The rate assumed is 100,000 buildings replaced
each year. This is slightly lower than the new build rate assumed to 2050
and the rationale is that it maintains the UK’s house building industry whilst
improving lower quality housing stock.

March 2019 9
HOUSING INSULATION PATHWAYS (II)
The revisions to the housing insulation pathways result in significant reductions in the weighted average housing insulation levels for the UK.
Figure 7A – “Limited ambition” housing insulation pathwayFigure 7B – “Sustained ambition” housing insulation pathway
Figure 7D – “Sustained ambition” housing insulation pathway with buildings demolished and replaced after 2050
Figure 7C – “Stretched ambition” housing insulation pathway

March 2019 10
DAILY TEMPERATURE SCENARIOS
For the 2017 Heat Study the space heat demand was calculated for
the year using a daily temperature profile based on 2015 Seasonal
Normal Composite Weather Variable (SNCWV). This normalises
average temperature but also makes an adjustment to take account
of other weather factors that can affect demand such as wind chill.
By using daily temperatures other “real”, i.e. not normalised,
temperature profiles can be used. This is particularly useful under
extreme weather conditions as it allows the impact of peak demands
to be assessed, e.g. the heat capacity requirements under cold
weather or the need for cooling under warm weather. Two
temperature scenarios have been used: a cold weather scenario and
a warm weather scenario. The cold weather scenario is from 2010
(Cold 2010) and which could be categorised as an extreme cold
weather year, e.g. 1 in 20 event. The warm weather scenario is from
2003 (Warm 2003) which was a particularly warm year. The
temperature scenarios are shown in Figure 8. Temperature and gas
data is available from National Grid plc [17].
The use of “real” temperature scenarios allows greater insight into the effect of weather and its impact on infrastructure and heating appliances.
Figure 8 – Daily temperature scenarios

March 2019 11
CLIMATE CHANGE ADJUSTMENT (I)
UK climate projections were updated in 2018 from UKCP09
to UKCP18. There is a considerable amount of information
on the Met Office web site [4] including access to data.
For this study climate adjustments were derived from
“UKCP18 Derived Projections of Future Climate over the
UK” [18]. This explores temperature change across the UK
arising from two levels of global mean warming based on
RCP2.6 and RCP8.5 (RCP is the Representative
Concentration Pathway and is a greenhouse gas
concentration trajectories). RCP8.5 has higher levels of
greenhouse gas concentration and hence this results in
more global warming.
Changes in temperature across the UK are projected for
when global mean temperatures reach +2°C and 4°+C
above pre-industrial levels. (Note: the change is with
reference to the average over the period 1981 to 2000.)
Figures 9 and 10 are extracts from the report [18] which
show these results. Note: “winter” is the average over
December to February and “summer” is for June to August.
It can be seen from Figure 9 that at 2°C of global mean
warming there is little spatial annual variation across the
UK with a warming of +1°C to +2°C. Warming is slightly
higher in summer than winter, with summers warming
more in the south, by up to +4°C.
With +4°C of global mean warming (Figure 10) there is
again little spatial variation in winter warming across the
UK with increases of up to +4°C. Warming is slightly
higher in summer but there is more spatial variation in the
south with up to +5°C (Median) and +6°C (High).
UKCP18 uses two global warming pathways resulting in global mean temperature increases of +2°C and +4°C with corresponding UK regional
temperature increases. These are similar to UKCP09 for winter but are slightly higher for summer. There is less annual spatial variation across the
UK although more in summer.
Figure 9 – projected change in temperature (from 1981 to 2000) for time when global mean warming reaches 2°C above pre-industrial levels
Figure 10 – projected change in temperature (from 1981 to 2000) for time when global mean warming reaches 4°C above pre-industrial levels

March 2019 12
CLIMATE CHANGE ADJUSTMENT (II)
The modelling approach adopted by UKCP18 results in an assumption that changes to the
climate at a given level of global warming are independent of the time at which that level is
reached. This assumption effectively means that there is uncertainty around the timing of when
global mean temperatures are reached for within an ensemble as well as for different ensembles
(an ensemble is a series of forecasts run from different starting conditions). The data from
UKCP18 illustrating this timing uncertainty is shown in Figure 11. So, for example, under RCP2.6,
+2°C could be reached as early as 2038 or as late as 2090 and for RCP8.5, +4°C could be
reached as early as 2061 or as late as 2090. Hence there is considerable uncertainty with the
timing. For the purposes of the climate change adjustment (CCA) used in this study, it is
assumed that +2°C is reached by 2060 (under RCP 2.6) and +4°C by 2075 (under RCP 8.5). These
years have been selected because they are the average of the mid-range values for the three
ensembles (rounded to the nearest 5 years).
The data shown in Table 1 below is derived from figures 9, 10 and 11 for the “Low”, “Median”
and “High” CCA by region and season. This data is used in Figure 12 shows the UK temperature
change pathways assumed. For the purposes of determining the CCA for 2050 and 2080 an
assumption is made here that temperature changes are linear and are from 2000 onwards. For
RCP2.6 these plateau at the temperature change identified by region whereas for RCP8.5 these
continue to increase as global temperatures continue to rise.
There is a wide range of uncertainty when global mean temperatures reach +2°C under RCP2.6 and 4°C under RCP8.5.
Figure 11 – Timing of when global mean temperaturespass +2°C and +4°C change
Figure 12 – UK temperature change pathways
Table 1 – Climate change adjustments
SummerLow Median High Low Median High
UK
North, °C 1.0 2.0 3.0 3.0 4.0 4.0
Midlands, °C 1.0 2.0 4.0 3.0 4.0 6.0
South, °C 1.0 2.0 4.0 3.0 5.0 6.0
WinterLow Median High Low Median High
UK
North, °C 1.0 2.0 3.0 1.0 3.0 4.0
Midlands, °C 1.0 2.0 3.0 2.0 3.0 4.0
South, °C 1.0 2.0 3.0 2.0 3.0 4.0
+2°C global mean warming by 2060 +4°C global mean warming by 2075
RCP 2.6 RCP 8.5
+2°C global mean warming by 2060 +4°C global mean warming by 2075
RCP 2.6 RCP 8.5

March 2019 13
UK DOMESTIC HEAT SCENARIOS (I)WITHOUT CLIMATE CHANGE ADJUSTMENT
Figure 13 shows the revised UK domestic heat scenarios. These assume the same improvement in housing insulation pathways as the 2017 Heat Study (10%, 30% and 50% reduction by 2050) and have similar results except for the revision to ECUK data which increased water heat demand mostly offset by a reduction in space heat demand, (see Figure 2). The CCC recommends a 15% reduction in domestic heat demand by 2030 [19] which is very close to the central scenario (30% reduction by 2050). Beyond 2050 the reduction is driven by the demolition and replacement of 100,000 pre-2003 buildings each year.
Water heat scenarios are:
• “Limited ambition” which has a small increase to 2050 reflecting increased losses due to more heat storage arising from a reduction in combination heating technology
• “Sustained ambition” which has water heat fixed at 2017 levels.
• “Stretched ambition” which assumes continues reductions in water heat due to new water heat technology and water saving measures.
The demand for space heat declines as a result of housing insulation improvements which more than offset the increase in households. Beyond 2050 space heat demand continues to reduce driven by the demolition and replacement of pre-2003 buildings.
Figure 13 – UK domestic heat scenarios

March 2019 14
The demand for space heat is directly impacted by the internal
temperature of buildings. Figure 14 shows average household
internal temperature data from ECUK [20]. Temperatures have
risen from just under 14⁰C in 1970 to nearly 19⁰C by 2005 but
have since declined to ~17.5⁰C for the latest year recorded, 2012.
The decline in temperature is probably due to improvements in
temperature controls which have allowed higher temperatures in
some rooms and lower temperatures in others (possibly with the
use of TRVs for example) and as a consequence this would have
resulted in an overall reduction in the average household
temperature.
The internal building temperature sensitivities proposed are:
• “High” – this has an increase to 19°C by 2050 and then fixed
thereafter. The increase could arise from householders seeking
more comfort from higher temperatures off-setting demand
savings , i.e. rebound effect.
• “Central” – this has internal temperatures fixed at 2012 levels,
i.e. 17.5°C.
• “Low” – this has a reduction to 16.5°C based on the
assumption that better heating controls continue to be
adopted, e.g. zonal control (with temperature and timer
settings) and smart technology.
Figure 15 shows the sensitivities to building internal
temperatures. These vary demand from Central by ~+/-10%.
Household internal temperature which has steadily increased since 1970 now appears to be on the decline probably as a result of improved heating controls. However, there is a lack of recent data and although further reductions should be expected it is proposed that the assumption is made that internal temperatures are fixed 2012 levels. i.e. Central pathway.
Figure 14 – Building internal temperature pathways
Figure 15 – Building internal temperature pathways
UK DOMESTIC HEAT SCENARIOS (II)BUILDING INTERNAL TEMPERATURE PATHWAYS

March 2019 15
Figure 16 shows the space heat demand
scenarios with the “Median” (RCP2.6) climate
change adjustment, i.e. +2°C for winter
(December to February) by 2060 and
incrementally increased from 2020 onwards as
shown in Figure 12. The solid lines show the
reduction in space heat demand for each of the
insulation pathways (refer to figures 7A, 7B and
7C) but with buildings demolished and replaced
after 2050 as described and illustrated in Figure
7D.
The CCA has an impact up until 2060. This is
because RCP2.6 assumes that global mean
temperatures reach a plateau with no further
increases. Reductions in space heat continue as a
result of buildings being demolished and
replaced with new buildings with higher
insulation levels.
Figure 16 – Space heat demand scenarios with “Median” climate change adjustment
The “Median” climate change adjustment results in a significant reduction in space heat demand by 2050 with ongoing reductions driven by improvements in housing stock.
UK DOMESTIC HEAT SCENARIOS (III)WITH CLIMATE CHANGE ADJUSTMENT

March 2019 16
Figure 17 shows the space heat demand with climate change sensitivities. For comparison the space heat demand for 2015 is shown along with the
demand from the 2017 Heat Study. The climate change adjustments are determined from Table 1, i.e. the change in average temperature for winter
(December to February) for each of sensitivities is +2°C, +3°C by 2060 (RCP2.6 Median and High) and +4°C (RCP8.5 High) by 2060 from 2000.
The combined impact of climate change and housing insulation improvements is substantial with a ~40% reduction in demand by 2050 under the
Sustained Ambition housing insulation pathway for RCP2.6 Median and more than 50% by 2080.
Figure 18 shows the individual contributions of housing insulation and CCA to space heat demand reductions by 2050. The CCA reduces demand by ~20%
whereas the impact of housing insulation improvements reduces demand by ~10%, ~30% and ~50%.
Figure 17 – Space heat demand sensitivity to changes in household average internal temperature
The combined impact of improvements in housing insulation and climate change result in very significant changes in space heat demand with a
total reduction of ~40% by 2050 and 50% by 2080 for the “Sustained ambition” scenario with “Median” CCA.
UK DOMESTIC HEAT SCENARIOS (IV)CLIMATE CHANGE SENSITIVITIES
Figure 18 – Contribution of housing insulation improvements and CCA to space heat demand reductions in 2050

March 2019 17
Figures 19 and 20 show the space heat demand for the Median climate change adjustment by date of building construction. (Note: the demand is based on
average buildings in each category as there will be factors such as size that will increase or reduce that demand.) This is helpful when making judgements
about the type of low carbon heating system that would be suitable for specific housing types. For example, buildings with a space heat demand above
6MWhpa are less likely to be suitable for heat pumps as these may have insufficient heat capacity to meet the performance requirements of building.
(Note: the heating appliance would also need to meet the demand for water heat which adds a further 2-3MWhpa to the household heat demand.) Pre-
1945 buildings fall into that category and very significant insulation improvements would be required for them to be suitable for heat pumps. An alternative
would be to fit hybrid heat pumps with the capacity to provide supplementary heating. In contrast buildings with a space heat demand less than 4MWhpa
are likely to have a high levels of insulation but this may require the building to have some form mechanical ventilation. Hence it might be more
appropriate to incorporate the space heat within the ventilation system for such buildings.
Household space heat demand varies significantly by date of building construction and this should be considered when making judgements about
the type of low carbon heating system that would be suitable for specific housing types. Pre-1945 buildings have a much higher space heat demand
than those built subsequently.
UK DOMESTIC HEAT SCENARIOS (V)HOUSEHOLD SPACE HEAT DEMAND BY DATE OF BUILDING CONSTRUCTION
Figure 19 – 2050 space heat by building date of construction Figure 20 – 2080 space heat by building date of construction

March 2019 18
Peak space heat is important as it determines the amount of capacity
required to ensure demand can be met. There are several factors that
influence peak demand. For example, housing insulation reduces the energy
consumed by the building and the rate of heat loss which results in a “flatter”
daily demand profile. This reduction in peak demand is illustrated in Figure
21 for 2017 “Normal” against 2050 “Normal with CCA” temperature scenarios.
For example, “Sustained ambition” peak demand has reduced by ~50% by
2050.
The demand for space heat is largely determined by weather and typically a
cold temperature scenario will be used to determine peak demand. From
Figure 21 the demand under the “Cold 2010” is twice that under the “Normal
with CCA” temperature scenario. Although climate change will impact
average temperatures across the year, the assumption is generally made that
cold weather events are independent of climate change.
However, UKCP18 does comment [21] on the 2 types of winter weather, i.e.
Type 1 (cold and dry) and Type 2 (warm and wet) and notes that:
Future warming means that by the 2080s, the temperature levels experienced
during ‘cold’ weather type 1 winter events will be similar to temperature levels
currently experienced under weather type 2.
This suggests that peak demand could look more like that for the “Normal
without CCA” temperature scenarios and as a result could have very
significant repercussions on the system infrastructure reducing the capacity
required. Further investigation of this is warranted to ensure UKCP18 has
been correctly interpreted. For example, the likelihood of extreme weather
events such as the polar vortex experienced in 2018 which resulted in
unusually cold weather in March 2018.
CLIMATE CHANGE AND PEAK SPACE HEAT DEMAND
Improvements in housing insulation will reduce peak heat demand. This may permit smaller size heating appliances reducing the need for costly
and disruptive changes to system infrastructure. UKCP18 has stated climate change will mean that cold weather events will be less cold. This will
have importance consequences for system capacity requirements and further consideration is warranted.
Figure 21 – Household peak household space heat demand sensitivities based on 2017 Heat Study
(Note: Household peak demand is the average for a group of houses and includes a diversity factor.)

March 2019 19
UK DOMESTIC COOLING SCENARIOS (I)IMPACT OF CLIMATE CHANGE ON SUMMER TEMPERATURES AND THE DEMAND FOR COOLING
Figure 22 shows the impact on UK regional summer (June to August) temperatures by 2050 and 2080. These range from +1°C to +4°C in 2060 (RCP2.6) and
+4°C to +6°C in 2075 (RCP8.5), refer to Table 1.
When daily temperatures exceed 22⁰C (“cooling trigger”) the Met Office assumes that some kind of cooling is required and Cooling Degree Days (CDD) is an
indication of the amount of cooling required. This is determined from the difference between daily mean temperature, the daily maximum and minimum
temperatures and the cooling trigger temperature [22]. The CDDs for UK regions is shown in Figure 23. As might be expected the South ranks the highest
and by 2080 is similar to the 2015 levels for the south of France. Note: a summer daily mean of 22⁰C could result in a maximum daily mean >30⁰C which
could see temperatures reach above 40⁰C during the day. UKCP18 reports that such events will become more frequent rising from a current 10% probability
to 50% by 2050.
These temperature increases are the average for the region and it is likely that within those regions the “urban heat island” effect that occurs within large
cities such as London and Manchester will result in higher temperatures ( ~+2°C to summer average) further increasing the demand for cooling.
Figure 22 – UK regional summer temperatures by 2050 and 2080
The impact of climate change on summer mean temperatures results in increases of up to +4⁰C by 2060 and +6⁰C by 2080 and is accompanied
by an increase in frequency of hot weather events. This increases cooling degree days, particularly in the South which could result in a demand
for cooling reaching levels experienced in the south of France in 2015.
Figure 23 – UK regional cooling degree days by 2050 and 2080

March 2019 20
UK DOMESTIC COOLING SCENARIOS (II)HOUSEHOLDS WITH COOLING FOR UK REGIONS BY 2050 AND 2080
Figure 24 – UK regional cooling scenarios of households with cooling by 2050 and 2080, %
Three scenarios of households with cooling have been created and are shown in Figure 24. Categories of 5%, 10%, 25%, 50%, 75% and 90% were
allocated to each region based on the cooling degree days shown in Figure 23. So, for example, in 2050 the North has 5%, 10% and 25% of households
with cooling for each scenario respectively whereas the South has 25%, 50% and 75%.
Figure 25 converts the percentage values in Figure 24 to number of households by taking 2014 regional numbers [9], [10], [11] and [12] and then
proportioning to the total number for 2050 and 2080 based on Figure 6. This result in the UK households with cooling ranging from ~5million to
~17million in 2050 and ~10million to ~24million in 2080.
Figure 25 – UK regional cooling scenarios of households by 2050 and 2080
Based on projections of cooling degree days, regional scenarios of households with cooling have been created. These result in households with
cooling of ~5 million to 17million by 2050 and ~10 million to ~24 million by 2080.

March 2019 21
Figure 26 – Domestic cooling demand pathways to 2100
There are a number of approaches to cooling buildings
ranging from passive measures to minimise heat gain, e.g.
building insulation, shading, natural ventilation, through to
air conditioning.
To estimate cooling energy demand an assumption is made
that for lower levels of housing insulation (“Limited
ambition”) the demand for air conditioning will be greater
than for higher levels of building insulation. From figure 23,
100 was taken as an estimated median CDD value for the
UK. Belgium, France and Czech Republic all have similar
estimated CDD values today [23 – table 2]. Their average
estimated potential specific cooling demand in dwellings in
these three countries is 11.3 kWh/m2 p.a. which, given an
average UK dwelling size of 90m2, gives 1 MWh pa for each
household. For the higher levels of housing insulation, i.e.
“Sustained ambition” and “Stretched ambition” 0.5MWh pa
and 0.25MWh pa are assumed respectively.
Although the assumptions used lead to uncertainty in the
cooling figures presented, they give an indication of the
scale of the demand.
These cooling demand scenarios are shown in Figure 26 and
result in a total domestic demand for cooling ranging from
~6TWh to ~15TWh by 2100 under a hot weather summer.
This is a lot less than the projected demand for heat. The
likelihood is that cooling demand will be even less as it is
assumed that cooling is solely provided by air conditioning
whereas in practice it is likely to be supplemented by
passive measures. Another feature of cooling is that it
correlates well with the output from solar PV and so the
system impact is minimal and possibly beneficial.
Summer mean temperatures are projected to increase as a result of climate change and buildings will require some form of cooling. This could include measures to keep the buildings cool as well as
some form of ventilation or air conditioning. There will be significant regional variations with the South most affected. However, the impact of cooling demand will be a lot less than heat and is very
unlikely to be significant.
UK DOMESTIC COOLING SCENARIOS (III)COOLING DEMAND IN 2050 AND 2080
March 2019 22
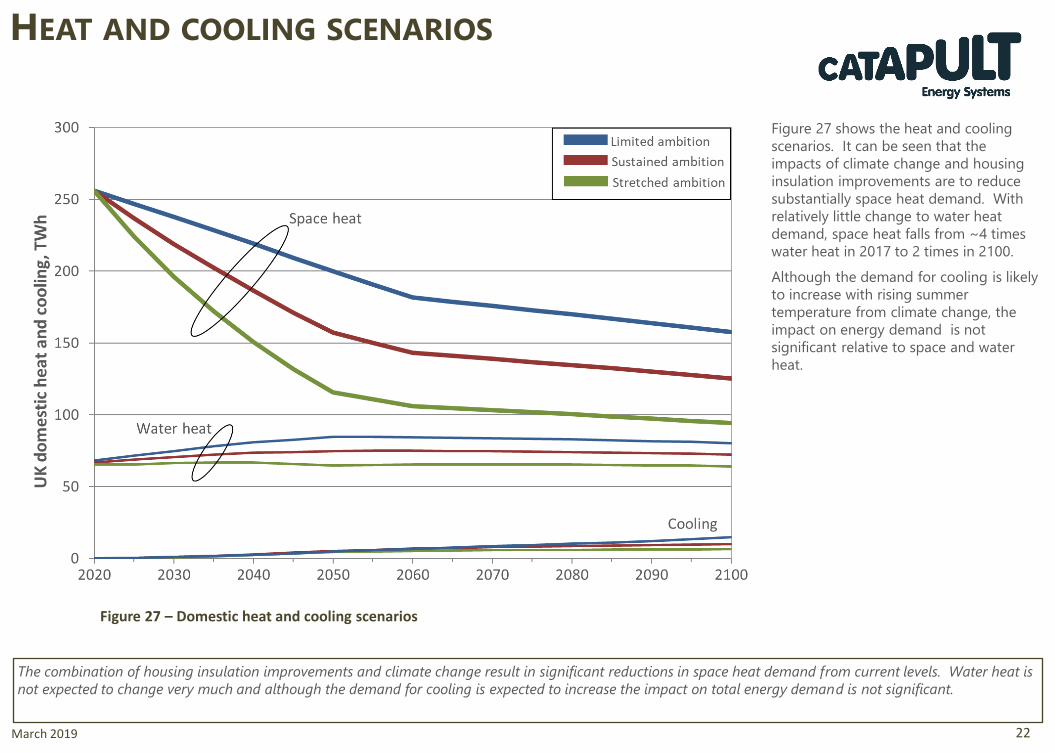
HEAT AND COOLING SCENARIOS
Figure 27 shows the heat and cooling
scenarios. It can be seen that the
impacts of climate change and housing
insulation improvements are to reduce
substantially space heat demand. With
relatively little change to water heat
demand, space heat falls from ~4 times
water heat in 2017 to 2 times in 2100.
Although the demand for cooling is likely
to increase with rising summer
temperature from climate change, the
impact on energy demand is not
significant relative to space and water
heat.
Figure 27 – Domestic heat and cooling scenarios
The combination of housing insulation improvements and climate change result in significant reductions in space heat demand from current levels. Water heat is
not expected to change very much and although the demand for cooling is expected to increase the impact on total energy demand is not significant.

March 2019 23
CONCLUSIONS
The update to the UK’s climate projections (UKCP18) uses two global warming pathways resulting in global mean temperature increases of +2°C and +4°C.
In terms of the UK impact it is similar to UKCP09 for winter with little spatial variation and with temperature increases up to 2°C. The expectation is that there
will be more spatial variation during the summer with temperature increases up to 6°C in the south of the UK with the higher global mean warming of +4°C.
The modelling approach adopted by UKCP18 has resulted in uncertainty in terms of the timing of the temperature increases ranging from 2038 to 2090 for
global mean temperature increase of +2°C and 2061 to 2090 for +4°C increase. In this study 2060 and 2075 have been used.
Domestic space heat demand has continued to fall from a peak in 2005 due to a combination of housing insulation and appliance efficiency improvements.
On the assumption that the global mean warming is kept to within +2°C of preindustrial levels then the expectation is that temperature increases will
stabilise beyond 2050. Further reductions for the period to 2100 will be driven via UK housing stock improvements as a result of the demolition of poorer
quality pre-2003 housing replaced with new buildings. Applying the “Median” climate adjustment to the “Sustained ambition” housing insulation pathway
results in a ~40% reduction in space heat demand by 2050 and 50% by ~2080. However, if global mean warming rises to +4°C heat demand is projected to
fall by more than 60% by 2080.
Housing insulation for new build has improved substantially over the last 15 years and projected new housing will lead to further reductions in housing space
heat demand. However, there will be little impact on total UK space heat demand without improvements in the housing insulation performance of existing
buildings, particularly those built before 1945. This is especially important when making judgements about the type of low carbon heating system that
would be suitable for specific housing types. For example, pre-1945 buildings have a much higher space heat demand than those built subsequently. This
may require more aggressive housing insulation (to reduce the space heat demand) or other measures such as supplementary heating (to increase the heat
output of the low carbon heating system).
UKCP18 has stated that climate change will mean that in the future cold weather events will be less cold. This will have important consequences for system
capacity requirements in terms of upstream infrastructure as well as the performance requirements of building heating appliances. So far the assumption
has been that cold weather events are independent of climate change. If this is no longer the case then there is scope to adjust design strategies accordingly
resulting in potential cost savings in infrastructure and other assets as well as implications for heating technology.
Domestic water heat demand has experienced a steady reduction since 1970 which has more than offset the increase in households. These reductions are
likely to have arisen from a combination of higher efficiency heating appliances, reduction in household water storage and less hot water consumption from
“wet appliances” (washing machines, dishwashers). There could be an increase in water heat demand if heating appliances that use combination technology
are replaced with low carbon appliances that cannot provide heat on demand. This is because it is likely to result in the re-installation of household water
storage. It is also possible that the reductions seen over the last 30 years will continue driven by new technology. Overall water heat demand will remain
considerably less than space heat demand but as a proportion of total heat demand it becomes more significant as space heat falls, particularly for the
period beyond 2050.
The impact of climate change may result in a higher frequency of hot summers with temperature increases up to 6°C in the South of the UK by 2080. This
will result in an increase in the demand for household cooling which could be met by passive measures, e.g. building insulation, shading ventilation but also
with air-conditioning. Projections of cooling energy demand indicate that they will be much less than heat demand and the impact on energy demand is not
significant.

March 2019 24
REFERENCES
1. ES Catapult(2017) Domestic heat demand study
2. DECC. (2010). “2050 Pathways Analysis.” DECC. London. UK.
3. www.gov.uk/government/statistics/energy-consumption-in-the-uk
4. www.metoffice.gov.uk/research/collaboration/ukcp
5. Tables 3.02 and 3.04 from www.gov.uk/government/statistics/energy-consumption-in-the-uk
6. Tables 3.01 and 3.19 from www.gov.uk/government/statistics/energy-consumption-in-the-uk
7. Table 3.19 from www.gov.uk/government/statistics/energy-consumption-in-the-uk
8. Table 3.13 from www.gov.uk/government/statistics/energy-consumption-in-the-uk
9. www.gov.uk/government/uploads/system/uploads/attachment_data/file/536702/Household_Projections_-_2014_-_2039.pdf
10. www.nrscotland.gov.uk/files//statistics/household-projections/2014-based/2014-based-household-projections.pdf
11. www.gov.wales/docs/statistics/2017/170323-household-projections-local-authorities-2014-based-en.pdf
12. www.nisra.gov.uk/publications/northern-ireland-household-projections-2012-based
13. Total population, median and prediction intervals from www.population.un.org/wpp/Download/Probabilistic/Population/
14. www.gov.uk/government/statistical-data-sets/live-tables-on-dwelling-stock-including-vacants
15. Table 3.17 from www.gov.uk/government/statistics/energy-consumption-in-the-uk
16. www.ukerc.ac.uk/publications.html
17. www.nationalgridgas.com/data-and-operations/transmission-operational-data
18. www.metoffice.gov.uk/pub/data/weather/uk/ukcp18/science-reports/UKCP18-Derived-Projections-of-Future-Climate-over-the-UK.pdf
19. Committee on Climate Change (2019) UK housing: Fit for the future? From www.theccc.org.uk
20. Table 3.16 from www.gov.uk/government/statistics/energy-consumption-in-the-uk
21. UKCP18 Fact Sheet: Weather Types www.metoffice.gov.uk
22. Jenkins, G.J., Perry, M.C., and Prior, M.J. (2008). The climate of the United Kingdom and recent trends. Met Office Hadley Centre, Exeter, UK.
23. Jakubcionis, M., & Carlsson, J. (2017). Estimation of European Union residential sector space cooling potential. Energy Policy, 101, 225-235.

March 2019 25
APPENDIX 1HOUSEHOLD SPACE HEATING PEAK DEMAND FOR PRE-1952 BUILDINGS - COLD
TEMPERATURE SCENARIO
Figure A1.1 above and shows the peak space heating demand profiles in 2050 for the Cold Temperature scenario averaged across all households. It is
recognised that the pre-1952 group of buildings has both a large population and a greater heat requirement than average and will present a greater
challenge for low carbon heating options such as heat pumps. Figure A1.2 disaggregates the demand to show pre 1952 buildings only. It can be seen
that with no energy efficiency improvements (“Do nothing”) peak heat demand is ~13kWth and this reduces with improved levels of insulation.
The impact of efficiency improvements on peak heat demands within the revised pathways can be seen to be significant, and consideration within
future design strategies may enable new options for this group such as the wider deployment of heat pumps or other technologies, as well as a
consequent reduction in the scale of costly and disruptive changes to system infrastructure.
Figure A1.2 – Household peak space heating demand
profiles for pre 1952 buildings in 2050 (Cold temperature
scenario)
Figure A1.1 – Household peak space heating peak demand
profiles for buildings in 2050 (Cold temperature scenario)

March 2019 26
APPENDIX 2IS A 30% IMPROVEMENT IN BUILDING INSULATION ACHIEVABLE
BY 2050 FOR PRE-1952 BUILDINGS?
It is assumed that the pre-1952 buildings would probably have
the lowest EPC rating in the country, i.e. Band F or G. These not
only have high energy requirements, they are likely to be
increasingly judged not to provide the levels of comfort and
amenity required by occupants, and particularly those from the
more vulnerable sectors. Improvements to the insulation of
these buildings would seem to be a minimum requirement,
even to Band D or E ratings. BEIS’s Clean Growth Strategy [13]
certainly sets an expectation for substantial efficiency
improvement, with an aspiration to move as many homes as
possible to EPC B and C or better, by 2035.
“To achieve this 2032 pathway, we will need to ensure existing
buildings waste even less energy. This pathway could see a
further six to nine million properties insulated, especially focusing
on those in fuel poverty where we are aiming to have the 2.5
million fuel poor homes in England improved to energy efficiency
rating C or better by 2030. More broadly, our aspiration is that as
many homes as possible are improved to EPC Band C by 2035,
where practical, cost-effective and affordable.”
EPC Band C is estimated to have similar performance to the
“Sustained Ambition” pathway used in this report. There are
currently 10* million properties with inadequate loft insulation,
6* million properties with uninsulated cavity walls, about 18
million with older poorer performing double glazing and 2
million with no double glazing. Figure A2.1 illustrates the
current status of insulation measures [14]. The judgement here
is that achievement of a 30% improvement in line with
‘Sustained Ambition’ is unlikely using today’s retrofit
approaches. However, improvements in product design and
performance combined with advances in renovation techniques
and increasing customer expectation during the next 30 years
will make this reference pathway realistic.
* Based on English Housing Survey [14] scaled for the UK.
Figure A2.1 – Insulation measures 2008 to 2015 (Annex Table 2.12
from [14])
Notes:
1. 80% of houses have full double glazing but nearly half were installed
before 2003 and are less efficient than current units [8].
2. Although more than 50% of properties do not have wall insulation, ~30%
have solid walls most of which are hard to treat.
3. The recommended depth of loft insulation is 270mm.