doi:10.1038/nature06340 ARTICLES - MITweb.mit.edu/manoli/www/publications/Stark_Nature_07.pdfof a...
14
ARTICLES ; < Discovery of functional elements in 12 Drosophila genomes using evolutionary signatures Alexander Stark 1,2 *, Michael F. Lin 1,2 *, Pouya Kheradpour 2 *, Jakob S. Pedersen 3,4 *, Leopold Parts 5,6 , Joseph W. Carlson 7 , Madeline A. Crosby 8 , Matthew D. Rasmussen 2 , Sushmita Roy 9 , Ameya N. Deoras 2 , J. Graham Ruby 10,11 , Julius Brennecke 12 , Harvard FlyBase curators{, Berkeley Drosophila Genome Project{, Emily Hodges 12 , Angie S. Hinrichs 4 , Anat Caspi 13 , Benedict Paten 4,5,14 , Seung-Won Park 15 , Mira V. Han 16 , Morgan L. Maeder 17 , Benjamin J. Polansky 17 , Bryanne E. Robson 17 , Stein Aerts 18,19 , Jacques van Helden 20 , Bassem Hassan 18,19 , Donald G. Gilbert 21 , Deborah A. Eastman 17 , Michael Rice 22 , Michael Weir 23 , Matthew W. Hahn 16 , Yongkyu Park 15 , Colin N. Dewey 24 , Lior Pachter 25,26 , W. James Kent 4 , David Haussler 4 , Eric C. Lai 27 , David P. Bartel 10,11 , Gregory J. Hannon 12 , Thomas C. Kaufman 21 , Michael B. Eisen 28,29 , Andrew G. Clark 30 , Douglas Smith 31 , Susan E. Celniker 7 , William M. Gelbart 8,32 & Manolis Kellis Sequencing of multiple related species followed by comparative genomics analysis constitutes a powerful approach for the systematic understanding of any genome. Here, we use the genomes of 12 Drosophila species for the de novo discovery of functional elements in the fly. Each type of functional element shows characteristic patterns of change, or ‘evolutionary signatures’, dictated by its precise selective constraints. Such signatures enable recognition of new protein-coding genes and exons, spurious and incorrect gene annotations, and numerous unusual gene structures, including abundant stop-codon readthrough. We also predict non-protein-coding RNA genes and structures, and new microRNA (miRNA) genes. We provide evidence of miRNA processing and functionality from both hairpin arms and both DNA strands. We identify several classes of pre- and post-transcriptional regulatory motifs, and predict individual motif instances with high confidence. We also study how discovery power scales with the divergence and number of species compared, and we provide general guidelines for comparative studies. The sequencing of the human genome and the genomes of dozens of other metazoan species has intensified the need for systematic meth- ods to extract biological information directly from DNA sequence. Comparative genomics has emerged as a powerful methodology for this endeavour 1,2 . Comparison of few (two–four) closely related gen- omes has proven successful for the discovery of protein-coding genes 3–5 , RNA genes 6,7 , miRNA genes 8–11 and catalogues of regulatory elements 3,4,12–14 . The resolution and discovery power of these studies should increase with the number of genomes 15–20 , in principle enab- ling the systematic discovery of all conserved functional elements. The fruitfly Drosophila melanogaster is an ideal system for devel- oping and evaluating comparative genomics methodologies. Over the past century, Drosophila has been a pioneering model in which many of the basic principles governing animal development and population biology were established 21 . In the past decade, the genome sequence of D. melanogaster provided one of the first systematic views Nature nature06340.3d 19/10/07 13:59:07 *These authors contributed equally to this work. {Lists of participants and affiliations appear at the end of the paper. 1 The Broad Institute, Massachusetts Institute of Technology and Harvard University, Cambridge, Massachusetts 02140, USA. 2 Computer Science and Artificial Intelligence Laboratory, MIT, Cambridge, Massachusetts 02139, USA. 3 The Bioinformatics Centre, Department of Molecular Biology, University of Copenhagen, Ole Maaloes Vej 5, 2200 Copenhagen N, Denmark. 4 Center for Biomolecular Science and Engineering, University of California, Santa Cruz, California 95064, USA. 5 Wellcome Trust Sanger Institute, Wellcome Trust Genome Campus, Hinxton, Cambridge CB10 1SA, UK. 6 Institute of Computer Science, University of Tartu, Estonia. 7 BDGP, LBNL, 1 Cyclotron Road MS 64-0119, Berkeley, California 94720, USA. 8 FlyBase, The Biological Laboratories, Harvard University, 16 Divinity Avenue, Cambridge, Massachusetts 02138, USA. 9 Department of Computer Science, University of New Mexico, Albuquerque, New Mexico 87131, USA. 10 Department of Biology, MIT, Cambridge, Massachusetts 02139, USA. 11 Whitehead Institute, Cambridge, Massachusetts 02142, USA. 12 Cold Spring Harbor Laboratory, Watson School of Biological Sciences, 1 Bungtown Road, Cold Spring Harbor, New York 11724, USA. 13 University of California, San Francisco/University of California, Berkeley Joint Graduate Group in Bioengineering, Berkeley, California 97210, USA. 14 EMBL Nucleotide Sequence Submissions, European Bioinformatics Institute, Wellcome Trust Genome Campus, Hinxton, Cambridge CB10 1SD, UK. 15 Department of Cell Biology and Molecular Medicine, G-629, MSB, 185 South Orange Avenue, UMDNJ-New Jersey Medical School, Newark, New Jersey 07103, USA. 16 Department of Biology and School of Informatics, Indiana University, Indiana 47405, USA. 17 Department of Biology, Connecticut College, New London, Connecticut 06320, USA. 18 Laboratory of Neurogenetics, Department of Molecular and Developmental Genetics, VIB, 3000 Leuven, Belgium. 19 Department of Human Genetics, K. U. Leuven School of Medicine, 3000 Leuven, Belgium. 20 Department de Biologie Moleculaire, Universite Libre de Bruxelles, 1050 Brussels, Belgium. 21 Department of Biology, Indiana University, Bloomington, Indiana 47405, USA. 22 Department of Mathematics and Computer Science, Wesleyan University, Middletown, Connecticut 06459, USA. 23 Biology Department, Wesleyan University Middletown, Connecticut 06459, USA. 24 Department of Biostatistics and Medical Informatics, University of Wisconsin-Madison, Madison, Wisconsin 53706, USA. 25 Department of Mathematics, University of California at Berkeley, Berkeley, California 94720, USA. 26 Department of Computer Science, University of California at Berkeley, Berkeley, California 94720, USA. 27 Department of Developmental Biology, Memorial Sloan-Kettering Cancer Center, New York, New York 10021, USA. 28 Graduate Group in Biophysics, Department of Molecular and Cell Biology, and Center for Integrative Genomics, University of California, Berkeley, California 94720, USA. 29 Lawrence Berkeley National Laboratory, Life Sciences Division, Berkeley, California 94720, USA. 30 Department of Molecular Biology and Genetics, Cornell University, Ithaca, New York 14853, USA. 31 Agencourt Bioscience Corporation, 500 Cummings Center, Suite 2450, Beverly, Massachusetts 01915, USA. 32 The Department of Molecular and Cellular Biology, Harvard University, Cambridge, Massachusetts 02138, USA. Vol 000 | 00 Month 2007 | doi:10.1038/nature06340 1
Transcript of doi:10.1038/nature06340 ARTICLES - MITweb.mit.edu/manoli/www/publications/Stark_Nature_07.pdfof a...

ARTICLES
;<
Discovery of functional elements in 12Drosophila genomes using evolutionarysignaturesAlexander Stark1,2*, Michael F. Lin1,2*, Pouya Kheradpour2*, Jakob S. Pedersen3,4*, Leopold Parts5,6,Joseph W. Carlson7, Madeline A. Crosby8, Matthew D. Rasmussen2, Sushmita Roy9, Ameya N. Deoras2,J. Graham Ruby10,11, Julius Brennecke12, Harvard FlyBase curators{, Berkeley Drosophila Genome Project{,Emily Hodges12, Angie S. Hinrichs4, Anat Caspi13, Benedict Paten4,5,14, Seung-Won Park15, Mira V. Han16,Morgan L. Maeder17, Benjamin J. Polansky17, Bryanne E. Robson17, Stein Aerts18,19, Jacques van Helden20,Bassem Hassan18,19, Donald G. Gilbert21, Deborah A. Eastman17, Michael Rice22, Michael Weir23,Matthew W. Hahn16, Yongkyu Park15, Colin N. Dewey24, Lior Pachter25,26, W. James Kent4, David Haussler4,Eric C. Lai27, David P. Bartel10,11, Gregory J. Hannon12, Thomas C. Kaufman21, Michael B. Eisen28,29,Andrew G. Clark30, Douglas Smith31, Susan E. Celniker7, William M. Gelbart8,32 & Manolis Kellis
Sequencing of multiple related species followed by comparative genomics analysis constitutes a powerful approach for thesystematic understanding of any genome. Here, we use the genomes of 12 Drosophila species for the de novo discovery offunctional elements in the fly. Each type of functional element shows characteristic patterns of change, or ‘evolutionarysignatures’, dictated by its precise selective constraints. Such signatures enable recognition of new protein-coding genes andexons, spurious and incorrect gene annotations, and numerous unusual gene structures, including abundant stop-codonreadthrough. We also predict non-protein-coding RNA genes and structures, and new microRNA (miRNA) genes. Weprovide evidence of miRNA processing and functionality from both hairpin arms and both DNA strands. We identify severalclasses of pre- and post-transcriptional regulatory motifs, and predict individual motif instances with high confidence. Wealso study how discovery power scales with the divergence and number of species compared, and we provide generalguidelines for comparative studies.
The sequencing of the human genome and the genomes of dozens ofother metazoan species has intensified the need for systematic meth-ods to extract biological information directly from DNA sequence.Comparative genomics has emerged as a powerful methodology forthis endeavour1,2. Comparison of few (two–four) closely related gen-omes has proven successful for the discovery of protein-codinggenes3–5, RNA genes6,7, miRNA genes8–11 and catalogues of regulatoryelements3,4,12–14. The resolution and discovery power of these studies
should increase with the number of genomes15–20, in principle enab-ling the systematic discovery of all conserved functional elements.
The fruitfly Drosophila melanogaster is an ideal system for devel-oping and evaluating comparative genomics methodologies. Overthe past century, Drosophila has been a pioneering model in whichmany of the basic principles governing animal development andpopulation biology were established21. In the past decade, the genomesequence of D. melanogaster provided one of the first systematic views
Nature nature06340.3d 19/10/07 13:59:07
*These authors contributed equally to this work.{Lists of participants and affiliations appear at the end of the paper.
1The Broad Institute, Massachusetts Institute of Technology and Harvard University, Cambridge, Massachusetts 02140, USA. 2Computer Science and Artificial IntelligenceLaboratory, MIT, Cambridge, Massachusetts 02139, USA. 3The Bioinformatics Centre, Department of Molecular Biology, University of Copenhagen, Ole Maaloes Vej 5, 2200Copenhagen N, Denmark. 4Center for Biomolecular Science and Engineering, University of California, Santa Cruz, California 95064, USA. 5Wellcome Trust Sanger Institute, WellcomeTrust Genome Campus, Hinxton, Cambridge CB10 1SA, UK. 6Institute of Computer Science, University of Tartu, Estonia. 7BDGP, LBNL, 1 Cyclotron Road MS 64-0119, Berkeley,California 94720, USA. 8FlyBase, The Biological Laboratories, Harvard University, 16 Divinity Avenue, Cambridge, Massachusetts 02138, USA. 9Department of Computer Science,University of New Mexico, Albuquerque, New Mexico 87131, USA. 10Department of Biology, MIT, Cambridge, Massachusetts 02139, USA. 11Whitehead Institute, Cambridge,Massachusetts 02142, USA. 12Cold Spring Harbor Laboratory, Watson School of Biological Sciences, 1 Bungtown Road, Cold Spring Harbor, New York 11724, USA. 13University ofCalifornia, San Francisco/University of California, Berkeley Joint Graduate Group in Bioengineering, Berkeley, California 97210, USA. 14EMBL Nucleotide Sequence Submissions,European Bioinformatics Institute, Wellcome Trust Genome Campus, Hinxton, Cambridge CB10 1SD, UK. 15Department of Cell Biology and Molecular Medicine, G-629, MSB, 185South Orange Avenue, UMDNJ-New Jersey Medical School, Newark, New Jersey 07103, USA. 16Department of Biology and School of Informatics, Indiana University, Indiana 47405,USA. 17Department of Biology, Connecticut College, New London, Connecticut 06320, USA. 18Laboratory of Neurogenetics, Department of Molecular and Developmental Genetics,VIB, 3000 Leuven, Belgium. 19Department of Human Genetics, K. U. Leuven School of Medicine, 3000 Leuven, Belgium. 20Department de Biologie Moleculaire, Universite Libre deBruxelles, 1050 Brussels, Belgium. 21Department of Biology, Indiana University, Bloomington, Indiana 47405, USA. 22Department of Mathematics and Computer Science, WesleyanUniversity, Middletown, Connecticut 06459, USA. 23Biology Department, Wesleyan University Middletown, Connecticut 06459, USA. 24Department of Biostatistics and MedicalInformatics, University of Wisconsin-Madison, Madison, Wisconsin 53706, USA. 25Department of Mathematics, University of California at Berkeley, Berkeley, California 94720, USA.26Department of Computer Science, University of California at Berkeley, Berkeley, California 94720, USA. 27Department of Developmental Biology, Memorial Sloan-Kettering CancerCenter, New York, New York 10021, USA. 28Graduate Group in Biophysics, Department of Molecular and Cell Biology, and Center for Integrative Genomics, University of California,Berkeley, California 94720, USA. 29Lawrence Berkeley National Laboratory, Life Sciences Division, Berkeley, California 94720, USA. 30Department of Molecular Biology and Genetics,Cornell University, Ithaca, New York 14853, USA. 31Agencourt Bioscience Corporation, 500 Cummings Center, Suite 2450, Beverly, Massachusetts 01915, USA. 32The Department ofMolecular and Cellular Biology, Harvard University, Cambridge, Massachusetts 02138, USA.
Vol 000 | 00 Month 2007 | doi:10.1038/nature06340
1

of a metazoan genome22, and the ongoing effort by the FlyBase andBerkeley Drosophila Genome Project (BDGP) groups established asystematic high-quality genome annotation23–25. Moreover, the fruit-fly benefits from extensive experimental resources26–28, which enablenovel functional elements to be systematically tested and used in theevaluation of genetic screens29,30.
The fly research community has sequenced, assembled and anno-tated the genomes of 12 Drosophila species22,31,32 at a range of evolu-tionary distances from D. melanogaster (Fig. 1a, b). The analysis ofthese genomes was organized around two complementary aims. Thefirst, described in an accompanying paper32, was to understand theevolution of genes and chromosomes in the Drosophila phylogeny,and how it relates to speciation and adaptation. The second goal,described here, was to develop general comparative methodologies todiscover and refine functional elements in D. melanogaster using the12 genomes, and to investigate the scaling of discovery power and itsimplications for studies in vertebrates (Fig. 1c).
Here, we report genome-wide alignments of the 12 species(Supplementary Information 1), and the systematic discovery offunctional elements in the euchromatic part of the D. melanogastergenome. We predict and refine thousands of protein-coding exons,RNA genes and structures, miRNAs, pre- and post-transcriptionalregulatory motifs and regulatory targets. We validate many of theseelements using complementary DNA (cDNA) sequencing, humancuration, small RNA sequencing, and correlation with experiment-ally supported transcription factor and miRNA targets. In addition,our analysis leads to several specific biological findings, listed below.$ We predict 123 novel polycistronic transcripts, 149 genes withapparent stop-codon readthrough and several candidate programmed
frameshifts, with potential roles in regulation, localization and func-tion of the corresponding protein products.$ We make available the first systematic prediction of general RNAgenes and structures (non-coding RNAs (ncRNAs)) in Drosophila,including several structures probably involved in translational regu-lation and adenosine-to-inosine RNA editing (A-to-I editing).$ We present comparative and experimental evidence that somemiRNA loci yield multiple functional products, from both hairpinarms or from both DNA strands, thereby increasing the versatilityand complexity of miRNA-mediated regulation.$ We provide further comparative evidence for miRNA targeting inprotein-coding exons.$ We report an initial network of pre- and post-transcriptionalregulatory targets in Drosophila on the basis of individual high-confidence motif occurrences.Comparative genomics and evolutionary signatures. Althoughmultiple closely related genomes provide sufficient neutral diver-gence for recognition of functional regions in stretches of highlyconserved nucleotides16,17,33, measures of nucleotide conservationalone do not distinguish between different types of functional ele-ments. Moreover, functional elements that tolerate abundant ‘silent’mutations, such as protein-coding exons and many regulatorymotifs, might not be detected when searching on the basis of strongnucleotide conservation.
Across many genomes spanning larger evolutionary distances, theinformation in the patterns of sequence change reveals evolutionarysignatures (Fig. 2) that can be used for systematic genome annota-tion. Protein-coding regions show highly constrained codon substi-tution frequencies34 and insertions and deletions that are heavily
Nature nature06340.3d 19/10/07 13:59:08
D. pseudoobscuraD. persimilis
D. melanogaster
c
a b
D. simulansD. sechelliaD. yakuba
D. erectaD. ananassae
D. willistoniD. mojavensis
D. virilisD. grimshawi
D.melD.simD.secD.yakD.ereD.anaD.pseD.perD.wilD.mojD.virD.gri
0.1 substitutionsper site
melanogastersubgroupmelanogaster
subgroup
SubgenusSophophora
SubgenusDrosophila
D.s
imD
.sec
D.e
reD
.yak
D.a
naD
.per
D.p
se
D.m
oj
12 s
p.(+
D.g
ri)
20 s
p.(+
plat
ypus
)
19 s
p.(+
opos
sum
)
18 s
p.(+
elep
hant
)
15 s
p.(+
dog)
9 sp
.(+
mou
se)
5 sp
.(+
tree
shre
w)
Hum
an
3 sp
.(rh
esus
)
6 sp
.(+
D.a
na)
5 sp
.(+
D.y
ak)
3 sp
.(+
D.s
im)
D.m
el
8 sp
.(+
D.p
se)
9 sp
.(+
D.w
il)
Chi
mp
Rhe
sus
Bus
hbab
yH
orse
Tree
shre
wE
lep
hant
Dog Cat
Arm
adill
oC
owR
abbit
Gui
nea-
pig
Hed
geho
gS
hrew
Tenr
ecM
ouse Rat
Op
ossu
m
Pla
typ
usC
hick
en
Liza
rd
Frog
Stic
kleb
ack
Fugu
Tetr
aod
onZ
ebra
fish
Med
aka
Flies(pairwise)
Vertebrates(pairwise)
Flies(multi-species)
Mammals(multi-species)
D.v
irD
.gri
D.w
il
1.5 1.9 2.1 2.2 2.3 2.41.41.0 1.1 1.30.2 0.5 0.80.1
0.1 0.2 0.4 0.5 1.3 1.9 2.3 2.9 3.5 4.2
CG4495
D.m
el
Hum
an
Figure 1 | Phylogeny and alignment of 12 Drosophila species.a, Phylogenetic tree relating the 12 Drosophila species, estimated fromfourfold degenerate sites (Supplementary Methods 1). The 12 species span atotal branch length of 4.13 neutral substitutions per site. b, Gene orderconservation for a 0.45-Mb region of chromosome 2L centred on CG4495,for which we predict a new exon (Fig. 3a), and spanning 35 genes. Colourrepresents the direction of transcription. Boxes represent full gene models.
Individual exons and introns are not shown. c, Comparison of evolutionarydistances spanned by fly and vertebrate trees. Pairwise and multi-speciesdistances (in substitutions per fourfold degenerate site) are shown from D.melanogaster and from human as reference genomes. Note that species withlonger branches (for example, mouse) show higher pairwise distances, notalways reflecting the order of divergence. Multi-species distances include allspecies within a phylogenetic clade.
ARTICLES NATURE | Vol 000 | 00 Month 2007
2

biased to be multiples of three3 (Fig. 2a). RNA genes and structurestolerate substitutions that preserve base pairing35,36 (Fig. 2b).MicroRNA hairpins show a characteristic conservation profile withhigh conservation in the stem and mutations in loop regions10,11
(Fig. 2c). Finally, regulatory motifs are marked by high levels ofgenome-wide conservation3,4,12–14, and post-transcriptional motifsshow strand-biased conservation12 (Fig. 2d, e).
We find that these signatures can be much more precise for gen-ome annotation than the overall level of nucleotide conservation (forexample, Fig. 3a).
Revisiting the protein-coding gene catalogue
The annotation of protein-coding genes remains difficult in meta-zoan genomes owing to short exons and complex gene structures
with abundant alternative splicing. Comparative information hasimproved computational gene predictors5, but their accuracy stillfalls far short of well-studied gene catalogues such as the FlyBaseannotation, which combines computational gene prediction37,high-throughput experimental data38–42 and extensive manual cura-tion23. Recognizing this, we set out not only to produce an independ-ent computational annotation of protein-coding genes in the flygenome, but also to assess and refine its already high-quality annota-tions43.
Our analyses of D. melanogaster coding genes are based on twoindependent evolutionary signatures unique to protein-codingregions (Fig. 2a, b): (1) reading frame conservation (RFC)3, whichobserves the tendency of nucleotide insertions and deletions to pre-serve the codon reading frame; and (2) codon substitution frequencies
Nature nature06340.3d 19/10/07 13:59:11
14
63
3
17
7
D.mel GGAAGTGCTGCCACAATCTACTACGAATCTATGCCAGCCTCCGCCTCCACAGGCGTTCTATCATTGACTACG
G S A A T I Y Y E S M P A S A S T G V L S L T T
D.sim GGAAGTGCTGCCACAATCTACTACGAATCTATGCCAGCCTCCGCCTCCACAGGCGTTCTATCATTGACTACGD.sec GGAAGTGCTGCCACAATCTACTACGAATCTATGCCAGCCTCCGCCTCCACAGGCGTTCTATCATTGACTACTD.yak GGAAGTGCTGCCACAATCTACTACGAGTCTATGCCAGCCTCCGCCTCCACGGGCGTTCTATCATTGACTACGD.ere GGAAGTGCTGCCACAATCTACTACGAGTCTATGCCAGCCTCCGCCTCCACAGGCGTTCTATCATTGACTACGD.ana GGTAGTGCAGCTACGATCTACTACGAATCAATGCCGGCATCCTCGTCCACTGGCGTACTCTCGTTGACCACCD.pse GGCAGCTCTGCCACAATCTACTACGAATCGATGCCCGCCTCGGCCTCCACGGGCGTCCTCTCGCTGACCACAD.per GGCAGCTCTGCCACAATCTACTACGAATCGATGCCCGCCTCGGCCTCCACGGGCGTCCTCTCGCTGACCACAD.wil GGTGGAGCTGCCACCATTTATTATGAATCCATGCCAGCATCTGCCTCAACTGGAGTCCTCTCGCTGACCACCD.moj GGCAGCTCAG---CCATCTACTATGAATCTATGCCGGC------CTCAACGGGCGTTCTATCGCTGACCACCD.vir GGCAGCTCGG---CCATCTACTATGAGTCCATGCCGGC------CTCGACGGGGGTGCTCTCGCTGACCACCD.gri GGCAGCTCGG---CCATCTATTACGAGTCGATGCCGGC------GTCGACGGGCGTCCTCTCACTGACGACG
** * * * * ** ** ** ** ** ** ***** ** ** * ** ** ** ** ** ** **** **
AACCGCCTTCCCCCTGGACTCGTCCCACTCTCTGCTCCTTCTCCACCAGCGATGCAAACTTTGCGAATCACTAGCCGCCTTCCCCCCGGACTCGTCCCACTACCTGCTCCTTCTCCACCAGCGATGCAAACTTTGCGAATCACTAGCCGCCTTCCCCCCGGACTCGCCCCACTACCTGCTCCTTCTCCACCAGCGATGCAAACTTTGCGAATCACTAGCCGCCTTCCCTCTG------------ CATGCTCCTTCTCCTCCAGCGATGCAAACTTTGCGAATCACTAGCCGCCTTCCCCCTGGACTCGTCCCACTACCTGCTCCTGCTCCTCCAACGATGCAAACTTTGCGAATCACTGGCCATCCTCCTCCTGGCAGC-CCCAACTGCCTCCGTTTTGTCTGTGTGTGTTGGTAACTTTGCAAATCACTGTTCACGTCCTTTGTGGCCAGTTCTCCTCTCCTTTTCTCTCTCGGTGCGTGTTGGAAACTTTGCAAATCACTGTTCACGTCCTTTGTGGCCAGTTCTCCTCTCCTTTTCTCTCTCGGTGCGTGTTGGAAACTTTGCAAATCACTACTCGCCAGCTTTGTGGCCAG---TAGTTCTCTGCTCTT------ GTGTGTTGGAAAACTTGCAAATCACTAGCTTACGTCCAAGTGAGCGTGTGCGTATACCTGTTGTGTTGGCTTGCCTGTTGAAAATTTTTCCCAACACTAGCTAACGTCCAAGTGTGCATGTGCATGTACGTGTGGTGTTTGTATGTCTGTTGAAAATTTTGCCCAACACT
D.melD.simD.secD.yakD.ereD.anaD.pseD.perD.wilD.mojD.virD.gri
D.melD.simD.secD.yakD.ereD.anaD.pseD.perD.wilD.mojD.virD.gri
AGCTAACGTTCAGCTGTG--------------- TGTGTGTGTGTGTTCGTTGAAAATTTTGCCAAACACT* * * ** ** *** * * * ***
Protein-coding exon Non-coding region
RNA
a
b
c
d e
GGGGATGTGGGGAAGGATGCTCTTTTCTGACTCTATTTTGTCGGCGAACATGGATCTAGTGCACGGTGG-TTCATGATTAAGTTCGTGACTAGATTTCATGCTCGTCTATTAAGTTGGGTCAGCACA-ACGAAGA----GAGCGGAGCTGGGGATGTGGGGAAGGATGCTCTTTTCTGACTCTATTTTGTCGGCGAACATGGATCTAGTGCACGGTGG-TTCATGATTAAGTTCGTGACTAGATTTCATGCTCGTCTATTAAGTTGGGTCAGCACA-ACGAAGA----GAGCGCAGCTGGGGATGTGGGGAAGGATGCTCTTTTCTGACTCTATTTTGTCGGCGAACATGGATCTAGTGCACGGTGG-TTCATGATTAAGTTCGTGACTAGATTTCATGCTCGTCTATTAAGTTGGGTCAGCACA-ACGAAGA----GAGCGGAGCTGGGGATGTGGGGAAGGATGCTCTTTTCTGACTCTATTTTGTCGGCGAACATGGATCTAGTGCACGGTGG-TTCATGATTAAGTTCGTGACTAGATTTCATGCTCGTCTATTAAGTTGGGTCAGCACT-ACGAAGA----GAG-----CTGGAGAAGTGGGGAAGGATGCTCTTTTCTGACTCTATTTTGTCGGCGAACATGGATCTAGTGCACGGTGG-TTCATGATTAAGTTCGTGACTAGATTTCATGCTCGTCTATTAAGTTGGGTCAGCACT-ACGAAGA----GAG-----CTGAAAAGG----ATTTGGGGTCTTTTTCTGACTCTATTTTGTCGGCGAACATGGATCTAGTGCACGGTGT-TTCATGATTAAGTTCGTGACTAGATTTCATGCTCGTCTATTAAGTTGGGTCAGCACA-CCAAAGAGTCGGATAGTGGAGTCTGATCCGGCAGCGTTTGCTCTTCTCTGACTCTATTTTGTCGGCGAACATGGATCTAGTGCACGGTTG-TTCATGATTAAGTTCGTGACTAGATTTCATGCTCGTCTATTAAGTTGGGTCAACACA-ACGAACCGAAAGAGCAGAGCATCTGATCCGGCAGCGTTTGCTCTTCTCTGACTCTATTTTGTCGGCGAACATGGATCTAGTGCACGGTTG-TTCATGATTAAGTTCGTGACTAGATTTCATGCTCGTCTATTAAGTTGGGTCAACACA-ACGAACCGAAAGAGCAGAGCAGAGTCCTTTCTATGTGGCAGCGTCTCTTGACTCTATTTTGTCGGCGAACATGGATCTAGTGCACGGTTTGTTCATGATTAAGTTCGTGACTAGATTTCATGCTCGTCTATTAAGTTGGGTCAGCACA-ACAAGAG--CGCAGCGGAGAGATTTCTTTT-----TTTTGCTCTTCTCTGACTCTATTTTGTCGGCGAACATGGATCTAGTGCACGGTTG-TTCATGATTAAGTTCGTGACTAGATTTCATGCTCGTCTATTAAGTTGGGTCAATACACACA-GCGAAAACATGGCCAAGGTTTCGCTC-----TTTTGCTCTTCTCTGACTCTATTTTGTCGGCGAACATGGATCTAGTGCACGGTTG-TTCATGATTAAGTTCGTGACTAGATTTCATGCTCGTCTATTAAGTTGGGTCAACACACACACACACACACATAAAAGAAACTGCAACTGCAACTGCTGCTCTTTTCTGACTCTATTTTGTCGGCGAACATGGATCTAGTGCACGGTTG-TTCATGATTAAGTTCGTGACTAGATTTCATGCTCGTCTATTAAGTTGGGTCAACACACA-ACACAAAAAAAAAAGAGGA ((((( (((.(((((... .............))))))))))).)))))).))))).)).)))).)))))))
G
A
A
A
C
C
G
G
U
U
U
U
C
G
A
UU
U
G
G
U
U
U
UG G
G
G
A
A
C
U
G
U
U
UU U C
A
U
A
CA
A
U
C
A
UU
U
U
G
A
A
A
G
C
U
G
A
U
U
U
U
5′ 3′
Nonsense mutation introducing a stop codon
Triplet substitution typical of non-coding regions
Frame-shifting gap (length L not a multiple of 3)
Codon substitution typical of protein-coding regions
Characteristic protein-preserving events
Characteristic non-coding region events
Frame-preserving gap (length L a multiple of 3)
Changes disruptive of RNA structuresDisruptive double substitution
No change
Conserved paired nucleotide
Disruptive insertion or deletion
Silent changes characteristic of RNA evolutionSilent G•U substitution
Silent base-preserving double substitutionSilent substitution in unpaired base
********************************************************************************************************************************************************************************************************************************************************************************************************************************************************************************************************************************************************************************************************************************************************************************************************************* ******* * ** ************************************************************************************************************************ ********* * *** *** ** ************************************************** ***************************************************************** * *** *** * ** * * * ************************************************** ****************************************************** ******* ** * *** ** ******* ****************************************** ****************************************************** ******* ** * * ******* ****************************************** ****************************************************** **** ** * * * ** ****************************************** ***************************************************** *** ** * * **************************************** **************************************************** ** *
G CC GG UA UU AU AU AG C
57G
A10
671
1 10 20 29 38 47 57 67
UG CC GU G
CU AC GA U
47
AG CU20
29
AU GU AG CG CG CU AC G
38A UC G
UUAA AC
GG
A
A
GC
5′ 3′
806040
40
80
120
160
200
2000
1000
0.2
0.4
0.6
0.8
1
Known motifs
Random motifs
BLS (% of tree)
Confidence
Num
ber
of c
onse
rved
inst
ance
s
Con
fiden
ce le
vel
GATTAGT------TCATCATTTATTAT---T------ATT---AATTAATGGCGTT-----------TCGCAGC-GGCTGG-C-----------------------TGTTTATTATTAACCATTATTT------A-ACA----CCGATTAGT------TCATCATTTATTAT---T------ATT---AATTAATGGCGTT-----------TCGCAGC--GCTGG-C-----------------------TGTTTATTATTAACCATTATTT------A-ACA----CCGATTAGT------TCATCATTTATTAT---T------ATT---AATTAATGGCGTT-----------TCGCAGC--GCTGG-C-----------------------TTTTTATTATTAACCATTATTT------A-ATA----CCGATTAGT------TCATCATTTATTAT---T------ATT---AATTAATGGCGTT-----------TCGCAGC--GCTGG-CTG---------------------TGTTTATTATTTATCATTATTA------A-ACA----CCGATTAGT------TCATCGTTTATTAT---T------ATC---AATTAATGGCGTT-----------TCGCAGC--GGTGG-C-----------------------TGTTTATTATTAACCATTACTA------A-ACA----CCGATTTGT------TCATCATTTATTAT---T------------AATTAATGGTATT-----------TCTTGACTGGCTGC-CTGCC---TGCCTGTTA--TTTGTTGTTTATTATTAAGCATTATTA------A-ACA----CAGATATGC------TCATCATTTATTAT---T------GAT---AATTAATGGAACTTTGGTCAGTT-TTGCTGCCTGCCTG-TTGCCTGCTGCCTGTTGCTTTTGCTGTTTATTATTAACTATTATTG------A-GCAGCGCCAGATATGC------TCCCCATTTTTTCT---T------GAT---AATTAATGGAAATTTGGTCACTTATTACTGCCTGCCGG-T-------CACCTCTCGCTTCTGCTGTTTATTATTAACTATTATTG------A-GCAGCGCCAGATTAGT------TCATCATTTATTAT---TATTTATATT---AATTAATGAAGTTT----------TCGTTTC------G-T-----------------------TTCGTATGGTT-----TCGTTT------G-ATG------GATTAGTCGTTCATCAATATTAATTATGTAT------ATAATTAATTAATGAAGTT-----------TT----C--GCTTTAT-----------------------CGTTTATCGACAGCTATTTTTAAT----A-ACA----ACGATTAGTTGATCATCATCATTAATTAT---T------ATA---AATTAATGAAGTT--------------------GCGTT-T-----------------------CGTTTATCGACAGCTATTTTTAAT----A-ACA----ACGATTAGTTGCTCATCATCATTAATTATGAGT------ATT---AATTAATGAAGTT-----------T--------GCTCT-T-----------------------CGCTCACCGATAGCTATTTTTAATACCAA-ACA----AC
Mef2 (BLS=0.25) Mef2 (BLS=0.83)Mef2: YTAWWWWTAR
miRNA
miRNA
miR
NA
*
miR
NA
miRNA*
Regulatory motifs
L
L
D.melD.simD.secD.yakD.ereD.anaD.pseD.perD.wilD.mojD.virD.gri
GCGAUUUGGAGCUCUCAAGUUUGGGUCACUUAAAC-GGGUGACCCAGACAUGAAGGCUGCCAAAUUGCGCGAUUUGGAGCUCUCAAGUUUGGGUCACUUAAAG-GGGUGACCCAGACAUGAAAGCUGCCAAAUCGCGCGAUUUGGAGCUCUCAAGUUUGGGUCACUUAAAG-GGGUGACCCAGACAUGAAGGCUGCCAAAUUGCGCGAUUUGGAGCCCUUAAGUUUGGGUCAUUUAAAG-GGGUGACCCAGACAUGAGGGCUGCCAAGUUGCGCGAUUUGGAGCCAUUAAGUUUGGGUCAUUUAAAG-GGGUGACCCAGACAUGAGGGCUGCCAAGUUGCGCGAUUUGGAGCCCUCAAGUUUGGGUCACUUUAAC-GCGUGUCCCAGACAUGAUGGCUGCCAAAUUGCGCGAUUUGGAGCCCUCAAGUUUGGGUCACUUAAAU-GGGUGACCCAGACAUGAUGGCUACUAGAUC--GCGAUUUGGAGCCCUCAAGUUUGGGUCACUUAAAU-GGGUGACCCAGACAUGAUGGCUACUAGAUC--GCAAUUUCGAACUAUUAAGUUUGGAUCACUUAAAGCACGUGAUCCAGACAUAAUAGAUCUGAGAUUUUAACAUUUGG-CCUGUCAAGUCUGCGCCAUUUAAAU-GCGUGGCCCAGACAUGACAAGCUACAAAUGUUAGCAUUUGG-UUUGCCAAGUCUGUGGCAUUUGAAU-GUAUGUCGCAGACAUGACAAUC-GCAAAUGCUAGCAUUUGG-UUUGUUAAGUCUGCGUCAUUUCAAU-GUGUGCCGCAGACAUGACAAAUUCCAAAUGUU((((((((.((((.(((.(((((((((((...... ..))))))))))).))).))))..))))))))abcdefgh iklm nop qrstuvwxyzA Azyxwvutsrq pon mlki hgfedcba
Conserved unpaired nucleotide
Disruptive single substitution
Figure 2 | Distinct evolutionary signatures for diverse classes of functionalelements. a, Protein-coding genes tolerate mutations that preserve theamino-acid translation, leading to abundant conservative codonsubstitutions (green). Insertions and deletions are largely constrained to be amultiple of three (grey). In contrast, non-coding regions show abundantnon-conservative triplet substitutions (red), nonsense mutations (blue) andframe-shifting insertions and deletions (orange). b, RNA genes toleratemutations that preserve the secondary structure (for example, singlesubstitutions involving G.U base pairs and compensatory changes) andexclude structure-disrupting mutations. Matching parentheses andmatching letters of the alphabet indicate paired bases. c, MicroRNA genes, in
contrast, generally do not show changes in stem regions, but toleratesubstitutions in loop regions and flanking unpaired regions, leading to adistinctive conservation profile. Asterisks denote the number of informantspecies matching the melanogaster sequence at each position. d, Regulatorymotifs tolerate local movement and nucleotide substitutions consistent withtheir degeneracy patterns, and show increased conservation across thephylogenetic tree, measured as the branch length score (BLS; SupplementaryMethods 5a). e, Increasing BLS thresholds select for instances of knownmotifs (black) at increasing confidence (red), as the number of conservedinstances of control motifs (grey) drops significantly faster.
NATURE | Vol 000 | 00 Month 2007 ARTICLES
3

(CSF, See Supplementary Methods 2a), which observes mutationalbiases towards synonymous codon substitutions and conservativeamino acid changes, similar to the non-synonymous/synonymoussubstitution ratio KA/KS
34 and other methods44–46.Assessing and refining existing gene annotations. We first assessedthe 13,733 euchromatic genes in FlyBase47 release 4.3. Using the abovemeasures, we defined tests that ‘confirmed’ genes supported by theevolutionary evidence, ‘rejected’ genes inconsistent with protein-codingselection, or ‘abstained’ for genes that were not aligned or with ambigu-ous comparative evidence (Supplementary Methods 2a). Of the 4,711genes with descriptive names, we confirmed 97%, rejected 1% andabstained for 2%, whereas the same criteria applied to 15,000 randomnon-coding regions $300 nucleotides rejected 99% of candidates andconfirmed virtually none (Table 1). Together, these results illustrate thehigh sensitivity and specificity of our criteria.
Applying the same criteria to the 9,022 genes lacking a descriptivename (genes designated only by a CG identifier, referred to hereafteras CGid-only genes), our tests accepted 87%, rejected 5% (414 genes)and abstained for 8%. This provides strong evidence that most CGid-only genes encode proteins, but also suggests that they may be lessconstrained20,32 and/or may include incorrect annotations. Indeed,on manual review, 222 (54%) of the 414 rejected CGid-only geneswere re-categorized as non-protein-coding or deleted (of which 55were due to genomically primed clones), 73 (18%) were flagged asbeing of uncertain quality, and the remaining 119 (29%) were keptunchanged (Fig. 3b). Some of these are probably rapidly evolvingprotein-coding genes, but others may also prove to be non-protein-coding genes or spurious; in fact, none of these had any functionalgene ontology (GO) annotation48.
In addition, we proposed specific corrections and adjustments tohundreds of existing transcript models, including translation startsite adjustments (Supplementary Fig. 2b), alternative spliceboundaries =(Supplementary Fig. S2b), recent nonsense mutations(Supplementary Fig. 2c) and alternative translational readingframes43.Identifying new genes and exons. To predict new protein-codingexons, we integrated our metrics into a probabilistic algorithm thatdetermines an optimal segmentation of the genome into protein-coding and non-coding regions (Fig. 3a) on the basis of whole-genome sequence alignments of the 12 fly species (SupplementaryMethods 2a). Our genome-wide search predicted 1,193 new protein-coding exons, mostly in euchromatic regions annotated as intergenic(43%), intronic (26%), or 59/39 untranslated region (UTR; 23%) inFlyBase annotation release 4.3.
We manually reviewed 928 of these predictions according toFlyBase standards23 (Supplementary Methods 2a), leading to 142new gene models (incorporating 192 predictions) and 438 revisedgene models (incorporating 562 predictions) (Fig. 3b). In parallel, wetested 184 predictions (126 intergenic, 58 intronic) by directed cDNAsequencing using inverse polymerase chain reaction (inverse PCR) ofcircularized full-length clones49–51 (Fig. 3c), which validated 120 tar-geted predictions (65%) and an additional 42 predictions not directlytargeted but contained within the recovered transcripts. Predictionsin intergenic regions yielded 88 full-length cDNAs, providing evid-ence for 50 new genes and modification of 39 gene models.Predictions within introns of existing annotations yielded 32 full-length cDNAs, of which only 18 (56%) represent new splice variantsof the surrounding gene, whereas the remaining 14 revealed nested or
Nature nature06340.3d 19/10/07 13:59:14
Chr 2L
Conservation
7183K
Low conservationHigh protein-coding signal
High conservationNo protein-coding signal
New exon(see panel c)
7184K 7185K 7186K 7187K 7188K
FlyBase genes
Predicted exons
Protein-codingevolutionary signal
CG4495
CG4496
b
c
d
a
e
81%
192562 174928 predicted
new exons
414 rejectedgenes
New geneModify existing annotation No actionFlyB
ase
cura
tion
19%
71%
73222 119Flagged asuncertain
Removed from FlyBaseprotein-coding genes
No action
29%
Disruptive substitution
Frame-shifting (not a multiple of 3)
Conservative substitution
Codon substitutions
Exon boundaries
Gaps
Stop codon
Frame-preserving (multiple of 3)
cDNA validation IP17639
Known splice form LD46238
(see panel a)CG4495
Inverse PCR primers
A V A A A E Q Q H Y H A Q H H H H P Q X Y K P H G K L K S R D Y T L H W Q N Y XGCAGTCGCTGCCGCCGAGCAGCAGCACTATCACGCCCAGCaCCATCACCATcCGCaATGATACAAGCCCCACGGAAAGCTCAAATCACGCGACTATACCCTTCACTGGCAGAACTATTAGTTAAAGTTCATTCATATTCaTCGCACATTGGCCATATCCCGA
Continued protein-coding evolutionStop StopProtein-coding evolution
Protein-coding evolution (frame 1) Protein-coding evolution (frame 2)Frameshift
+1
Non-coding evolution
CG8092
CG14047D Y F N N Q Q R E R H Y Q L R R Q S Q R Q P P R F V P P P P P P R R L L L T Q TGACTATTTCAACAATCAGCAGCGCGAGCGACACTACCAGCTCCGGCGGCAGAGCCAGCGGCAG CCTCCGAGATTTGTACCGCCGCCACCGCCTCCGCGTCGCTTGCTCCTCACGCAGACCA
AAAAGGGGGGG
Figure 3 | Revisiting the protein-coding gene catalogue and revealingunusual gene structures. a, Protein-coding evolutionary signaturescorrelate with annotated protein-coding exons more precisely than theoverall conservation level (phastCons track33), for example excluding highlyconserved yet non-coding elements. Asterisk denotes new predicted exon,which we validate with cDNA sequencing (see panel c). The height of theblack tracks indicates protein-coding potential according to evolutionarysignatures (top) and overall sequence conservation (bottom). Blue andgreen boxes indicate predicted coding exons (top) and the current FlyBaseannotation (bottom). The region shown represents the central 6 kb of Fig. 1b,
rendered by the UCSC genome browser126. b, Results of FlyBase curation of414 genes rejected by evolutionary signatures (Table 1), and 928 predictednew exons. ?c, Experimental validation of predicted new exon from panela. Inverse PCR with primers in the predicted exon (green) results in a full-length cDNA clone, confirming the predicted exon and revealing a newalternative splice form for CG4495. d, Protein-coding evolution continuesdownstream of a conserved stop codon in 149 genes, suggesting translationalreadthrough. e, Codon-based evolutionary signatures (CSF score) abruptlyshift from one reading frame to another within a protein-coding exon,suggesting a conserved, ‘programmed’ frameshift.
ARTICLES NATURE | Vol 000 | 00 Month 2007
4

interleaved gene structures. This provides additional evidence thatsuch complex gene structures are not rare in Drosophila23.
Overall, 83% of the 948 predicted exons that we assessed by man-ual curation or cDNA sequencing were incorporated into FlyBase,resulting in 150 new genes and modifications to hundreds of existinggene models. Finally, the 245 predictions that we did not assess werein non-coding regions of existing transcript models, or were alreadyincluded in FlyBase independent of our study. In an independentanalysis52, we predicted 98 new genes on the basis of inferred homo-logy to predicted genes in the informant species32, of which 63%matched the above predictions.Discovering unusual features of protein-coding genes. Our analysisalso predicted an abundance of unusual protein-coding genes thatcall for follow-up experimental investigation. First, we found openreading frames with clear protein-coding signatures and conservedstart and stop sites on the transcribed strand of annotated UTRs,indicative of polycistronic transcripts23,53,54. These include 73% of115 annotated dicistronic transcripts and 135 new candidate cistronsof 123 genes (Supplementary Fig. 2b).
Second, we predicted that 149 genes undergo stop codon readthrough,with protein-coding selection continuing past a deeply conserved stopcodon (Fig. 3d), in some cases for hundreds of amino acids. It is unlikelythat these genes are selenoproteins, as they appear to lack SECIS elementsthat direct selenocysteine recoding55–58. Other mechanisms may insteadbe at work, such as regulation of ribosomal release factors59, A-to-Iediting39,60,61, alternative splicing, or other less-characterized mechan-isms62. In fact, these genes are significantly enriched in neuronal proteins(P 5 1024), which frequently undergo A-to-I editing63.
Third, we found four genes in which CSF signatures abruptly shiftfrom one reading frame to another in the absence of nearby intron–exon boundaries or insertions and deletions (Fig. 3e). These aresuggestive of conserved ‘programmed’ frameshifts64, which arethought to be rare in eukaryotes.
Overall, our results affected over 10% of protein-coding genes, andwill be available in future releases of FlyBase. They also suggest thatseveral types of unusual protein-coding gene structure may be moreprevalent in the fly than previously appreciated.
RNA genes and structures
Several comparative approaches to RNA gene identification havebeen developed6,7,65 that recognize their characteristic properties:
compensatory double substitutions of paired nucleotides (forexample, A.U«C.G), structure-preserving single-nucleotide muta-tions involving G.U base pairs (G.U«G.C and G.U«A.U), andfew nucleotide substitutions disrupting functional base pairs(Fig. 2b). To predict new structures, we applied EvoFold7 in highlyconserved segments of the 12 Drosophila species and focused on high-stringency candidates with strong support by compensatory changes(Supplementary Methods 3).
Our search led to 394 predictions, recovering 68 known RNAstructures (primarily transfer RNA genes) in 0.02% of the genome(570-fold enrichment). The novel candidates consisted of 177 struc-tures in intergenic regions (54%), 103 in introns (32%), 36 in 39
UTRs (11%) and 10 in 59 UTRs (3%). In addition, we predicted200 structures in protein-coding regions (Supplementary Methods3). Notably, 75% of 39 UTR structures and 80% of 59 UTR structureswere predicted on the transcribed strand, suggesting that they arefrequently part of the messenger RNA. In contrast, only 47% ofintronic structures are on the transcribed strand, suggesting that theyare largely independent of the surrounding genes.Known and novel types of RNA genes. Of the 177 predicted inter-genic structures, 30 were detected in a tiling-array expression study42.This fraction (17%) is significantly above that for all conserved inter-genic regions (12%, P 5 0.007), but lower than that of known inter-genic ncRNAs (21%), suggesting that these candidates may be oflower abundance, temporally or spatially constrained, or mightinclude false positives. Two predictions were expressed throughoutdevelopment, one extending the annotation of a previously reportedbut uncharacterized ncRNA66 and the other probably representing anovel type of ncRNA. The predictions also included nine novelH/ACA-box small nucleolar RNA candidates in introns of ribosomalgenes, known to frequently contain small nucleolar RNAs that guidepost-transcriptional base modifications of ncRNAs67.Likely A-to-I editing structures. Many of the 48 intronic candidateson the transcribed strand and many of the 200 hairpins in codingsequence are probably involved in A-to-I editing or post-transcriptionalregulation (Fig. 4a). Hairpins in coding sequence were associated with11 of the 157 known editing sites (120-fold enrichment) and bothintronic and coding-sequence hairpins showed a strong enrichmentfor ion-channel genes (6%, P 5 0.007 and 10%, P 5 23 10212, respect-ively), known to be frequent editing targets. Editing is known to occur atmultiple sites in the same gene63, and we find an additional 10 hairpins
Nature nature06340.3d 19/10/07 13:59:18
GG C G C A U U
UU AU AU
UUU
AU AC G
31
26
G CU GA UA10
5
1
14 22
UU AU AU AA U
UC
C GUCG
5′- -3′
Protein translation
Start
CC
GGACGUUUC
GC G
GUUU CAU CA GGUUUGA
U GA UA UA UU AG UG C
AUU GU AC GU A
AA
U GG CA UU A
AC GU AG C
A
AU AG CC GG C
AA
G CG CC GG UA UA UG CU
C UU
A
C
5′- -3′
V F
F
A
T
H
S
E
S
Y
L
I
GF H Q
C
T
L
E
G
E
I
M
F
G
N
L
L
A
C
Intron 4Intron 5
SpliceSplice
Exo
n 5
RM I
Exon 1
Exon 5
Intron 2lodestar
spineless
CG6764
UGGCAGUCGCUGGGCACGAGUUACUGUGCGGUGGCUGUCCA
UGGGGGUCGCUGGGCACGAGUUACUGUGCGGCGCCUGUUUAUGGGGGUCGCUGGGCACGAGUUACUGUGCGGCGCCUGUUUA
GUG G- GUCGUUGGGCACGAGUUACUGUGCGACGGUCAU-CAUGGGAGCCGCUGGGCACGAGUUACUGUGCGGCGGCUGUUCAUGGGAGUCGCUGGGCACGAGUUACUGUGCGGCGGCUGUUCAUGGGAGUCGCUGGGCACGAGUUACUGUGCGGUGGCUGUCCAUGGAAGUCGCUGGGCACGAGUUACUGUGCGGUGGCUGUCCA
UGAUUAAUUCCUGGCACGAGUUACUGUGCGGAAUUCGAUCA
UGUUGGCGGCCAGGCACGAGUUACUGUGCGGACGUCUUUCAUGUUGGCGCCUGGGCACGAGUUACUGUGCGGGCGCAUAACA
UGUCUGCGCCUGGGCACGAGUUAAUGUGCGGGCGCCUGGCA(((.(((((((..(((((......))))))))))))..)))abc defghik lmnop ponmlkihgfed cbaU A
G C41
G CC
A UG CU GC GG UC10
14
5
1
1 5 10 14 18 25 29 31 36 41
GU G
31
29
25
36
GG
G
C
C
G
A
U
C
G
G
U
A G18 UUA
C
GU
a b c
D.melD.simD.secD.yakD.ereD.anaD.pseD.perD.wilD.mojD.virD.gri
Figure 4 | Novel RNA structures. a, New exonic RNA structure spanning 78of 90 nucleotides of spineless exon 5. b, New intronic RNA structure inlodestar shows 11 compensatory substitutions and 10 silent G.Usubstitutions, providing strong evidence of structural selection (colours as in
Fig. 2b). c, New 59 UTR structure that overlaps the translation start site ofCG6764, the fly orthologue of yeast ribosomal protein RPL24, suggesting apotential role in translational regulation. a–c, Structure shown correspondsto shaded region in the gene model.
NATURE | Vol 000 | 00 Month 2007 ARTICLES
5
in known editing targets, as well as 40 additional hairpins clustered in 18genes not previously known to be edited (for example huntingtin68,which harbours four predicted hairpins, more than any other gene).Intronic predictions also showed the highest abundance of compens-atory substitutions: for example, Resistant to dieldrin (Fig. 2b) containeda 26-base-pair (bp) intronic hairpin flanked by exons known to beedited69 with a striking 16 compensatory changes, lodestar showedone hairpin with 11 compensatory changes, and Inverted repeat-bindingprotein showed one hairpin with 10 compensatory substitutions(Fig. 4b).Likely regulatory UTR structures. We predicted 38 structures in 39
UTRs, a density twofold higher than the genomic average, whereasfewer than 10 such examples are currently known70. A considerablefraction of these lies in regulatory genes (14 out of 38; P 5 1024),including several transcriptional regulators (for example, cas, spenand Alh), the tyrosine phosphatase PTP-ER and the translation ini-tiation factor eIF3-S8. This suggests that many regulatory genes maythemselves be regulated post-transcriptionally through these struc-tures.
39 UTR structures were also enriched for genes involved in mRNAlocalization (3 out of 38, P 5 2.7 3 1024), including oo18 RNA-bind-ing protein (orb) and staufen (stau), both of which contain double-stranded RNA-binding domains, are involved in axis specificationduring oogenesis, and interact with the mRNA of maternal effectprotein oskar. The hairpin in orb is known to be important formRNA transport and localization71, whereas the highly similar stauhairpin has not been previously described to our knowledge.
The ten structures found in 59 UTRs probably contain bindingsites for factors that regulate translation. For example, the fly homo-logue of yeast ribosomal protein RPL24 contains a hairpin structureoverlapping its start codon (Fig. 4c). This is interesting in light ofhigh conservation upstream of the start codon in yeast ribosomalproteins3,4, and findings that ribosomal proteins bind to theirmRNAs and control translation in prokaryotes72,73.Conserved RNA structures in roX2 recruit MSL. In an independentstudy74, we searched for conserved regions in the non-coding roX1and roX2 (RNA on the X) genes to gain insights into their function.Both RNAs are components of the MSL (Male-specific lethal) com-plex and are crucial for dosage compensation in male flies, inducinglysine 16 acetylation of histone H4, leading to upregulation of hun-dreds of genes on the X chromosome75. We identified several stem-loop structures with repeated sequence motifs (for example,GUUNUACG), and found that tandem repeats of one of these weresufficient to recruit MSL complexes to the X chromosome and toinduce acetylation of lysine 16 of histone H4. Although this structurecould not fully rescue roX-deficient males, our results suggest that itmediates MSL recruitment during roX2-dependent chromatin modi-fication and dosage compensation, illustrating the power of evolu-tionary evidence for directing experimental studies.
Prediction and characterization of miRNA genes
Focusing on specific classes of RNA genes markedly increases theaccuracy of RNA gene prediction, reviewed in refs 35, 76 and illu-strated here for Drosophila miRNA genes. The common biogenesisand function of miRNAs77 lead to evolutionary and structural signa-tures (Fig. 2c) that can be used for their systematic de novodiscovery8–11. Using such signatures in the 12 fly genomes(Supplementary Methods 4a, b), we predicted 101 miRNAs78
(Supplementary Table 4d), which include 60 of the 74 verifiedRfam miRNAs (81%), while spanning less than 0.006% of the flygenome (13,500-fold nucleotide enrichment).
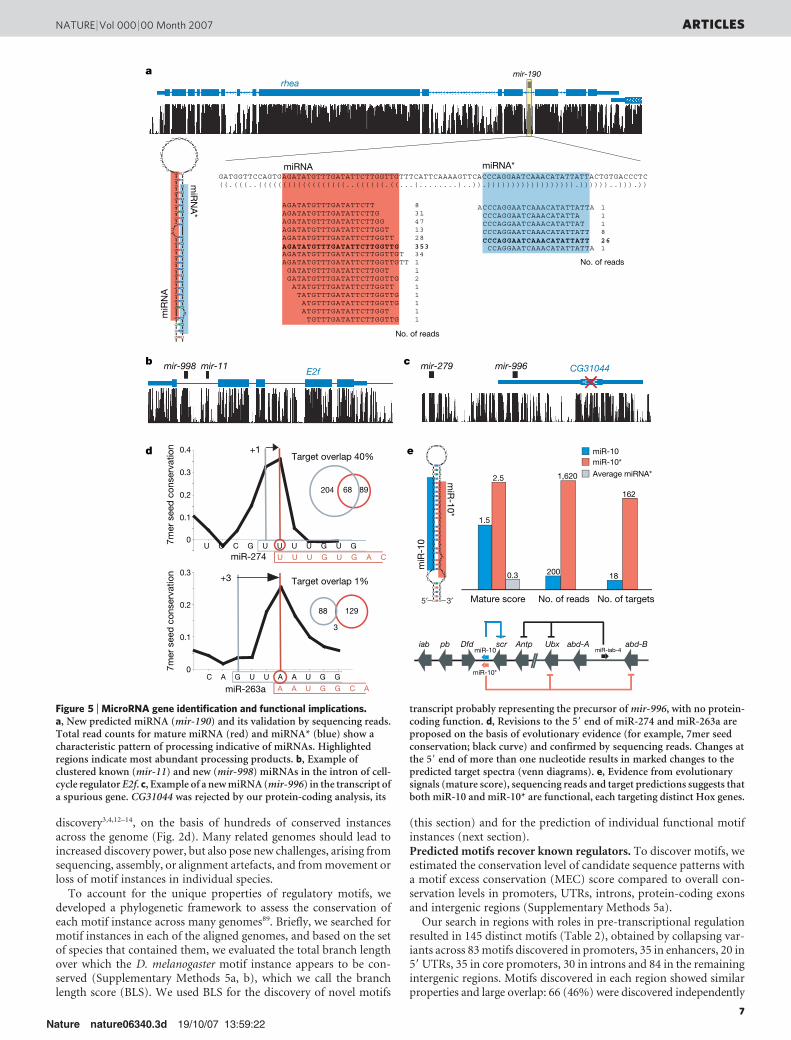
Comparison of our predictions with high-throughput sequencingdata of short RNA libraries from different stages and tissues of D.melanogaster78,79 revealed that 84 of the 101 predictions (83%),including 24 of the 41 novel predictions (59%), were authenticmiRNA genes (Fig. 5a and Supplementary Table 4d). An independentcomputational method79 had 20 of its 45 novel predictions validated
when used across six Drosophila species. Additional candidates mayrepresent genuine miRNAs whose temporal or spatial expressionpattern does not overlap with the surveyed libraries.
Several of the validated miRNAs were on the transcribed strand ofintrons or clustered with other miRNAs. For example, mir-11 andmir-998 (the vertebrate homologue of which, mir-29, has been impli-cated in cancer80) both lied in the last intron of E2f, and might beinvolved in cell-cycle regulation (Fig. 5b). Notably, two predictionsoverlapped exons of previously annotated protein-coding genes thatwere independently rejected above (Fig. 5c), providing an explana-tion for the previously observed transcripts of these annotations andhighlighting the importance of specific signatures for genomeannotation.
High-throughput sequencing data discovered an additional 50miRNAs not found computationally79,81, thereby illustrating the lim-itations of purely computational approaches. Some of these hadprecursor structures not seen previously for animal miRNAs, includ-ing unusually long hairpins79 and hairpins corresponding to shortintrons (mirtrons)81,82. The remaining were often less broadly con-served or showed unusual conservation properties.Signatures for mature miRNA annotation. The exact position of 59
cleavage of mature miRNAs is important, because it dictates the coreof the target recognition sequence83–85. This leads to unique structuraland evolutionary signatures, including direct signals, present at the 59
cleavage site, and indirect signals, stemming from the relationship ofmiRNAs with their target genes (Supplementary Methods 4a, c).Combined into a computational framework78, these signatures pre-dicted the exact start position in 47 of the 60 cloned Rfam miRNAs(78%), and were within 1 bp in 51 cases (85%). The method dis-agreed with the previous annotation in 9 of the 14 Rfam miRNAsthat were not previously cloned, of which 6 were confirmed bysequencing reads78,79, leading to marked changes in the inferred targetspectrum (Fig. 5d). Prediction accuracy was significantly lower (41%exact, 61% within 1 nucleotide) for novel miRNAs, which, however,also showed less accurate processing in vivo78,79.New insights into miRNA function and biogenesis. We predictedtargets for all conserved miRNAs identified by high-throughputsequencing79 searching for conserved matches to the seed region(similar to ref. 86) evaluated using the branch length score(Supplementary Methods 5a), a new scoring scheme describedbelow. Whereas the resulting miRNA targeting network changedsubstantially79, we found that the novel and revised miRNAs sharedmany of their predicted targets with previously known miRNAs,resulting in a denser network with increased potential for combin-atorial regulation78,79.
For ten miRNA hairpins, the mature miRNA and the correspond-ing miRNA star sequence (miRNA*, the small RNA from the oppos-ite arm of the hairpin) both appeared to be functional: both reachedhigh computational scores and were frequently sequenced78,79, oftenexceeding the abundance of many mature miRNAs (SupplementaryTable 4e). The Hox miRNA mir-10 showed a particularly strikingexample of a functional star sequence (Fig. 5e): both arms showedabundant reads, high scores and highly conserved Hox gene tar-gets78,79, suggesting a key role in Hox regulation.
In addition, for 20 miRNA loci, the anti-sense strand also foldedinto a high-scoring hairpin suggestive of a functional miRNA78
(Supplementary Table 4f). Indeed, sequencing reads confirmed thatfour of these anti-sense hairpins are processed into small RNAsin vivo79. Thus, a single genomic miRNA locus may produce up tofour miRNAs, each with distinct targets.
Regulatory motif discovery and characterization
Regulatory motifs recognized by proteins and RNAs to control geneexpression have been difficult to identify due to their short length,their many weakly specified positions, and the varying distancesat which they can act87,88. Recent studies have shown that compar-ative genomics of a small number of species can be used for motif
Nature nature06340.3d 19/10/07 13:59:22
ARTICLES NATURE | Vol 000 | 00 Month 2007
6
discovery3,4,12–14, on the basis of hundreds of conserved instancesacross the genome (Fig. 2d). Many related genomes should lead toincreased discovery power, but also pose new challenges, arising fromsequencing, assembly, or alignment artefacts, and from movement orloss of motif instances in individual species.
To account for the unique properties of regulatory motifs, wedeveloped a phylogenetic framework to assess the conservation ofeach motif instance across many genomes89. Briefly, we searched formotif instances in each of the aligned genomes, and based on the setof species that contained them, we evaluated the total branch lengthover which the D. melanogaster motif instance appears to be con-served (Supplementary Methods 5a, b), which we call the branchlength score (BLS). We used BLS for the discovery of novel motifs
(this section) and for the prediction of individual functional motifinstances (next section).Predicted motifs recover known regulators. To discover motifs, weestimated the conservation level of candidate sequence patterns witha motif excess conservation (MEC) score compared to overall con-servation levels in promoters, UTRs, introns, protein-coding exonsand intergenic regions (Supplementary Methods 5a).
Our search in regions with roles in pre-transcriptional regulationresulted in 145 distinct motifs (Table 2), obtained by collapsing var-iants across 83 motifs discovered in promoters, 35 in enhancers, 20 in59 UTRs, 35 in core promoters, 30 in introns and 84 in the remainingintergenic regions. Motifs discovered in each region showed similarproperties and large overlap: 66 (46%) were discovered independently
Nature nature06340.3d 19/10/07 13:59:22
miRNA*
miR
NA
*
miRNAm
iRN
A
miR
-10
miR
-10*No. of reads
No. of reads
GATGGTTCCAGTGAGATATGTTTGATATTCTTGGTTGTTTCATTCAAAAGTTCACCCAGGAATCAAACATATTATTACTGTGACCCTC((.(((..((((((((((((((((((..((((((.((...(........)..)).)))))))))))))))))).))))))..))).))
AGATATGTTTGATATTCTT 8AGATATGTTTGATATTCTTG 31AGATATGTTTGATATTCTTGG 47AGATATGTTTGATATTCTTGGT 13AGATATGTTTGATATTCTTGGTT 28
AGATATGTTTGATATTCTTGGTTGT 34AGATATGTTTGATATTCTTGGTTG 353
AGATATGTTTGATATTCTTGGTTGTT 1GATATGTTTGATATTCTTGGT 1GATATGTTTGATATTCTTGGTTG 2ATATGTTTGATATTCTTGGTT 1TATGTTTGATATTCTTGGTTG 1ATGTTTGATATTCTTGGTTG 1ATGTTTGATATTCTTGGT 1TGTTTGATATTCTTGGTTG 1
ACCCAGGAATCAAACATATTATTA 1CCCAGGAATCAAACATATTA 1CCCAGGAATCAAACATATTAT 1CCCAGGAATCAAACATATTATT 8CCCAGGAATCAAACATATTATT 26CCAGGAATCAAACATATTATTA 1
GU
GA
GA
UA
UG
UU
UG
AU
AU
UC
UU
GG
UU
G
UU
UC
AU
U C AA
AA
GU
U
CA
CC
CA
GG
AA
UC
AA
AC
AU
AU
UA
UU
AC
a
b c
d e
Mature score
miR-10miR-10*
Average miRNA*
No. of reads No. of targetsC
C
A
C
GU
CU
A
C
C
C
U
G
U
A
G
A
U
C
C
G
A
A
U
U
U
G
U
U
U
UA
U
A
CU
AC
U
U
UA
A
G
G
A
C
A
A
A
U
U
C
G
G
U
U
C
U
A
G
A
G
AG
G
UUU
GU
G
U
G
G5′ 3′
G
iab pb Dfd scrmiR-10
miR-10*
Antp Ubx abd-AmiR-iab-4
abd-B
miR-263a
Target overlap 40%
Target overlap 1%
C A G U U A A U G G
A A U G G C A
12988
3
89204 68
U U U G U G A CmiR-274U U C G U U U U G U G
+3
+1
7mer
see
d c
onse
rvat
ion
7mer
see
d c
onse
rvat
ion
mir-11mir-998 mir-279 mir-996
mir-190
CG31044
rhea
E2f
1.5
2.5
0.3 200
1,620
18
162
0.1
0
0.2
0.3
0.4
0.1
0.2
0.3
0
Figure 5 | MicroRNA gene identification and functional implications.a, New predicted miRNA (mir-190) and its validation by sequencing reads.Total read counts for mature miRNA (red) and miRNA* (blue) show acharacteristic pattern of processing indicative of miRNAs. Highlightedregions indicate most abundant processing products. b, Example ofclustered known (mir-11) and new (mir-998) miRNAs in the intron of cell-cycle regulator E2f. c, Example of a new miRNA (mir-996) in the transcript ofa spurious gene. CG31044 was rejected by our protein-coding analysis, its
transcript probably representing the precursor of mir-996, with no protein-coding function. d, Revisions to the 59 end of miR-274 and miR-263a areproposed on the basis of evolutionary evidence (for example, 7mer seedconservation; black curve) and confirmed by sequencing reads. Changes atthe 59 end of more than one nucleotide results in marked changes to thepredicted target spectra (venn diagrams). e, Evidence from evolutionarysignals (mature score), sequencing reads and target predictions suggests thatboth miR-10 and miR-10* are functional, each targeting distinct Hox genes.
NATURE | Vol 000 | 00 Month 2007 ARTICLES
7

in at least two regions and 40 (28%) in at least three, consistent withshared regulatory elements in these regions90.
The 145 discovered motifs match 40 (46%) of the 87 known tran-scription factors in Drosophila (Supplementary Table 5c) comparedto 8% expected at random (P 5 1 3 10220). Several of the non-discovered known motifs are involved in early anterior–posteriorsegmentation of the embryo, consistent with reports that they arelargely non-conserved91; indeed, 74% of these did not exceed theconservation expected by chance in promoter regions. Other non-discovered motifs often lacked characteristics expected for transcrip-tion factor motifs, suggesting that some may be spurious: 49% wereunusually long (.10 nucleotides) compared to 23% of recoveredones, and showed only one or a few total instances genome-wide,suggestive of individual regulatory sites rather than motifs.Tissue-specific and functional enrichment of novel motifs. Thediscovered motifs showed strong signals with respect to embryonicexpression patterns (Fig. 6a). Overall, 75 (52%) were either enrichedor depleted in genes expressed in at least one tissue, compared to 59%of known motifs and 3% of random controls. Motif depletion mayrepresent either specific repressors for individual tissues, or activatorsexcluded from these tissues. Motif depletion was found more gen-erally in ubiquitously expressed genes (30% of discovered and 34% ofknown motifs compared with 1% expected at random), similar to
findings for in vivo binding sites92, and probably reflecting less com-plex regulation. We also found significant motif enrichment in groupsof genetically interacting genes (collected by FlyBase) that often func-tion in common developmental contexts or signalling pathways,genes of metabolic pathways (Kyoto Encyclopedia of Genes andGenomes, KEGG93), and genes with shared functions (GO).
In total, 68% of discovered and 70% of known motifs wereenriched or depleted in one of the functional categories (14% ran-dom). Noteworthy examples include motif ME93 (GCAACA), whichwas more highly enriched in neuroblasts (P 5 4 3 10212) than eitherof the two well-known regulators of neuroblast development, pros-pero and asense (P 5 4 3 1025 and 2 3 1027, respectively). Similarly,motifs ME89 (CACRCAC), ME11 (MATTAAWNATGCR) andME117 (MAAMNNCAA) were highly enriched in malpighian tubule(P 5 4 3 1027), trachea (P 5 4 3 1025) and surface glia (6 3 1027),respectively, in each case ranking above motifs for factors known tobe important in these tissues (Supplementary Table 5c). These pre-sumably correspond to as-yet-unknown regulators for these tissues.Exclusion, clustering and positional constraints. A large number ofmotifs were depleted in coding sequence (57% of discovered versus57% of known and 10% of random motifs, P 5 3 3 10218) and in 39
UTRs (30% versus 22% and 0%, P 5 4 3 10211), suggesting specificexclusion similar to in vivo binding92.
Nature nature06340.3d 19/10/07 13:59:24
ba
c dTSS +250 nt–250 nt +500 nt–500 nt
–1
0
1
2
3
4
–5 –4 –3 –2
–10 1 2
3 4 5 6 7 8 9 11 13 15 17 1910 12 14 16 18 20
Reading frame
Mot
if ex
cess
con
serv
atio
n
Mot
if ex
cess
con
serv
atio
n
Position relative to mature miRNA 5′ end
1
2
3
4
5
F1 F2 F3 All Fs
STATAWAWR (TATA box)
RCGYRCGY (DPE)
TCAGTT (Inr)
TATCGATA (Dref)
5E
M6
2E
M8
1E
M2
EM
41
EM
52
EM
1E
M9
3E
M5
1E
M8
EM
13
EM
33
EM
34
EM
92
EM
43
EM
14
EM
3E
M7
1E
M8
4E
M9
1E
M6
3E
M6
EM
7E
M0
5E
M0
2E
M2
3E
M3
2E
M7
2E
M3
1E
M6
4E
M9
4E
M8
3E
M8
2E
ME
M11
73
EM
4E
M4
2E
M2
4E
M2
2E
M5
4E
M
No stainingDorsal-lateral sensory complex
Crystal cellPlasmatocytesMuscle system
UbiquitousGonad
Somatic muscleGastric caecum
Dorsal prothoracic pharyngeal muscleMidgut
Malpighian tubuleMidgut chamber
Malpighian tubule main segmentAnal pad
ProventriculusProventriculus intermediate layer
RectumSmall intestine
Dorsal vesselCirculatory system
Antennal sense organOenocyte
Visceral muscleDorsal apodeme
Large intestineRing gland
Corpus allatumLabral sensory complex
Midgut interstitial cellLateral cord glia
Lateral cord neuronHindgutForegut
ClypeolabrumAtrium
Dorsal epidermisVentral epidermis
Head epidermisPosterior spiracleTracheal system
OesophagusDorsal trunk
Visceral branchProventriculus inner layer
Apoptotic amnioserosaSalivary gland
Salivary gland ductSensory system head
Ventral sensory complex PRVisual system
Optic lobeHead epidermis dorsal
Salivary gland common ductHypopharynx
EpipharynxMaxillary sensory complex
Ventral apodemeLabial sensory complex
Sensory nervous system PRVentral midline
Lateral cord surface gliaCentral brain glia
Central brain surface gliaCentral brain
Central brain neuronCuprophilic cell
AmnioserosaProcephalon
BrainVentral nerve cord
Central nervous systemGerm cell
In coding exonsIn 3′ UTRs
miRNA 7mer conservation(×10–2)(×10–2)
Figure 6 | Regulatory motif discovery. a, Discovered motifs showenrichment (red) or depletion (blue) in genes expressed in a given tissue (logcolour range from P 5 1025 enrichment to P 5 1025 depletion). Bi-clustering reveals groups of motifs with similar tissue enrichment andgroups of tissues with similar motif content. Full matrix and randomizedcontrol is shown in Supplementary Fig. 6d. b, Positional bias of discoveredmotifs relative to transcription start sites (TSS). Peaks with highly specificdistances from the transcription start site (for example, first three plots) arecharacteristic of core promoter elements, and broad peaks (for example,fourth plot) are characteristic of transcription factors. For non-palindromicmotifs, colours indicate forward-strand (red) and reverse-strand (blue)instances. Curves denote the density of all instances and individual segments
denote individual motif instances, summed across groups of 50 genes (eachline). c, Coding regions show reading-frame-invariant conservation formiRNA motifs (red) and reading-frame-biased conservation for proteinmotifs (grey). MEC scores are evaluated for each of the three reading frameoffsets (F1–F3) and also without frame correction (all Fs). Plots showaverage MEC for all miRNA motifs and 500 top-scoring protein-codingmotifs (based on MEC without frame correction). d, Motif excessconservation (MEC) of 7mer complements at different offsets with respect tomiRNA 59 end, averaged across all Rfam miRNAs. MEC scores evaluated inprotein-coding regions and 39 UTRs show a highly similar profile(correlation coefficient 0.96), suggesting similar evolutionary constraints.
ARTICLES NATURE | Vol 000 | 00 Month 2007
8

Many of the intergenic or intronic instances occurred in clusters, aproperty of motifs that has been used to identify enhancer ele-ments91,94–96. We assessed increased conservation of motifs whenfound near other instances of the same motif (whether conservedor not, to correct for regional conservation biases), and found sig-nificant multiplicity for 19% of the discovered motifs (compared to24% of known and 4% of random motifs).
In addition, 15 of the discovered motifs (10%) were significantlyenriched near transcription start sites (compared to 14% of knownand 1% of random motifs). Several were enriched at precise positionsand preferred orientations (Fig. 6b), including close matches to sev-eral known core promoter motifs involved in transcription ini-tiation97. For example, ME5 (STATAWAWR), which matches theTATA-box motif, displayed a sharp peak on the transcribed strand,27 nucleotides upstream of the transcription start site. Similarly,ME120 (TCAGTT), corresponding to the known initiator motif(Inr) strongly peaked directly on the transcription start site, andME54 (RCGYRCGY), which matches a known downstream pro-moter element (DPE), peaked 30 nucleotides downstream of thetranscription start site.Regulatory motifs involved in post-transcriptional regulation. Wealso used BLS/MEC to discover motifs involved in post-transcriptionalregulation, and developed methods to distinguish motifs acting at theDNA level, motifs acting at the RNA level and motifs stemming fromprotein-coding codon biases (Supplementary Methods 5a). Motifs act-ing post-transcriptionally at the RNA level generally showed highlyasymmetric conservation12, as functional instances can only occur onthe transcribed strand. Indeed, 71 of 90 motifs (79%) discovered in 39
UTRs showed strand-specific conservation (compared with only 3% of59 UTR motifs and 5% of intron motifs, suggesting that these actprimarily in pre-transcriptional regulation).
Overall, 33 motifs discovered in 39 UTRs were complementary tothe 59 end of Rfam miRNAs, recovering 72% of known miRNAs(68% of 59 unique miRNA families). An additional 21 motifsmatched to 59 ends of novel miRNAs predicted above, of which 12were validated experimentally78,79, and 3 motifs matched uniquely tomiRNA star sequences, all of which were abundantly expressed invivo (Supplementary Table 4e).
We found 33 additional motifs in 39 UTRs that were apparentlynot associated with miRNAs. MO40 (TGTANWTW) closely matchesthe Puf-family Pumilio motif98. MO32 (AATAAA) corresponds tothe polyadenylation signal and displays both very strong conser-vation and a sharply defined distance preference with respect to theend of the annotated 39 UTR (P 5 10269). Finally, several motifs (forexample, MO24 5 TAATTTAT; MO94 5 TTATTTT) are variants ofknown AU-rich elements, which are known to mediate mRNAinstability and degradation99.MicroRNA targeting in protein-coding regions. Protein-codingregions can also harbour functional regulatory motifs, such as exonicsplicing regulatory elements100. However, motif conservation is dif-ficult to assess within protein-coding regions because of the overlap-ping selective pressures. Indeed, the most highly conservednucleotide sequence patterns of length seven (7mers) in codingsequence showed strong reading-frame-biased conservation, sug-gesting that they reflect protein-coding constraints rather than reg-ulatory roles at the DNA or RNA level (Fig. 6c).
MicroRNA motifs, which function at the RNA level, insteadshowed high conservation in all three reading frames, suggesting thatthey are specifically selected within coding regions for their RNA-level function. Indeed, previous studies have shown that miRNAmotifs in coding regions are preferentially conserved in vertebrates86,that they can lead to repression in experimental assays101,102, and thatthey are avoided in genes co-expressed with the miRNA103. Frame-invariant conservation allows us to demonstrate the coding-regiontargeting of individual miRNAs, and also enables the de novo discov-ery of miRNA motifs in coding regions. Using frame-invariantconservation, we recovered 11 miRNA motifs within the top 20
coding-region motifs (Supplementary Table 5g), whereas using over-all conservation required several hundred candidates to recover 11miRNA motifs.
Moreover, 7mers complementary to different positions in themature miRNA show a distinctive conservation pattern indicativeof functional targeting in coding regions (Fig. 6d) and similar to thatfound in 39 UTRs12,83 (correlation coefficient 0.96). Finally, 6merscomplementary to miRNA 59 ends were depleted in coding exons ofanti-target genes (Supplementary Fig. 5f), similar to findings forthese genes’ 39 UTRs103,104. Overall, these results, together with find-ings in vertebrates86,101–103, suggest that important miRNA targetshave been overlooked by many target prediction methods105 that havetraditionally focused exclusively on 39 UTR sequences.
Prediction of individual regulator binding sites
Previous methods for regulatory motif discovery3,4,12–14 integratedconservation information over hundreds of motif instances acrossthe genome, leading to an exceedingly clear signal for motif discoveryeven if many of these instances are only marginally conserved. Incontrast, the reliable identification of individual motif instanceshas been hampered by lack of neutral divergence and would requiremany related genomes15–19. In the absence of such data, previousstudies have relied on motif clustering91,94–96 or other sequence char-acteristics106 to predict regulatory targets or regions.
With the availability of the 12 fly genomes, we inferred high-con-fidence instances of regulatory motifs by mapping the BLS of eachmotif instance to a confidence value (Supplementary Methods 5a).This value represents the probability that a motif instance is func-tional, on the basis of the conservation level of appropriate controlmotifs evaluated in the same type of region (promoter, 39 UTR,coding, and so on). Because the number of conserved instancesdecreases much more rapidly for control motifs than for real motifs,the many genomes allowed us to reach high confidence values formany transcription factors and miRNAs, even at relatively modestBLS thresholds (Fig. 2e).Conserved motif instances identify functional in vivo targets. Wefound that increasing confidence levels selected for functionalinstances for both transcription factor and miRNA motifs: the nor-malized fraction of transcription factor motif instances within pro-moter regions rose from 20% to 90%; that of miRNA motif instanceswithin 39 UTRs rose from 20% to 90%; and the fraction of miRNAmotif instances on the transcribed strand of 39 UTRs rose from 50%(uniform) to 100% (Fig. 7a); in each case selecting the regions andstrands where the motifs are known to be functional.
We further assessed how predicted motif instances compared within vivo targets in promoter regions, defined experimentally (withoutcomparative information). We used a set of high-confidence directCrebA targets107 and three genome-wide chromatin immunopreci-pitation (ChIP) data sets for Snail, Mef2 and Twist92,108,109, and ineach case found that the enrichment between conserved motifinstances and known in vivo regions increased sharply for increasingconfidence values (Fig. 7b).
We also found that a large fraction of motif instances in experi-mentally determined target regions was conserved (Fig. 7c): 76% ofmotif instances in direct CrebA targets and 90% of motif instances inexperimentally supported miRNA targets104,110 were recovered at60% confidence. Although many of the miRNA targets stem fromcomparative predictions and are expected to be well conserved, theirhigh recovery rate illustrates the increased sensitivity of the BLSmeasure compared to perfect conservation (Supplementary Fig.7d). Similar results were found for motifs in known enhancers thatwere determined to be bound by ChIP (‘ChIP-bound’): 65% of Mef2motifs, 65% of snail motifs and 25% of twist motifs were conserved(Fig. 7c).ChIP-determined and conservation-determined targets show sim-ilar enrichment. To determine whether ChIP-bound motifs thatlack conservation are biologically meaningful, we studied their
Nature nature06340.3d 19/10/07 13:59:28
NATURE | Vol 000 | 00 Month 2007 ARTICLES
9

enrichment in muscle gene promoters. We found that motifs thatwere both bound and evolutionarily conserved showed very strongcorrelation with muscle genes for all three factors: Mef2 showedeightfold enrichment, twist showed sevenfold enrichment and snail,a mesodermal repressor, showed threefold depletion for musclegenes. However, when only non-conserved sites were considered,the correlation dropped significantly to 1–2-fold for all three factors,suggesting that non-conserved ChIP-bound sites may be of decreasedbiological significance (Fig. 7d).
We also used the correlation with muscle genes to compare ChIP-on-chip and evolutionary conservation as two complementary meth-ods for target identification (Fig. 7d). We found that the enrichment ofconservation-inferred targets was consistently higher than the enrich-ment of ChIP-inferred targets for each of the three factors. Finally, weassessed the functional significance of motif instances that were onlyfound by the conservation approach, specifically excluding those inChIP-bound regions, and found that these were also enriched in thesame functional categories as ChIP-bound sites with comparable orhigher functional correlations (Fig. 7d). This suggests that the addi-tional conserved instances are indeed functional, probably reflectingthe higher coverage of conservation-based approaches, which are notrestricted to the experimental conditions surveyed, or that they may bebound in vivo yet missed by ChIP-on-chip technology111,112.
In an independent study113 we compared several strategies for theprediction of motif instances and cis-regulatory modules and foundthat using the 12 fly genomes led to substantial improvements. Inanother study, we reported the recovery of conserved motifs forseveral known regulators, including Suppressor of Hairless, in genesof the Enhancer of split complex114.A regulatory network of D. melanogaster at 60% confidence.Having established the accuracy of conserved motif instances, wepresent an initial regulatory network for D. melanogaster at 60%confidence (Supplementary Fig. 5i), containing 46,525 regulatoryconnections between 67 transcription factors and 8,287 genes, and3,662 connections between 81 cloned miRNAs (clustered in 49 fam-ilies with unique seed sequences) and 2,003 genes.
The distribution of predicted sites per target gene is highly non-uniform and indicative of varying levels of regulatory control. Geneswith the highest number of sites appeared to be enriched in morpho-genesis, organogenesis, neurogenesis and a variety of tissues, whereas
ubiquitously expressed genes and maternal genes with housekeepingfunctions had the fewest sites104. Interestingly, transcription factorsappeared to be more heavily targeted than other genes, both by tran-scription factors (10 sites versus 5.5 on average, P 5 10215) and bymiRNAs (2.3 versus 1.8 miRNAs, P 5 5 3 1025). Moreover, geneswith many transcription factor sites also had many miRNA sites, andconversely, genes with few transcription factor sites also had fewmiRNA sites (P 5 1024 and P 5 7 3 1023, respectively).
Several of the predicted regulatory connections have independentexperimental support (Supplementary Table 5h), including directregulation of achaete by Hairy115, of giant by Bicoid116, of Enhancerof split complex genes by Suppressor of Hairless117, and of bagpipe byTinman (known to cooperate in mesoderm induction and heartspecification118). More generally, when tissue-specific expressiondata were available, we found that on average 46% of all targets wereco-expressed with their factor in at least one tissue (SupplementaryFig. 5i), which is significantly higher than expected by chance(P 5 2 3 1023).
Scaling of comparative genomics power
Theoretical considerations and pilot studies on selected genomicregions showed that the discovery power of comparative methodsscales with the number and phylogenetic distance of the speciescompared16–20,46,119,120. We extended these analyses by investigatingthe scaling of genome-wide discovery power using evolutionary sig-natures for each class of functional elements (Fig. 8), on the basis ofthe recovery of known elements using different subsets of informantspecies (at a fixed stringency).
We found that recovery consistently increased with the total num-ber of informant species, and that multi-species comparisons out-performed pairwise comparisons within the same phylogenetic clade.When we examined subsets of informants with similar total branchlength (for example, several close species versus one distant species),multi-species comparisons sometimes performed better (protein-coding exons, ncRNAs), comparably (motifs), or worse (miRNAs)than pairwise comparisons. This complex relationship between totalbranch length and actual discovery power probably reflects imperfectgenome assemblies/alignments, characteristics of each class of func-tional elements, and the specific methods we used. For example,ncRNA discovery probably benefits from observing more compensatory
Nature nature06340.3d 19/10/07 13:59:30
0
10
20
30
40
50
60
70
80
90
100
Mef2CrebA miRNAs
Known motifExpected random
SnailTwistMef2
Mef2TwistSnailCrebA
snailtwist Mef2 SnailTwist0
2
4
6
8
10
12
ChIP + enhancer
95%
0%
0%
3′ UTRs
3′ UTRs (+ strand) 3′ UTRs (– strand)
5′ UTRs
Promoters
Confidence CodingIntro
ns
Confidence (%)B
ound
reg
ion
enric
hmen
t (fo
ld)
80%
60%
0 4020 60 80
a b c d
ChIP+cons
Cons, all
ChIP only
ChIP, all
Cons only
0
1
2
3
4
5
6
7
8
TF motifs
miRNA
Baseline
Baseline
miRNA
Scaled fraction of motif instances
TF motifs in bound regions Motif instance recovery
Frac
tion
of m
otif
inst
ance
s co
nser
ved
Relative functional enrichment
Enr
ichm
ent/
dep
letio
n of
mus
cle
gene
s
Figure 7 | Identification of individual motif instances. a, Increasingconfidence levels select for motif instances in regions they are known to befunctional: conserved transcription factor (TF) motifs enrich for promoters;miRNA motifs for 39UTRs, and specifically the transcribed strand. Regionsare normalized for their overall length, measured by the number of motifinstances without conservation (0% confidence baseline). b, Increasingconfidence levels select for transcription factor motif instances withexperimental support for each factor tested. c, The high fraction ofexperimentally supported motif instances that are recovered at 60%confidence for transcription factors and 80% confidence for miRNAsillustrates the high sensitivity of the BLS approach. d, Comparison of
chromatin immunoprecipitation (ChIP) and conservation in their ability toidentify functional motif instances. Motif instances that are both ChIP-bound and conserved (purple) show the strongest functional enrichment inmuscle genes for Mef2 and Twist (depletion for Snail), whereas motifinstances derived by ChIP alone (light blue) show substantially reducedenrichment levels. Comparing the enrichment of all instances recovered byChIP (blue) and all instances recovered by conservation (red) suggests thatthe two approaches perform comparably. Even the sites recovered byconservation alone outside bound regions (pink) show enrichment levelscomparable to ChIP, suggesting that they are also functional.
ARTICLES NATURE | Vol 000 | 00 Month 2007
10

changes across more genomes, whereas miRNA discovery may be moresensitive to artefacts in low-coverage genomes, given the expected highconservation of miRNA arms.
As expected, longer elements were easier to discover than shorterelements. Long protein-coding exons (.300 nucleotides) wererecovered at very high rates even with few species at close distances(leaving little room for improvement with additional species). Incontrast, more informant species and larger distances were crucialfor recovering short exons, miRNAs and regulatory motifs.
Notably, the optimal evolutionary distance for pairwise compar-isons to D. melanogaster also seemed to depend on element length: forlong protein-coding exons, the best pairwise informant was the clo-sely related D. erecta, for exons of intermediate lengths D. ananassae,and for the shortest exons the distant D. willistoni (SupplementaryTable 7a). Distant species were also optimal for other classes of shortelements (ncRNAs, miRNAs and motifs, Fig. 8b–d). This suggeststhat a small number of species at close evolutionary distances maygenerally allow the discovery of long elements, possibly includingclade-specific elements, whereas short clade-specific elements maynot be reliably detectable without many genomes at close distances.
Finally, we investigated the effect of alignment choice on ourresults (Supplementary Fig. 8). We found high similarity betweendifferent alignment strategies for longer elements (.93% agreementfor exons), whereas shorter elements showed larger discrepanciesbetween alignments (81% and 59% agreement for miRNA and motifinstances, respectively).
Although factors such as genome size, repeat density, pseudogeneabundance and physiological differences might confound a simpleanalogy to the vertebrate phylogeny based on neutral branch length(Fig. 1c), our results suggest that comparisons spanning marsupials,birds and reptiles may prove surprisingly useful for biological signaldiscovery in the human genome.
Discussion
Our results demonstrate the potential of comparative genomics forthe systematic characterization of functional elements in a completegenome. Even in a species as intensely studied as D. melanogaster, our
methods predicted several thousand new functional elements,including protein-coding genes and exons, novel RNA genes andstructures, miRNA genes, regulatory motifs, and regulator targets.Our novel predictions have overwhelming statistical support, oftensurpassing that of known functional elements, and are additionallysupported by experimental evidence in hundreds of cases. The com-mon underlying methodology in this study has been the recognitionof specific evolutionary signatures associated with each class of func-tional elements, which can be much more informative for genomeannotation than overall measures of nucleotide conservation. Thesesignatures are general and are immediately relevant to the analysis ofthe human genome and more generally of any species.
In addition to the many new elements, we gained specific bio-logical insights and formulated hypotheses that we hope will guidefollow-up experiments. We found 149 genes with potential trans-lational readthrough, showing protein-like evolution downstreamof a highly conserved stop codon, and possibly encoding additionalprotein domains or peptides specific to certain developmental con-texts. We also found several candidate programmed frameshifts,which might be part of regulatory circuits (as for ODC/Oda 64) orhelp expand the diversity of protein products generated from onemRNA, similar to their role in prokaryotes121. We also presentedevidence of miRNA processing from both arms of a miRNA hairpinand from both DNA strands of a miRNA locus in some cases, poten-tially leading to as many as four functional miRNAs per locus. AsmiRNA/miRNA* pairs are expressed from a single precursor andthus co-regulated, whereas sense/anti-sense pairs are expressed fromdistinct promoters, the use of both arms or both strands providescompelling general building blocks for higher-level miRNA-mediated regulation.
The newly discovered elements did not dramatically increase thetotal number of annotated nucleotides. Known and predicted ele-ments explain 42% of nucleotides in phastCons elements33, com-pared to 35.5% for previous annotations (Supplementary Fig. 6),an 18% increase (mostly owing to conserved motif instances). Theremaining phastCons elements and independent estimates based ontranscriptional activity42 would suggest that a much higher fraction
Nature nature06340.3d 19/10/07 13:59:32
a b c dE
xon
sens
itivi
ty a
t 99
% s
pec
ifici
ty (%
)
200 300 400 500 600
70
80
90
10035
30
25
20
15
10
5
2 0.25 0.46 1.38 1.99 2.812 4.1Best pair D.mel, D.ana
D.mel, D.ere+D.sim, D.sec, D.yak+D.ana+D.pse, D.per+D.wil+D.moj, D.vir, D.gri
1.0
No. of species Species used
Branch length
40
50
60
70
80
Branch length
Mot
ifs r
each
ing
60%
con
fiden
ce (%
)
Branch lengthBranch length
Clo
ned
miR
NA
s re
cove
red
Kno
wn
ncR
NA
s re
cove
red
Sequence length (nucleotide)
10
0
20
30
40
50
60
70
0 1 2 3 4 0 1 2 3 4 0 1 2 3 4
PairwiseMultiple
PairwiseMultiple
PairwiseMultiple
60
100
Figure 8 | Scaling of discovery power with the number and distance ofinformant species. a, Discriminatory power of CSF protein-codingevolutionary metric for varying exon lengths and using different numbers ofinformant species. Sensitivity is shown for known exons at a fixed false-positive rate based on random non-coding regions. Mean length is shown foreach exon length quantile. Multi-species comparisons increase discovery
power, especially among short exons. b, Recovery of known ncRNAs (amongthe top 100 predictions) for pairwise (blue) and multi-species (red)comparisons. c, Recovery of cloned miRNAs (among the top 100predictions). d, Recovery of transcription factor and miRNA motifs withinstances at 60% confidence.
Table 1 | Assessment of FlyBase euchromatic protein-coding gene annotations
Regions evaluated Total Confirm Abstain Reject*
Named genes 4,711 4,566 (96.9%) 105 (2.2%) 40 (0.8%)
CGid-only genes 9,022 7,879 (87.3%) 729 (8.1%) 414 (4.6%)
Non-coding regions{ 15,564 3 (0.0%) 131 (0.8%) 15,430 (99.1%)
* A minority of rejected genes are false rejections; see Fig. 3b and text for details.{Regions $300 nucleotides in length randomly chosen from the non-coding part of the genome (see Supplementary Methods 2a).
NATURE | Vol 000 | 00 Month 2007 ARTICLES
11

of the genome may be functional (Supplementary Fig. 6). Although itis possible that these estimates are artificially high and that we are infact converging on a complete annotation of the fly genome, theymight instead indicate that much remains to be discovered, whichmay require the recognition of as-yet-unknown classes of functionalelements with distinct evolutionary signatures.
Our results also allowed us to compare and contrast evolutionaryand experimental methods for the recovery of functional elements,particularly for the identification of regulator targets. We found thatcomparative genomics resulted in many functionally meaningfulsites for transcription factors Mef2, Twist and Snail outside ChIP-bound regions, probably representing targets from diverse condi-tions not surveyed experimentally. Similarly, ChIP resulted in manyadditional sites outside those recovered by comparative genomics:some of these may have been replaced by functionally equivalentnon-orthologous sequence, rendering them apparently non-conservedin sequence alignments122–124; others may have species- or lineage-specific roles, thus lacking sufficient signal for their comparative detec-tion; finally, some bound sites may be biochemically active yet selec-tively neutral125. It is worth noting, however, that ChIP-bound motifsthat were not conserved showed decreased enrichment in muscle/mesoderm development where the factors are known to act, suggestingthat potential lineage-specific roles may lie outside the regulators’conserved functions. To resolve these questions, comparative geno-mics studies would benefit greatly from experimental studies in severalrelated species in parallel.
Overall, comparative genomics and species-specific experimentalstudies provide complementary approaches to biological signal dis-covery. Comparative studies help pinpoint evolutionarily selectedfunctional elements across diverse conditions, whereas experimentalstudies reveal stage- and tissue-specific information, as well as spe-cies-specific sites. Ultimately, their integration is a necessary steptowards a comprehensive understanding of animal genomes.
METHODS SUMMARY
The Methods are described in Supplementary Information, with more details
found in the cited companion papers for each section. The sections of the
Supplementary Methods are arranged in the same order as the manuscript to
facilitate cross-referencing, with an index on the first page to aid navigation. >
Received 21 July; accepted 4 October 2007.
1. Miller, W., Makova, K. D., Nekrutenko, A. & Hardison, R. C. Comparativegenomics. Annu. Rev. Genomics Hum. Genet. 5, 15–56 (2004).
2. Ureta-Vidal, A., Ettwiller, L. & Birney, E. Comparative genomics: genome-wideanalysis in metazoan eukaryotes. Nature Rev. Genet. 4, 251–262 (2003).
3. Kellis, M. et al. Sequencing and comparison of yeast species to identify genes andregulatory elements. Nature 423, 241–254 (2003).
4. Cliften, P. et al. Finding functional features in Saccharomyces genomes byphylogenetic footprinting. Science 301, 71–76 (2003).
5. Brent, M. R. Genome annotation past, present, and future: how to define an ORF ateach locus. Genome Res. 15, 1777–1786 (2005).
6. Washietl, S., Hofacker, I. L. & Stadler, P. F. Fast and reliable prediction ofnoncoding RNAs. Proc. Natl Acad. Sci. USA 102, 2454–2459 (2005).
7. Pedersen, J. S. et al. Identification and classification of conserved RNA secondarystructures in the human genome. PLoS Comput. Biol. 2, e33 (2006).
Nature nature06340.3d 19/10/07 13:59:35
Table 2 | Pre-transcriptional motifs
Name Motif consensus MEC MCS Region* Knowntranscription factor{
Multiplicityscore{
ImaGO enrichment1 ImaGOscore1
ME1 GTCACGTD 0.448 45.41 PIG – – – –ME2 AWNTGGGTCA 0.393 26.97 PIG Hr46 – Oesophagus (13–16) 4.52
ME3 BCATAAATYA 0.369 36.02 PCEIG Caudal – Ubiquitous (13–16) 26.22
ME4 HAATTAYGCRH 0.365 32.71 PCE5IG Engrailed – – –ME5 STATAWAWR 0.358 24.31 C TATA – Ventral nerve cord (13–16) 25.1ME6 VATTWGCAT 0.356 44.06 PE5IG – 3.73 Ubiquitous (11–12) 27.15
ME7 BYAATTARH 0.338 15.45 PCE5IG Engrailed 7.08 Ubiquitous (11–12) 210.26
ME8 HRTCAATCA 0.338 42.32 PIG – – Dorsal pharyngeal muscle PR (11–12) 24.15
ME9 TGACANNNNNNTGACA 0.336 9 G – – – –ME10 RCGTGNNNNGCAT 0.329 15.94 PIG – – – –ME11 MATTAAWNATGCR 0.324 12.43 PIG acj6 – Tracheal PR (11–12) 4.11
ME12 TTAATGATG 0.32 20.31 PG – – – –ME13 WTGACANBT 0.318 63.45 PE5IG – 4.14 Ubiquitous (13–16) 23.97
ME14 YGACMTTGA 0.313 27.06 PIG – – Midgut (13–16) 4.32
ME15 AATTRNNNNCAATT 0.309 21.17 PG – – – –ME16 TGACGTCAT 0.304 12.24 PC5IG CrebA – – –ME17 MAATTNAATT 0.304 51.57 PE5IG – – Ubiquitous (11–12) 26.66
ME18 MRYTTCCGYY 0.304 39.04 PEIG Dorsal – Ubiquitous (11–12) 24.4ME19 MATTRRCACNY 0.303 25.24 PIG – – – –ME20 YTAATGAVS 0.298 44.5 PEIG – – Foregut PR (11–12) 4.19
ME21 TAATTRANNTTNATG 0.294 8.67 G – – – –ME22 WAATGCGCNT 0.291 18.17 G – – – –ME23 MATTWRTCA 0.288 46.25 PEIG – – Dorsal epidermis PR (11–12) 4.4ME24 YAATTWNRYGC 0.287 30.91 PG – 4.27 Ubiquitous (11–12) 24.79
ME25 TTAYGTAA 0.283 13.06 5 Giant – Midgut (13–16) 5.32
ME26 YGCGTHAATTR 0.283 13.61 PEG – – – –ME27 AATTRYGWCA 0.28 22.85 PEIG – – Pericardial cell (13–16) 4.1ME28 GCGCATGH 0.28 30.17 PCEG – – Ventral nerve cord PR (11–12) 5.75
ME29 WAATCARCGC 0.275 13.82 G – – – –ME30 AATTAANNNNNCATNA 0.271 16.44 G Antennapedia – – –ME31 GCGTSAAA 0.271 29.95 PG – – – –ME32 YGCGYRTCAWT 0.269 12.87 G – – – –ME33 GCGTTGAYA 0.269 15.1 PG – – – –ME34 AAATKKCATTA 0.266 14.04 PG – – – –ME35 RACASCTGY 0.266 28.38 PCEG Scute – Ventral sensory complex SA (11–12) 4.08
ME36 TGTCAATTG 0.265 12.65 PG – – Tracheal system (13–16) 4.56
ME37 WAATKNNNNNCRCGY 0.261 23.34 PEG – – – –ME38 CASGTAR 0.261 9.24 PEG Single-minded 4.58 Ventral epidermis PR (11–12) 7.41
ME39 WCACGTGC 0.26 10.54 PCE5IG Enhancer of split – – –ME40 CATTANNNWAATT 0.259 19.02 G – – – –
The top 40 of 145 are shown. MEC, motif excess conservation; MCS, motif conservation score. See Supplementary Table 5c for the full table.* Region where the motif was found: P, promoter, C, core promoter; E, enhancers; 5, 59 UTR; I, intron; G, intergenic genome.{The known transcription factor motif matching the consensus sequence.{A multiplicity score is reported for motifs with many repeated occurrences.1 Tissue where motif is most strongly enriched or depleted, and corresponding score (positive, enrichment; negative, depletion). PR, primordium; SA, specific anlage. @
ARTICLES NATURE | Vol 000 | 00 Month 2007
12

8. Lim, L. P. et al. The microRNAs of Caenorhabditis elegans. Genes Dev. 17, 991–1008(2003).
9. Lim, L. P. et al. Vertebrate microRNA genes. Science 299, 1540 (2003).10. Lai, E. C., Tomancak, P., Williams, R. W. & Rubin, G. M. Computational
identification of Drosophila microRNA genes. Genome Biol. 4, R42 (2003).11. Berezikov, E. et al. Phylogenetic shadowing and computational identification of
human microRNA genes. Cell 120, 21–24 (2005).12. Xie, X. et al. Systematic discovery of regulatory motifs in human promoters and 39
UTRs by comparison of several mammals. Nature 434, 338–345 (2005).13. Ettwiller, L. et al. The discovery, positioning and verification of a set of
transcription-associated motifs in vertebrates. Genome Biol. 6, R104 (2005).14. Chan, C. S., Elemento, O. & Tavazoie, S. Revealing posttranscriptional regulatory
elements through network-level conservation. PLoS Comput. Biol. 1, e69 (2005).15. Boffelli, D. et al. Phylogenetic shadowing of primate sequences to find functional
regions of the human genome. Science 299, 1391–1394 (2003).16. Cooper, G. M. et al. Distribution and intensity of constraint in mammalian
genomic sequence. Genome Res. 15, 901–913 (2005).17. Margulies, E. H., Blanchette, M., Haussler, D. & Green, E. D. Identification and
characterization of multi-species conserved sequences. Genome Res. 13,2507–2518 (2003).
18. Thomas, J. W. et al. Comparative analyses of multi-species sequences fromtargeted genomic regions. Nature 424, 788–793 (2003).
19. Eddy, S. R. A model of the statistical power of comparative genome sequenceanalysis. PLoS Biol. 3, e10 (2005).
20. Bergman, C. M. et al. Assessing the impact of comparative genomic sequencedata on the functional annotation of the Drosophila genome. Genome Biol. 3,RESEARCH0086 (2002).
21. Rubin, G. M. & Lewis, E. B. A brief history of Drosophila’s contributions to genomeresearch. Science 287, 2216–2218 (2000).
22. Adams, M. D. et al. The genome sequence of Drosophila melanogaster. Science 287,2185–2195 (2000).
23. Misra, S. et al. Annotation of the Drosophila melanogaster euchromatic genome: asystematic review. Genome Biol. 3, RESEARCH0083 (2002).
24. Celniker, S. E. & Rubin, G. M. The Drosophila melanogaster genome. Annu. Rev.Genomics Hum. Genet. 4, 89–117 (2003).
25. Ashburner, M. & Bergman, C. M. Drosophila melanogaster: a case study of a modelgenomic sequence and its consequences. Genome Res. 15, 1661–1667 (2005).
26. Matthews, K. A., Kaufman, T. C. & Gelbart, W. M. Research resources forDrosophila: the expanding universe. Nature Rev. Genet. 6, 179–193 (2005).
27. Venken, K. J., He, Y., Hoskins, R. A. & Bellen, H. J. P[acman]: a BAC transgenicplatform for targeted insertion of large DNA fragments in D. melanogaster. Science314, 1747–1751 (2006).
28. Dietzl, G. et al. A genome-wide transgenic RNAi library for conditional geneinactivation in Drosophila. Nature 448, 151–156 (2007).
29. Spradling, A. C. et al. The Berkeley Drosophila Genome Project gene disruptionproject: Single P-element insertions mutating 25% of vital Drosophila genes.Genetics 153, 135–177 (1999).
30. St Johnston, D. The art and design of genetic screens: Drosophila melanogaster.Nature Rev. Genet. 3, 176–188 (2002).
31. Richards, S. et al. Comparative genome sequencing of Drosophila pseudoobscura:chromosomal, gene, and cis-element evolution. Genome Res. 15, 1–18 (2005).
32. Drosophila 12 Genomes Consortium.A Evolution of genes and genomes on theDrosophila phylogeny. Nature. doi:10.1038/nature06341 (this issue) (2007).
33. Siepel, A. et al. Evolutionarily conserved elements in vertebrate, insect, worm, andyeast genomes. Genome Res. 15, 1034–1050 (2005).
34. Nekrutenko, A., Makova, K. D. & Li, W. H. The KA/KS ratio test for assessing theprotein-coding potential of genomic regions: an empirical and simulation study.Genome Res. 12, 198–202 (2002).
35. Eddy, S. R. Computational genomics of noncoding RNA genes. Cell 109, 137–140(2002).
36. Bompfuenewerer, A. F. et al. Evolutionary patterns of non-coding RNAs. Theor.Biosci. 123, 301–369 (2004).
37. Reese, M. G. et al. Genome annotation assessment in Drosophila melanogaster.Genome Res. 10, 483–501 (2000).
38. Rubin, G. M. et al. A Drosophila complementary DNA resource. Science 287,2222–2224 (2000).
39. Stapleton, M. et al. A Drosophila full-length cDNA resource. Genome Biol. 3,RESEARCH0080 (2002).
40. Hild, M. et al. An integrated gene annotation and transcriptional profilingapproach towards the full gene content of the Drosophila genome. Genome Biol. 5,R3 (2003).
41. Yandell, M. et al. A computational and experimental approach to validatingannotations and gene predictions in the Drosophila melanogaster genome. Proc.Natl Acad. Sci. USA 102, 1566–1571 (2005).
42. Manak, J. R. et al. Biological function of unannotated transcription during the earlydevelopment of Drosophila melanogaster. Nature Genet. 38, 1151–1158 (2006).
43. Lin, M. F.B et al. Revisiting the protein-coding gene catalog of Drosophilamelanogaster using twelve fly genomes. Genome Res. (in the press).
44. Yang, Z. & Bielawski, J. P. Statistical methods for detecting molecular adaptation.Trends Ecol. Evol. 15, 496–503 (2000).
45. Mignone, F., Grillo, G., Liuni, S. & Pesole, G. Computational identification ofprotein coding potential of conserved sequence tags through cross-speciesevolutionary analysis. Nucleic Acids Res. 31, 4639–4645 (2003).
46. Zhang, L., Pavlovic, V., Cantor, C. R. & Kasif, S. Human-mouse gene identificationby comparative evidence integration and evolutionary analysis. Genome Res. 13(6A), 1190–1202 (2003).
47. Crosby, M. A. et al. FlyBase: genomes by the dozen. Nucleic Acids Res. 35(Database issue) D486–D491 (2007).
48. Ashburner, M. et al. Gene ontology: tool for the unification of biology. The GeneOntology Consortium. Nature Genet. 25, 25–29 (2000).
49. Ochman, H., Ajioka, J. W., Garza, D. & Hartl, D. L. Inverse polymerase chainreaction. Bio/Technology 8, 759–760 (1990).
50. Hoskins, R. A. et al. Rapid and efficient cDNA library screening by self-ligation ofinverse PCR products (SLIP). Nucleic Acids Res. 33, e185 (2005).
51. Wan, K. H. et al. High-throughput plasmid cDNA library screening. NatureProtocols 1, 624–632 (2006).
52. Hahn, M. W., Han, M. V. & Han, S. G. Gene family evolution across 12 Drosophilagenomes. PLoS Genet. (in the press).
53. Andrews, J. et al. The stoned locus of Drosophila melanogaster produces adicistronic transcript and encodes two distinct polypeptides. Genetics 143,1699–1711 (1996).
54. Brogna, S. & Ashburner, M. The Adh-related gene of Drosophila melanogaster isexpressed as a functional dicistronic messenger RNA: multigenic transcription inhigher organisms. EMBO J. 16, 2023–2031 (1997).
55. Hatfield, D. L. & Gladyshev, V. N. How selenium has altered our understanding ofthe genetic code. Mol. Cell. Biol. 22, 3565–3576 (2002).
56. Kryukov, G. V. et al. Characterization of mammalian selenoproteomes. Science300, 1439–1443 (2003).
57. Copeland, P. R. Regulation of gene expression by stop codon recoding:selenocysteine. Gene 312, 17–25 (2003).
58. Castellano, S. et al. In silico identification of novel selenoproteins in the Drosophilamelanogaster genome. EMBO Rep. 2, 697–702 (2001).
59. von der Haar, T. & Tuite, M. F. Regulated translational bypass of stop codons inyeast. Trends Microbiol. 15, 78–86 (2007).
60. Luo, G. X. et al. A specific base transition occurs on replicating hepatitis delta virusRNA. J. Virol. 64, 1021–1027 (1990).
61. Casey, J. L. & Gerin, J. L. Hepatitis D virus RNA editing: specific modification ofadenosine in the antigenomic RNA. J. Virol. 69, 7593–7600 (1995).
62. Steneberg, P. et al. Translational readthrough in the hdc mRNA generates a novelbranching inhibitor in the Drosophila trachea. Genes Dev. 12, 956–967 (1998).
63. Bass, B. L. RNA editing by adenosine deaminases that act on RNA. Annu. Rev.Biochem. 71, 817–846 (2002).
64. Ivanov, I. P. et al. The Drosophila gene for antizyme requires ribosomalframeshifting for expression and contains an intronic gene for snRNP Sm D3 onthe opposite strand. Mol. Cell. Biol. 18, 1553–1561 (1998).
65. Eddy, S. R. Non-coding RNA genes and the modern RNA world. Nature Rev. Genet.2, 919–929 (2001).
66. Yuan, G. et al. RNomics in Drosophila melanogaster: identification of 66 candidatesfor novel non-messenger RNAs. Nucleic Acids Res. 31, 2495–2507 (2003).
67. Lestrade, L. & Weber, M. J. snoRNA-LBME-db, a comprehensive database ofhuman H/ACA and C/D box snoRNAs. Nucleic Acids Res. 34 (Database issue),D158–D162 (2006).
68. Bier, E. Drosophila, the golden bug, emerges as a tool for human genetics. NatureRev. Genet. 6, 9–23 (2005).
69. Hoopengardner, B., Bhalla, T., Staber, C. & Reenan, R. Nervous system targets ofRNA editing identified by comparative genomics. Science 301, 832–836 (2003).
70. Mignone, F. et al. UTRdb and UTRsite: a collection of sequences and regulatorymotifs of the untranslated regions of eukaryotic mRNAs. Nucleic Acids Res. 33(Database issue), D141–D146 (2005).
71. Cohen, R. S., Zhang, S. & Dollar, G. L. The positional, structural, and sequencerequirements of the Drosophila TLS RNA localization element. RNA 11, 1017–1029(2005).
72. Allemand, F. et al. Escherichia coli ribosomal protein L20 binds as a singlemonomer to its own mRNA bearing two potential binding sites. Nucleic Acids Res.35, 3016–3031 (2007).
73. Okumura, T., Matsumoto, A., Tanimura, T. & Murakami, R. An endoderm-specificGATA factor gene, dGATAe, is required for the terminal differentiation of theDrosophila endoderm. Dev. Biol. 278, 576–586 (2005).
74. Park, S. W. et al. An evolutionarily conserved domain of roX2 RNA is sufficient forinduction of H4-Lys16 acetylation on the Drosophila X chromosome. Genetics. (inthe press).
75. Park, Y. & Kuroda, M. I. Epigenetic aspects of X-chromosome dosagecompensation. Science 293, 1083–1085 (2001).
76. Berezikov, E., Cuppen, E. & Plasterk, R. H. Approaches to microRNA discovery.Nature Genet. 38 (Suppl 1), S2–S7 (2006).
77. Bartel, D. P. MicroRNAs: genomics, biogenesis, mechanism, and function. Cell 116,281–297 (2004).
78. Stark, A. et al. Systematic discovery and characterization of fly microRNAs using12 Drosophila genomes. Genome Res.. (in the press).
79. Ruby, J. G. et al. Evolution, biogenesis, expression, and target predictions of asubstantially expanded set of Drosophila microRNAs. Genome Res.. (in the press).
80. Pekarsky, Y. et al. Tcl1 expression in chronic lymphocytic leukemia is regulated bymiR-29 and miR-181. Cancer Res. 66, 11590–11593 (2006).
81. Ruby, J. G., Jan, C. H. & Bartel, D. P. Intronic microRNA precursors that bypassDrosha processing. Nature 448, 83–86 (2007).
Nature nature06340.3d 19/10/07 13:59:39
NATURE | Vol 000 | 00 Month 2007 ARTICLES
13
82. Okamura, K. et al. The mirtron pathway generates microRNA-class regulatoryRNAs in Drosophila. Cell 130, 89–100 (2007).
83. Lewis, B. P. et al. Prediction of mammalian microRNA targets. Cell 115, 787–798(2003).
84. Stark, A., Brennecke, J., Russell, R. B. & Cohen, S. M. Identification of DrosophilamicroRNA targets. PLoS Biol. 1, E60 (2003).
85. Lai, E. C. Micro RNAs are complementary to 39 UTR sequence motifs that mediatenegative post-transcriptional regulation. Nature Genet. 30, 363–364 (2002).
86. Lewis, B. P., Burge, C. B. & Bartel, D. P. Conserved seed pairing, often flanked byadenosines, indicates that thousands of human genes are microRNA targets. Cell120, 15–20 (2005).
87. Tompa, M. Identifying functional elements by comparative DNA sequenceanalysis. Genome Res. 11, 1143–1144 (2001).
88. Stormo, G. D. DNA binding sites: representation and discovery. Bioinformatics 16,16–23 (2000).
89. Stark, A., Kheradpour, P., Roy, S. & Kellis, M. Reliable prediction of regulatortargets using 12 Drosophila genomes. Genome Res. (in the press).
90. Stathopoulos, A. & Levine, M. Genomic regulatory networks and animaldevelopment. Dev. Cell 9, 449–462 (2005).
91. Schroeder, M. D. et al. Transcriptional control in the segmentation gene networkof Drosophila. PLoS Biol. 2, e271 (2004).
92. Zeitlinger, J. et al. Whole-genome ChIP-chip analysis of Dorsal, Twist, and Snailsuggests integration of diverse patterning processes in the Drosophila embryo.Genes Dev. 21, 385–390 (2007).
93. Kanehisa, M. et al. The KEGG resource for deciphering the genome. Nucleic AcidsRes. 32 (Database issue) D277–D280 (2004).
94. Berman, B. P. et al. Exploiting transcription factor binding site clustering to identifycis-regulatory modules involved in pattern formation in the Drosophila genome.Proc. Natl Acad. Sci. USA 99, 757–762 (2002).
95. Markstein, M. et al. A regulatory code for neurogenic gene expression in theDrosophila embryo. Development 131, 2387–2394 (2004).
96. Philippakis, A. A. et al. Expression-guided in silico evaluation of candidate cisregulatory codes for Drosophila muscle founder cells. PLoS Comput. Biol. 2, e53(2006).
97. Smale, S. T. & Kadonaga, J. T. The RNA polymerase II core promoter. Annu. Rev.Biochem. 72, 449–479 (2003).
98. Gerber, A. P. et al. Genome-wide identification of mRNAs associated with thetranslational regulator PUMILIO in Drosophila melanogaster. Proc. Natl Acad. Sci.USA 103, 4487–4492 (2006).
99. Zubiaga, A. M., Belasco, J. G. & Greenberg, M. E. The nonamer UUAUUUAUU isthe key AU-rich sequence motif that mediates mRNA degradation. Mol. Cell. Biol.15, 2219–2230 (1995).
100. Fairbrother, W. G., Yeh, R. F., Sharp, P. A. & Burge, C. B. Predictive identification ofexonic splicing enhancers in human genes. Science 297, 1007–1013 (2002).
101. Kloosterman, W. P., Wienholds, E., Ketting, R. F. & Plasterk, R. H. Substraterequirements for let-7 function in the developing zebrafish embryo. Nucleic AcidsRes. 32, 6284–6291 (2004).
102. Grimson, A. et al. MicroRNA targeting specificity in mammals: determinantsbeyond seed pairing. Mol. Cell 27, 91–105 (2007).
103. Farh, K. K. et al. The widespread impact of mammalian MicroRNAs on mRNArepression and evolution. Science 310, 1817–1821 (2005).
104. Stark, A. et al. Animal microRNAs confer robustness to gene expression and havea significant impact on 39 UTR evolution. Cell 123, 1133–1146 (2005).
105. Rajewsky, N. microRNA target predictions in animals. Nature Genet. 38 (suppl. 1),S8–S13 (2006).
106. Elnitski, L. et al. Distinguishing regulatory DNA from neutral sites. Genome Res. 13,64–72 (2003).
107. Abrams, E. W. & Andrew, D. J. CrebA regulates secretory activity in the Drosophilasalivary gland and epidermis. Development 132, 2743–2758 (2005).
108. Sandmann, T. et al. A temporal map of transcription factor activity: mef2 directlyregulates target genes at all stages of muscle development. Dev. Cell 10, 797–807(2006).
109. Sandmann, T. et al. A core transcriptional network for early mesodermdevelopment in Drosophila melanogaster. Genes Dev. 21, 436–449 (2007).
110. Sethupathy, P., Corda, B. & Hatzigeorgiou, A. G. TarBase: A comprehensivedatabase of experimentally supported animal microRNA targets. RNA 12, 192–197(2006).
111. Lee, T. I. et al. Control of developmental regulators by Polycomb in humanembryonic stem cells. Cell 125, 301–313 (2006).
112. Boyer, L. A. et al. Core transcriptional regulatory circuitry in human embryonicstem cells. Cell 122, 947–956 (2005).
113. Aerts, S., van Helden, J., Sand, O. & Hassan, B. Fine-tuning enhancer models topredict transcriptional targets across multiple genomes. PLoS ONE. (in the press).
114. Maeder, M., Polansky, B., Robson, B. & Eastman, D. Phylogenetic footprintinganalysis in the upstream regulatory regions of the Drosophila Enhancer of splitgenes. Genetics. (in the press).
115. Van Doren, M. et al. Negative regulation of proneural gene activity: hairy is a directtranscriptional repressor of achaete. Genes Dev. 8, 2729–2742 (1994).
116. Kraut, R. & Levine, M. Spatial regulation of the gap gene giant during Drosophiladevelopment. Development 111, 601–609 (1991).
117. Bailey, A. M. & Posakony, J. W. Suppressor of hairless directly activatestranscription of enhancer of split complex genes in response to Notch receptoractivity. Genes Dev. 9, 2609–2622 (1995).
118. Yin, Z. & Frasch, M. Regulation and function of tinman during dorsal mesoderminduction and heart specification in Drosophila. Dev. Genet. 22, 187–200 (1998).
119. Margulies, E. H. et al. An initial strategy for the systematic identification offunctional elements in the human genome by low-redundancy comparativesequencing. Proc. Natl Acad. Sci. USA 102, 4795–4800 (2005).
120. Margulies, E. H., Chen, C. W. & Green, E. D. Differences between pair-wise andmulti-sequence alignment methods affect vertebrate genome comparisons.Trends Genet. 22, 187–193 (2006).
121. Farabaugh, P. J. Programmed translational frameshifting. Annu. Rev. Genet. 30,507–528 (1996).
122. Odom, D. T. et al. Tissue-specific transcriptional regulation has divergedsignificantly between human and mouse. Nature Genet. 39, 730–732 (2007).
123. Ludwig, M. Z. & Kreitman, M. Evolutionary dynamics of the enhancer region ofeven-skipped in Drosophila. Mol. Biol. Evol. 12, 1002–1011 (1995).
124. Ludwig, M. Z. et al. Functional evolution of a cis-regulatory module. PLoS Biol. 3,e93 (2005).
125. The ENCODE Project Consortium.. Identification and analysis of functionalelements in 1% of the human genome by the ENCODE pilot project. Nature 447,799–816 (2007).
126. Kent, W. J. et al. The human genome browser at UCSC. Genome Res. 12, 996 C–1006(2002).
Supplementary Information is linked to the online version of the paper atwww.nature.com/nature.
Acknowledgements A.S. was supported in part by the Schering AG/Ernst ScheringFoundation and in part by the Human Frontier Science Program Organization(HFSPO). P.K. was supported in part by a National Science Foundation GraduateResearch Fellowship. J.S.P. thanks B. Raney and R. Baertsch, and the DanishMedical Research Council and the National Cancer Institute for support. J.B. thanksthe Schering AG/Ernst Schering Foundation for a postdoctoral fellowship. L.Partsthanks J. Vilo. S.R. was supported by a HHMI-NIH/NIBIB Interfaces Training Grantand thanks T. Lane and M. Werner-Washburne. M.K. was supported by start-upfunds from the MIT Electrical Engineering and Computer Science Laboratory, theBroad Institute of MIT and Harvard, and the MIT Computer Science and ArtificialIntelligence Laboratory, and by the Distinguished Alumnus (1964) CareerDevelopment Professorship.
Author Contributions Organizing committee: Manolis Kellis, William Gelbart,Doug Smith, Andrew G. Clark, Michael E. Eisen, Thomas C. Kaufman;protein-coding gene prediction: Michael F. Lin, Ameya N. Deoras, Mira V. Han,Matthew W. Hahn, Donald G. Gilbert, Michael Weir, Michael Rice, Manolis Kellis;manual curation of protein-coding genes: Madeline A. Crosby, Harvard FlyBasecurators, William M. Gelbart; validation of protein-coding genes: Joseph W.Carlson, Berkeley Drosophila Genome Project, Susan E. Celniker; non-coding RNAgene prediction: Jakob S. Pedersen, David Haussler, Yongkyu Park, Seung-WonPark, Manolis Kellis; microRNA gene prediction: Alexander Stark, PouyaKheradpour, Leopold Parts, Manolis Kellis; microRNA cloning and sequencing:Julius Brennecke, Emily Hodges, Gregory J. Hannon; microRNA target prediction:Alexander Stark, J. Graham Ruby, Manolis Kellis, Eric C. Lai, David P. Bartel; motifidentification: Alexander Stark, Pouya Kheradpour, Manolis Kellis; motif instanceprediction: Alexander Stark, Pouya Kheradpour, Sushmita Roy, Morgan L. Maeder,Benjamin J. Polansky, Bryanne E. Robson, Deborah A. Eastman, Stein Aerts, BassemHassan, Jacques van Helden, Manolis Kellis; genome alignments: Angie S. Hinrichs,W. James Kent, Anat Caspi, Lior Pachter, Colin N. Dewey, Benedict Paten;phylogeny and branch length estimation: Matthew D. Rasmussen, Manolis Kellis;final manuscript preparation: Alexander Stark, Michael F. Lin, Pouya Kheradpour,Jakob Pedersen, Manolis Kellis. B.P., D.H., D.P.B., E.H., G.J.H., J.B., J.G.R. and T.C.K.are Investigators of the Howard Hughes Medical Institute. C
Author Information Reprints and permissions information is available atwww.nature.com/reprints. Correspondence and requests for materials should beaddressed to M.K. ([email protected]).
Harvard FlyBase curators Madeline A. Crosby1, Beverley B. Matthews1, Andrew J.Schroeder1, L. Sian Gramates1, Susan E. St Pierre1, Margaret Roark1, Kenneth L. WileyJr1, Rob J. Kulathinal1, Peili Zhang1, Kyl V. Myrick1, Jerry V. Antone1 & William M.Gelbart1
Berkeley Drosophila Genome Project Joseph W. Carlson2, Charles Yu2, Soo Park2,Kenneth H. Wan2 & Susan E. Celniker2
1FlyBase, The Biological Laboratories, Harvard University, 16 Divinity Avenue,Cambridge, Massachusetts 02138, USA. 2BDGP, LBNL, 1 Cyclotron Road MS 64-0119,Berkeley, California 94720, USA.
Nature nature06340.3d 19/10/07 13:59:47
ARTICLES NATURE | Vol 000 | 00 Month 2007
14