
DoesQualityMatter.pdf
26
Get-Out-the-Vote Phone Calls: Does Quality Matter? Shang E. Ha Postdoctoral Associate, Institution for Social and Policy Studies Yale University 77 Prospect Street New Haven, CT 06511 [email protected] Dean S. Karlan Professor of Economics Fellow, Institution for Social and Policy Studies Yale University 77 Prospect Street New Haven, CT 06511 [email protected] September 25, 2008 forthcoming American Politics Research
-
Upload
ralphyoung -
Category
Documents
-
view
213 -
download
0
Transcript of DoesQualityMatter.pdf

Get-Out-the-Vote Phone Calls: Does Quality Matter?
Shang E. Ha Postdoctoral Associate,
Institution for Social and Policy Studies Yale University
77 Prospect Street New Haven, CT 06511
Dean S. Karlan Professor of Economics
Fellow, Institution for Social and Policy Studies Yale University
77 Prospect Street New Haven, CT 06511 [email protected]
September 25, 2008
forthcoming American Politics Research

2
Abstract This paper reports the results of a field experiment testing the effectiveness of different quality get-out-the-vote (GOTV) non-partisan phone calls. During the week preceding the November 2004 election, we randomly assigned registered voters in North Carolina and Missouri to one of three live phone calls with varying length and content. The scripts are (1) standard GOTV, (2) interactive GOTV, and (3) interactive GOTV with a request for mobilizing neighbors. We find that people assigned to the interactive GOTV treatment are more likely to turn out, while the effect of the “get your neighbors to vote” script is relatively as weak as that of the standard script. The findings suggest that interactive phone calls generally tend to increase voter turnout, but in order for a phone call to be effective, the message needs to be focused. The borderline statistical significance of the script that encourages neighbors’ participation invites replication of this experiment.
Acknowledgement: the authors would like to thank Institution for Social and Policy Studies (ISPS) for the financial support, Don Green for helpful commentary and guidance, and Terence Leong for valuable technical assistance.

3
Every year, millions of phone calls are made in the United States to mobilize
voters to presidential, congressional, gubernatorial, and local elections. Other get-out-
the-vote (GOTV) strategies include door-to-door canvassing, leaflets, door-hangers,
direct mails, and emails. Phone mobilization has been popular not only because phone
calls can cover larger areas but because they are especially suitable for the final push, two
or three days before Election Day. However, the effectiveness of phone calls has been
often questioned and the results of previous field experiments are mixed. Some report
that phone calls are good at mobilizing voters in both partisan and non-partisan settings
(e.g., Nickerson 2006; Nickerson, Friedrichs, and King 2006), whereas others find no
discernible effects (e.g., Gerber and Green 2000, 2005a).
Explanations for this discrepancy have been offered referring to two related
attributes of phone calls: mode and quality. On one hand, the effectiveness of phone calls
seems to depend on the mode of calls, i.e., volunteers, commercial or professional phone
banks, and prerecorded or robotic calls. Volunteer phone calls can be effective at
increasing turnout because politically motivated volunteers typically excel in
communicating with potential voters in casual yet genuine conversation. In contrast, in
professional phone banks, callers are perhaps less passionate or more formal, and thus
may fail to establish authentic personal connections with the potential voters. Such a lack
of conversational tone and pace is also said to explain the overall ineffectiveness of
robotic calls. This hypothesis is supported by prior studies. A substantively and
statistically significant increase in turnout results mainly from calls made by volunteers
(Michelson, Garcia Bedolla, and Green 2007; Nickerson 2006; Nickerson, Friedrichs, and
4
King 2006) and non-findings stem from field experiments using commercial phone banks
(Gerber and Green 2000, 2005a) and robotic calls (Ramirez 2005).
On the other hand, perhaps the “mode” of the phone call is not an issue. Instead
of a short, structured phone call, a professional phone bank which employs a more
conversational approach can generate positive results, just as the volunteers do. In a
recent randomized field experiment covering 18 different counties in the United States,
Nickerson (2007) finds that professional phone calls with some quality control (i.e.,
interactive scripts and easy-to-follow pace with carefully inserted short pauses) are more
likely to increase voter turnout, while volunteer calls lose their efficacy in mobilizing
voters when they are less conversational and less engaging to recipients. This finding
suggests that the effectiveness of phone call mobilization efforts do not hinge on the
difference in mode but on the difference in quality. So, careful monitoring of quality can
make the usage of commercial phone banks to be a natural choice because professionals
are generally better trained and more experienced than volunteers.
This study, based on a field experiment conducted during the week preceding the
November 2004 election in North Carolina and Missouri with a professional phone bank
firm, examines the effects of quality of phone calls on voter turnout. We are particularly
interested in an aspect of the GOTV phone call quality, i.e., interactive scripts. We
suppose that the more interactive the script is, the higher the phone call quality is because
interactive scripts are more likely to draw attention from the recipient.
This study is different from an existing study on the GOTV phone call quality
(Nickerson 2007) in two aspects. First, as Nickerson (2007) is primarily interested in the
qualitative differences in two modes (commercial vs. volunteer) of phone calls, multiple

5
phone banks (i.e., national professional, local volunteer, and highly coached local
professional) were used, and therefore scripts significantly vary not only across phone
banks but across experiment sites. Instead, our live phone call study relies on a single
commercial phone bank. The usage of a single phone bank is especially noteworthy
because it makes possible direct comparison of different scripts: as opposed to Nickerson
(2007) who compared interactive commercial phone calls with non-interactive volunteer
phone calls, we compare interactive commercial phone calls with non-interactive
commercial phone calls. Second, unlike Nickerson (2007) that focuses on tone and pace
of the phone calls, we simply manipulate the number of conversational back-and-forth
and content of messages without deliberately monitoring the callers’ tone and pace. Our
experiment is designed to draw nuanced implications by using three treatments: standard
(with one interaction), augmented (with two interactions), and augmented with a request
for mobilizing neighbors (with three interactions). We hypothesize that the more
conversational back-and-forth does the script contain, the more effective it is at
mobilizing voters.
Previous Phone Call Experiments: A Meta-Analysis
In order to illustrate the significance of the phone call quality, we conduct a meta-
analysis of previous field experiments using commercial phone banks. As of now, there
exist 21 field experiment studies – both published and unpublished -- that examine the
effects of phone calls on voter turnout (Green and Gerber 2008). Among them, 10
studies relied entirely or partially on professional phone calls (Arceneaux, Gerber, and
Green 2007; Cardy 2005; Gerber and Green 2000; Gerber and Green 2005a; Green 2004;

6
Green 2006; McNulty 2005; Nickerson 2007; Panagopoulos 2006; Panagopoulos 2007)
and the other 11 studies used either volunteers or robotic calls.1 Apart from Nickerson
(2007)’s high-quality phone call experiment, 9 professional phone call studies can be
categorized into experiments using standard phone calls, characterized by simple GOTV
scripts without interactions with the recipients.
The treatment effect estimates were obtained via the following two steps: (1)
aggregate the coefficients and standard errors of sub-studies if they were conducted by
the same phone bank and the same experimental protocol (for instance, we constructed a
single set of coefficient and standard error by aggregating the results from 15 different
locations in Nickerson (2007)); and (2) analyze the coefficients and standard errors from
a two-stage least squares (2SLS) model (i.e., treatment-on-treated effects) that does not
include any covariates. When aggregating the numbers from sub-studies, we used fixed
effects, assuming that all of the studies we examine as a whole are considered to be
conducted under similar conditions with similar subjects (in other words, assuming that
the effect sizes of the studies are all randomly drawn from a single population).
TABLE 1 HERE
The meta-analysis permits us to combine the results of previous studies by
appropriately weighting each study. In other words, the meta-analysis yields a weighted
average treatment effect across the studies, which, unlike the simple average effect, take
the variance of each study into consideration. Table 1 shows the results from a meta-
analysis of previous commercial phone call field experiments. The key element is Q-
statistic which tells us whether or not there is a significant variation in study outcomes.
1 For Gerber and Green (2000)’s New Haven/West Haven experiments, we used the updated numbers from Gerber and Green (2005b).
7
Without Nickerson’s (2007) high-quality phone call study, we cannot reject the null
hypothesis that there is no variation in effect sizes among these studies (p = 0.660).
Adding Nickerson (2007) not only allows us to reject the null hypothesis of homogeneity
across the studies (p = 0.026) but increases the weighted average treatment-on-treated
effect from 0.005 to 0.008 (fixed effects) or 0.009 (random effects). This result suggests
that quality would matter in determining the significance of the effects of GOTV phone
calls on voter turnout. Our study will confirm this finding.
Experimental Design
The data was obtained via the state voter registration and turnout database in
North Carolina and Missouri. The sample frame of the experiment included all registered
voters who meet all five of the following criteria: (1) 90 years old or younger, (2) 9-digit
zip code identifiable in the data (about 95% of the total sample), (3) not coded as an
absentee ballot voter by the state voter registration database, (4) residential city was the
same as the mailing city, (5) lived in a “dense” 9-digit zip code. We defined a 9-digit zip
code as “dense” if it met two criteria: (a) at least five individuals were registered to vote,
and (b) at least one of the mailing addresses in that 9-digit zip code was listed as an
apartment. This density measure was included because the experiment was originally
designed to examine the possibility of indirect mobilization within the recipients’ social
network.2 By doing so, we yielded a sample of 274,443 individuals, 53,996 in Missouri
and 220,447 in North Carolina.
2 The spill-over effect of the GOTV phone calls within neighborhoods is not the main interest of this paper, so it is not discussed here.

8
Based on this sampling frame, we randomly assigned the subjects to treatment
and control groups as follows. First, 20% of the 9-digit zip codes were assigned to the
control group in which nobody received a phone call. Next, we conducted a block
randomization in which each block was a 9-digit zip code.3 Last, treatment group
individuals in selected blocks were randomly assigned, with equal probability, to one of
the four live phone calls scripts: (1) a standard GOTV, (2) an augmented script that was
longer and involved some conversational back-and-forth between callers and recipients,
(3) an augmented script that included both conversation and a request to mobilize their
neighbors to vote, and (4) a script that urged seat belt usage (Placebo). In this paper, we
merge the placebo group with the control group because there is no noticeable difference
between these two groups.4
The key determinant of the quality of the phone call is the number of
conversational back-and-forth in the script: one in the standard script, two in the
augmented script, and three in the neighbor encouragement script. The GOTV scripts
were developed in collaboration with veteran political consultants who manage the
commercial phone bank. Both the augmented script and the “get your neighbors to vote”
script also feature a short call-back, used when a potential voter requested detailed
polling place information.5 Full scripts are available in Appendix A.
3 The block randomization was performed as follows. For each remaining 9-digit zip code, j, we randomly assigned a target penetration rate, pj. The mean target penetration rate was 40% with a uniform distribution between 10% and 70%. The individuals within each 9-digit zip code were ordered randomly. If there were nj individuals in a 9-digit zip code, there were integer(njpj)+ rj individuals assigned to the treatment and nj – (integer(njpj)+ rj) individuals assigned to the control group, where rj is a randomly assigned “rounding” variable which is equal to 1 with 50% probability and 0 with 50% probability. 4 Also, the contact rate of the buckle-up calls is very similar to that of other GOTV phone calls used in this study. 5 Despite the follow-up phone calls, this study examines the effect of a single GOTV phone call. Call backs were self-selected and their proportion is ignorable – only 0.02% of the completed phone calls.

9
We conducted a series of tests to ensure that randomization resulted in balanced
treatment and control groups with respect to a variety of observable characteristics (see
Appendix B). Both groups do not differ in terms of voting propensity: p-values
associated with Chi-square test of independence are 0.43 (voted in 2000), 0.89 (voted in
2001), 0.72 (voted in 2002), and 0.21 (voted in 2003), respectively. An additional
randomization check was conducted by regressing assignment to the treatment condition
(i.e., all three types of phone calls) on past voter history (2000-2003), state dummy, age,
and gender. No systematic correlation was detected between treatment and control group
in terms of observed characteristics: p-value associated with F-test of the significance of
these covariates was 0.63.
TABLE 2 HERE
Table 2 presents a raw comparison of the outcome of the experiment. We find a
35.3% contact rate (i.e., completed calls, excluding hang-ups) and a 63.1% and 62.8%
voting rate in the treatment group and the control group, respectively, which yields a 0.3
percentage-point turnout differential in favor of the treatment group (when we aggregate
all three different treatment scripts). The contact rates slightly vary across three
treatment conditions: 34.6% for standard script, 33.0% for augmented script, and 38.3%
for augmented script with a request for mobilizing neighbors. Examining the turnout
rates separately for each treatment condition, we find that those in the augmented script
treatment are more likely to vote (63.7%) than those who were assigned to standard
phone calls or calls with “get your neighbors to vote” component (both 62.8%).
Statistical Models and Results

10
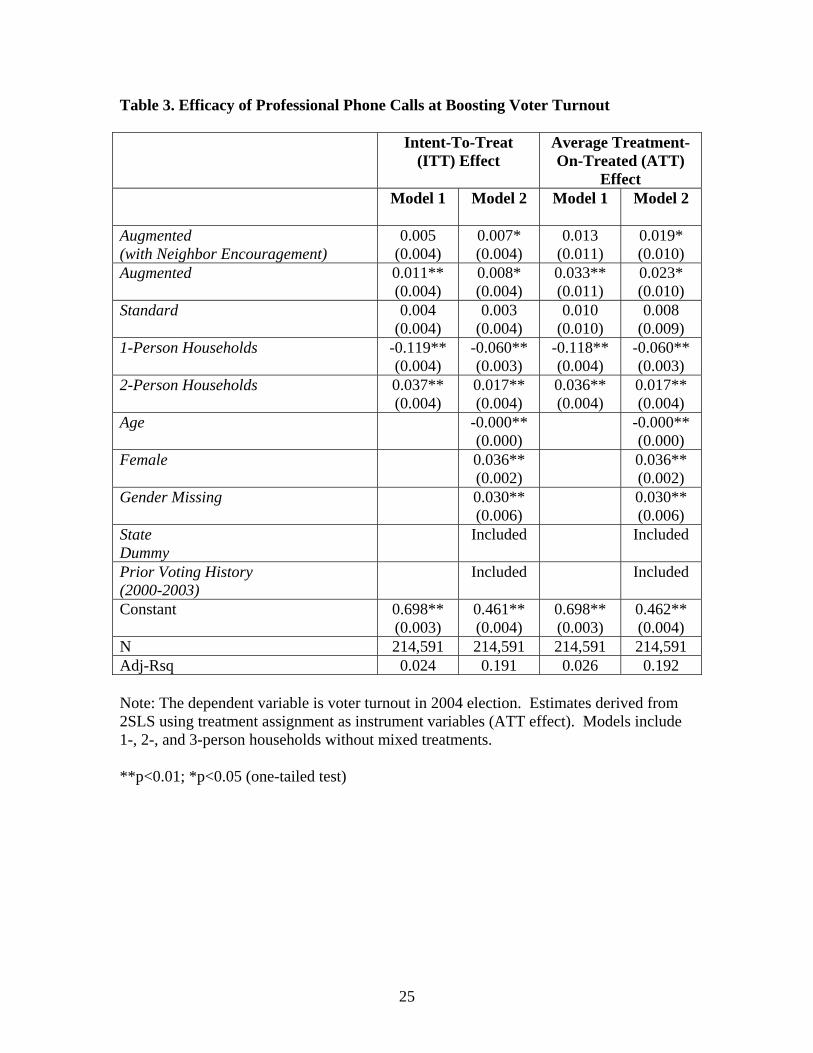
Table 3 reports our estimates of the effect of phone contact on voter turnout. The
dependent variable in our analysis is voter turnout in the 2004 election from public
records. We estimate both the intent-to-treat (ITT) effect and the average treatment-on
treated (ATT) effect. The ITT effect refers to the effect of assigning a subject to a
treatment, leaving aside the question of whether the subject actually received the
treatment. The ATT effect allows us to figure out the effect of assigning a subject to
actual treatment. The ATT effect is obtained either by dividing the ITT effect (i.e., the
observed difference in turnout between treatment and control groups) by the attempted
treatment rate, i.e., contact rate, or by regressing voter turnout on three indicators
(standard, augmented, and augmented with neighbor encouragement) for phone contact,
using random assignment to the treatment as the instrumental variable.6
TABLE 3 HERE
When analyzing the data, we focus on the direct effect of a treatment of the
treated individual because individuals, not households, were assigned to different
treatment conditions in this experiment.7 For example, 2-person households were
assigned to 16 different conditions: (1) both members got the same pair of
treatment/control (4 categories, i.e., neighbor encouragement-neighbor encouragement,
augmented-augmented, standard-standard, and control-control) and (2) both got different
pairs of treatment/control (12 (= 4P2) categories in total, e.g., neighbor encouragement-
6 The assignment to the treatment condition is a valid instrument for campaign contact to avoid biased estimates because the treatment is highly correlated with actual phone contact by construction, and is independent of all other underlying factors that cause voting (Angrist, Imbens, and Rubin 1996; Gerber and Green 2000). Of course, it is important to note that this treatment on the treated estimate should not necessarily be applied to those who would not be reached by a phone banking operation (i.e., those who do not answer the phone, do not have a landline phone, etc). 7 We do not have to employ cluster-robust standard errors here since individuals rather than sampling clusters (e.g., 9-digit zip codes and households sharing a single telephone number) were randomly assigned to the treatment and the control.

11
standard, standard-augmented, control-neighbor encouragement, etc). Assigning
individuals to different treatments in the same household will not allow us to examine the
direct effect of a treatment because the interactions between differently treated household
members may undermine the direct effect of each treatment. Therefore, we need to
exclude households under mixed treatment conditions to see the direct treatment effect.8
Table 3 presents the results from OLS and 2SLS regressions using a sub-sample
of 1-, 2-, and 3-person households without mixed treatments.9 To be precise, the sample
includes people who were assigned to the same set of treatment/control and those who
got any type of treatment (white other household member(s) were assigned to control) in
2- and 3-person households in conjunction with people in 1-person households. Models
also include the household dummies because the size of household now correlates with
our treatment variable. The OLS and 2SLS regressions report the ITT and ATT effect,
respectively. Since our main interest is the effect of treatment, not assignment, we
interpret the results using the ATT effect. A statistically and substantively significant
effect of a medium-length script is estimated to be 3.3 percentage-points without
covariates and 2.3 percentage-points with covariates.10 That means that an individual
who had a 50% probability of voting prior to the call would have a 53.3% (or 52.3%)
probability of voting after receiving the augmented phone call. Standard scripts and
augmented scripts with a request for mobilizing neighbors results in smaller effects, 1.0
percentage-points and 1.3 percentage-points, respectively (Model 1). The results do not
8 By doing so, we lose many observations (about 18% of the total subjects), but it does not affect the balance between treatment and control groups (see Appendix B). The result from a regression of assignment on several covariates tells us that there is no systematic correlation between treatment and control group in terms of observed characteristics: p-value associated with F-test of the significance of these covariates is 0.71. 9 1-, 2-, and 3-person households comprise about 94 percent of the whole sample. 10 When we use the whole sample, the effect of interactive phone call is estimated to be 3.1 percentage-points (without covariates) and 2.4 percentage-points (with covariates).

12
change much even after controlling for prior voting history, age, gender, and state where
call recipients reside (Model 2), although the effect of the neighbor encouragement script
increases to 1.9 percentage-points, which is statistically significant at p < 0.05 level using
one-tailed test.11 In short, these findings suggest that the quality of phone calls matters.
The magnitude of these effect sizes is very similar to those reported by past phone
experiments. The results from previous professional phone call studies using standard
scripts (e.g., Cardy 2005; Gerber and Green 2000; Gerber and Green 2005; McNulty
2005) mostly are around 0.4-0.5 percentage points (with some much smaller than these
numbers), which are smaller than the effect of all three scripts used in this study.
Interestingly, the magnitude of augmented, medium-length scripts is by and large
equivalent to the numbers from past volunteer phone call experiments, which range from
2.3 to 4.6 percentage points (e.g., Nickerson 2006; Nickerson, Friedrichs, and King 2006;
Ramirez 2005; Wong 2005), though it is smaller than the effect of deliberately well-
executed commercial phone calls, i.e., about 5.0 percentage-points (Nickerson 2007).
The finding that the professional calls with an augmented and conversational script are as
effective as usual volunteer calls confirms the significance of the quality of phone calls.
TABLE 4 HERE
To situate the findings from our experiment, we re-run a meta-analysis using
previous commercial phone call studies and ours. We include two coefficients and their
standard errors from this study in the dataset and define one from long and medium-
length scripts (combined using Model 1 in Table 3) as high-quality phone call estimate
and the other from short script as standard one. Hence, the number of studies is 12 and
11 Information about covariates improves prediction of the dependent variable by the independent variable. The fact that covariates are included in the model, however, does not substantially alter the relation between two variables.

13
two of them (Nickerson 2007 and ours for medium/long scripts) are considered field
experiments using high-quality phone calls. A meta-analysis with studies relying on
standard-quality phone calls (n=10) yields the same result as that reported in Table 1:
pooled estimate of both fixed and random effects is 0.005 and Q-statistic is 6.115 (p =
0.728). When the estimates from two high-quality phone call studies are included, the
average treatment effect increases to 0.01 and it suggests that there is more variation
across studies than we would expect by chance alone (Q-statistic = 22.005; p = 0.024).
Table 4 provides a strong result in support of the quality of phone calls with a positive
and statistically significant coefficient on the phone call quality dummy variable (i.e.,
high-quality versus standard-quality). We find this statistically significant result
regardless of whether or not we include additional covariates (i.e., partisan vs. non-
partisan message and years of experiments). The meta-regression states that high-quality
phone calls would increase the fraction of individuals who voted by about 2 percentage-
points compared with standard GOTV phone calls.
Discussion
The borderline significance of the script asking recipients to persuade their
neighbors to vote is interesting because the overall quality was intended to be equal to, if
not better than, the augmented script. The only difference lies in the fact that the longest
script includes one more feature, i.e., mobilization of neighbors. Given that other parts of
the script are the same as the medium-length script, this additive component seems to
undermine the effectiveness of phone mobilization, possibly by shifting the attention of
the recipients from a “vote yourself” message to a “get your neighbors to vote”

14
component. In other words, in contrast to our expectation, the effect of the neighbor
encouragement script is not greater than (albeit not statistically significantly different
from) that of the medium-length phone calls which strictly focus on one individual,
because recipients may forget about the first “vote yourself” component and instead
remember the phone call primarily as encouraging them to mobilize neighbors. To make
an analogy with a consumer’s behavior, people are less likely to vote when they are asked
to do something else but vote themselves, just as people are less likely to buy a product if
they are exposed to an optional add-on (e.g., Shafir, Simonson, and Tversky 1993;
Bertrand et al. 2006).
How cost-effective are phone calls made for this experiment? In order to gauge
the cost per vote implied by the estimates in Table 2, we need to assess the total cost of
assigning subjects to treatment condition. According to our invoices, we spent $36,500
for the experiment. Based on this information, we estimated the cost per completed call
by dividing the total expenditure by the number of actual contact (both completed calls
and hang-ups), which yields $1.63. This cost per contact is equivalent to that ($1.50) of
the well-coached professional calls by a national phone bank in Nickerson’s (2007)
study. Since the invoices were not itemized, we cannot estimate the cost per call for each
of the three different live phone call scripts.
The cost per vote is calculated by simply dividing the total expenditure by the
expected number of votes produced by treatment. The expected number of votes is
generated by multiplying the number of subjects assigned to treatment by the effect of
assignment to treatment (i.e., the coefficient of treatment variable). In our live phone call
experiment, the coefficient of treatment (aggregating all three scripts) is 0.011

15
(SE=0.006) and the number of people assigned to any phone treatment is 63,325, and so
the expected number of votes produced by this experiment is 697 and the cost per vote is
$52.4 (=$36,500/697). When the sample is limited to 1-, 2-, and 3-person households
without mixed treatments, the cost per vote becomes lower: $26.9 for the neighbor
encouragement script, $18.0 for the augmented script, and $37.0 for the standard script.
These costs are comparable to leafleting ($32) (Nickerson, Friedrichs, and King 2006),
door-to-door canvassing ($31) (Green, Gerber, and Nickerson 2003), direct mails ($67)
(Gerber and Green 2000), volunteer phone calls ($20) (Nickerson 2006), and well-
executed professional phone calls ($29) (Nickerson 2007). It turns out that our
augmented and conversational phone calls are relatively more cost-effective than other
GOTV methods in previous studies.
Conclusion
The central findings of this study offer insights to campaign managers and
scholars who are interested in the effectiveness of phone call mobilization. In particular,
our results suggest that well-managed live phone calls are generally effective. Consistent
with previous studies, our finding confirms the importance of the quality of phone calls.
Interactive phone calls work better primarily because conversional interaction with
humane tone (and its concomitant easy-to-follow pace) makes potential voters to be more
informed about elections. However, when callers ask recipients to go to the polls and at
the same time ask them to mobilize their neighbors, the effects of phone call treatment
was not higher than, more on par with that of simple GOTV calls. This finding suggests

16
that although the number of interactions between callers and recipients matter, the
message needs to be focused in order for a GOTV phone call to be effective.
Further research is needed to confirm the generality of our results. It remains to
be seen whether the same phone calls requesting the mobilization of neighbors would
also be less effective than expected in partisan settings or, more generally stated, whether
peer mobilization efforts simply require certain methods to be effective, but are not
universally superior. For instance, contrary to the results from our experiment, a “get
your neighbors to vote for a specific candidate” appeal may not necessarily distract the
attention of the recipients and therefore it can be more influential because mobilization
usually works better among people who share their political views and furthermore in
socially homogeneous networks (see Mutz 2002). Similarly, even in non-partisan
elections, mobilization may be induced depending on the nature of electoral settings. For
example, people may be more likely to vote themselves as well as mobilize their friends
and neighbors when they believe their specific interests appear to be at stake, either in
highly contested elections or in elections where a few political issues are extremely
salient and divisive. Also, content of message can still be a critical element to boost voter
turnout when it is designed to be focused and appeal to the recipients’ hearts and minds
(e.g., ethnic or racial appeals to low-propensity minority voters). Thus, the results from
this study await replication in various electoral and social settings.
17
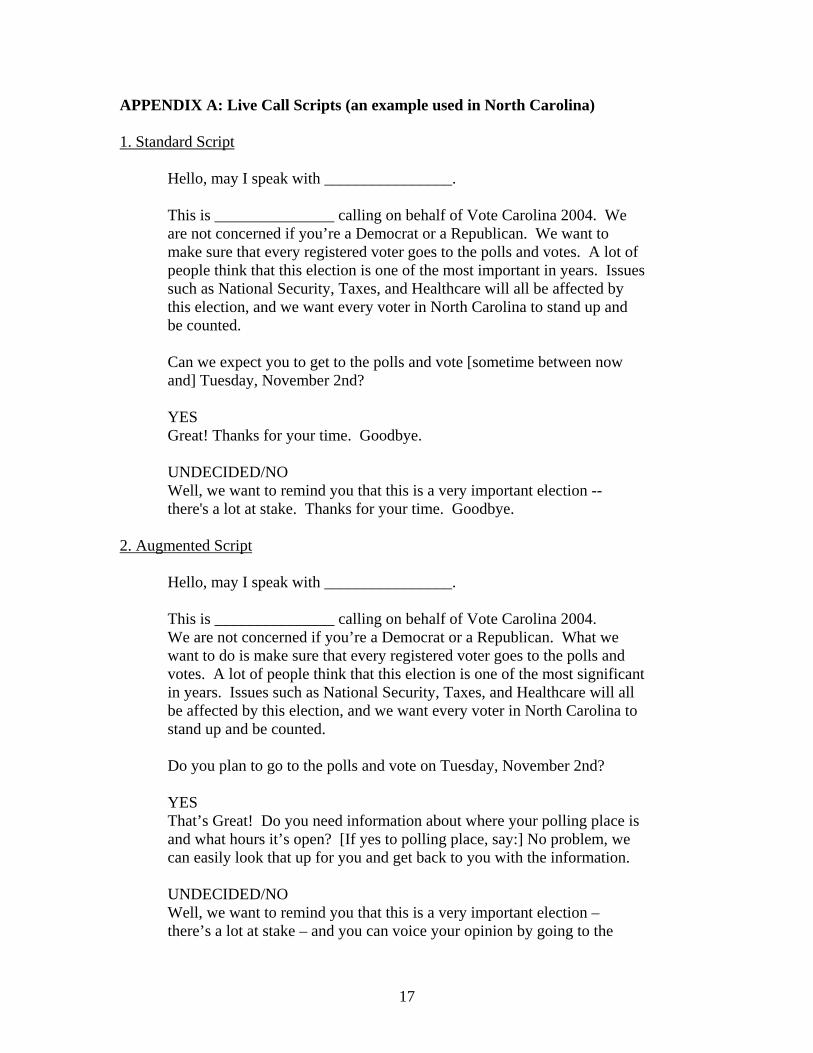
APPENDIX A: Live Call Scripts (an example used in North Carolina)
1. Standard Script Hello, may I speak with ________________. This is _______________ calling on behalf of Vote Carolina 2004. We are not concerned if you’re a Democrat or a Republican. We want to make sure that every registered voter goes to the polls and votes. A lot of people think that this election is one of the most important in years. Issues such as National Security, Taxes, and Healthcare will all be affected by this election, and we want every voter in North Carolina to stand up and be counted. Can we expect you to get to the polls and vote [sometime between now and] Tuesday, November 2nd? YES Great! Thanks for your time. Goodbye. UNDECIDED/NO Well, we want to remind you that this is a very important election -- there's a lot at stake. Thanks for your time. Goodbye.
2. Augmented Script
Hello, may I speak with ________________. This is _______________ calling on behalf of Vote Carolina 2004. We are not concerned if you’re a Democrat or a Republican. What we want to do is make sure that every registered voter goes to the polls and votes. A lot of people think that this election is one of the most significant in years. Issues such as National Security, Taxes, and Healthcare will all be affected by this election, and we want every voter in North Carolina to stand up and be counted. Do you plan to go to the polls and vote on Tuesday, November 2nd? YES That’s Great! Do you need information about where your polling place is and what hours it’s open? [If yes to polling place, say:] No problem, we can easily look that up for you and get back to you with the information. UNDECIDED/NO Well, we want to remind you that this is a very important election – there’s a lot at stake – and you can voice your opinion by going to the

18
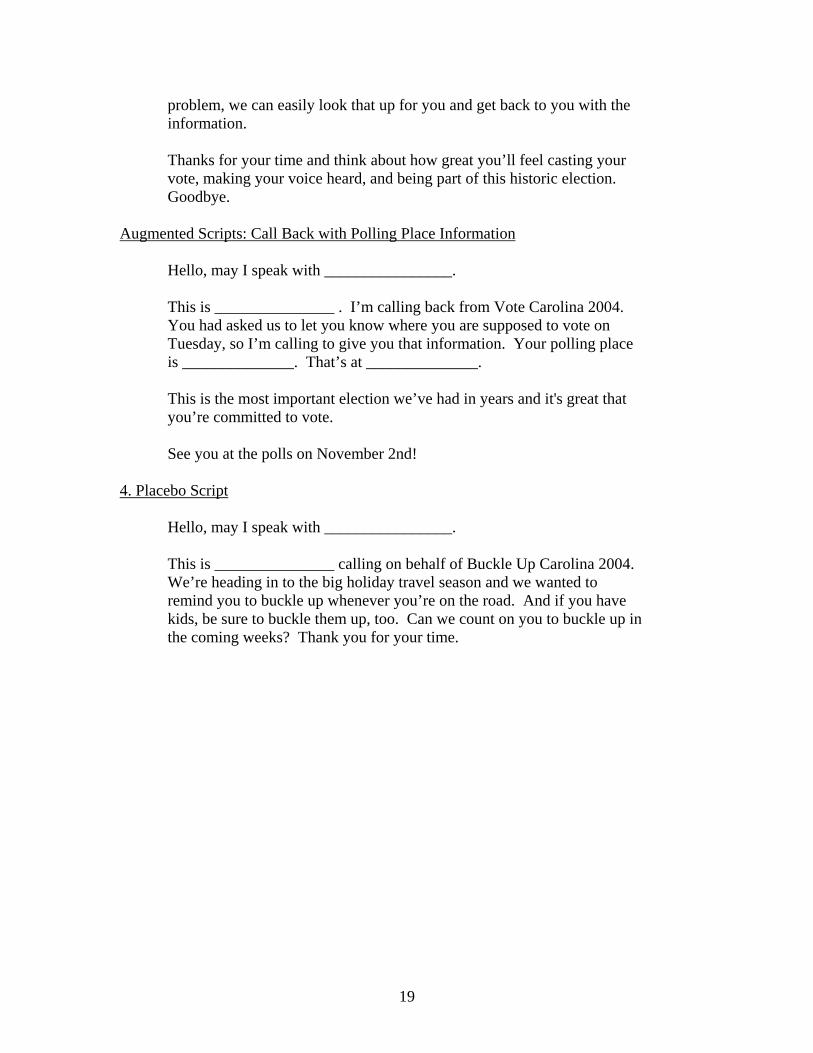
polls and voting. In case you decide to vote, would you like information about where your polling place is? [If yes to polling place, say:] No problem, we can easily look that up for you and get back to you with the information. Thanks for your time and think about how great you’ll feel casting your vote, making your voice heard, and being part of this historic election. Goodbye.
3. Augmented Script with Neighbor Encouragement
Hello, may I speak with ________________. This is _______________ calling on behalf of Vote Carolina 2004. We are not concerned if you’re a Democrat or a Republican. What we want to do is make sure that every registered voter goes to the polls and votes. A lot of people think that this election is one of the most significant in years. Issues such as National Security, Taxes, and Healthcare will all be affected by this election, and we want every voter in North Carolina to stand up and be counted. Do you plan to go to the polls and vote on Tuesday, November 2nd? YES That’s Great! Do you need information about where your polling place is and what hours it’s open? [If yes to polling place, say:] No problem, we can easily look that up for you and get back to you with the information. We also know that people who otherwise might not vote, could be persuaded to vote by their neighbors. Can you think of one or two people in your building or on your block that you could encourage to vote? [pause to let them think about it] It could really make a difference. Can we count on you to pick at least one of these neighbors and do what you can to get them to vote? YES – Terrific. Thanks again for your time and don’t forget to convince your neighbors to vote! Goodbye. NO – Well, if you do, it could really make a difference to try to get them out to vote. Thank you for your time. Goodbye. UNDECIDED/NO Well, we want to remind you that this is a very important election – there’s a lot at stake – and you can voice your opinion by going to the polls and voting. In case you decide to vote, would you like information about where your polling place is? [If yes to polling place, say:] No
19
problem, we can easily look that up for you and get back to you with the information. Thanks for your time and think about how great you’ll feel casting your vote, making your voice heard, and being part of this historic election. Goodbye.
Augmented Scripts: Call Back with Polling Place Information
Hello, may I speak with ________________. This is _______________ . I’m calling back from Vote Carolina 2004. You had asked us to let you know where you are supposed to vote on Tuesday, so I’m calling to give you that information. Your polling place is ______________. That’s at ______________. This is the most important election we’ve had in years and it's great that you’re committed to vote. See you at the polls on November 2nd!
4. Placebo Script
Hello, may I speak with ________________. This is _______________ calling on behalf of Buckle Up Carolina 2004. We’re heading in to the big holiday travel season and we wanted to remind you to buckle up whenever you’re on the road. And if you have kids, be sure to buckle them up, too. Can we count on you to buckle up in the coming weeks? Thank you for your time.

20
Appendix B: Balance of Observable Characteristics Full Sample Limited Sample
(1-, 2-, and 3-person households) Long
Script Medium Script
Short Script
Control Long Script
Medium Script
Short Script
Control
Voted 2000 (%) 49.4 50.6 50.3 50.3 47.9 49.5 49.3 49.0 Voted 2001 (%) 9.4 9.5 9.6 9.5 9.4 9.6 9.7 9.6 Voted 2002 (%) 42.2 43.1 42.3 42.5 40.7 42.0 41.0 41.3 Voted 2003 (%) 9.0 8.9 8.8 8.7 9.0 8.9 9.0 8.8 Female (%) 56.4 57.0 56.8 56.6 57.8 57.9 57.7 57.7 Age (mean) 47.0 47.0 46.9 46.9 47.2 47.3 47.1 47.1 Note: The “long script” indicates the subjects who were exposed to the augmented script with neighbor encouragement. The “medium script” means the augmented script and the “short script” is the standard script.

21
REFERENCES Angrist, Joshua D., Guido W. Imbens, and Donald B. Rubin. 1996. “Identification of Causal Effects Using Instrumental Variables”. Journal of the American Statistical Association. 91 (434): 444-455. Arceneaux, Kevin, Alan S. Gerber, and Donald P. Green. 2007. “A Cautionary Note on the Use of Matching to Estimate Causal Effects: An Empirical Example Comparing Matching Estimates to an Experimental Benchmark”. Unpublished manuscript. Bertrand, Marianne, Dean Karlan, Sendhil Mullainathan, Eldar Shafir, and Jonathan Zinman. 2006. “What’s Psychology Worth?: A Field Experiment in the Consumer Credit Market”. Unpublished manuscript. Cardy, Emily Arthur. 2005. “An Experimental Field Study of the GOTV and Persuasion Effects of Partisan Direct Mail and Phone Calls”. The Annals of the American Academy of Political and Social Science. 601: 28-40. Freedman, David A. 2005. Statistical Models: Theory and Practice. New York: Cambridge University Press. Gerber, Alan S., and Donald P. Green. 2005a. “Do Phone Calls Increase Voter Turnout?: An Update”. The Annals of the American Academy of Political and Social Science. 601: 142-154. Gerber, Alan S., and Donald P. Green. 2005b. “Correction to Gerber and Green (2000), Replication of Disputed Findings, and Reply to Imai (2005)”. American Political Science Review. 99 (2): 301-313. Gerber, Alan S., and Donald P. Green. 2000. “The Effects of Canvassing, Telephone Calls, and Direct Mail on Turnout: A Field Experiment”. American Political Science Review. 94 (3): 653-663. Green, Donald P. 2006. “Evaluation of the GOTV Phone Calls: A Field Experiment in Colorado”. Unpublished manuscript. Green, Donald P. 2004. “Evaluation of Phone/Canvass Campaign in the PA-13 Primary”. Unpublished manuscript. Green, Donald P., and Alan S. Gerber. 2008. Get Out the Vote!: How to Increase Voter Turnout. 2nd edition. Washington, DC: Brookings Institution. Green, Donald P., Alan S. Gerber, and David W. Nickerson. 2003 “Getting Out the Vote in Local Elections: Results from Six Door-to-Door Canvassing Experiments”. Journal of Politics. 65 (4): 1083-1096.

22
McNulty, John E. 2005 “Phone-Based GOTV – What’s on the Line? Field Experiments with Varied Partisan Components, 2002-2003”. The Annals of the American Academy of Political and Social Science. 601: 41-65. Michelson, Melissa R., Lisa Garcia Bedolla, and Donald P. Green. 2007. “New Experiments in Minority Voter Mobilization”. Unpublished manuscript. Mutz, Diana C. 2002. “The Consequences of Cross-Cutting Networks for Political Participation”. American Journal of Political Science. 46 (4): 838-855. Nickerson, David W. 2007. “Quality Is Job One: Professional and Volunteer Voter Mobilization Calls”. American Journal of Political Science. 51 (2): 269-282. Nickerson, David W. 2006. “Volunteer Phone Calls Can Increase Turnout: Evidence from Eight Field Experiments”. American Politics Research. 34 (3): 271-292. Nickerson, David W., Ryan K. Friedrichs, and David C. King. 2006. “Partisan Mobilization Campaigns in the Field: Results from a Statewide Mobilization Campaign in Michigan”. Political Research Quarterly. 59 (1): 85-97. Panagopoulos, Costas. 2007. “Timing Is Everything?: Primacy and Recency Effects in Voter Mobilization Campaigns”. Unpublished manuscript. Panagopoulos, Costas. 2006. “Partisan and Nonpartisan Message Content and Voter Mobilization”. Unpublished manuscript. (forthcoming in Political Research Quarterly) Ramirez, Ricardo. 2005. “Giving Voice to Latino Voters: A Field Experiment on the Effectiveness of a National Nonpartisan Mobilization Effort”. The Annals of the American Academy of Political and Social Science. 601: 66-84. Shafir, Eldar, Itamar Simonson, and Amos Tversky. 1993. “Reason-Based Choice”. Cognition. 49: 11-36. Wong, Janelle S. 2005. “Mobilizing Asian American Voters: A Field Experiment”. The Annals of the American Academy of Political and Social Science. 601”102-114.

23
Table 1. A Meta-Analysis of Previous Commercial Phone Call Field Experiments
Without Nickerson (2007)
With Nickerson (2007)
Pooled Estimate
95% C.I. Lower
95% C.I. Upper
Pooled Estimate
95% C.I. Lower
95% C.I. Upper
Fixed Effects
0.005 0.002 0.010 0.008 0.004 0.013
Random Effects
0.005 0.002 0.010 0.009 0.001 0.017
Q-Statistic 5.89 (p = 0.660) 18.95 (p = 0.026) N 9 10 Note: The dependent variable is the commercial phone call treatment effect estimates. The Q-statistic is a statistical test for heterogeneity across studies. Studies included in this analysis are: Arceneaux, Gerber, and Green 2007; Cardy 2005; Gerber and Green 2000; Gerber and Green 2005a; Green 2004; Green 2006; McNulty 2005; Nickerson 2007; Panagopoulos 2006; Panagopoulos 2007.

24
Table 2. Voter Turnout Summary Statistics All Three
Treatments Standard
Script Augmented
Script Augmented Script with Neighbor
Encouragement
Control
Total Number of Subjects in Group
63,325 21,071 21,110 21,144 211,118
Subjects with Completed Phone Call (Contacted)
22,365 7,293 6,965 8,107 N/A
Contact Rate (%)
35.3 34.6 33.0 38.3 N/A
Voters in Group
39,952 13,239 13,438 13,275 132,569
Voting Rate (%)
63.1 62.8 63.7 62.8 62.8
25
Table 3. Efficacy of Professional Phone Calls at Boosting Voter Turnout Intent-To-Treat
(ITT) Effect Average Treatment-On-Treated (ATT)
Effect Model 1
Model 2 Model 1
Model 2
Augmented (with Neighbor Encouragement)
0.005 (0.004)
0.007* (0.004)
0.013 (0.011)
0.019* (0.010)
Augmented 0.011** (0.004)
0.008* (0.004)
0.033** (0.011)
0.023* (0.010)
Standard 0.004 (0.004)
0.003 (0.004)
0.010 (0.010)
0.008 (0.009)
1-Person Households -0.119** (0.004)
-0.060** (0.003)
-0.118** (0.004)
-0.060** (0.003)
2-Person Households 0.037** (0.004)
0.017** (0.004)
0.036** (0.004)
0.017** (0.004)
Age -0.000** (0.000)
-0.000** (0.000)
Female 0.036** (0.002)
0.036** (0.002)
Gender Missing 0.030** (0.006)
0.030** (0.006)
State Dummy
Included Included
Prior Voting History (2000-2003)
Included Included
Constant 0.698** (0.003)
0.461** (0.004)
0.698** (0.003)
0.462** (0.004)
N 214,591 214,591 214,591 214,591 Adj-Rsq 0.024 0.191 0.026 0.192 Note: The dependent variable is voter turnout in 2004 election. Estimates derived from 2SLS using treatment assignment as instrument variables (ATT effect). Models include 1-, 2-, and 3-person households without mixed treatments. **p<0.01; *p<0.05 (one-tailed test)

26
Table 4. Significance of the Quality of Phone Calls: A Meta-Regression Model 1
(No Covariates) Model 2
(With Covariates) Quality Dummy 0.019**
(0.005) 0.018** (0.006)
Constant 0.005* (0.002)
-2.123 (3.233)
N 12 12 Note: The dependent variable is the average treatment-on-treated estimates of professional GOTV phone calls. Covariates in Model 2 include a dummy of partisan vs. non-partisan message and years of experiments. Studies included in this analysis are: Arceneaux, Gerber, and Green 2007; Cardy 2005; Gerber and Green 2000; Gerber and Green 2005a; Green 2004; Green 2006; McNulty 2005; Nickerson 2007; Panagopoulos 2006; Panagopoulos 2007; two values – high-quality (i.e., medium and long) and standard-quality (i.e., short) from this study. **p<0.01; *p<0.05 (one-tailed test)


