Does%Mandatory%Shareholder% · PDF fileMarket’s response to Kraft Inc’s bid for...
42
Oslo, 3 October 2014 Marco Becht ECARES, Université libre de Bruxelles, CEPR and ECGI based on joint work with Andrea Polo Universitat Pompeu Fabra and Barcelona GSE Stefano Rossi Krannert School of Management, Purdue University, CEPR and ECGI Does Mandatory Shareholder Vo1ng Prevent Bad Acquisi1ons?
Transcript of Does%Mandatory%Shareholder% · PDF fileMarket’s response to Kraft Inc’s bid for...

Oslo, 3 October 2014
Marco Becht ECARES, Université libre de Bruxelles, CEPR and ECGI
based on joint work with
Andrea Polo
Universitat Pompeu Fabra and Barcelona GSE Stefano Rossi
Krannert School of Management, Purdue University, CEPR and ECGI
Does Mandatory Shareholder Vo1ng Prevent Bad Acquisi1ons?

“In the past, I've observed that many acquisiRon-‐hungry managers were apparently mesmerized by their childhood reading of the story about the frog-‐kissing princess. Remembering her success, they pay dearly for the right to kiss corporate toads, expecRng wondrous transfiguraRons. IniRally, disappoinRng results only deepen their desire to round up new toads. […] UlRmately, even the most opRmisRc manager must face reality. Standing knee-‐deep in unresponsive toads , he then announces an enormous "restructuring” charge. In this corporate equivalent of a Head Start program, the CEO receives the educaRon but the stockholders pay the TuiRon.”
Warren Buffet 1992 Letter to Shareholders http://www.berkshirehathaway.com/letters/1992.html
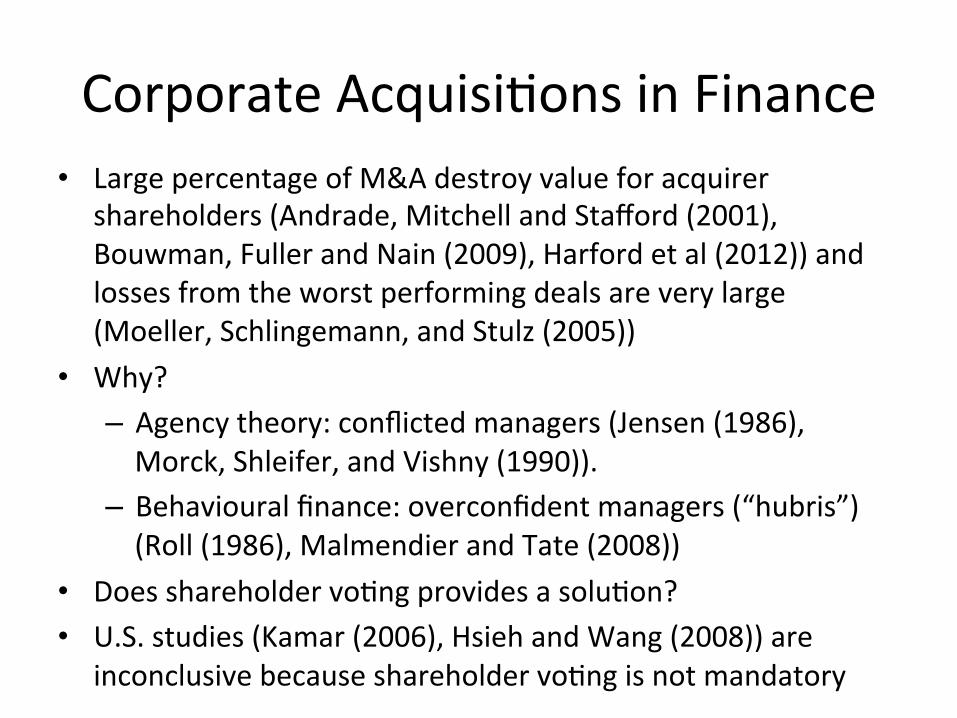
Corporate AcquisiRons in Finance • Large percentage of M&A destroy value for acquirer
shareholders (Andrade, Mitchell and Stafford (2001), Bouwman, Fuller and Nain (2009), Harford et al (2012)) and losses from the worst performing deals are very large (Moeller, Schlingemann, and Stulz (2005))
• Why? – Agency theory: conflicted managers (Jensen (1986), Morck, Shleifer, and Vishny (1990)).
– Behavioural finance: overconfident managers (“hubris”)(Roll (1986), Malmendier and Tate (2008))
• Does shareholder voRng provides a soluRon? • U.S. studies (Kamar (2006), Hsieh and Wang (2008)) are
inconclusive because shareholder voRng is not mandatory
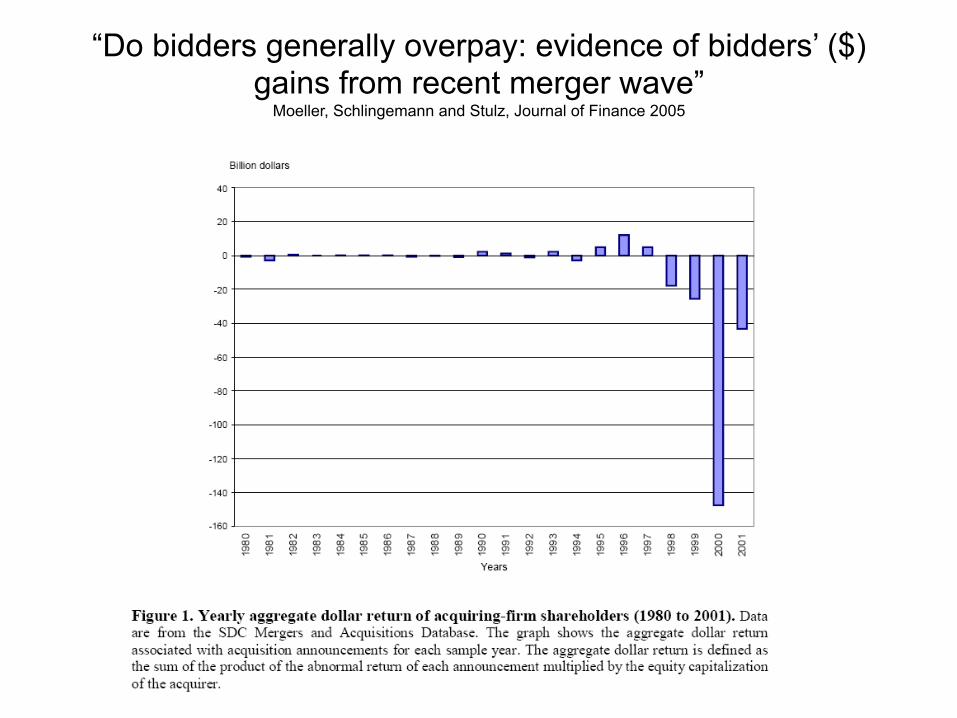
“Do bidders generally overpay: evidence of bidders’ ($) gains from recent merger wave”
Moeller, Schlingemann and Stulz, Journal of Finance 2005
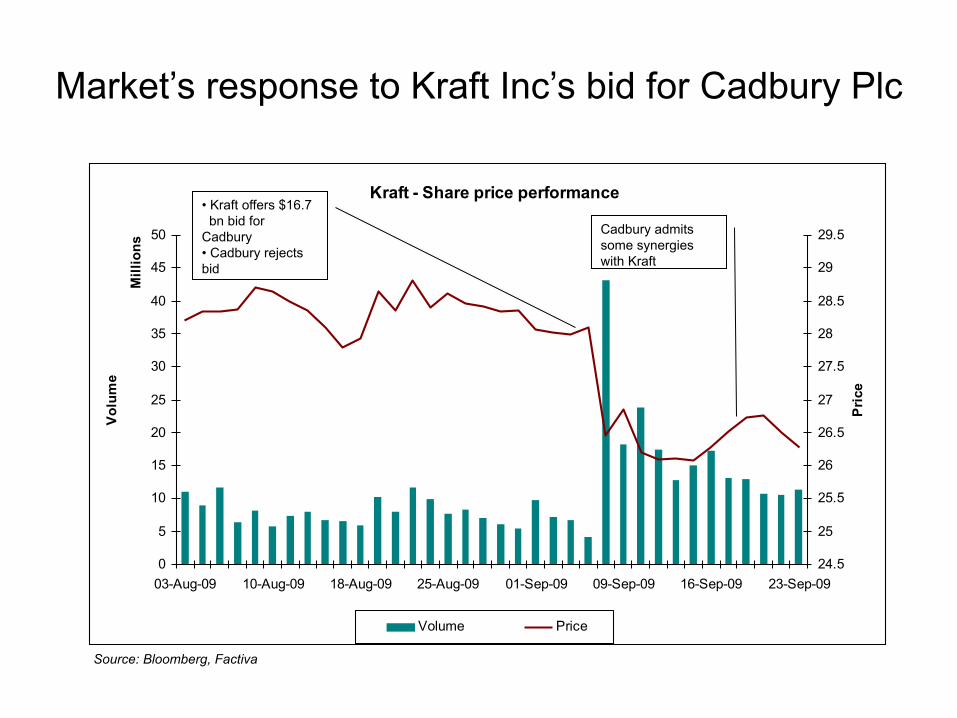
Kraft - Share price performance
0
5
10
15
20
25
30
35
40
45
50
03-Aug-09 10-Aug-09 18-Aug-09 25-Aug-09 01-Sep-09 09-Sep-09 16-Sep-09 23-Sep-09
Mill
ions
Volu
me
24.5
25
25.5
26
26.5
27
27.5
28
28.5
29
29.5
Pric
e
Volume Price
Market’s response to Kraft Inc’s bid for Cadbury Plc
• Kraft offers $16.7 bn bid for Cadbury • Cadbury rejects bid
Cadbury admits some synergies with Kraft
Source: Bloomberg, Factiva
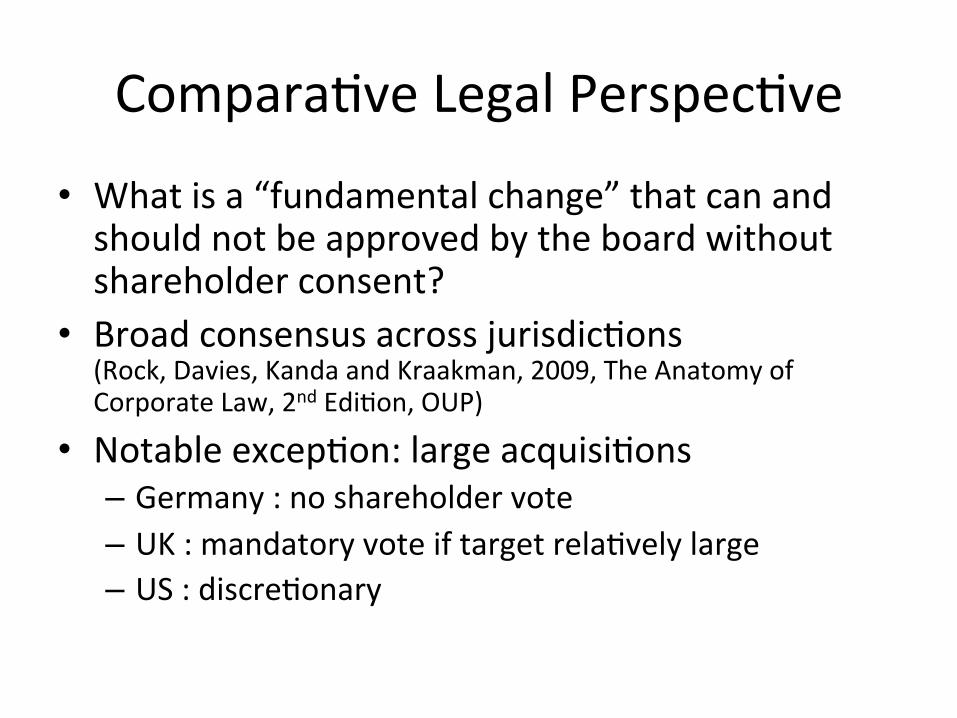
ComparaRve Legal PerspecRve
• What is a “fundamental change” that can and should not be approved by the board without shareholder consent?
• Broad consensus across jurisdicRons (Rock, Davies, Kanda and Kraakman, 2009, The Anatomy of Corporate Law, 2nd EdiRon, OUP)
• Notable excepRon: large acquisiRons – Germany : no shareholder vote – UK : mandatory vote if target relaRvely large – US : discreRonary
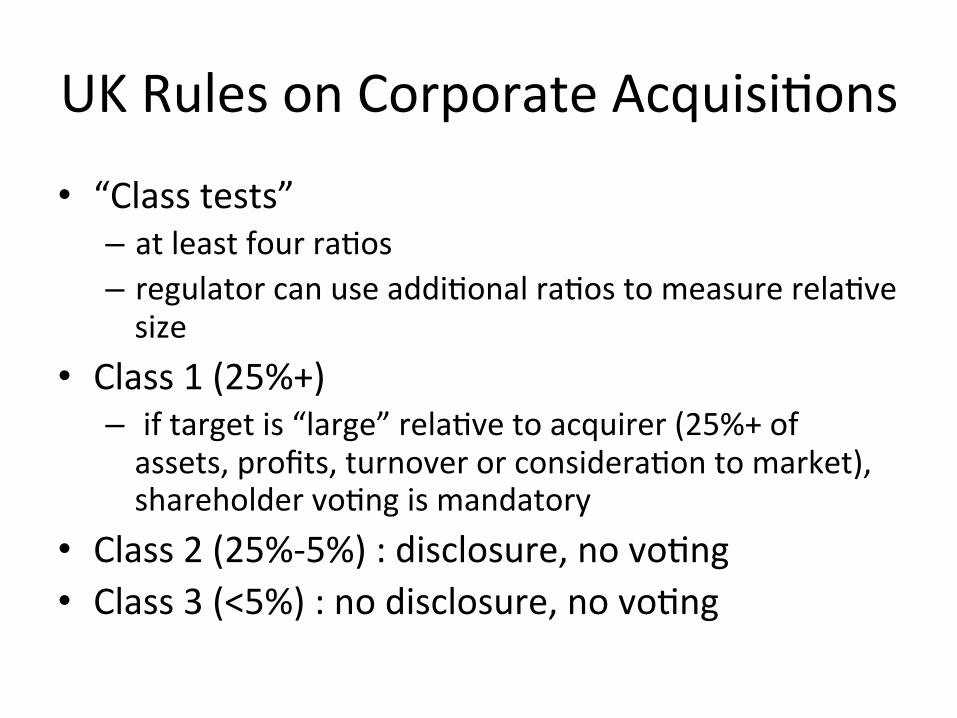
UK Rules on Corporate AcquisiRons
• “Class tests” – at least four raRos – regulator can use addiRonal raRos to measure relaRve size
• Class 1 (25%+) – if target is “large” relaRve to acquirer (25%+ of assets, profits, turnover or consideraRon to market), shareholder voRng is mandatory
• Class 2 (25%-‐5%) : disclosure, no voRng • Class 3 (<5%) : no disclosure, no voRng
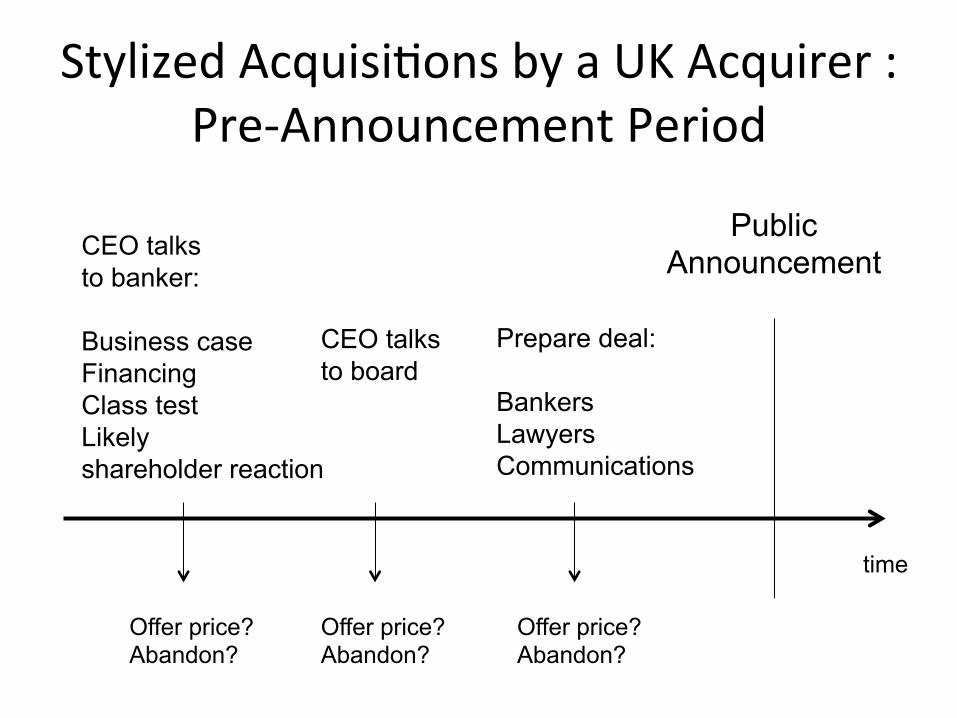
Stylized AcquisiRons by a UK Acquirer : Pre-‐Announcement Period
Public Announcement
time
CEO talks to banker: Business case Financing Class test Likely shareholder reaction
CEO talks to board
Prepare deal: Bankers Lawyers Communications
Offer price? Abandon?
Offer price? Abandon?
Offer price? Abandon?
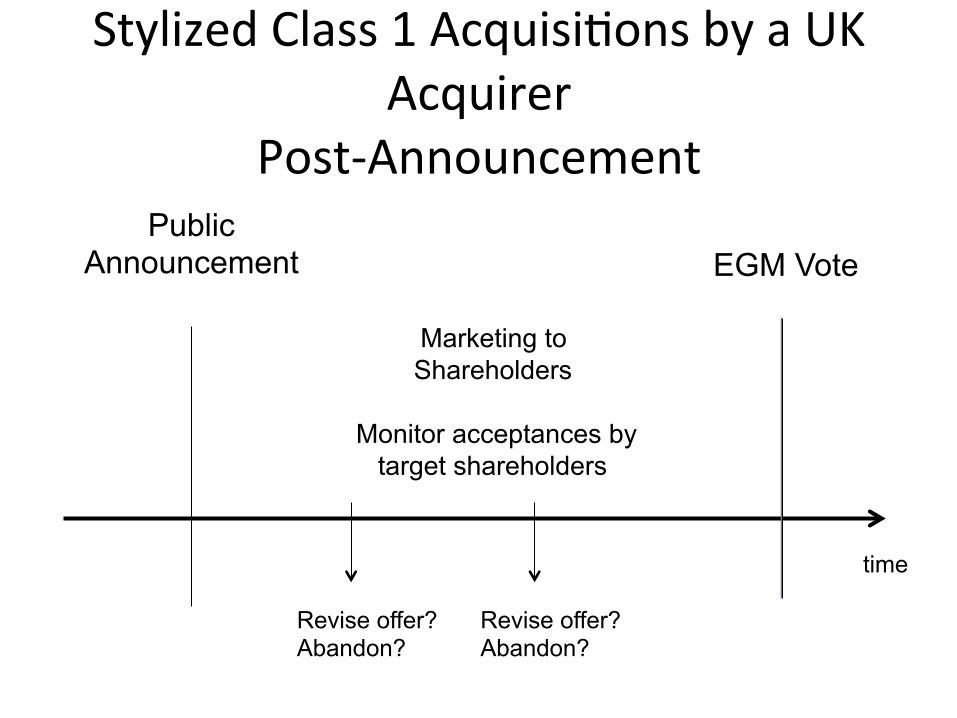
Stylized Class 1 AcquisiRons by a UK Acquirer
Post-‐Announcement Public
Announcement
time
EGM Vote
Marketing to Shareholders
Monitor acceptances by
target shareholders
Revise offer? Abandon?
Revise offer? Abandon?
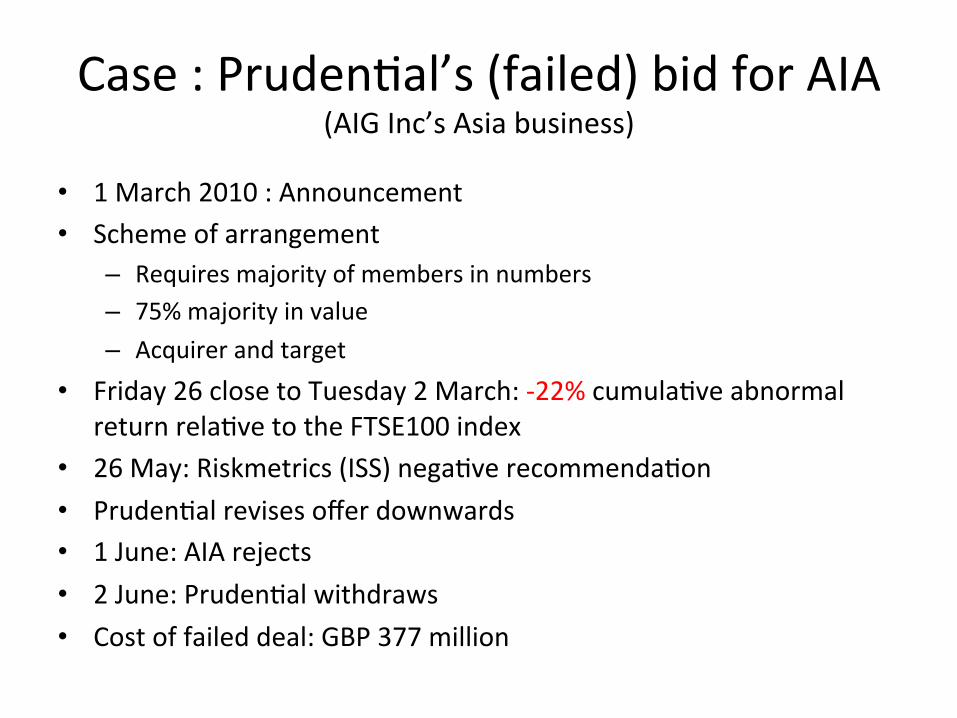
Case : PrudenRal’s (failed) bid for AIA (AIG Inc’s Asia business)
• 1 March 2010 : Announcement • Scheme of arrangement
– Requires majority of members in numbers – 75% majority in value – Acquirer and target
• Friday 26 close to Tuesday 2 March: -‐22% cumulaRve abnormal return relaRve to the FTSE100 index
• 26 May: Riskmetrics (ISS) negaRve recommendaRon • PrudenRal revises offer downwards • 1 June: AIA rejects • 2 June: PrudenRal withdraws • Cost of failed deal: GBP 377 million
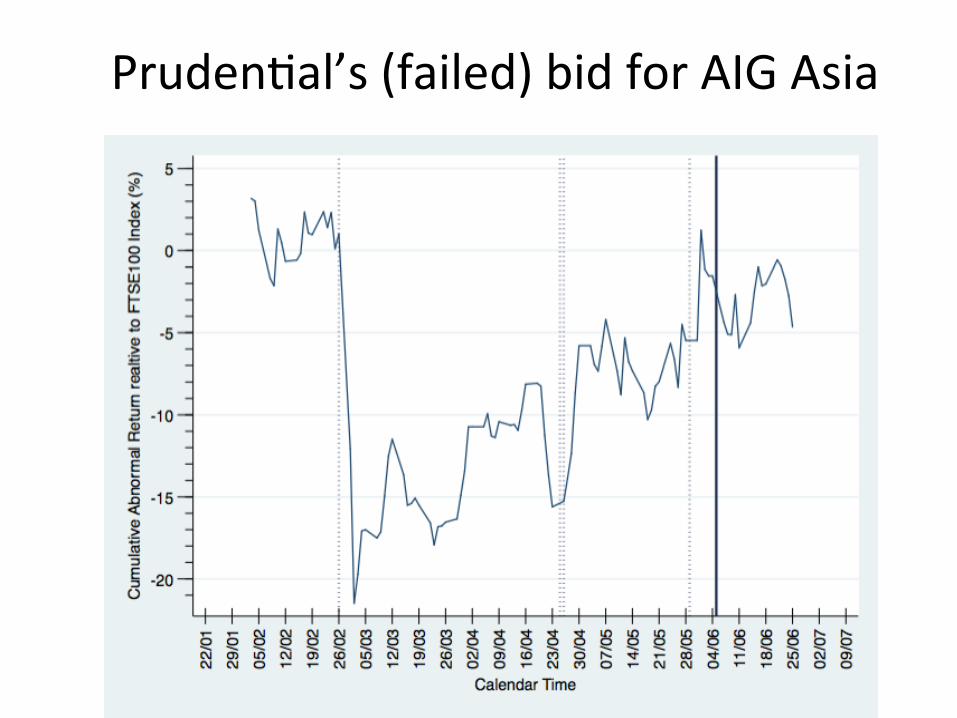
PrudenRal’s (failed) bid for AIG Asia
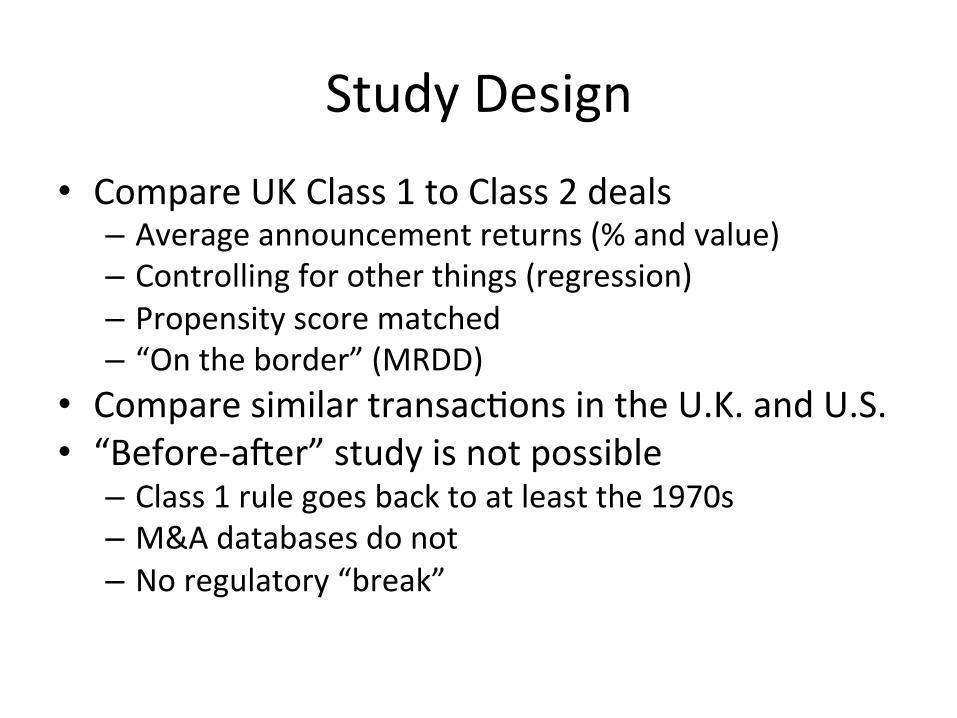
Study Design • Compare UK Class 1 to Class 2 deals
– Average announcement returns (% and value) – Controlling for other things (regression) – Propensity score matched – “On the border” (MRDD)
• Compare similar transacRons in the U.K. and U.S. • “Before-‐ater” study is not possible
– Class 1 rule goes back to at least the 1970s – M&A databases do not – No regulatory “break”
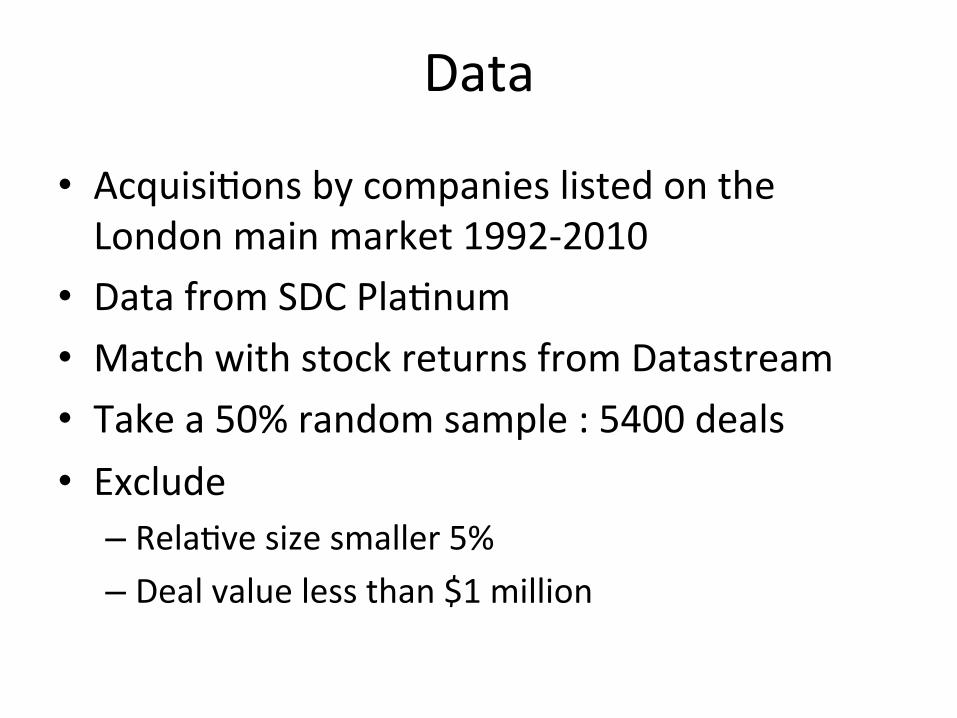
Data
• AcquisiRons by companies listed on the London main market 1992-‐2010
• Data from SDC PlaRnum • Match with stock returns from Datastream • Take a 50% random sample : 5400 deals • Exclude
– RelaRve size smaller 5% – Deal value less than $1 million

Class 1 or Class 2?
• Classify deals “by hand” looking at FacRva • For Class 1 record EGM date
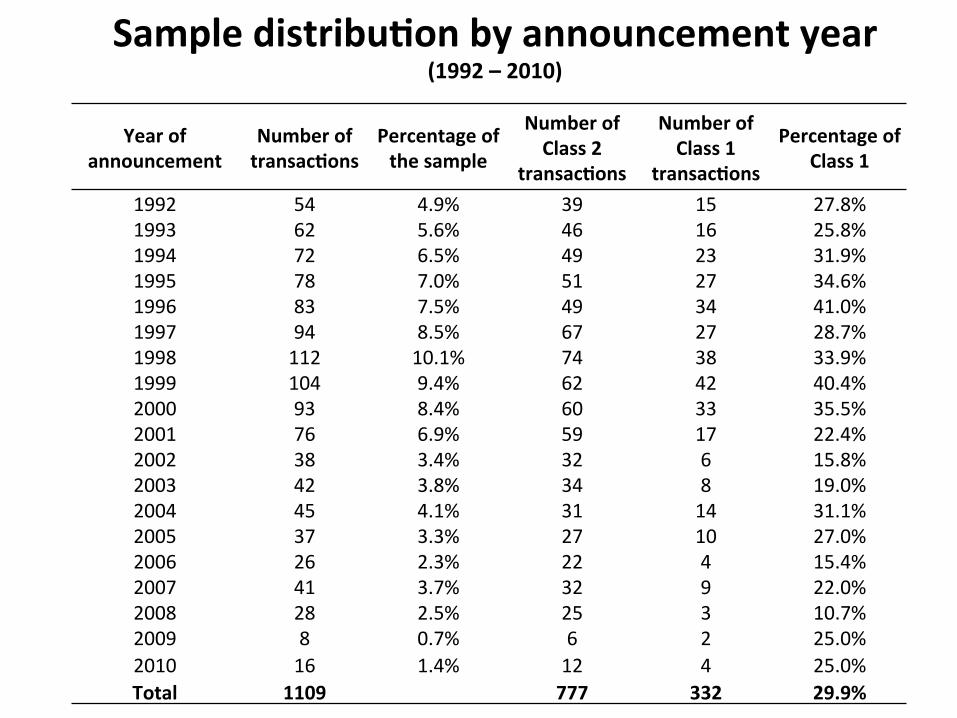
Sample distribu1on by announcement year (1992 – 2010)
Year of announcement
Number of transac1ons
Percentage of the sample
Number of Class 2
transac1ons Number of Class 1
transac1ons Percentage of
Class 1 1992 54 4.9% 39 15 27.8% 1993 62 5.6% 46 16 25.8% 1994 72 6.5% 49 23 31.9% 1995 78 7.0% 51 27 34.6% 1996 83 7.5% 49 34 41.0% 1997 94 8.5% 67 27 28.7% 1998 112 10.1% 74 38 33.9% 1999 104 9.4% 62 42 40.4% 2000 93 8.4% 60 33 35.5% 2001 76 6.9% 59 17 22.4% 2002 38 3.4% 32 6 15.8% 2003 42 3.8% 34 8 19.0% 2004 45 4.1% 31 14 31.1% 2005 37 3.3% 27 10 27.0% 2006 26 2.3% 22 4 15.4% 2007 41 3.7% 32 9 22.0% 2008 28 2.5% 25 3 10.7% 2009 8 0.7% 6 2 25.0% 2010 16 1.4% 12 4 25.0% Total 1109 777 332 29.9%
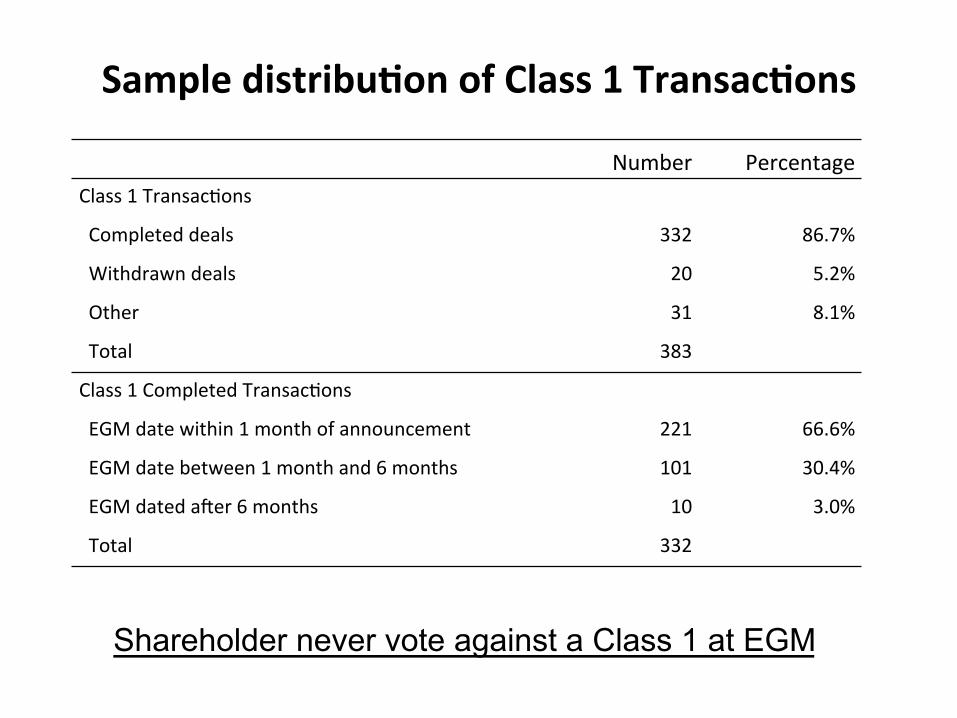
Sample distribu1on of Class 1 Transac1ons
Number Percentage Class 1 TransacRons
Completed deals 332 86.7%
Withdrawn deals 20 5.2%
Other 31 8.1%
Total 383
Class 1 Completed TransacRons
EGM date within 1 month of announcement 221 66.6%
EGM date between 1 month and 6 months 101 30.4%
EGM dated ater 6 months 10 3.0%
Total 332
Shareholder never vote against a Class 1 at EGM
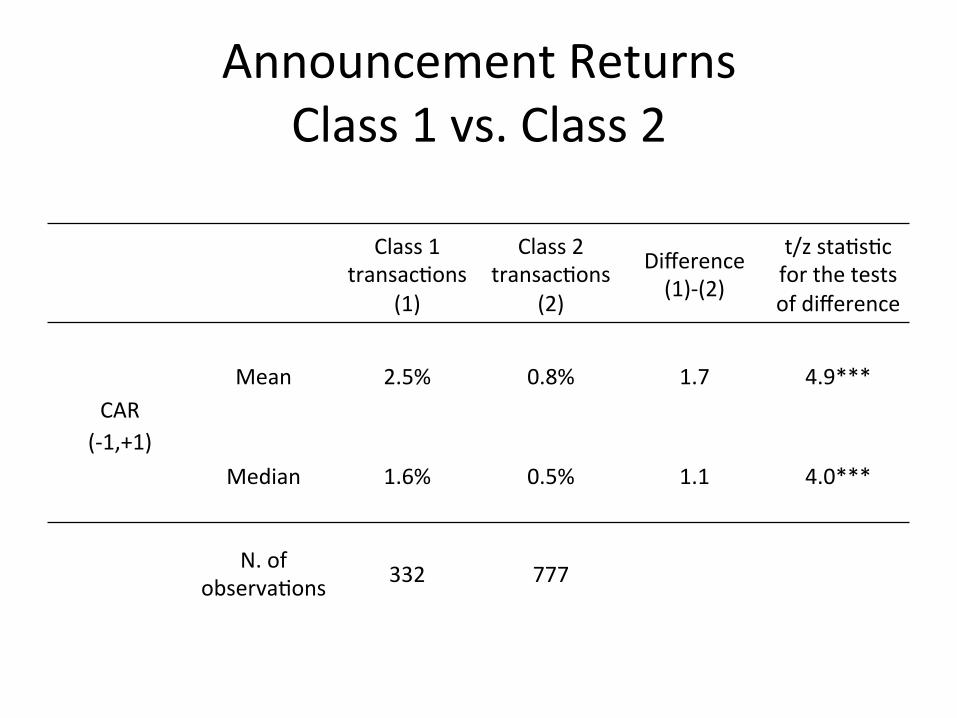
Announcement Returns Class 1 vs. Class 2
Class 1
transacRons (1)
Class 2 transacRons
(2) Difference (1)-‐(2)
t/z staRsRc for the tests of difference
CAR (-‐1,+1)
Mean 2.5% 0.8% 1.7 4.9***
Median 1.6% 0.5% 1.1 4.0***
N. of observaRons 332 777
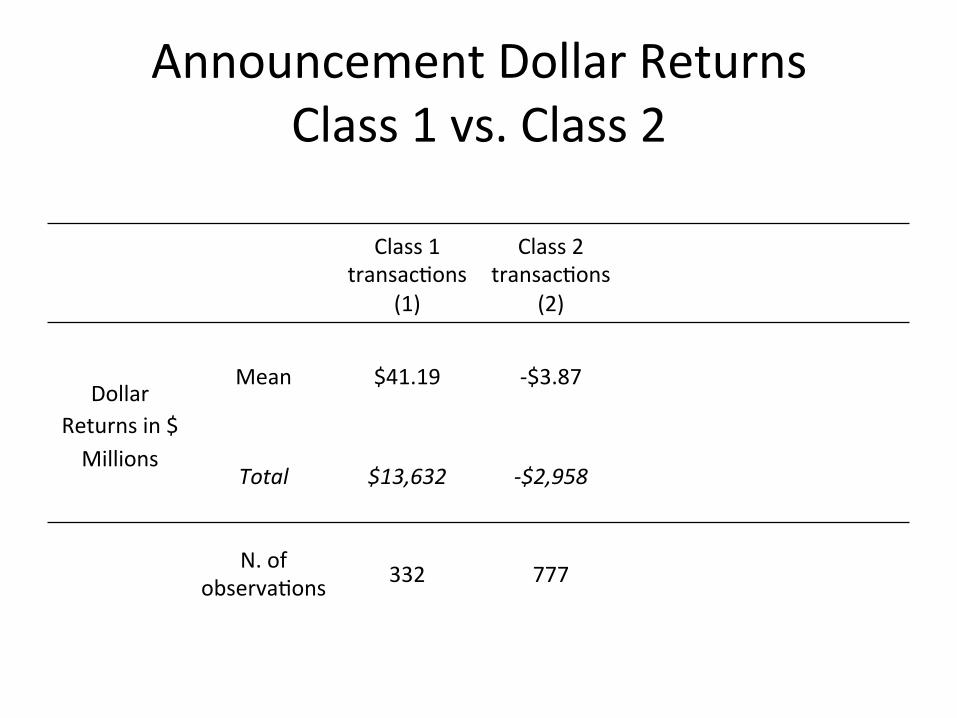
Announcement Dollar Returns Class 1 vs. Class 2
Class 1
transacRons (1)
Class 2 transacRons
(2)
Dollar Returns in $ Millions
Mean $41.19 -‐$3.87
Total $13,632 -‐$2,958
N. of observaRons 332 777
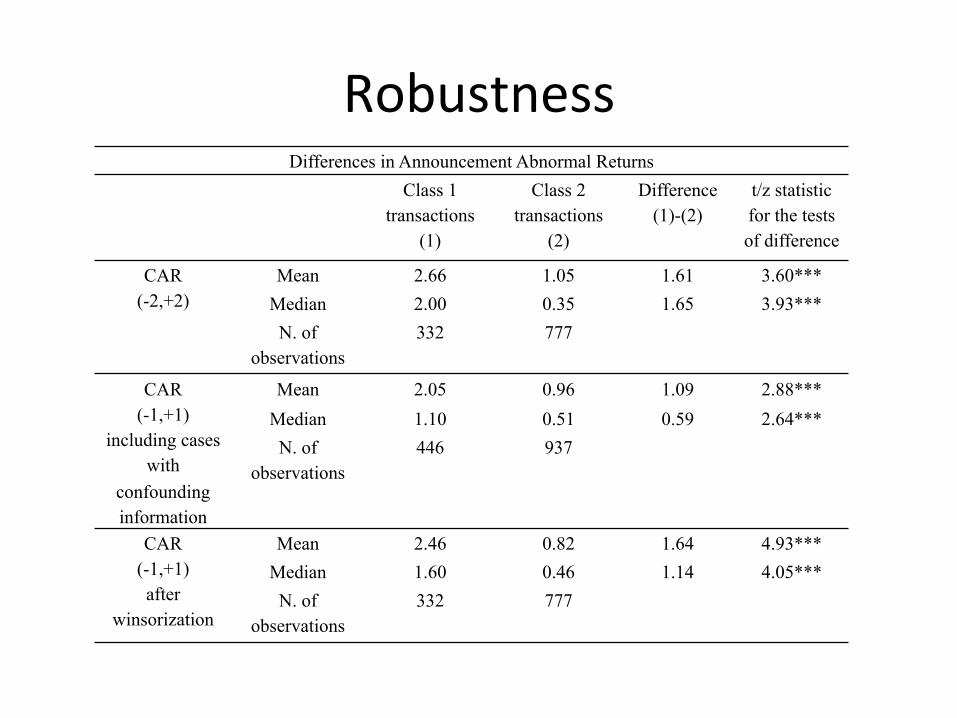
Robustness Differences in Announcement Abnormal Returns
Class 1 transactions
(1)
Class 2 transactions
(2)
Difference (1)-(2)
t/z statistic for the tests of difference
CAR (-2,+2)
Mean 2.66 1.05 1.61 3.60*** Median 2.00 0.35 1.65 3.93*** N. of
observations 332 777
CAR (-1,+1)
including cases with
confounding information
Mean 2.05 0.96 1.09 2.88*** Median 1.10 0.51 0.59 2.64*** N. of
observations 446 937
CAR (-1,+1) after
winsorization
Mean 2.46 0.82 1.64 4.93*** Median 1.60 0.46 1.14 4.05*** N. of
observations 332 777
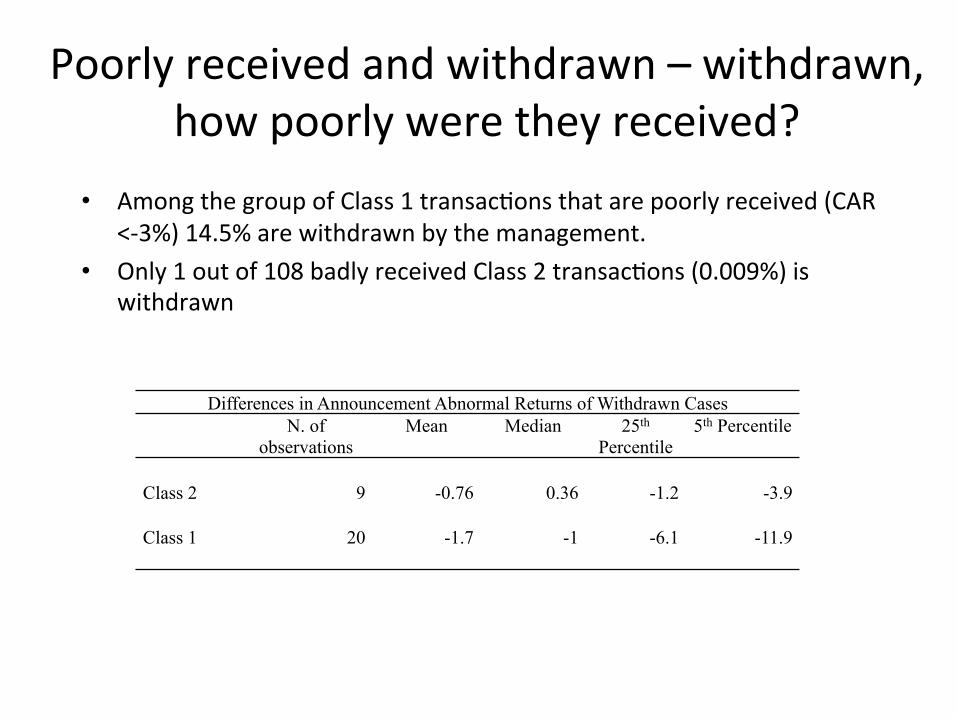
Poorly received and withdrawn – withdrawn, how poorly were they received?
• Among the group of Class 1 transacRons that are poorly received (CAR <-‐3%) 14.5% are withdrawn by the management.
• Only 1 out of 108 badly received Class 2 transacRons (0.009%) is withdrawn
Differences in Announcement Abnormal Returns of Withdrawn Cases N. of
observations Mean Median 25th
Percentile 5th Percentile
Class 2 9 -0.76 0.36 -1.2 -3.9
Class 1 20 -1.7 -1 -6.1 -11.9
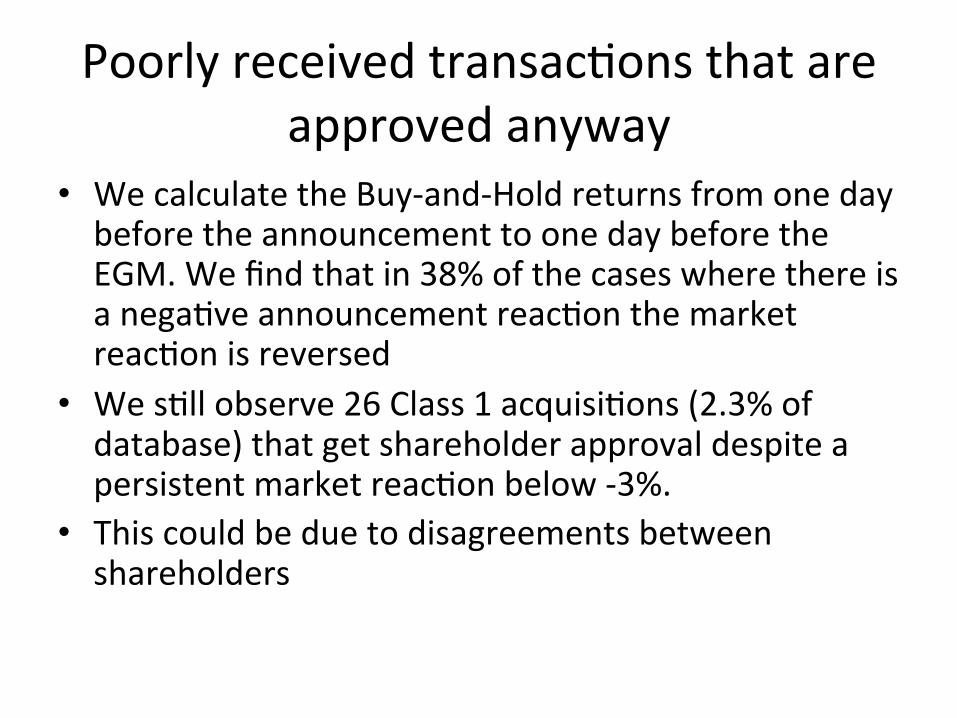
Poorly received transacRons that are approved anyway
• We calculate the Buy-‐and-‐Hold returns from one day before the announcement to one day before the EGM. We find that in 38% of the cases where there is a negaRve announcement reacRon the market reacRon is reversed
• We sRll observe 26 Class 1 acquisiRons (2.3% of database) that get shareholder approval despite a persistent market reacRon below -‐3%.
• This could be due to disagreements between shareholders

ARM plunges 13 pct on Ar1san takeover news
• STOCKWATCH ARM plunges 13 pct on Ar1san takeover news
• 23 August 2004 • STOCKWATCH ARM plunges 13 pct on Ar1san takeover news
• LONDON (AFX) -‐ ARM Holdings PLC lost over an eighth of its value in opening deals this morning ater the UK semiconductor designer paid a huge premium to acquire US peer Ar1san Components Inc, dealers said.

Press
• 22/23 August – 13% Plunge Headlines • 28 August – Interview with Sir Robin Saxby, Chairman of ARM Holdings in the Independent
• 2 September – Merrill Lynch ups ARM to buy • 19 October – Q3 Results 95 percent jump in profits, be{er than expected
• “Strong ARM muscles out criRcs” (Citywire)
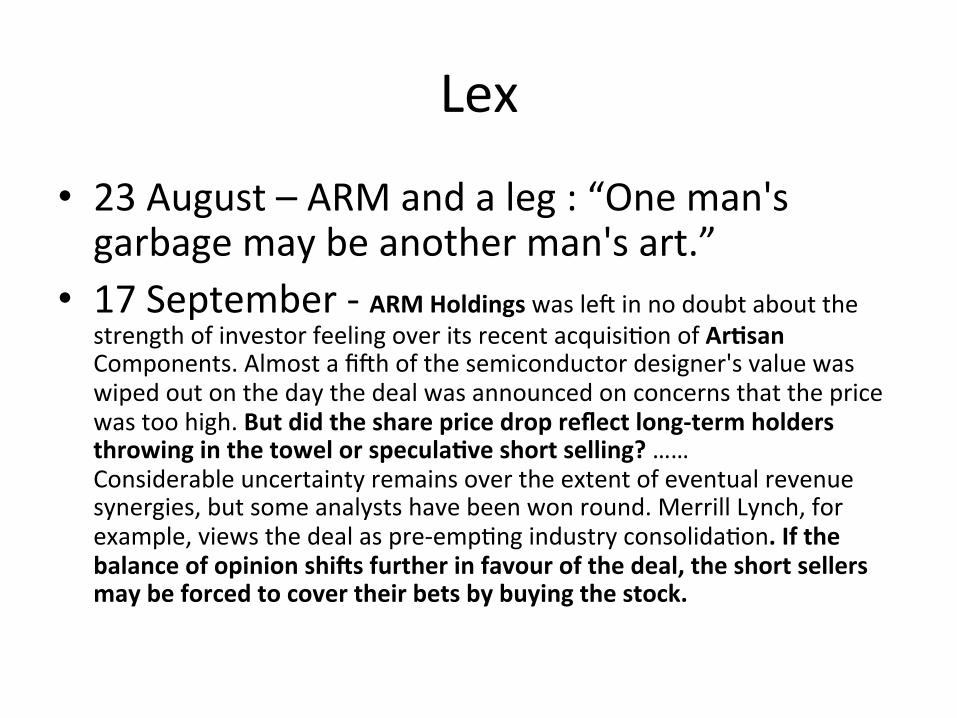
Lex
• 23 August – ARM and a leg : “One man's garbage may be another man's art.”
• 17 September -‐ ARM Holdings was let in no doubt about the strength of investor feeling over its recent acquisiRon of Ar1san Components. Almost a fith of the semiconductor designer's value was wiped out on the day the deal was announced on concerns that the price was too high. But did the share price drop reflect long-‐term holders throwing in the towel or specula1ve short selling? …… Considerable uncertainty remains over the extent of eventual revenue synergies, but some analysts have been won round. Merrill Lynch, for example, views the deal as pre-‐empRng industry consolidaRon. If the balance of opinion shiYs further in favour of the deal, the short sellers may be forced to cover their bets by buying the stock.
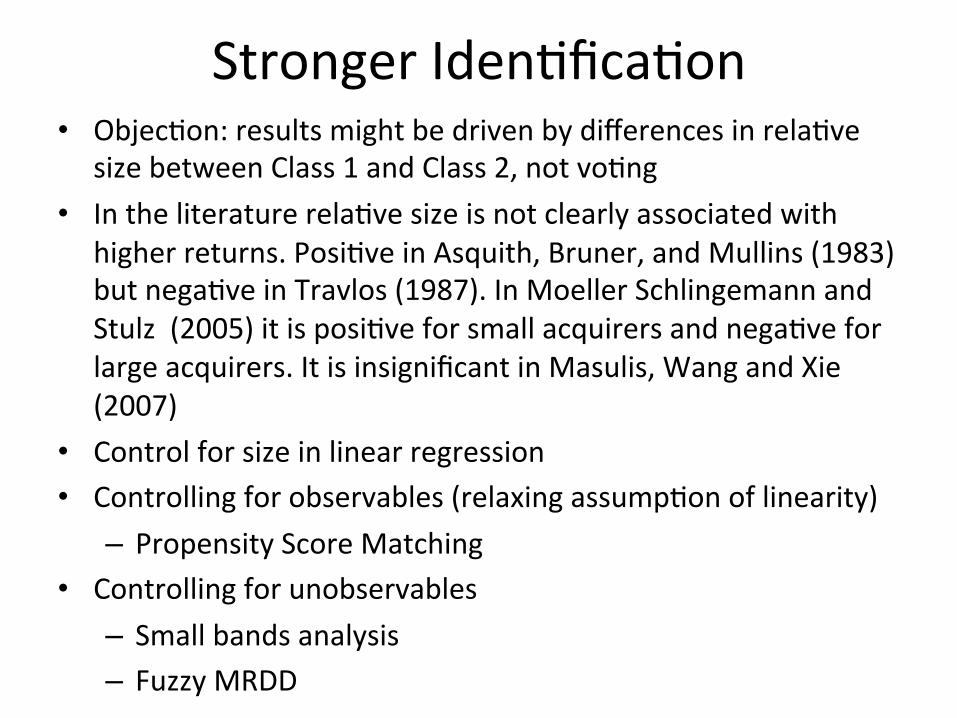
Stronger IdenRficaRon • ObjecRon: results might be driven by differences in relaRve
size between Class 1 and Class 2, not voRng • In the literature relaRve size is not clearly associated with
higher returns. PosiRve in Asquith, Bruner, and Mullins (1983) but negaRve in Travlos (1987). In Moeller Schlingemann and Stulz (2005) it is posiRve for small acquirers and negaRve for large acquirers. It is insignificant in Masulis, Wang and Xie (2007)
• Control for size in linear regression • Controlling for observables (relaxing assumpRon of linearity)
– Propensity Score Matching • Controlling for unobservables
– Small bands analysis – Fuzzy MRDD
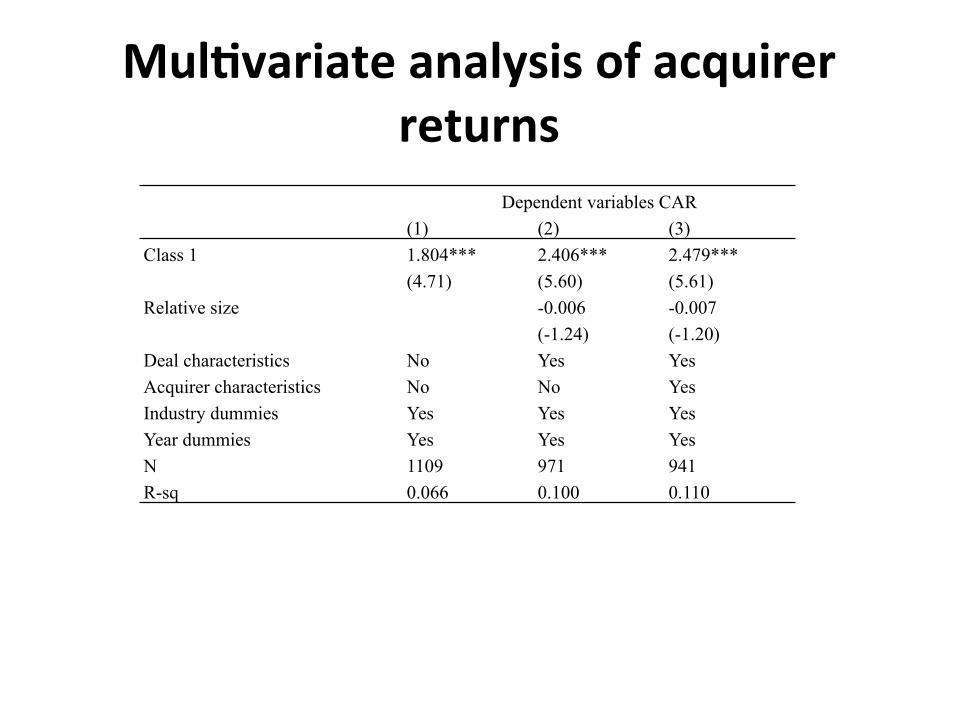
Mul1variate analysis of acquirer returns
Dependent variables CAR (1) (2) (3)
Class 1 1.804*** 2.406*** 2.479*** (4.71) (5.60) (5.61)
Relative size -0.006 -0.007 (-1.24) (-1.20)
Deal characteristics No Yes Yes Acquirer characteristics No No Yes Industry dummies Yes Yes Yes Year dummies Yes Yes Yes N 1109 971 941 R-sq 0.066 0.100 0.110
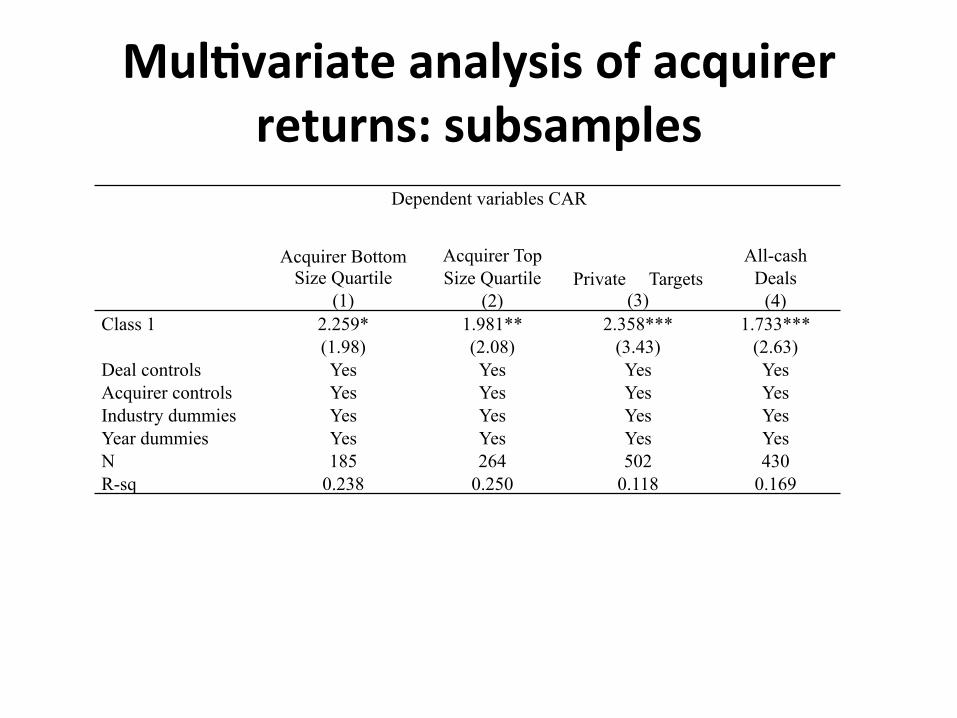
Mul1variate analysis of acquirer returns: subsamples
Dependent variables CAR
Acquirer Bottom Size Quartile
(1)
Acquirer Top Size Quartile
(2) Private Targets
(3)
All-cash
Deals (4)
Class 1 2.259* 1.981** 2.358*** 1.733*** (1.98) (2.08) (3.43) (2.63)
Deal controls Yes Yes Yes Yes Acquirer controls Yes Yes Yes Yes Industry dummies Yes Yes Yes Yes Year dummies Yes Yes Yes Yes N 185 264 502 430 R-sq 0.238 0.250 0.118 0.169
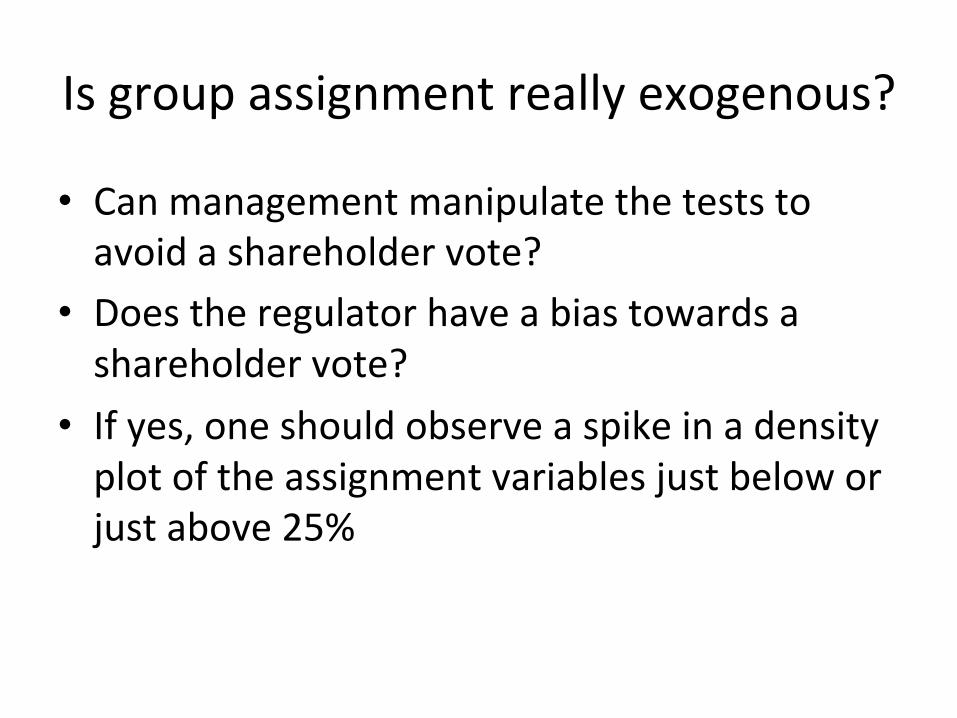
Is group assignment really exogenous?
• Can management manipulate the tests to avoid a shareholder vote?
• Does the regulator have a bias towards a shareholder vote?
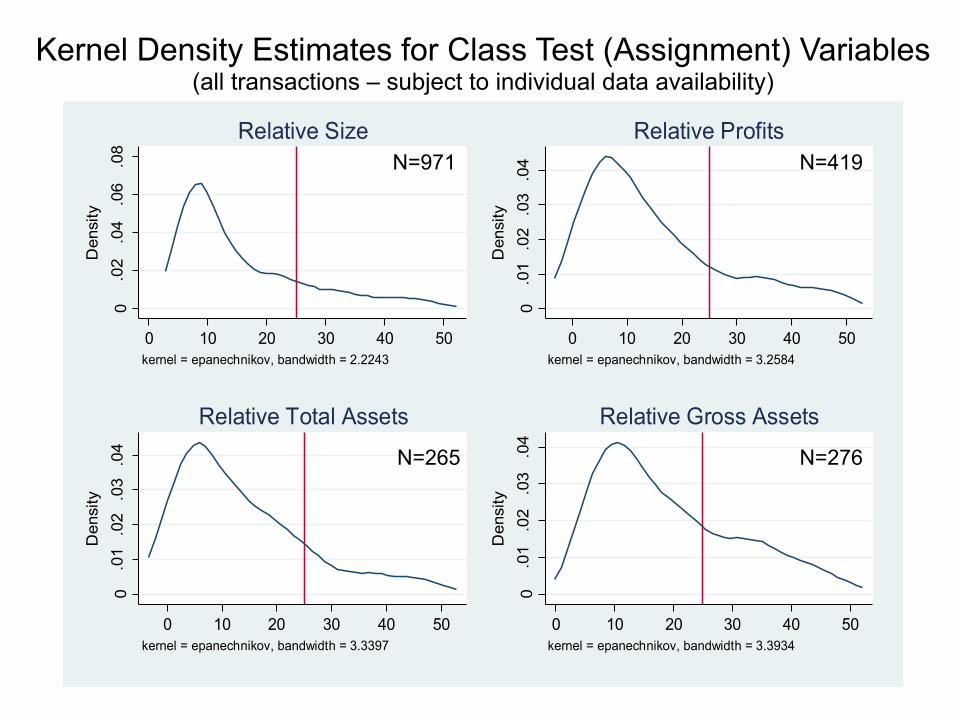
• If yes, one should observe a spike in a density plot of the assignment variables just below or just above 25%
0.0
2.0
4.0
6.0
8D
ensi
ty
0 10 20 30 40 50kernel = epanechnikov, bandwidth = 2.2243
Relative Size
0.0
1.0
2.0
3.0
4D
ensi
ty
0 10 20 30 40 50kernel = epanechnikov, bandwidth = 3.2584
Relative Profits0
.01
.02
.03
.04
Den
sity
0 10 20 30 40 50kernel = epanechnikov, bandwidth = 3.3397
Relative Total Assets
0.0
1.0
2.0
3.0
4D
ensi
ty
0 10 20 30 40 50kernel = epanechnikov, bandwidth = 3.3934
Relative Gross Assets
Kernel Density of Acquisitions (All UK Deals)Kernel Density Estimates for Class Test (Assignment) Variables
(all transactions – subject to individual data availability)
N=971
N=276 N=265
N=419
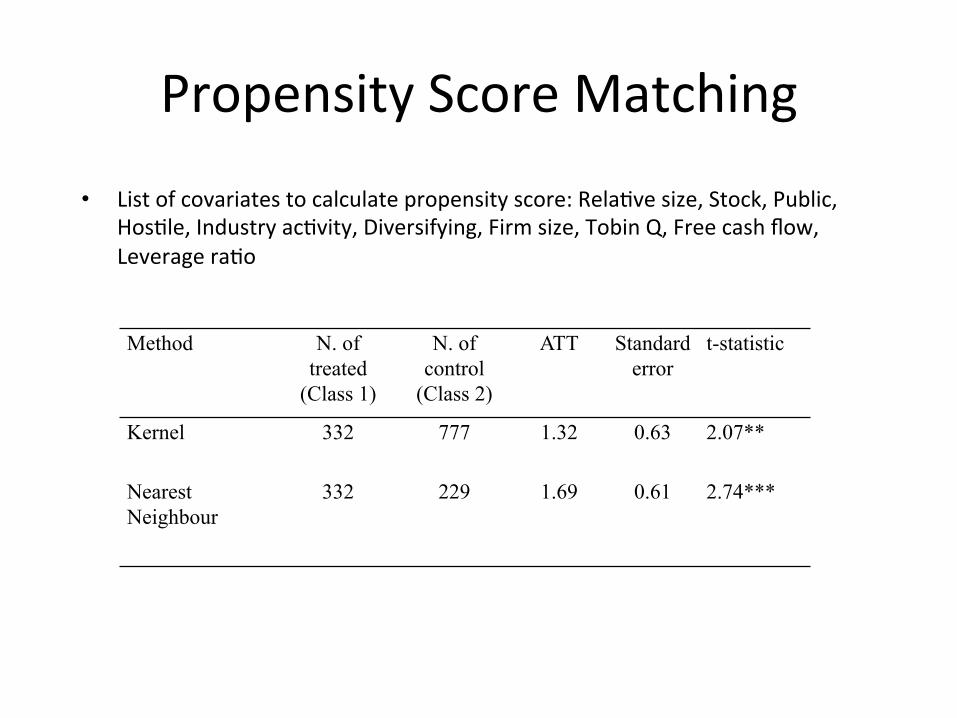
Propensity Score Matching
• List of covariates to calculate propensity score: RelaRve size, Stock, Public, HosRle, Industry acRvity, Diversifying, Firm size, Tobin Q, Free cash flow, Leverage raRo
Method N. of treated
(Class 1)
N. of control
(Class 2)
ATT Standard error
t-statistic
Kernel 332 777 1.32 0.63 2.07**
Nearest Neighbour
332 229 1.69 0.61 2.74***
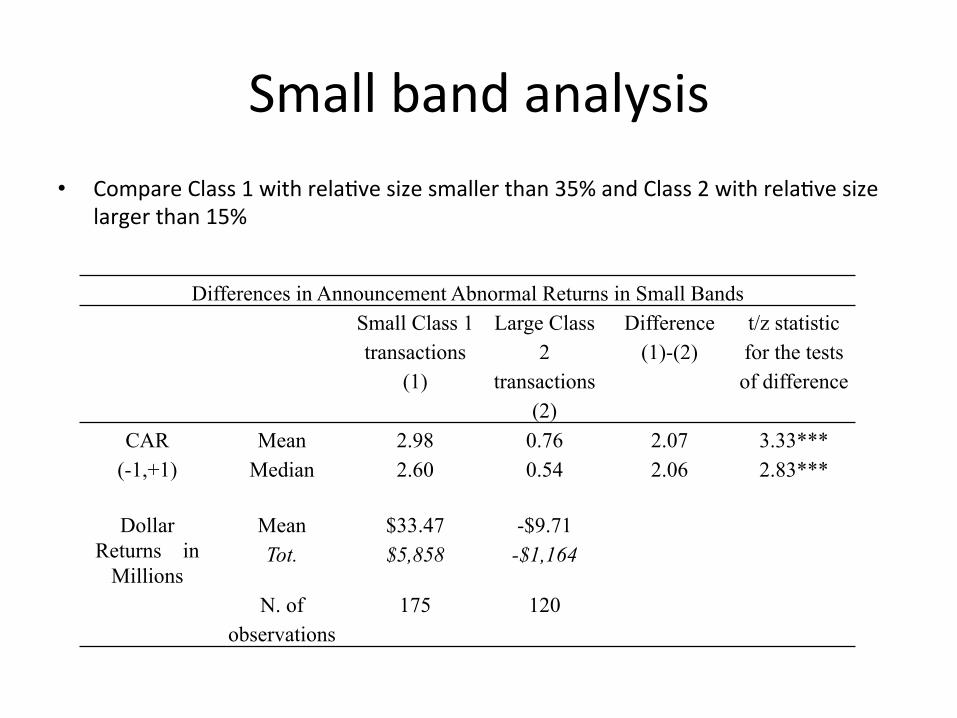
Small band analysis • Compare Class 1 with relaRve size smaller than 35% and Class 2 with relaRve size
larger than 15%
Differences in Announcement Abnormal Returns in Small Bands Small Class 1 transactions
(1)
Large Class 2
transactions (2)
Difference (1)-(2)
t/z statistic for the tests of difference
CAR (-1,+1)
Mean 2.98 0.76 2.07 3.33*** Median 2.60 0.54 2.06 2.83***
Dollar Returns in
Millions
Mean $33.47 -$9.71 Tot. $5,858 -$1,164
N. of observations
175 120
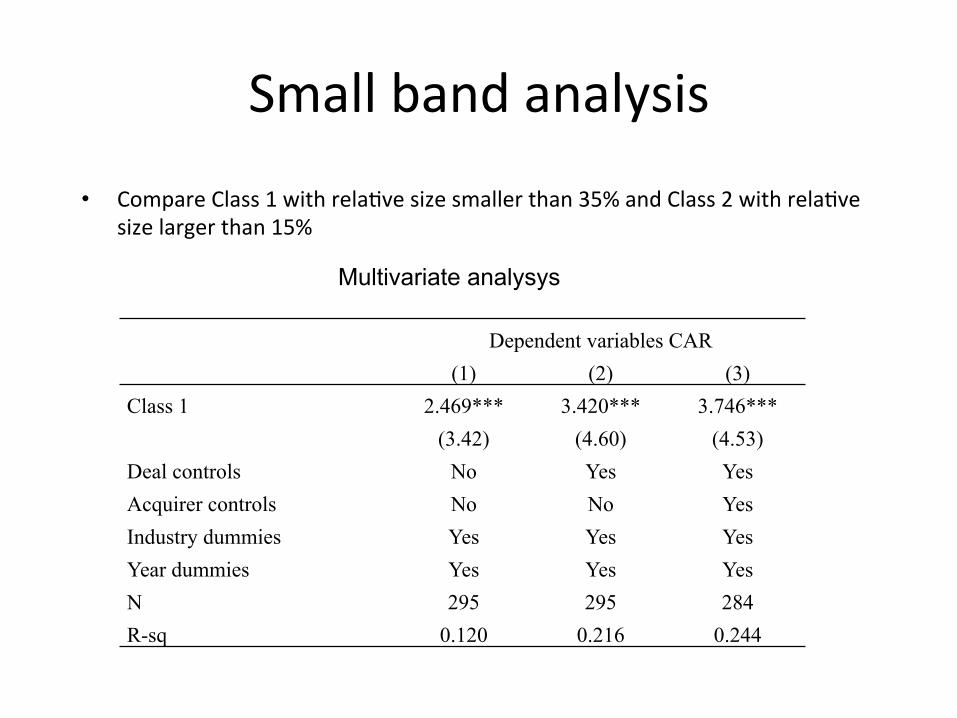
Small band analysis
Dependent variables CAR (1) (2) (3)
Class 1 2.469*** 3.420*** 3.746*** (3.42) (4.60) (4.53)
Deal controls No Yes Yes Acquirer controls No No Yes Industry dummies Yes Yes Yes Year dummies Yes Yes Yes N 295 295 284 R-sq 0.120 0.216 0.244
• Compare Class 1 with relaRve size smaller than 35% and Class 2 with relaRve size larger than 15%
Multivariate analysys
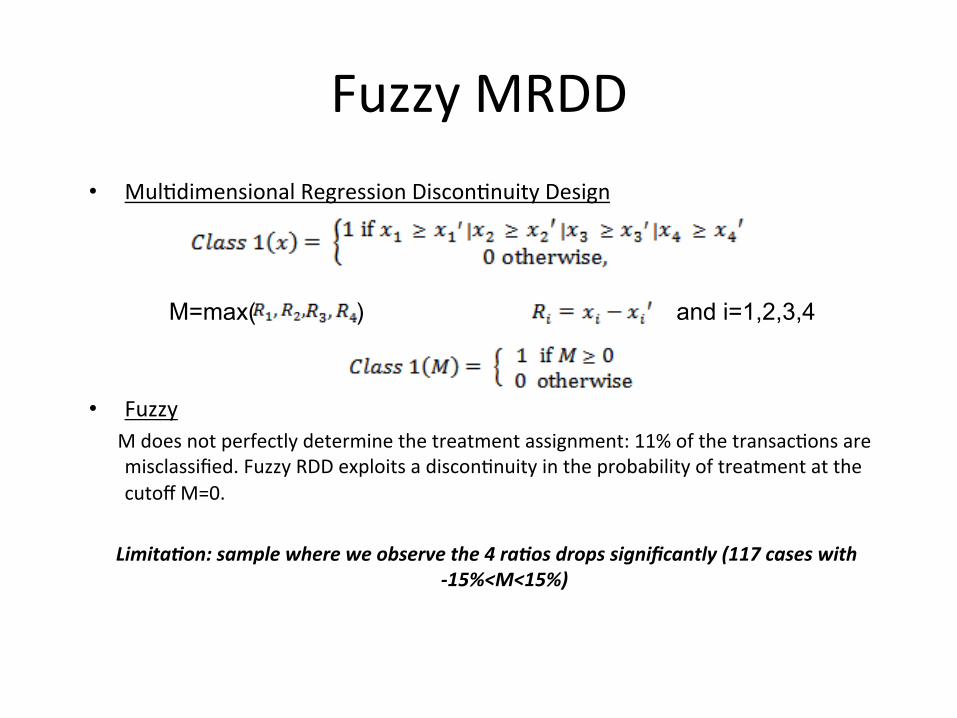
Fuzzy MRDD • MulRdimensional Regression DisconRnuity Design
• Fuzzy M does not perfectly determine the treatment assignment: 11% of the transacRons are
misclassified. Fuzzy RDD exploits a disconRnuity in the probability of treatment at the cutoff M=0.
Limita'on: sample where we observe the 4 ra'os drops significantly (117 cases with
-‐15%<M<15%)
M=max( ) and i=1,2,3,4
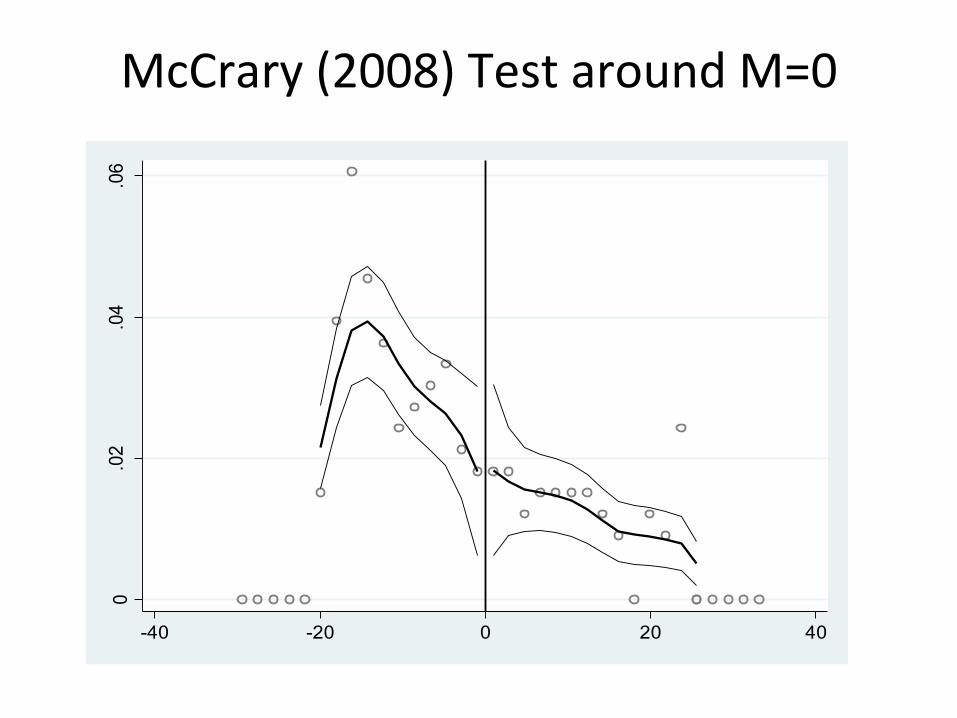
0.02
.04
.06
-40 -20 0 20 40
McCrary (2008) Test around M=0
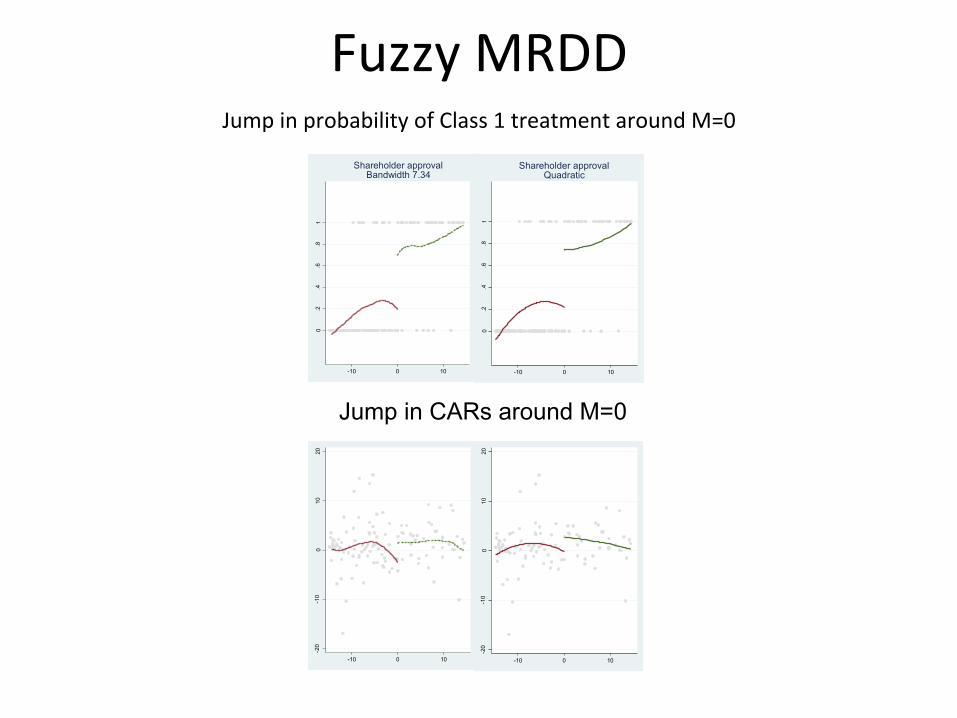
Fuzzy MRDD Jump in probability of Class 1 treatment around M=0
0.2
.4.6
.81
-10 0 10
Shareholder approvalBandwidth 7.34
0.2
.4.6
.81
-10 0 10
Shareholder approvalQuadratic
-20
-10
010
20
-10 0 10
-20
-10
010
20
-10 0 10
Jump in CARs around M=0
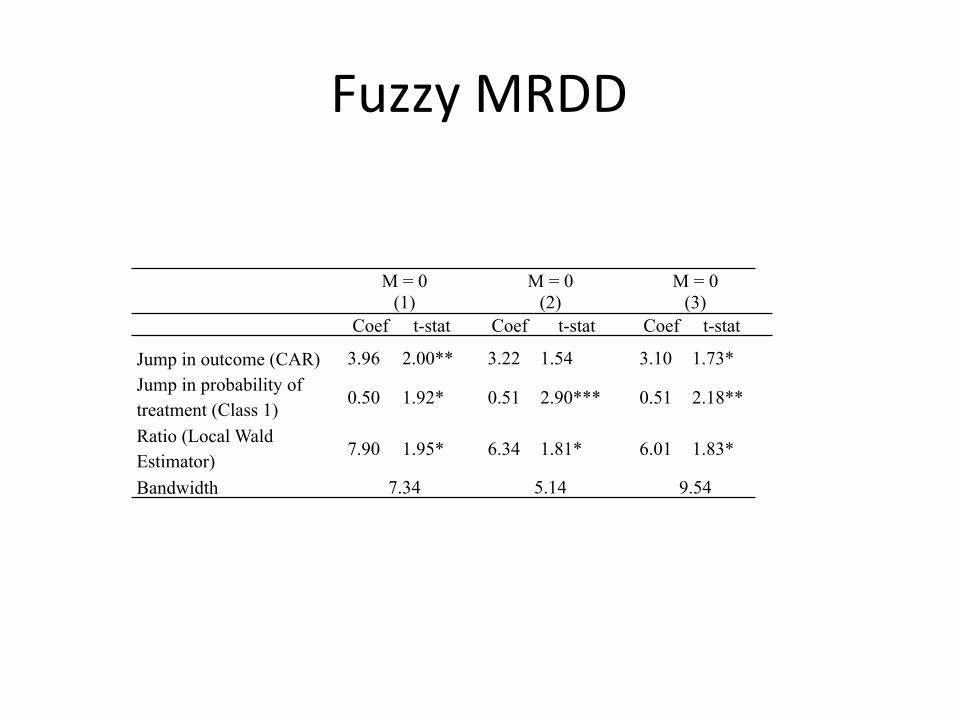
Fuzzy MRDD
M = 0 (1)
M = 0 (2)
M = 0 (3)
Coef t-stat Coef t-stat Coef t-stat
Jump in outcome (CAR) 3.96 2.00** 3.22 1.54 3.10 1.73* Jump in probability of treatment (Class 1)
0.50 1.92* 0.51 2.90*** 0.51 2.18**
Ratio (Local Wald Estimator)
7.90 1.95* 6.34 1.81* 6.01 1.83*
Bandwidth 7.34 5.14 9.54
Comparison with the U.S.
• In the United States management can avoid mandatory voRng for relaRvely large deals
• In the UK this is not possible • Difference-‐in-‐differences comparison across the AtlanRc
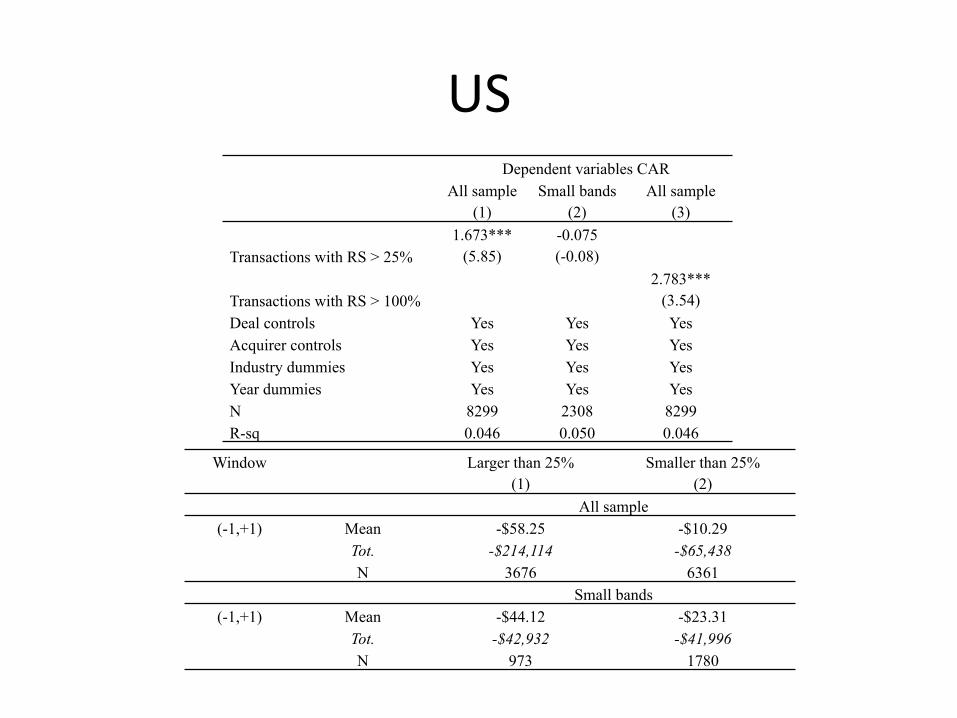
US Dependent variables CAR
All sample (1)
Small bands (2)
All sample (3)
Transactions with RS > 25% 1.673***
(5.85) -0.075 (-0.08)
Transactions with RS > 100% 2.783***
(3.54) Deal controls Yes Yes Yes Acquirer controls Yes Yes Yes Industry dummies Yes Yes Yes Year dummies Yes Yes Yes N 8299 2308 8299 R-sq 0.046 0.050 0.046
Window Larger than 25% (1)
Smaller than 25% (2)
All sample (-1,+1) Mean -$58.25 -$10.29
Tot. -$214,114 -$65,438 N 3676 6361
Small bands (-1,+1) Mean -$44.12 -$23.31
Tot. -$42,932 -$41,996 N 973 1780
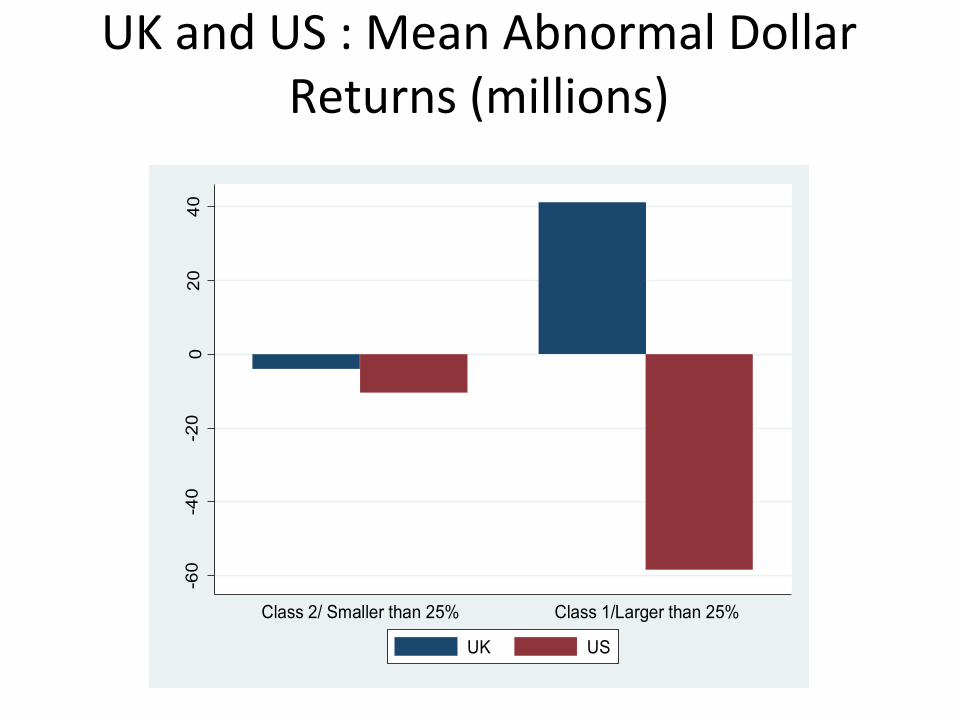
UK and US : Mean Abnormal Dollar Returns (millions)
-60
-40
-20
020
40
Abn
orm
al D
olla
r Ret
urn
Class 2/ Smaller than 25% Class 1/Larger than 25%
UK US
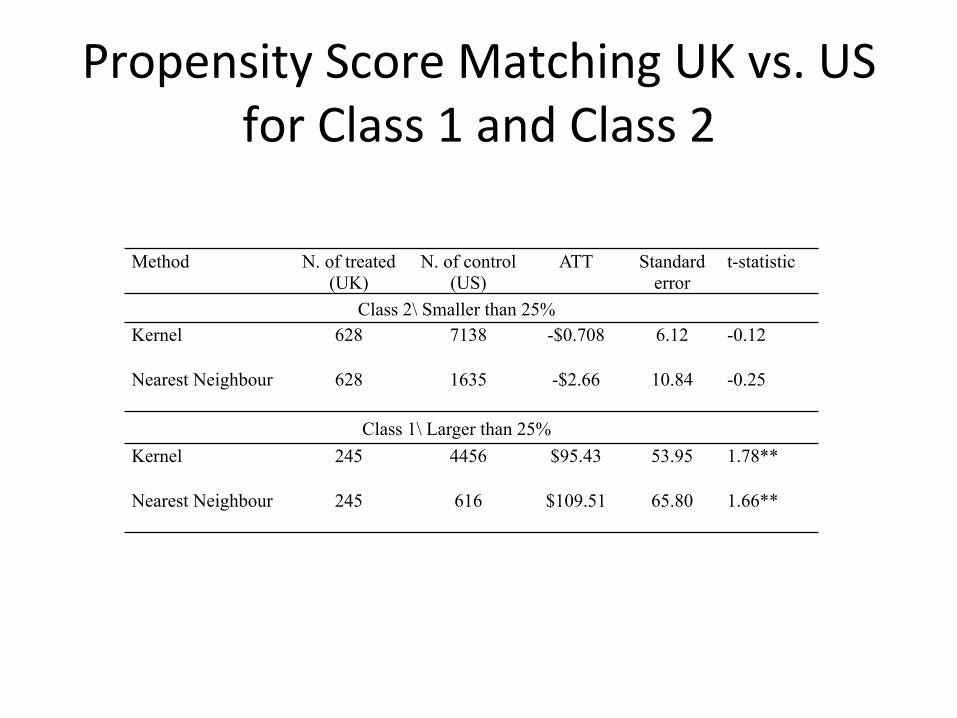
Propensity Score Matching UK vs. US for Class 1 and Class 2
Method N. of treated (UK)
N. of control (US)
ATT Standard error
t-statistic
Class 2\ Smaller than 25% Kernel 628 7138 -$0.708 6.12 -0.12
Nearest Neighbour 628 1635 -$2.66 10.84 -0.25
Class 1\ Larger than 25% Kernel 245 4456 $95.43 53.95 1.78**
Nearest Neighbour 245 616 $109.51 65.80 1.66**
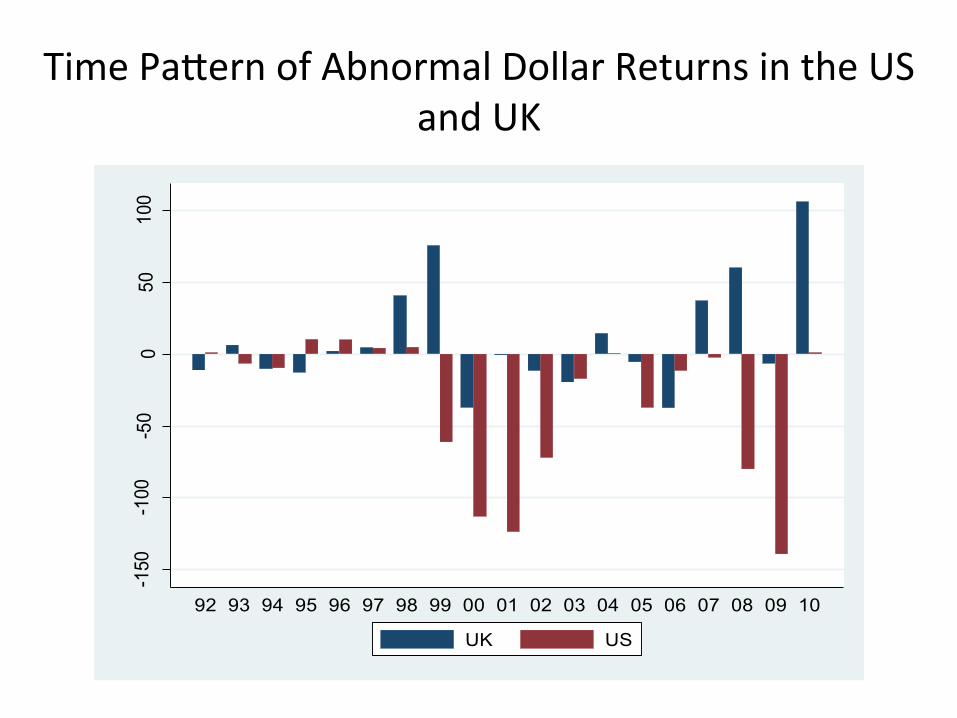
Time Pa{ern of Abnormal Dollar Returns in the US and UK
-150
-100
-50
050
100
Abno
rmal
Dol
lar R
etur
n
92 93 94 95 96 97 98 99 00 01 02 03 04 05 06 07 08 09 10
UK US
Conclusion and Caveats
• Shareholders in the UK never vote against Class 1. Nevertheless, there is a sizeable difference between the performance of Class 1 and Class 2
• Study does not provide a full cost/benefit analysis of the mandatory voRng rule
• Results do not apply for banks: shareholder of highly leveraged companies might want to take big risks & banks excluded from study