Does zoning winter recreationists reduce recreation conflict? · frameworks such as the limits of...
18
Environmental Management DOI 10.1007/s00267-016-0777-0 Does Zoning Winter Recreationists Reduce Recreation Conflict? Aubrey D. Miller 1 ● Jerry J. Vaske 1 ● John R. Squires 2 ● Lucretia E. Olson 2 ● Elizabeth K. Roberts 3 Received: 18 July 2016 / Accepted: 3 October 2016 © Springer Science+Business Media New York 2016 Abstract Parks and protected area managers use zoning to decrease interpersonal conflict between recreationists. Zoning, or segregation, of recreation—often by non- motorized and motorized activity—is designed to limit physical interaction while providing recreation opportu- nities to both groups. This article investigated the effec- tiveness of zoning to reduce recreation conflict in the Vail Pass Winter Recreation Area in Colorado, USA. Despite a zoning management system, established groomed travel routes were used by both non-motorized recreationists (backcountry skiers, snowboarders, snowshoers) and motorized recreationists (snowmobilers). We hypothesized that persistent recreation conflict reported by non-motorized recreationists was the result of recreation occurring in areas of mixed non-motorized and motorized use, mostly along groomed routes. We performed a geospatial analysis of recreation [from Global Positioning System (GPS) points, n = 1,233,449] in the Vail Pass Winter Recreation Area to identify areas of mixed non-motorized and motorized use. We then surveyed non-motorized recreationists (n = 199) to test whether reported conflict is higher for respondents who traveled in areas of mixed-use, compared with respondents traveling outside areas of mixed-use. Results from the geospatial analysis showed that only 0.7 % of the Vail Pass Winter Recreation Area contained recreation from both groups, however that area contained 14.8 % of all non- motorized recreation and 49.1 % of all motorized recreation. Survey analysis results showed higher interpersonal conflict for all five standard conflict variables among non-motorized respondents who traveled in areas of mixed-use, compared with those traveling outside mixed-use areas. Management implications and recommendations for increasing the effectiveness of zoning are provided. Keywords GIS ● Geospatial analysis ● Parks and protected areas ● Recreation conflict ● Survey analysis ● Zoning Introduction Recreation in American parks and protected areas (PPAs) increased dramatically after World War II (Cordell et al. 2008; Jensen and Guthrie 2006), and estimates indicate that overall participation will continue to climb in coming dec- ades (Bowker et al. 2012). Recreation research since the 1960s has developed in two directions. First, a considerable body of research exists on recreation ecology, or the effects recreation has on the ecosystems in which it occurs (e.g., Hammitt and Cole 1998; Liddle 1997; Monz et al. 2010). The second direction has focused on describing patterns of recreation use and how those patterns may affect the availability or quality of recreational experiences (Manning 2011). Research provides insights into the sources of common recreation issues such as crowding, conflict and dissatisfaction that evolved around the idea of a social carrying capacity (Cole 2004; Manning 2011; Shelby and Heberlein 1986; Wagar 1964). PPA managers have responded to recreation issues with various planning * Aubrey D. Miller [email protected] 1 Department of Human Dimensions of Natural Resources, Colorado State University, 1480 Campus Delivery, Fort Collins, CO 80523, USA 2 US Forest Service, Rocky Mountain Research Station, 800 E. Beckwith, Missoula, MT 59801, USA 3 US Forest Service, White River National Forest, 900 Grand Ave, Glenwood Springs, CO 81601, USA
Transcript of Does zoning winter recreationists reduce recreation conflict? · frameworks such as the limits of...

Environmental ManagementDOI 10.1007/s00267-016-0777-0
Does Zoning Winter Recreationists Reduce Recreation Conflict?
Aubrey D. Miller1 ● Jerry J. Vaske1 ● John R. Squires2 ● Lucretia E. Olson2 ●
Elizabeth K. Roberts3
Received: 18 July 2016 / Accepted: 3 October 2016© Springer Science+Business Media New York 2016
Abstract Parks and protected area managers use zoning todecrease interpersonal conflict between recreationists.Zoning, or segregation, of recreation—often by non-motorized and motorized activity—is designed to limitphysical interaction while providing recreation opportu-nities to both groups. This article investigated the effec-tiveness of zoning to reduce recreation conflict in the VailPass Winter Recreation Area in Colorado, USA. Despite azoning management system, established groomed travelroutes were used by both non-motorized recreationists(backcountry skiers, snowboarders, snowshoers) andmotorized recreationists (snowmobilers). We hypothesizedthat persistent recreation conflict reported by non-motorizedrecreationists was the result of recreation occurring in areasof mixed non-motorized and motorized use, mostly alonggroomed routes. We performed a geospatial analysis ofrecreation [from Global Positioning System (GPS) points, n= 1,233,449] in the Vail Pass Winter Recreation Area toidentify areas of mixed non-motorized and motorized use.We then surveyed non-motorized recreationists (n= 199) totest whether reported conflict is higher for respondents whotraveled in areas of mixed-use, compared with respondentstraveling outside areas of mixed-use. Results from thegeospatial analysis showed that only 0.7 % of the Vail Pass
Winter Recreation Area contained recreation from bothgroups, however that area contained 14.8 % of all non-motorized recreation and 49.1 % of all motorized recreation.Survey analysis results showed higher interpersonal conflictfor all five standard conflict variables among non-motorizedrespondents who traveled in areas of mixed-use, comparedwith those traveling outside mixed-use areas. Managementimplications and recommendations for increasing theeffectiveness of zoning are provided.
Keywords GIS ● Geospatial analysis ● Parks and protectedareas ● Recreation conflict ● Survey analysis ● Zoning
Introduction
Recreation in American parks and protected areas (PPAs)increased dramatically after World War II (Cordell et al.2008; Jensen and Guthrie 2006), and estimates indicate thatoverall participation will continue to climb in coming dec-ades (Bowker et al. 2012). Recreation research since the1960s has developed in two directions. First, a considerablebody of research exists on recreation ecology, or the effectsrecreation has on the ecosystems in which it occurs (e.g.,Hammitt and Cole 1998; Liddle 1997; Monz et al. 2010).The second direction has focused on describing patterns ofrecreation use and how those patterns may affect theavailability or quality of recreational experiences (Manning2011). Research provides insights into the sources ofcommon recreation issues such as crowding, conflict anddissatisfaction that evolved around the idea of a socialcarrying capacity (Cole 2004; Manning 2011; Shelby andHeberlein 1986; Wagar 1964). PPA managers haveresponded to recreation issues with various planning
* Aubrey D. [email protected]
1 Department of Human Dimensions of Natural Resources,Colorado State University, 1480 Campus Delivery, Fort Collins,CO 80523, USA
2 US Forest Service, Rocky Mountain Research Station, 800 E.Beckwith, Missoula, MT 59801, USA
3 US Forest Service, White River National Forest, 900 Grand Ave,Glenwood Springs, CO 81601, USA

frameworks such as the limits of acceptable change (Stan-key et al. 1985), visitor impact management framework(Kuss et al. 1990) and visitor experience and resourceprotection (NPS 1997) designed to help managers identifyrecreation issues and take steps to minimize them inrecreation planning.
An increasing demand for abundant and high-qualityrecreation opportunities in PPAs can create conflict betweenrecreationists competing for their desired recreationexperience. Decades of research on recreation conflict andmanagement practices have focused on two common stra-tegies for limiting conflict between recreationists (Graefeand Thapa 2004; Lindberg et al. 2009; Lucas 1964). First,PPA managers limit the amount of interaction betweengroups by zoning recreation into areas open to a particularrecreation activity while being closed to another (Leung andMarion 1999; Wagar 1964). Zoning is designed to separateactivities and reduce interpersonal conflict. Interpersonalconflict occurs when the physical presence or behavior of anindividual or group interferes with the goals of anotherindividual or group (Graefe and Thapa 2004; Jacob 1977;Jacob and Schreyer 1980). Research shows interpersonalconflict often occurs between non-motorized and motorizedrecreation groups, for example between canoers andmotorboaters (Adelman et al. 1982), between cross-countryskiers and snowmobilers (Jackson and Wong 1982; Knoppand Tyger 1973; Vaske et al. 2007), and between back-country skiers and helicopter-assisted skiers (Gibbons andRuddell 1995).
Second, PPA managers use an active managementapproach to visitor education and enforcement of zoningboundaries. A primary aim of active management is to limitsocial values conflict (Miller and Vaske 2016; Vaske et al.2007). Social values conflict occurs between groups whomay not share similar norms or values about an activity(Rudell and Gramann 1994; Vaske et al. 1995). Socialvalues conflict can occur between recreationists even withno direct contact between the groups (Carothers et al. 2001;Vaske et al. 2007). One group of recreationists may philo-sophically disagree about allowing another recreationistactivity (e.g., Blahna et al. 1995; Vaske et al. 1995), solong-term education efforts are used to target the commonlyheld norms a group may have. For example, a ColoradoParks and Wildlife education program focused on the ben-efits of a regulation (C.R.S. 25-12-110) that limits off-highway vehicle noise pollution. Snowmobile noise pollu-tion is often reported as a source of animosity from non-motorized recreationists towards motorized recreationists(Lindberg et al. 2009; Vittersø et al. 2004). The educationprogram on the noise regulation was designed to minimizesocial values conflict by demonstrating that snowmobilesare quieter now compared with in the past. Active man-agement may coincide with a fee for recreation use in the
PPA. Fee revenue is used in supporting an active manage-ment approach with field-going employees educating visi-tors on zoning boundaries and enforcing regulations.
While interpersonal and social values conflicts exist withdistinct underlying drivers, they are closely related. Man-agers of PPAs have looked to zoning and active manage-ment to more fully address conflict between recreationgroups (Leung and Marion 1999; Miller and Vaske 2016;Schneider 2000; Vaske et al. 2007). There is limitedempirical research measuring the effectiveness of zoningand active management. Early notions of recreation zoningcome from planning frameworks such as Clark and Stan-key’s (1979) Recreation Opportunity Spectrum (ROS). TheROS codified the idea of spatial separation of incompatibleuses, for example mechanized and non-mechanized, tomitigate potential conflict between groups. In proceedingdecades, managers have implemented zoned recreationmanagement plans, especially in high-use areas likenational parks (Leung and Marion 1999). Few studies havetested the effectiveness of recreation zoning, however.Marion et al. (1993) report on actions taken by NationalPark Service managers to reduce conflict. They foundrespondents had taken management actions to segregate usegeographically (27 % of respondents) and zone trails by use(12 % of respondents). An example of active managementwas reported by Marion et al. (1993) who found 40 % of therespondents indicated that they had “inform[ed] visitorsabout conflicting uses they may encounter in certain areas”(p. 27). Leung and Marion (1999) have shown that zoningand active management are used by PPA managers, but notwhether they are effective at reducing conflict.
Miller and Vaske (2016) examined changes in reportedinterpersonal and social values conflict over a 10-year plusperiod at the Vail Pass Winter Recreation Area (VPWRA),a busy (over 35,000 winter recreationist visits per season),actively managed and zoned recreation area in centralColorado. The results showed interpersonal conflict whichdecreased over the period for both non-motorized andmotorized recreationists. Both groups, however, continue toreport interpersonal conflict even with an established zoningsystem. Despite an established active management approachat the VPWRA, social values conflict among non-motorizedrecreationists increased over the period. One importantfinding was that despite a system of zoning at the VPRWA,there are areas with both non-motorized and motorizedrecreationists present. These mixed-use areas, it was hypo-thesized, may have been responsible for much of the lin-gering interpersonal and social values conflict.
The analysis reported in this article builds on previousresearch at the VPWRA to better understand the extent towhich areas of mixed-use recreation influences levels ofconflict reported by non-motorized recreationists. Specifi-cally, we used two distinct methodologies to more clearly
Environmental Management

describe the nature of winter recreation at the VPWRA andidentify factors responsible for persistent conflict amongnon-motorized recreationists. First, we performed a Geo-graphic Information System (GIS) analysis of recreationGPS data, collected over two winter seasons at theVPWRA. The GIS analysis provides a more completeobjective for characterization of how recreationists movethrough a winter dispersed recreation landscape. The extentto which recreation is dispersed will have direct effects onthe level of interaction the recreation groups will have. Thishigh resolution analysis quantifies where and when recrea-tion use occurs in the VPWRA to better understand the levelof mixed-use in a zoned recreation system. Second, we useda survey to test whether there are reported differencesamong non-motorized recreationists who traveled in areasof mixed-use, compared with those who did not travel inmixed-use areas.
Hypotheses
Based on previous winter recreationist conflict research andobservations of recreationists at the VPWRA, the followingthree hypotheses were advanced:
H1 Despite a zoning management plan, due to the pre-sence of established travel routes, a disproportionateamount of recreation at the VPWRA will occur in mixed-use areas, compared with areas of no mixed-use.
H2 Among non-motorized respondents, those traveling inmixed-use areas within the VPWRA will report a higherlevel of interpersonal conflict compared with those recrea-tionists who did not travel in mixed-use areas.
H3 Among non-motorized respondents, those traveling inmixed-use areas within the VPWRA will report a higherlevel of social values conflict compared with those recrea-tionists who did not travel in mixed-use areas.
Methods
Study Site
The VPWRA encompasses 20,240 ha of sub-alpine andalpine terrain ranging from 2652 to 3869 m and is managedby the White River National Forest (WRNF). The area islocated immediately south of Vail Mountain Resort, west ofthe Eagles Nest Wilderness Area, and north of the CopperMountain Resort (Fig. 1). Both Vail Mountain Resort andCooper Mountain hold special-use permits from the WRNFfor ski operations on public land. Interstate 70 crossesthrough the eastern portion of the VPWRA, which is a oneand a half hour drive to the Denver Metro Area and other
Colorado Front Range communities. US Highway 24 formsthe western boundary of the VPWRA connecting themountain communities of Leadville and Minturn.
Visitors to the VPWRA are required to pay an entrancefee (currently $6 per person per day), of which 95 % isgiven to the WRNF to be used for trail grooming and full-time paid rangers who provide active management in theform of parking lot management, enforcement of regula-tions, and public education. The VPWRA sees approxi-mately 35,000 visitors per winter season (USDA ForestService 2015). The majority of visitors access the VPWRAfrom four primary portals, the busiest adjacent to Interstate70, and three along the west side of the VPWRA (Fig. 1).
The current zoning boundaries at the VPWRA reflectmore than 20 years of collaboration between the WRNF andlocal stakeholders to provide access to high quality non-motorized and motorized backcountry terrain (Miller andVaske 2016; USDA Forest Service 2015). Approximately47 % of the winter recreation area is closed to motorized use(Table 1), while 45 % is open to motorized use. There are1338 ha (7 %) of terrain designated for hybrid use. Theseareas allow motorized use along designated routes to pro-vide access to skiers and snowboarders.
Backcountry hut users account for approximately 11,000users annually (USDA Forest Service 2015). There are sixbackcountry huts located within the VPWRA, which areeither operated privately with special-use permits from theWRNF on public lands, or located on private inholdings(Fig. 1). Hut users are predominately non-motorizedrecreationists, as motorized use is not permitted at mosthuts. The majority of recreationists access the huts from themain VPWRA portals, however, some visitors traveldirectly between huts, including from huts located outsidethe VPWRA.
Data Collection
Two datasets were used in the analysis. First, a geospatialdataset was used to examine the overlapping use of non-motorized and motorized recreationists in the VPWRA. TheGPS point dataset allows for a more reliable analysis ofrecreation patterns at higher spatial resolutions than tradi-tional methods such as electronic trail counters or exitinterviews with visitors, which do not provide a completepicture of how recreationists move through a landscape(Cole and Daniel 2003; Hallo et al. 2012). Use of GPS unitsto study recreation is increasing (e.g., D’Antonio et al. 2010;Hallo et al. 2012; Lai et al. 2007; Rupf et al. 2011; Shovaland Isaacson 2006) as units become smaller and lessexpensive (Wing et al. 2005). Second, data were obtainedfrom a survey of both non-motorized and motorizedrecreationists at the VPWRA. Data from the non-motorizedgroup were the focus of this article since they reported
Environmental Management

Fig. 1 The vail pass winter recreation area (VPWRA) and recreation zoning designations and established groomed routes. See Miller and Vaske(2016) for history of recreation zoning at the VPWRA. The six backcountry huts (diamonds) and four primary access portals (stars) are also shown
Environmental Management

higher levels of interpersonal conflict than the motorizedgroup (Miller and Vaske 2016).
Geospatial Data
The GPS data were collected from the VPWRA during thewinters of 2010 and 2011 as part of a larger study on themovement patterns of winter recreationists and Canada lynx(Lynx canadensis). Recreationists were asked to carry asmall GPS unit (Qstarz, model BT-Q1300), which stored aGPS point every 5 s throughout their visit to the VPWRA.In addition to logging the geographic coordinates, the GPSunit also captured the speed, altitude, and turn-angle of eachpoint but had no user-interface or remote tracking cap-ability. Sampling occurred on all seven days (during day-light hours only) over the period from early January to thefirst week of April in both 2010 and 2011. A network ofinfrared and magnetic trail counters was used to verify thesampling procedure, which showed the busiest days at theVPWRA were weekends with over 95 % of use occurringbetween 8am and 5pm. A greater number of tracks wascollected on weekend days, which reflected the higherweekend visitation to the VPWRA. Researchers asked avisitor from every fourth vehicle in the parking lot to carrythe unit (response rate = 90 %). One unit was carried pergroup. The number of people in the group, the mode oftravel, the portal from which the unit was distributed, andthe unit identification number were recorded. As an incen-tive for carrying the GPS unit, visitors could voluntarilyprovide an email address to which the GPS track was sent asa Google Earth file. Recreationists dropped the GPS unitsinto a collection bin at the end of their visit to the VPWRA.The researchers collected the units and downloaded the datain a computer.
GPS data were categorized by the mode of travel: (1)snowmobile, (2) hybrid, where a snowmobile or snowcat isused to access remote ski/snowboard terrain, (3) back-country ski/snowboard, and (4) snowshoe/cross-country ski,generally travel routes through less-steep terrain. Data weresaved for each track and contained all GPS points asso-ciated with the route taken by the recreationist. In some
cases, GPS units were used for multiple days by recrea-tionists staying at backcountry huts. In these cases, aseparate track was saved for each day the unit was used.
Survey Data
Survey data were collected in the winter of 2014. Both anon-site and an online version of the survey were used. On-site surveys were distributed at the Vail Pass parking area toall recreationists after their recreation experience. Twoversions of the survey were developed with the samequestions, one for motorized recreationists and one for non-motorized recreationists. This article focused on the non-motorized recreationists. Non-motorized activities includebackcountry skiing and snowboarding, cross-country ornordic skiing, and snowshoeing. Hybrid users were cate-gorized as motorized respondents and were not included inthis analysis.
On-site surveys were distributed on weekend days; mostVPWRA visitation occurs on weekends. An online versionof the survey was also created to capture visitation to thebackcountry huts located in the VPWRA. Some hut usersdo not access the VPWRA though the primary portals,entering instead from Copper Mountain or on a route fromother backcountry huts outside of the VPWRA. The onlinesurvey was necessary to reach these respondents. Hut users(specifically the trip leader listed on the reservation) wereprovided the non-motorized survey because motorized useis not allowed at huts where respondents were staying.Surveys from hut users were collected from weekdays inaddition to weekends. Trip leaders were emailed informa-tion about the survey and a link to complete it online withinthree days of their visit to the VPWRA. The averageresponse time for the online survey was 2.5 days. Com-pleted surveys were collected from a total of 199 non-motorized respondents. The majority were collected fromthe online survey (n= 180, response rate = 71 %), com-pared with the 19 on-site surveys (response rate 88 %).
Variables Measured
Geospatial Data
The geospatial variable of interest for this analysis was thespatial distribution of recreation use across the VPWRA.Specifically, this analysis focused on the extent to whichnon-motorized and motorized recreationists’ terrain selec-tion overlapped spatially.
Survey Data
The conflict variables were identical to previous recreationresearch (i.e., Carothers et al. 2001; Miller and Vaske 2016;
Table 1 Recreation zoning designations and distributions at theVPWRA, Colorado
Zoning designation Hectares Of total VPWRA (%)
Closed to motorized 9515 47
Open to motorized 9020 45
Open to motorized for hybridaccess only
1338 7
Non-US forest service land 366 2
Total 20,240
Environmental Management

Vaske et al. 1995 2007). Respondents initially indicatedhow frequently they (1) saw motorized user traveling out ofcontrol, (2) saw motorized user being rude and dis-courteous, (3) saw motorized user pass too closely, (4) sawmotorized user not yielding the right of way, and (5) sawmotorized user disturb wildlife. Response categories were“never,” “1–2 times,” “3–5 times,” and “almost always.”Based on previous research (Carothers et al. 2001; Millerand Vaske 2016; Vaske et al. 1995 2007), these responseswere recoded into “not observed” (i.e., respondent reportedit never happened) or “observed” (i.e., respondent reported ithappened at least once). Respondents were then asked ifthey believed each of these questions was a problem. Theresponses were initially coded on a four-point scale: “not aproblem,” “slight problem,” “moderate problem,” and“extreme problem.” As with the above questions, theresponses were recoded into either “no problem” or“problem.”
Consistent with previous research (Carothers et al. 2001;Miller and Vaske 2016; Vaske et al. 1995, 2007), com-bining the frequency of occurrence (observed, not observed)variables with the corresponding perceived problem (noproblem, problem) variables for each respondent producedconflict typologies with the three possible attributes: (1) noconflict, (2) interpersonal conflict, and (3) social valuesconflict. Individuals who observed or did not observe agiven event, yet did not perceive it to be a problem wereconsidered to have experienced no conflict (i.e., no inter-personal or social values conflict). Those who never saw agiven event, but believed that a problem existed for theevent were considered to be expressing a conflict in socialvalues. Conversely, those who witnessed a particular eventand believed that it had caused a problem were judged to beindicating interpersonal conflict.
Data Analysis
Geospatial Analysis
The geospatial data included 903 GPS tracks comprising atotal of 1,444,054 GPS points from 2010 and 2011 (Table 2;Fig. 2). The dataset was analyzed using ArcGIS 10.2. Pointswere categorized as non-motorized or motorized by therespondent’s mode of travel. Ski/board and snowshoe/XC-ski were categorized as non-motorized. The hybrid pointsfalling within 20 m of an established route, along withsnowmobile points were categorized as motorized. Thehybrid points greater than 20 m from an established routewere not included in the analysis because, they could not beaccurately categorized as non-motorized or motorized.
Once the GPS points were categorized, a raster analysiswas performed converting the points into a new 10 mresolution output raster layer for non-motorized points and a
second layer for motorized points that contained the numberof points located within each 10 m2 cell. A relatively high-resolution raster of 10 m was used to capture the spatialrelationship between established routes and the recreationistcarrying the GPS unit. Each raster layer was then reclassi-fied into six categories based on the number of pointscontained within each cell. Classification based on discretebins was used to assist in consistent visualization of the dataresults for the motorized and non-motorized layer. Theintensity of recreation use, however, was a continuousvariable used in computation. Six bins were created for bothmotorized and non-motorized use. The bins were labeled asvery low use (10 points or fewer), low use (11–25 points),moderate use (26–100 points), high use (101–250 points),very high use (251–500 points), and extreme use (greaterthan 500 points). Raster algebra was then used to identifythe cells that contained both non-motorized and motorizedrecreation, at a resolution of 10 m2. The final output rastercontained all possible density combinations of overlappingnon-motorized and motorized use (Table 3).
Finally, the mixed-use layer was intersected with theoriginal non-motorized and motorized GPS points todetermine the proportion of recreation use occurring insidethe mixed-use area, compared with the recreation occurringoutside the area. One limitation of the analysis was thatsome physical terrain covered by recreationists between theGPS units collecting points was not captured.1 To moreaccurately capture the terrain, recreationists moved acrosswhile carrying the GPS unit; we buffered the mixed-usearea by 10 m. We then calculated the number of non-motorized and motorized GPS points intersecting the
Table 2 Summary of recreation GPS tracks and points collected bymode and year
Year Mode Tracks Points
2010 Snowmobile 131 223,943
Hybrid 127 316,761
Ski/Board 73 171,128
Snowshoe/XC-ski 16 41,685
2010 Total 347 753,517
2011 Snowmobile 191 211,832
Hybrid 169 233,035
Ski/Board 176 221,163
Snowshoe/XC-ski 20 24,507
2011 total 556 690,537
Overall total 903 1,444,054
1 The analysis was performed directly on the GPS points rather thanon the GPS tracks because the straight lines drawn between points didnot necessarily accurately represent the path taken by the recreationist.We found the point analysis to be more accurate at this spatialresolution.
Environmental Management

Environmental Management

buffered mixed-use area. This approach further revealeddiffering use patterns between motorized and non-motorized recreationists.
Survey Analysis
Areas of mixed-use were identified from the GIS analysis.Respondents were categorized as either having traveled in amixed-use area or not, based on the locations they selectedon the survey as ones visited during their trip (locationsidentified in Fig. 3). Locations were based on popular pointsof interest within the VPRWA. For example, if a respondentselected only Corral Creek/Uneva Peak as the location he/she traveled to during the trip, the survey was categorized asno mixed-use because motorized travel is not permittedalong any possible travel route to reach this location afterdeparting from the access portal. However, if the respondentselected a location that would require travel through amixed-use area, the survey was categorized as mixed-use.Of the eight possible locations, a respondent could havevisited and selected on the survey, two had no overlappingnon-motorized and motorized use (some limited mixed-useoccurs in and adjacent to the access portal at Vail Pass). Theother six locations required travel through mixed-use areas.
χ2 was then used to test for differences in each of the fiveconflict variables between respondents who traveled inmixed-use areas and those who did not.2 Depending on theconflict variable measured, there were roughly four timesmore respondents who traveled in mixed-use areas com-pared with those who did not.
Results
Geospatial Analysis
The distribution of recreation in the VPWRA varied bymode of travel (Fig. 2). A total of 1,233,449 GPS pointswere used in the analysis. There were 210,605 points thatwere not included in the analysis because they were hybridrecreation points greater than 20 m from an establishedroute. The mean length of a motorized track was longer(45.8 km, SD 22.5 km) for motorized recreationists
compared with non-motorized (mean of 9.1 km, SD of 8.2km; Table 4), and the mean speed was faster for motorized(22.9 km/h, SD 20.0 km/h), compared with non-motorizedrecreationists (3.4 km/h, SD 5.2 km/h). Non-motorized
Fig. 2 Recreation GPS tracks by mode of travel, including a snowmobile,n= 322; b hybrid snowmobile and ski/snowboard, n= 296; c backcountryski/snowboard, n= 249; and d snowshoe/cross-country ski, n= 36. The
network of groomed routes is also depicted e. The star represents thelocation of the primary portal adjacent to Interstate 70 at Vail Pass
Table 3 Final mixed-use raster layer showing combinations ofintensity of non-motorized and motorized recreation use
Level of non-motorized use
Level ofmotorized use
Number of 10m2 cells
Total ofmixed-usearea (%)
Very low Very low 6310 44.63
Very low Low 2505 17.72
Very low Moderate 3072 21.73
Very low High 735 5.20
Very low Very high 92 0.65
Very low Extreme 44 0.31
Low Very low 320 2.26
Low Low 205 1.45
Low Moderate 352 2.49
Low High 218 1.54
Low Very high 12 0.08
Low Extreme 3 0.02
Moderate Very low 119 0.84
Moderate Low 43 0.30
Moderate Moderate 37 0.26
Moderate High 34 0.24
Moderate Very high 5 0.04
Moderate Extreme 7 0.05
High Very low 7 0.05
High Low 5 0.04
High Moderate 3 0.02
High High 2 0.01
High Very high 3 0.02
High Extreme 0 0
Very high Very low 1 0.01
Very high Low 2 0.01
Very high Moderate 1 0.01
Very high High 0 0
Very high Very high 0 0
Very high Extreme 1 0.01
Extreme Very low 0 0
Extreme Low 0 0
Extreme Moderate 0 0
Extreme High 0 0
Extreme Very high 0 0
Extreme Extreme 0 0
2 Similar to Miller and Vaske (2016) and Vaske et al. (2007), a K-meanscluster analysis was performed on the non-motorized dataset. Unlike inthose analyses, however, no convergence was reached with a 2, 3, or 4cluster solution and, therefore, the cluster analysis was not included inthis analysis. The relatively small sample size of the non-mixed-userespondents could be responsible for the lack of convergence.
Environmental Management

Fig. 3 Spatial distribution and density of GPS points collected from non-motorized and motorized recreation with the locations listed on surveygiven to recreationists
Environmental Management

recreationists, however, spent more time in the VPWRAwith a mean of 2 h and 14 min spent on recreation (SD 44min), compared with a mean of 1 h and 44 min for motor-ized recreationists (SD 40 min). The mean elevation of GPSpoints analyzed was similar for both groups (3324 m, SD235 m for non-motorized points and 3380 m, SD 200 m formotorized points). Finally, non-motorized recreationiststraveled in larger groups, on average, with a mean groupsize of 5.3 (SD 4.9) compared with a mean group size of 4.0(SD 2.7) for motorized recreationists.
The geospatial analysis revealed distinct movementpatterns for the recreation groups. The areas of highestdensity—in other words, the areas with the greatest numberof GPS points per cell—were located near establishedroutes and points of interest (Fig. 3). In this case, points ofinterest are common destinations and main intersectionsalong the route network, especially passes and peaksoffering good viewsheds, as well as backcountry huts. Thenetwork of established groomed routes (approximately 105km) received predominately motorized use, but non-motorized recreation did occur as well. Backcountry ski-ers, snowboarders, cross-country skiers and snowshoersused established groomed routes, which required less phy-sical exertion compared with the travel-off establishedroutes. Overlap between motorized and motorized recrea-tion was especially prevalent at points of interest (Fig. 4).
The area of mixed use was calculated by summing thenumber of 10 m2 cells that contained at least one GPS point.Using this metric, non-motorized recreation occurred ononly 2.7 % of the entire 20,240 ha of the VPWRA (Table 5).Motorized recreation occurred on 3.5 % of the land area.Finally, only 141 ha, or 0.7 % of VPWRA contained bothnon-motorized and motorized recreation. Despite the smallarea of mixed-use recreation, these cells contained nearly15 % of non-motorized and 49% of motorized recreation(Table 5), supporting Hypothesis 1. Further, once themixed-use cells were buffered by 10 m to account for some
of the potential gaps in the terrain covered by the recrea-tionists moving at higher speeds, the area of mixed-use wascalculated as 415 ha, or 2.1 % of the entire VPWRA. Thisarea contained 18.2 % of all non-motorized GPS points (anincrease of 3.4 % over the original mixed-use area). Thebuffered mixed-use area also contained 80.6 % of allmotorized GPS points (an increase of 31 %), and furtherhighlighted how much of the recreation occurs in a smallland area on and near established travel routes and points ofinterest.
Survey Analysis
The survey results indicated differences in reported levels ofinterpersonal and social values conflict among non-motorized recreationists at the VPWRA (Table 6).Respondents who traveled in mixed-use areas reportedhigher interpersonal conflict for each conflict variable,compared with respondents who traveled in areas with nomixed-use, supporting Hypothesis 2. Respondents whotraveled in mixed-use areas, however, reported lower socialvalues conflict compared with respondents who traveled inareas with no mixed-use, not supporting Hypothesis 3. Forexample, for the conflict variable “motorized recreationistbeing rude or discourteous” of the respondents who traveledin mixed-use areas, 25 % reported interpersonal conflict,compared with 6 % for respondents who did not travel inmixed-use areas. Contrarily, 24 % of mixed-use respondentsreported social values conflict, compared with 52 % ofrespondents who did not travel in mixed-use areas (n= 166,χ²= 11.59, p= .003, Cramer’s V= .261). Levels of inter-personal conflict were lower for respondents in areas withno mixed-use, however with four of the five conflict vari-ables, some level of interpersonal conflict lingers (between6 and 12 % of respondents reporting it).
Discussion
This analysis showed the complexity of recreation zoningand conflict. Managers of PPAs have implemented zoningafter recognizing the contentious use of terrain by non-motorized and motorized recreationists. However, since theemergence of the ROS and other planning documents in the1970s, which gave PPA managers indicators for identifyingconflict and designs for spatial segregation, research hasbeen lacking on what characteristics make a zoned systemeffective at reducing conflict. Our study showed how smallspatial overlap between uses, which exist despite a zoningsystem, can result in persistent interpersonal conflict.Affordable and accurate GPS technologies for measuringthe movement and terrain selection of recreationists arebeing used in recreation research (e.g., D’Antonio et al.
Table 4 Summary of recreation GPS tracks and points used ingeospatial analysis
Non-motorized Motorized
Total Mean SD Total Mean SD
GPS points 458,463 1609a 1407a 774,986 1254a 1110a
Tracks 285 618
Track length (km) 2589 9.1 8.2 28,272 45.8 22.5
Time elapsed pertrack (h:min)
2:14 :44 1:44 :40
Speed (km/h) 3.4 5.2 22.9 20.0
Altitude (m) 3324 235 3380 200
Group size 5.3 4.9 4.0 2.7
a Points per track
Environmental Management

Fig. 4 Spatial distribution of mixed-use areas in the VPWRA at 10 mresolution. Cells containing both non-motorized and motorized GPSpoints sum to141 ha, or 0.7 % of the total land area of the VPWRA and
are most abundant around points of interest such as Shrine Pass andPtarmigan Pass
Environmental Management

2010; Hallo et al. 2012; Lai et al. 2007), which provide amore complete picture of what kind of experience winterrecreationists are seeking.
Our geospatial analysis provided an objective measure ofwhere recreation occurred within the VPWRA. It alsoidentified through a large sample size and high spatialresolution, novel characteristics of winter recreation patternsnot previously quantifiable at fine spatial scales. Our resultsindicated a spatial pattern of recreation that was not welldispersed across the VPWRA. Overall, a large proportion oftotal recreation occurred along established routes, points ofinterest and access portals (Figs. 4 and 5). This was espe-cially true for motorized recreation where 49 % of the GPSpoints collected were located inside the area of mixed-useidentified in the analysis (0.7 % of entire VPWRA area).When we buffered this mixed-use area by 10 m, over 80 %of motorized use sampled occurred in only 2.1 % of the areaof the VPWRA. There were clear differences between theway non-motorized and motorized recreationists movedthrough terrain. While non-motorized recreationists weremore dispersed in their use of terrain, 18 % of total pointscollected were located in the buffered mixed-use area. Theconsequence of low dispersion is that recreationists aremore likely to encounter other recreationists during a typical
Table 5 The area within the VPWRA with observed recreation useand the number of GPS points intersecting both the area of mixed non-motorized and motorized use and the buffered (10 m) mixed-use area
Hectares Points Of total (%)
Area of observed recreationa
Non-motorized only 547 2.7b
Motorized only 713 3.5b
Mixed non-motorized andmotorized use
141 0.7b
Mixed-use area, 10 m Buffer 415 2.1b
Points intersecting mixed-use area
Non-motorized points 67,984 14.8c
Motorized points 380,593 49.1c
Points intersecting 10 m buffer of mixed-use area
Non-motorized points 83,382 18.2d
Motorized points 624,738 80.6d
a Area calculated by summing all 10 m2 cells containing at least 1 GPSpointb The percent of land area of the total land area of the VPWRA(20,240 ha)c The percent of total points located inside the mixed-use aread The percent of total points located inside the 10 m buffer of themixed-use area
Table 6 Differences inrecreation conflict reported bynon-motorized recreationistsbased on whether or not therespondent traveled through amixed-use area
Variable Type of conflict Mixed-use area visitors χ²a p Cramer's V
No (%) Yes (%)
Riding out of control n= 32 n= 137 3.715 .156 .125
No conflict 41 49
Interpersonal 0 4
Social values 59 46
Being rude or discourteous n= 31 n= 135 11.588 .003* .261
No conflict 42 51
Interpersonal 6 25
Social values 52 24
Passing too closely n= 30 n= 138 9.166 .010* .231
No Conflict 43 43
Interpersonal 13 36
Social values 43 21
Not yielding right of way n= 31 n= 132 7.822 .020* .210
No conflict 48 51
Interpersonal 7 24
Social values 45 25
Disturbing wildlife n= 34 n= 135 1.137 .566 .080
No conflict 35 36
Interpersonal 12 19
Social values 53 45
* Significant to p< 0.05a Likelihood ratio
Environmental Management

Fig. 5 Cells with both non-motorized and motorized recreation, most of which are located along established groomed travel routes and are lessabundant as distance away from established routes increases
Environmental Management

recreation experience, increasing the opportunity for inter-personal conflict.
Furthermore, despite separating non-motorized andmotorized recreationists, there are areas where zones aresmall enough that non-motorized recreationists are likely tostill hear and perhaps see motorized recreationists. Forexample, on the top of Vail Pass, the primary recreationportal adjacent to Interstate 70, recreationists used estab-lished routes that were in close proximity to one another, onparallel travel corridors (Figs. 6 and 7). Parallel corridorsare designed to separate non-motorized and motorized use,while still providing both groups access to points of interest.However, if the corridors are too close together, they maynot provide enough segregation to effectively limit inter-personal conflict. It is likely that parallel corridors weremore effective at limiting interpersonal conflict thanmultiple-use routes, but ample space, with a considerationfor topography and sound pollution, is necessary betweenthe routes.
An effective zoning system also requires an effectiveactive management system. Because there is a high densityof use in a small proportion of the entire recreation area,PPA managers should focus their active management effortsin these mixed-use areas where messaging and publiccontacts are likely to reach the greatest number of visitors.However, this analysis revealed a more dispersed move-ment pattern for non-motorized recreationists, comparedwith motorized recreationists. Messaging and educationefforts aimed at non-motorized recreationists will requireefforts beyond the mixed-use areas. Since backcountry hutvisits account for nearly a third of all visits to the VPWRAand are most frequented by non-motorized recreationists,they may be an important place for PPA managers to focustheir active management program.
The survey analysis revealed lower interpersonal conflictamong those non-motorized recreationists who traveledthrough terrain without mixed-use. However, a smallamount lingers with these non-motorized respondents. Onepossible explanation is the effect of access portals, andspecifically parking areas, which are mixed-use, small ingeographic size, and have high numbers of recreationists atpeak times. A backcountry skier’s itinerary may be in anarea closed to motorized use, but the time spent getting froma parking spot to entering the backcountry may be enoughto see, hear and smell snowmobiles and may thereforecreate interpersonal conflict.
Survey respondents also reported higher levels of socialvalues conflict when traveling in areas of no mixed-use.One possible explanation for this could be that theserecreationists chose to travel in area without motorized useprecisely to avoid contact with motorized users. They mayhold negative attitudes towards the use of snowmobiles andavoid being in mixed-use areas when feasible. Managers of
PPAs should consider how they might be able to reach theserecreationists who are generally traveling in areas of low(mixed and non-mixed) use and who may require messa-ging targeted to the negative attitudes towards motorizeduse.
Management Recommendations
Providing recreation opportunities to both non-motorizedand motorized groups with more effective spatial zoning islikely to further erode persistent interpersonal conflictamong non-motorized recreationists. Two managementsuggestions are evident from the analysis. First, PPAmanagers should consider the logistical feasibility of pro-viding separate non-motorized and motorized access por-tals. At the Vail Pass portal, non-motorized and motorizedusers park in separate lots, however, access to establishedroutes and the backcountry at large, require travel in mixed-use areas, even if for short distances. An established non-motorized route exists from the Vail Pass portal to thepopular Shrine Pass. In 2014, rangers at the VPWRAallowed non-motorized use on the groomed motorized routeto Shrine Pass, reversing previous management practices.This analysis suggested separation of use in cases such asShrine Pass will limit interpersonal conflict and wouldenhance the recreation experience. If PPA managers couldprovide more direct access from parking areas to zonedterrain for both recreation groups, reducing the time arecreationist spends in a mixed-use area, zoning is morelikely to be effective at limiting interpersonal conflict.
PPA managers could also consider alternative methodsfor zoning in these high-use areas. For example, temporalzoning, which limits use in certain areas on certain days andhas been implemented by the National Park Service(Manning and Anderson 2012), may segregate use moreeffectively, while still providing equal access to bothgroups. Or additional grooming for non-motorized users(perhaps with a small snowmobile attachment rather thanthe full-size groomer used on main route network) couldprovide a greater incentive for non-motorized users to traveloff the routes open to motorized use. There are additionaladministrative costs to this kind of active management andthe costs would need to be weighed against the potentialdecreases in interpersonal conflict.
Second, PPA managers should consider how educationcampaigns could more effectively reach those non-motorized recreationists reporting social values conflict.Separation alone is not sufficient to address underlyingattitudes and norms around snowmobile use in backcountryterrain. Targeted messaging to non-motorized recreationistsaround modern advances in snowmobile noise and pollutioncontrol may be one way to address the attitudes and norms.More research is needed on what kind of education and
Environmental Management

Fig. 6 Density of GPS points per cell ranging from very low to extreme for non-motorized recreation near the Vail Pass portal, the primary accesspoint to the VPWRA. Zoning designations are also depicted
Environmental Management
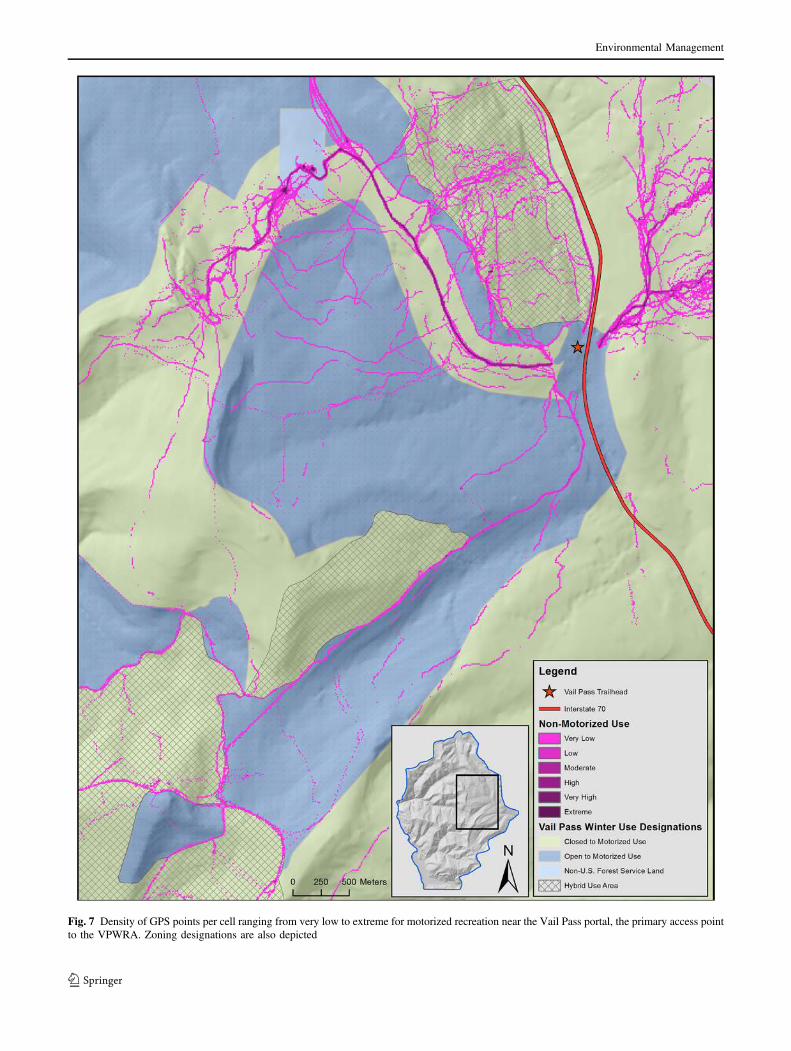
Fig. 7 Density of GPS points per cell ranging from very low to extreme for motorized recreation near the Vail Pass portal, the primary access pointto the VPWRA. Zoning designations are also depicted
Environmental Management

messaging is most effective in reaching these recreationists.Managers could set lower sound and emission limits as theNational Park Service has done in Yellowstone NationalPark (National Park Service 2013) or encourage or requirethe use of a four-stroke engine to reduce pollution. Howeverthis could face strong resistance by members of the snow-mobile community and managers may decide the cost is notworth bearing to further decrease recreation conflict.Finally, as detailed in Miller and Vaske (2016), for areaswith contentious and volatile recreation conflict—as was thecase in the VPWRA in the 1990s--the collaborative processfostered by local stakeholders and PPA managers to designa zoning system with equitable access to terrain for bothnon-motorized and motorized recreationists is an essentialfirst step to reduce conflict. However, designing a zoningsystem should include consideration for small areas ofpotential spatial overlap between groups, especially nearaccess portals and along route networks.
Conclusions
Our results demonstrated the complex relationship betweenrecreation zoning and decreasing recreation conflict.Recreation Managers must decide how best to design andimplement recreation zoning based on historical use pat-terns for the area, topographic features and considerations(such as access portals and parallel corridors), equitableaccess to favorable terrain for each group, and practicalmanagerial considerations (e.g. maintenance of signs alongzoning boundaries). This analysis has shown that zoningdoes decrease interpersonal conflict among non-motorizedrecreationists, however, despite a zoning management sys-tem, recreationists at the VPWRA are likely to still shareterrain, which permits interpersonal conflict to persist.
PPA managers should design a zoning system that limitsspatial overlap between non-motorized and motorizedrecreationists as much as is feasible, including around theaccess portals, and may consider alternative or additionaltools such as temporal zoning depending on the intract-ability of the conflict. The VPWRA zoning and activemanagement model for a busy winter recreation area iseffective at reducing interpersonal conflict, however, zoningadjustments are needed to extinguish the conflict. Themodel is less effective at limiting social values conflictamong non-motorized recreationists. Active managementshould be adjusted to specifically target the attitudes andnorms of non-motorized recreationists, especially thosetraveling in low-use areas with no motorized use.
Acknowledgments We thank the US Department of Agriculture, USForest Service, WRNF for providing primary funding to evaluatewinter recreation. Additional funding and support was provided by the
Rocky Mountain Research Station, Vail Associates Inc., ColoradoBLM state office, USFS R2 Regional Office Renewable ResourcesDepartment, 10th Mountain Huts, and Colorado Department ofTransportation. The Department of Human Dimensions of NaturalResources at Colorado State University provided support for theadministration of the survey for the article. Spatial movement data forthis and related studies were collected as a collaboration between theUS Forest Service, Rocky Mountain Research Station, University ofMontana, and other project cooperators. We acknowledge the fieldtechnicians who distributed GPS units to recreationists and who alsosurveyed people’s opinions. We also thank the two anonymousreviewers who provided valuable comments.
Compliance with Ethical Standards
Conflict of interest The authors declare that they have no com-peting interests.
References
Adelman BJ, Heberlein TA, Bonnicksen TM (1982) Social psycho-logical explanations for the persistence of a conflict betweenpaddling canoeists and motorcraft users in the boundary watersCanoe area. Leis Sci 5:45–61
Blahna JD, Smith SK, Anderson AJ (1995) Backcountry llamapacking: Visitor perceptions of acceptability and conflict. Leis Sci17:185–204
Bowker JM, Askew AE, Cordell HK, Betz CJ, Zarnoch SJ, Seymour L(2012) Outdoor recreation participation in the United States—Projections to 2060: a technical document supporting the forestservice 2010 RPA assessment: 2010 renewable resources plan-ning act assessment. US Department of Agriculture, Forest Ser-vice, Southern Research Station, Ashville, NC
Carothers P, Vaske JJ, Donnelly MP (2001) Social values versusinterpersonal conflict among hikers and mountain bikers. Leis Sci23:47–61
Clark RN and Stankey GH (1979) The Recreation OpportunitySpectrum: A Framework for Planning, Management, andResearch. US Department of Agriculture Forest Service. PacificNorthwest Forest and Range Experiment Station, General Tech-nical Report PNW-98
Cole DN (2004) Carrying capacity and visitor management: Facts,values, and the role of science. In: Harmon D, Kilgore BM,Vietzke GE (eds) Protecting our diverse heritage: the role ofparks, protected areas, and cultural sites. George Wright Society,Hanckock, MI, p 43–46
Cole DN, Daniel TC (2003) The science of visitor management inparks and protected areas: From verbal reports to simulationmodels. J Nat Conserv 11:269–277
Cordell HK, Betz CJ, Green GT (2008) Nature-based outdoorrecreation trends and wilderness. Int J Wilderness 14(2):7–13
D’Antonio A, Monz C, Lawson S, Newman P, Pettebone D, Courte-manch A (2010) GPS-based measurement of backcountry visitorsin parks and protected areas: Examples of methods and applica-tions from three case studies. J Park Recreat Admin 38(3):42–60
Gibbons S, Ruddell EJ (1995) The effect of goal orientation and placedependence on select goal interferences among winter back-country users. Leis Sci 17:171–183
Graefe AE, Thapa B (2004) Conflict in natural resource recreation. In:Manfredo MJ, Vaske JJ, Bruyere BL, Field DR, Brown PJ (eds)Society and natural resources: a summary of knowledge. ModernLitho, Jefferson, MO, p 209–224
Environmental Management

Hallo JC, Beeco JA, Goetcheus C, McGee J, McGehee NG, NormanWC (2012) GPS as a method for assessing spatial and temporaluse distributions of nature-based tourists. J Travel Res 51:591–606
Hammitt WE, Cole DN (1998) Wildland recreation: ecology andmanagement (2nd ed.). Wiley, New York
Jackson EL, Wong R (1982) Perceived conflict between urban cross-country skiers and snowmobilers in Alberta. J Leis Res 14:47–62
Jacob GR (1977) Conflict in outdoor recreation: The search forunderstanding. Utah Tour Recreat Rev 6(4):1–5
Jacob GR, Schreyer R (1980) Conflict in outdoor recreation: A theo-retical perspective. J Leis Res 12:368–380
Jensen CR, Guthrie SP (2006) Outdoor recreation in America (6th ed.).Human Kinetics, Champaign, IL
Lai PC, Li CL, Chan KW, Kwong KH (2007) An assessment of GPSand GIS in recreational tracking. J Park Recreat Admin 25:128–139
Liddle MJ (1997) Recreation ecology: the ecological impact of out-door recreation and ecotourism. Chapman and Hall, London
Lindberg K, Fredman P, Heldt T (2009) Facilitating integratedrecreation management: Assessing conflict reduction benefits in acommon metric. For Sci 55:201–209
Leung Y, Marion JL (1999) Spatial strategies for managing visitorimpacts in national parks. J Park Recreat Admin 17(4):20–38
Lucas RC (1964) The recreational capacity of the Quetico-Superior area.USDA Lake States Forest and Experiment Station, St. Paul, MN
Knopp TB, Tyger JD (1973) A study of conflict in recreational landuse: Snowmobiling versus ski touring. J Leis Res 5:6–17
Kuss FR, Graefe AR, Vaske JJ (1990) Visitor impact management: areview of research. National Parks and Conservation Association,Washington, DC
Manning RE (2011) Studies in outdoor recreation: search and researchfor satisfaction (3rd edn.). Oregon State University Press, Cor-vallis, OR
Manning RE, Anderson LE (2012) Managing outdoor recreation: casestudies in the national parks. CAB International, Wallingford,Oxfordshire
Marion JL, Roggenbuck J, Manning RE (1993) Problems and prac-tices in backcountry recreation management: a survey of NationalPark Service managers. Natural Resources Report NPS/NRVT/NRR-93/12
Miller AM, Vaske JJ (2016) Winter recreationist conflict and man-agement approaches at Vail Pass, Colorado. J Parks RecreatAdmin 34(2):1–11
Monz CA, Cole DN, Leung YF, Marion JL (2010) Sustaining visitoruse in protected areas: Future opportunities in recreation ecology
research based on the USA experience. Environ Manage45:551–562
National Park Service (1997) VERP: the visitor experience andresource protection (VERP) framework, a handbook for plannersand managers. USDI, National Park Service, Denver ServiceCenter, Denver, CO
National Park Service (2013) Special regulations; Areas of the nationalpark system; Yellowstone national park; Winter Use. 36 SFR part7. Fed Regist 78(205):630968–663093
Rudell EJ, Gramann JH (1994) Goal orientation, norms, and noise-induced conflict among recreation area users. Leis Sci 16:93–104
Rupf R, Wyttenbach M, Köchli D, Hediger M, Lauber S, Ochsner P,Graf R (2011) Assessing the spatio-temporal pattern of wintersports activities to minimize disturbance in capercaillie habitats. JProt Mt Areas Res 3(2):23–32
Schneider IE (2000) Revisiting and revising recreation conflictresearch. J Leis Res 32:129–132
Shelby B, Heberlein TA (1986) Social carrying capacity in recreationsettings. Oregon State University Press, Corvallis, OR
Shoval N, Isaacson M (2006) Application of tracking technologies tothe study of pedestrian spatial behavior. Prof Geogr 58(2):172–183
Stankey GH, Cole DN, Lucas RC, Peterson ME, Frissell SS (1985)The limits of acceptable change (LAC) system for wildernessplanning. USDA forest service general technical report INT-176.Intermountain Forest and Range Experiment Station, Odgen,Utah
USDA Forest Service (2015) White River National Forest OfficialWebpage on Vail Pass Winter Recreation Area. http://www.fs.usda.gov/recarea/whiteriver/recreation/recarea/?recid=41445&actid=92. Accessed 30 July 2015
Vaske JJ, Donnelly MP, Wittman K, Laidlaw S (1995) Interpersonalversus social value conflict. Leis Sci 17:205–222
Vaske JJ, Needham MD, Cline RC (2007) Clarifying interpersonal andsocial values conflict among recreationists. J Leis Res39:182–195
Vittersø J, Chipeniuk R, Skar M, Vistad OI (2004) Recreationalconflict is affective: Case study of cross country skiers andsnowmobiles. Leis Sci 26:227–243
Wagar JA (1964) The carrying capacity of wild lands for recreation.For Sci 10(Supplement 7):a0001–a0001
Wing MG, Eklund A, Kellogg LD (2005) Consumer-grade globalpositioning system (GPS) accuracy and reliability. J For 103(4):169–173
Environmental Management