Does WTO improve market access? May be, but with maturity
33
Does WTO improve market access? May be, but with maturity Pradyut Kumar Pyne * and Saikat Sinha Roy ** Abstract: The disagreement among the international trade economists on the impact of WTO on world trade growth has remained an important issue since the formation of the institution. The finding of insignificant effect of WTO in promoting world trade by Rose (2004a) has been challenged by a number of studies like, among others, Subramanian and Wei (2007), Tomz et al. (2007), and Helpman et al. (2008). This study investigates whether WTO promotes trade growth in an extended gravity model framework using a dataset comprising of 200 exporter and 234 importer countries. Along with extended gravity variables, the study uses trade facilitating infrastructure, and tariff and non- tariff barriers as explanatory variables for estimating trade performance. The results show that the sole effect of WTO membership is crucial in enhancing market access along with regional trade agreements and preferential trade arrangements. The impact of WTO membership increases with the maturity of the institution, but varies across country groups. JEL Classification: F13, F14, F15 Keywords: World Trade Organization, Regional Trade Agreements, Preferential Trading Arrangements, Export growth, Augmented Gravity Model estimation _________________________ * Economic Officer, Department of Economic Affairs, Ministry of Finance, New Delhi – 110001, Email: [email protected], [email protected]. ** Professor & Coordinator, UGC Centre for Advanced Studies, Department of Economics, Jadavpur University, Kolkata – 700032, E-mail: [email protected], [email protected] The paper is accepted for presentation at the 20 th European Trade Study Group (ETSG) 2018 Conference held at the Warsaw School of Economics, Poland, during 13-15 September 2018. An earlier version of the paper was presented at the International Conference on “International Trade, Specialization and Growth – David Ricardo and Contemporary Perspectives” jointly organized by the Centre for Studies in Social Sciences, Kolkata and the Centre for Advanced Studies, Department of Economics, Jadavpur University during 28-29 December 2017, in a seminar at the Department of Humanities and Social Sciences, Indian Institute of Technology Bombay on 26 June 2018 and at the Centre for Development Studies, Trivandrum on 05 July 2018. The authors gratefully acknowledge the various comments received at the internal seminars of the Department of Economic Affairs, Ministry of Finance, Government of India, and the Department of Economics, Jadavpur University, Kolkata. We thankfully acknowledge constructive comments from Professors Arvind Subramanian, Sarmila Banerjee, Rupa Chanda, Sugata Marjit, Sajal Lahiri, Rajat Acharyya, Devashish Mitra, Saibal Kar, Sunil Mani, Sunandan Ghosh, Pushpa Trivedi, K. Narayanan, Partha Ray on an earlier draft of the paper. However, errors, if any, are authors‟ own.
Transcript of Does WTO improve market access? May be, but with maturity

Does WTO improve market access? May be, but with maturity
Pradyut Kumar Pyne * and Saikat Sinha Roy **
Abstract: The disagreement among the international trade economists on the impact of WTO on world trade growth
has remained an important issue since the formation of the institution. The finding of insignificant effect of WTO in
promoting world trade by Rose (2004a) has been challenged by a number of studies like, among others, Subramanian
and Wei (2007), Tomz et al. (2007), and Helpman et al. (2008). This study investigates whether WTO promotes
trade growth in an extended gravity model framework using a dataset comprising of 200 exporter and 234 importer
countries. Along with extended gravity variables, the study uses trade facilitating infrastructure, and tariff and non-
tariff barriers as explanatory variables for estimating trade performance. The results show that the sole effect of WTO
membership is crucial in enhancing market access along with regional trade agreements and preferential trade
arrangements. The impact of WTO membership increases with the maturity of the institution, but varies across country
groups.
JEL Classification: F13, F14, F15
Keywords: World Trade Organization, Regional Trade Agreements, Preferential Trading
Arrangements, Export growth, Augmented Gravity Model estimation
_________________________
* Economic Officer, Department of Economic Affairs, Ministry of Finance, New Delhi – 110001, Email: [email protected], [email protected]. ** Professor & Coordinator, UGC Centre for Advanced Studies, Department of Economics, Jadavpur University, Kolkata – 700032, E-mail: [email protected], [email protected]
The paper is accepted for presentation at the 20th European Trade Study Group (ETSG) 2018 Conference held at
the Warsaw School of Economics, Poland, during 13-15 September 2018. An earlier version of the paper was
presented at the International Conference on “International Trade, Specialization and Growth – David Ricardo
and Contemporary Perspectives” jointly organized by the Centre for Studies in Social Sciences, Kolkata and the
Centre for Advanced Studies, Department of Economics, Jadavpur University during 28-29 December 2017, in a
seminar at the Department of Humanities and Social Sciences, Indian Institute of Technology Bombay on 26 June
2018 and at the Centre for Development Studies, Trivandrum on 05 July 2018. The authors gratefully acknowledge
the various comments received at the internal seminars of the Department of Economic Affairs, Ministry of
Finance, Government of India, and the Department of Economics, Jadavpur University, Kolkata. We thankfully
acknowledge constructive comments from Professors Arvind Subramanian, Sarmila Banerjee, Rupa Chanda,
Sugata Marjit, Sajal Lahiri, Rajat Acharyya, Devashish Mitra, Saibal Kar, Sunil Mani, Sunandan Ghosh, Pushpa
Trivedi, K. Narayanan, Partha Ray on an earlier draft of the paper. However, errors, if any, are authors‟ own.

2
Does WTO improve market access? Maybe, but with maturity
1. Introduction
This paper empirically investigates whether World Trade Organization (WTO) aid growth in
multilateral trade through improvement in market access. WTO as an institution formed during the
Uruguay Round of multilateral trade negotiation aims at market access through free and fair
multilateral trade. Implementation of non-discriminatory trade policy measures using Most Favoured
Nation (MFN) clause, reciprocity principle and national treatment are the key principles that
promote multilateral trade under WTO. While market access was aimed at through removal or
reduction in trade barriers, including tariff and non-tariff measures, a country can protect its interest
sector through the provision of safeguards in WTO. Dispute settlement procedure of WTO acts to
monitor issues related to violation of agreements relating to facilitating and maintaining multilateral
relations. The benefit that was expected to accrue globally as a result of liberalization of trade in
goods ranging from a low of US$ 109 billion to a high of US$ 510 billion in world income by 20051.
According to World Economic Outlook (WEO) database, average annual growth of global exports
of goods and services of 6.1 per cent during 1985-1994 increased to 7.2 per cent during 1995-2007.
Despite a downturn since 2008, world exports registered a positive average growth afterwards.
Regional trade agreements (RTAs) and preferential trade arrangements (PTAs)2, contrary to the
WTO MFN clause, have proliferated along with the expansion of WTO membership in the last two
decades. These trade arrangements also have contributed to the increase in global trade. World
Trade Report 2011 shows that the number of such trade agreements increased from 70 in 1990 to
around 300 in 2010. Lee et al. (2008) find that RTAs increase global trade by raising intra-bloc trade
without hampering extra-bloc trade. The study also argues non-member countries generally create a
separate RTA rather than joining the existing ones, thereby increasing the number of such trading
blocs. According to a recent declaration by WTO, all WTO member nations now have at least one
RTA in force, which implies that trade by large number of WTO members is between preferential
groups.3 With the proliferation of such preferential trade arrangements and regional trading
1 The estimate is based on the report prepared by GATT Secretariat on the results of the Uruguay Round of Multilateral Trade negotiations. 2 In general, preferential trading arrangements, synonymous as RTAs, include various arrangements with different depth and breadth such free trade areas, customs union, common market and economic union. In the context of WTO, PTAs mean non-reciprocal preferential schemes as distinct from RTAs. The two are thus treated separately in this study. 3 Estevadeordal et al. (2008) find no negative effect of preferential agreement on external trade liberalization. Limao (2016) shows the proliferation of such agreements after the formation of WTO and the share of trade between RTA (including PTA) members in world trade almost tripled between 1965 and 2010. Falvey and Foster-McGregor (2017), however, provide nuanced results.

3
arrangements, there is disagreement among economists on the role of WTO as a multilateral
institution in explaining overall trade benefits and distribution of such gains among different groups
of countries4. This is the core of the existing debates on the role of WTO. In examining the role of
WTO on trade growth, the impact of all such possible factors needs to be segregated.
The main objective of this study is thus to find out the impact of WTO market access negotiations
on multilateral trade flows across countries. Even though there is a history of multilateral trade
negotiations under GATT and the benefits emanating thereof during the period since 1944, this
study focuses on the gains from multilateral trade in the post-WTO period only. The gains are
observed only with regards to merchandise trade, market access relating to services trade achieved
through General Agreement on Trade in Services (GATS) under WTO is outside the scope of this
study5. The issues that are not yet been taken into account in the literature is the role of
infrastructure in bilateral trade flows6 along with the role of non-tariff barriers in export promotion.
This is done while controlling for all these possible important determinants of multilateral trade in
an extended gravity model framework. In doing so, the following section provides with the existing
literature followed by a snapshot view on growth in world trade in section 3. Section 4 briefs on the
gravity model and its extensions. In section 5, methodological issues are described along with a brief
illustration on data coverage and sources across countries. Estimation results are illustrated in
section 6. The paper concludes with summary of major findings in section 7.
2. Is WTO membership a factor? What the literature says…
There is an emerging literature on the impact of multilateral trade agreements on trade promotion
across countries. The debate on the impact of WTO on world trade growth started with the findings
of Rose (2004a) and the counter findings by Subramanian and Wei (2007). Rose (2004a) finds that
only extension of Generalised Scheme of preferences (GSP) offered by the importers to selected
exporters are effective in trade growth while GATT/WTO membership is not. In contrast,
Subramanian and Wei (2007) provide evidence of positive but uneven impact of GATT/WTO
membership across countries and sectors. The debate continues with nuanced findings based on
newer theoretical perspectives, advanced econometric methods and larger database. Apart from the
4 The review of literature that follows discusses in detail the debate on the benefits in terms of trade and welfare following multilateral trade negotiation under WTO. 5 An exhaustive and in-depth discussion on WTO and services trade is available in Mattoo et al. (2008). 6 Portugal-Perez and Wilson (2012) show the impact of trade facilitating infrastructure, hard and soft, on export performance across countries.

4
above mentioned studies, the impact of multilateral trade agreements on trade promotion is
examined in various earlier studies including Rose (2004 b, c), Glick and Rose (2001), Greenaway
and Milner (2002), Carrere (2006), Subramanian and Wei (2007), Coe et al (2007), Baier and
Bergstrand (2007), Helpman et al. (2008), Jayasinghe and Sarkar (2008), Kepaptsoglou et al. (2010),
Egger et al. (2011), Martin et al. (2012), Dutt et al. (2013), among others.
Rose (2004a) shows that GATT/WTO membership does not have any substantial impact on trade
and only extension of Generalised Scheme of Preferences (GSP) from one country to another is
founded to have large positive impact. In another study, Rose (2004b) finds that members are often
less open than non-members with regards to tariff and NTBs and concludes that there is no clear
evidence that GATT/WTO accession or membership led to trade liberalisation. Further, Rose
(2004c), using pooled OLS regression model, finds that WTO/GATT membership increases trade
volatility. Contradicting these views, Subramanian and Wei (2007) provide evidence of positive but
asymmetric impact of GATT/WTO on trade across countries and sectors. The study argues that
successive rounds of tariff liberalization under the aegis of GATT/WTO have served to increase
industrial countries imports.
Considering the presence of such large non-member countries along with the non-member observer
nation of WTO, Tomz et al. (2007) argue that the results in Rose (2004a) are largely on account of
mistaken country classification as WTO member and outsider. Considering non-member
participation, the study finds that GATT substantially increases the trade of both formal member
and observer countries, relative to countries outside the agreement. In support of his earlier findings,
Rose (2007) further shows that GATT had no substantial effect on aggregate trade and the same is
true for both formal and observer countries.
Helpman et al. (2008), however, argue that the commonly used gravity framework provides
inappropriate results on account of biased sample selection with non-consideration of bilateral trade
with zero trade value. The study, using a generalized gravity model framework and data on positive
as well as zero trade flows between countries shows that there is positive and very strong significant
effect of GATT/WTO membership on bilateral trade flows, applying exporter and importer specific
fixed effects. This study generalizes the Anderson and van-Wincoop (2003) gravity framework in an
international trade model by introducing firm heterogeneity, fixed trade cost and asymmetries in
export flows in a bilateral pair, to control for potential biases. Belenkiy (2008) checks for robustness
of results drawn by Helpman et al. (2008), the extensive margin correction is found to be significant

5
in estimating the bilateral trade flows between country pairs, by splitting the world into developed
North and developing South. Using the same model of Helpman et al. (2008) for estimating the
relative importance of the extensive margin to non-random export selection and the study finds that
extensive margin is significant but with lower magnitude as compared to the magnitude of the non-
random selection.
To re-examine the effect of GATT/WTO membership and overcome the risk of misspecification in
parametric gravity methodology, Chang and Lee (2011) apply non-parametric method and find large
and significant trade promoting effect of GATT/WTO, especially in case if both the exporter and
importer are members of WTO compared to the case when one of the two trade partners is a WTO
member. Eicher and Henn (2011) measure the WTO effect on trade flows7 by considering three
types of omitted variable biases, namely multilateral resistance, unobserved bilateral heterogeneity,
and individual PTA trade effects, on trade flows. The study finds that PTAs create trade strongly,
but unevenly across individual agreements. Countries with greater incentives to bargain for tariff
reductions during WTO accession negotiations exhibit positive and significant WTO trade effects.
The trade effect of GATT/WTO is also examined in many studies by decomposing into extensive
and intensive margins. Besedes and Prusa (2011) investigate and compare countries‟ export growth
based on their performance at the extensive and intensive export margins. The study finds that
majority of the growth of trade is on account of intensive margin rather than extensive margin.
However, Dutt et al. (2013) show that WTO membership has impacted on extensive margin of trade
positively while it adversely affects intensive margin that in turn implies the significant role of WTO
in the reduction of fixed cost rather than variable cost of trade. The study thus suggests that WTO
as an institution resolves uncertainties in the export market and promotes overall exports through
diversification of export basket and market. Several trade restrictions and fixed costs constrain a
firm‟s entry into a foreign market. In this context, Buono and Lalanne (2012), using export data on
French firms for 57 sectors to 147 destinations for the period of 1993-2002, find that the decrease in
tariff in the Uruguay Round did not induce more firms into exporting, while it increased the
shipments of incumbent exporters.
Provisions of preferential trading arrangements, formation of regional trading blocs, and currency
unions can also play a critical role in trade promotion (Limao (2016), Falvey and Foster-McGregor
(2017)), and these factors need to be controlled for while arriving at the impact of multilateral trade
7 This is done by putting together studies by Rose (2004a), Tomz et al. (2007), and Subramanian and Wei (2007).

6
negotiations on growth of trade across countries. In an attempt to examine the relative importance
of regional/preferential trade agreements and WTO-membership, Limao (2016) finds that the trade
effect of WTO is larger and significant only for old members. Heterogeneity in the tariff
liberalization among the new trade members can be a reason for not having significant effect of
WTO on multilateral trade. Tarasov (2012) examines certain newer dimensions with regards to trade
costs and multilateral trade and finds that poorer countries not only trade less but maintain trade
relation with less number of partners. The study also argues that trade costs play an important role
in explaining zero trade flow and the correlation between per capita income and trade volume. The
study finds that there is strong negative correlation between fixed costs of trade and the level of
development of exporter-importer countries.
It is thus evident from the review of existing literature that the debate on the impact of multilateral
trade negotiations under the aegis of GATT/WTO on trade is far from resolved. The debate on the
impact of WTO centres around on nuanced results arrived at with advances in methodology, use of
varied models and database. Further, the trade cost factor has not been given an explicit treatment in
the literature on multilateral trade flows. This calls for further empirical investigation of the role of
WTO on market access in merchandise trade controlling for all possible factors using a larger time
comparable dataset and accounting for the methodological biases, and thus adding to the existing
literature.
3. WTO in Global Trade
Increase in market access multilaterally is the primary objective of WTO. The major features
underlying WTO‟s market access principles are (i) maintaining reciprocity in tariff reduction, (ii)
tariff bindings, (iii) enforcement of non-discrimination principles through national treatment and
most favoured nation treatment, (iv) strong dispute settlement procedure, etc.. The effort to
dismantle trade restrictions to promote international trade in merchandise started since the
formation of GATT in 1947, but that was mainly confined to industrial goods and limited to a small
set of mostly developed countries. The formation of WTO in January 1995 replaced GATT as
multilateral trade agency, which is expected to ensure multilateral trade among all member countries
covering agriculture, textiles, and services trade along with non-agriculture (industries). WTO, since
its inception, aims to ensure abolition or systematic reduction of trade restrictions and to implement
efficient trade arrangements across all groups of countries. Till 2010, increasing number of countries
became WTO members. The number of WTO member nations increased to 164 along with 20

7
additional observer nations in July 2016 (see Figure 1). This indicates that in the global economy
there are forces that influence WTO non-members to become a member.
Figure 1: Countries with formal membership of WTO, RTAs and PTAs
Through a series of negotiations WTO member countries have promised themselves to reduce trade
barriers and make reciprocal concessions. Using data from WTO-integrated database, Table 1
presents MFN and effective applied rates of tariff across different country groups during the post-
WTO phase. This description on tariff rates is however limited to broad sectors despite data
availability at the disaggregated level.
WTO founder nations are only considered here for comparison over time and, in that sense, the
comparison has limitations. The detailed list of countries considered for each group is presented in
Appendix 1. It is evident that developed countries lowered its average MFN import tariff rate for
industrial imports by around 50 per cent while the corresponding decline in tariff rates on
agricultural imports in developed countries is lower during 1996 to 2016. Developing country
members of WTO have also reduced their MFN import tariff on industrial imports at a higher rate
than on agricultural commodities. It can also be observed from Table 1 that the depth of the cut for
developing countries is higher than that for developed countries8. In the process of negotiations,
developing countries have generally argued for higher cut in tariffs on agricultural and industrial
products of developing country export interests in developed country markets for greater market
8 Martin and Ng (2004) have shown substantial reduction in tariff for developing countries. Even though a larger part of this reduction is unilateral, a significant part is consequent upon Uruguay Round of multilateral trade negotiations.
25
35
45
55
65
75
85
95
90
110
130
150
170
190
No. of formal WTO member
No. of countries engaged in atleast one RTA
No of countries enjoys PTA from atleast one trade partner (RHS)

8
access. The reduction in tariff is the lowest for LDC member countries. Similar to MFN rates,
effective applied rates are reduced across country groups. Overall, through reduction in tariff
restrictions the developed and developing countries have provided significant market access in
agriculture and non-agriculture to their respective trade partners.
Table 1: MFN and effective applied tariff rates across different country groups
Row Labels MFN applied rate (%) Effective applied rate (%)
1996 2005 2016 1996 2005 2016
WTO Developed members 10.0 6.3 7.2
9.0 5.5 5.4
Agricultural 14.3 9.3 11.6
11.7 7.5 8.4
Industrial 5.7 3.4 2.8
6.3 3.6 2.3
WTO Developing members 15.5 11.7 10.4
16.3 11.8 9.6
Agricultural 17.8 14.2 12.8
18.5 13.8 11.6
Industrial 13.1 9.2 8.0
14.0 9.7 7.6
WTO LDC members 16.3 15.0 13.6
16.0 15.6 12.2
Agricultural 18.2 16.4 16.0
16.8 16.9 14.3
Industrial 14.4 13.7 11.2
15.1 14.2 10.2
Data source: WTO Integrated database (WITS).
Growth of world trade in goods and services, based on International Monetary Fund‟s (IMF‟s)
World Economic Outlook (WEO) database, for the period since 1980 is presented in Figure 2.
World trade growth averaged at 5.6 per cent during 1980-2010 despite wide fluctuations, as is
evident in the figure. The annual average growth of volume of exports of goods and services
increased from 5.0 per cent during 1980-1994 to 8.0 per cent during 1995-2000. After registering a
strong growth in the first half of 2000s, both world trade and export growth lowered since 2007.
The sharpest fall in growth of global trade occurred following the global financial crisis in 2009 only
to revive in 2010. Despite the sharp downturn in 2009, average growth of global trade remained
high during the post-WTO period. Global exports of goods and services during pre- and post-WTO
phases registered an average growth rate of 5.1 per cent and 6.3 per cent (not considering the year
2009) respectively, while the corresponding average annual growth rates of merchandise exports are
5.0 per cent and 7.0 per cent respectively. It is noteworthy that the financial crisis in late 2000s did
not lead to a prolonged decline in the growth of international trade.

9
Figure 2: Growth (in per cent) of world trade in goods and services
China and India, two major Asian developing economies, recorded a double digit growth of around
15 per cent in volume of exports of goods and services during 2001-2010. Other developing
countries like Brazil, Turkey, South Korea, Indonesia, and Thailand also witnessed strong growth in
exports during the post-WTO phase. Enhanced participation of developing and least developed
countries doubled their share in global trade during the last two decades (Bhagwati et al. 2016) and
the groups have emerged as new interest groups in multilateral trade negotiations. Continuation of
„Special and Differential‟ (S&D) treatment of GATT during post-WTO phase to overcome low
income and price elasticity of developing country exports, which are mostly primary products, has
motivated such countries for active participation in WTO. To improve market access for LDCs,
other WTO member countries have recently agreed to reduce trade barriers on exports from LDCs.
The LDCs have also benefitted from preferential market access arrangements. Developed and
developing countries along with LDCs have increasingly participated in RTAs, which have possibly
led to expansion of merchandise trade in these countries.9
However, growth of the volume of exports of goods and services of WTO member countries, based
on IMF World Economic Outlook database, increased from 5.6 per cent during 1981-1994 to 7.4
per cent during 1995-2008. For the non-member nations, the corresponding increase in the growth
of volume of exports is slightly lower at 1.5 percentage points. Hence, it is important to examine the
role of WTO as an institution in multilateral trade promotion.
9 Even though Martin and Ng (2004) argue that regional trading arrangements explain tariff liberalization across countries to a lesser extent, Limao (2016) and Falvey and Foster-McGregor (2017) show the large expansion of trade under regional/preferential trading arrangements.
-15
-10
-5
0
5
10
15
20
198
0
198
2
198
4
198
6
198
8
199
0
199
2
199
4
199
6
199
8
200
0
200
2
200
4
200
6
200
8
201
0
201
2
201
4
201
6
Exports of goods and services Exports of goods Average
Average export growth 5.0 %
Average export growth 7.0 % (excl. the year 2009)
10
4. Gravity Model in Trade Flow Estimation and its Extensions
Following the extensive use in applied international trade modelling, gravity model is being used in
this study to explain the factor underlying bilateral trade in a multilateral framework. Important
studies, including Linneman (1966), Bergstrand (1985, 1989), among others, use the gravity
framework essentially deriving the gravity equation from a general equilibrium framework. The
gravity framework of trade modelling estimate the size of trade volume based on various gravity
factors, while assuming fixity of relative prices.
The gravity model, in its basic form, assumes that economic mass and geographical distance among
trading nations are key to the bilateral trade flows (gravity model assume perfect international
product substitutability). Following Newton‟s law of gravitation, the basic form of gravity model is
ijjiij YYfX ,, , with 0
YX
and 0
X
(1)
where, ijX represents volume of trade flow (export or import or total trade volume) from country i
to j, Y is the gross domestic product, and represents trade cost between the countries.
Geographical distance between the countries can be assumed to be a proxy for trade costs with the
understanding that such costs increase with distance. The gravity framework, thus, shows that larger
country pairs are expected to trade more, while more distant country pairs trade less, perhaps on
account of higher transport cost. However, some studies [Brun et al. (2005), Coe et al. (2007)]
establish that distance as a factor determining bilateral trade has lost its importance as a proxy for
trade cost following globalisation. Nonetheless, Carrere and Schiff (2005) show increasing
importance of distance in determining trade flows. Further, the basic gravity model does not
consider the impact of reduction of trade costs following trade agreements that a country engages
into. Such agreements are found to significantly lower trade costs between two partner countries
while having no impact between non-member trade partners. Therefore, in the basic gravity model,
trade flows between a pair of countries are independent to the trade costs between a different pair of
countries who have formed an agreement, i.e.
0ik
ijX
(2)

11
Where i and k are members of a trade agreement but j is not. This condition, thus, ignores the
effects of trade creation and trade diversion.
Anderson and van Wincoop (2003) augment the basic gravity model by incorporating multilateral
resistance parameters (both external and internal). These resistance factors capture the dependence
of trade flows between two countries on trade costs in all possible ways. Common factors
considered in the literature for influencing trade costs are (i) geographical distance between the trade
partners, (ii) sharing of common land border, (iii) having common official language, (iv) past colonial
relationship between the trade partners, (v) the case of colonization by the same power, etc.. The
augmented gravity model considers the effect of changes in trade costs among a pair of bilateral
trade partners on trade flows of all other partners because of relative price changes.
In the empirical international trade literature, the gravity model has been in use in the context of
trade flows in regional trade agreements [Frankel (1997), De (2004), Baier and Bergstrand (2007),
Jayasinghe and Sarkar (2008), Kepaptsoglou et al. (2010), Egger et al. (2011), Eicher and Henn
(2011), Martin et al. (2012) etc.]; currency unions [Rose (2000), Glick and Rose (2002)]; and
multilateral trade [Rose (2004a), Subramanian and Wei (2007), Rose (2004c), Tomz et al. (2007),
Dutt, et. al. (2013)]. From a review of these studies it is evident that the gravity model, when
suitably adjusted, is appropriate in explaining variations in bilateral trade flows in a multilateral
framework.
5. Method of estimating export flows
5.1 Possible determinants of export flows
The literature on determining of trade flows, accounting for the impact of formation of WTO use
gravity model. The study adds to the literature accounting for infrastructure, tariff and non-tariff
restrictions along with the variables generally considered in the extended gravity model framework.
Further, to examine the effects of WTO and other policy variables, some mutually exclusive and
exhaustive dummies are taken into account to separate out the WTO membership effect. This
aspect follows Dutt et al. (2013). Apart from extended gravity variables like distance and GDP of the
trade partners, colonial history, linguistic similarities, contiguity etc. are used along with the country
specific fixed effects following the suggestion of Anderson and van Wincoop (2003). Following
Helpman et al. (2008), the study will also consider all possible bilateral pairs in the econometric
exercise.

12
It is established in the existing literature that infrastructure is critical for economic development and
open economies can provide better infrastructure than its closed counter parts (World Trade Report
(2004), De (2004), Chakravorty and Mazumdar (2008)). As an important determinant of transport
cost, infrastructure is considered to be directly related to firm productivity, diversification in
production and expansion in trade, increase in output and economic growth (Munnell (1992),
Easterly and Rebelo (1993), Limao and Venables (2001), De (2004, 2006)). However, the effective
rate of protection in international trade flow provided by transport cost, in many of the countries, is
considerably higher than that by tariff10 and it act as a hindrance to economic integration. The lack
of quality transport infrastructure creates obstacles to the supply chain of production and trading of
final goods as well11. For Asian countries, De (2004) finds the significant and important role of
transaction cost and infrastructure in explaining variation in trade flows in a gravity model
framework income, trade openness, trade duties, exchange rate volatility, and dummies on common
land border and free trade agreement as other determining variables. Chakravorty and Mazumdar
(2008) develop a model of trade in which provision of infrastructure makes the domestic firm more
productive and enable to capture market share from a foreign firm in both the domestic and export
markets. Infrastructure is a complementary factor to the trade policies of multilateral trade
expansion because gains from trade often depend on it and hence, included in the model.
5.2 Estimation model
In order to analyse the impact of formulation of WTO on export flows, following Rose (2004 a),
Subramanian and Wei (2007), Tomz et al. (2007), Dutt et al. (2013), among others, the gravity model
framework used for estimation is
jiijijijjiij TFITFIDYYfX ,,,,,,
(3)
where i and j are trade partner countries. The gravity variables are defined as follows:
ijX is flow of exports from ith country to jth country.
ijD is the distance between source (i) and destination (j) country.
iY is the GDP of the source country.
jY is the GDP of the destination country.
10 World Trade Report 2004 11 Poor infrastructure has been identified as one of the responsible factor that restricts participation of the developing countries in the global value chain (World Trade Report 2014)

13
ij
represents the set of time invariant trade influencing geographical, cultural, and historical
factors like linguistic similarities, colonial relationship, sharing common land border etc.
among trading countries. Linguistic similarity (Common language) is a binary variable which is
unity if both the trading partners have common official language. Again colony (Colonial link)
is a binary variable which is unity if i ever colonized j or vice versa, common colonizer (comcol)
is a binary variable equal to unity if both trade partners are colonized by the same power and
contiguity (Border) is a binary variable which is unity if i and j share a land border.
it represents the set of country-specific time-variant factors like WTO membership,
membership of a RTA, beneficiary of a PTA including GSP etc..
)( ji TFITFI is the measure of trade facilitating infrastructure variable for the trading nations.
In log-linear form, the equation (3) can be expressed as including country specific fixed effects as
(4)
Here t represents time. The country and year specific dummies are represented by i , j , and
t to
have country and year specific fixed effects, and is the residual disturbance term assumed to be
well behaved.i ‟s are the coefficients of the variables used in the regression. Country specific fixed
effects will control the issue of multilateral resistance, as argued by Anderson and Van Wincoop
(2003).
In order to examine the effect of tariff and non-tariff barriers on multilateral trade flows, a measure
of tariff and non-tariff barriers is considered in a separate formulation. To analyse the sole effect of
these trade barriers a set of regression estimation has done by dropping the WTO membership and
related dummy variables from the equation (3.4). The estimation model, in that case, can be
represented as
ijttjijtitijtijjtitijijt TFITFIYYDX 7664321 lnlnlnln (5)
where ij is time variant trade policy instruments like tariff and non-tariff barriers.
The estimation model presented above considers only the positive trade flows. The estimated
coefficients may suffer from the sample selection bias as the bilateral trade data matrix has entries
with zero trade flows. The consideration of zero trade flows in the estimation may therefore provide
different result. To work with these zero trade flows, the exercise may be like finding of probability
of having positive trade flows and the factors underlying such flows. The method of sample
selection correction introduced by Heckman (1979) takes care of this problem. The Heckman
ijttjijtitijtijjtitijijt TFITFIYYDX 7654321 lnlnlnln

14
sample selection estimation provides results in two parts: (i) outcome estimation, that describes the
relationship between the trade flows and the responsible variables used in the estimation, and (ii)
selection estimation, that explains the power of the explanatory variables to have a positive trade.
The results of Heckman sample selection estimations are used here as a robustness check.
The next step in econometric estimation is the separating out the effect of WTO. Following
Subramanian and Wei (2007), Eicher and Henn (2011) and the decomposition of trade preferences
as formulated by Dutt et al. (2013), the chapter also accounts for WTO membership, RTA
membership, and PTA membership in a set of mutually exclusive and exhaustive dummies. Such
classification leads to the estimation of pure WTO effect. The dummies are as follows:
1. Dummy for pure WTO effect (D1): The dummy takes the value 1, if both source and
destination countries are members of WTO but they do not belong to a RTA and the
importing nation does not offer any preferential arrangement to the exporter, and zero
otherwise.
2. Dummy for pure RTA effect (D2): The dummy takes the value 1, if both the trading
partners are members of common RTA, but at least one of them is not member of WTO
and the importing nation does not offer any preferential arrangement to the exporter, and
zero otherwise.
3. Dummy for pure PTA effect (D3): The dummy takes the value 1, if the importer extends
preferential arrangements to the exporter but at least one of them is not member of WTO
and they do not belong to any RTA, and zero otherwise.
4. Dummy for effect without PTA (D4): The dummy takes the value 1, if both origin and
destination countries are members of WTO and the trading partners are members of
common RTA, but the importing nation does not offer any preferential arrangement with
the exporter, and zero otherwise.
5. Dummy for effect without RTA (D5): The dummy takes the value 1, if both origin and
destination countries are members of WTO and importer extends preferential arrangement
to the exporter but they do not belong to any RTA, and zero otherwise.
6. Dummy for effect without WTO (D6): The dummy takes the value 1, if importer extends
preferential arrangement to the exporter and both the countries belong to same RTA but at
least one of them is not member of WTO, and zero otherwise.
15
7. Dummy for having all three effects: The dummy takes the value 1, if both origin and
destination countries are members of WTO, the trading partners are member of common
RTA and importer extends preferential arrangements to the exporter, and zero otherwise.
The estimated coefficients gives separate impact effect of all seven dummies by which the pure
effect of WTO and effect without WTO on export flows (estimated coefficients of D1 and D6) can
be judged.
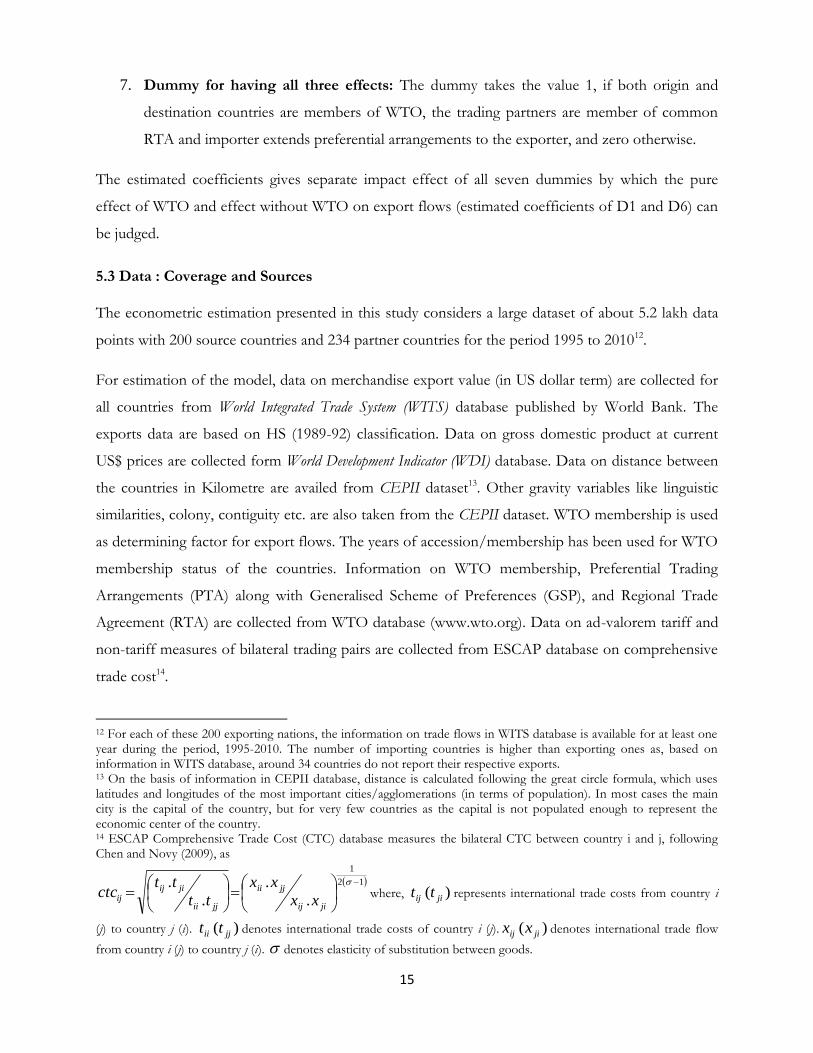
5.3 Data : Coverage and Sources
The econometric estimation presented in this study considers a large dataset of about 5.2 lakh data
points with 200 source countries and 234 partner countries for the period 1995 to 201012.
For estimation of the model, data on merchandise export value (in US dollar term) are collected for
all countries from World Integrated Trade System (WITS) database published by World Bank. The
exports data are based on HS (1989-92) classification. Data on gross domestic product at current
US$ prices are collected form World Development Indicator (WDI) database. Data on distance between
the countries in Kilometre are availed from CEPII dataset13. Other gravity variables like linguistic
similarities, colony, contiguity etc. are also taken from the CEPII dataset. WTO membership is used
as determining factor for export flows. The years of accession/membership has been used for WTO
membership status of the countries. Information on WTO membership, Preferential Trading
Arrangements (PTA) along with Generalised Scheme of Preferences (GSP), and Regional Trade
Agreement (RTA) are collected from WTO database (www.wto.org). Data on ad-valorem tariff and
non-tariff measures of bilateral trading pairs are collected from ESCAP database on comprehensive
trade cost14.
12 For each of these 200 exporting nations, the information on trade flows in WITS database is available for at least one year during the period, 1995-2010. The number of importing countries is higher than exporting ones as, based on information in WITS database, around 34 countries do not report their respective exports. 13 On the basis of information in CEPII database, distance is calculated following the great circle formula, which uses latitudes and longitudes of the most important cities/agglomerations (in terms of population). In most cases the main city is the capital of the country, but for very few countries as the capital is not populated enough to represent the economic center of the country. 14 ESCAP Comprehensive Trade Cost (CTC) database measures the bilateral CTC between country i and j, following Chen and Novy (2009), as
12
1
.
.
.
.
jiij
jjii
jjii
jiijij xx
xx
tt
ttctc where, )( jiij tt represents international trade costs from country i
(j) to country j (i). )( jjii tt denotes international trade costs of country i (j). )( jiij xx denotes international trade flow
from country i (j) to country j (i). denotes elasticity of substitution between goods.

16
On the whole, a summary of the dataset is given in Table 2. The table shows that only around half
of the observations are with positive trade flows. The significant presence of country pairs with zero
trade values urge for examining the robustness of the estimated coefficients of the model with
positive trade flows.
Table 2 : Data Statistics
Sl. No. Parameter Value
1. Number of observations 5,18,784
2. Number of observations with positive export flows 2,87,579
3. Number of country-pairs having common official language 3155
4. Number of country-pairs sharing common land border 303
5. Number of country-pairs have colony and colonizer relationship 231
In this study principal component analysis (PCA) is used to arrive at a measure of trade facilitating
infrastructure (TFI) across countries during 1995 to 2010. The variables used for the purpose
include volume of air freight measured in metric tons times kilometre travelled, flow of port
containers from land to sea transport modes and vice versa in a standard-size container (twenty-foot
equivalent units), road density measured by the ratio of the length of country‟s total road network to
the country‟s land area, volume of goods transported by railways measured in metric tonnes times
kilometre travelled, internet users per 100 people, and telephone lines per 100 people. Data on these
variables are collected from World Bank‟s World Development Indicator (WDI) database at the
country level for the period 1995 to 2000. The computational detail of TFI is given in Appendix 2.
6. Estimation Results and Interpretations
The impact of WTO has been estimated in two sets of model specification using: (i) WTO
membership dummies, and (ii) tariff and non- tariff measures. Three different time periods are
Bilateral tariff cost measure in this database is defined as
jiijij tarifftariffT 11 where, )( jiij tarifftariff is the simple average effective import tariff imposed by
country i (j) on country j (i). All additional trade cost other than tariff costs involved in trading goods bilaterally between countries, rather than domestically, are calculated as non-tariff trade cost as
ij
ij
ijT
ctcntctc

17
considered: full time period (1995-2010), initial phase of WTO formation (1995-2000), and the
maturity phase of WTO (2005-2010) to examine whether there is any difference in the effect of
WTO over the time phases. For each time period, two sets of regression are done accounting for
country and time fixed effects to control for multilateral resistance. Estimation results with
membership dummies for all country dataset are presented in Table 3.
The F-statistics of all the estimations, as reported in Table 3, are significant at 1 per cent level.
Further, as reported by adjusted R2, all the models explain more than 70 per cent of the variations in
cross-country exports. This indicates that the augmented gravity model fits the data well. Estimation
results show that the basic gravity variables are significant at 1 per cent level with expected signs in
all the cases. The economic size of trading countries, as measured by GDP, has positive impact on
exports in all cases. The impact is larger with regards to importing country‟s GDP than that of the
origin country. This indicates that exports across countries are essentially more demand driven. As
expected, distance proxying for trade costs impact export flows inversely. This result on trade costs
shows countries which are geographically close have lower trade cost leading to higher trade flows
among them.
The augmented gravity variables, for instance, common land border, colonial history, and common
language have positive and significant impact on export flows. Colonial history is a significant
determinant of export flows among the countries. Trade facilitating infrastructure of the exporting
country is a positive and significant determinant of export flows, the effect being larger during 2005-
2010. Infrastructure of the importing country is also found to be an important determinant of
export flows. However, the coefficients on TFI for the 2005-2010 period shows the impact of trade
facilitating infrastructure of the exporting country is stronger than that for the partner countries.
This indicates that improvements in trade facilitating infrastructure reduce transaction costs to trade
thereby increasing trade potential. However, distance between the trading nations and their
respective infrastructure provisions do not take into account the entire range of trade costs (see
Anderson and van Wincoop 2004).
Apart from basic and augmented gravity variables, WTO membership of both exporter and
importer countries have significant impact on export flows between a pair of countries. Such
membership however does not necessarily separate out the trading countries membership in a RTA
and/or a PTA. The dummy variables, as mentioned earlier, help to capture the pure WTO
membership, pure RTA and pure PTA effects. Table 3 shows that pure WTO membership

18
Table 3 : Gravity model estimation using membership dummies
ln(exp) (1995-2010) (1995-2000) (2005-2010)
(1) (2) (3) (4) (5) (6)
ln(GDP-exp) 0.445*** 0.455*** 0.283*** 0.283*** 0.272*** 0.257*** (0.02) (0.02) (0.06) (0.06) (0.05) (0.06)
ln(GDP-imp) 0.549*** 0.561*** 0.386*** 0.394*** 0.550*** 0.557*** (0.02) (0.02) (0.05) (0.05) (0.05) (0.06)
ln(Distance) -1.712*** -1.711*** -1.654*** -1.654*** -1.786*** -1.786*** (0.01) (0.01) (0.01) (0.01) (0.01) (0.01)
ln(TFIi) 0.004 0.027* -0.034 -0.047 0.204*** 0.263*** (0.01) (0.01) (0.04) (0.06) (0.04) (0.04)
ln(TFIj) 0.052*** 0.070*** 0.071* 0.065 0.061** 0.105*** (0.01) (0.01) (0.04) (0.05) (0.03) (0.03)
Common Language 0.604*** 0.604*** 0.539*** 0.539*** 0.660*** 0.660*** (0.01) (0.01) (0.02) (0.02) (0.02) (0.02)
Colonial Link 1.152*** 1.153*** 1.271*** 1.271*** 1.024*** 1.024*** (0.03) (0.03) (0.05) (0.05) (0.05) (0.05)
Common Colony 0.851*** 0.851*** 0.918*** 0.918*** 0.826*** 0.826*** (0.02) (0.02) (0.03) (0.03) (0.03) (0.03)
Border 0.848*** 0.848*** 0.850*** 0.850*** 0.829*** 0.829*** (0.03) (0.03) (0.04) (0.04) (0.05) (0.05)
Pure WTO Effect 0.893*** 0.894*** 0.221 0.220 1.362*** 1.364*** (0.28) (0.28) (0.37) (0.37) (0.50) (0.50)
Pure RTA Effect 0.409*** 0.407*** 0.217*** 0.217*** 0.751*** 0.752*** (0.02) (0.02) (0.03) (0.03) (0.04) (0.04)
Pure PTA Effect 0.041 0.036 0.006 0.007 0.107** 0.105* (0.03) (0.03) (0.05) (0.05) (0.05) (0.05)
Effect without PTA 0.254*** 0.256*** 0.082*** 0.082*** 0.307*** 0.309*** (0.01) (0.01) (0.03) (0.03) (0.02) (0.02)
Effect without RTA 0.369*** 0.370*** 0.522*** 0.522*** 0.396*** 0.398*** (0.02) (0.02) (0.04) (0.04) (0.04) (0.04)
Effect without WTO -0.017 -0.011 0.267 0.271 -0.206* -0.199* (0.08) (0.08) (0.17) (0.17) (0.11) (0.11)
Effect of all 0.429*** 0.435*** 0.645*** 0.655*** 0.388*** 0.392*** (0.05) (0.05) (0.20) (0.20) (0.06) (0.06)
Time FE No Yes No Yes No Yes Exporter FE Yes Yes Yes Yes Yes Yes Importer FE Yes Yes Yes Yes Yes Yes Observations 262900 262900 85608 85608 107967 107967 Adjusted R2 0.720 0.720 0.727 0.727 0.727 0.727
Note: Standard errors in parentheses, * p < 0.10, ** p < 0.05, *** p < 0.01
19
coefficient is positive and significant in explaining export flows. Interestingly it is not significant for
the initial period (1995-2000), but is found to be significant during 2005-2010. The pure RTA effect
is also positive and significant, while pure PTA effect is not (except for the period of 2005-2010).
This result does not support the findings of Rose (2004a). The effect of WTO membership without
either RTA or PTA is also positive and significant in all the cases. However, the effect of PTA and
RTA without WTO is insignificant. Finally, membership of all trading arrangements simultaneously
has significant impact on multilateral trade flows.
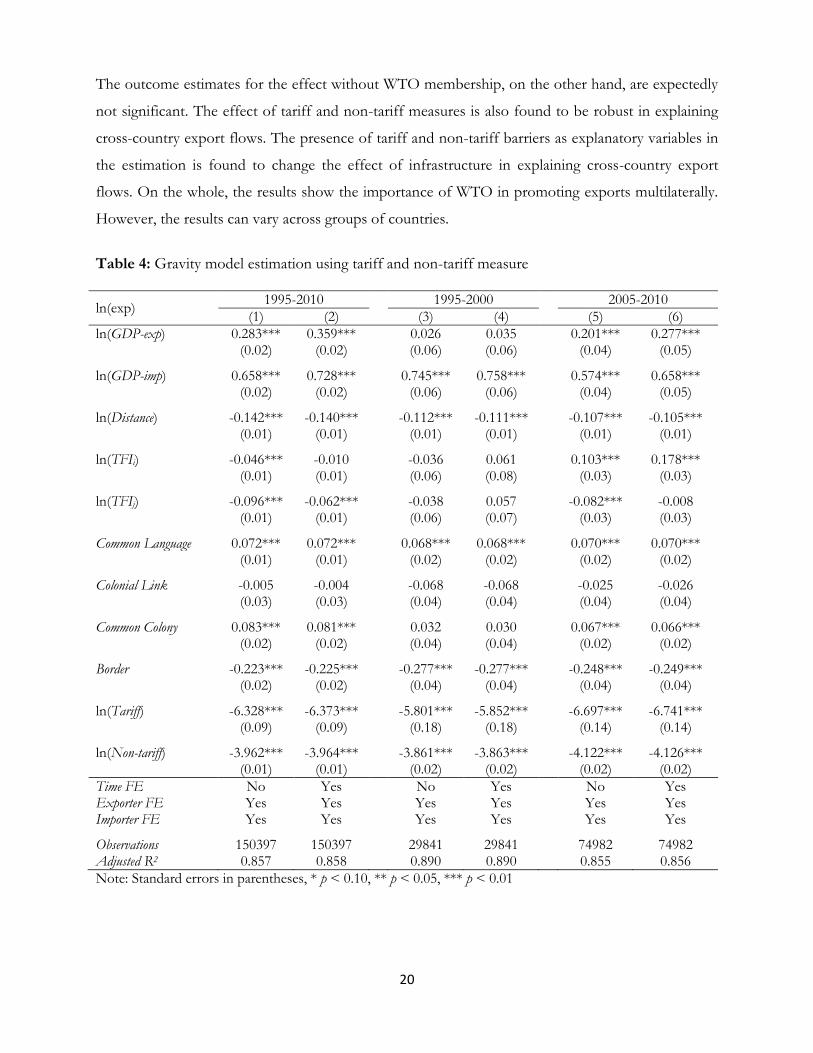
The effect of WTO on export flows has also been examined using tariff and non-tariff data. Table 4
shows that tariff and non-tariff barriers to trade have a significant inverse relationship with cross-
country export flows. The elasticity coefficients are high. The presence of these two variables in
place of WTO membership and related dummy variables however, reduces the explanatory power of
the other trade cost variables used in the estimation. This relegates the infrastructure variable either
to a negative determinant in some cases. The fall in the negative magnitude of distance, which
overshadows the positive effect of infrastructure, indicates the importance of tariff and non-tariff
measures in explaining trade costs.
On the whole, the basic and extended gravity variables remain important as determinants of trade
flows in a trade regime after WTO formation. Trade facilitating infrastructure, tariff and non-tariff
barriers, by way of reducing transaction costs, are significant determinants of trade flows. The effect
of WTO membership is important in determining trade flows. The above results, however, suffered
from sample selection bias as the estimation considered only the positive export flows. Table 1
shows around half of the observations are either missing or zero. To consider these zero export
flows in the estimation and control the sample selection bias, Heckman sample selection estimation
is attempted as a robustness check for the above estimation.
Heckman sample selection estimation is carried out for robustness check. Outcome columns in
Tables 5 and Table 6 give the coefficients of each variable on the basis of the sample which
considers both zero and positive export flows. The selection column shows the role of that variable
in question in having positive export flows. Most variables, for the full time period, are significant
with expected signs. The estimates for the entire period, 1995-2010, are robust and the WTO
membership is strong enough as a determinant explaining cross-country export flows.
20
The outcome estimates for the effect without WTO membership, on the other hand, are expectedly
not significant. The effect of tariff and non-tariff measures is also found to be robust in explaining
cross-country export flows. The presence of tariff and non-tariff barriers as explanatory variables in
the estimation is found to change the effect of infrastructure in explaining cross-country export
flows. On the whole, the results show the importance of WTO in promoting exports multilaterally.
However, the results can vary across groups of countries.
Table 4: Gravity model estimation using tariff and non-tariff measure
ln(exp) 1995-2010 1995-2000 2005-2010
(1) (2) (3) (4) (5) (6)
ln(GDP-exp) 0.283*** 0.359*** 0.026 0.035 0.201*** 0.277*** (0.02) (0.02) (0.06) (0.06) (0.04) (0.05)
ln(GDP-imp) 0.658*** 0.728*** 0.745*** 0.758*** 0.574*** 0.658*** (0.02) (0.02) (0.06) (0.06) (0.04) (0.05)
ln(Distance) -0.142*** -0.140*** -0.112*** -0.111*** -0.107*** -0.105*** (0.01) (0.01) (0.01) (0.01) (0.01) (0.01)
ln(TFIi) -0.046*** -0.010 -0.036 0.061 0.103*** 0.178*** (0.01) (0.01) (0.06) (0.08) (0.03) (0.03)
ln(TFIj) -0.096*** -0.062*** -0.038 0.057 -0.082*** -0.008 (0.01) (0.01) (0.06) (0.07) (0.03) (0.03)
Common Language 0.072*** 0.072*** 0.068*** 0.068*** 0.070*** 0.070*** (0.01) (0.01) (0.02) (0.02) (0.02) (0.02)
Colonial Link -0.005 -0.004 -0.068 -0.068 -0.025 -0.026 (0.03) (0.03) (0.04) (0.04) (0.04) (0.04)
Common Colony 0.083*** 0.081*** 0.032 0.030 0.067*** 0.066*** (0.02) (0.02) (0.04) (0.04) (0.02) (0.02)
Border -0.223*** -0.225*** -0.277*** -0.277*** -0.248*** -0.249*** (0.02) (0.02) (0.04) (0.04) (0.04) (0.04)
ln(Tariff) -6.328*** -6.373*** -5.801*** -5.852*** -6.697*** -6.741*** (0.09) (0.09) (0.18) (0.18) (0.14) (0.14)
ln(Non-tariff) -3.962*** -3.964*** -3.861*** -3.863*** -4.122*** -4.126*** (0.01) (0.01) (0.02) (0.02) (0.02) (0.02)
Time FE No Yes No Yes No Yes Exporter FE Yes Yes Yes Yes Yes Yes Importer FE Yes Yes Yes Yes Yes Yes
Observations 150397 150397 29841 29841 74982 74982 Adjusted R2 0.857 0.858 0.890 0.890 0.855 0.856
Note: Standard errors in parentheses, * p < 0.10, ** p < 0.05, *** p < 0.01

21
Table 5: Heckman estimation with membership dummies
ln(exp) (1995-2010) (1995-2000) (2005-2010)
outcome selection outcome selection outcome selection
ln(GDP-exp) 0.166*** 0.209*** 0.186*** 0.227*** 0.073 0.205*** (0.02) (0.00) (0.04) (0.01) (0.05) (0.00)
ln(GDP-imp) 0.342*** -0.067*** 0.329*** -0.082*** 0.399*** -0.053*** (0.02) (0.00) (0.04) (0.01) (0.05) (0.00)
ln(Distance) -1.717*** -0.228*** -1.652*** -0.235*** -1.785*** -0.266*** (0.01) (0.01) (0.01) (0.02) (0.01) (0.02)
ln(TFIi) 0.065*** -0.075*** -0.047 -0.038*** 0.304*** -0.103*** (0.02) (0.01) (0.07) (0.01) (0.05) (0.01)
ln(TFIj) 0.102*** 0.088*** 0.065 0.112*** 0.131*** 0.084*** (0.01) (0.00) (0.05) (0.01) (0.03) (0.01)
Common Language 0.599*** -0.019 0.538*** -0.036 0.658*** 0.039 (0.01) (0.02) (0.02) (0.03) (0.02) (0.03)
Colonial Link 1.151*** 0.787*** 1.269*** 0.571*** 1.021*** 0.817*** (0.03) (0.13) (0.04) (0.17) (0.05) (0.23)
Common Colony 0.854*** -0.257*** 0.923*** -0.308*** 0.830*** -0.248*** (0.02) (0.02) (0.03) (0.03) (0.03) (0.03)
Border 0.834*** 0.425*** 0.848*** 0.399*** 0.827*** 0.429** (0.03) (0.09) (0.05) (0.12) (0.05) (0.20)
Pure WTO Effect 0.930** 6.259*** 0.213 6.473*** 1.350 6.645*** (0.38) (0.03) (0.30) (0.05) (0.95) (0.06)
Pure RTA Effect 0.392*** 0.437*** 0.214*** 0.387*** 0.745*** 0.490*** (0.02) (0.05) (0.03) (0.07) (0.05) (0.09)
Pure PTA Effect 0.060* 0.067* 0.005 0.162*** 0.112* -0.137** (0.04) (0.04) (0.05) (0.06) (0.07) (0.06)
Effect without PTA 0.254*** 0.768*** 0.079*** 0.656*** 0.304*** 0.809*** (0.01) (0.04) (0.02) (0.07) (0.02) (0.06)
Effect without RTA 0.389*** 0.190*** 0.518*** 0.249*** 0.398*** 0.137*** (0.02) (0.02) (0.04) (0.04) (0.03) (0.03)
Effect without WTO -0.041 0.896*** 0.255 0.678** -0.212* 5.717*** (0.09) (0.22) (0.20) (0.29) (0.13) (0.06)
Effect of all 0.432*** 0.872*** 0.647*** 5.286*** 0.386*** 0.764*** (0.04) (0.22) (0.11) (0.08) (0.05) (0.23)
athrho Constant -0.075 -0.080 -0.074 (0.06) (0.07) (0.06)
lnsigma Constant 0.678 0.603 0.711 (0.56) (0.58) (0.66)
Observations 268123 87236 110176
Note: Standard errors in parentheses, * p < 0.10, ** p < 0.05, *** p < 0.01

22
Table 6: Heckman estimation with tariff and non-tariff barriers
ln(exp) (1995-2010) (1995-2000) (2005-2010)
outcome selection outcome selection outcome selection
ln(GDP-exp) 0.362*** 0.260*** 0.155*** 0.360*** 0.370*** 0.223*** (0.02) (0.01) (0.05) (0.02) (0.04) (0.01)
ln(GDP-imp) 0.732*** -0.017*** 0.874*** -0.001 0.749*** -0.021*** (0.02) (0.01) (0.05) (0.01) (0.04) (0.01)
ln(Distance) -0.141*** 0.092*** -0.112*** 0.065 -0.106*** 0.092*** (0.01) (0.02) (0.02) (0.07) (0.01) (0.03)
ln(TFIi) -0.010 -0.168*** 0.031 -0.159*** 0.154*** -0.151*** (0.02) (0.01) (0.08) (0.04) (0.04) (0.02)
ln(TFIj) -0.063*** -0.034** 0.033 -0.017 -0.032 -0.006 (0.01) (0.01) (0.07) (0.03) (0.03) (0.02)
Common Language 0.073*** -0.075* 0.070*** -0.229** 0.070*** -0.006 (0.01) (0.04) (0.03) (0.11) (0.02) (0.06)
Colonial Link -0.004 0.408* -0.068* -0.036 -0.026 0.270 (0.02) (0.21) (0.04) (0.43) (0.03) (0.26)
Common Colony 0.081*** 0.028 0.031 -0.098 0.066*** 0.133* (0.02) (0.05) (0.05) (0.13) (0.02) (0.08)
Border -0.223*** 0.050 -0.273*** -0.782*** -0.247*** 3.886*** (0.02) (0.16) (0.04) (0.23) (0.03) (0.08)
ln(Tariff) -6.365*** -1.465*** -5.836*** -2.423*** -6.731*** -1.445*** (0.11) (0.23) (0.26) (0.52) (0.20) (0.34)
ln(Non-tariff) -3.960*** -0.843*** -3.854*** -1.321*** -4.122*** -0.661*** (0.02) (0.03) (0.03) (0.13) (0.02) (0.04)
athrho Constant -0.109 -0.177 -0.086 (0.09) (0.12) (0.09)
lnsigma Constant 0.275 0.077 0.314 (0.19) (0.06) (0.27)
Observations 151212 29949 75403
Note: Standard errors in parentheses, * p < 0.10, ** p < 0.05, *** p < 0.01
6.1 Estimation Results: Developed Country Exports
Results based on the estimation of same set of equations for developed exporting nations are
presented in Table 7. The adjusted R2 values of the estimations show that all model specifications
explain more than 85 per cent variations of export flows. Most basic gravity variables (in Table 7)
are found to be significant with expected signs except GDP of the exporting nations during the early
phase of WTO formation. Infrastructure of the partner countries is not important in determining
export flows from the developed exporting nations. Among extended gravity variables, common

23
official languages and past colonial link with the trade partners are positive and significant in
explaining export flows. For developed exporting nations dummy for capturing pure WTO effects
(D1), effect without WTO (D6), and effects of all (D7) are single valued set, hence dropped from
the estimation. Regional trade agreements are the sole significant and positive determinant in
explaining developed country export flows as effect without it is adversely affecting the flows.
Table 7: Developed countries: Estimation results for with membership dummy
ln(exp) 1995-2010 1995-2000 2005-2010
(1) (2) (3) (4) (5) (6)
ln(GDP-exp) 0.381*** 0.346*** 0.076 0.120 0.354*** 0.060 (0.03) (0.04) (0.11) (0.11) (0.09) (0.12)
ln(GDP-imp) 0.708*** 0.715*** 0.534*** 0.532*** 0.627*** 0.663*** (0.02) (0.02) (0.06) (0.06) (0.05) (0.07)
ln(Distance) -1.611*** -1.610*** -1.606*** -1.606*** -1.604*** -1.603*** (0.01) (0.01) (0.02) (0.02) (0.02) (0.02)
ln(TFIi) 0.063** 0.125*** -0.001 -0.003 0.281* 0.412** (0.03) (0.04) (0.06) (0.11) (0.15) (0.17)
ln(TFIj) -0.015 0.008 0.028 0.048 0.005 0.065* (0.01) (0.02) (0.05) (0.06) (0.03) (0.04)
Common Language 0.402*** 0.401*** 0.360*** 0.360*** 0.410*** 0.410*** (0.02) (0.02) (0.03) (0.03) (0.03) (0.03)
Colonial Link 1.266*** 1.266*** 1.349*** 1.349*** 1.237*** 1.237*** (0.03) (0.03) (0.05) (0.05) (0.05) (0.05)
Common Colony 0.256** 0.255** -0.035 -0.036 0.242 0.241 (0.11) (0.11) (0.20) (0.20) (0.17) (0.17)
Border 0.058 0.058 0.039 0.038 0.131 0.134 (0.05) (0.05) (0.08) (0.08) (0.09) (0.09)
Pure RTA Effect 0.210*** 0.209*** 0.362*** 0.363*** 0.329*** 0.338*** (0.04) (0.04) (0.06) (0.06) (0.08) (0.08)
Pure PTA Effect -0.035 0.002 . . -0.331 -0.307 (0.72) (0.72) . . (0.71) (0.71)
Effect without PTA 0.122*** 0.126*** 0.059 0.060 0.155*** 0.161*** (0.02) (0.02) (0.04) (0.04) (0.04) (0.04)
Effect without RTA -0.345** -0.345** -0.534** -0.534** -0.213 -0.213 (0.15) (0.15) (0.24) (0.24) (0.24) (0.24)
Time FE No Yes No Yes No Yes Exporter FE Yes Yes Yes Yes Yes Yes Importer FE Yes Yes Yes Yes Yes Yes Observations 73128 73128 25714 25714 28475 28475 Adjusted R2 0.855 0.855 0.854 0.854 0.861 0.862
Note: Standard errors in parentheses, * p< 0.10, ** p< 0.05, *** p< 0.01

24
6.2 Estimation Results: Developing Country Exports
For developing country exports, the fixed effect estimation shows certain interesting results. These
estimation results carry significance. The estimation results using membership dummy are presented
in Table 8. The F-statistics in all model specifications are significant at 1per cent level, the Adjusted
R2 values show that the model explains about 66 per cent variations in export flows across
developing nations. GDP of both the trading nations are positive and significant in all the phases.
Exports from developing nations are more demand driven as the coefficient of GDP for the partner
countries are higher than that for the exporting countries. Distance, being significant, acts as an
impediment to export flows from developing countries. For developing exporters, trade facilitating
infrastructure of both the trading nations is an important factor that promotes trade. All the
extended gravity variables including common land border, colonial links, common language, and
common colony, are positive and significant in determining export flows from developing countries.
Colonial history, in particular, is important in establishing trade network for developing nations.
Table 8: Developing countries: Estimation results with membership dummies
ln(exp) (1995-2010) (1995-2000) (2005-2010)
(1) (2) (3) (4) (5) (6)
ln(GDP-exp) 0.459*** 0.512*** 0.286*** 0.292*** 0.281*** 0.332*** (0.02) (0.03) (0.07) (0.07) (0.07) (0.08)
ln(GDP-imp) 0.475*** 0.518*** 0.384*** 0.394*** 0.476*** 0.521*** (0.02) (0.03) (0.07) (0.07) (0.07) (0.08)
ln(Distance) -1.781*** -1.781*** -1.723*** -1.723*** -1.858*** -1.858*** (0.01) (0.01) (0.01) (0.01) (0.01) (0.01)
ln(TFIi) 0.064*** 0.120*** -0.010 -0.003 0.281*** 0.401*** (0.02) (0.02) (0.06) (0.08) (0.06) (0.07)
ln(TFIj) 0.077*** 0.107*** 0.100* 0.108 0.070 0.115*** (0.02) (0.02) (0.06) (0.07) (0.04) (0.04)
Common Language 0.653*** 0.653*** 0.576*** 0.576*** 0.710*** 0.710*** (0.02) (0.02) (0.03) (0.03) (0.03) (0.03)
Colonial Link 1.057*** 1.057*** 1.179*** 1.179*** 0.860*** 0.860*** (0.05) (0.05) (0.08) (0.08) (0.09) (0.09)
Common Colony 0.998*** 0.998*** 1.068*** 1.068*** 0.980*** 0.979*** (0.02) (0.02) (0.04) (0.04) (0.03) (0.03)
Border 0.557*** 0.558*** 0.593*** 0.593*** 0.482*** 0.483*** (0.04) (0.04) (0.06) (0.06) (0.06) (0.06)
Pure WTO Effect 1.036*** 1.032*** 0.326 0.326 1.522*** 1.525*** (0.30) (0.30) (0.39) (0.39) (0.53) (0.53)

25
ln(exp) (1995-2010) (1995-2000) (2005-2010)
(1) (2) (3) (4) (5) (6) Pure RTA Effect 0.497*** 0.496*** 0.268*** 0.267*** 0.868*** 0.870*** (0.03) (0.03) (0.04) (0.04) (0.05) (0.05)
Pure PTA Effect -0.017 -0.025 -0.101 -0.101 0.256*** 0.253*** (0.04) (0.04) (0.06) (0.06) (0.07) (0.07)
Effect without PTA 0.442*** 0.447*** 0.327*** 0.327*** 0.459*** 0.460*** (0.02) (0.02) (0.04) (0.04) (0.03) (0.03)
Effect without RTA 0.437*** 0.440*** 0.774*** 0.775*** 0.405*** 0.406*** (0.03) (0.03) (0.05) (0.05) (0.05) (0.05)
Effect without WTO -0.187** -0.175** 0.399** 0.401** -0.417*** -0.407*** (0.09) (0.09) (0.19) (0.19) (0.12) (0.12)
Effect of all 0.448*** 0.460*** 0.856*** 0.861*** 0.390*** 0.394*** (0.05) (0.05) (0.21) (0.21) (0.08) (0.08)
Time FE No Yes No Yes No Yes Exporter FE Yes Yes Yes Yes Yes Yes Importer FE Yes Yes Yes Yes Yes Yes Observations 163196 163196 52119 52119 67791 67791 Adjusted R2 0.666 0.666 0.669 0.669 0.679 0.679
Note: Standard errors in parentheses, * p< 0.10, ** p< 0.05, *** p< 0.01
Pure WTO effect is a positive and significant determinant of export flows, though it is not so for the
initial phase just after the formation of WTO. WTO membership during its maturity phase is
stronger in determining export flows from the developing nations. This finding has further been
validated through the estimated coefficient of the effect without WTO membership. Pure RTA
effect is also significant in explaining developing countries exports but the coefficient is smaller than
that for pure WTO membership. PTA is not significant in the initial phase of WTO formation (as
also for the whole time period) but is significant during 2005-2010. This is quite obvious as there
was a sharp increase in the number of countries entering into PTA after 2000 (as observed in section
3). The effects of all three, PTA, RTA and WTO taken together, are significant which reveal that
trade agreements, WTO membership in specific, are important for a developing economy in export
promotion.
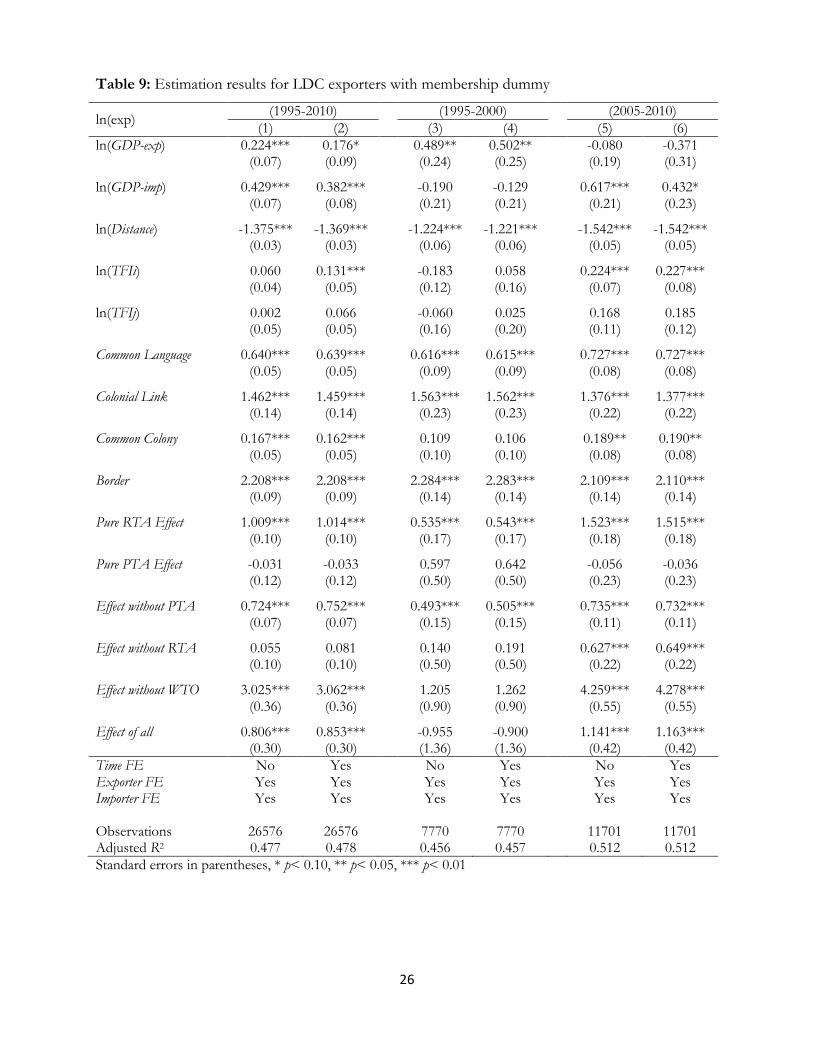
6.3 Estimation Results: Least Developed Country Exporters
Estimation results for least developed exporting countries are reported in Table 9. The F-statistics
in all the form of model specification are significant at 1 per cent level. Adjusted R2 values show
that the estimated equations are explaining around 47 per cent of variation of exports from the least
developed countries. For least developed exporting nations, GDP of both the trading nations are
26
Table 9: Estimation results for LDC exporters with membership dummy
ln(exp) (1995-2010) (1995-2000) (2005-2010)
(1) (2) (3) (4) (5) (6)
ln(GDP-exp) 0.224*** 0.176* 0.489** 0.502** -0.080 -0.371 (0.07) (0.09) (0.24) (0.25) (0.19) (0.31)
ln(GDP-imp) 0.429*** 0.382*** -0.190 -0.129 0.617*** 0.432* (0.07) (0.08) (0.21) (0.21) (0.21) (0.23)
ln(Distance) -1.375*** -1.369*** -1.224*** -1.221*** -1.542*** -1.542*** (0.03) (0.03) (0.06) (0.06) (0.05) (0.05)
ln(TFIi) 0.060 0.131*** -0.183 0.058 0.224*** 0.227*** (0.04) (0.05) (0.12) (0.16) (0.07) (0.08)
ln(TFIj) 0.002 0.066 -0.060 0.025 0.168 0.185 (0.05) (0.05) (0.16) (0.20) (0.11) (0.12)
Common Language 0.640*** 0.639*** 0.616*** 0.615*** 0.727*** 0.727*** (0.05) (0.05) (0.09) (0.09) (0.08) (0.08)
Colonial Link 1.462*** 1.459*** 1.563*** 1.562*** 1.376*** 1.377*** (0.14) (0.14) (0.23) (0.23) (0.22) (0.22)
Common Colony 0.167*** 0.162*** 0.109 0.106 0.189** 0.190** (0.05) (0.05) (0.10) (0.10) (0.08) (0.08)
Border 2.208*** 2.208*** 2.284*** 2.283*** 2.109*** 2.110*** (0.09) (0.09) (0.14) (0.14) (0.14) (0.14)
Pure RTA Effect 1.009*** 1.014*** 0.535*** 0.543*** 1.523*** 1.515*** (0.10) (0.10) (0.17) (0.17) (0.18) (0.18)
Pure PTA Effect -0.031 -0.033 0.597 0.642 -0.056 -0.036 (0.12) (0.12) (0.50) (0.50) (0.23) (0.23)
Effect without PTA 0.724*** 0.752*** 0.493*** 0.505*** 0.735*** 0.732*** (0.07) (0.07) (0.15) (0.15) (0.11) (0.11)
Effect without RTA 0.055 0.081 0.140 0.191 0.627*** 0.649*** (0.10) (0.10) (0.50) (0.50) (0.22) (0.22)
Effect without WTO 3.025*** 3.062*** 1.205 1.262 4.259*** 4.278*** (0.36) (0.36) (0.90) (0.90) (0.55) (0.55)
Effect of all 0.806*** 0.853*** -0.955 -0.900 1.141*** 1.163*** (0.30) (0.30) (1.36) (1.36) (0.42) (0.42)
Time FE No Yes No Yes No Yes Exporter FE Yes Yes Yes Yes Yes Yes Importer FE Yes Yes Yes Yes Yes Yes Observations 26576 26576 7770 7770 11701 11701 Adjusted R2 0.477 0.478 0.456 0.457 0.512 0.512
Standard errors in parentheses, * p< 0.10, ** p< 0.05, *** p< 0.01

27
positive and significant determinant of export flows from the LDCs. Here it is important to note
that the elasticity of partner country‟s GDP is higher than that for the source country in explaining
exports from the LDCs. As expected, distance is negative and significant factor in determining
exports. The infrastructure of the LDC exporters is found to be significant especially during 2005-
2010. Extended gravity variables like common official language, colonial history, and sharing of
common land border are positive and significant determinants of export flows from LDCs.
Among the membership dummies, pure WTO effect (D1) is single valued in this case and hence
dropped from the estimation. For LDCs, effect of the WTO membership is not that significant
while RTA is the sole factor that determines exports flows from the LDCs. In this case, it is
surprising to note that PTAs are not significantly affecting the country‟s exports. However, the
effect of all three memberships together is positive and significant in explaining exports from the
LDCs.
7. Conclusion and Implications for policy
The formation of WTO as a successor of GATT in 1995 with higher coverage for trade negotiation
and stronger dispute settlement procedure was to facilitate smoother trade flows across member
countries by abolishing and/or reducing trade barriers. However, there exist differences in views
among the economists about the role of the institution in enhancing trade flows. Evidence shows
that there is improvement in multilateral trade flows among the WTO member nations, especially
after 2000. After the formation of WTO, there is significant improvement in the export growth
across countries. The increasing interest of trading nations in regional and preferential trade
agreements has also resulted in increase in world trade.
The issue of the role of WTO formation in export promotion has been debated extensively by Rose
(2004a, 2004b, 2004c), Subramanian and Wei (2007), Tomz et al. (2007), Helpman et al. (2008),
Chang and Lee (2011), Eicher and Henn (2011), Dutt et al. (2013) among others. Many studies
delved into this debate, raised many methodological and other issues, but the debate remained
inconclusive. The study, motivated by the above studies, explores the effect of WTO and estimates
the responsiveness of tariff and NTBs in promoting multilateral exports. This study adds to the
debate in the following ways: (i) increasing coverage of the trade pairs (source and destination
countries) at the most possible, (ii) separating out the effect of WTO, PTA and RTA following the
28
decomposition done by Dutt et.al. (2013), (iii) including of the role of trade facilitating infrastructure
for the time period considered, (iv) using tariff and non- tariff measures in the gravity model, and (v)
a separate analysis for the initial phase of WTO formation (1995-2000) and for the maturity period
(2005-2010). In the econometric estimation, the study controls for time and country specific fixed
effects to address the issue of multilateral resistance.
The estimation results show that basic as well as extended gravity variables are significant in
determining trade flows between pairs of countries. From the estimation results it is found that
WTO membership is an important requirement in promoting exports for almost all the countries.
The role of the institution became more prominent with its maturity. It is also to note that
involvement in regional trade agreements and/or getting the benefit of preferential trade
arrangements are important in trade promotion along with other complementary factors including
lower tariff and non-tariff barriers and trade facilitating infrastructure.
The role of WTO as an institution in the current global trade system, which is predominated by
regional and preferential trade agreements, has not been lost. Rather, it has become more important.
In fact in many cases, even though only WTO memberships will not be sufficient to aid higher trade
flows, multilateralisation of trade becomes fragile in many cases without WTO. It is found in the
estimation result that as the institution matures, the effect of it strengthens multilateral trade flows.
This in a way means that older members gain more than the new members. Actually WTO provides
an environment to member nations with a systematic and stronger dispute settlement procedure. As
a result, countries engage in any further trade agreements with a preferred country or country groups
to ensure improvements in cross-border trade flows. As the WTO-membership is instrumental in
promoting exports, especially for the developing countries, accessing membership of the institution
has become an important imperative in the world of multilateral trade.
However, the increasing use of non-tariff measures for protection, despite the WTO‟s mandate to
abolish such protection in multilateral trade, is a major cause for concern in the multilateral trade
liberalization process. Trading nations generally use NTBs to fulfill their respective political motives.
The estimated impact of NTBs on multilateral export flows is very strong and significant. Hence, the
regulated use of such protective measures can promote a country‟s trade flows. As there is a
significant reduction in tariff protection by all member nations in the post-WTO phase, it is now
important for WTO as an institution to ensure the minimum use of NTBs to achieve higher gains in
multilateral trade flows.

29
APPENDIX 1
WTO members in 1995: Developed, Developing and Least Developed Countries
Countries considered as developed:
Belgium, Canada, Czech Republic, Greece, Hungary, Iceland, Ireland, Japan, Luxembourg,
Netherlands, Portugal, South Korea, New Zealand, Norway, United States, United Kingdom
Countries considered as developing:
Antigua and Barbuda, Argentina, Bahrain, Barbados, Belize, Brazil, Brunei Darussalam, Botswana, Chile, Colombia, Costa Rica, Cote d'Ivoire, Cuba, Cyprus, Dominica, El Salvador, Gabon, Guyana, Honduras, India, Indonesia, Israel, Jamaica, Kenya, Kuwait, Malaysia, Malta, Mexico, Morocco, Myanmar, Namibia, Pakistan, Paraguay, Peru, Philippines, Senegal, Singapore, St. Lucia, St. Vincent and the Grenadines, South Africa, Sri Lanka, Suriname, Swaziland, Thailand, Trinidad and Tobago, Tunisia, Turkey, United Arab Emirates, Uruguay, Zimbabwe.
Countries considered as LDCs:
Bangladesh, Burkina Faso, Central African Republic, Djibouti, Guinea, Lesotho, Togo, Mali,
Niger, Tanzania, Uganda, Zambia

30
APPENDIX 2
Computation of Trade Facilitating Infrastructure (TFI)
As supported by the existing literature, the infrastructure of the transportation and communication
sector has been considered as responsible for determining transportation cost which acts as a barrier
to the international trade flows.
Table A 1: List of infrastructure variable considered for the analysis
Sector Variable (X) Label
Transportation
ATF Air transport, freight (million ton-km)
CPT Container port traffic (TEU: 20 foot equivalent units)
RD Road density (km of road per 100 sq. km of land area)
RGT Railways, goods transported (million ton-km)
Communication IU Internet users (per 100 people)
TL Telephone lines (per 100 people)
Data Source: World Bank, WDI
As the variables are of different unit and scale, first standardization has been done for each variable
for each country using the following formulation.
Min
k
Max
k
Min
k
Actual
ik
ikxx
xxx
ˆ
where, ikx̂ is the adjusted value of the kth variable for ith country, Min
kx and Max
kx are the minimum and
maximum values respectively for the variable that recorded in the period considered among all the
countries. ikx̂ will therefore take the value from zero to one, where zero represent the worst scenario
and one the best.
For each year separately the Principal Component Analysis(PCA) has been carried out to
calculate weights,kw ,(relative importance) of respective variables as per the PCA loadings of the
first component as it captures a significant part of variation among the considered variables15. PCA
loadings of all the variables for the first component as weighting factor are presented in Table A2.
15 PCA is a statistical technique used for data reduction. By n (large number) variables, PCA will generate n components and first few components will carry a significant level of variance which may be used for having a broad impression over the variables considered though some of the variance in the variables will be unaccounted form or unexplained.

31
Country level data for the port traffic (CPT) and road density (RD) are not available during 1995-
1999, hence ignored for constructing the TFI.
Table A 2: PCA loadings (kw ) of first component for the used variables
Year ATF CPT RD RGT IU TL
1995 0.5525 … … 0.4476 0.5237 0.4692
1996 0.5458 … … 0.4412 0.5338 0.4716
1997 0.5421 … … 0.4242 0.5345 0.4904
1998 0.5460 … … 0.4377 0.5257 0.4837
1999 0.5377 … … 0.4040 0.5355 0.5107
2000 0.5027 0.4645 0.1743 0.4140 0.4158 0.3961
2001 0.5013 0.4589 0.2029 0.4151 0.4141 0.3914
2002 0.4992 0.4523 0.2077 0.4166 0.4148 0.3967
2003 0.4933 0.4518 0.2203 0.4166 0.4140 0.3989
2004 0.4924 0.4467 0.2231 0.4187 0.4154 0.4005
2005 0.4937 0.4676 0.2143 0.4153 0.4067 0.3922
2006 0.4961 0.4618 0.1674 0.4358 0.4005 0.4028
2007 0.4995 0.4634 0.1674 0.4359 0.4001 0.3971
2008 0.4973 0.4579 0.1724 0.4371 0.4000 0.4027
2009 0.5010 0.4698 0.1751 0.4344 0.3932 0.3930
2010 0.5222 0.4871 0.1540 0.4695 0.3526 0.3485
Source: Own calculation based on WDI data
The TFI of the ith country has been constructed using the following formula:
100
ˆ
k
k
k
kik
iw
wx
TFI
As in the process of trade, infrastructure of both trading nations are playing a determining role for
export flows the same measure for both exporter and importer have been used for estimation.

32
References
Anderson, J. E., van Wincoop, E. 2003. Gravity with Gravitas: A Solution to the Border Puzzle. American Economic Review. 93 (1), 170-192.
Anderson, J. E., van Wincoop, E. 2004. Trade Costs. Journal of Economic Literature. 42(3), 691-751.
Baier, S. L., Bergstrand, J. H. 2007. Do Free Trade Agreements actually Increase Members International Trade?. Journal of International Economics. 71, 72-95.
Belenkiy, M. 2008. Robustness of the Extensive Margin in the Helpman-Melitz-Rubinstein (HMR) Model. Munich Personal RePEc Archive (MPRA). 17913.
Besedes, T., Prusa, T. J. 2011. The Role of Extensive and Intensive Margins and Export Growth. Journal of Development Economics. 96, 371-379.
Bhagwati, J. N., Krishna, T. J., Panagariya, A. 2016. The World Trade System Today. In J. N. Bhagwati, P. Krishna and A. Panagariya (eds.). The World Trade System: Trends and Challenges, pp. 1-21, Cambridge, MA: MIT Press.
Brun, J. F., Carrere, M., Guillaumont, P., Melo, J. D. 2005. Has Distance Died? Evidence from a Panel Gravity Model. World Bank Economic Review. 19(1), 99-120.
Buono, I., Lalanne, G. 2012. The Effect of the Uruguay Round on the Intensive and Extensive Margins of Trade. Journal of International Economics. 86(2), 269-283.
Carrere, C. 2006. Revisiting the Effects of Regional Trade Agreements on Trade Flows with Proper Specification of the Gravity Model. European Economic Review. 50, 223-247.
Carrere, C., Schiff, M. 2005. On the Geography of Trade: Distance is Alive and Well. Revue économique. 56(6), 1249-1274.
Chang, P., Lee, M. 2011. The WTO Trade Effect. Journal of International Economics. 85, 53-71.
Coe, D. T., Subramanian, A., Tamirisa, N. T. 2007. The Missing Globalization Puzzle: Evidence of the Declining Importance of Distance. IMF Staff Papers, 54(1), 34-58.
De, P. 2004. Transaction Costs as Barriers to Economic Integration in Asia: An Empirical Exploration. RIS Discussion Paper no. 77.
Dutt, P., Mihov, I., Zandt, T. V. 2013. The Effect of WTO on the Extensive and the Intensive Margin of Trade. Journal of International Economics. 91, 204-219.
Easterly, W., Rebelo, S. 1993. Fiscal Policy and Economic Growth: An Empirical Investigation. Journal of Monetary Economics. 32, 417-458.
Egger, P., Larch, M., Staub, K. E., Winkelmann, R. 2011. The Trade Effects of Endogenous Preferential Trade Agreements. American Economic Journal: Economic Policy. 3(3), 113-143.
Eicher, T. S., Henn, C. 2011. In search of WTO trade effects: Preferential trade agreements promote trade strongly but unevenly. Journal of International Economics. 83, 137–153.
Falvey, R., Foster-McGregor, N. 2017. On the relationship between the breadth of PTAs and trade flows. UNU-MERIT Working Paper Series # 2017-038. Maastricht, The Netherlands: United Nations University-Maastricht University.

33
Frankel, J., 1997. Regional Trading Blocs in the World Economic System. Washington: Institute for International Economics.
Greenaway, D., Milner, C. 2002. Regionalism and Gravity. Research Paper Series # 2002/20, The University of Nottingham.
Heckman, J. 1979. Sample Selection Bias as a Specification Error. Econometrica. 47(1), 153-161.
Helpman, E., Melitz, M., Rubinstein, Y. 2008. Estimating Trade Flows: Trading Partners and Trading Volumes. Quarterly Journal of Economics, CXXIII(2).
Jayasinghe, S., Sarkar, R. 2008. Effects of Regional Trade Agreements on Trade in Agrifood Products: Evidence from Gravity Modelling Using Disaggregated Data. Review of Agricultural Economics. 30(1), 61-81.
Kepaptsoglou, K., Karlaftis, M. G., Tsamboulas, D. 2010. The Gravity Model Specification for Modelling International Trade Flows and Free Trade Agreement Effects: A 10-year Review of Empirical Studies. Open Economic Journal, 3, 1-13.
Lee, J-W., Park, I., Shin, K. 2008. Proliferating RTAs: why and whither?. World Economy. 31(12), 1525-1557.
Limao, N. 2016. Preferential Trade Agreements. In K. Bagwell and R. W. Staiger (eds.). Handbook of Commercial Policy. pp. 279-367. Elsevier.
Limao, N., Venables, A. J. 2001. Infrastructure, Geographical Disadvantage, Transport Cost and Trade. World Bank Economic Review. 15(3), 451-479.
Linneman, H. 1966. An Econometric Study of International Trade Flows. Amsterdam: North Holland Publishing.
Martin, P., Mayer, T., Thoenig, M. 2012. The Geography of Conflicts and Regional Trade Agreements. American Economic Journal: Macroeconomics. 4(4), 1-35.
Rose, A. K. 2004a. Do We Really Know that the WTO Increases Trade?. American Economic Review, 94(1), 98-114.
Rose, A. K. 2004b. Do WTO Members have a more Liberal Trade Policy?. Journal of International Economics, 63(2), 209-235.
Rose A. K. 2004c. Does the WTO Make Trade More Stable?. National Bureau of Economic Research Working Paper Series # 10207.
Rose A. K. 2007. Do We Really Know That the WTO Increases Trade? Reply. American Economic Review. 97(5), 2019-2025.
Rose, A. K. 2000. One Money One Market: The Effect of Common Currencies on Trade. Economic Policy. 15(30), 7–45.
Subramanian, A., Wei, S. J. 2007. The WTO Promotes Trade, Strongly but Unevenly. Journal of International Economics. 71(1), 151-175.
Tarasov, A. 2012. Per Capita Income, Market Access Costs, and Trade Volumes. Journal of International Economics, 86, 284-294.
Tomz M., Goldstein, J. L., Rivers, D. 2007. Do We Really Know That the WTO Increases Trade? Comment. American Economic Review. 97(5), 2005-2018.
*****