Does University Licensing Facilitate or Restrict the Flow ...€¦ · Does University Licensing...
29
Does University Licensing Facilitate or Restrict the Flow of Knowledge and Research Inputs Among Scientists? David C. Mowery Haas School of Business, University of California, Berkeley and NBER Neil C. Thompson Sloan School of Management Massachussetts Institute of Technology Arvids A. Ziedonis Stanford Institute of Economic Policy Research Stanford University Work in Progress This Draft: June 9, 2014 Abstract As university involvement in technology transfer and entrepreneurship has increased, concerns over the patenting and licensing of scientific discoveries have grown. This paper examines the effect of licensing on the citation of academic publications associated with patents covering university scientific research. We analyze data on invention disclosures, patents, and licenses from the University of California, a leading US academic patenter and licensor, between 1997 and 2007. We also develop a novel “inventor– based” maximum–likelihood matching technique to automate and generalize Murray’s (2002) patent– paper “pairs” methodology. We use this methodology to identify the scientific publications associated with University of California patents and licenses. We find that, in general, licenses are associated with an increase in journal citations to related scientific publications. The timing of this effect supports earlier research that suggests that academic licenses may act as positive signals of research potential in the licensed technological area (Drivas et al. 2014). In contrast, we find the opposite effect of licensing on citations to related scientific publications when the underlying discovery is a research input (which we identify through the use of material transfer agreements (MTAs)). In these cases, the related scientific publications experience a significant decline in citations following the execution of the license. Our results suggest that, in general, licensing of academic patents does not limit scientific communi- cation linked to patented academic research. Our findings on the effects of licenses on research inputs, however, raise the possibility that licensing may restrict the flow of inputs to further scientific research among researchers. We are grateful to Wendy Streitz, Ron Franck, and other employees of the U.C. Office of the President for access to the intellectual property data employed in this paper, and to Thompson Reuters for their data on scientific publications. We also thank Fiona Murray and Scott Stern for sharing their data. This work has greatly benefited from comments and suggestions by Janet Bercovitz, Paul David, Bronwyn Hall, Jennifer Kuan, Joanne Oxley, Rob Seamans, Brian Wright, Rosemarie Ziedonis, participants in seminars at the Copenhagen Business School, U.C. Berkeley, Santa Clara University, Stanford University, the 2011 NBER Economics of Intellectual Property Policy and Innovation Workshop, the 2011 Georgia Tech Roundtable for Engineering Entrepreneurship Research, and the 2012 Academy of Management annual meeting. The authors gratefully acknowledge financial support from the Institute for Business Innovation at the Haas School of Business, the National Science Foundation, the Industrial Partnerships Office at Lawrence Livermore National Laboratory, the Program in Law, Economics, and Technology at the University of Michigan Law School, the Rotman School of Management at the University of Toronto, and the Sloan Foundation. We also appreciate the support of the Stanford Institute of Economic Policy Research.
-
Upload
nguyentram -
Category
Documents
-
view
215 -
download
1
Transcript of Does University Licensing Facilitate or Restrict the Flow ...€¦ · Does University Licensing...

Does University Licensing Facilitate or Restrict theFlow of Knowledge and Research Inputs Among Scientists?
David C. MoweryHaas School of Business, University of California, Berkeley
and NBER
Neil C. ThompsonSloan School of Management
Massachussetts Institute of Technology
Arvids A. ZiedonisStanford Institute of Economic Policy Research
Stanford University
Work in ProgressThis Draft: June 9, 2014
Abstract
As university involvement in technology transfer and entrepreneurship has increased, concerns over thepatenting and licensing of scientific discoveries have grown. This paper examines the effect of licensingon the citation of academic publications associated with patents covering university scientific research.We analyze data on invention disclosures, patents, and licenses from the University of California, aleading US academic patenter and licensor, between 1997 and 2007. We also develop a novel “inventor–based” maximum–likelihood matching technique to automate and generalize Murray’s (2002) patent–paper “pairs” methodology. We use this methodology to identify the scientific publications associatedwith University of California patents and licenses.
We find that, in general, licenses are associated with an increase in journal citations to relatedscientific publications. The timing of this effect supports earlier research that suggests that academiclicenses may act as positive signals of research potential in the licensed technological area (Drivas et al.2014). In contrast, we find the opposite effect of licensing on citations to related scientific publicationswhen the underlying discovery is a research input (which we identify through the use of material transferagreements (MTAs)). In these cases, the related scientific publications experience a significant decline incitations following the execution of the license.
Our results suggest that, in general, licensing of academic patents does not limit scientific communi-cation linked to patented academic research. Our findings on the effects of licenses on research inputs,however, raise the possibility that licensing may restrict the flow of inputs to further scientific researchamong researchers.
We are grateful to Wendy Streitz, Ron Franck, and other employees of the U.C. Office of the President for access to theintellectual property data employed in this paper, and to Thompson Reuters for their data on scientific publications. We alsothank Fiona Murray and Scott Stern for sharing their data. This work has greatly benefited from comments and suggestions byJanet Bercovitz, Paul David, Bronwyn Hall, Jennifer Kuan, Joanne Oxley, Rob Seamans, Brian Wright, Rosemarie Ziedonis,participants in seminars at the Copenhagen Business School, U.C. Berkeley, Santa Clara University, Stanford University,the 2011 NBER Economics of Intellectual Property Policy and Innovation Workshop, the 2011 Georgia Tech Roundtablefor Engineering Entrepreneurship Research, and the 2012 Academy of Management annual meeting. The authors gratefullyacknowledge financial support from the Institute for Business Innovation at the Haas School of Business, the National ScienceFoundation, the Industrial Partnerships Office at Lawrence Livermore National Laboratory, the Program in Law, Economics,and Technology at the University of Michigan Law School, the Rotman School of Management at the University of Toronto,and the Sloan Foundation. We also appreciate the support of the Stanford Institute of Economic Policy Research.


1 Introduction
Growth in patenting of academic research advances in U.S. and other universities within the OECD has
triggered considerable debate since at least 1980, the year of passage of the Bayh–Dole Act in the United
States. Supporters argue that patenting and licensing of university inventions can speed the transfer of
scientific discoveries to the private sector, promoting the commercialization of such advances. On the other
hand, detractors predict a collision between the norms of science and the norms of commerce, fearing that the
exclusionary effects of patents will limit research and slow the progress of science. Despite the importance of
this question, there has been relatively little empirical work on the extent to which the patenting of academic
research results affects scientific research progress. The modest volume of such research (e.g., Murray and
Stern (2007)) reflects the challenge of obtaining data that can be used to empirically examine such effects.
This paper develops a new approach to matching scientific publications and patents, which is used to
examine the effect of licensing on the journal citations to related publications. We interpret increased
citations to these scientific publications after a license issues as evidence that licensing is correlated with a
positive effect on the prominence and use by other scientists of the knowledge embodied in the paper, while
decreases in such citations may indicate the presence of greater restrictions to such use. Drawing on related
work by Walsh et al. (2007), we also examine the effect of licenses on related scientific publications covering
the inputs to the experiments of other researchers, a class often referred to as “research tools.”
The next section of this paper discusses the use and potential effects on scientific research of formal intel-
lectual property rights covering academic discoveries. We describe our data and its relevance to this question
in Section 3. We then turn to explaining our methodology for constructing publication–patent matches, as
well as how we construct a plausible counterfactual for our treatment observations in our methodology (Sec-
tion 4). We present the results of our analysis (Section 5). Finally, we discuss the implications of our results
and conclude with a summary of the contributions and limitations of this paper in Section 6.
2 Research and Intellectual Property in Academia
Universities have long been important performers of research, particularly basic research, in the United
States and other industrial economies. The share of U.S. basic research performed by universities has risen
in recent years according to the National Science Foundation’s Science and Engineering Indicators (National
Science Foundation 2012; Table 4-4).
*** Figure 1 Here ***
1

At least since the 1970s, this expanded role of U.S. universities in research performance has been paralleled
by growth in patenting and licensing of university discoveries, particularly in biotechnology. Figure 2 shows
the growth in academia’s share of U.S. patents since 1969.1
*** Figure 2 Here ***
The roles of universities as sources of basic knowledge and as sources of potentially valuable ingredients
for commercial innovation raises the possibility of conflict between these roles, with detrimental consequences
for the advance of scientific research. Do patents and licenses restrict access to such knowledge? Or is the
existence of a patent and/or license for that patent a signal of the quality of scientific work that leads to
greater exploration of the area?
Our examination of the effects of patenting and licensing on scientific communication focuses on “patented
publications.” These are discoveries that are published in scientific journals and become the subject of
successful patent applications. A patented publication, therefore, is a scientific publication whose discovery
is also covered by a patent. Although our patented publications are similar to the patent–paper pairs of
Murray (2002) and Murray and Stern (2007), we allow multiple papers to match each patent and thus our
observations are not necessarily “pairs.”2
2.1 The Effects of Intellectual Property Protection and Licensing on Scientific
Research and Communication
An array of factors, including the Bayh–Dole Act of 1980, other changes in U.S. intellectual property laws
and policies, and expanded federal support for academic biomedical research, has increased the patenting
of academic research by U.S. universities. The growth in such patenting has been the subject of a large
literature and considerable debate over its effects on the scientific research enterprise (e.g., Mowery et al.
(2004)).
Heller and Eisenberg (1998) argue that expanded patenting of academic research results may result in
fragmented and overlapping property rights covering upstream biomedical research, limiting the ability of
scientists to access patented and licensed research results for follow–on research. Other scholars raising
concerns over the expanded assertion of property rights in science include Nelson (2003) and David (2003).
Empirical research seeking to assess the effects of patenting on scientific communication has examined the
effects of patenting on biomedical researchers’ willingness to share information on their work (Blumenthal,
et al., 1997; Campbell, et al., 2002). More recent research has analyzed the effects of patenting biomedical1USPTO (2012).2We discuss the construction of our sample of “patented publications” in Section 4.
2

discoveries that are also disclosed in scientific papers. Some of this work finds that the issuance of a patent
results in modest but significant declines in citations to the research papers related to the patent (Murray
and Stern 2007, Sampat 2005). Other research, however, argues that biomedical researchers rarely if ever
search to determine whether a prospective research project or experiment will infringe on patents (Walsh,
et al., 2005; Lei, et al., 2009), raising a question about the mechanism for any observed citation decreases.
Empirical research on the effects of academia’s use of intellectual property has focused mainly on patenting
of academic research results. The effects of university licensing on scientific research has received much
less attention from scholars. Unlike patents, licenses are not published or otherwise subject to mandatory
disclosure. In many cases the identity of licensees is treated by university technology transfer offices as
confidential (Ziedonis 2007).
Why and how might licenses affect the behavior of academic researchers in formulating their research
agenda? Sampat and Ziedonis (2005) examined patent citations to Columbia University and University of
California patents that were licensed. They found that citations were associated with an increase in the
likelihood that a patent would be licensed. Moreover, most citations occurred after the patent was licensed.
These scholars interpret this pattern as indicating market interest in the technological area surrounding
the licensed patents. More recently, Drivas et al. (2014) found that citations by non–licensees to patents
exclusively licensed (either by geographic area or field of use) by the University of California increased after
the licenses were executed. Similar to Sampat and Ziedonis, Drivas et al. regard the increase in non–licensee
patent citations as a reaction to the potential commercial value signaled by the negotiation of the license.
It is possible that a similar signaling effect associated with the execution of a license could increase
citations to patented publications linked to the license. In such a case, the issue of a license “demonstrates”
that a particular area of research has potential scientific or commercial value, leading other investigators
to pursue work in closely related fields. It is also possible (see Larsen (2011)) that contemporary academic
researchers may choose research areas partly based on their potential private profitability, and therefore
might respond positively to a “signal” that a given area of research has attracted the attention of industrial
licensees. Regardless of whether a license signal operates through perceptions among researchers of scientific
or commercial potential, this argument predicts an increase in citations to patented publications following
the negotiation of the license.
Equally plausible arguments, however, suggest a chilling effect of licensing on scientific communication.
Reactions by university technology licensing offices and/or their licensees to any evidence of patent infringe-
ment (even for research purposes, inasmuch as the research exemption from such infringement suits remains
unclear) may be swifter and stronger in the case of patents that are licensed. And licenses may include pro-
visions for reach–through royalties and limitations on the disposition of intellectual property on follow–on
3

research. Moreover, the negotiation of a license may take considerable time, delaying access to the materials
or tools embodied in the disclosure.
We are thus agnostic on the likely direction of any effect of licenses on scientific communication associated
with publications linked to licensed academic patents. Indeed, both effects may be present for papers in
various fields of research, and we hope that our findings shed light on the magnitude of any offsetting effects.
2.2 Research Inputs and Material Transfer Agreements
Patents and licenses increase the “excludability” of intellectual property for other researchers, exposing
them to potential legal liability in the event that they utilize or exploit the intellectual property protected by
patents and issued to others for their own research or commercial use. A very different form of “excludability,”
highlighted by Walsh et al. (2007), concerns the denial by one researcher of physical access to materials (or
other research results) that are inputs to the experiments of another researcher.3 The survey results of Walsh
et al. (2007) indicate that such denials can impose significant costs and delays on the scientific work of other
researchers, costs and delays that according to these authors, exceed those associated with patents.
Research inputs have been widely (and imprecisely) identified as “research tools.” For example, the NIH
Working Group on Research Tools (1998) defines them as “the full range of resources that scientists use
in the laboratory. . . the term may thus include cell lines, monoclonal antibodies, reagents, animal models,
growth factors, combinatorial chemistry libraries, drugs and drug targets, clones and cloning tools (such as
PCR), methods, laboratory equipment and machines, databases and computer software.”4
As we noted above, Walsh et al. (2007) argue that denials of access to such research tools are more
likely when the erstwhile supplier of them is engaged in “commercial activity,” such as licensing of the
invention disclosure associated with them. Interviews we conducted for this study supports this view, with
one scientist (who was involved in a start–up firm) saying “if another company asked to use our [materials]
for [same purpose as our company uses them] we would say ‘no.’ ”5
Even when access is granted, however, researchers gaining access to research tools that are associated
with licensed disclosures may encounter difficulties, as highlighted by the celebrated case of the Oncomouse
(Murray 2010):3“More problematic [than patents in limiting researcher access] is access to materials and/or data possessed by other re-
searchers, such as cell lines, reagents, genetically modified animals, unpublished information, etc. Restrictions on access,however, do not appear to turn on whether the material is itself patented. Rather, such restrictions are more closely associatedwith scientific competition, the cost of providing materials, a history of commercial activity on the part of the prospectivesupplier, and whether the material in question is itself a drug.” (Walsh et al. 2007; p. 1185)
4The National Research Council panel has a similarly broad definition that includes materials that “. . .may be critical inputsfor the success of a research project.” (National Research Council 2010; p. 7).
5Even though this scientist was unwilling to share materials in this instance, in other instances he/she had shared materials.This is important for this study, because some successful transfers of materials can be observed.
4

“In 1984, scientists at Harvard University carefully engineered a new mouse to have a predis-position to cancer, the Oncomouse. . . The Harvard researchers . . . patented their creation andsubsequently licensed this patent to DuPont. . .
[Dupont] set a high price per mouse. . . placed restrictions on breeding programs. . . demandedpublication oversight. . . [and] insisted upon a share of any commercial breakthroughs made usingthe Oncomouse.”
These and similar restrictions may have an adverse effect on the use by other researchers of research tools
such as the Oncomouse. Moreover, as the NIH Working Group on Research Tools (1998) noted in its report,
licensees may have an incentive to restrict access to these materials:
“If the sponsor or licensee plans to develop the research tool as a commercial product for sale toresearchers, it may be unwilling to permit the university to undercut its position in this particularmarket by giving the tool away to potential paying customers.”
The surveys of scientists by Walsh et al. (2007) and Lei et al. (2009) found requests by researchers for
research tools from industrial researchers, a group more likely to be engaged in commercial applications of
research, are rejected approximately twice as often as requests to other academics.
Based on these arguments, we anticipate that access to research tools (inputs to other scientific ex-
periments) that are associated with licensed intellectual property (a sign of the commercial exploitation,
prospective or otherwise, of the intellectual property) may well be restricted, even when terms for its ex-
change among researchers are successfully negotiated through a Material Transfer Agreement (MTA). Li-
censing of IP related to research tools thus may have negative consequences for follow–on scientific research
and therefore may have a negative effect on citation rates for publications related to such IP.
As the discussion of “research tools” thus far indicates, developing a definition that facilitates their identi-
fication and empirical analysis is challenging. The definitions of research tools employed by the NIH Working
Group and Walsh et al. (2007) are very broad and do not lend themselves to empirical operationalization.
Instead of attempting to develop and defend a definition of research tools that relies on the characteristics of
the relevant invention disclosure or patent, we identify research tools based on the association of a Material
Transfer Agreement (MTA) with a given patented invention disclosure.
Material Transfer Agreements (MTAs) are agreements that govern the transfer and exchange of materials,
usually biological, used in research. Although the informal exchange by researchers of biological materials for
use in fundamental research has a long and occasionally controversial history in the biomedical sciences, these
materials exchanges historically were governed by little more than a letter from the source accompanying
the materials, requesting acknowledgement and in some cases asking that the materials not be passed on to
third parties (McCain 1991). The more elaborate MTAs used in contemporary materials exchanges appear
to be a byproduct of the post–1980 surge in academic patenting (Streitz and Bennett 2003). One of the few
5
analyses of the role of MTAs in the scientific research enterprise is Stern’s discussion of biological resource
centers (2004).
Biological resource centers (BRCs) are nonprofit materials depositories that play a key role in maintaining
the reliability and provenance of cell lines used by industrial and academic researchers—as Stern notes,
contamination of widely used cell lines has caused major research fiascoes in the past several decades. Stern
argues that the use of MTAs by BRCs has aided the exchange of materials, and recommends that MTAs
be a standard complement to patents covering biological discoveries: “Putting MTAs in place at the time
of patent approval lowers the cost of mutually beneficial transactions between the developers of materials
and follow–on researchers and widens the availability of patented biomaterials” (2004; pp. 96–97). Similarly,
Walsh et al. (2003) argue that the formalization of materials exchanges through MTAs may simplify these
transactions and facilitate researcher access.
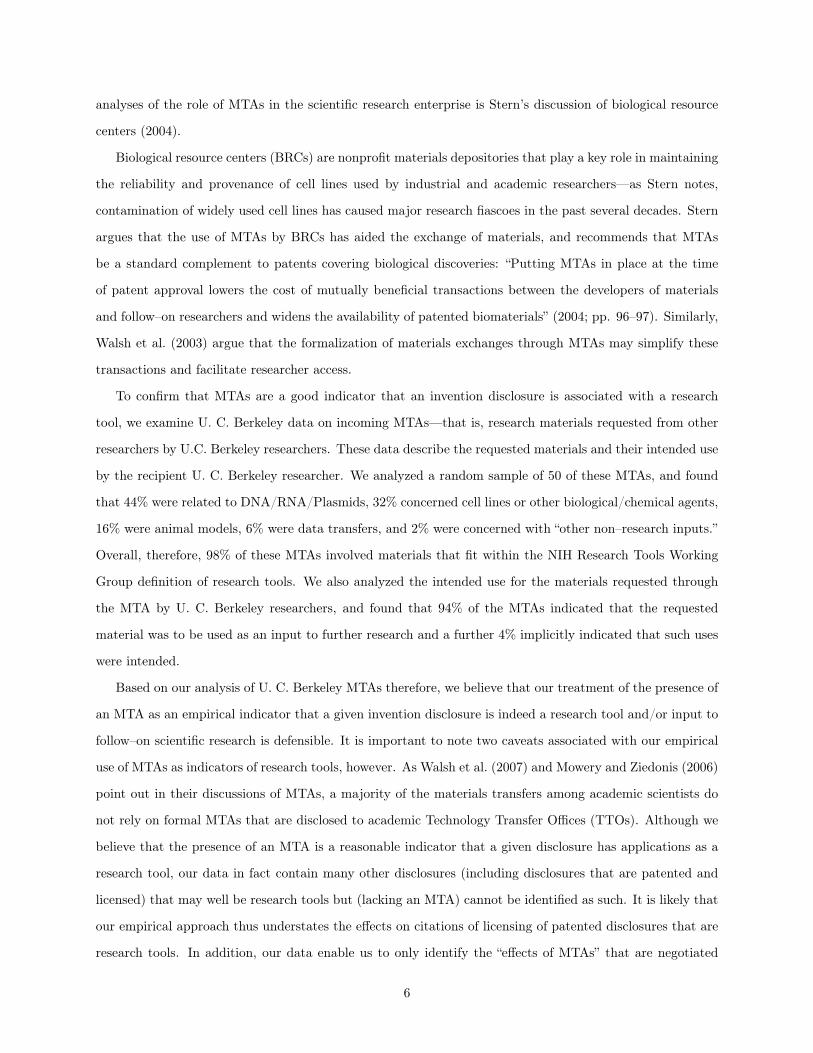
To confirm that MTAs are a good indicator that an invention disclosure is associated with a research
tool, we examine U. C. Berkeley data on incoming MTAs—that is, research materials requested from other
researchers by U.C. Berkeley researchers. These data describe the requested materials and their intended use
by the recipient U. C. Berkeley researcher. We analyzed a random sample of 50 of these MTAs, and found
that 44% were related to DNA/RNA/Plasmids, 32% concerned cell lines or other biological/chemical agents,
16% were animal models, 6% were data transfers, and 2% were concerned with “other non–research inputs.”
Overall, therefore, 98% of these MTAs involved materials that fit within the NIH Research Tools Working
Group definition of research tools. We also analyzed the intended use for the materials requested through
the MTA by U. C. Berkeley researchers, and found that 94% of the MTAs indicated that the requested
material was to be used as an input to further research and a further 4% implicitly indicated that such uses
were intended.
Based on our analysis of U. C. Berkeley MTAs therefore, we believe that our treatment of the presence of
an MTA as an empirical indicator that a given invention disclosure is indeed a research tool and/or input to
follow–on scientific research is defensible. It is important to note two caveats associated with our empirical
use of MTAs as indicators of research tools, however. As Walsh et al. (2007) and Mowery and Ziedonis (2006)
point out in their discussions of MTAs, a majority of the materials transfers among academic scientists do
not rely on formal MTAs that are disclosed to academic Technology Transfer Offices (TTOs). Although we
believe that the presence of an MTA is a reasonable indicator that a given disclosure has applications as a
research tool, our data in fact contain many other disclosures (including disclosures that are patented and
licensed) that may well be research tools but (lacking an MTA) cannot be identified as such. It is likely that
our empirical approach thus understates the effects on citations of licensing of patented disclosures that are
research tools. In addition, our data enable us to only identify the “effects of MTAs” that are negotiated
6

and agreed to by all parties to the materials transfer. In other words, and in contrast to Walsh et al. (2007),
we do not identify the effects on scientific research of the denial by researchers of other researchers’ requests
for research materials. Nevertheless, our results seem to indicate that the types of restrictions associated
with MTAs linked to licensed disclosures that were examined by Murray (2010) in her discussion of the
Oncomouse may indeed have effects on scientific communication, as measured by citations to publications.
3 Data
We draw on two principal sources of data for our empirical analysis. The first, the “IP data,” is an extract
from the technology disclosure database maintained by the Technology Transfer Office within the University
of California Office of the President (UCOP). UCOP monitors and in some cases manages invention disclo-
sures, patent applications, and licensing transactions for all campuses of the University of California (nine
campuses, including five medical schools, during the period of our study).
These data list all 11,341 inventions reported by University of California faculty from 1997 to 2007. These
disclosures led to 2,035 issued U. S. patents, 1,890 licenses to these patents, and 3,853 MTAs by the end
of 2009. Note that only a small subset of technology disclosures is patented, and universities’ patenting
propensity varies among fields of academic research—since the 1980s, patenting and licensing activity at
U. C. has been dominated by biomedical research (Mowery, et al., 2001). The distribution of MTAs also
is highly skewed, with few disclosures generating the majority of MTAs and many disclosures associated
with no MTAs. This echoes the finding in Mowery and Ziedonis (2006) that MTAs are disproportionately
concentrated in biomedical fields of research, as are licenses.
The second source, “publications data,” comes from Web of Science, an internet–based service that tracks
the bibliographic information and the citations to and from articles published in 10,000 of the highest-impact
journals across 256 disciplines.6
From Web of Science we gathered the title, author names, journal, publication date, and citation in-
formation for each scientific paper. The information on “forward citations,” citations from later published
papers to that publication, was extracted through the end of 2009. Web of Science also provides a number
of well–accepted measures of journal quality. The most prominent of these is the “impact factor,” which
measures the average number of times an article in that journal is cited in its first two years, and which we
include in our analysis.6http://thomsonreuters.com/products_services/science/science_products/a–z/web_of_science (downloaded May 2010).
7
4 Methodology
4.1 Sample
Our study focuses on finding differences in the citations associated with patented publications, depending
on whether or not they are licensed. One advantage of restricting our comparison to patented publications
is that they are more likely to be similar in quality and other characteristics. In particular, because all of
the underlying disclosures are patented, differences in “commercializability” are considerably lower than they
would be in a general sample. Nevertheless, there may well exist other unobserved differences within our
sample between the patented publications that are licensed and those that are not. Below we describe how
we construct a control sample to address these issues.
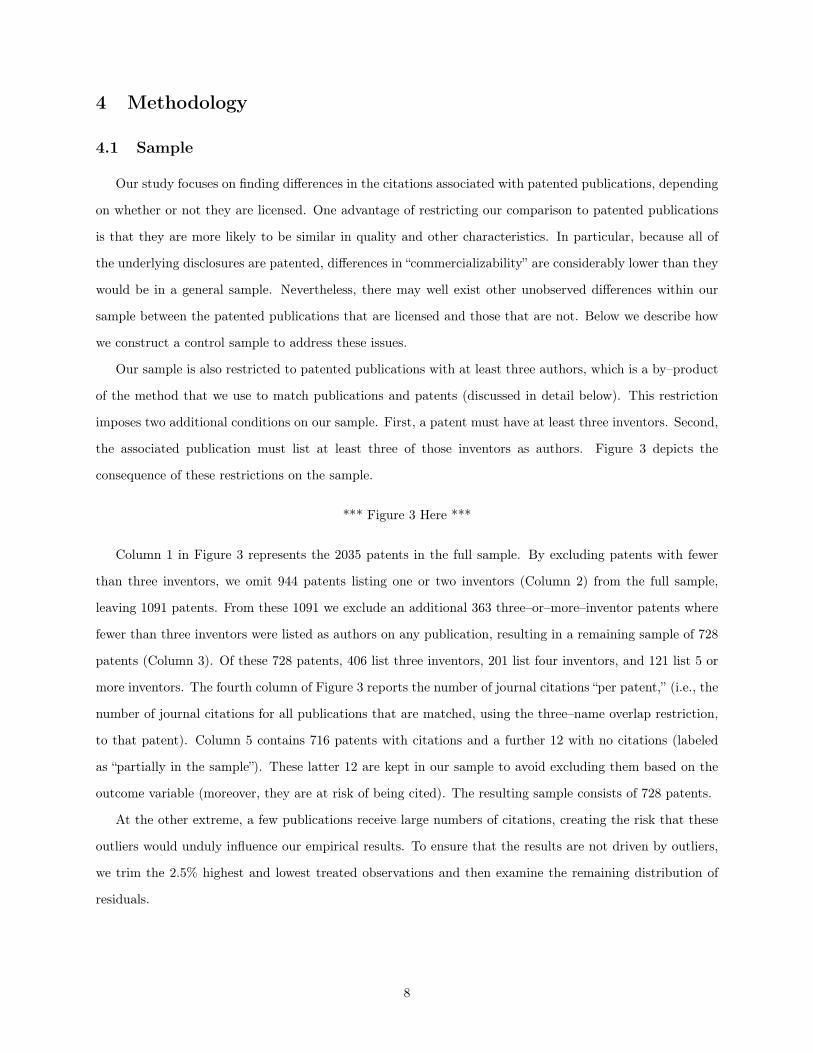
Our sample is also restricted to patented publications with at least three authors, which is a by–product
of the method that we use to match publications and patents (discussed in detail below). This restriction
imposes two additional conditions on our sample. First, a patent must have at least three inventors. Second,
the associated publication must list at least three of those inventors as authors. Figure 3 depicts the
consequence of these restrictions on the sample.
*** Figure 3 Here ***
Column 1 in Figure 3 represents the 2035 patents in the full sample. By excluding patents with fewer
than three inventors, we omit 944 patents listing one or two inventors (Column 2) from the full sample,
leaving 1091 patents. From these 1091 we exclude an additional 363 three–or–more–inventor patents where
fewer than three inventors were listed as authors on any publication, resulting in a remaining sample of 728
patents (Column 3). Of these 728 patents, 406 list three inventors, 201 list four inventors, and 121 list 5 or
more inventors. The fourth column of Figure 3 reports the number of journal citations “per patent,” (i.e., the
number of journal citations for all publications that are matched, using the three–name overlap restriction,
to that patent). Column 5 contains 716 patents with citations and a further 12 with no citations (labeled
as “partially in the sample”). These latter 12 are kept in our sample to avoid excluding them based on the
outcome variable (moreover, they are at risk of being cited). The resulting sample consists of 728 patents.
At the other extreme, a few publications receive large numbers of citations, creating the risk that these
outliers would unduly influence our empirical results. To ensure that the results are not driven by outliers,
we trim the 2.5% highest and lowest treated observations and then examine the remaining distribution of
residuals.
8

4.2 Matching Invention Disclosures, Patents, and Scientific Publications
4.2.1 Constructing Patent–Paper “Pairs”
Our empirical analysis adopts a methodology that is broadly similar to that of Murray and Stern (2007).
We measure “scientific communication” as the number of times a published scientific paper is cited by subse-
quent articles published in scientific journals (a “count”). Our sample includes only scientific publications that
are patented—that is, where the discovery has also been disclosed by the researcher to the university, and
the university has subsequently patented it. We also observe the licenses and MTAs, if any, associated with
these patented invention disclosures. To construct this sample, we rely on the connections between patents,
licenses and MTAs provided by UCOP. Connecting patents to scientific publications is less straightforward.
Murray and Stern (2007) matched patents to articles published in the journal Nature Biotechnology by read-
ing both patents and the academic articles and relying on expert judgment to link them. Our methodology
instead employs an “inventor–based matching” technique to link patents to scientific papers.
Inventor–based matching relies on two assumptions. First, inventors listed on a patent are likely to be
the authors listed on related publications. Second, the patent application date is likely to occur near the
publication date of the academic article. Based on these assumptions we construct a maximum–likelihood
estimator for the publication(s) that best matches a particular patent. For each inventor name listed in the
patent, we first identify all publications authored within a five year window that includes the year of the
patent application and the two years prior to and following that year (t − 2 to t + 2). We then determine
the instances in which the inventors’ publications overlap. Those publications with the greatest overlap are
chosen as matches. For example, if a patent has three inventors, we extract three publication sets (one for
each inventor) and retrieve publications common to all three inventors. Figure 4 illustrates this process for
the three–inventor case.
*** Figure 4 Here ***
This approach can result in multiple publications as “best” matches, in contrast to Murray and Stern
(2007), which matches one publication to each patent. To illustrate, consider patent number 7011723,
“Adhesive Microstructure and Method of Forming Same.” The patent pertains to adhesives inspired by the
design of gecko feet and credits four inventors. The inventor–based matching approach defined above yields
two matches of the underlying invention to publications in scientific journals. The first, entitled “Adhesive
Force of a Single Gecko Foot–Hair,” appeared in Nature in March 2000. A second article, “Evidence for Van
der Waals Adhesion in Gecko Setae” was published in Proceedings of the National Academy of Sciences in
2002. In this case, all four patent inventors were listed on each publication.
9

Inventor–based matching does not restrict us to instances in which all inventors are listed as authors on
the publication. For instance, if in the example above a lab technician had also been listed as an inventor
on the patent, but was not included on any linked academic publications, the algorithm would choose the
publication(s) with the maximum possible overlap. In this instance the publications listing four of the five
inventors would be chosen since there would be no five–out–of–five–inventor matches.
4.2.2 Maximum–Likelihood Estimation for Patent–Paper Pairs
As highlighted above, an implication of the inventor–based matching method is that a single patent can
be associated with more than one publication. Such a match will occur precisely when multiple publications
share the same level of overlap between the inventors, and when no publications have a greater overlap.
Based on the “best–available” property of maximum–likelihood estimators, we assume that a publication
and a patent are more likely to be a match if they share an author:
p(matchpubi&patentj | authork ∈
(authorspubi ∩ inventorspatentj
))> p
(matchpubi&patentj
)(1)
Here authorspubi and inventorspatentj are the sets of authors for publication i and the inventors for
patent j, respectively. Given these parameters, pubm is a “match” for patentj if
m ∈ argmaxi
∏i,k
p(matchpubi&patentj | authork ∈
(authorspubi ∩ inventorspatentj
))(2)
As with all maximum–likelihood estimators, a “best” estimate is not necessarily precise (Casella and
Berger 2002). In general, accurate matches are less likely when the precision of the estimate is low. For
example, our matching algorithm would be unlikely to produce correct matches if, on a four–inventor patent,
we identified only publications that listed a single inventor as an author. In this case, the algorithm would
theoretically identify as matches all publications by all of the inventors in the relevant (t−2 , t+2) window.
To avoid such errors and improve the precision of the estimate, we restrict matches to those with three or
more authors. The logic behind this criterion is illustrated in Figure 5, which portrays the number of papers
matched to each patent in our dataset linked by at least two inventors and authors and lists the number of
names common to both the patent and the published paper.
*** Figure 5 Here ***
Figure 5 shows that 82% of the sample patents is linked by the inventor–based matching algorithm to
between one and five papers, while the remaining 18% of our patents matches to six or more publications. The
10

large number of papers associated with each of the patents in the 18% may reflect common scientist names
(e.g., “J. Smith”). Figure 5 also demonstrates that patents matched to more than five publications typically
have only two names that are common to both the inventor list and the author list. We therefore exclude
all the patents marked “2” in Figure 5, noting that we have previously excluded patents and papers with
only one name in common. This leaves us with 728 patents and their related publications. The statistical
implication of dropping publications with an overlap of two authors is to restrict the sample to patent–paper
pairs with a higher expected probability of a match, thus reducing the likelihood of including false matches
(hereafter “noise”) in our sample.
We examine the effect of restricting our sample to higher levels of inventor–overlap by comparing the
sample statistics of 3–inventor overlap and 4–inventor overlap samples, as shown in Columns 1 and 2 in
Table 1. Column 3 reports difference of means test results for each variable.
*** Table 1 Here ***
The average publication year, publication age when the citations are observed, and the proportion of
the papers in the Life Sciences (principally biology, biochemistry, and medicine) are relatively stable across
the samples, suggesting little or no introduction of bias along these dimensions.7 In contrast, two measures
of publication quality, the number of citations per year and the average impact factor of the publication’s
journal, are higher in the 4–inventor overlap sample in Column 2. Since correct matches are patented
publications by definition and incorrect matches are random additions from the general pool of publications,
it is not surprising that the removal of incorrect matches yields an increase in average publication quality.
This result is consistent with our argument that higher–overlap specifications reduce noise in the sample.8 It
is also consistent with Murray and Stern’s (2007) finding that patented publications receive more citations
than unpatented publications.
4.2.3 Validation of the Inventor–Based Matching Technique
To assess the validity of this matching algorithm, we compare its output with the hand–matches compiled
by Murray and Stern (2007).9 For each patent in the Murray and Stern sample, we generated maximum–
likelihood estimates of the “best” publication matches using the inventor–based matching technique. Of
the 170 patent–publication matches identified by Murray and Stern, our automated method determined an
identical “best” publication match for 95% of the sample. In a small number of cases (4%), our algorithm7As Table 1 shows, while small, some of these differences are statistically significant. In the case of Publication Year, the
difference is equivalent to a few months.8All else equal, it is plausible that publications associated with patents will tend to be of higher quality than an average
unpatented publication. So, if tightening the “overlap” restriction results in a sample with fewer unpatented publications(“noise”), then it should have a higher average citation rate, which is what we observe.
9Fiona Murray and Scott Stern graciously provided their data to us for comparison.
11

identified a “better” match.10 Only in two cases (1% of their sample) did our approach yield matches
otherwise inconsistent with their hand–matching process.
In summary, our inventor–based matching approach, while demonstrating accuracy comparable to the
hand–matching approach employed by Murray and Stern (2007), possesses several advantages, (a) it does not
impose a simple one–to–one relationship between patents and publications, (b) it is transparent, reproducible,
and does not rely on domain expertise, (c) it is applicable to multiple scientific fields, and (d) it is automated,
making larger sample sizes feasible.
4.3 Construction of Treatment and Control Groups
Designing an adequate specification to test the effect of licensing on scientific communication is a chal-
lenging exercise, because of the complex and varied patterns of citations that publications may receive during
our sample period. Citations to some publications may grow throughout the period of our data, whereas for
other publications, citations may rise, peak, and then decline. Moreover, the timing and rate of the ascent
and descent in citations may vary. It is thus difficult to construct a sufficiently flexible parametric model
to adequately accommodate these differences.11 Moreover, if the specification is not sufficiently flexible, a
poorly modeled sub–group could bias our results. Because of the complex and potential non–linear interac-
tions of various control variables that we may employ to construct treatment and matching control groups,
we therefore pursue a flexible nonparametric approach. This technique allows us to weaken the assumption
of linearity and enables us to account for the many plausible interaction effects that could be present in our
analysis.
The non–parametric method we use is “nearest neighbor” matching. It searches the set of non–treatment
observations to identify the one that “best” matches each treatment observation. Collectively, these “best
matched” non–treatment observations form a control group. Because this search is done based on observ-
able characteristics, the control and treatment observations should be similar along these dimensions by
construction.12
10The difference here is likely because of the direction of matching. Murray and Stern began with a set of publications andfound the most–similar patent, whereas our analysis starts with a patent and finds the most–similar publication. The patentidentified by Murray and Stern may have been the best match for that publication, but another publication may be an evenbetter match to that patent. Our non–expert review of the “better” matches suggests that they are well matched.
11It is reasonable to assume that publications in more highly cited journals accrue more citations, which would argue forincluding Journal Impact Factor as a control variable. Similarly, the academic discipline (hereafter Journal Subject) could alsodrive citation patterns, as could how much higher cited a publication is prior to the license (Citations in t−1, Citations in t−2).Each of these the effects could be non–linear, which would suggest the inclusion of higher–order terms. Interaction terms betweenthese variables would also be important, since the effects of Journal Impact Factor could differ by discipline. Each of theseeffects would affect a publication differently at different points in time, calling for them to be interacted with age fixed effects.Fully interacting all of these effects to capture the entire complexity would result in many of the parameter estimates to bedetermined by small numbers of observations, or have no observations at all.
12Restricting ourselves to control observations that match the treatment observations decreases our sample size. The effectthat this has on the precision of our estimates is ambiguous, however. Smaller samples will tend to reduce our precision (makingthe standard errors larger), but there may also be a countervailing effect as the smaller sample will likely be more homogenous,
12

Since matches are found for the treated observations, the estimate from our analysis should be interpreted
as an “average treatment effect on the treated” (ATT), that is, the average effect of a license on citations
to patented publications similar to those that do receive licenses (in contrast, for example, to the effect of a
license on an average publication or an average patented publication).
We identify the control matches using the “Genetic Matching” technique, which is a generalization of
the propensity scoring matching method (Rosenbaum and Rubin 1985) that employs a search algorithm to
iteratively improve covariate balance (Diamond and Sekhon 2013, Sekhon 2011).13 Our procedure employs
two types of variables, those where we require an exact match and those where a nearby (“nearest neighbor”)
match is sufficient. We force an exact match on the following variables:
• Publication Age: Number of years since the paper was published
• Journal Subject: Academic discipline of the journal (e.g., medicine)
• Patent Granted (yes/no): Whether the related patent has been granted at the time of license
• MTA Issued (yes/no): Whether the paper has an associated MTA at the time of the license
For example, these restrictions imply that in our analysis a (licensed) treatment observation in the life
sciences with an issued patent and no MTA would be compared with a control group observation in the life
sciences with an issued patent and no MTA, and that the time period covered by the comparison would be
identical for the treatment and control observations.
For each treatment observation that matches on these exact characteristics, we then choose its nearest
neighbor based on its relative proximity in the following five characteristics:
• Journal Impact Factor
• Publication Year
• Citations in t− 2: Number of citations two years before the treatment
• Citations in t− 1: Number of citations one year before the treatment
• Slope of citation curve between t− 2 and t− 1.
In each of these dimensions we limit the maximum “distance” between each treatment and control obser-
vation to one standard deviation for that variable (the “caliper”), thus excluding any observation that differs
and thus increase precision.13Treatment and control variables are in “covariate balance” when they have the same joint distribution of their observed
covariates (Diamond and Sekhon 2013). According to Sekhon (2011) in referring to the genetic matching software GenMatch,“GenMatch dominates the other matching methods in terms of MSE [Mean Squared Error] when assumptions required forEPBR [Equal Percent Bias Reduction] hold and, even more so, when they do not.” Previous social science researchers whohave also used this generalization of the propensity score matching method include Morgan and Harding (2006), Gilligan andSergenti (2008), Eggers and Mainmueller (2009), Ladd and Lenz (2009), Gordon (2009), and Hopkins (2010).
13

by more than that amount on any characteristic.14 Under this procedure, treatment observations with no
equivalent control observation are dropped from the sample.
We further control for any remaining differences in the characteristics between treatment and control
observations by applying a “covariate bias adjustment.” We conduct a multivariate linear “regression ad-
justment” on the post–matching sample of treatment observations plus their matched controls. Collectively,
these restrictions result in a control group such that for each characteristic, the observation matches either
exactly or within one standard deviation to the corresponding treatment observation characteristic.
4.4 Methodology
Once we have generated our treatment and control group sample, we employ a difference–in–differences
approach to estimate the size of the treatment effect. More specifically we compare the change in the
number of citations to one patented publication following the execution of a license (a treated observation)
to the change in number of citations for a comparable publication that lacks a license (a matching control
observation). The specification is as follows:
Treatment Effect = (Citationst+1 − Citationst−1)pubw/License
− (Citationst+1 − Citationst−1)pubw/o License
(3)
Using a differences–in–differences estimator allows us to avoid bias associated with changes that affect
the “before” and “after” periods simultaneously. For example, in the matched sample case, if a particular
scientist receives on average five additional citations (relative to the sample average) per year, these citations
will be included in both (Citationst−1) and (Citationst+1) terms, thus the impact on the estimate will be
zero. Our estimator thus accomplishes the same effect as author or publications fixed effects. It is also
robust to these types of unobservable differences, as well as the observable differences controlled for using
matching.
To summarize, we obtain our covariate balance by using two techniques. First, we use matching to find
the nearest neighbor to our treatment observations. This non–parametric technique means that we make
fewer assumptions about the parametric form of the effect than we would with a linear, or generalized linear
(e.g., negative binomial) formulation. Secondly, we perform a multivariate linear regression (using the same
covariates used in matching), to adjust for any remaining differences between the groups.15 Because we14“Coarsened exact matching (CEM) is an alternative matching approach. Employing a caliper rather than CEM, however,
allows us to exclude both observations whose observable covariates would make them outliers and those which would qualifythem as “inliers,” that is, observations that are within the range of the data, but nevertheless lack a comparable controlobservation (Sekhon 2011).
15For the license effect: ∆Citations = β0 + β1Age + β2Journal Subject + β3Patent Granted + β4MTA Issued(Y/N) +β5Journal Impact Factor + β6Publication Y ear + β7Citationst−2 + β8Citationst−1 + β9Citations Slope+ ε. Our coefficient
14

expect such differences to be smaller, the linearity assumption embedded in least–squares is more plausible,
although still subject to the same criticisms noted above. Rubin (1979) discusses the value of using these
(slightly modified) techniques and concludes that “pair–matching coupled with regression adjustment on the
matched pairs is a quite effective general plan for controlling the bias due to matching variables, and this
combination is clearly superior to regression adjustment” (p. 318).
5 Results
Before we estimate the effects of licensing on citations to patented publications, we first must verify the
covariate balance between the treatment and control groups. An effective matching procedure should yield
summary statistics for the treatment and control groups that are similar. Table 2 reports the mean of each
group for the control variables and the results of t–tests (difference of means) and Kolmogorov–Smirnoff
(KS ) tests (difference in distributions).
*** Table 2 Here ***
The equal means (and equivalent distributions) across the treatment and control groups for first four
variables reported in Table 2, Publication Age, Journal Subject, Patent Issued, and MTA Issued, reflect our
requirement of exact matching on these dimensions across the two groups. For the remaining variables, means
for the control and treatment groups appear to be similar, but some differences are statistically significant.
Most notably, the means and distributions between the two groups are significantly different at a 1% level for
Journal Impact Factor and Citation Slope from t–2 to t–1. The Kolmogorov–Smirnoff test also shows that
the distribution of Citations in t–1 differs at 1% significance across the two groups. Overall, the presence
of significant differences in several of the matching variables suggests that the regression–adjusted analysis
improves covariate balance beyond that achieved by relying solely on the caliper matching approach.
5.1 The Effects of Licensing on Citations to Patent–Linked Publications
We now turn to estimating the effects of licensing on scientific communication as measured by citations
to patent–linked publications.16 We report the results of our findings in two ways. The effect can be seen
directly through the citation pattern for the treatment group (dashed line with circles) and the control group
(dotted line with squares), as shown in Figure 6.
*** Figure 6 Here ***
of interest is γ, which we present in our results.16Although exclusive licenses represent 97% of the licensing activity (with 3% of the licenses being non–exclusive), results are
reported by types of license. An analysis of exclusive licenses only (not reported) produces similar results.
15

As depicted in Figure 6, patented publications receive more citations starting two years after a license
is executed than do publications that are linked to unlicensed patents. This pattern of increased citations
two years after the license is consistent with a more gradual expansion of awareness within the research
community of the license that increases citations to the relevant publication only after a lag, reflecting the
lack of any public announcement of the license. In this interpretation, scientists gradually adjust their
research agendas to increase their attention to the area of research at the center of the license, in response
to the positive signal of the commercial or scientific quality embodied in the license.
Figure 7 reports results from the regression adjustment analysis, confirming the post–licensing citation
pattern presented in Figure 6 and testing for the statistical significance of the differences in citations between
the two groups. The effect of licensing on the number of citations is near zero and not statistically significant
in the first year after the execution of the license. The average difference in citations between the treatment
and control groups is 2.4 in the second year and 2.1 citation in year t+3, both of which are significant at the
1% level. This pattern is very similar to the citation trends depicted in Figure 6 due to the covariate balance
prior to the regression adjustment. The magnitude of the differences between the two groups in years t+2
and t+3 implies that the average publication receives an increase of approximately 25% in citations in these
two years compared to the control group.
*** Figure 7 Here ***
Inspection of the residuals after our regressions (not reported) shows that the mean and median are
aligned and that the residuals are distributed approximately normally, supporting the validity of our model.
5.2 The Effects of Licensing on Citations to Patent–Linked Publications Asso-
ciated with Research Tools
We now turn our attention to the effects of licensing on patented publications that we believe are more
likely to be associated with research tools. In their test of the effects of patenting on citations to “research
tool”–related publications, Murray and Stern (2007) defined such publications as those linked to any patents
within their sample in the 3–digit patent classes 435 (Chemistry: Molecular Biology and Microbiology) and
800 (Multicellular Living Organisms and Unmodified Parts Thereof and Related Processes). A patent class–
based definition, however, does not account for the patent’s use. Instead of employing patent classes, as
we noted above, we believe that patented publications for which MTAs are issued are likely to fall within a
rough definition of “research tool.”
Our analysis of the effects of licensing on this class of patented publications restricts the sample to only
16

those with materials transfer agreements.17 Thus, both treatment and the control observations have MTAs
and the difference between them is whether a license is issued.18 Table 3 presents the covariate balance for
this sample.
*** Table 3 Here ***
Although the difference in means for the control and treatment groups in the MTA–linked sample is
larger in absolute magnitude than that for the full sample reported in Table 2, the MTA sample reveals fewer
statistically significant differences in means. For the MTA–linked sample, only the t–test of the difference
of means for Publication Year is highly significant (at the 1% level), while the distributions between the
treatment and control group observations are weakly significant (10%) only for Journal Impact Factor. This
suggests a greater level of noise within the MTA–linked observations than in the full sample.
As we did in our analysis for the full sample, we present both the non–parametric citation curve for the
matched samples in Figure 8 and the regression results in Figure 9 below.
*** Figures 8 and 9 Here ***
Our analysis of the effects of licensing on citations to patent–paper pairs that are associated with MTAs
reveals a very different effect from that observed in the overall sample. For the overall sample, licensing
is associated with an increase in citations to the publications linked to the underlying patented disclosure.
For the MTA–linked sample, however, licensing is associated with a decline in citations. Using the covariate
adjusted values (Figure 9), the magnitude of the licensing effect is -3.6 citations in year t+1 and -3.2 in year
t+3 (and statistically significant at the 1% level in those two years), but is not statistically significant from
zero in year t+2.19 Overall, these coefficients represent a decrease in citations of approximately 30% for the
average publication, although our small sample size calls for caution in interpreting the exact magnitude of
the effect.20
The timing of the “license effect” for citations to MTA–linked patent–paper pairs also suggests a more
rapid negative impact than was observed for the positive effect of licenses on citations in the overall sample.17We include MTAs that are issued before or after the license. In doing so we assume that an invention receiving an MTA
irrespective of when the MTA was executed (i.e., the execution of the MTA) does not “convert” the material into a research tool.Restricting the sample to instances where an MTA exists prior to the license could ensure against possible reverse causality,however. This restriction led to results that are similar in direction, although with much smaller sample sizes. Thus we reportresults with the larger sample of MTA–linked inventions.
18Because we also match treatment to control observations based on whether the observation has an MTA, treated observationswith MTAs prior to license are matched to controls that also already have an MTA, while those that have not received an MTAprior to license are matched to controls that also have not yet received an MTA as of the license execution date.
19We do not ascribe any economic meaning to the unusual result in t+2. This can be seen in robustness checks with 2–inventoroverlap (coefficients of -5.3***, -3.4***, -5.1*** for years t+1, t+2, and t+3 ) and 2–inventor overlap considering only patentswith fewer than six publications (coefficients -5.9***, -4.1***, -5.9***). Both show strong effects in t+2 as well as in t+1 andt+3.
20For robustness, we also conducted our analysis of research tool licensing using the Murray and Stern (2007) patent class–based definition of research tools and obtained similar results.
17

The apparently more rapid appearance of the negative effects on citations observed in the MTA sample is
broadly consistent with the delays and project abandonment observed in the surveys by Walsh et al. (2007)
and Lei et al. (2009), as well as interviews we conducted for this study. Moreover, declines in citations for the
MTA–linked disclosures that are licensed occur as early as the year of the execution of the license. Inasmuch
as the citations to the focal publication associated with the patented disclosure appear only after a lag, the
speed of this observed effect suggests that researchers or universities may limit or impose other restrictions
on sharing of “research tools” during the negotiation of the license.21
6 Conclusion
This paper has investigated the effects of licenses on communication among scientists of published research
results that are linked to patented academic invention disclosures within the University of California system.
Our results suggest that in general, licenses on scientific work are associated with an increase in the number
of citations to related publications, but that this effect differs for a class of patented invention disclosures
that we believe includes a high share of research tools. For these inventions we observe a decrease in the
number of citations following a license.
Our results are consistent with other findings in the literature that suggest that licensing may have a
positive signaling effect, but that licenses on research tools may lead to restrictions on input materials that
are important for follow–on research.
These findings should be interpreted with caution, however. Our citation data do not currently incorpo-
rate the identities of the individuals and organizations citing the scientific journals within our sample. Any
“self–citations,” or citations made by the authors of the original work, would not represent knowledge flows.
Their inclusion, therefore, could overstate the effect of licenses on scientific communication.
Accounting for citers’ identities would also allow us to investigate the extent to which follow–on research is
conducted by licensees, thus suggesting the presence of market–based knowledge flows—or by third–parties,
which would indicate spillovers operating within cumulative research. We are presently incorporating the
identities of authors of citing journal articles into our data in order to address these issues in an upcoming
revision.
This study makes three contributions. First, it introduces a method for linking patents and publications
associated with an academic research advance, and thereby automates a previously arduous process that
has been difficult to scale up. Second, it employs a matching methodology that avoids strong parametric
assumptions that may not be appropriate for the complex interactions that underlie journal citation patterns.21Note that the identification of any in–year effect is much weaker, since the exact timing of the license during the year is
not accounted for in the analysis.
18

And finally, but most importantly, this paper contributes to our understanding of the effect of the licensing
of intellectual property rights covering academic research output on scientific communication.
19

ReferencesCasella, G. and Berger, R. L. (2002). Statistical Inference. Pacific Grove, CA, 2nd edition.
Diamond, A. and Sekhon, J. S. (2013). Genetic Matching for Estimating Causal Effects: A General Mul-tivariate Matching Method for Achieving Balance in Observational Studies. Review of Economics andStatistics, 95(3):932–945.
Drivas, K., Lei, Z., and Wright, B. D. (2014). Academic Patent Licenses: Roadblocks or Signposts forUnlicensed Innovators? Working Paper, pages 1–70.
Eggers, A. C. and Mainmueller, J. (2009). MPs for Sale? Returns to Office in Postwar British Politics.American Political Science Review, 103(04):513–533.
Gilligan, M. J. and Sergenti, E. J. (2008). Do UN Interventions Cause Peace? Using Matching to ImproveCausal Inference. Quarterly Journal of Political Science, 3(2):89–122.
Gordon, S. C. (2009). Assessing Partisan Bias in Federal Public Corruption Prosecutions. American PoliticalScience Review, 103(4):534–554.
Heller, M. A. and Eisenberg, R. S. (1998). Can Patents Deter Innovation? The Anticommons in BiomedicalResearch. Science, 280(5364):698–701.
Hopkins, D. J. (2010). Politicized Places: Explaining Where and When Immigrants Provoke Local Opposi-tion. American Political Science Review, 104(1):40–60.
Ladd, J. M. and Lenz, G. S. (2009). Exploiting a Rare Communication Shift to Document the PersuasivePower of the News Media. American Journal of Political Science, 53(2):394–410.
Larsen, M. T. (2011). The Implications of Academic Enterprise for Public Science: An Overview of theEmpirical Evidence. Research Policy, 40(1):6–19.
Lei, Z., Juneja, R., and Wright, B. D. (2009). Patents versus patenting: implications of intellectual propertyprotection for biological research. Nature Biotechnology, 27(1):36–40.
McCain, K. W. (1991). Communication, Competition, and Secrecy: The Production and Dissemination ofResearch-Related Information in Genetics. Science, Technology, and Human Values, 16(4):491–516.
Morgan, S. L. and Harding, D. J. (2006). Matching Estimators of Causal Effects: Prospects and Pitfalls inTheory and Practice. Sociological Methods & Research, 35(1):3–60.
Mowery, D. C., Nelson, R. R., Sampat, B. N., and Ziedonis, A. A. (2004). Ivory Tower and IndustrialInnovation: University-Industry Technology Transfer Before and After the Bayh-Dole Act in the UnitedStates. report of a symposium. Stanford University Press, Stanford, CA.
Mowery, D. C. and Ziedonis, A. A. (2006). Academic Patents and Materials Transfer Agreements: Substitutesor Complements? The Journal of Technology Transfer, 32(3):157–172.
Murray, F. (2002). Innovation as Co-Evolution of Scientific and Technological Networksw: Exploring TissueEngineering. Research Policy, 31:1389–1403.
Murray, F. (2010). The Oncomouse That Roared: Hybrid Exchange Strategies as a Source of Distinction atthe Boundary of Overlapping Institutions1. The American Journal of Sociology, 116(2):341–388.
Murray, F. and Stern, S. (2007). Do Formal Intellectual Property Rights Hinder the Free Flow of ScientificKnowledge? Journal of Economic Behavior and Organization, 63(4):648–687.
National Institutes of Health Working Group on Research Tools (1998). Report of the National Institutes ofHealth (NIH) Working Group on Research Tools: Presented to the Advisory Committee to the Director,June 4, 1998. pages 1–56.
20

National Research Council (2010). Managing University Intellectual Property in the Public Interest. TheNational Academy Press, Washington, D.C.
National Science Foundation (2012). Science and Engineering Indicators.
Rosenbaum, P. R. and Rubin, D. B. (1985). Constructing a Control Group Using Multivariate MatchedSampling Methods That Incorporate the Propensity Score. The American Statistician, 39(1):33–38.
Rubin, D. B. (1979). Using Multivariate Matched Sampling and Regression Adjustment to Control Bias inObservational Studies. Journal of the American Statistical Association, 74(366):318–328.
Sampat, B. N. (2005). Genomic Patenting by Academic Researchers: Bad for Science?
Sampat, B. N. and Ziedonis, A. A. (2005). Patent Citations and the Economic Value of Patents. In Moed,H. F., Glänzel, W., and Schmoch, U., editors, Handbook of Quantitative Science and Technology Research,pages 277–298. Kluwer Academic Publishers, Dordrecht.
Sekhon, J. S. (2011). Multivariate and Propensity Score Matching Software with Automated Balance Opti-mization: The Matching package for R. Journal of Statistical Software, 42(7):1–52.
Stern, S. (2004). Biological Resource Centers: Knowledge Hubs for the Life Sciences. Brookings InstitutionPress, Washington, D.C.
Streitz, W. D. and Bennett, A. B. (2003). Material Transfer Agreements: A University Perspective. PlantPhysiology, 133:10–13.
Walsh, J. P., Arora, A., and Cohen, W. M. (2003). Effects of Research Tool Patents and Licensing on Biomed-ical Innovation. In Patents in the Knowledge–Based Economy, pages 285–340. The National AcademiesPress, Washington, DC.
Walsh, J. P., Cohen, W. M., and Cho, C. (2007). Where Excludability Matters: Material Versus IntellectualProperty in Academic Biomedical Research. Research Policy, 36(8):1184–1203.
Ziedonis, A. A. (2007). Real Options in Technology Licensing. Management Science, 53(10):1618–1633.
21

Table 1: Summary Statistics for Samples with Three and Four Author Publication Matches to Patents
SamplesInventor Overlap 3+ 4+Sample Size†
Publications (000) 1.7 0.6Patents (000) 0.7 0.3Publications with MTAs 261 79Publications / Patent 2.4 1.8Observations in the Life Sciences 49% 44%Sample Statistics†† Difference†††Citations Per Year 11.4 16.2 ***
(26.1) 36.3)Average Impact Factor 8.7 11.0 ***
(8.4) (9.8)Publication Year 2000.7 2000.4 ***
(2.6) (2.8)Publication Age 3.2 3.3 -
(2.6) (2.7)Age at MTA Issuance 2.4 2.6 **
(2.7) (2.6)Age at Patent Issuance 3.5 3.5 -
(2.0) (2.0)†Values in the parentheses are the number of standard deviations.††Sample restricted to those publications with 7 years of citation data (only first 7 years of data included)†††Comparison is a t–test between those with 3–inventor overlap (not 3+) and those with 4+.
Table 2: Covariate Balance for the Full Licensing Sample
Full Licensing SampleCovariates Mean Treated Mean Control t–Test KS TestPublication Age 2.0 2.0 - -Journal Subject† 4.3 4.3 - -Patent Issued 0.56 0.56 - -MTA Issued 0.04 0.04 - -Journal Impact Factor 7.3 7.1 - -Publication Year 2000.7 2000.5 * -Citations in t–1 6.6 6.1 - ***Citations in t–2 4.3 4.2 - -Citation Slope from t–2 to t–1 2.3 1.9 *** ***
Notes:*** p<0.01 ** p<0.05 * p<0.10†Journal Subject is a categorical variable, with each subject mapped to a random integer. Therefore the 4.3 listed has noliteral meaning, but the equality between treatment and control, as well as well as the lack of any difference, reinforce thesuccess of the exact matching.
22

Table 3: Covariate Balance for the Research Tools Sample
Research Tools SampleCovariates Mean Treated Mean Control t–Test KS TestPublication Age 1.9 1.9 - -Journal Subject 3.9 3.9 - -Patent Issued 0.5 0.5 - -MTA Issued 0.3 0.3 - -Journal Impact Factor 5.2 6.0 - *Publication Year 2001.4 2000.5 *** -Citations in t–1 5.4 5.0 - -Citations in t–2 1.2 1.3 - -Citation Slope from t–2 to t–1 4.3 3.8 - -
Note:*** p<0.01 ** p<0.05 * p<0.10
010
2030
4050
6070
8090
100
Percent
1980 1985 1990 1995 2000 2005 2010Year
Figure 1: Academia Share of U.S. Basic Research Performance
23

Figure 2: Academia Share of U.S. Utility Patents
Figure 3: Sample Composition
24

Figure 4: Inventor–Based Matching Example
2
2 2 2 2
3
3
4
5+
0% 10% 20% 30% 40% 50% 60% 70% 80% 90%
1-‐5 6-‐10 11-‐15 16-‐20 21+
% of p
aten
ts in th
e sample with
listed level of a
utho
r overla
p
No. of Publica9on Matches for each patent
Figure 5: Distribution of Patent–Paper Pairs with Two or More Names Common to Both Matched Patentand Published Paper
25
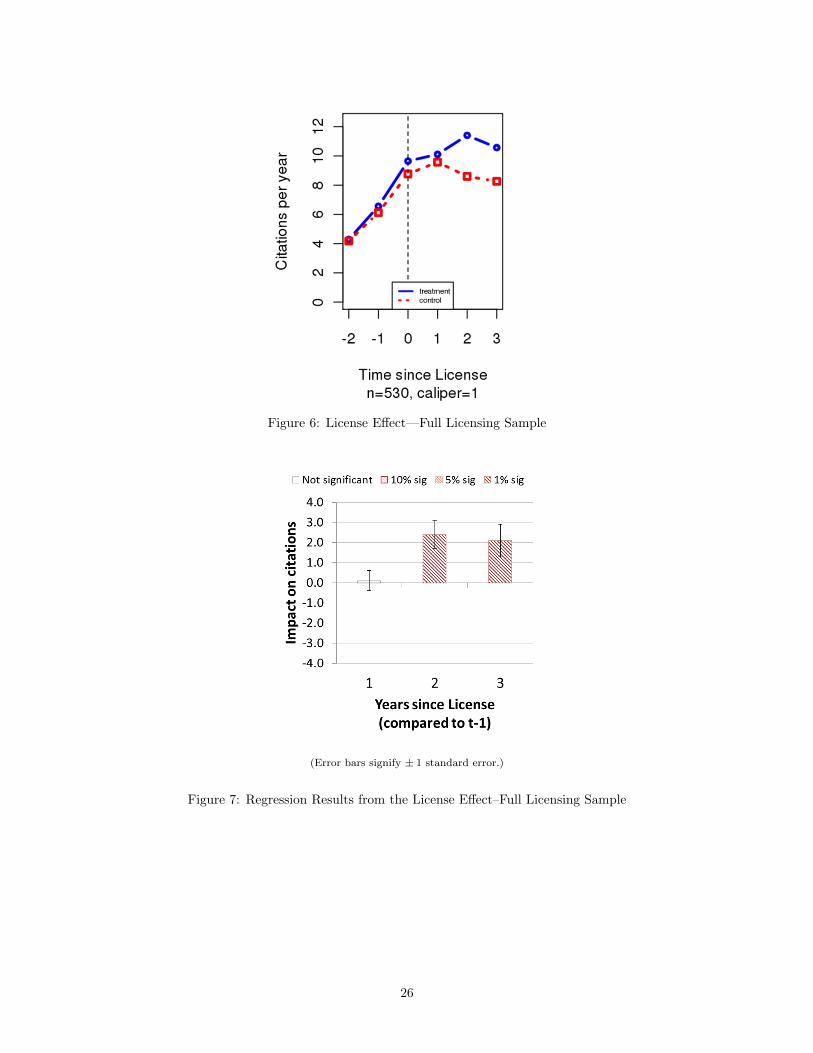
Figure 6: License Effect—Full Licensing Sample
(Error bars signify ± 1 standard error.)
Figure 7: Regression Results from the License Effect–Full Licensing Sample
26

Figure 8: License Effect—Research Tools
(Error bars signify ± 1 standard error.)
Figure 9: Regression Results from the License Effect—Research Tools
27