Does The Choice Of Concentration Ratio Really Matter?
16
WORKING PAPERS DES T CHOICE OF CONCENTION RTIO RLLY MT? Joh E. Kwok, Jr. WORING PAPE NO. 17 October 1979 FC Bureu of Ecoomic working pape ae preiminary mateials circulate t simulat dson and ctc commet. Al dt cotine i the are i te pub6c domain. This include information obtine by the Comiso which has bome par of public reord. The analys and conclusons s fort are those o the authors and do no neesarily refet the ve of ote mes of the Bureu of Eonomic othe Commissio staf, or te Commson its Upn reue, sngle copie o the paper will be provide. Reeece in publications to FC Bureau of Ecoomic workin papes by FC eonoiss (ote than acknowledgement by a write that he ha acces to sch unpublishe materials) should be cleare with the author to protet the tentative character of the papers. BURAU OF ECONOMCS FDER TRADE COMSSION WASHGTON, DC 20580
Transcript of Does The Choice Of Concentration Ratio Really Matter?

WORKING
PAPERS
DOES THE CHOICE OF CONCENTRATION RATIO REALLY MATTER
John E Kwoka Jr
WORKING PAPER NO 17
October 1979
FlC Bureau of Economics working papers are preliminary materials circulated to stimulate discussion and critical comment All data contained in them are in the pub6c domain This includes information obtained by the Commission which has become part of public record The analyses and conclusions set forth are those of the authors and do not necessarily reflect the views of other members of the Bureau of Economics other Commission staff or the Commission itselt Upon request single copies of the paper will be provided References in publications to FfC Bureau of Economics working papers by FfC economists (other than acknowledgement by a writer that he has access to such unpublished materials) should be cleared with the author to protect the tentative character of these papers
BUREAU OF ECONOMICS FEDERAL TRADE COMMISSION
WASHINGTON DC 20580
I In troduction
A common observation in industrial organiza tion literature
is that the measure of concentration used to describe an
industry or to relate its structure to performance is an issu e
of at most secondary importance Since concentration ratios and
other statistics of firm size distribution are highly correlated
it is argu ed empirical investigations will show similar results
regardless of the choice of index This paper will demonstrat e
both theoretically and empirically why that conclusion is
unfounded in the case where it is most likely to be valid
namely in a comp arison of different concentration ratios In
addition we shall suggest some economic implications of the
statistical results produced by concentration ratios consisting
of different numbers of firms
The belief that the choice of structur al measure is unimp orshy
tant stemmed origina ly from experience with structureshy
p erformance studies In his athbreak ing article Bain (1 51)
employed an industry s eight-firm concentration ratio to explain
its leading firms profitability The relationship ne found--a
significant break at eight-firm concentration of 70 percent--has
s timul ated a great deal of an alogous resear ch Occasionally the
eight-firm but more often the four-firm ratio (both available
in the Census of Manufactures) wa s used since the latter offered
1somewhat more highly signif icant results
s t since the difference 1n xplanatory power among chese
alternatives was n ever overwhelming the question of the appro-
prlate concentration ratio was generally not even mentioned or
at most quic kly di smissed Only Kilpatrick (1967 ) raised the
i ssue directly by studying correla tions between the four e ight
and twenty firm concentration ratios (plus some variants) and
industry prof it rates The similarity of correlation coef-
ficients he concluded bullprovide[s] much evidence that the
p articular choice is not cru cial bull and bullthat an economist can use
an ordinary concentration ratio in a cross-sectional st udy with-
out concern that a different choice would have alt ered his con-
elusions appreciab lybull (p 260) Although Millers nearly
s imul taneous study of marginal concentrati on ratios can be inter-
preted to mean that different concentration ratios do contain
2different informa tion that implica tion h as not prevailed
Indeed the conventional conclusion that alternative measures are I
indi stin gu ishable has general ly be en ext ende d to other structural
3n d ces
Direct compa risons of these measures of concentration
seemed to provide corroboration Rosenbl uth (1955) Scherer
(1970 and Bailey and Boyle (1971 all calculated c orre latio n
coefficients between a variety of alternative indices using
different da ta and time periods Almost al l correlatio ns were
in excess of 90 and Schere rs conclusion reflected the con-
sensus bull[r]t is senseless to spend sleepless nights worrying
about choosing the right concentration measure (Schere r 1970
-2-
p 52) bull4 Two reservations were voiced concerning this
conclusion Stigler (1968) cautioned that some such correldtions
were spurious since for exampl e the common eleme nts of the
three- and four- firm concentration ratios (namely the top three
shares) insure a high correlation A p r oper formu l ation (eg
between the three-firm ratio and the fourth share) he predicted
wo uld reveal a vastly l ower correlation Sch malensee (1976)
devised twelve more or less pl ausible concentration in dices by
m a ni pula ting Census data and t es ted their corres pondence to the
Herfindahl His conclusion that importan t differences exist
h owever is temp ered by his assumptio n th at the Herfi nd ahl is
the ideal measure of industrial concentration
In any event none of thes e stud i s have expl ored t he f undashy
mental properties of correlation coefficients which determine why
and when alt ernative c oncentration measures may m ake a differshy
ence The next section of this paper develops these properties
thereby clarifying modify ing or ref uting some of the cl aims in
the literature Then det ailed data by f our-digit S IC industry
are us ed to co ns true t al ternative cone en tr ation ra tics and
provide a specific example of these properties in structureshy
p erformance tests We con clu de w ith some implications of these
findings for economic research and public policy
-3-
II Properties of Correlation Coefficients
Let us suppose we wish to explain some measure of performshy
ance (Y) by either of two indices of marKet structure x1 ana
x2 Assume we calculate the correlation coefficient between Y
and x1 ( denoted ryl) and know fr om previous work that
between X1 and X2 (denoted r12gtmiddot what can we infer about
ry2 the correlatlon oetween Y and X2 In particular if
r12 is ver y large and highly significant and ry1 is also
s1gnificant (if not near ly so large) can we conclude that ry2
must also be significant
Th e answer is mos t definitely in the neg at1ve The necesshy
sary conditions on ry2 yield very low lower bounds for typishy
cal values on ry1 and r12bull To see this consider the
following matrix of correlation coefficients
(1 )R =
The diagona l elements are of course unity and the matrixrii
is symmetric (ie rij = rji) In addition R shares with
the covariance matrix from which it is derived the pr operty of
being pos iti ve de fln ite that is the determinants of its
5principal minors are all positive Within that constraint
howev er a wide variety of va lu es of r12r rly and r2y lS
possible
-4-
In order to focus on the present question let us explore
what values of r12 and r1y are consistent with r2y = 0
that is when Y is wholly unrelated to X2bull Then the matrix k
can be rewritten
(2 )R =
1
0 1
Positive definiteness (see footnote 5) now requires only that 2 2
1 -(r12 gt -(r ly) gt 0 ( 3)
Possible solutions include r12 = 7 r1y = 7 also r12 =
9 r1y = 4 or even r12 = 95 r1y = 3 Such values of
r12 are consistent with the evidence cited in the previous
s ect io n and th ese r1ys ar e very muc h on tne orde r of those
found in structure-performance studies (see Weiss 1974 and
r efe rences the rein)
Thus one conclusion of this exercise is that a high
c orrelation betwe en two measures of market structure (r12gt and
substantial correlation between one measure and industry perform-
ance (r1ygt need not imply any relationship wh atsoev er betwe en
the other measure and performance (r2y) Certainly they do not
imply a rela tionship of simi la r size andor significance
Alternatively these correlations can be interpreted to mean that
the weakn ess or absence of one relationship (r2y and a high
correlation between two structural measures (r12gt does not
preclud e a relations hip between the sec ond structural statistic
-s-
a d performance (r1yl Inferences that alternative concenshy
tration ratios andor other indices are indistinguishable a e
simply not justified by such correla tions
III Properties of Concentration Ra tios
In this section we shall describe alternative concentration
ratios for us manufacturing and explore their relationships to
industry performance There are of course as many concentrashy
tion ratios as firms (ie market shares) in any industry The
data required for their calculation however have not genershy
a lly been available and this study will use estimates generated
by a private mar keting research firm Their reliability has been
6
checked and found satisfactory and the data have performed well
1n prev1ous uses
The top 10 ma rke t shares for each of 314 four-di git SIC
industries in 1972 constitute the basic new data These have
been summed into the corresponding succession of concentration
ratios labeled C l bull bull bull ClO and described i n Tabl e I Thus Cl
(the large st share itself) averages 175 for all industries and
ranges from a high of 686 to a low of 011 Since at least one
industry has only seven firms id entified in the data base_ the
maximum C7 = 1 00 0 The pattern of increasing means in these
data is qui te reg ul ar though it obscures huge ra nges
The las t two columns of Tabl e I speak to Stiglers comment
and the argument of the preceding section Co rrela tions among
successive concentration ratios are extremely large in part
-6-
995
995
999
999
999
TABLE I
Descriptive Statistics of Concentration Ratios
Concentration Correlation Correlation Ratio Mean Max Min With C(n+l) With S(n+1)
Cl 175 686 011 965 702
C2 275 875 019 991 bull 708
C3 345 912 026 bull 61 4
C4 398 973 032 997 540
C5 440 bull 46 4037 998
041C6 474 999 299 I _I C7 502 1000 045 999 180
526 1000 049co
C9
087
546 1000 053 017
ClO 564 1000 057
because C(n) constitutes the largest component of C (n+l) The
correlations between any Cn) and the next share (n+l) however
are substantially different ranging from somewhat less for 52
and S3 to the vastly lower Stigler predicted in the case of
7smal ler shares Clearly succeeding shares are not d etershy
mined by any given concentration ratio and hence differen t
ratios em body di ffe ren t information about industry structure
In any event the preceding section cautions against conshy
c luding too much about rela tionships to industry performance from
such correlations A crucial test of alternative concentration
ratios li es in their rela tiv e anility to explain perf ormance
directly Our procedure is to build on the wel l -established
metho dology of pr1ce-cost ma rgin ana ly sis (Weiss 19 74 Kwoka
1979) by using different concentration ratios as alternative
explanatory va riables in the followi ng relationship
PCM = f(C KO GD GR MPT DUM) (3)
He re PCM = pr ice-cost ma rgin defined as industry value-ad ded
minus payrol l divided by value of shipments It
mea sur es the elevation of price over d irect cost a nd
hence (with some control factor s) the exercise of
market power rata are from the 1972 Census of
Manufactures 1975)
C = various concentration ratios
KO = capital-output ratio to correct PCM for intershy
industry differences in cap ital intens ity Data are
from Census of Manufactures (1975)
-8-
par
Industry
GD = geographical dispersion variable to reflect local
regional or national extent of market and thereby
correct Census data for scope of true econom1c
markets Its definition imp lies a ne gative sign
against PCM8
GR = a growth variable defined as the percenta ge change in
industry shipments between 19 67 and 1972 Theory
predicts more rapidly growing industries will have
higher margins middot
MPT = the market share of the midpoint plant size in the
indu stry to capture scale economies which require
different m inimum market shares in different
9 d1n ustr1es
DUM = zero for producer good industries one for consumer
goods industries This variable reflects the greater
importance of advertising outlays and product
differentiation in the latter Data are from FTC
Classification and Concentration (1967
Re gressions of equation 3 were performed on all ten conshy
centration ratios as reported in Table II Although Cl the
leading firm share has considerable strength and significance by
itself in explaining industry price-cost margins substantial
impr oveme nt occurs from using the two-firm concentration
ratio10 That statistic yields the highest R2 (175) and
t-value (243) of an y of the alternatives Furthermore the
-9-
H
(4 45) bull (306) (374)
3
4
1 6 5
7
9
lAULE I I
M ultivariate Regressions of Industry Price-Cost Marg ins on Various Concentration Hatios
Concentration Ha ti o KO GO GH MPl OUM CUNgtl
l 0906 Cl 0813 -0425 0530 0652 0394 2128
(193) (2 7 5) (291)
2 0 853 C2 0786 -0423 0515 o 5 41 o 391 2088
(243) (430) (306) (268) (230) (372)
_
16y
1 7 r)
064 7
(209)
CJ 0791
(430)
-0420
(302)
0529
(276)
056 8
(235)
OJ8 9
(370)
208U 1 71
o 515
( l 76)
C4 0800
(432)
-0419
(301)
05 38
(280)
06 03
(242)
0388
(368)
2094 16 u
0445 C 5 0806 -0420 0543 062 5 033 8 2095 166
I 0I
5
(157) (434) (302) (2 82) (2 48) (3 68)
6 0411 C6 0808 -04 20 0 5 47 0637 0389 2092
( 149) (434) (302) (284) (251) ( 3 6 u)
037 4 C7 0812 -0420 0550 065 5 038 9 2093 164
(137) (43 5) (301) (2 86) (2 51) (Jb8)
8 o 348 C8 0815 -0420 0552 06 70 038 209J 1 6 4
(127) (436) (301) (287) (262) ( 3 6 8)
163031 5 C9 0820 -00420 0556 0691 0389 209 7
(116) (4 39 ) (JOl) (2 88) (271 ) (368)
10 o 278 ClO 0827 -0420 05b0 0716 0389 2104 1 p 2 (103) (442) (301) (290) (2 82) (368)
pattecn of cesults w ith the moce inclusive concentcat ion catio
is pecfectly cegular w ith R2 decl ining fcom 175 w ith C2 co
1 62 w ith ClO Th e pecfocmance of the cead ily available concenshy
tcat ion cat ios foe four and eight ficms is distinctly infecioc to
that usin g C2 with C8 the wocst for being the largest aggcegat e
In deed wh ile C2 is significant at ovec 99 C4 is signif icant at
only 95 in a one-tail test an d C8 actual ly falls below 9 0
Th is occurs despite the fact that the pactial corcelation between
11C2 and C4 is 96 and that between C2 and ca is as It is
also wocth noting that all the control variables ace stable
s ignif icant and have the expected signs throughout In dustcy
macgins ace higher with lacger cap ital-output ratios less
geo gcaphical dispecsion faster
orientation
growth lacger scale economies
and a consumer goods to the industry
Thus the fact that C2s relationship to pric e-cost mar gins
is highly sign if icant and all these concentcat ion ratios are
highly correlated does not insure the emergence of a clear relashy
t ionship between these alternativ es and margins The more
inclus ive concentration ratios s imply ace too inclusive Adding
shaces not causally cela ted to performance adds random noise
which in suff icient amounts can drive even a significant undershy
ly ing variable (C2) to statistical insignificance (a s in C8)
Reseacch conf ined to the moce aggregated concentration rat ios
-11shy
--
and echanically ap lying conventio nal tests or significance
would in this case even be led to reject the hypothesis thak
121ndustr y concentration affects performance The mere fact
that the correlations between ratios were very high (as most
would surely characterize those just ment ioned) would be insufshy
ficient to draw the same conclusion regarding other--and more
a pp r opri ate measures of industry structure
v Conclusions
Th i s stu dy has demo trated that the choice of concentration
ratios can matter a great deal The usual ar gument for di smis sshy
ing the choice as unimport ant has been demons trated theoretically
incorr ect or at least incomplete Furthermore in pract ice the
choice is show n potentially cruci al to the strength of the relashy
tionsh ip found and in some circumstances even to whether a relashy
t ionship is uncove red at all Th is is n ot a trivial dismissab le
issue
The e co nomi c significan ce of the superi ority of the twoshy
firm concentra tion ratio is intriguing It suggests that an
i ndustr ys ability to coordinate behavi or and raise p rice-cost
margins above competitive levels may be determined not b y twenty
eight or even four firms but by the leading tw o This could
reflect the gr eater difficult y of securing and maintaining agreeshy
me nt amo ng more numerous rivals where even the third firm p os es
some problems such possibilities lie buried within conventional
concentrati on ra tios bu t their importance for pub lic p olicy
demonstrates the value of more disag gregated data
-12shy
Footnotes
l Weis s rev iew of 35 stud ies of us manufacturing ind stries reveals an overwhelming number which focused on the fourshyfirm concentration ratio (Weiss 1974 pp 204-20) More recent research maintains that patter n
2 Miller (1967) disaggregated the eight -firm concentration ratio and found that a large fifth-through-eighth firm group could exert a negative effect on industry performance This result sug gests that the four- and eight-firm ratios are fundamental ly different constructs
3 T w o exceptions to this view are Miller (1972) and Kwoka (1977)
4 In fairness Scherers comment was partially intended to contrast the more seriou s problems of n rket definit ion and contaminated data due to divers ified firms
5 This implies the following conditions
(a r1 1 gt 0
(b) r11 r22 - r21 r12 gt 0
(c) r11 r22 r33 + r12 r2y tyl + r21 ry2 r1y
-(rly r22 ry1 + r2y ry2 r11 + r12 r21 ryy) gt 0
For an elaboration see Ch iang (1972) pp 338-40
6 Fbr a desc ription of the nature and previous use of the data see Kwoka (1979
7 Also lower are correlations between nonsuccessive concentrashytion ratios eg the four eight and twenty firm versions
8 It is defined as the sum of absolute values of the differshyences in percentages of all manufacturing value added and a particular industrys value added for all four Census regions of the country Data are from the 1972 Census of Manufacturers (1975
9 This variable is the market share of the plant producing the fiftieth percentile of output in each industry as estimated from employment size classes of plants ln the Census of Manufactures
-13shy
10 Th ese resul s do not fully reflect the de ree of added R2explanatory power due to C2 vs Cl The of the
regres sion witnout either concentration ratio is 162middot _
While the addition of Cl raises this by 007 C2 causes R2
to increase by 013 a near doubli ng of the importance of the concentration itself
11 Although it is the partial correlations (holding the other independent variables constant) that are relevant to these multivariate relationships another common error in the literature is to note only the simp le correlation coefficients among structural measures In the present examp le they are larger yet The simp le correlation between C2 and C4 is 98 and between C2 and CS 93
12 Indeed the use of inappropriate concentration ratios might be a factor contributi ng to some findings of no such relationship See Weiss (1974) pp 203 ff
-14shy
1971 702-6
Quarterly 93-324
---o
-n In- du -st- r-y Pe-rf-ormance Economics
-- -------- --Concentration
Policy 1955
Rand McNal ly 19 70
Organization Industry
Learning
References
Bailey D and s E Boyle bullThe Op timal Me asure of ConceRtrashytion bull Journal of the American Statistical Association December pp
Bain Jo e s bullRe lation of Profit Rate to Industry Concentrashytion bull Journal of Economics August 195 1 pp 2
Chiang Alpha c Fundamental Methods of Mathematical Economics New York McGraw Hil l 1974
Kilpatrick R w The Choice Among Alternative Measure s of In dustrial Co ncentration bull Review of Economics and Statistics
May 1967 pp 258-60
Kwoka John E Jr bullLarge Firm Dominance and Price Cost
Journal July 197 7
pp 183-89
bullThe Effect of Market Share Distribution Review of and Statistics
Margins in Manufacturing Industriesbull Southern Economic
February 1979 pp 101-109
Miller Richard Marginal Concentration Ratios and Industry Profit Rates bull Southern Economic Journal Oct ober 1967
Wa shingt on
pp 259-68
Number-Equivalents Relative Entropy and Ra tios A Comp arison USifyen3 Market Performance bull
Southern Economic Journal July 1972 pp 107-11 2
Rosenbluth Gideon Measures of Concentrat ion in Business Concentration and Price NBeR Pri nceton Prlnceton University Press
Scnerer F M Industrial Market Structure and Economic Performance Ch 1c ag o
Schmalensee Ri chard Using the H-Index of Concen tr ation wi th Published Data Review of Economics and Statistics May 19 7 7 pp bull 18 6-9 3 bull
Stigler George The Me asureme nt of Con centra tion bull in his The of Homewood Irwin 196 8
us Bureau of the Census 1972 Census o f Manufactures 19 75
We iss Leo nard The Con centration-Profits ke lationship and Antitrust in Goldschrnid H J Mann H M and Weston J F Industrial Concentration The New Boston Little Brown 1974
-15shy
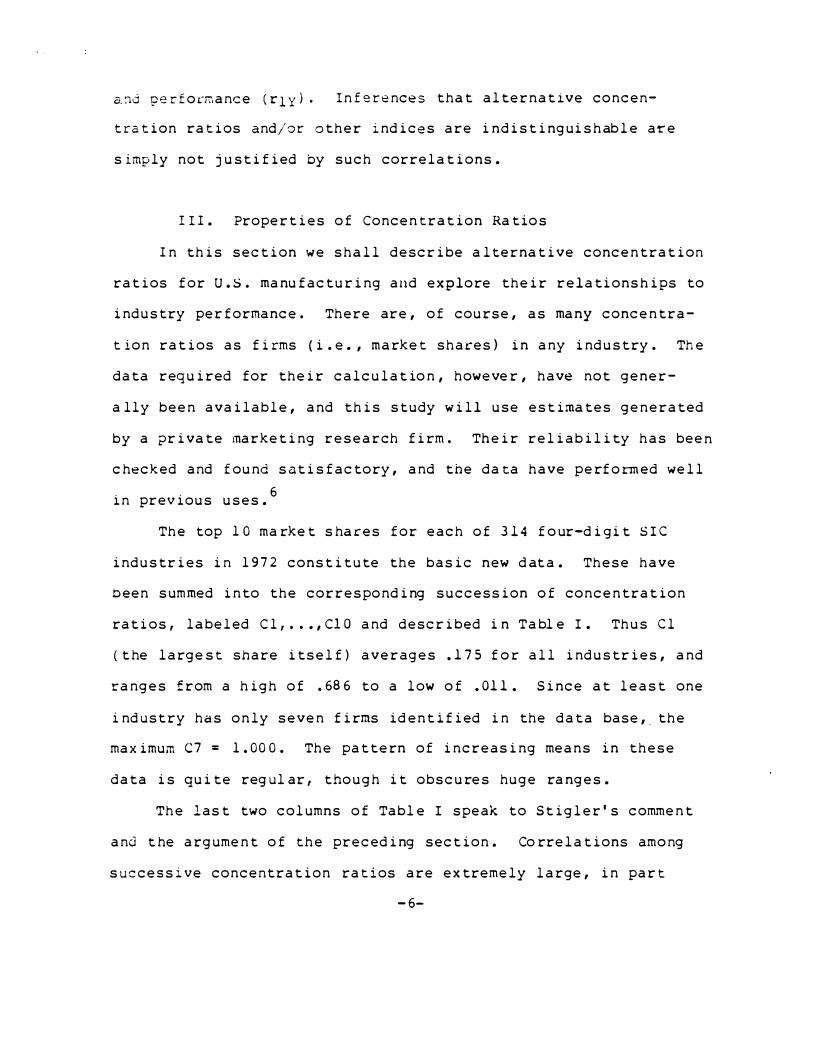

995
995
999
999
999
TABLE I
Descriptive Statistics of Concentration Ratios
Concentration Correlation Correlation Ratio Mean Max Min With C(n+l) With S(n+1)
Cl 175 686 011 965 702
C2 275 875 019 991 bull 708
C3 345 912 026 bull 61 4
C4 398 973 032 997 540
C5 440 bull 46 4037 998
041C6 474 999 299 I _I C7 502 1000 045 999 180
526 1000 049co
C9
087
546 1000 053 017
ClO 564 1000 057
because C(n) constitutes the largest component of C (n+l) The
correlations between any Cn) and the next share (n+l) however
are substantially different ranging from somewhat less for 52
and S3 to the vastly lower Stigler predicted in the case of
7smal ler shares Clearly succeeding shares are not d etershy
mined by any given concentration ratio and hence differen t
ratios em body di ffe ren t information about industry structure
In any event the preceding section cautions against conshy
c luding too much about rela tionships to industry performance from
such correlations A crucial test of alternative concentration
ratios li es in their rela tiv e anility to explain perf ormance
directly Our procedure is to build on the wel l -established
metho dology of pr1ce-cost ma rgin ana ly sis (Weiss 19 74 Kwoka
1979) by using different concentration ratios as alternative
explanatory va riables in the followi ng relationship
PCM = f(C KO GD GR MPT DUM) (3)
He re PCM = pr ice-cost ma rgin defined as industry value-ad ded
minus payrol l divided by value of shipments It
mea sur es the elevation of price over d irect cost a nd
hence (with some control factor s) the exercise of
market power rata are from the 1972 Census of
Manufactures 1975)
C = various concentration ratios
KO = capital-output ratio to correct PCM for intershy
industry differences in cap ital intens ity Data are
from Census of Manufactures (1975)
-8-
par
Industry
GD = geographical dispersion variable to reflect local
regional or national extent of market and thereby
correct Census data for scope of true econom1c
markets Its definition imp lies a ne gative sign
against PCM8
GR = a growth variable defined as the percenta ge change in
industry shipments between 19 67 and 1972 Theory
predicts more rapidly growing industries will have
higher margins middot
MPT = the market share of the midpoint plant size in the
indu stry to capture scale economies which require
different m inimum market shares in different
9 d1n ustr1es
DUM = zero for producer good industries one for consumer
goods industries This variable reflects the greater
importance of advertising outlays and product
differentiation in the latter Data are from FTC
Classification and Concentration (1967
Re gressions of equation 3 were performed on all ten conshy
centration ratios as reported in Table II Although Cl the
leading firm share has considerable strength and significance by
itself in explaining industry price-cost margins substantial
impr oveme nt occurs from using the two-firm concentration
ratio10 That statistic yields the highest R2 (175) and
t-value (243) of an y of the alternatives Furthermore the
-9-
H
(4 45) bull (306) (374)
3
4
1 6 5
7
9
lAULE I I
M ultivariate Regressions of Industry Price-Cost Marg ins on Various Concentration Hatios
Concentration Ha ti o KO GO GH MPl OUM CUNgtl
l 0906 Cl 0813 -0425 0530 0652 0394 2128
(193) (2 7 5) (291)
2 0 853 C2 0786 -0423 0515 o 5 41 o 391 2088
(243) (430) (306) (268) (230) (372)
_
16y
1 7 r)
064 7
(209)
CJ 0791
(430)
-0420
(302)
0529
(276)
056 8
(235)
OJ8 9
(370)
208U 1 71
o 515
( l 76)
C4 0800
(432)
-0419
(301)
05 38
(280)
06 03
(242)
0388
(368)
2094 16 u
0445 C 5 0806 -0420 0543 062 5 033 8 2095 166
I 0I
5
(157) (434) (302) (2 82) (2 48) (3 68)
6 0411 C6 0808 -04 20 0 5 47 0637 0389 2092
( 149) (434) (302) (284) (251) ( 3 6 u)
037 4 C7 0812 -0420 0550 065 5 038 9 2093 164
(137) (43 5) (301) (2 86) (2 51) (Jb8)
8 o 348 C8 0815 -0420 0552 06 70 038 209J 1 6 4
(127) (436) (301) (287) (262) ( 3 6 8)
163031 5 C9 0820 -00420 0556 0691 0389 209 7
(116) (4 39 ) (JOl) (2 88) (271 ) (368)
10 o 278 ClO 0827 -0420 05b0 0716 0389 2104 1 p 2 (103) (442) (301) (290) (2 82) (368)
pattecn of cesults w ith the moce inclusive concentcat ion catio
is pecfectly cegular w ith R2 decl ining fcom 175 w ith C2 co
1 62 w ith ClO Th e pecfocmance of the cead ily available concenshy
tcat ion cat ios foe four and eight ficms is distinctly infecioc to
that usin g C2 with C8 the wocst for being the largest aggcegat e
In deed wh ile C2 is significant at ovec 99 C4 is signif icant at
only 95 in a one-tail test an d C8 actual ly falls below 9 0
Th is occurs despite the fact that the pactial corcelation between
11C2 and C4 is 96 and that between C2 and ca is as It is
also wocth noting that all the control variables ace stable
s ignif icant and have the expected signs throughout In dustcy
macgins ace higher with lacger cap ital-output ratios less
geo gcaphical dispecsion faster
orientation
growth lacger scale economies
and a consumer goods to the industry
Thus the fact that C2s relationship to pric e-cost mar gins
is highly sign if icant and all these concentcat ion ratios are
highly correlated does not insure the emergence of a clear relashy
t ionship between these alternativ es and margins The more
inclus ive concentration ratios s imply ace too inclusive Adding
shaces not causally cela ted to performance adds random noise
which in suff icient amounts can drive even a significant undershy
ly ing variable (C2) to statistical insignificance (a s in C8)
Reseacch conf ined to the moce aggregated concentration rat ios
-11shy
--
and echanically ap lying conventio nal tests or significance
would in this case even be led to reject the hypothesis thak
121ndustr y concentration affects performance The mere fact
that the correlations between ratios were very high (as most
would surely characterize those just ment ioned) would be insufshy
ficient to draw the same conclusion regarding other--and more
a pp r opri ate measures of industry structure
v Conclusions
Th i s stu dy has demo trated that the choice of concentration
ratios can matter a great deal The usual ar gument for di smis sshy
ing the choice as unimport ant has been demons trated theoretically
incorr ect or at least incomplete Furthermore in pract ice the
choice is show n potentially cruci al to the strength of the relashy
tionsh ip found and in some circumstances even to whether a relashy
t ionship is uncove red at all Th is is n ot a trivial dismissab le
issue
The e co nomi c significan ce of the superi ority of the twoshy
firm concentra tion ratio is intriguing It suggests that an
i ndustr ys ability to coordinate behavi or and raise p rice-cost
margins above competitive levels may be determined not b y twenty
eight or even four firms but by the leading tw o This could
reflect the gr eater difficult y of securing and maintaining agreeshy
me nt amo ng more numerous rivals where even the third firm p os es
some problems such possibilities lie buried within conventional
concentrati on ra tios bu t their importance for pub lic p olicy
demonstrates the value of more disag gregated data
-12shy
Footnotes
l Weis s rev iew of 35 stud ies of us manufacturing ind stries reveals an overwhelming number which focused on the fourshyfirm concentration ratio (Weiss 1974 pp 204-20) More recent research maintains that patter n
2 Miller (1967) disaggregated the eight -firm concentration ratio and found that a large fifth-through-eighth firm group could exert a negative effect on industry performance This result sug gests that the four- and eight-firm ratios are fundamental ly different constructs
3 T w o exceptions to this view are Miller (1972) and Kwoka (1977)
4 In fairness Scherers comment was partially intended to contrast the more seriou s problems of n rket definit ion and contaminated data due to divers ified firms
5 This implies the following conditions
(a r1 1 gt 0
(b) r11 r22 - r21 r12 gt 0
(c) r11 r22 r33 + r12 r2y tyl + r21 ry2 r1y
-(rly r22 ry1 + r2y ry2 r11 + r12 r21 ryy) gt 0
For an elaboration see Ch iang (1972) pp 338-40
6 Fbr a desc ription of the nature and previous use of the data see Kwoka (1979
7 Also lower are correlations between nonsuccessive concentrashytion ratios eg the four eight and twenty firm versions
8 It is defined as the sum of absolute values of the differshyences in percentages of all manufacturing value added and a particular industrys value added for all four Census regions of the country Data are from the 1972 Census of Manufacturers (1975
9 This variable is the market share of the plant producing the fiftieth percentile of output in each industry as estimated from employment size classes of plants ln the Census of Manufactures
-13shy
10 Th ese resul s do not fully reflect the de ree of added R2explanatory power due to C2 vs Cl The of the
regres sion witnout either concentration ratio is 162middot _
While the addition of Cl raises this by 007 C2 causes R2
to increase by 013 a near doubli ng of the importance of the concentration itself
11 Although it is the partial correlations (holding the other independent variables constant) that are relevant to these multivariate relationships another common error in the literature is to note only the simp le correlation coefficients among structural measures In the present examp le they are larger yet The simp le correlation between C2 and C4 is 98 and between C2 and CS 93
12 Indeed the use of inappropriate concentration ratios might be a factor contributi ng to some findings of no such relationship See Weiss (1974) pp 203 ff
-14shy
1971 702-6
Quarterly 93-324
---o
-n In- du -st- r-y Pe-rf-ormance Economics
-- -------- --Concentration
Policy 1955
Rand McNal ly 19 70
Organization Industry
Learning
References
Bailey D and s E Boyle bullThe Op timal Me asure of ConceRtrashytion bull Journal of the American Statistical Association December pp
Bain Jo e s bullRe lation of Profit Rate to Industry Concentrashytion bull Journal of Economics August 195 1 pp 2
Chiang Alpha c Fundamental Methods of Mathematical Economics New York McGraw Hil l 1974
Kilpatrick R w The Choice Among Alternative Measure s of In dustrial Co ncentration bull Review of Economics and Statistics
May 1967 pp 258-60
Kwoka John E Jr bullLarge Firm Dominance and Price Cost
Journal July 197 7
pp 183-89
bullThe Effect of Market Share Distribution Review of and Statistics
Margins in Manufacturing Industriesbull Southern Economic
February 1979 pp 101-109
Miller Richard Marginal Concentration Ratios and Industry Profit Rates bull Southern Economic Journal Oct ober 1967
Wa shingt on
pp 259-68
Number-Equivalents Relative Entropy and Ra tios A Comp arison USifyen3 Market Performance bull
Southern Economic Journal July 1972 pp 107-11 2
Rosenbluth Gideon Measures of Concentrat ion in Business Concentration and Price NBeR Pri nceton Prlnceton University Press
Scnerer F M Industrial Market Structure and Economic Performance Ch 1c ag o
Schmalensee Ri chard Using the H-Index of Concen tr ation wi th Published Data Review of Economics and Statistics May 19 7 7 pp bull 18 6-9 3 bull
Stigler George The Me asureme nt of Con centra tion bull in his The of Homewood Irwin 196 8
us Bureau of the Census 1972 Census o f Manufactures 19 75
We iss Leo nard The Con centration-Profits ke lationship and Antitrust in Goldschrnid H J Mann H M and Weston J F Industrial Concentration The New Boston Little Brown 1974
-15shy
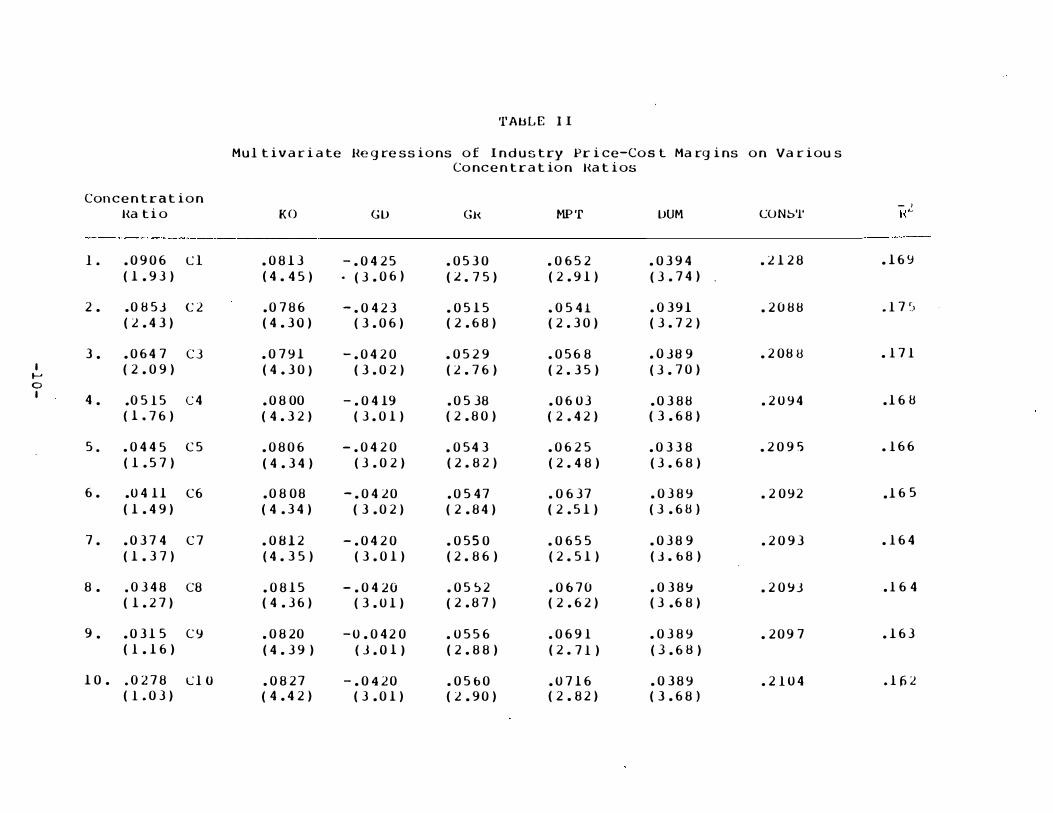