![Subgroups of direct products of two right-angled Artin groups · papar,[4], was the contrast between nitely presented and nitely generated subgroups. Finitely generated subgroups](https://static.fdocuments.us/doc/165x107/5f06640a7e708231d417c234/subgroups-of-direct-products-of-two-right-angled-artin-groups-papar4-was-the.jpg)
Does Taking Developmental Courses Improve the …...usually improve students’ chances of short-...
112
ACT Research Report Series 2016 (1) Julie Noble Does Taking Developmental Courses Improve the Success of Students Who First Enroll at Two-Year Colleges?
Transcript of Does Taking Developmental Courses Improve the …...usually improve students’ chances of short-...

ACT Research Report Series 2016 (1)
Julie Noble
Does Taking Developmental Courses Improve the Success of Students Who
First Enroll at Two-Year Colleges?

© 2016 by ACT, Inc. All rights reserved. 5191
Julie Noble, former Principal Research Scientist in the Statistical Research
Department, conducts research on course placement and postsecondary
success at two- and four-year institutions.
AcknowledgmentsThe author thanks Richard Sawyer, Justine Radunzel, and Jeff Allen for
their comments and suggestions on this research.

ContentsAbstract . . . . . . . . . . . . . . . . . . . . . . . . . . . . . . . . . . . . . . . . . . . . . . . . . . . . . . . . . . . . . . . . . . . . . . . . . . . . . . . . . . iv
Introduction . . . . . . . . . . . . . . . . . . . . . . . . . . . . . . . . . . . . . . . . . . . . . . . . . . . . . . . . . . . . . . . . . . . . . . . . . . . . . . 1
Developmental Courses and Two-Year College Students . . . . . . . . . . . . . . . . . . . . . . . . . . . . . . . . . 1
Data. . . . . . . . . . . . . . . . . . . . . . . . . . . . . . . . . . . . . . . . . . . . . . . . . . . . . . . . . . . . . . . . . . . . . . . . . . . . . . . . . . . . . . 2
ACT Compass Test Scores . . . . . . . . . . . . . . . . . . . . . . . . . . . . . . . . . . . . . . . . . . . . . . . . . . . . . . . . . . . . . . 2
Student Enrollment Status and Age . . . . . . . . . . . . . . . . . . . . . . . . . . . . . . . . . . . . . . . . . . . . . . . . . . . . . 3
College Course Pair Identification and Selection . . . . . . . . . . . . . . . . . . . . . . . . . . . . . . . . . . . . . . . . . 3
Course Grades . . . . . . . . . . . . . . . . . . . . . . . . . . . . . . . . . . . . . . . . . . . . . . . . . . . . . . . . . . . . . . . . . . . . . . . . . 4
Longitudinal College Outcomes . . . . . . . . . . . . . . . . . . . . . . . . . . . . . . . . . . . . . . . . . . . . . . . . . . . . . . . . . 5
Limitations of the Data . . . . . . . . . . . . . . . . . . . . . . . . . . . . . . . . . . . . . . . . . . . . . . . . . . . . . . . . . . . . . . . . . 6
Method . . . . . . . . . . . . . . . . . . . . . . . . . . . . . . . . . . . . . . . . . . . . . . . . . . . . . . . . . . . . . . . . . . . . . . . . . . . . . . . . . . 6
Student Age and Enrollment Status . . . . . . . . . . . . . . . . . . . . . . . . . . . . . . . . . . . . . . . . . . . . . . . . . . . . . 6
Descriptive Statistics . . . . . . . . . . . . . . . . . . . . . . . . . . . . . . . . . . . . . . . . . . . . . . . . . . . . . . . . . . . . . . . . . . . 7
Evaluating the Success of Developmental Students . . . . . . . . . . . . . . . . . . . . . . . . . . . . . . . . . . . . . 7
Propensity Scores . . . . . . . . . . . . . . . . . . . . . . . . . . . . . . . . . . . . . . . . . . . . . . . . . . . . . . . . . . . . . . . . . . . . . . 8
Success in the Higher-Level Course and Later Outcomes . . . . . . . . . . . . . . . . . . . . . . . . . . . . . . . . 9
Results . . . . . . . . . . . . . . . . . . . . . . . . . . . . . . . . . . . . . . . . . . . . . . . . . . . . . . . . . . . . . . . . . . . . . . . . . . . . . . . . . . . 9
Descriptive Results . . . . . . . . . . . . . . . . . . . . . . . . . . . . . . . . . . . . . . . . . . . . . . . . . . . . . . . . . . . . . . . . . . . . . 9
Models for Predicting Success in College . . . . . . . . . . . . . . . . . . . . . . . . . . . . . . . . . . . . . . . . . . . . . . 10
Estimated Probabilities of Success . . . . . . . . . . . . . . . . . . . . . . . . . . . . . . . . . . . . . . . . . . . . . . . . . . . . . 11
Discussion . . . . . . . . . . . . . . . . . . . . . . . . . . . . . . . . . . . . . . . . . . . . . . . . . . . . . . . . . . . . . . . . . . . . . . . . . . . . . . 28
Success in College Depends on Prior Academic Preparation . . . . . . . . . . . . . . . . . . . . . . . . . . . . 29
Simply Taking Developmental Courses Results in Few Long-Term Benefits . . . . . . . . . . . . . . . 30
The Benefit of Taking Developmental Courses Also Depends on the Grades Earned in Them . . . . . . . . . . . . . . . . . . . . . . . . . . . . . . . . . . . . . . . . . . . . . . . . . . . . . . . . . . . . 32
The Benefit of Developmental Courses Depends on Age and First-Year Enrollment Status . . . . . . . . . . . . . . . . . . . . . . . . . . . . . . . . . . . . . . . . . . . . . . . . . . . . . . . . . . . 32
Does Developmental Coursework Benefit Students? . . . . . . . . . . . . . . . . . . . . . . . . . . . . . . . . . . . . 33
References . . . . . . . . . . . . . . . . . . . . . . . . . . . . . . . . . . . . . . . . . . . . . . . . . . . . . . . . . . . . . . . . . . . . . . . . . . . . . 36
Appendix A . . . . . . . . . . . . . . . . . . . . . . . . . . . . . . . . . . . . . . . . . . . . . . . . . . . . . . . . . . . . . . . . . . . . . . . . . . . . . 40
Appendix B . . . . . . . . . . . . . . . . . . . . . . . . . . . . . . . . . . . . . . . . . . . . . . . . . . . . . . . . . . . . . . . . . . . . . . . . . . . . . 46
Appendix C . . . . . . . . . . . . . . . . . . . . . . . . . . . . . . . . . . . . . . . . . . . . . . . . . . . . . . . . . . . . . . . . . . . . . . . . . . . . . 51
Appendix D . . . . . . . . . . . . . . . . . . . . . . . . . . . . . . . . . . . . . . . . . . . . . . . . . . . . . . . . . . . . . . . . . . . . . . . . . . . . . 80
Appendix E . . . . . . . . . . . . . . . . . . . . . . . . . . . . . . . . . . . . . . . . . . . . . . . . . . . . . . . . . . . . . . . . . . . . . . . . . . . . . 86
Appendix F . . . . . . . . . . . . . . . . . . . . . . . . . . . . . . . . . . . . . . . . . . . . . . . . . . . . . . . . . . . . . . . . . . . . . . . . . . . . . 95

AbstractPostsecondary policymakers question whether subsidizing developmental education is a wise use of
public money. Some college systems have restricted developmental coursework to two-year colleges
and/or are exploring alternative delivery approaches to developmental education. Two-year colleges are
perceived as being better equipped and/or more cost-effective for providing developmental instruction.
A recent study (Noble & Sawyer, 2013) showed that completing a developmental course does not usually
improve students’ chances of short- and long-term success in college. However, particular subgroups
of students appeared to benefit from taking a developmental course. In this study, I examined whether
taking developmental courses benefits two-year students, and differentiated students by both enrollment
status and age. A higher percentage of two-year students than four-year students enroll in developmental
coursework, but less than one in four complete entry-level “gateway” courses within two years.
Data for the study consisted of ACT Compass® test and college outcomes data for 64,344 students
who first enrolled in one of thirty-seven two-year postsecondary institutions. The success of students
who initially enrolled in five lower-level (developmental) courses in English, mathematics, or reading
was compared with those of students who initially enrolled in associated higher-level courses. I first
estimated probabilities of success with respect to twenty outcome variables ranging from performance
in the associated higher-level college course to degree completion within particular periods of time. The
probabilities of success were conditioned on developmental course enrollment, ACT Compass test score,
age and enrollment status (full- or part-time), the grade received in the developmental course (if taken),
and other student characteristics. I then compared the probabilities of success of students who did and
did not first take the developmental course, but who otherwise were similar.
The results were similar to those found in the study previously cited: Positive benefits were found only for
higher-level course and grade point average (GPA) outcomes, and for specific course pairs. Any positive
benefits resulting from first taking the lower-level course disappeared over time, however. Moreover, a very
large percentage of students (35% to 55%) who took lower-level courses did not progress to any higher-
level courses in the same subject area. Those who did not progress were much less likely to be successful
in college in the long term. For all students who first enrolled in lower-level courses, as opposed to those
who progressed to the higher-level course, the probabilities of short- and long-term college success would
likely be much lower than those reported here.
Particular subgroups of students who took a lower-level course (as characterized by their ACT Compass
test scores, the grade they received in the course, and their age/enrollment status) did benefit from
taking the developmental course. In particular, students who received an A (or sometimes a B) grade in
the developmental course appeared to benefit from taking it. Furthermore, part-time students aged 21 or
younger appeared to derive more benefit from taking developmental courses than older students did, but
they had lower probabilities of success.
The report concludes with a discussion about possible contributing factors to academic success, including
academic supports and the noncognitive characteristics of two-year developmental students. Suggestions
for further research are also made.

1
IntroductionPostsecondary policymakers question whether subsidizing developmental education is a wise use of
public money. Estimated annual costs for developmental instruction range from $1.9 billion to nearly
$3 billion at two-year colleges to $500 million at four-year colleges (Bailey, Jeong, & Cho, 2010;
Strong American Schools, 2008). Facing demands for increasing graduation and retention rates,
some college systems have restricted developmental coursework to two-year colleges and/or are
exploring alternative delivery approaches such as modular, co-requisite, or integrated instructional
models (Bettinger & Long, 2005; Burdman, 2012; “Experts: Remedial college classes need fixing,”
2012; Fulton, Gianneschi, Blanco, & DeMaria, 2014; Merisotis & Phipps, 2000). Two-year colleges
are perceived as being better equipped and/or more cost-effective for providing developmental
instruction (e.g., Ignash, 1997; Vandal, 2010; Shults, 2000).
A recent study (Noble & Sawyer, 2013) showed that completing a developmental course does not
usually improve students’ chances of short- and long-term success in college. However, particular
subgroups of students (e.g., part-time students) appeared to benefit from taking a developmental
course. As the authors noted, most of the recent research on the effectiveness of developmental
instruction has focused on degree-seeking students and/or on full-time students. Research on
the success of nontraditional students is limited. In a recent survey of postsecondary institutions
(Fong, 2012), about 43% of responding institutions reported that they do not examine retention and
degree completion rates for nontraditional students. Over 75% did not know their current degree
completion rate for nontraditional students. Only 16% reported having a good understanding of why
their nontraditional students dropped out. Ironically, nontraditional students have been found to have
relatively low degree completion rates (Choy, 2002; Aud et al., 2012).This study examined whether
taking developmental courses benefits students who enroll in two-year colleges. Nearly two-thirds
of two-year students enroll in and complete developmental coursework, but only 22% also complete
entry-level “gateway” courses within two years. Only 9.5% of those who complete entry-level courses
complete a degree within three years (Fulton et al., 2014).
Developmental Courses and Two-Year College StudentsFor public two-year colleges, a majority (59%) of students enroll part-time, compared to slightly more
than one-third (36%) at public four-year colleges. In addition, 61% of nontraditional-aged two-year
college students enroll part-time, compared to 44% of similar traditional-aged students (National
Center for Education Statistics [NCES], 2010). The Noble and Sawyer (2013) study was limited in
that (1) student age wasn’t considered and (2) there were limited controls for possible confounding
characteristics of students who did/did not take a developmental course. I therefore considered
both student age and enrollment status to determine whether developmental coursework benefits
nontraditional and part-time students. I also accounted for other possible confounding student
characteristics when examining these relationships.

2
ACT Research Report Does Taking Developmental Courses Improve the Success of Students Who First Enroll at Two-Year Colleges?
Following the approach used by Noble and Sawyer (2013) and Perkhounkova, Noble, and Sawyer
(2006), I compared lower-level course students’ conditional probability of success (defined in various
ways) with the corresponding conditional probability of success of students with similar test scores
and other characteristics who enrolled directly into the corresponding higher-level course. Students
took the lower-level course either before or concurrently with the first time they took the higher-level
course.
Noble and Sawyer (2013) showed that developmental instruction was effective only for students
who earned an A grade and sometimes a B grade in the developmental course. The study also
examined lower-level courses with pass/fail grades as well as lower-level courses with A–F grades.
This approach was also planned for this study; however, there were insufficient students with
pass/fail grades and, of those, very few or no students failed the lower-level courses examined in
this study. Therefore, only A–F grades in lower-level courses were used as predictors. Descriptive
statistics provided in Appendices A and B include the results for students who took lower-level
courses with pass/fail grades.
Estimated conditional probabilities of success could be influenced by other variables, in addition to
test scores. Examples include background characteristics, high school coursework and grades, and
psychosocial and situational variables. Conditioning on other variables permits studying particular
groups of students, thereby yielding a more detailed and accurate description of the benefit of
developmental courses. I therefore explicitly conditioned on test score, part-time vs. full-time
enrollment status, and student age, as well as propensity scores (composites derived from other
student and institutional characteristics, described below).
DataData for this study consisted of the ACT Compass test and ACT® test student records and college
outcomes data for 64,344 students from thirty-seven two-year colleges from two public state
postsecondary systems; specifically, students enrolled as first-time entering freshmen between fall
2005 and fall 2009.1 These colleges primarily use ACT Compass test scores for course placement,
but also accept ACT scores for this purpose. One state also included limited data for private
two-year institutions. Both states are located in the south-central region of the United States. All
students initially enrolled at a two-year institution and were followed to other two- and four-year
institutions within the two state systems, if they transferred (or were dually enrolled). No data were
available on students who transferred to institutions outside the two state systems.
ACT Compass Test ScoresI used students’ ACT Compass Writing Skills, Pre-Algebra, Algebra, and Reading Skills scores to
predict later college outcomes. I did not use the ACT Compass College Algebra score as a predictor
because of limited use of this test by both states.
ACT Compass tests are modular; each test may be taken at a different time, and may be taken
multiple times. ACT Compass test scores were therefore limited to those with test dates within a
range of three years prior to the term date for the first course taken in a subject area to not more
1 The time span for follow-up data depended on the cohort year. Students and institutions were included only in analyses for which outcome data were available. Students were tracked for at least four years. (Four years for the 2009 cohort, five years for the 2008 cohort, six years for the 2007 cohort, seven years for the 2006 cohort, and eight years for the 2005 cohort).

3
than six weeks after the beginning of the term.2 Concordant ACT English, reading, and mathematics
scores were used for students with missing ACT Compass scores, or with ACT Compass scores that
did not comply with the range of test dates and term dates required for inclusion in the study.
Student Enrollment Status and AgeI classified students by full-time or part-time enrollment status using credit hours attempted during
their first fall and spring terms; credit hours earned was used if credit hours attempted was missing. I
classified students with fewer than 24 total credit hours attempted during the first year as part-time
and those with 24 attempted hours or more as full-time. Student age was categorized as less than
or equal to 21 years (≤ 21), 22–25 years, or greater than 25 years (> 25).
College Course Pair Identification and SelectionInstitutions provided complete college transcripts for all their enrolled students. Using the course
code list from ACT’s Course Placement Service® (ACT, 2015) and the course catalogs for the
institutions, I coded all courses as first-year vs. later, by level (developmental, standard college-
level, or honors), and by whether the course was specific to a particular program or major (e.g.,
mathematics for elementary school teachers). I retained for analysis only the developmental or
first-year college-level courses in English, mathematics, reading, and the social sciences that were
not specific to a particular program or college major.3 Conversely, I excluded seminars and other
developmental offerings (e.g., supplemental instruction) that could not be explicitly defined as a
course or associated with a particular subject area.
I identified courses with known sequencing (e.g., Arithmetic to Elementary Algebra or Developmental
English Composition to Standard English Composition) and retained the most frequently occurring
course sequences across institutions. I also required the selected courses to have data from
at least ten institutions. All institutions were required to have data for both the lower-level and
corresponding higher-level course (i.e., course pair) in a subject area, with a minimum sample size
of five students in the lower-level course. I excluded from the analyses students who skipped
courses in the mathematics sequence.4 Moreover, if students took more than two mathematics
courses in the mathematics course sequence, I used only the data for the first two courses, to avoid
having intervening coursework influence test score/course outcome relationships. For example, if
students took Arithmetic, Elementary Algebra, and Intermediate Algebra, I used only their data for
Arithmetic and Elementary Algebra. I also required, for each pair of lower- and higher-level courses,
that students took the lower-level course either before or concurrently with the first time they took
the higher-level course. For students who took a lower-level course multiple times, I retained data
from both the first time they took the course and from the last time they took the course prior to
(or concurrently with) taking the higher-level course. For the corresponding higher-level courses, I
retained data only from the first time students took the higher-level course.
2 For students with multiple scores on an ACT Compass test from administrations occurring within this item frame, the score closest in time to the start date of the relevant course was used.
3 I also excluded honors courses from the analyses.4 One might hypothesize that, given the outcomes shown here for developmental students who also took the higher-level course, it
is unlikely that the outcomes for students who skipped the higher-level course would be any better, assuming that the next course would be of greater difficulty. Further investigation would help to determine the probabilities of success of these students and the extent to which these students differed from those who took the higher-level course, in terms of prior academic preparation and other psychosocial characteristics.

4
ACT Research Report Does Taking Developmental Courses Improve the Success of Students Who First Enroll at Two-Year Colleges?
Five pairs of developmental courses and typical subsequent courses were examined in this study:
1. Developmental English Composition and Standard English Composition (N = 38,925)
2. Arithmetic and Elementary Algebra (N = 19,603)
3. Elementary Algebra and Intermediate Algebra (N = 18,299)
4. Intermediate Algebra and College Algebra (N = 21,070)
5. Developmental Reading and first social science course (N = 53,547).
For each course pair, I assembled data of three distinct groups of students: those who enrolled in the
lower- and higher-level courses, those who enrolled only in the higher-level course, and those who
enrolled only in the lower-level course.
For two of the three mathematics course pairs, the lower-level course and the higher-level course
were both developmental courses. To avoid confusion, the term “lower-level course” in this report
refers to the first course in each course pair, and the term “higher-level course” refers to the second
course in each pair. The higher-level course could be either a developmental or college-level course.
For course pair 5, six social science courses were considered as potential “first social science
courses”: American History, Other History, Psychology, Sociology, Political Science, and Economics.
The first social science course taken by a student was then identified; if more than one of these
social science courses was taken at that time, one of the courses was randomly selected for
inclusion in the course pair. Only those students who took one of the six social science courses
(alone or subsequent to taking Developmental Reading) were included in the analyses.
Course GradesI transformed A–F grades in the higher-level courses to two different levels of outcome variables:
a B or higher grade (successful) vs. less than a B grade (unsuccessful), and a C or higher grade
(successful) vs. less than a C grade (unsuccessful).5 For either level of outcome variable, I classified
withdrawals as unsuccessful. Pass/fail grades in higher-level courses occurred infrequently and
were excluded as outcomes.
For all lower-level courses, A–F grades from the last time the course was taken were retained in
their original form as predictor variables for the analyses. For predicting success in the lower-level
course, A–F and pass/fail grades from the first time the course was taken were recoded to B or
higher, C or higher, or pass/fail outcomes according to the same method described for higher-level
courses.6
As mentioned previously, for the models using lower-level course grade as predictors, the intent
was to develop separate models for students receiving A–F grades and for those receiving pass/
fail grades in the lower-level course. However, both the student sample sizes and the numbers of
institutions with pass/fail grades for these courses were much smaller than those with A–F grades.
In addition, there were virtually no failing students in the pass/fail courses; pass rates were .99
5 I also found grades that could not be converted to an A–F scale (e.g., audit, administrative withdrawal, etc.). We omitted these grades from the analyses.
6 W grades were included with A–F grades from the lower-level courses when recoded to success outcome variables and levels. Only those W grades from courses that predominantly used A–F grades were included. Those from courses that predominantly used pass/fail grades were excluded from the analyses. The percentages of W grades ranged from 3% in Developmental English Composition to 9% in Reading for the last time the course was taken. W grades were not included as predictors of success in higher-level courses or of other college outcomes.

5
or 1.00 for all five lower-level courses. Therefore, models could not be developed using pass/fail
grades as predictors.
We typically classify students who took the lower-level course in a course pair, but did not take
the higher-level course, as having an unsuccessful outcome. However, a large percentage of
students taking the lower-level course in a course pair did not progress to any higher-level course,
with percentages ranging from 35% for Developmental Reading/first social science course to
55% for Arithmetic/Elementary Algebra (see Appendices A and B; descriptive statistics for these
students are provided in Appendix B). Because of these very high percentages of students and
their relatively low college success rates, I could not include them in the models as unsuccessful
students. Therefore, interpretation of the results for higher-level course and subsequent outcomes
were limited to students who completed the lower-level course and who enrolled in the higher-level
course.
Longitudinal College OutcomesEach institution provided up to six years of long-term outcome data. The data included term-
by-term credit hours attempted, credit hours earned, re-enrollment indicators, cumulative GPAs,
and certificate (one state only), associate’s degree, or bachelor’s degree completion indicators.
From these variables, I coded several binary outcome variables. These outcome variables differed
somewhat from those used in the first study, to include those unique to two-year colleges and to
delineate results for retention and progress-to-degree outcomes. The outcomes studied included the
following:
• Earned a C or higher grade in the lower-level course
• Earned a B or higher grade in the lower-level course
• Earned a passing grade in the lower-level course (where data permitted)
• Earned a C or higher grade in the higher-level course
• Earned a B or higher grade in the higher-level course
• Earned 2.0 or higher Year 1 GPA (or last GPA, if Year 1 was not completed)
• Earned 3.0 or higher Year 1 GPA (or last GPA, if Year 1 was not completed)
• Earned 2.0 or higher Year 2 GPA
• Earned 3.0 or higher Year 2 GPA
• Earned 2.0 or higher Year 3 GPA
• Earned 3.0 or higher Year 3 GPA
• Persisted to Year 2 at any institution within the two state systems
• Persisted to Year 3 at any institution within the two state systems
• Progressed toward a degree at the end of Year 2 (i.e., completed 48 hours or more)
• Earned certificate within four, five, or six years (data for one state only)
• Earned associate’s degree within four, five, or six years7
• Earned associate’s or bachelor’s degree within four, five, or six years8
7 Associate’s degree completion within four, five, and six years was used to maximize success rates. Completion rates within three years were generally low.
8 Students who transferred to other two- or four-year institutions within the two states were followed to obtain their coursework and outcome data. Outcome data were not available for students who transferred to private, proprietary, or other out-of-state institutions.

6
ACT Research Report Does Taking Developmental Courses Improve the Success of Students Who First Enroll at Two-Year Colleges?
The last three sets of outcomes pertain to degree completion within specified time periods. For
the years spanning the data for this study, the Integrated Postsecondary Education Data System
(IPEDS) standard time frame for evaluating graduation rates was 150% of normal time. This
corresponds to associate’s degree completion in three years and bachelor’s degree completion in six
years. IPEDS now collects graduation rates from institutions at 100%, 150%, and 200% of normal
time.
Limitations of the Data The data for this study consisted of ACT Compass-tested college students who were enrolled
in two-year institutions from two south-central states. These two states also use ACT English,
mathematics, and reading scores for course placement. Although a large proportion of high school
graduates in both states take the ACT, it is not required for two-year college admission.
I focused on explicitly defined pairs of lower-level and higher-level courses in this research.
Developmental education is complex and is not limited to performance in lower- and higher-level
courses. I had no information about students’ participation in other educational support programs or
student services (e.g., learning communities, tutoring, etc.). Moreover, in using particular course pairs,
I did not study the content or level of other coursework taken, either within or across subjects. Either
of these conditions could have influenced students’ success in the higher-level course or later in
college.
The sample for this study represented ACT Compass- or ACT-tested enrolled students who
started their college experience at a two-year institution. Those students who did not take ACT
Compass or the ACT (two-year institutions in these states had the option of using other local
tests for placement), or ACT Compass-tested high school students (due to possible intervening
high school coursework), were not included in the sample. In addition, this study compares college
outcomes for students who did and did not first take a lower-level course. The extent to which these
two groups differ on characteristics not accounted for in the models could affect the results. For
example, several studies noted that students enrolled in developmental coursework are more likely
to be students with economic hardship (e.g., Bettinger & Long, 2007; Boylan, 1995; Ignash, 1997).
These students might benefit differently from developmental coursework than do students without
economic hardship. Differences on other student characteristics such as motivation or behavior
might also affect the results. Because data on such potential covariates were incomplete, I was
unable to include them in the models for this study.
Method
Student Age and Enrollment StatusStudent age and enrollment status were initially treated as separate predictor variables. However,
age and enrollment status were confounded in the data: Over 80% of students aged 22–25 or over
25 in the study were part-time students. To retain the enrollment status variable as much as possible,
the enrollment status categories for students aged 22–25 and over 25 were combined, resulting in
four categories: full-time and ≤ 21 years, part-time and ≤ 21 years, 22–25 years, and > 25 years.
These categories were transformed into three dummy variables, with students in the latter three age/
enrollment categories compared to students who were full-time and ≤ 21 years (the reference group).

7
Descriptive StatisticsI calculated sample sizes and means (or proportions), pooled across institutions, for each course
pair. These statistics were calculated separately for students who took the lower-level course prior
to taking the higher-level course, and for students who took only the higher-level course. Results for
students who took the lower-level course were further disaggregated by grade earned the last time
they took the course. Similar statistics were calculated for students who took the lower-level course
but did not progress to any higher-level course in the same subject area.
Evaluating the Success of Developmental Students I first estimated hierarchical logistic regression models for predicting students’ chances of a B or
higher, or C or higher, grade in each lower-level course the first time taken (see Noble & Sawyer,
2013 for a discussion about hierarchical logistic regression).9 The models included all students who
took the lower-level course (i.e., students who did not take any additional coursework in the same
subject area, as well as those who progressed to the subsequent higher-level course). The predictor
variables were ACT Compass test score, the age/enrollment status dummy variables, and propensity
score (described in the next section). Institution-specific mean values for each predictor variable
were also used to predict the outcomes. All student and institutional predictor variables were grand-
mean centered.
I then estimated hierarchical logistic regression models for predicting students’ probability of higher-
level course and subsequent success, described previously. For a given course pair, models were
based on students either enrolled in the lower-level course or in the higher-level course, or both. I
included a binary lower-level course predictor variable that identified students who did (1) and did
not (0) enroll in the lower-level course prior to taking the higher-level course. These models also
included ACT Compass test score, the age/enrollment status dummy variables, the propensity
score, and the interactions (products) of these variables and the developmental course variable.
The interactions identify potentially different effects of taking the lower-level course for different
combinations of student characteristics (e.g., part-time, older students who took the lower-level
course before taking the higher-level course). Additionally, I estimated models for students who first
took the lower-level course that also included the grade they received in the lower-level course (A–F
grade), the interactions of lower-level course grade with the age/enrollment status dummy variables
and propensity score, and the interaction of lower-level course grade with ACT Compass test score.
As noted above, institution-specific mean values for each predictor variable were used to predict
outcomes at the institution level. All student-level and institution-level predictor variables were grand-
mean centered. Student-level ACT Compass test score, lower-level course taken indicator variable,
propensity score, age/enrollment status, and lower-level course grade were retained in all relevant
models, regardless of their statistical significance, as they were the primary predictor variables in the
study.
Parsimonious models were developed by course pair; that is, one set of predictors was used for
all outcomes for a course pair.10 Institution- and student-level predictors were removed from the
9 Hierarchical regression models in this study describe the relationship between predictor variables and course/college outcomes and account for variation in these relationships across institutions.
10 This approach was used for practical reasons, due to the large number of models to be estimated, and to minimize overinterpretation of isolated but statistically significant results.

8
ACT Research Report Does Taking Developmental Courses Improve the Success of Students Who First Enroll at Two-Year Colleges?
model if the predictor was statistically significant (p < .01 for main effects; .05 for interactions and
institution-level predictors) for fewer than five outcomes for a course pair.11
Hierarchical models estimate both fixed effects (the average regression coefficients across
institutions) and random effects (the variability of the regression coefficients across institutions).
In this study, I first estimated random slope and random intercept models, but only the estimated
variability in the intercepts across institutions was significantly different from zero (p > .01) for most
models.12 Random intercept models were therefore estimated for all course pairs; non-statistically
significant random intercepts were noted.
Propensity ScoresPropensity score methodology is a technique to estimate the effect of a treatment or intervention
by accounting for covariates that predict receiving that treatment. Thus, these methods allow
researchers to control for potential bias due to important covariates not being included in the models
(i.e., omitted variable bias). For predicting college success outcomes, psychosocial and situational
variables would be important variables to consider; however, complete data were available for only a
few student and institutional characteristics. Using propensity regression methodology (Rosenbaum
& Rubin, 1983; Austin, 2011), propensity for taking a lower-level course was estimated for each
course pair using students’ ethnicity, gender, institution state, in-state vs. out-of-state enrollment, and
self-reported high school average. Multiple imputation was used to resolve missing data, primarily
for high school average.13,14 The propensity scores were then included as predictor variables in the
models.
Goodness-of-fit tests (average absolute standardized difference in predicted outcomes; Austin,
2008) were used to evaluate the fit of the propensity score models. Covariates for which the
difference exceeded 0.1 would reflect imbalance in the covariate between students who took the
lower- and higher-level course and those who took only the higher-level course.
To test the adequacy of the propensity scores, sensitivity analysis was used to determine the
sensitivity of the models to omitted variable bias in the models (Marcus, 1997). For each model,
the absolute value of the regression weight associated with the lower-level course indicator was
compared to the corresponding absolute value of the weight associated with propensity score.
Models for which the propensity score weight exceeded the lower-level course indicator weight
would reflect sensitivity to omitted variable bias.
Propensity scores in models for predicting higher-level course success and subsequent outcomes
were based on students who took the higher-level course, regardless of whether they took the
lower-level course. Students who took the lower-level course and did not progress to a subsequent
course in the same subject area were not included.
In contrast, for predicting success in the lower-level course, propensity scores were developed for
students who took the lower-level course, regardless of whether or not they took the higher-level
course, relative to all students who enrolled directly in the higher-level course. Though students
11 The estimated regression coefficient for the overall interaction term was statistically significantly different from zero, given the other predictors in the model.
12 Consistent with other ACT Compass research (Westrick & Allen, 2014).13 High school average was obtained from three sources: Students’ ACT Compass records, the ACT Course Grade Information Section
(if available), and the ACT Student Profile Section high school GPA range (if available). High school average was missing for 35% of student records.
14 Results are based on the first imputed data set only.

9
who took the higher-level course were not included in the models for predicting lower-level course
success, I used these propensity scores as predictors to control for student characteristics in the
lower-level course models, thus paralleling the controls used in the models for predicting higher-level
and subsequent college success.
Success in the Higher-Level Course and Later OutcomesAs noted earlier, a large percentage of students (35% to 55%) who took a lower-level course did
not progress beyond that course to a subsequent course in the same subject area; these students
were therefore unsuccessful with respect to success in the higher-level course. These students
were also less successful with respect to the longer-term success outcomes. The results reported
here for predicting success in the higher-level course (or success with respect to longer-term
outcomes) pertain only to the subset of lower-level course students who subsequently enrolled in
the higher-level course. Therefore, the results for these outcomes should be interpreted in light of
this restriction.
Results
Descriptive ResultsTables A-1 through A-5 in Appendix A provide pooled descriptive statistics for the five course
pairs. Each table contains the number of institutions, the number of students, and the means (or
proportions) for all predictor and outcome variables. These statistics are presented separately for
students who took the lower-level course before taking the associated higher-level course, and for
those who enrolled directly in the higher-level course, and excluding those who took the lower-level
course but did not progress to a different higher-level course. The statistics are also presented
separately according to the grading scale in the lower-level course (A–F or pass/fail). Descriptive
statistics are also reported in Appendix B, Tables B-1 through B-5, for students who took the lower-
level course but did not progress to a subsequent course in the same subject area.
According to the “No. of students” columns in Tables A-1 through A-5, the percentages of students
who took the lower-level course before taking the associated higher-level course ranged from 17%
for Developmental Reading/first social science course to 44% for Elementary Algebra/Intermediate
Algebra. Among the students who took the lower-level course before the higher-level course,
the percentage earning an A–F grade (vs. a pass/fail or other grade) also varied widely, ranging
from 69% (Developmental Reading/first social science course) to 91% (Elementary Algebra/
Intermediate Algebra).
Compared to two-year ACT Compass-tested freshmen nationally, the students in our sample who
enrolled in lower-level courses had lower average ACT Compass test scores. National average ACT
Compass Writing Skills, Reading, Pre-Algebra, and Algebra scores of two-year students in 2008-09
(ACT, 2009)15 were 60.36, 77.09, 44.79, and 31.83, respectively. However, students who received
A–F grades in the lower-level courses typically had somewhat higher average ACT Compass test
scores than all students who took the lower-level courses.16 In contrast, the average scores of
students in the sample who enrolled directly in the higher-level courses were higher than those of
15 ACT Compass national averages were not available for years prior to 2008-09.16 The exception was students who took Arithmetic, where average ACT Compass Pre-Algebra scores were similar.

10
ACT Research Report Does Taking Developmental Courses Improve the Success of Students Who First Enroll at Two-Year Colleges?
two-year ACT Compass-tested freshmen nationally, except for the average Pre-Algebra score of
students who enrolled directly into Elementary Algebra.
With the exception of Arithmetic/Elementary Algebra, students who first enrolled in a lower-level
course were much less likely to enroll full-time than students who enrolled directly in a higher-level
course (0.16 to 0.47 vs. 0.30 to 0.54, respectively). For Arithmetic/Elementary Algebra, the opposite
was true (0.21 and 0.13, respectively). In general, students who enrolled in Developmental English
Composition, Elementary Algebra (before Intermediate Algebra), and Intermediate Algebra (before
College Algebra) were older than students who enrolled directly into the associated higher-level
courses.
Students who take developmental courses in college typically have lower associate’s and five- and
six-year bachelor’s degree completion rates than students who take only higher-level courses,
possibly because developmental courses typically do not count towards a degree. As shown in
Tables A-1 through A-5, this was the case for three of the five course pairs. The exceptions were
Intermediate Algebra/College Algebra and Arithmetic/Elementary Algebra. However, certificate
completion rates for all five course pairs were comparable for students who first took the lower-level
course and those who enrolled directly in the higher-level course.
Of the total sample of students who took a lower-level course, 19,899 students (31%) failed to
progress beyond at least one lower-level course; 7,062 students (11%) did not progress in any
subject area. Of the non-progressing students, 30% to 40% did not have an A–F or pass/fail grade
the last time they took the lower-level course. They were typically part-time (about 8% full-time),
about age 21, had high school GPAs of about 2.50, and had lower than a C grade in the lower-level
course the last time they took it. Compared to lower-level students who did progress, those who did
not progress had lower average ACT Compass test scores, and they were also much less likely to be
full-time students (40% to 16% vs. 16% to 47%, respectively), but they differed only slightly in age.
Students who did not progress to any higher-level course in a subject area would be expected
to have lower college success rates that those who did progress. This was the case, as shown in
Tables B-1 through B-5. Students who did not progress to higher-level courses had substantially
lower college success rates than students who did progress (as shown in Tables A-1 through A-5).
For example, Year 2 and Year 3 re-enrollment rates of students who did not progress to higher-
level courses were one-third to one-half the magnitude of those of students who did progress. All
certificate and degree completion rates were less than .10 for students who did not progress.17
Models for Predicting Success in College Table C-1 in Appendix C summarizes the five hierarchical logistic regression models for predicting
success in lower-level courses. This table contains both the fixed effects (the estimated average
regression coefficients across all institutions) and the variance components (estimates of the
variance of the regression intercepts across institutions). Tables C-2, C-6, C-10, C-14, and C-18
summarize, by course pair, the fixed effects of the models for predicting success in college (e.g.,
success in the associated higher-level course, GPAs over time, retention, progress to degree, and
degree completion) for students who first enrolled in the lower-level course before enrolling in the
higher-level courses, and students who enrolled directly in the higher-level course. Tables C-3, C-7,
17 Some certificate programs at these institutions did not require students to complete higher-level courses, but only to take, for example, one mathematics course.

11
C-11, C-15, and C-19 summarize the variance component associated with the fixed effect coefficient
(intercept) in these models. These tables are structured similarly to Tables C-2, C-6, C-10, C-14,
and C-18. Tables C-4, C-8, C-12, C-16, and C-20 summarize the fixed effects of the models for
predicting success in college (e.g., success in the associated higher-level course, GPAs over time,
retention, and degree completion) only for students who took a lower-level course before taking
the associated higher-level course. Course grade (A–F grades) was included as a predictor in the
models. Tables C-5, C-9, C-13, C-17, and C-21 summarize the variance component associated with
the fixed effect coefficient (intercept) in these models.
Each table shows, for every outcome type and level, the institution-level and student-level
coefficients; for most course pairs, institution-level and student-level coefficients are shown on
adjacent pages. The coefficients that were not statistically significant are shaded. Student-level
interaction terms were removed from the models when the overall Type III coefficients for the
interaction terms were not statistically significant (p > .05). I also removed institution- and student-
level interaction terms from the models when they were not statistically significant for five or more
outcomes. As mentioned previously, student-level ACT Compass test score, lower-level course
taken indicator variable, propensity score, age/enrollment status, and lower-level course grade
were retained in all relevant models, regardless of statistical significance, as they were the primary
predictor variables in the study.
Estimated Probabilities of SuccessVariation across institutions. The intercept variances (right-most columns in Tables C-1, C-3, C-5,
C-7, C-9, C-11, C-13, C-15, C-17, C-19, and C-21) indicate that probabilities of success differed
across institutions. The magnitude of the variances suggests that the probability of success for
a typical student would vary by less than .10 among two-thirds of the institutions. Differences in
probabilities across institutions were somewhat larger for models excluding lower-level course grade
for predicting higher-level course outcomes and certificate completion. Arithmetic and Elementary
Algebra course pairs had the largest differences in probabilities of all the course pairs, with and
without including lower-level course grades as predictors, with a maximum difference in probabilities
across institutions of .28. English and Reading models that included lower-level course grade
also had larger differences across institutions; these differences did not exceed .16. Slopes of the
predictor variables did not differ significantly across institutions.
Fixed effects results. The fixed effects in Tables C-2, C-4, C-6, C-8, C-10, C-12, C-14, C-16,
C-18, and C-20 can be used to calculate estimated probabilities of success at typical institutions.
Distributions over students of probabilities of success for different course pairs and outcomes are
summarized in Appendix D. In this section, I illustrate and discuss the estimated probabilities for
different outcome variables and under different scenarios.
Age/enrollment status was an important predictor in most of the models. To simplify the discussion,
I focus on the college outcomes of typical (average) two-year college students in the next sections,
regardless of age/enrollment status. Following this discussion, I then report on the results among
the four age/enrollment status groups.

12
ACT Research Report Does Taking Developmental Courses Improve the Success of Students Who First Enroll at Two-Year Colleges?
Developmental Course Outcomes by ACT Compass Test Score.18 For all students who
took the lower-level course, ACT Compass test score was a statistically significant predictor of B
or higher, and C or higher, grade in the lower-level course (see Table C-1 in Appendix C).19 The
probability of a B or higher, or C or higher, grade increased as ACT Compass test score increased
(Figures 1 to 3). ACT Compass Pre-Algebra score was also positively associated with a passing
grade in Elementary Algebra (Figure 2); ACT Compass Algebra score was not a significant predictor
of passing Intermediate Algebra, possibly due to the very high pass rate for this course. Additionally,
based on the regression coefficients for age/enrollment status, part-time traditional (age ≤ 21) and
older students were less likely to be successful in lower-level courses than full-time, traditional-aged
students.
As illustrated in Figures 1 through 3, students had at least a .40 probability of achieving a C or
higher grade the first time they took the lower-level course, and at least a 0.25 to 0.30 probability
of achieving a B or higher grade.20 The course with the highest probabilities of success was
Developmental English Composition, with minimum probabilities of achieving a C or higher, or B or
higher, grade of .60 and .40, respectively. For three of the five courses (including Developmental
English Composition), students had at least a 0.50 probability of achieving a C or higher grade,
regardless of ACT Compass test score. In contrast, students with the highest ACT Compass test
scores had about a 0.55 to 0.60 probability of achieving a B or higher grade.
0.0
0.1
0.2
0.3
0.4
0.5
0.6
0.7
0.8
0.9
1.0
5 10 15 20 25 30 35 40 45 50 55 60 65 70 75
Pro
babi
lity
of S
ucce
ss
ACT Compass Writing Skills Score
Success in Developmental English Composition
C or Higher Grade B or Higher Grade
Figure 1. Probability of success in Developmental English Composition, first time taken, by ACT Compass Writing Skills score
18 Predictions of pass/fail grade in the lower-level course were not reported for Developmental English, Arithmetic, and Developmental Reading due to insufficient data.
19 Virtually all of the institution-level coefficients were not statistically significant (p > .05). Mean ACT Compass test score was retained in all models to ensure accurate estimation of error terms and significance tests.
20 For all graphs shown in this report, the probability curves are plotted for ACT Compass scores between the 5th and 95th percentiles for a given course pair and course group.

13
0.0
0.1
0.2
0.3
0.4
0.5
0.6
0.7
0.8
0.9
1.0
15 20 25 30 35 40 45 50 55 60 65 70 75
Pro
babi
lity
of S
ucce
ss
ACT Compass Pre-Algebra Score
Success in Arithmetic
C or Higher Grade B or Higher Grade
0.0
0.1
0.2
0.3
0.4
0.5
0.6
0.7
0.8
0.9
1.0
15 20 25 30 35 40 45 50 55 60 65 70 75
Pro
babi
lity
of S
ucce
ss
ACT Compass Pre-Algebra Score
Success in Elementary Algebra
C or Higher Grade B or Higher Grade Passing Grade
0.0
0.1
0.2
0.3
0.4
0.5
0.6
0.7
0.8
0.9
1.0
15 20 25 30 35 40 45 50 55
Pro
babi
lity
of S
ucce
ss
ACT Compass Algebra Score
Success in Intermediate Algebra
C or Higher Grade B or Higher Grade Passing Grade
Figure 2. Probability of success in Arithmetic, Elementary Algebra, and Intermediate Algebra, first time taken, by ACT Compass Pre-Algebra or Algebra score
0.0
0.1
0.2
0.3
0.4
0.5
0.6
0.7
0.8
0.9
1.0
35 40 45 50 55 60 65 70 75 80 85
Pro
babi
lity
of S
ucce
ss
ACT Compass Reading Score
Success in Developmental Reading
C or Higher Grade B or Higher Grade
Figure 3. Probability of success in Developmental Reading, first time taken, by ACT Compass Reading score
Higher-Level Course Outcomes by ACT Compass Test Score. As shown in Appendix B, ACT
Compass test score was a positive and statistically significant predictor of success for all of the
higher-level courses. This result pertains both to students who took the lower-level course prior to
enrolling in the higher-level course and to those who enrolled directly in the higher-level course,
as well as both B-or-higher and C-or-higher success outcomes. Moreover, score distributions for
students who first enrolled in lower-level mathematics courses substantially overlapped those for
students who enrolled directly in the associated higher-level courses, particularly at the lower end of
the distributions. The scores corresponding to the 5th percentiles for these course pairs differed by
only one to three score points.

14
ACT Research Report Does Taking Developmental Courses Improve the Success of Students Who First Enroll at Two-Year Colleges?
For the Developmental English Composition/Standard English Composition, Elementary Algebra/
Intermediate Algebra, and Developmental Reading/first social science course pairs, students who
first took the lower-level course before taking the higher-level course, on average, had significantly
(p < .01) higher probabilities of success in the higher-level course than those expected of similar
students who enrolled directly into the course. This result was true of both the B-or-higher and the
C-or-higher success criteria. For the other two course pairs, students who first took the lower-level
course had similar or slightly lower probabilities.
Figures 4, 5, 6, and 7 and Appendix D illustrate this finding. In these and subsequent figures, red and
navy solid and dashed lines reflect the middle 90% of observed scores. The navy solid lines show
estimated probabilities of success for students who enrolled directly in the higher-level course. The
red solid lines show estimated probabilities of success for students who first took the lower-level
course. Dashed navy lines represent extrapolation to scores of students who enrolled in the lower-
level course, illustrating their probability of success, had they enrolled directly in the higher-level
course
As shown in Figure 4, students with an ACT Compass Writing Skills score between 10 and 74 had
over a .60 probability of a C or higher grade in Standard English Composition, regardless of ACT
Compass Writing Skills score and whether they had taken Developmental English Composition prior
to taking it. However, for students who first enrolled in Developmental English Composition, their
probability of a C or higher grade was typically 0.10 higher than that expected for similar students
who enrolled directly into the higher-level course. This difference in probability also depended
on ACT Compass Writing Skills score, with larger differences occurring for students with lower
scores.21 Similar results were found for the B or higher outcome, with similar to slightly larger group
differences in probability of success.
0.0
0.1
0.2
0.3
0.4
0.5
0.6
0.7
0.8
0.9
1.0
5 10 15 20 25 30 35 40 45 50 55 60 65 70 75 80 85 90 95 100
Pro
babi
lity
of a
C o
r Hig
her G
rade
ACT Compass Writing Skills Score
Standard English Composition C or Higher Grade
Took Developmental English and Standard English
Took Standard English Only
Extrapolated Probability of Success if Developmental English Not Taken
0.0
0.1
0.2
0.3
0.4
0.5
0.6
0.7
0.8
0.9
1.0
5 10 15 20 25 30 35 40 45 50 55 60 65 70 75 80 85 90 95 100
Pro
babi
lity
of a
B o
r Hig
her G
rade
ACT Compass Writing Skills Score
Standard English Composition B or Higher Grade
Took Developmental English and Standard English
Took Standard English Only
Extrapolated Probability of Success if Developmental English Not Taken
Figure 4. Probability of success in Standard English Composition with and without taking Developmental English Composition
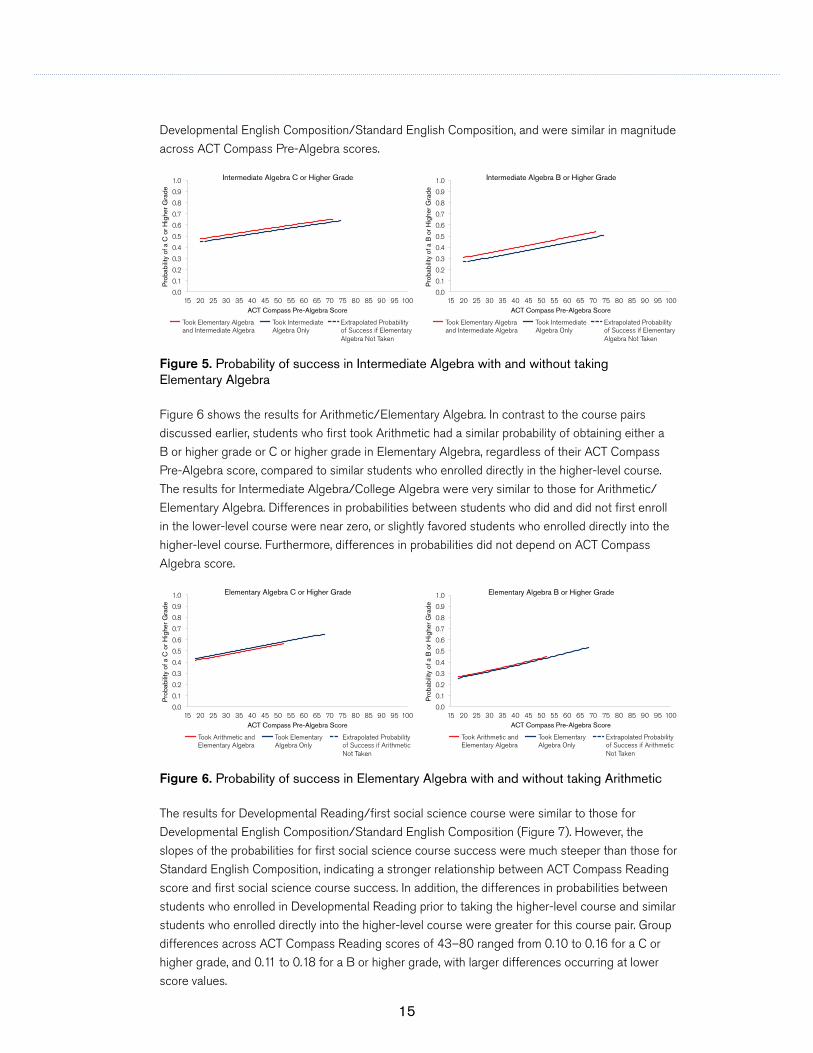
I found similar results for Elementary Algebra/Intermediate Algebra (Figure 5). For students who
first enrolled in Elementary Algebra prior to taking Intermediate Algebra, their probability of a
C or higher grade was 0.02 to 0.03 points higher than those expected for similar students who
enrolled directly into Intermediate Algebra, and 0.04 to 0.05 points for a B or higher grade. Though
statistically significant (p < .01), these differences in probabilities were smaller than those found for
21 Although differences in probabilities for those taking and not taking the lower-level course before the higher-level course were, on average, statistically significant (p<.01), conditional differences in probabilities between the two groups for particular test scores might not be. Confidence bands around the conditional probabilities would be the appropriate test, but were of lesser interest here, and would overcomplicate the interpretability of the figures.
15
Developmental English Composition/Standard English Composition, and were similar in magnitude
across ACT Compass Pre-Algebra scores.
0.0
0.1
0.2
0.3
0.4
0.5
0.6
0.7
0.8
0.9
1.0
15 20 25 30 35 40 45 50 55 60 65 70 75 80 85 90 95 100
Pro
babi
lity
of a
C o
r Hig
her G
rade
ACT Compass Pre-Algebra Score
Intermediate Algebra C or Higher Grade
Took Elementary Algebra and Intermediate Algebra
Took Intermediate Algebra Only
Extrapolated Probability of Success if Elementary Algebra Not Taken
0.0
0.1
0.2
0.3
0.4
0.5
0.6
0.7
0.8
0.9
1.0
15 20 25 30 35 40 45 50 55 60 65 70 75 80 85 90 95 100
Pro
babi
lity
of a
B o
r Hig
her G
rade
ACT Compass Pre-Algebra Score
Intermediate Algebra B or Higher Grade
Took Elementary Algebra and Intermediate Algebra
Took Intermediate Algebra Only
Extrapolated Probability of Success if Elementary Algebra Not Taken
Figure 5. Probability of success in Intermediate Algebra with and without taking Elementary Algebra
Figure 6 shows the results for Arithmetic/Elementary Algebra. In contrast to the course pairs
discussed earlier, students who first took Arithmetic had a similar probability of obtaining either a
B or higher grade or C or higher grade in Elementary Algebra, regardless of their ACT Compass
Pre-Algebra score, compared to similar students who enrolled directly in the higher-level course.
The results for Intermediate Algebra/College Algebra were very similar to those for Arithmetic/
Elementary Algebra. Differences in probabilities between students who did and did not first enroll
in the lower-level course were near zero, or slightly favored students who enrolled directly into the
higher-level course. Furthermore, differences in probabilities did not depend on ACT Compass
Algebra score.
0.0
0.1
0.2
0.3
0.4
0.5
0.6
0.7
0.8
0.9
1.0
15 20 25 30 35 40 45 50 55 60 65 70 75 80 85 90 95 100
Pro
babi
lity
of a
C o
r Hig
her G
rade
ACT Compass Pre-Algebra Score
Elementary Algebra C or Higher Grade
Took Arithmetic and Elementary Algebra
Took Elementary Algebra Only
Extrapolated Probability of Success if Arithmetic Not Taken
0.0
0.1
0.2
0.3
0.4
0.5
0.6
0.7
0.8
0.9
1.0
15 20 25 30 35 40 45 50 55 60 65 70 75 80 85 90 95 100
Pro
babi
lity
of a
B o
r Hig
her G
rade
ACT Compass Pre-Algebra Score
Elementary Algebra B or Higher Grade
Took Arithmetic and Elementary Algebra
Took Elementary Algebra Only
Extrapolated Probability of Success if Arithmetic Not Taken
Figure 6. Probability of success in Elementary Algebra with and without taking Arithmetic
The results for Developmental Reading/first social science course were similar to those for
Developmental English Composition/Standard English Composition (Figure 7). However, the
slopes of the probabilities for first social science course success were much steeper than those for
Standard English Composition, indicating a stronger relationship between ACT Compass Reading
score and first social science course success. In addition, the differences in probabilities between
students who enrolled in Developmental Reading prior to taking the higher-level course and similar
students who enrolled directly into the higher-level course were greater for this course pair. Group
differences across ACT Compass Reading scores of 43–80 ranged from 0.10 to 0.16 for a C or
higher grade, and 0.11 to 0.18 for a B or higher grade, with larger differences occurring at lower
score values.

16
ACT Research Report Does Taking Developmental Courses Improve the Success of Students Who First Enroll at Two-Year Colleges?
0.0
0.1
0.2
0.3
0.4
0.5
0.6
0.7
0.8
0.9
1.0
35 40 45 50 55 60 65 70 75 80 85 90 95 100
Pro
babi
lity
of a
C o
r Hig
her G
rade
ACT Compass Reading Score
First Social Science Course C or Higher Grade
Took Developmental Reading and First Social Science Course
Took First Social Science Course Only
Extrapolated Probability of Success if Developmental Reading Not Taken
0.0
0.1
0.2
0.3
0.4
0.5
0.6
0.7
0.8
0.9
1.0
35 40 45 50 55 60 65 70 75 80 85 90 95 100
Pro
babi
lity
of a
B o
r Hig
her G
rade
ACT Compass Reading Score
First Social Science Course B or Higher Grade
Took Developmental Reading and First Social Science Course
Took First Social Science Course Only
Extrapolated Probability of Success if Developmental Reading Not Taken
Figure 7. Probability of success in first social science course with and without taking Developmental Reading
Lower-Level Course Grades as Predictors of Success in Higher-Level Courses. Across all
course pairs, the probability of success in the higher-level course for students who took the lower-
level course also depended on the A–F grade they received in the lower-level course.
For most course pairs, the probability of earning a B or higher or C or higher grade in the higher-
level course also depended on ACT Compass test score when lower-level course grade was
included in the models. There were two exceptions: ACT Compass Writing skills score was not a
statistically significant predictor of success in Standard English Composition after Developmental
English Composition grade was added to the models. For Elementary Algebra/Intermediate Algebra,
ACT Compass test score was a significant predictor of a B or higher grade (p < .01) when lower-
level course grade was included in the model, but not for a C or higher grade. For all course pairs,
the test score by lower-level course grade interaction was not statistically significant (p > .05), i.e.,
differences in probabilities among lower-level course grades did not vary by ACT Compass test
score.
In general, even for those outcomes where ACT Compass test score was statistically significant,
the slopes of the probability curves were flatter than those when lower-level course grade was
not included. This finding was not surprising, given that taking the lower-level course, and the
corresponding grade received, occurred closer in time to the subsequent college outcomes, relative
to the test date for the corresponding ACT Compass score.
For all course pairs, students who received an A grade in the lower-level course had a higher
probability of success in the higher-level course than did similar students who enrolled directly in the
higher-level course. Students who received a B grade in Arithmetic also had a consistently higher
probability of success in Elementary Algebra. For all other course pairs and outcome levels, only
students with a B grade in the lower-level course and lower ACT Compass scores (typically below
the median score for the lower-level course) had higher probabilities of success. Students with a C
grade consistently had lower probabilities than those who enrolled directly in Elementary Algebra.
Figure 8 illustrates these findings for Arithmetic/Elementary Algebra (both outcome levels; see also
Table D-2 in Appendix D).

17
0.0
0.1
0.2
0.3
0.4
0.5
0.6
0.7
0.8
0.9
1.0
15 20 25 30 35 40 45 50 55 60 65 70 75 80 85 90 95 100
Pro
babi
lity
of a
C o
r Hig
her G
rade
ACT Compass Pre-Algebra Score
Elementary Algebra C or Higher Grade
Took Elementary Algebra Only
A Grade in Arithmetic
B Grade in Arithmetic
C Grade in Arithmetic
0.0
0.1
0.2
0.3
0.4
0.5
0.6
0.7
0.8
0.9
1.0
15 20 25 30 35 40 45 50 55 60 65 70 75 80 85 90 95 100
Pro
babi
lity
of a
B o
r Hig
her G
rade
ACT Compass Pre-Algebra Score
Elementary Algebra B or Higher Grade
Took Elementary Algebra Only
A Grade in Arithmetic
B Grade in Arithmetic
C Grade in Arithmetic
Figure 8. Probability of success in Elementary Algebra by Arithmetic grade and ACT Compass Pre-Algebra score
In Figure 8, probabilities of a B or higher grade for students who enrolled directly in Elementary
Algebra ranged from 0.26 to 0.55 across ACT Compass Pre-Algebra scores of 19 to 71. The
corresponding probabilities of success for students who first took Arithmetic and received an A
grade ranged from 0.49 to 0.67, and ranged from 0.30 to 0.48 for those who received a B grade.
Therefore, grades of A and B were the only grades where the probabilities of a B or higher grade
for students who first took Arithmetic always exceeded those for students who enrolled directly in
Elementary Algebra. Probabilities associated with a B or higher grade were only slightly higher than
those for students enrolling in the higher-level course. The results for C or higher grade followed a
similar trend, but with considerably higher probabilities for both groups of students. ACT Compass
test score was not a statistically significant predictor of a C or higher grade in Elementary Algebra,
when grade earned in Arithmetic was included in the model.
Figure 9 for Developmental Reading/first social science course illustrates the more typical results
for the other course pairs. Students with an A grade in Developmental Reading had a higher
probability of success (both B or higher, and C or higher, grade) in their first social science course
than similar students who enrolled directly in it. Students with a B grade in Developmental Reading
also had higher probabilities, but only for those with ACT Compass Reading scores of less than 69
(see also Appendix D, Table D-5).
0.0
0.1
0.2
0.3
0.4
0.5
0.6
0.7
0.8
0.9
1.0
35 40 45 50 55 60 65 70 75 80 85 90 95 100
Pro
babi
lity
of a
C o
r Hig
her G
rade
ACT Compass Reading Score
First Social Science Course C or Higher Grade
Took First Social Science Course Only
A Grade in Developmental Reading
B Grade in Developmental Reading
C Grade in Developmental Reading
0.0
0.1
0.2
0.3
0.4
0.5
0.6
0.7
0.8
0.9
1.0
35 40 45 50 55 60 65 70 75 80 85 90 95 100
Pro
babi
lity
of a
B o
r Hig
her G
rade
ACT Compass Reading Score
First Social Science Course B or Higher Grade
Took First Social Science Course Only
A Grade in Developmental Reading
B Grade in Developmental Reading
C Grade in Developmental Reading
Figure 9. Probability of success in first social science course by Developmental Reading grade and ACT Compass Reading score
18
ACT Research Report Does Taking Developmental Courses Improve the Success of Students Who First Enroll at Two-Year Colleges?
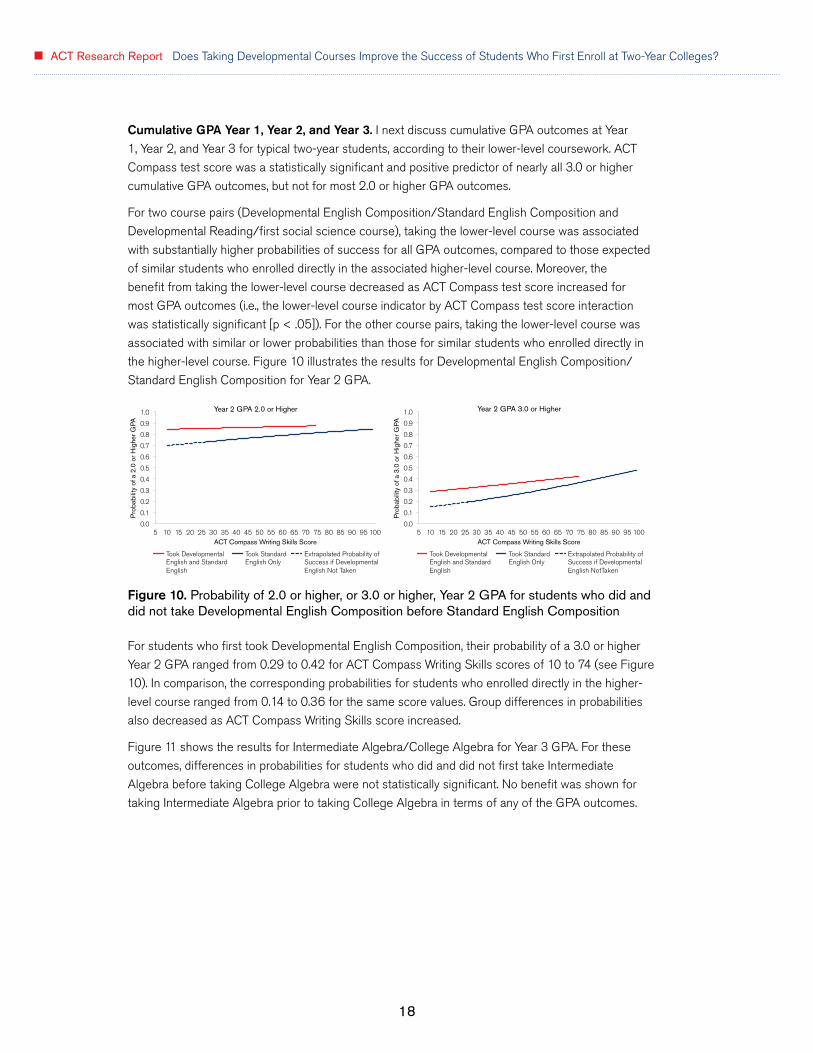
Cumulative GPA Year 1, Year 2, and Year 3. I next discuss cumulative GPA outcomes at Year
1, Year 2, and Year 3 for typical two-year students, according to their lower-level coursework. ACT
Compass test score was a statistically significant and positive predictor of nearly all 3.0 or higher
cumulative GPA outcomes, but not for most 2.0 or higher GPA outcomes.
For two course pairs (Developmental English Composition/Standard English Composition and
Developmental Reading/first social science course), taking the lower-level course was associated
with substantially higher probabilities of success for all GPA outcomes, compared to those expected
of similar students who enrolled directly in the associated higher-level course. Moreover, the
benefit from taking the lower-level course decreased as ACT Compass test score increased for
most GPA outcomes (i.e., the lower-level course indicator by ACT Compass test score interaction
was statistically significant [p < .05]). For the other course pairs, taking the lower-level course was
associated with similar or lower probabilities than those for similar students who enrolled directly in
the higher-level course. Figure 10 illustrates the results for Developmental English Composition/
Standard English Composition for Year 2 GPA.
0.0
0.1
0.2
0.3
0.4
0.5
0.6
0.7
0.8
0.9
1.0
5 10 15 20 25 30 35 40 45 50 55 60 65 70 75 80 85 90 95 100
Pro
babi
lity
of a
2.0
or H
ighe
r GPA
ACT Compass Writing Skills Score
Year 2 GPA 2.0 or Higher
Took Developmental English and Standard English
Took Standard English Only
Extrapolated Probability of Success if Developmental English Not Taken
0.0
0.1
0.2
0.3
0.4
0.5
0.6
0.7
0.8
0.9
1.0
5 10 15 20 25 30 35 40 45 50 55 60 65 70 75 80 85 90 95 100
Pro
babi
lity
of a
3.0
or H
ighe
r GPA
ACT Compass Writing Skills Score
Year 2 GPA 3.0 or Higher
Took Developmental English and Standard English
Took Standard English Only
Extrapolated Probability of Success if Developmental English NotTaken
Figure 10. Probability of 2.0 or higher, or 3.0 or higher, Year 2 GPA for students who did and did not take Developmental English Composition before Standard English Composition
For students who first took Developmental English Composition, their probability of a 3.0 or higher
Year 2 GPA ranged from 0.29 to 0.42 for ACT Compass Writing Skills scores of 10 to 74 (see Figure
10). In comparison, the corresponding probabilities for students who enrolled directly in the higher-
level course ranged from 0.14 to 0.36 for the same score values. Group differences in probabilities
also decreased as ACT Compass Writing Skills score increased.
Figure 11 shows the results for Intermediate Algebra/College Algebra for Year 3 GPA. For these
outcomes, differences in probabilities for students who did and did not first take Intermediate
Algebra before taking College Algebra were not statistically significant. No benefit was shown for
taking Intermediate Algebra prior to taking College Algebra in terms of any of the GPA outcomes.

19
0.0
0.1
0.2
0.3
0.4
0.5
0.6
0.7
0.8
0.9
1.0
15 20 25 30 35 40 45 50 55 60 65 70 75 80 85 90 95 100
Pro
babi
lity
of a
2.0
or H
ighe
r GPA
ACT Compass Algebra Score
Year 3 GPA 2.0 or Higher
Took Intermediate Algebra and College Algebra
Took College Algebra Only
Extrapolated Probability of Success if Intermediate Algebra Not Taken
0.0
0.1
0.2
0.3
0.4
0.5
0.6
0.7
0.8
0.9
1.0
15 20 25 30 35 40 45 50 55 60 65 70 75 80 85 90 95 100
Pro
babi
lity
of a
3.0
or H
ighe
r GPA
ACT Compass Algebra Score
Year 3 GPA 3.0 or Higher
Took Intermediate Algebra and College Algebra
Took College Algebra Only
Extrapolated Probability of Success if Intermediate Algebra Not Taken
Figure 11. Probability of 2.0 or higher, or 3.0 or higher, Year 3 GPA for students who did and did not take Intermediate Algebra before College Algebra
Lower-Level Course Grades as Predictors of Cumulative GPA Outcomes. Across all course
pairs, the probability of successful cumulative GPA outcomes for students who took the lower-level
course also depended on the A–F grade they received in the lower-level course.
ACT Compass test score was not a positive and significant predictor of most cumulative GPA
outcomes, when lower-level course grade was included in the model. The exception was
Developmental English Composition/Standard English Composition for Year 1 and Year 2 GPA
outcomes (both 2.0 or higher and 3.0 or higher), and Elementary Algebra/Intermediate Algebra for
Year 3 GPA, for both outcome levels.
For all course pairs, students who received an A grade in the lower-level course had a consistently
higher probability of a 2.0 or higher or 3.0 or higher GPA in Year 1, Year 2, and Year 3 than did
similar students who enrolled directly in the higher-level course (see Tables D-1 through D-5
in Appendix D). Students who received a B grade in Arithmetic also had a consistently higher
probability for these outcomes. For other course pairs (except Intermediate Algebra/College
Algebra), only students with lower ACT Compass scores who received a lower-level course grade of
B had higher probabilities of success for the Year 1, Year 2, and Year 3 GPA outcomes.
Figures 12 and 13 summarize the results for Developmental English Composition/Standard English
Composition for Year 2 GPA of 3.0 or higher and Intermediate Algebra/College Algebra for Year 1
GPA of 2.0 or higher.
0.0
0.1
0.2
0.3
0.4
0.5
0.6
0.7
0.8
0.9
1.0
5 10 15 20 25 30 35 40 45 50 55 60 65 70 75 80 85 90 95 100
Pro
babi
lity
of a
3.0
or H
ighe
r GPA
ACT Compass Writing Skills Score
Year 2 GPA 3.0 or Higher
Took Standard English Only
A Grade in Developmental English
B Grade in Developmental English
C Grade in Developmental English
Figure 12. Probability of a Year 2 GPA of 3.0 or higher by Developmental English Composition grade and ACT Compass Writing Skills score

20
ACT Research Report Does Taking Developmental Courses Improve the Success of Students Who First Enroll at Two-Year Colleges?
As shown in Figure 12, probabilities of a 3.0 or higher Year 2 GPA associated with a Developmental
English Composition grade of A were consistently higher than those for similar students who
enrolled directly in Standard English Composition, with differences decreasing slightly as ACT
Compass Writing Skills score increased from 10 to 79. Probabilities associated with a lower-level
course grade of B were higher only for students with ACT Compass Writing Skills scores of less
than 37.
0.0
0.1
0.2
0.3
0.4
0.5
0.6
0.7
0.8
0.9
1.0
15 20 25 30 35 40 45 50 55 60 65 70 75 80 85 90 95 100
Pro
babi
lity
of a
2.0
or H
ighe
r GPA
ACT Compass Algebra Score
Year 1 GPA 2.0 or Higher
Took College Algebra Only
A Grade in Intermediate Algebra
B Grade in Intermediate Algebra
C Grade in Intermediate Algebra
Figure 13. Probability of a Year 1 GPA of 2.0 or higher by Intermediate Algebra grade and ACT Compass Algebra score
For Intermediate Algebra/College Algebra, probabilities of a Year 1 GPA of 2.0 or higher were very
high, regardless of Intermediate Algebra grade. Probabilities were 0.78, 0.86, and 0.91 for students
with Intermediate Algebra grades of C, B, and A, respectively, for ACT Compass Algebra scores
ranging from 16 to 57. Probabilities for students who enrolled directly into College Algebra ranged
from 0.85 to 0.87 for the same score values, with lower-level course grade of A having probabilities
that exceeded those for students who took only the higher-level course.
The findings related to lower-level course grade for the other course pairs were similar to those for
these course pairs: The A and B grade findings for 3.0 or higher GPA results paralleled those for
Developmental English Composition/Standard English Composition, and the A grade results for 2.0
or higher GPA paralleled those for Intermediate Algebra/College Algebra.
Early College Outcomes. I next discuss re-enrolling Year 2 or Year 3, and progressing to degree by
the end of Year 2, relative to lower-level coursework of typical two-year students.
The probabilities of success for re-enrolling Year 2 and Year 3, and progress to degree, differed
substantially from those for cumulative GPA outcomes. Across course pairs, ACT Compass test
score was either not related or slightly negatively related to re-enrolling Year 2; however, ACT
Compass test score was positively related to re-enrolling Year 3 for three of the course pairs, and
to progressing to degree at the end of Year 2 for four of the course pairs. The negative and non-
significant results are likely due to lower re-enrollment rates for higher-achieving students (possibly
transferring to proprietary schools and/or out of state), and the criteria used to determine progress
to degree.
For Developmental English Composition/Standard English Composition, taking the lower-level
course was associated with higher probabilities of success than those of similar students who
enrolled directly in the higher-level course. This finding was seen for all three early college outcomes.
The benefit from taking the lower-level course decreased as ACT Compass test score increased (i.e.,
the lower-level course indicator by ACT Compass test score interaction was statistically significant

21
(p < .05). For the other course pairs, taking the lower-level course was associated with similar or
lower probabilities than those for similar students who enrolled in the higher-level course.
Figures 14 and 15 illustrate the results for Elementary Algebra/Intermediate Algebra and re-
enrolling Year 2, and Developmental English Composition/Standard English Composition for re-
enrolling Year 3.
0.0
0.1
0.2
0.3
0.4
0.5
0.6
0.7
0.8
0.9
1.0
15 20 25 30 35 40 45 50 55 60 65 70 75 80 85 90 95 100
Pro
babi
lity
of R
e-E
nrol
ling
Year
2
ACT Compass Pre-Algebra Score
Re-Enroll Year 2
Took Elementary Algebra and Intermediate Algebra
Took Intermediate Algebra Only
Extrapolated Probability of Success if Elementary Algebra Not Taken
Figure 14. Probability of re-enrolling Year 2 for students who did and did not take Elementary Algebra before Intermediate Algebra
For Elementary Algebra/Intermediate Algebra, the probability of re-enrolling Year 2 was consistently
lower for students who first enrolled in the lower-level course, with probabilities ranging from 0.68
to 0.60 for ACT Compass Pre-Algebra scores of 22–74. Probabilities ranged from 0.78 to 0.72 for
similar students who enrolled in the higher-level course. Differences in probabilities between the two
groups did not depend on ACT Compass test score.
0.0
0.1
0.2
0.3
0.4
0.5
0.6
0.7
0.8
0.9
1.0
5 10 15 20 25 30 35 40 45 50 55 60 65 70 75 80 85 90 95 100
Pro
babi
lity
of R
e-E
nrol
ling
Year
3
ACT Compass Writing Skills Score
Re-Enroll Year 3
Took Developmental English and Standard English
Took Standard English Only
Extrapolated Probability of Success if Developmental English Not Taken
Figure 15. Probability of re-enrolling Year 3 for students who did and did not take Developmental English Composition before Standard English Composition
In contrast, for Developmental English Composition/Standard English Composition, the probability of
re-enrolling Year 3 was consistently slightly higher for students who first enrolled in the lower-level
course, with probabilities ranging from 0.52 to 0.46 for ACT Compass Writing Skills scores of 10–74.
Probabilities were lower for similar students who enrolled directly in the higher-level course, with
probabilities ranging from 0.41 to 0.43. As Figure 15 illustrates, differences between the two groups
also depended on ACT Compass Writing Skills score.
Lower-Level Course Grades as Predictors of Early College Success. Across virtually all course
pairs, the probability of early college success for students who took the lower-level course also
depended on the A–F grade they received in the lower-level course. The one exception was re-

22
ACT Research Report Does Taking Developmental Courses Improve the Success of Students Who First Enroll at Two-Year Colleges?
enrolling Year 2 for Intermediate Algebra/College Algebra, for which lower-level course grade was
not statistically significant (p > .01). ACT Compass test score was a significant negative predictor
of re-enrolling Year 2 for three course pairs, and for two course pairs for re-enrolling Year 3, when
lower-level course grade was include in the models. Results for progress to degree differed across
course pairs.
For re-enrolling Year 2 or Year 3, students with a lower-level course grade of A had a higher
probability of success than similar students who enrolled directly into the higher-level course for
all course pairs except Intermediate Algebra/College Algebra (for which course grade was not a
significant predictor of re-enrolling Year 2). This finding held for all ACT Compass test score values.
Students with lower ACT Compass scores and a B grade in the lower-level course had higher
probabilities of re-enrolling Year 2 and Year 3 for three of the five course pairs.22 Figure 16 illustrates
these results for Elementary Algebra/Intermediate Algebra.
0.0
0.1
0.2
0.3
0.4
0.5
0.6
0.7
0.8
0.9
1.0
15 20 25 30 35 40 45 50 55 60 65 70 75 80 85 90 95 100
Pro
babi
lity
of R
e-E
nrol
ling
Year
2
ACT Compass Pre-Algebra Score
Re-Enroll Year 2
Took Intermediate Algebra Only
A Grade in Elementary Algebra
B Grade in Elementary Algebra
C Grade in Elementary Algebra
0.0
0.1
0.2
0.3
0.4
0.5
0.6
0.7
0.8
0.9
1.0
15 20 25 30 35 40 45 50 55 60 65 70 75 80 85 90 95 100
Pro
babi
lity
of R
e-E
nrol
ling
Year
3
ACT Compass Pre-Algebra Score
Re-Enroll Year 3
Took Intermediate Algebra Only
A Grade in Elementary Algebra
B Grade in Elementary Algebra
C Grade in Elementary Algebra
Figure 16. Probability of re-enrolling Year 2 or Year 3 by Elementary Algebra grade and ACT Compass Pre-Algebra score
In contrast, students with a B grade in Arithmetic had consistently higher probabilities. Figure 17
illustrates these results for re-enrolling Year 3.
0.0
0.1
0.2
0.3
0.4
0.5
0.6
0.7
0.8
0.9
1.0
15 20 25 30 35 40 45 50 55 60 65 70 75 80 85 90 95 100
Pro
babi
lity
of R
e-E
nrol
ling
Year
3
ACT Compass Pre-Algebra Score
Re-Enroll Year 3
Took Elementary Algebra Only
A Grade in Arithmetic
B Grade in Arithmetic
C Grade in Arithmetic
Figure 17. Probability of re-enrolling Year 3 by Arithmetic grade and ACT Compass Pre-Algebra score
For three of the five course pairs, students who first enrolled in the lower-level course had lower
probabilities of showing progress to degree than similar students who enrolled directly in the
higher-level course, regardless of lower-level course grade. Figure 18 illustrates this finding for
22 These course pairs included Developmental English Composition/Standard English Composition, Elementary Algebra/Intermediate Algebra, and Developmental Reading/first social science course (re-enrolling Year 2 only).

23
Developmental Reading/first social science course (see also Table D-5 in Appendix D). For the other
two course pairs (Arithmetic/Elementary Algebra and Elementary Algebra/Intermediate Algebra),
only a lower-level course grade of A resulted in higher probabilities of success than those of similar
students who enrolled directly in the higher-level course.
0.0
0.1
0.2
0.3
0.4
0.5
0.6
0.7
0.8
0.9
1.0
35 40 45 50 55 60 65 70 75 80 85 90 95 100 Pro
babi
lity
of S
how
ing
Pro
gres
s to
Deg
ree
Year
2
ACT Compass Reading Score
Progress to Degree Year 2
Took First Social Science Course Only
A Grade in Developmental Reading
B Grade in Developmental Reading
C Grade in Developmental Reading
Figure 18. Probability of progressing to degree by Developmental Reading grade and ACT Compass Reading score
Certificate, Associate’s Degree, and Associate’s or Bachelor’s Degree Completion. In this
section I compare probabilities of degree completion for students who first enrolled in a lower-level
course and those who enrolled directly in the corresponding higher-level course. As noted earlier,
degree completion rates are generally low for two-year students; these results were also found here.
For all certificate outcomes and course pairs, the relationship between ACT Compass test score
and probability of success was zero, or near zero. Additionally, probabilities of success did not differ
between students who first enrolled in the lower-level course and those who enrolled directly in the
higher-level course.
In contrast, for four of the five course pairs, ACT Compass test score was positively and significantly
related to associate’s degree completion and to associate’s or bachelor’s degree completion within
four, five, or six years.23 For Intermediate Algebra/College Algebra, ACT Compass Algebra score was
not a statistically significant predictor (p > .05) of these outcomes. Observed degree completion
rates were very similar for both groups, possibly reflecting different degree requirements for
mathematics. Students may not be required to complete College Algebra to complete an associate’s
degree, for example.
For most course pairs, enrolling in the lower-level course was associated with a similar or lower
probability of completing an associate’s degree or either an associate’s or bachelor’s degree within
four, five, or six years, compared to enrolling directly in the higher-level course. The exceptions were
Developmental English Composition/Standard English Composition (for all degree outcomes except
associate’s degree within six years) and Developmental Reading/first social science course (for
either an associate’s or bachelor’s degree within four or five years). The differences in probabilities
for these exceptions were generally small, with most not exceeding 0.05 points across ACT
Compass scores. Figure 19 illustrates these exceptions using the results for Developmental English
Composition/Standard English Composition and completing an associate’s or bachelor’s degree
within six years. Figure 20 illustrates the more typical result of similar or lower probabilities for
23 ACT Compass Pre-Algebra score was not statistically significant for predicting associate’s degree completion at Year 6 for Elementary Algebra/Intermediate Algebra.
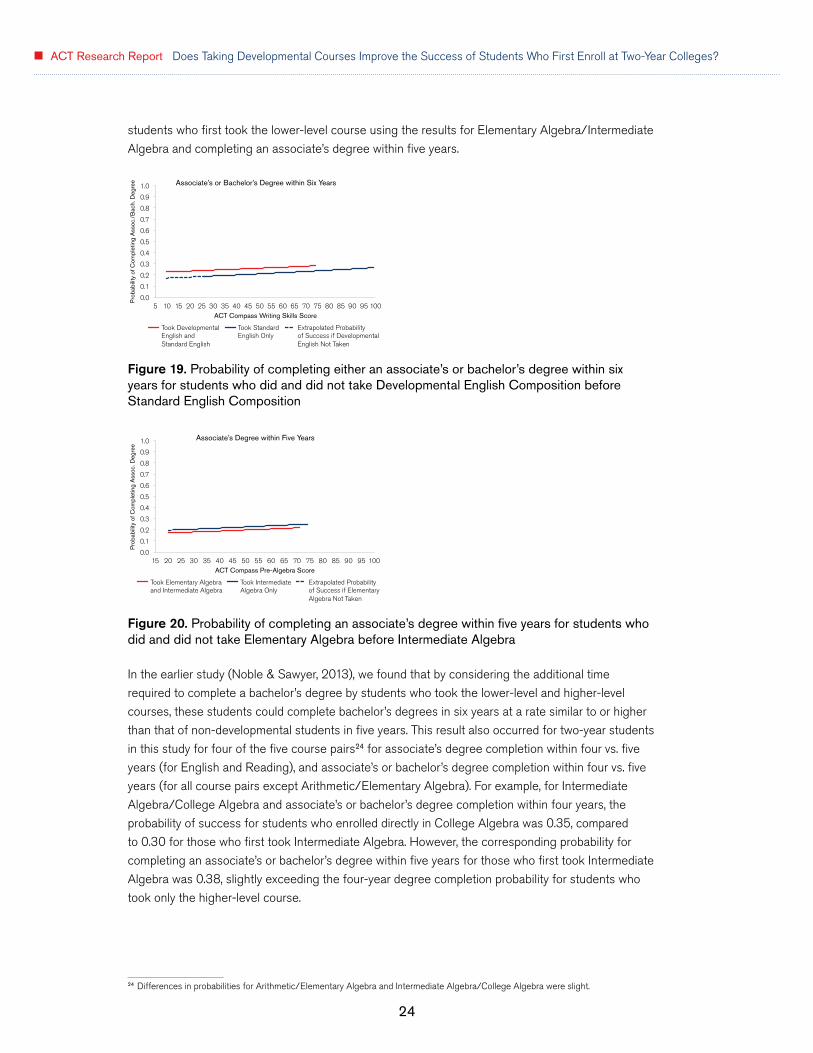
24
ACT Research Report Does Taking Developmental Courses Improve the Success of Students Who First Enroll at Two-Year Colleges?
students who first took the lower-level course using the results for Elementary Algebra/Intermediate
Algebra and completing an associate’s degree within five years.
0.0
0.1
0.2
0.3
0.4
0.5
0.6
0.7
0.8
0.9
1.0
5 10 15 20 25 30 35 40 45 50 55 60 65 70 75 80 85 90 95 100
Pro
babi
lity
of C
ompl
etin
g A
ssoc
./B
ach.
Deg
ree
ACT Compass Writing Skills Score
Associate’s or Bachelor’s Degree within Six Years
Took Developmental English and Standard English
Took Standard English Only
Extrapolated Probability of Success if Developmental English Not Taken
Figure 19. Probability of completing either an associate’s or bachelor’s degree within six years for students who did and did not take Developmental English Composition before Standard English Composition
0.0
0.1
0.2
0.3
0.4
0.5
0.6
0.7
0.8
0.9
1.0
15 20 25 30 35 40 45 50 55 60 65 70 75 80 85 90 95 100
Pro
babi
lity
of C
ompl
etin
g A
ssoc
. Deg
ree
ACT Compass Pre-Algebra Score
Associate’s Degree within Five Years
Took Elementary Algebra and Intermediate Algebra
Took Intermediate Algebra Only
Extrapolated Probability of Success if Elementary Algebra Not Taken
Figure 20. Probability of completing an associate’s degree within five years for students who did and did not take Elementary Algebra before Intermediate Algebra
In the earlier study (Noble & Sawyer, 2013), we found that by considering the additional time
required to complete a bachelor’s degree by students who took the lower-level and higher-level
courses, these students could complete bachelor’s degrees in six years at a rate similar to or higher
than that of non-developmental students in five years. This result also occurred for two-year students
in this study for four of the five course pairs24 for associate’s degree completion within four vs. five
years (for English and Reading), and associate’s or bachelor’s degree completion within four vs. five
years (for all course pairs except Arithmetic/Elementary Algebra). For example, for Intermediate
Algebra/College Algebra and associate’s or bachelor’s degree completion within four years, the
probability of success for students who enrolled directly in College Algebra was 0.35, compared
to 0.30 for those who first took Intermediate Algebra. However, the corresponding probability for
completing an associate’s or bachelor’s degree within five years for those who first took Intermediate
Algebra was 0.38, slightly exceeding the four-year degree completion probability for students who
took only the higher-level course.
24 Differences in probabilities for Arithmetic/Elementary Algebra and Intermediate Algebra/College Algebra were slight.

25
Lower-Level Course Grades as Predictors of Certificate and Degree Completion. Across
all course pairs, the probability of completing an associate’s degree or either an associate’s or
bachelor’s degree within four, five, or six years for students who first took the lower-level course also
depended on the A–F grade they received in the lower-level course (see Tables C-1 through C-5
in Appendix C). These results also held for completing a certificate within four, five, or six years, but
only for Developmental English Composition and Developmental Reading. Across the mathematics
course pairs, lower-level course grade was a consistently significant predictor only for completing a
certificate within four years, and not within five and six years.
ACT Compass test score was a statistically significant and positive predictor only for completing
an associate’s degree or associate’s or bachelor’s degree within four years for the Arithmetic/
Elementary Algebra course pair, when Arithmetic grade was included in the models. For all other
course pairs, the relationship of these outcomes with ACT Compass test score was zero or near
zero, when lower-level course grade was included.
Only those students with an A grade in the lower-level course had higher probabilities of completing
an associate’s degree or associate’s or bachelor’s degree within four, five, or six years than did those
enrolling directly into the higher-level course. This result was seen across all ACT Compass scores
for all course pairs except the English Composition course pair, where probabilities associated with a
lower-course grade of A were higher only for students with lower ACT Compass scores. In general,
for certificate completion, differences in probabilities between students who received A grades in
the lower-level course and those who enrolled directly in the higher-level course were near zero.
Probabilities associated with a B or higher grade were similar to or lower than those for similar
students who enrolled directly in the higher-level course.
Figures 21 and 22 illustrate the results for degree completion by lower-course grade. Figure
21 shows the results for completing an associate’s or bachelor’s degree within four years for
Arithmetic/Elementary Algebra. The results for completing an associate’s degree within four years
were very similar. Figure 22 shows the results for completing an associate’s degree within five years
for Elementary Algebra/Intermediate Algebra.
0.0
0.1
0.2
0.3
0.4
0.5
0.6
0.7
0.8
0.9
1.0
15 20 25 30 35 40 45 50 55 60 65 70 75 80 85 90 95 100
Pro
babi
lity
of C
ompl
etin
g A
ssoc
./B
ach.
Deg
ree
ACT Compass Pre-Algebra Score
Associate’s or Bachelor’s Degree within Four Years
Took Elementary Algebra Only
A Grade in Arithmetic
B Grade in Arithmetic
C Grade in Arithmetic
Figure 21. Probability of completing an associate’s/bachelor’s degree within four years by Arithmetic grade and ACT Compass Pre-Algebra score

26
ACT Research Report Does Taking Developmental Courses Improve the Success of Students Who First Enroll at Two-Year Colleges?
0.0
0.1
0.2
0.3
0.4
0.5
0.6
0.7
0.8
0.9
1.0
15 20 25 30 35 40 45 50 55 60 65 70 75 80 85 90 95 100
Pro
babi
lity
of C
ompl
etin
g A
ssoc
. Deg
ree
ACT Compass Pre-Algebra Score
Associate’s Degree within Five Years
Took Intermediate Algebra Only
A Grade in Elementary Algebra
B Grade in Elementary Algebra
C Grade in Elementary Algebra
Figure 22. Probability of completing an associate’s degree within five years by Elementary Algebra grade and ACT Compass Pre-Algebra score
For Arithmetic/Elementary Algebra, probabilities of completing an associate’s or bachelor’s degree
within four years ranged from 0.13 to 0.19 for students with an Arithmetic grade of A, and 0.09 to
0.13 for those with a grade of B, for ACT Compass Pre-Algebra scores of 18–57. For students who
enrolled directly in Elementary Algebra, probabilities ranged from 0.09 to 0.12 for the same scores.
Thus, only the probabilities of success for a lower-level course grade of A exceeded those for
students who enrolled directly in the higher-level course.
As shown in Figure 22, only the probability of completing an associate’s degree for students with
an A grade in Elementary Algebra consistently exceeded those for students who enrolled directly in
Intermediate Algebra. In contrast, only those students with lower ACT Compass Pre-Algebra scores
and who received a B grade in the lower-level course had slightly higher probabilities of completing
an associate’s degree.
Age/Enrollment Status and College Success. For the vast majority of course pairs and outcome
variables, the age/first-year enrollment status dummy variables were statistically significant
predictors of college success (see Appendix C, Tables C-1 through C-5). Moreover, the benefit of
taking the lower-level course depended on the age/enrollment status group. The exceptions to
this finding were all certificate completion outcomes for the Developmental English Composition/
Standard English Composition, Arithmetic/Elementary Algebra, and Elementary Algebra/
Intermediate Algebra course pairs, and completing a certificate in Year 6 for Developmental
Reading/first social science course. The results are shown in Appendix E, Tables E-1 to E-5.
In general, traditional students (full-time, aged ≤ 21) and students aged > 25 had the highest
probabilities of success; for some outcomes and course pairs25, students aged > 25 had the higher
probabilities. Part-time students aged ≤ 21 universally had the lowest probabilities of success for all
five course pairs.
For traditional students, taking both the lower-level and higher-level courses was associated with
lower probabilities of success, when compared to those who took only the higher-level course,
for all course pairs. For part-time students aged ≤ 21, the opposite was true for Developmental
English Composition/Standard English Composition and Developmental Reading/first social
science course for almost all outcomes and outcome levels: Taking both courses was associated
with higher probabilities of success than those for students who took only the higher-level course,
with differences in probabilities ranging from 0.05 to 0.20. Similar results were found for this age/
25 These included Year 1 and Year 2 GPA outcomes for all course pairs except Elementary Algebra/Intermediate Algebra.

27
enrollment group for all course pairs except Arithmetic/Elementary Algebra, but only for Year 2 and
Year 3 GPA outcomes and selected levels of associate’s or bachelor’s degree completion.
The results for students aged 22–25 or > 25 generally paralleled those of traditional students: They
tended to favor students who enrolled directly in the higher-level courses. For students aged 22–25,
there were few exceptions to this finding, including higher-level course success in Standard English
Composition and first social science course for students who first enrolled in the lower-level course.
Differences in probabilities were .14 and .10 and .10 and .07, respectively, for C or higher and B or
higher outcomes. Exceptions for students aged > 25 were few and inconsistent across course pairs.
Age/Enrollment Status, Lower-Level Course Grade, and College Success. Taking lower-
level course grades into consideration changed some of the results by age/enrollment status (see
Appendix F). Across course pairs, for traditional students and students aged 22–25, those with
an A grade in the lower-level course had similar or higher probabilities of success than similar
students who enrolled directly in the higher-level course for higher-level course success, some
GPA outcomes, and degree completion. For some outcomes, a lower-level course grade of B was
also associated with higher probabilities of success for students aged 22–25. In contrast, part-time
students aged ≤ 21 with A or B grades in the lower-level course had higher probabilities of success
for all course pairs. Moreover, those with C grades had higher probabilities of success for most
degree completion outcomes. For students aged > 25, those with an A grade in the lower-level
course also had higher probabilities of success, but only for Developmental English Composition/
Standard English Composition, Arithmetic/Elementary Algebra, and Elementary Algebra/
Intermediate Algebra, and for differing outcomes. A, B, or C grades were associated with similar or
lower probabilities of success compared to those for similar students who enrolled directly in the
higher-level course for the other two course pairs.
Across age/enrollment status groups, for the English course pair, probabilities of success for
students aged 22–25 and > 25 with lower-level course grades of A, B, or C were not significantly
different from those for traditional students for higher-level course (B or higher grade) and GPA
outcomes. For some outcomes, the probabilities associated with lower-level course grades of A for
students aged > 25, and occasionally for students aged 22–25, exceeded those of all traditional
students who enrolled directly in the higher-level course. For example, the probability of a 3.0 or
higher Year 1 GPA for traditional students who took only the higher-level course was .52 (see
Table E-1). However, for students aged 22–25 and > 25 with lower-level course grades of A, their
probabilities of achieving the same outcome were .57 and .59, respectively (see Table F-1). Similar
findings occurred for a 3.0 or higher Year 2 GPA.
These findings were also shown for the Year 2 and Year 3 GPA outcomes for Arithmetic/Elementary
Algebra (2.0 or higher only) and Elementary Algebra/Intermediate Algebra (both outcome levels),
but not for Developmental Reading/first social science course. The probabilities of success
for students aged 22–25 and > 25 with lower-level course grades of A exceeded those for all
traditional students who enrolled directly in the higher-level course. Furthermore, probabilities of
success for nontraditional-aged students with Elementary Algebra grades of B also exceeded those
of traditional students who enrolled directly in Intermediate Algebra, but only for GPAs of 3.0 or
higher (0.62 and 0.67 vs. 0.49, and 0.61 and 0.67 vs. 0.45, respectively).
For part-time students aged ≤ 21, though lower-level course grades of A or B were associated with
higher probabilities of success than those for similar students who enrolled directly in the higher-

28
ACT Research Report Does Taking Developmental Courses Improve the Success of Students Who First Enroll at Two-Year Colleges?
level course, their probabilities remained universally lower than those for similar students in the other
age/enrollment groups.
Goodness-of-Fit and Sensitivity Analyses of Regression Models. Students who first enrolled
in the lower-level course and those who enrolled directly in the higher-level course were compared
on the conditional means (log odds for dichotomous variables) of the variables used to create the
propensity scores (students’ ethnicity, gender, institution state, in-state vs. out-of-state enrollment,
and self-reported high school average). The means were conditioned on the lower-level course
indicator, propensity score, their interaction, as well as the other covariates included in the regression
models (ACT Compass test score, age/enrollment status). The average absolute standardized
differences in the means showed adequate fit (differences < .1) for 28 out of 35 predictor/
course pair combinations. The predictors for which fit was less adequate were fairly consistent
across course pairs: high school average (Developmental English Composition/Standard English
Composition and Developmental Reading/first social science course), racial/ethnic minority
students vs. white students (Developmental English Composition/Standard English Composition and
Developmental Reading/first social science course), and state location of institution (Developmental
English Composition/Standard English Composition, Intermediate/College Algebra, and
Developmental Reading/first social science course).
The sensitivity analyses showed that the regression models could be sensitive to omitted variables
(i.e., variables not included in the models). The regression coefficients for the propensity scores (and
propensity score coefficient/2) were almost always larger than the coefficients for the lower-level
course indicator. Given the limited number and types of predictor variables used to estimate the
propensity scores, the sensitivity analysis results could be expected. No information was available
about students’ motivation and reasons for enrolling in a two-year college, or their psychosocial
characteristics. Further research with additional covariates will help differentiate actual benefits from
the effects of omitted variable bias.26
DiscussionThe results of Noble and Sawyer (2013) confirmed previous research findings: Developmental
students are less successful overall than students who do not take developmental courses (Attewell
et al., 2006; NCES, 2004). However, as Noble and Sawyer (2013) found, I also found that particular
subgroups of students do benefit from taking developmental coursework, especially when I took into
account the greater time they needed to complete their bachelor’s degrees.
In this study, I examined the effectiveness of developmental courses from a similar perspective, but
focused on two-year college students. I compared the college success of students who enrolled in
both a lower- and higher-level course to those who enrolled only in the higher-level course: These
students had the same ACT Compass scores, age/enrollment status, student and institutional
characteristics, and were enrolled in similar institutions (i.e., group differences in these variables were
adjusted through prediction models and propensity scores). I measured college success using many
different outcome variables: completing the subsequent course with a satisfactory grade; cumulative
GPA the first, second, and third year; re-enrollment the second and third years; and certificate or
degree completion (certificate, associate’s degree, or associate’s or bachelor’s degree in four, five, or
26 It is unlikely that inclusion of additional covariates will change the overall results. Even with restricting the sample to those lower-level students who progressed to the higher-level course, the results, though somewhat more positive than prior research, illustrated the same general conclusions.

29
six years). I compared the conditional probabilities of success, given ACT Compass test score, age/
enrollment status, and propensity score, of five groups of students who took particular lower-level
courses and the associated higher-level course with the corresponding conditional probabilities of
students who enrolled directly in the higher-level course.
This study found somewhat similar results to those found in the earlier study. Positive benefits were
found only for course grade and GPA outcomes and for specific course pairs: Taking the lower-level
course was associated with higher probabilities of a B or higher or C or higher grade in the higher-
level course for three of the five course pairs. Results for most Year 1 through Year 3 GPA outcomes
followed the same pattern for two of these three course pairs. Any positive benefits resulting from
first taking the lower-level course disappeared over time, however. In general, little or no benefits
were found for most retention and degree completion outcomes (if not taking into account the extra
time required for developmental course work).
Due to the large percentages of students (35% to 55%) who took lower-level courses but who did
not progress to higher-level courses, I was unable to include them as unsuccessful outcomes in the
regression models. However, by comparing the observed success rates for those students enrolled
in the lower-level course who progressed and those who did not, it is immediately apparent that
those who did not progress were also much less likely to be successful in college in the long term.
These findings are consistent with those of other studies (Bailey et al., 2010; Jenkins et al., 2009;
Jaggars & Stacey, 2014). A large proportion of developmental students do not progress beyond
developmental courses to entry-level gateway college courses.
These findings have direct implications for interpreting the overall results of this study in terms of
all students who first enrolled in lower-level courses, and not only those students who progressed
to the higher-level course. With the lower ACT Compass test scores, lower-level course grades, and
success rates for students who did not progress, when combined with the modeled results shown
here, the probabilities of short- and long-term college success for all students who took the lower-
level course would likely be much lower than those reported here. These results would more closely
parallel our earlier findings (Noble & Sawyer, 2013), as well as other research (Adelman, 1999;
Attewell et al., 2006; Calcagno & Long, 2008; NCES, 2004) on the benefits of taking developmental
coursework.
Some students who did not progress to the higher-level course did progress to completing a
certificate. Students in certificate programs might not be required to take entry-level gateway
coursework, particularly coursework that might be required for an associate’s or bachelor’s degree.
Additional study of non-progressing students by program of study, as well as additional information
about requirements for certificate completion, would help clarify this issue.
Success in College Depends on Prior Academic PreparationAs shown in Noble and Sawyer (2013), with few exceptions, students who were better prepared for
college coursework were more likely to be successful, both short- and long-term, than students who
were underprepared. This was true of students who first enrolled in the lower-level course and those
who enrolled directly in the higher-level course.
ACT Compass test score was a significant predictor for both lower- and higher-level course
outcomes, as well as several longer-term college outcomes, including degree completion.
Furthermore, test score remained a significant predictor of several outcomes even with the
inclusion of lower-level course grade in the models. Recent studies (Scott-Clayton, 2012; Fulton et

30
ACT Research Report Does Taking Developmental Courses Improve the Success of Students Who First Enroll at Two-Year Colleges?
al., 2014) claim that misplacement of students (over- and under-placement) is one contributor to
the ineffectiveness of developmental programs. These researchers advocate eliminating the use
of placement tests in favor of using high school average, or using both in combination in making
placement decisions.
The results here argue for using placement test scores for course placement, along with other
relevant variables such as lower-level course grade (if appropriate) and high school GPA (used
here in the propensity score). ACT recommends the use of multiple measures in making course
placement decisions. However, for many two-year students, particularly for returning adult students,
high school GPA is either unavailable or out-of-date; it no longer reflects what a student knows and
is able to do.
Among students who enrolled in the lower-level course, grade in that course was also a significant
predictor of short- and long-term success. In some cases, both ACT Compass test score and lower-
level course grade were significant predictors of success; in others, ACT Compass test score was
not significant when grade was included in the model. This finding is consistent with the results
from the earlier study: If developmental coursework is effective in providing the knowledge and
skills needed for success in the next course, then test scores obtained before taking developmental
coursework no longer reflect what students know and are able to do after they take the course.
Moreover, ACT Compass test scores were used to place the majority of students in lower-level
courses. The resulting distributions of ACT Compass test scores were restricted, especially for
mathematics courses.
It is worth reiterating that, when validating test scores or other measures for course placement,
institutions and researchers need to ensure that no intervening instruction has occurred (or else is
statistically controlled for). This also means that test scores should be current, rather than relying
on older scores, as older scores may not accurately present a student’s current level of knowledge
and skill. The ACT Compass Course Placement Service (ACT, 2015) recommends that institutions
include in their validity studies data only from first-time students without prior developmental
instruction. The ACT Compass Course Placement Service also recommends that institutions identify
students who are taking developmental coursework at the same time as standard college-level
courses.
Simply Taking Developmental Courses Results in Few Long-Term BenefitsFor three of the five developmental courses, simply taking the courses (without considering the
grades earned in them) and enrolling in subsequent higher-level courses resulted in increased
chances of succeeding in those courses. Maximum differences in probabilities were relatively
large for Developmental English Composition/Standard English Composition and Developmental
Reading/first social science course (maximum increases in probability of .13 and .15, and .16 and
.18, respectively).
Typical two-year students who took Developmental English Composition or Developmental Reading,
as a group, also improved their chances of successful GPA outcomes. Similar results were found in
the earlier study for selected developmental courses. These results could be due to how institutions
treat course credits and grades from developmental courses in GPA calculations (Parsad & Lewis,
2003). Follow-up with the two states providing the college outcome data revealed that for one
state, developmental grades were included in cumulative GPA calculations. For the other state,

31
the inclusion/exclusion decision was institution-specific and not determined at the state level. The
relatively high percentages of students receiving C or higher grades in these courses are therefore
not surprising.
The re-enrollment and progress-to-degree results were an interesting contrast to those for higher-
level course grade and GPA outcomes. Students who took Developmental English Composition
or Developmental Reading prior to higher-level courses were more likely to re-enroll and show
progress to degree than similar students who enrolled only in the higher-level courses. The benefits
decreased as ACT Compass score increased, however: Higher-achieving students who first took
either the lower-level or the higher-level course were less likely to re-enroll Year 2 or Year 3 than
similar lower-achieving students. These findings may in part be due to students’ intent to transfer
after enrolling in a two-year college. Higher-achieving students are more likely to transfer to a four-
year institution and may also take a few classes at a two-year college in advance of or concurrently
with courses at another institution. The data for this study were limited to students who could have
transferred within the two public state systems of higher education. No data were available from out-
of-state institutions or from most in-state private institutions and vocational/technical colleges.
Moreover, part-time students, by definition, will appear as not progressing to degree: Part-time
status was defined as taking less than 24 credit hours the first year, and showing progress to
degree was defined as having completed 48 credit hours by the end of Year 2.
For the progress-to-degree outcome, I expected to find lower probabilities for students who first
took the lower-level course, due to delays in accumulating credit hours towards graduation from
taking developmental courses. For most course pairs, this finding did not occur; Intermediate
Algebra/College Algebra was the exception. There are at least two possible reasons for this result.
First, as noted earlier, treatment of developmental course credit hours could be much like treatment
of developmental grades; developmental course credit hours may be included/excluded on an
institution-by-institution basis and dependent on a student’s program of study. Second, the cutoff
used for progress to degree (48 hours) might have been too restrictive for the two-year college
student population, where the vast majority were part-time students. Across the course pairs,
progress-to-degree rates were less than 0.50; the one exception was Intermediate Algebra/College
Algebra, which also had considerably higher percentages of full-time students than other course
pairs.
After the first two years, benefits associated with developmental coursework tended to decline
and, in many cases, disappear. This was particularly the case for completing a certificate program.
There was benefit to taking Developmental English Composition for almost all associate’s degree or
associate’s or bachelor’s degree outcomes, and for taking Developmental Reading for completing
an associate’s or bachelor’s degree in four or five years. These findings are consistent with those of
the earlier study and to some extent with other studies that looked at long-term college outcomes
(e.g., Adelman, 1999; Calcagno & Long, 2008), which found that taking developmental coursework
did not improve later college success. These studies used different methodological approaches and
college outcomes than those used here, however. The findings here and in the earlier study also
illustrate the importance of taking time to degree into consideration in conducting such research,
with consideration for the delayed accumulation of credit hours resulting from taking developmental
coursework.
Unlike the earlier study, across all outcomes studied, Developmental Reading appeared to be
beneficial for improving the academic preparedness of entering students. For the institutions in

32
ACT Research Report Does Taking Developmental Courses Improve the Success of Students Who First Enroll at Two-Year Colleges?
this study, Developmental Reading could be taken prior to, concurrent with, or following college-
level social science courses. Students who took Developmental Reading after taking their first
social science course were excluded from the analyses, thereby limiting the numbers of students
who actually took Developmental Reading. It may be that the policies at two-year institutions for
taking this sequence of courses differ from those of the states as a whole. Having all students
take Developmental Reading prior to or concurrent with standard college-level social sciences
coursework might change these results.
The potential benefits of taking developmental coursework were also found to depend on the course
grade in the lower-level course and first-year enrollment status. The following sections address
these factors.
The Benefit of Taking Developmental Courses Also Depends on the Grades Earned in ThemConsistent with findings by Noble and Sawyer (2013), Perkhounkova, Noble, and Sawyer (2006),
and others (Bettinger & Long, 2005; Boatman & Long, 2010; Calcagno & Long, 2008), the benefits
of taking developmental coursework depend on the grade in the developmental course. A–F grading
for the courses studied here was generally tougher than that shown in the earlier study for both two-
and four-year institutions. Pass/fail grades for both studies typically had very high percentages of
students receiving passing grades, which limits the extent to which students can be differentiated in
terms of what they know and are able to do.
A grades in the lower-level course were associated with higher probabilities of success than
expected, had students enrolled directly in the higher-level course. This finding was consistent
across almost all course pairs, age/enrollment status group, ACT Compass test score, and outcomes
(except for certificate completion). Similarly, students with B grades in the lower-level course also
had higher probabilities, but only for students with lower ACT Compass test scores, and only for
higher-level course and GPA success outcomes.
The benefits associated with receiving an A grade in the lower-level courses tended to decrease
over time. For later college success outcomes, only a grade of A in the lower-level course was
associated with a higher probability of success than would have been expected, had students
enrolled directly in the higher-level course.
The Benefit of Developmental Courses Depends on Age and First-Year Enrollment StatusThe results of this study showed that, in general, full-time students aged ≤ 21 are more likely than
part-time or older students to succeed in college. For some outcomes, students aged > 25 had
higher probabilities. Part-time students aged ≤ 21 were the least likely to be successful across most
outcomes and course pairs. Age/enrollment status did not appear to be associated with any of the
Certificate completion outcomes, however.
Full-time students aged ≤ 21 and students aged 22–25 who took both the lower-level and higher-
level courses did not appear to benefit from taking the lower-level course for all course pairs. In
contrast, part-time students aged ≤ 21 appeared to derive more benefit from taking Developmental
English Composition, Arithmetic, Elementary Algebra, and Developmental Reading than other
students did. These results were seen for Year 2 and Year 3 GPA outcomes and some success
levels of associate’s or bachelor’s degree completion. For example, part-time students aged ≤ 21

33
who first took Developmental English Composition were more likely to have Year 2 GPAs of 2.0 or
higher, or 3.0 or higher, and they were more likely to complete an associate’s degree or associate’s
or bachelor’s degree, within four, five, or six years, compared to similar students who enrolled directly
in the associated higher-level course.
The associations between first-year enrollment status and the effectiveness of lower-level courses
helped inform the results from Noble and Sawyer (2013), where we compared only full-time and
part-time students. Most of the research on the effectiveness of developmental instruction has
focused on two-year or four-year college students (but not on both), or on degree-seeking students
only, or on full-time students only. Also, as noted earlier, longer-term outcomes for nontraditional
students are not typically studied in detail. Federal reporting (IPEDS) for postsecondary institutions
focuses on first-time, full-time, degree-seeking students. Students who take only developmental
coursework are not included in IPEDS reporting. Based on the information available on two-year
students for this study, many of them would not be included in federal reporting.
Does Developmental Coursework Benefit Students?Students who take developmental courses are not as successful in college as students who do
not need to take developmental courses. My research, as well as that of Noble and Sawyer (2013),
confirms this finding: Students who took both the lower- and higher-level course, as a group were
as successful in college as non-developmental students with respect to higher-level course and
GPA outcomes, but not for re-enrollment over time and degree completion within a fixed time
period. However, as we recommended in the earlier study, consideration of the additional time
required to complete an associate’s or bachelor’s degree by developmental students showed that
these students can complete degrees at a rate similar to or higher than those of non-developmental
students.
Do students derive any benefit from taking developmental courses, in the sense that they are more
successful than similar students who do not take developmental courses? I defined similarity in
terms of students’ readiness for college-level work, as measured by their ACT Compass test scores,
by their age/enrollment status, and other student and institutional characteristics. I compared the
conditional probability of success, given ACT Compass test score, age/enrollment status, and
propensity score, of groups of students who took particular lower-level courses with those who
took the next higher-level course. For two of the five lower-level courses, students did benefit, but
not through degree completion. For all course pairs and outcomes, however, students did benefit
if they earned an A in the lower-level course. For some course pairs, students who entered the
developmental course with lower ACT Compass test scores and who earned a B in the lower-level
course also derived benefit.
Considerations that may help inform these results include the following:
Academic supports. Average grades and lower-level course success rates for students who did
not progress to higher-level courses were considerably lower than those for students who did. These
students also had lower average ACT Compass scores and were much more likely to be part-time
students. These findings highlight the importance of providing developmental instruction that is
appropriate for a variety of levels of skills and knowledge.
Moreover, these findings, and those for students who did not progress, highlight the need for
student support and advising to encourage students to take the courses that are appropriate to
their skill levels, to pass the course, and to persist to the subsequent course. As noted by Boylan
34
ACT Research Report Does Taking Developmental Courses Improve the Success of Students Who First Enroll at Two-Year Colleges?
(1995), developmental education is not limited to providing developmental courses, but also includes
advising/counseling and other services that address needs related to students’ noncognitive
characteristics.
Several studies (Karp & Bork, 2012; Venezia et al., 2010; Venezia et al., 2003) have noted the lack
of preparedness of two-year college students for the placement process, the lack of knowledge
of placement policies and how students are affected by them, and the implications of taking
developmental coursework in terms of both time and costs. The studies also recognized the limited
support programs provided to students as they progress into entry-level coursework.
Support programs can provide academic assistance for academically underprepared students and
social support to encourage social integration at the institution (Padgett & Keup, 2011). They may
include freshman orientation, first-year seminars, summer bridge programs, mentoring, advising,
and counseling for selected population subgroups, course placement, and learning communities
(Muraskin, 1997). Researchers from the National Resource Center for the First-Year Experience
and Students in Transition reported that, of 87% of responding US postsecondary institutions
(N = 1,019), over half had nearly all first-year students participating in the program (Padgett & Keup,
2011). In contrast, only about one-third of responding institutions had initiatives for sophomores;
these initiatives typically emphasized retention, satisfaction, and student engagement (Keup et al.,
2010).
Noncognitive characteristics of students. Although academic preparation is important for
success in college, noncognitive characteristics are also important. I hypothesize that students’
noncognitive characteristics explain, to a large extent, developmental students’ disappointing
long-term success. Examples of these factors include psychosocial characteristics, motivation, and
academic discipline (Allen & Robbins, 2010; Allen et al., 2010), family environment (support and
encouragement to succeed in college), and life situations (e.g., care for dependents, the need to
work while in college). Such nonacademic characteristics affect grades earned in college, as well as
those earned in high school (Goldman & Hewitt, 1975; Goldman et al., 1974; Goldman & Widawski,
1976; Stiggins et al., 1989). Research with ACT Engage® for college students has also shown the
relationships between students’ noncognitive characteristics and college retention, GPA, and timely
degree attainment (e.g., Allen & Robbins, 2010; Allen et al., 2010). Support programs and advising,
as described earlier, can help students who are “at risk” due to these factors, in addition to academic
factors.
The cost and fatigue factors associated with taking full-term developmental courses. Taking
developmental courses is expensive, time consuming, and can be frustrating for many students.
As we have seen here, many give up. In response, institutions and researchers are exploring a
variety of alternative delivery approaches, such as modular, co-requisite, or integrated instructional
models (Bettinger & Long, 2005; Burdman, 2012; “Experts: Remedial classes need fixing,” 2012;
Fulton et al., 2014; McTiernan et al., 2013; Merisotis & Phipps, 2000; Rutschow & Schneider, 2011),
or targeted brush-up instruction delivered on-line (e.g., American Education Corporation, 2009;
Blackboard, Inc., 2012; Pearson Education Inc., 2012; see also Tong et al. [2012] for a detailed
summary of developmental mathematics software). These alternative approaches have advantages
in time, cost, and/or convenience to students, but their effectiveness, like that of traditional
developmental courses, needs to be studied, especially for different student subgroups.

35
Continued research on developmental education is needed; there are still many unanswered
questions, several of them mentioned in this section. Such research can help support or refute the
value of instructional methods, instructional approaches, and noncognitive characteristics of students
in informing and increasing the benefits of developmental education. In particular, the large numbers
of developmental students who don’t progress, as well as the diversity of student age and enrollment
status at two-year colleges, highlight the complexity of developmental course effectiveness and the
need for their consideration in such research.

36
ACT Research Report Does Taking Developmental Courses Improve the Success of Students Who First Enroll at Two-Year Colleges?
ReferencesACT. (2009). The ACT Compass Program Entering Student Descriptive Report: National 2-year
institutions September 2008 through August 2009. Iowa City, IA: ACT.
ACT. (2015). ACT Compass Course Placement Service. Iowa City, IA: ACT.
Adelman, C. (1999). Answers in the tool box: Academic intensity, attendance patterns, and bachelor’s
degree attainment. Washington, DC: Office of Education Research and Improvement, US
Department of Education.
Allen, J., & Robbins, S. (2010). Effects of interest–major congruence, motivation, and academic
performance on timely degree attainment. Journal of Counseling Psychology. 57 (1), 23–35.
Allen, J., Robbins, S., & Sawyer, R. (2010). Can measuring psychosocial factors promote college
success? Applied Measurement in Education, 23, 1–22.
American Education Corporation. (2009). A+dvancer college readiness online. Retrieved from
www.advancerlearning.com/home.htm.
Attewell, P., Lavin, D., Domina, T., & Levey, T. (2006). New evidence on college remediation. Journal of
Higher Education, 77(5), 886-924.
Aud, S., Hussar, W., Johnson, F., Kena, G., Roth, E., Manning, E., Wang, X., & Zhang, J. (2012). The
condition of education 2012 (NCES 2012-045). Washington, DC: US Department of Education,
National Center for Education Statistics.
Austin, P. (2008). Goodness-of-fit diagnostics for the propensity score model when estimating
treatment effects using covariate adjustment with the propensity score. Pharmacoepidemiology &
Drug Safety, 17, 1202–1217.
Austin, P. (2011). An introduction to propensity score methods for reducing the effects of
confounding in observational studies. Multivariate Behavioral Research, 46(3), 399–424.
Bailey, T., Jeong, D. W., & Cho, S.-W. (2010). Referral, enrollment, and completion in developmental
education sequences in community colleges. Economics of Education Review, 29(2), 255–270.
Bettinger, E. P., & Long, B. T. (2005). Addressing the needs of under-prepared students in higher
education: Does college remediation work? (NBER Working Paper No. 11325). Retrieved from
www.nber.org/papers/w11325 on August 7, 2011.
Bettinger, E., & Long, B. T. (2007). Remedial and developmental courses. In S. Dickert-Conlin & R.
Rubenstein (Eds.), Economic inequality and higher education: Access, persistence, and success
(pp. 69–100). New York, NY: Russell Sage Foundation.
Blackboard, Inc. (2012). Blackboard for higher education. Retrieved from www.blackboard.com/
higher-education/index.aspx.
Boatman, A., & Long, B. T. (2010). Does remediation work for all students? How the effects of
postsecondary remedial and developmental courses vary by level of academic preparation (NCPR
Working Paper). New York, NY: National Center for Postsecondary Research.
Boylan, H. (1995). Making the case for developmental education. Research in Developmental
Education, 12(2), 1–4.

37
Burdman, P. (2012). Where to begin? The evolving role of placement exams for students starting
college. Boston, MA: Jobs for the Future. Retrieved from www.jff.org/sites/default/files/
publications/ATD_WhereToBegin_050213.pdf.
Calcagno, J. C., & Long, B. T. (2008). The impact of postsecondary remediation using a regression
discontinuity approach: Addressing endogenous sorting and noncompliance. (NBER Working
Paper 14194). Cambridge, MA: National Bureau of Economic Research.
Choy, S. (2002). Nontraditional undergraduates (NCES 2002–012). Washington, DC: U.S.
Department of Education, National Center for Education Statistics. Retrieved from nces.ed.gov/
pubs2002/2002012.pdf.
Experts: Remedial college classes need fixing. (2012, May 30). Education Week. Retrieved from
news.yahoo.com/experts-remedial-college-classes-fixing-184407870.html.
Fong, J. (2012). Measuring nontraditional student success: An imperative for colleges and universities.
Washington, DC: University Professional and Continuing Education Association.
Fulton, M., Gianneschi, M., Blanco, C., & DeMaria, P. (2014). Developmental strategies for college
readiness and success. Denver, CO: Education Commission of the States. www.ecs.org/docs/
DevEdStrategies.pdf.
Goldman, R. D., & Hewitt, B. N. (1975). Adaptation-level as an explanation for differential standards in
college grading. Journal of Educational Measurement, 12(3), 149–161.
Goldman, R. D., Schmidt, D. E., Hewitt, B. N., & Fisher, R. (1974). Grading practices in different major
fields. American Education Research Journal, 11(4), 343–357.
Goldman, R. D., & Widawski, M. H. (1976). A within-subjects technique for comparing college grading
standards: Implications in the validity of the evaluation of college achievement. Educational and
Psychological Measurement, 36(2), 381–390.
Ignash, J. M. (1997). Who should provide postsecondary remedial/developmental education? New
Directions for Community Colleges, 100, 5–20.
Jaggars, S., & Stacey. G. (2014). What we know about developmental education outcomes. New York,
NY: Columbia University, Teachers College, Community College Research Center.
Jenkins, D., Jaggars, S. S., Roksa, J., Zeidenberg, M., & Cho, S.-W. (2009). Strategies for promoting
gatekeeper course success among students needing remediation: Research report for the Virginia
Community College System. New York, NY: Columbia University, Teachers College, Community
College Research Center.
Karp, M., & Bork, R. (2012). “They Never Told Me What to Expect, so I Didn’t Know What to Do”:
Defining and Clarifying the Role of a Community College Student. (CCRC Working Paper No. 47).
New York, NY: Columbia University, Teachers College, Community College Research Center.
Keup, J. R., Gahagan, J., & Goodwin, R. N. (2010). 2008 National survey of sophomore-year initiatives:
Curricular and cocurricular structures supporting the success of second-year college students
(Research Reports on College Transitions No. 1). Columbia, SC: University of South Carolina,
National Resource Center for the First-Year Experience and Students in Transition.
Marcus, S. (1997). Using omitted variable bias to assess uncertainty in the estimation of an AIDS
education treatment effect. Journal of Educational and Behavioral Statistics, 22(2), 193-201.

38
ACT Research Report Does Taking Developmental Courses Improve the Success of Students Who First Enroll at Two-Year Colleges?
McTiernan, L., Palmer, I., & Fulton, M. (2013). NextDev Challenge: Instructional delivery. Denver, CO:
Education Commission of the States.
Merisotis, J., & Phipps, R. (2000). Remedial education in colleges and universities: What’s really
going on? Review of Higher Education, 24(1), 67–85.
Muraskin, L. (1997). A structured freshman year for at-risk students. Washington, DC: National TRIO
Clearinghouse.
National Center for Education Statistics. (2004). The condition of education 2004 (NCES 2004-
077). Washington, DC: US Department of Education, Office of Educational Research and
Improvement.
National Center for Education Statistics. (2010). Integrated Postsecondary Education Data System
(IPEDS). Retrieved March 16, 2015 from nces.ed.gov/ipeds/.
Noble, J., & Sawyer, R. (2013). Does taking developmental courses improve student success in
college? A paper presented at the Annual Forum of the Association for Institutional Research in
Long Beach, CA.
Padgett, R. D., & Keup, J. R. (2011). 2009 National survey of first-year seminars: Ongoing efforts
to support students in transition. (Research Reports on College Transitions No. 2). Columbia,
SC: University of South Carolina, National Resource Center for the First-Year Experience and
Students in Transition.
Parsad, B., & Lewis, L. (2003). Remedial education at degree-granting postsecondary institutions in
fall 2000. Washington, DC: US Department of Education, Office of Educational Research and
Improvement.
Pearson Education Inc. (2012). MyFoundationsLab™. Retrieved from foundations.mathxl.com/home_
foundations.htm.
Perkhounkova, Y., Noble, J., & Sawyer, R. (2006). A method of modeling the effectiveness of
developmental instruction. Research in Developmental Education, 20(2), 1–5.
Rosenbaum, P. R., & Rubin, D. (1983). The central role of the propensity score in observational
studies for causal effects. Biometrika, 70 (1), 41–55.
Rutschow, E. Z., & Schneider, E. (2011). Unlocking the gate: What we know about improving
developmental education. Retrieved from www.mdrc.org/sites/default/files/full_595.pdf.
Scott-Clayton, J.E. (2012). Do high-stakes placement exams predict college success? Retrieved from
academiccommons.columbia.edu/catalog/ac:146482.
Shults, C. (2000). Institutional policies and practices in remedial education: A national study of
community colleges. Washington DC: American Association of Community and Junior Colleges.
Stiggins, R. J., Frisbie, D. A., & Griswold, P. A. (1989). Inside high school grading practices: Building a
research agenda. Educational Measurement: Issues and Practice, 8(2), 5–14.
Strong American Schools. (2008). Diploma to nowhere. Retrieved May 29, 2012 from
www.broadeducation.org/asset/1128-diploma%20to%20nowhere.pdf.
Tong, J. A., Saxon, D. P., Boylan, H. R., Bonham, B. S., & Smith, M. C. (2012). A research overview and
product list of mathematical software for developmental education. Research in Developmental
Education, 24(2).

39
Vandal, B. (2010). Getting past go: Rebuilding the remedial education bridge to college success.
Denver, CO: Education Commission of the States.
Venezia, A., Bracco, K. R., & Nodine, T. (2010). One shot deal? Students’ perceptions of assessment
and course placement in California’s community colleges. San Francisco, CA: WestEd.
Venezia, A., Kirst, M. W., & Antonio, A. L. (2003). Betraying the college dream: How disconnected
K-12 and postsecondary education systems undermine student aspirations (Final Report of the
Bridge Project). Stanford, CA: Stanford Institute for Higher Education Research.
Westrick, P. A., & Allen, J. (2014). Validity evidence for ACT Compass® Placement Tests. (ACT
Research Report No. 2014-2). Iowa City, IA: ACT, Inc.

40
ACT Research Report Does Taking Developmental Courses Improve the Success of Students Who First Enroll at Two-Year Colleges?
Appendix A Pooled Descriptive Results
Tables A-1 through A-5
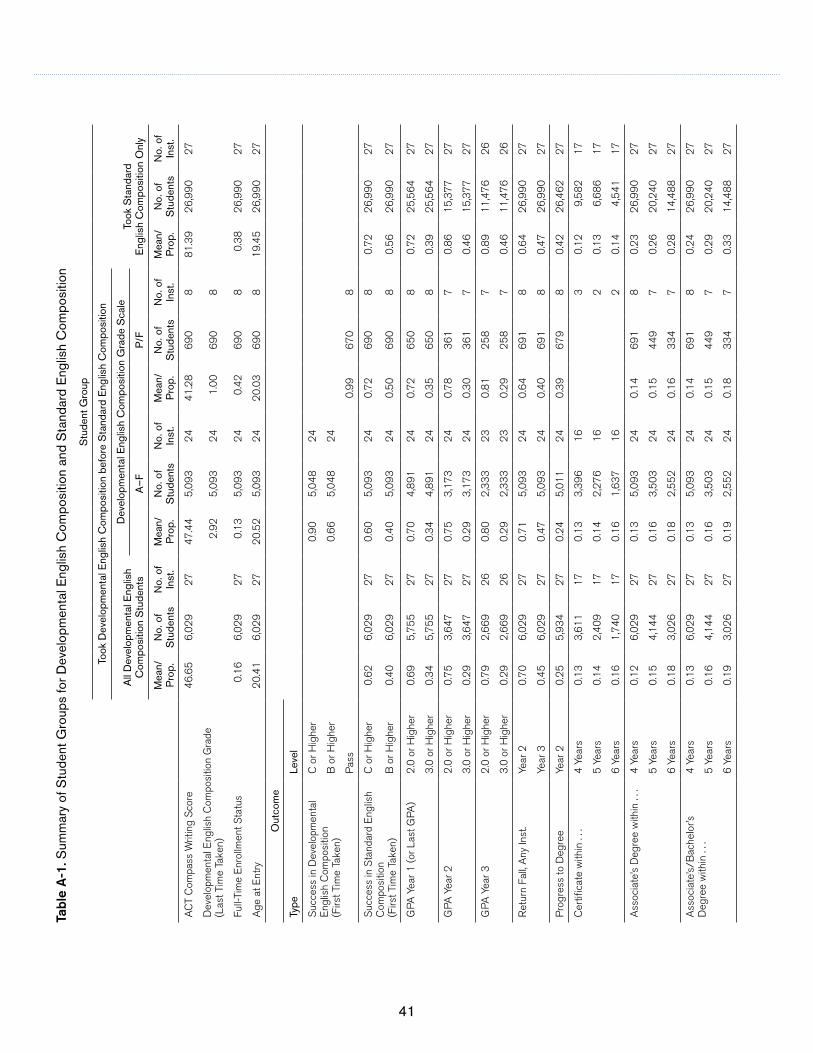
41
Tabl
e A
-1. S
umm
ary
of S
tude
nt G
roup
s fo
r Dev
elop
men
tal E
nglis
h C
ompo
sitio
n an
d S
tand
ard
Eng
lish
Com
posi
tion
Stu
dent
Gro
up
Took
Dev
elop
men
tal E
nglis
h C
ompo
sitio
n be
fore
Sta
ndar
d E
nglis
h C
ompo
sitio
n
All
Dev
elop
men
tal E
nglis
h C
ompo
sitio
n S
tude
nts
Dev
elop
men
tal E
nglis
h C
ompo
sitio
n G
rade
Sca
leTo
ok S
tand
ard
E
nglis
h C
ompo
sitio
n O
nly
A–
FP
/F
Mea
n/P
rop.
No.
of
Stu
dent
sN
o. o
f In
st.
Mea
n/P
rop.
No.
of
Stu
dent
sN
o. o
f In
st.
Mea
n/P
rop.
No.
of
Stu
dent
sN
o. o
f In
st.
Mea
n/P
rop.
No.
of
Stu
dent
sN
o. o
f In
st.
AC
T C
ompa
ss W
ritin
g S
core
46
.65
6,0
29
27
47
.44
5,0
93
24
41
.28
69
08
81
.39
26
,99
02
7
Dev
elop
men
tal E
nglis
h C
ompo
sitio
n G
rade
(L
ast T
ime
Take
n)
2
.92
5,0
93
24
1
.00
69
08
Full-
Tim
e E
nrol
lmen
t Sta
tus
0
.16
6,0
29
27
0
.13
5,0
93
24
0
.42
69
08
0
.38
26
,99
02
7
Age
at E
ntry
20
.41
6,0
29
27
20
.52
5,0
93
24
20
.03
69
08
19
.45
26
,99
02
7
Out
com
e
Type
Leve
l
Suc
cess
in D
evel
opm
enta
l E
nglis
h C
ompo
sitio
n
(Firs
t Tim
e Ta
ken)
C o
r Hig
her
0.9
05
,04
82
4
B o
r Hig
her
0.6
65
,04
82
4
Pas
s0
.99
67
08
Suc
cess
in S
tand
ard
Eng
lish
Com
posi
tion
(F
irst T
ime
Take
n)
C o
r Hig
her
0.6
26
,02
92
70
.60
5,0
93
24
0.7
26
90
80
.72
26
,99
02
7
B o
r Hig
her
0.4
06
,02
92
70
.40
5,0
93
24
0.5
06
90
80
.56
26
,99
02
7
GPA
Yea
r 1 (o
r Las
t GPA
)2
.0 o
r Hig
her
0.6
95
,75
52
70
.70
4,8
91
24
0.7
26
50
80
.72
25
,56
42
7
3.0
or H
ighe
r0
.34
5,7
55
27
0.3
44
,89
12
40
.35
65
08
0.3
92
5,5
64
27
GPA
Yea
r 22
.0 o
r Hig
her
0.7
53
,64
72
70
.75
3,1
73
24
0.7
83
61
70
.86
15
,37
72
7
3.0
or H
ighe
r0
.29
3,6
47
27
0.2
93
,17
32
40
.30
36
17
0.4
61
5,3
77
27
GPA
Yea
r 32
.0 o
r Hig
her
0.7
92
,66
92
60
.80
2,3
33
23
0.8
12
58
70
.89
11
,47
62
6
3.0
or H
ighe
r0
.29
2,6
69
26
0.2
92
,33
32
30
.29
25
87
0.4
61
1,4
76
26
Ret
urn
Fall,
Any
Inst
.Ye
ar 2
0.7
06
,02
92
70
.71
5,0
93
24
0.6
46
91
80
.64
26
,99
02
7
Year
30
.45
6,0
29
27
0.4
75
,09
32
40
.40
69
18
0.4
72
6,9
90
27
Pro
gres
s to
Deg
ree
Year
20
.25
5,9
34
27
0.2
45
,01
12
40
.39
67
98
0.4
22
6,4
62
27
Cer
tific
ate
with
in .
. .4
Yea
rs0
.13
3,6
11
17
0.1
33
,39
61
63
0.1
2
9,5
82
17
5 Y
ears
0.1
42
,40
91
70
.14
2,2
76
16
20
.13
6
,68
61
7
6 Y
ears
0.1
61
,74
01
70
.16
1,6
37
16
20
.14
4
,54
11
7
Ass
ocia
te’s
Deg
ree
with
in .
. .4
Yea
rs0
.12
6,0
29
27
0.1
35
,09
32
40
.14
69
18
0.2
32
6,9
90
27
5 Y
ears
0.1
54
,14
42
70
.16
3,5
03
24
0.1
54
49
70
.26
20
,24
02
7
6 Y
ears
0.1
83
,02
62
70
.18
2,5
52
24
0.1
63
34
70
.28
14
,48
82
7
Ass
ocia
te’s
/Bac
helo
r’s
Deg
ree
with
in .
. .4
Yea
rs0
.13
6,0
29
27
0.1
35
,09
32
40
.14
69
18
0.2
42
6,9
90
27
5 Y
ears
0.1
64
,14
42
70
.16
3,5
03
24
0.1
54
49
70
.29
20
,24
02
7
6 Y
ears
0.1
93
,02
62
70
.19
2,5
52
24
0.1
83
34
70
.33
14
,48
82
7

42
ACT Research Report Does Taking Developmental Courses Improve the Success of Students Who First Enroll at Two-Year Colleges?Ta
ble
A-2
. Sum
mar
y of
Stu
dent
Gro
ups
for A
rithm
etic
and
Ele
men
tary
Alg
ebra
Stu
dent
Gro
up
Took
Arit
hmet
ic b
efor
e E
lem
enta
ry A
lgeb
ra
All
A
rithm
etic
Stu
dent
s
Arit
hmet
ic G
rade
Sca
leTo
ok E
lem
enta
ry
Alg
ebra
Onl
yA
–F
P/F
Mea
n/P
rop.
No.
of
Stu
dent
sN
o. o
f In
st.
Mea
n/P
rop.
No.
of
Stu
dent
sN
o. o
f In
st.
Mea
n/P
rop.
No.
of
Stu
dent
sN
o. o
f In
st.
Mea
n/P
rop.
No.
of
Stu
dent
sN
o. o
f In
st.
AC
T C
ompa
ss P
re-A
lgeb
ra S
core
32
.19
4,6
65
29
32
.59
4,0
88
21
29
.53
38
77
41
.76
9,2
33
29
Arit
hmet
ic G
rade
(Las
t Tim
e Ta
ken)
2
.92
4,0
88
21
1
.00
38
77
Full-
Tim
e E
nrol
lmen
t Sta
tus
0
.21
4,6
65
29
0
.21
4,0
88
21
0
.25
38
77
0
.13
9,2
33
29
Age
at E
ntry
20
.89
4,6
65
29
20
.90
4,0
88
21
21
.03
38
77
20
.69
9,2
33
29
Out
com
e
Type
Leve
l
Suc
cess
in A
rithm
etic
(F
irst T
ime
Take
n)C
or H
ighe
r0
.86
4,0
82
21
B o
r Hig
her
0.6
44
,08
22
1
Pas
s0
.99
37
57
Suc
cess
in E
lem
enta
ry
Alg
ebra
(Firs
t Tim
e Ta
ken)
C o
r Hig
her
0.5
44
,66
52
90
.57
4,0
88
21
0.3
93
87
70
.56
9,2
33
29
B o
r Hig
her
0.3
64
,66
52
90
.37
4,0
88
21
0.2
63
87
70
.42
9,2
33
29
GPA
Yea
r 1 (o
r Las
t GPA
)2
.0 o
r Hig
her
0.7
34
,44
92
80
.73
3,9
33
21
0.7
23
54
70
.62
8,5
33
28
3.0
or H
ighe
r0
.37
4,4
49
28
0.3
73
,93
32
10
.36
35
47
0.3
28
,53
32
8
GPA
Yea
r 22
.0 o
r Hig
her
0.7
82
,86
02
60
.79
2,5
61
20
40
.78
4,2
99
26
3.0
or H
ighe
r0
.32
2,8
60
26
0.3
32
,56
12
04
0.3
64
,29
92
6
GPA
Yea
r 32
.0 o
r Hig
her
0.8
32
,08
02
50
.84
1,8
74
20
30
.83
3,1
58
25
3.0
or H
ighe
r0
.32
2,0
80
25
0.3
21
,87
42
03
0.3
53
,15
82
5
Ret
urn
Fall,
Any
Inst
.Ye
ar 2
0.7
24
,66
52
90
.73
4,0
88
21
0.6
53
87
70
.55
9,2
33
29
Year
30
.46
4,6
65
29
0.4
84
,08
82
10
.38
38
77
0.3
69
,23
32
9
Pro
gres
s to
Deg
ree
Year
20
.28
4,5
77
29
0.2
94
,01
02
10
.31
38
27
0.2
29
,01
12
9
Cer
tific
ate
with
in .
. .4
Yea
rs0
.12
2,1
71
17
0.1
32
,05
51
61
0.0
95
,20
71
7
5 Y
ears
0.1
31
,34
81
70
.13
1,2
86
16
10
.11
3,7
95
17
6 Y
ears
0.1
5
86
01
70
.15
8
16
16
10
.12
2,7
53
17
Ass
ocia
te’s
Deg
ree
with
in .
. .4
Yea
rs0
.11
4,6
65
29
0.1
24
,08
82
10
.08
38
77
0.1
19
,23
32
9
5 Y
ears
0.1
53
,29
52
80
.16
2,8
84
21
0.1
22
74
70
.14
6,8
18
28
6 Y
ears
0.1
72
,28
22
80
.19
1,9
71
21
0.1
22
00
70
.16
5,0
89
28
Ass
ocia
te’s
/Bac
helo
r’s
Deg
ree
with
in .
. .4
Yea
rs0
.11
4,6
65
29
0.1
24
,08
82
10
.09
38
77
0.1
19
,23
32
9
5 Y
ears
0.1
63
,29
52
80
.17
2,8
84
21
0.1
52
74
70
.15
6,8
18
28
6 Y
ears
0.1
92
,28
22
80
.20
1,9
71
21
0.1
52
00
70
.17
5,0
89
28
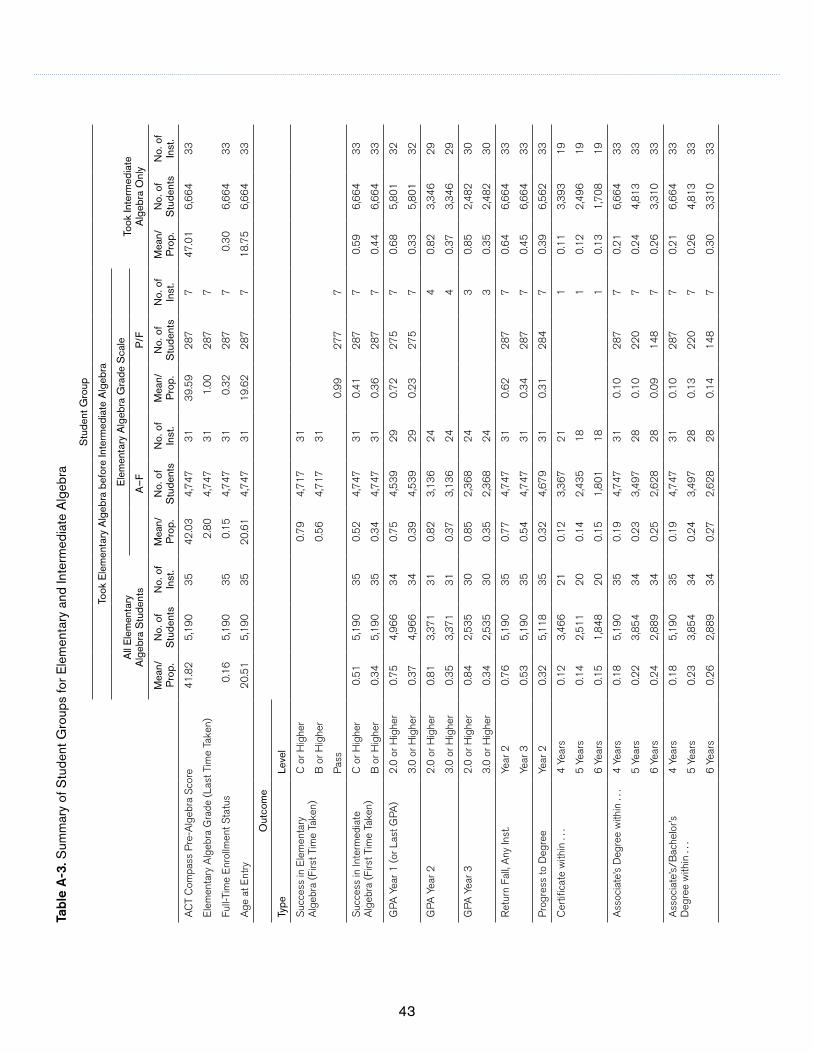
43
Tabl
e A
-3. S
umm
ary
of S
tude
nt G
roup
s fo
r Ele
men
tary
and
Inte
rmed
iate
Alg
ebra
Stu
dent
Gro
up
Took
Ele
men
tary
Alg
ebra
bef
ore
Inte
rmed
iate
Alg
ebra
All
Ele
men
tary
A
lgeb
ra S
tude
nts
Ele
men
tary
Alg
ebra
Gra
de S
cale
Took
Inte
rmed
iate
A
lgeb
ra O
nly
A–
FP
/F
Mea
n/P
rop.
No.
of
Stu
dent
sN
o. o
f In
st.
Mea
n/P
rop.
No.
of
Stu
dent
sN
o. o
f In
st.
Mea
n/P
rop.
No.
of
Stu
dent
sN
o. o
f In
st.
Mea
n/P
rop.
No.
of
Stu
dent
sN
o. o
f In
st.
AC
T C
ompa
ss P
re-A
lgeb
ra S
core
41
.82
5,1
90
35
42
.03
4,7
47
31
39
.59
28
77
47
.01
6,6
64
33
Ele
men
tary
Alg
ebra
Gra
de (L
ast T
ime
Take
n)
2.8
04
,74
73
1
1.0
02
87
7
Full-
Tim
e E
nrol
lmen
t Sta
tus
0
.16
5,1
90
35
0
.15
4,7
47
31
0
.32
28
77
0
.30
6,6
64
33
Age
at E
ntry
20
.51
5,1
90
35
20
.61
4,7
47
31
19
.62
28
77
18
.75
6,6
64
33
Out
com
e
Type
Leve
l
Suc
cess
in E
lem
enta
ry
Alg
ebra
(Firs
t Tim
e Ta
ken)
C o
r Hig
her
0.7
94
,71
73
1
B o
r Hig
her
0.5
64
,71
73
1
Pas
s0
.99
27
77
Suc
cess
in In
term
edia
te
Alg
ebra
(Firs
t Tim
e Ta
ken)
C o
r Hig
her
0.5
15
,19
03
50
.52
4,7
47
31
0.4
12
87
70
.59
6,6
64
33
B o
r Hig
her
0.3
45
,19
03
50
.34
4,7
47
31
0.3
62
87
70
.44
6,6
64
33
GPA
Yea
r 1 (o
r Las
t GPA
)2
.0 o
r Hig
her
0.7
54
,96
63
40
.75
4,5
39
29
0.7
22
75
70
.68
5,8
01
32
3.0
or H
ighe
r0
.37
4,9
66
34
0.3
94
,53
92
90
.23
27
57
0.3
35
,80
13
2
GPA
Yea
r 22
.0 o
r Hig
her
0.8
13
,37
13
10
.82
3,1
36
24
40
.82
3,3
46
29
3.0
or H
ighe
r0
.35
3,3
71
31
0.3
73
,13
62
44
0.3
73
,34
62
9
GPA
Yea
r 32
.0 o
r Hig
her
0.8
42
,53
53
00
.85
2,3
68
24
30
.85
2,4
82
30
3.0
or H
ighe
r0
.34
2,5
35
30
0.3
52
,36
82
43
0.3
52
,48
23
0
Ret
urn
Fall,
Any
Inst
.Ye
ar 2
0.7
65
,19
03
50
.77
4,7
47
31
0.6
22
87
70
.64
6,6
64
33
Year
30
.53
5,1
90
35
0.5
44
,74
73
10
.34
28
77
0.4
56
,66
43
3
Pro
gres
s to
Deg
ree
Year
20
.32
5,1
18
35
0.3
24
,67
93
10
.31
28
47
0.3
96
,56
23
3
Cer
tific
ate
with
in .
. .4
Yea
rs0
.12
3,4
66
21
0.1
23
,36
72
11
0.1
13
,39
31
9
5 Y
ears
0.1
42
,51
12
00
.14
2,4
35
18
10
.12
2,4
96
19
6 Y
ears
0.1
51
,84
82
00
.15
1,8
01
18
10
.13
1,7
08
19
Ass
ocia
te’s
Deg
ree
with
in .
. .4
Yea
rs0
.18
5,1
90
35
0.1
94
,74
73
10
.10
28
77
0.2
16
,66
43
3
5 Y
ears
0.2
23
,85
43
40
.23
3,4
97
28
0.1
02
20
70
.24
4,8
13
33
6 Y
ears
0.2
42
,88
93
40
.25
2,6
28
28
0.0
91
48
70
.26
3,3
10
33
Ass
ocia
te’s
/Bac
helo
r’s
Deg
ree
with
in .
. .4
Yea
rs0
.18
5,1
90
35
0.1
94
,74
73
10
.10
28
77
0.2
16
,66
43
3
5 Y
ears
0.2
33
,85
43
40
.24
3,4
97
28
0.1
32
20
70
.26
4,8
13
33
6 Y
ears
0.2
62
,88
93
40
.27
2,6
28
28
0.1
41
48
70
.30
3,3
10
33

44
ACT Research Report Does Taking Developmental Courses Improve the Success of Students Who First Enroll at Two-Year Colleges?Ta
ble
A-4
. Sum
mar
y of
Stu
dent
Gro
ups
for I
nter
med
iate
and
Col
lege
Alg
ebra
Stu
dent
Gro
up
Took
Inte
rmed
iate
Alg
ebra
bef
ore
Col
lege
Alg
ebra
All
Inte
rmed
iate
A
lgeb
ra S
tude
nts
Inte
rmed
iate
Alg
ebra
Gra
de S
cale
Took
Col
lege
A
lgeb
ra O
nly
A–
FP
/F
Mea
n/P
rop.
No.
of
Stu
dent
sN
o. o
f In
st.
Mea
n/P
rop.
No.
of
Stu
dent
sN
o. o
f In
st.
Mea
n/P
rop.
No.
of
Stu
dent
sN
o. o
f In
st.
Mea
n/P
rop.
No.
of
Stu
dent
sN
o. o
f In
st.
AC
T C
ompa
ss In
term
edia
te A
lgeb
ra S
core
29
.97
4,6
89
33
30
.82
3,4
28
29
27
.52
1,0
21
94
7.4
81
3,1
95
33
Inte
rmed
iate
Alg
ebra
Gra
de (L
ast T
ime
Take
n)
2.8
83
,42
82
9
1.0
01
,02
19
Full-
Tim
e E
nrol
lmen
t Sta
tus
0
.47
4,6
89
33
0
.40
3,4
28
29
0
.73
1,0
21
9
0.5
41
3,1
95
33
Age
at E
ntry
18
.83
4,6
89
33
18
.80
3,4
28
29
18
.96
1,0
21
91
8.3
11
3,1
95
33
Out
com
e
Type
Leve
l
Suc
cess
in In
term
edia
te
Alg
ebra
(Firs
t Tim
e Ta
ken)
C o
r Hig
her
0.8
33
,38
22
9
B o
r Hig
her
0.6
03
,38
22
9
Pas
s0
.99
9
71
9
Suc
cess
in C
olle
ge A
lgeb
ra
(Firs
t Tim
e Ta
ken)
C o
r Hig
her
0.6
04
,68
93
30
.59
3,4
28
29
0.6
91
,02
19
0.6
51
3,1
95
33
B o
r Hig
her
0.3
64
,68
93
30
.34
3,4
28
29
0.4
41
,02
19
0.4
61
3,1
95
33
GPA
Yea
r 1 (o
r Las
t GPA
)2
.0 o
r Hig
her
0.8
24
,25
73
20
.81
3,0
30
28
0.8
61
,00
19
0.7
61
2,3
05
32
3.0
or H
ighe
r0
.42
4,2
57
32
0.4
23
,03
02
80
.45
1,0
01
90
.44
12
,30
53
2
GPA
Yea
r 22
.0 o
r Hig
her
0.8
53
,18
03
20
.86
2,2
70
27
0.8
4
72
88
0.8
8
8,3
00
32
3.0
or H
ighe
r0
.39
3,1
80
32
0.4
02
,27
02
70
.41
7
28
80
.52
8
,30
03
2
GPA
Yea
r 32
.0 o
r Hig
her
0.8
92
,41
13
20
.89
1,7
53
27
0.9
0
52
18
0.9
0
6,0
79
32
3.0
or H
ighe
r0
.38
2,4
11
32
0.3
81
,75
32
70
.39
5
21
80
.51
6
,07
93
2
Ret
urn
Fall,
Any
Inst
.Ye
ar 2
0.8
24
,68
93
30
.82
3,4
28
29
0.8
21
,02
19
0.7
21
3,1
95
33
Year
30
.62
4,6
89
33
0.6
23
,42
82
90
.61
1,0
21
90
.56
13
,19
53
3
Pro
gres
s to
Deg
ree
Year
20
.59
4,6
35
33
0.5
73
,38
22
80
.69
1,0
11
90
.55
12
,97
93
3
Cer
tific
ate
with
in .
. .4
Yea
rs0
.12
2,1
87
19
0.1
22
,07
11
92
0.1
0
4,8
96
19
5 Y
ears
0.1
41
,65
41
90
.14
1,5
57
19
10
.11
3
,64
71
9
6 Y
ears
0.1
31
,19
41
90
.14
1,1
03
18
10
.12
2
,61
01
9
Ass
ocia
te’s
Deg
ree
with
in .
. .4
Yea
rs0
.33
4,6
89
33
0.3
23
,42
82
90
.40
1,0
21
90
.33
13
,19
53
3
5 Y
ears
0.3
73
,50
63
30
.36
2,5
28
29
0.4
4
78
38
0.3
7
9,9
60
33
6 Y
ears
0.4
02
,53
83
30
.39
1,7
79
27
0.4
5
61
18
0.3
9
7,0
72
33
Ass
ocia
te’s
/Bac
helo
r’s
Deg
ree
with
in .
. .4
Yea
rs0
.34
4,6
89
33
0.3
23
,42
82
90
.40
1,0
21
90
.35
13
,19
53
3
5 Y
ears
0.4
03
,50
63
30
.39
2,5
28
29
0.4
8
78
38
0.4
1
9,9
60
33
6 Y
ears
0.4
52
,53
83
30
.43
1,7
79
27
0.5
1
61
18
0.4
5
7,0
72
33

45
Tabl
e A
-5. S
umm
ary
of S
tude
nt G
roup
s fo
r Dev
elop
men
tal R
eadi
ng a
nd F
irst S
ocia
l Sci
ence
Cou
rse
Stu
dent
Gro
up
Took
Dev
elop
men
tal R
eadi
ng b
efor
e Fi
rst S
ocia
l Sci
ence
Cou
rse
All
Dev
elop
men
tal
Rea
ding
Stu
dent
s
Dev
elop
men
tal R
eadi
ng G
rade
Sca
leTo
ok F
irst S
ocia
l S
cien
ce C
ours
e O
nly
A–
FP
/F
Mea
n/P
rop.
No.
of
Stu
dent
sN
o. o
f In
st.
Mea
n/P
rop.
No.
of
Stu
dent
sN
o. o
f In
st.
Mea
n/P
rop.
No.
of
Stu
dent
sN
o. o
f In
st.
Mea
n/P
rop.
No.
of
Stu
dent
sN
o. o
f In
st.
AC
T C
ompa
ss R
eadi
ng S
core
65
.75
8,4
29
34
66
.47
5,7
94
31
64
.41
1,9
02
14
84
.61
40
,48
03
4
Dev
elop
men
tal R
eadi
ng G
rade
(Las
t Tim
e Ta
ken)
2
.82
5,7
94
31
1
.00
1,9
02
14
Full-
Tim
e E
nrol
lmen
t Sta
tus
0
.22
8,4
29
34
0.1
45
,79
43
1
0.4
91
,90
21
4
0.4
04
0,4
80
34
Age
at E
ntry
19
.69
8,4
29
34
19
.77
5,7
94
31
19
.41
1,9
02
14
19
.78
40
,48
03
4
Out
com
e
Type
Leve
l
Suc
cess
in D
evel
opm
enta
l R
eadi
ng (F
irst T
ime
Take
n)C
or H
ighe
r0
.87
5,7
30
31
B o
r Hig
her
0.6
55
,73
03
1
Pas
s1
.00
1,8
27
14
Suc
cess
in S
ocia
l Sci
ence
C
ours
e (F
irst T
ime
Take
n)C
or H
ighe
r0
.53
8,4
29
34
0.5
45
,79
43
10
.59
1,9
02
14
0.6
94
0,4
80
34
B o
r Hig
her
0.3
28
,42
93
40
.32
5,7
94
31
0.3
71
,90
21
40
.51
40
,48
03
4
GPA
Yea
r 1 (o
r Las
t GPA
)2
.0 o
r Hig
her
0.6
67
,71
33
30
.66
5,2
96
29
0.7
41
,78
61
40
.73
37
,01
33
3
3.0
or H
ighe
r0
.30
7,7
13
33
0.3
05
,29
62
90
.34
1,7
86
14
0.4
13
7,0
13
33
GPA
Yea
r 22
.0 o
r Hig
her
0.7
44
,64
13
20
.73
3,3
13
26
0.7
71
,10
01
30
.86
20
,84
73
2
3.0
or H
ighe
r0
.24
4,6
41
32
0.2
53
,31
32
60
.24
1,1
00
13
0.4
62
0,8
47
32
GPA
Yea
r 32
.0 o
r Hig
her
0.7
73
,33
33
30
.78
2,4
31
25
0.8
0
72
71
30
.88
16
,38
13
3
3.0
or H
ighe
r0
.23
3,3
33
33
0.2
42
,43
12
50
.24
7
27
13
0.4
51
6,3
81
33
Ret
urn
Fall,
Any
Inst
.Ye
ar 2
0.6
68
,42
93
40
.68
5,7
94
31
0.7
11
,90
21
40
.66
40
,48
03
4
Year
30
.42
8,4
29
34
0.4
45
,79
43
10
.45
1,9
02
14
0.4
84
0,4
80
34
Pro
gres
s to
Deg
ree
Year
20
.29
8,3
39
34
0.2
55
,73
13
10
.50
1,8
78
14
0.4
43
9,6
75
34
Cer
tific
ate
with
in .
. .4
Yea
rs0
.11
4,6
97
21
0.1
13
,95
82
16
0.1
21
3,8
48
21
5 Y
ears
0.1
23
,30
72
10
.13
2,7
83
21
40
.13
9
,83
42
1
6 Y
ears
0.1
32
,36
72
10
.14
1,9
76
21
40
.14
6
,69
62
1
Ass
ocia
te’s
Deg
ree
with
in .
. .4
Yea
rs0
.14
8,4
29
34
0.1
45
,79
43
10
.19
1,9
02
14
0.2
44
0,4
80
34
5 Y
ears
0.1
86
,07
13
40
.18
4,1
02
31
0.2
21
,43
21
20
.28
30
,31
03
4
6 Y
ears
0.2
04
,39
03
40
.21
2,9
38
30
0.2
31
,04
41
20
.30
21
,51
43
4
Ass
ocia
te’s
/Bac
helo
r’s
Deg
ree
with
in .
. .4
Yea
rs0
.14
8,4
29
34
0.1
45
,79
43
10
.19
1,9
02
14
0.2
54
0,4
80
34
5 Y
ears
0.1
96
,07
13
40
.19
4,1
02
31
0.2
41
,43
21
20
.31
30
,31
03
4
6 Y
ears
0.2
24
,39
03
40
.22
2,9
38
30
0.2
61
,04
41
20
.34
21
,51
43
4

46
ACT Research Report Does Taking Developmental Courses Improve the Success of Students Who First Enroll at Two-Year Colleges?
Appendix B Pooled Descriptive Results for Students Who
Took No Additional Coursework in Subject Area
Tables B-1 through B-5
Table B-1. Summary of Students Who Took Developmental English Composition and No Subsequent English Courses (Number of Institutions = 33)
Mean/ Prop.
No. of Students
Minority 0.19 5,906
In-State Student 0.45 5,906
High School GPA 2.50 5,906
ACT Compass Writing Score 38.37 5,906
Outcome
Type Level
Developmental English Composition Grade (Last Time Taken)
A–F 1.79 3,870
P/F 0.99 283
Full-Time Enrollment Status 0.04 5,906
Age at Entry 20.86 5,906
Success in Developmental English Composition (First Time Taken)
C or Higher 0.39 5,281
B or Higher 0.29 5,281
Pass 0.73 384
GPA Year 1 (or Last GPA) 2.0 or Higher 0.36 4,616
3.0 or Higher 0.17 4,616
GPA Year 2 2.0 or Higher 0.54 653
3.0 or Higher 0.24 653
GPA Year 3 2.0 or Higher 0.60 356
3.0 or Higher 0.21 356
Return Fall, Any Inst. Year 2 0.18 5,906
Year 3 0.05 5,906
Progress to Degree Year 2 0.02 5,766
Certificate within . . . 4 Years 0.06 2,912
5 Years 0.07 1,866
6 Years 0.06 1,309
Associate’s Degree within . . . 4 Years 5,906
5 Years 3,962
6 Years 2,883
Associate’s/Bachelor’s Degree within . . .
4 Years 5,906
5 Years 3,962
6 Years 2,883

47
Table B-2. Summary of Students Who Took Arithmetic and No Subsequent Math Courses (Number of Institutions = 34)
Mean/ Prop.
No. of Students
Minority 0.18 5,705
Female 0.60 5,705
In-State Student 0.41 5,705
High School GPA 2.48 5,705
ACT Compass Pre-Algebra Score 29.51 5,705
Outcome
Type Level
Arithmetic Grade (Last Time Taken)
A–F 1.57 3,099
P/F 1.00 283
Full-Time Enrollment Status 0.08 5,705
Age at Entry 21.44 5,705
Success in Arithmetic (First Time Taken)
C or Higher 0.30 4,624
B or Higher 0.23 4,624
Pass 0.49 577
GPA Year 1 (or Last GPA) 2.0 or Higher 0.40 4,329
3.0 or Higher 0.20 4,329
GPA Year 2 2.0 or Higher 0.64 847
3.0 or Higher 0.24 847
GPA Year 3 2.0 or Higher 0.68 488
3.0 or Higher 0.24 488
Return Fall, Any Inst. Year 2 0.22 5,705
Year 3 0.08 5,705
Progress to Degree Year 2 0.05 5,613
Certificate within . . . 4 Years 0.06 1,901
5 Years 0.07 1,092
6 Years 0.06 715
Associate’s Degree within . . . 4 Years 0.01 5,705
5 Years 0.01 3,752
6 Years 0.01 2,637
Associate’s/Bachelor’s Degree within . . .
4 Years 0.01 5,705
5 Years 0.01 3,752
6 Years 0.01 2,637

48
ACT Research Report Does Taking Developmental Courses Improve the Success of Students Who First Enroll at Two-Year Colleges?
Table B-3. Summary of Students Who Took Elementary Algebra and No Subsequent Math Courses (Number of Institutions = 37)
Mean/ Prop.
No. of Students
Minority 0.15 6,445
In-State Student 0.48 6,445
High School GPA 2.59 6,445
ACT Compass Pre-Algebra Score 39.04 6,445
Outcome
Type Level
Elementary Algebra Grade (Last Time Taken)
A–F 1.50 3,806
P/F 0.95 412
Full-Time Enrollment Status 0.08 6,445
Age at Entry 20.79 6,445
Success in Elementary Algebra (First Time Taken)
C or Higher 0.30 5,366
B or Higher 0.23 5,366
Pass 0.55 711
GPA Year 1 (or Last GPA) 2.0 or Higher 0.41 5,583
3.0 or Higher 0.18 5,583
GPA Year 2 2.0 or Higher 0.59 1,207
3.0 or Higher 0.24 1,207
GPA Year 3 2.0 or Higher 0.63 700
3.0 or Higher 0.25 700
Return Fall, Any Inst. Year 2 0.27 6,445
Year 3 0.10 6,445
Progress to Degree Year 2 0.07 6,309
Certificate within . . . 4 Years 0.06 3,602
5 Years 0.06 2,513
6 Years 0.06 1,750
Associate’s Degree within . . . 4 Years 0.02 6,445
5 Years 0.02 4,523
6 Years 0.02 3,248
Associate’s/Bachelor’s Degree within . . .
4 Years 0.02 6,445
5 Years 0.02 4,523
6 Years 0.02 3,248

49
Table B-4. Summary of Students Who Took Intermediate Algebra and No Subsequent Math Courses (Number of Institutions = 33)
Mean/ Prop.
No. of Students
Minority 0.22 3,186
In-State Student 0.66 3,186
High School GPA 2.80 3,186
ACT Compass Algebra Score 28.82 3,186
Outcome
Type Level
Intermediate Algebra Grade (Last Time Taken)
A–F 1.78 1,751
P/F 0.89 211
Full-Time Enrollment Status 0.16 3,186
Age at Entry 18.93 3,186
Success in Intermediate Algebra (First Time Taken)
C or Higher 0.33 2,580
B or Higher 0.27 2,580
Pass 0.57 329
GPA Year 1 (or Last GPA) 2.0 or Higher 0.49 2,669
3.0 or Higher 0.22 2,669
GPA Year 2 2.0 or Higher 0.67 741
3.0 or Higher 0.31 741
GPA Year 3 2.0 or Higher 0.73 420
3.0 or Higher 0.30 420
Return Fall, Any Inst. Year 2 0.34 3,186
Year 3 0.15 3,186
Progress to Degree Year 2 0.13 3,130
Certificate within . . . 4 Years 0.08 1,329
5 Years 0.08 948
6 Years 0.09 657
Associate’s Degree within . . . 4 Years 0.05 3,186
5 Years 0.05 2,201
6 Years 0.05 1,510
Associate’s/Bachelor’s Degree within . . .
4 Years 0.05 3,186
5 Years 0.05 2,201
6 Years 0.06 1,510

50
ACT Research Report Does Taking Developmental Courses Improve the Success of Students Who First Enroll at Two-Year Colleges?
Table B-5. Summary of Students Who Took Developmental Reading and No Subsequent Social Science Courses (Number of Institutions = 35)
Mean/ Prop.
No. of Students
Minority 0.20 4,638
In-State Student 0.41 4,638
High School GPA 2.45 4,638
ACT Compass Reading Score 61.95 4,638
Outcome
Type Level
Developmental Reading Grade (Last Time Taken)
A–F 2.01 2,872
P/F 1.00 416
Full-Time Enrollment Status 0.05 4,638
Age at Entry 20.71 4,638
Success in Developmental Reading (First Time Taken)
C or Higher 0.47 3,839
B or Higher 0.33 3,839
Pass 0.73 570
GPA Year 1 (or Last GPA) 2.0 or Higher 0.38 3,811
3.0 or Higher 0.19 3,811
GPA Year 2 2.0 or Higher 0.63 534
3.0 or Higher 0.28 534
GPA Year 3 2.0 or Higher 0.66 265
3.0 or Higher 0.22 265
Return Fall, Any Inst. Year 2 0.19 4,638
Year 3 0.05 4,638
Progress to Degree Year 2 0.03 4,576
Certificate within . . . 4 Years 0.07 2,826
5 Years 0.07 1,818
6 Years 0.07 1,275
Associate’s Degree within . . . 4 Years 0.01 4,638
5 Years 3,017
6 Years 2,185
Associate’s/Bachelor’s Degree within . . .
4 Years 0.01 4,638
5 Years 3,017
6 Years 2,185

51
Appendix C Hierarchical Logistic Regression Models for
Predicting Success in College
Tables C-1 through C-21Notes: Certificate completion rates were based on data from only one of the two states that provided data for this study. ACT Compass Test scores are: Writing Skills (for Developmental English Composition), Pre-Algebra (for Arithmetic and Elementary Algebra), Algebra for Intermediate Algebra, and Reading (for Developmental Reading). The shaded coefficients are not statistically significantly different from zero (p > .05 for institution-level coefficients; p > .01 for all student-level coefficients). Non-statistically significant (p > .05) variance components are shaded.
Table C-1. Hierarchical Logistic Regression Models for Predicting Success in Developmental Courses1
Fixed Effects
Institution-Level Effects Student-Level Effects Variance Components
FT and Age ≤ 21 Vs.
Developmental Course
Outcome Level Intercept
Mean ACT Compass Test Score
ACT Compass Test Score
Prop.Score
PT and Age ≤ 21
Age 22–25 Age > 25 Intercept
Standard Error
Developmental English Composition
C or Higher 0.64 -0.03 0.01 -1.47 -1.26 -1.14 -0.91 1.7814 0.5853
B or Higher -0.03 -0.05 0.01 -1.50 -0.83 -0.55 -0.26 1.8436 0.5759
Pass
Arithmetic C or Higher -0.07 0.12 0.03 -1.70 -1.35 -0.96 -0.76 1.8461 0.5891
B or Higher -0.61 0.08 0.04 -1.51 -0.88 -0.43 -0.18 1.7763 0.5600
Pass
Elementary Algebra
C or Higher -0.07 -0.06 0.02 -1.15 -1.01 -0.80 -0.52 2.2461 0.6348
B or Higher -0.63 -0.08 0.02 -0.92 -0.70 -0.44 -0.17 2.2664 0.6720
Pass 0.81 -0.14 0.02 -1.42 -1.85 -1.76 -1.14 3.0444 1.9466
Intermediate Algebra
C or Higher 0.38 -0.07 0.03 -1.40 -1.34 -0.78 -0.48 1.3299 0.3881
B or Higher -0.27 -0.09 0.04 -1.26 -1.03 -0.34 -0.08 1.4077 0.3972
Pass 2.52 -0.28 0.03 -1.38 -2.25 -1.00 -0.87 4.5914 2.5953
Developmental Reading
C or Higher 0.54 0.03 0.02 -0.87 -1.62 -1.84 -1.60 3.1962 0.9635
B or Higher -0.17 <0.01 0.02 -1.37 -1.11 -1.16 -0.89 2.8863 0.8733
Pass1 The first time the course was taken.

52
ACT Research Report Does Taking Developmental Courses Improve the Success of Students Who First Enroll at Two-Year Colleges?
Tabl
e C
-2. F
ixed
Effe
cts
of H
iera
rchi
cal L
ogis
tic R
egre
ssio
n M
odel
s fo
r Pre
dict
ing
Sub
sequ
ent C
olle
ge S
ucce
ss fo
r S
tude
nts
Who
Did
/Did
Not
Tak
e D
evel
opm
enta
l Eng
lish
Com
posi
tion
befo
re F
irst S
tand
ard
Eng
lish
Com
posi
tion
Out
com
eIn
stitu
tion-
Leve
l Effe
cts
Pro
p. F
T an
d A
ge ≤
21
Vs.
Type
Leve
lIn
terc
ept
Pro
p. P
T an
d A
ge ≤
21
Pro
p. A
ge
22–
25P
rop.
Age
>
25
Suc
cess
in S
tand
ard
Eng
lish
Com
posi
tion
C o
r Hig
her
0.7
2<
0.0
13
.00
-0.6
3
B o
r Hig
her
-0.1
00
.08
1.8
30
.70
GPA
Yea
r 1 (o
r Las
t GPA
)2
.0 o
r Hig
her
0.9
1-0
.58
3.9
8-1
.49
3.0
or H
ighe
r-0
.55
-0.4
73
.43
-0.0
5
GPA
Yea
r 22
.0 o
r Hig
her
1.4
70
.33
4.9
3-2
.39
3.0
or H
ighe
r-0
.53
-0.3
34
.96
-0.7
3
GPA
Yea
r 32
.0 o
r Hig
her
1.8
20
.22
5.8
4-1
.42
3.0
or H
ighe
r-0
.55
-0.2
75
.12
-0.7
7
Ret
urn
Fall,
Any
Inst
.Ye
ar 2
0.7
21
.09
3.6
6-1
.53
Year
3-0
.26
1.2
02
.99
-1.4
3
Pro
gres
s to
Deg
ree
Year
2-0
.72
-0.9
07
.18
-5.2
0
Cer
tific
ate
with
in .
. .4
Yea
rs-2
.02
-6.1
1-7
.86
4.7
1
5 Y
ears
-1.8
4-5
.09
-5.7
13
.40
6 Y
ears
-1.7
1-4
.60
-3.4
61
.87
Ass
ocia
te’s
Deg
ree
with
in .
. .4
Yea
rs-1
.72
-1.7
58
.45
-5.3
9
5 Y
ears
-1.4
8-1
.17
7.5
0-4
.63
6 Y
ears
-1.2
9-0
.41
6.0
1-4
.01
Ass
ocia
te’s
/Bac
helo
r’s
Deg
ree
with
in .
. .4
Yea
rs-1
.70
-1.7
08
.55
-5.4
1
5 Y
ears
-1.3
9-0
.82
6.8
5-4
.85
6 Y
ears
-1.1
7-0
.32
5.7
9-4
.13

53
Tabl
e C
-2. (
cont
inue
d)
Out
com
eS
tude
nt-L
evel
Effe
cts
Dev
elop
men
tal C
ours
e Ta
ken
Inte
ract
ion
with
FT a
nd A
ge ≤
21
Vs.
FT a
nd A
ge ≤
21
Vs.
Type
Leve
lD
evel
opm
enta
l C
ours
e Ta
ken
AC
T C
ompa
ss
Writ
ing
Sco
reP
rop.
S
core
PT
and
A
ge
≤ 2
1 A
ge
22–
25A
ge >
25
Test
S
core
Pro
p.
Sco
re
PT
and
Age
≤
21
Age
22
–25
Age
> 2
5
Suc
cess
in S
tand
ard
Eng
lish
Com
posi
tion
C o
r Hig
her
0.4
1<
0.0
1-2
.70
-1.8
7-1
.36
-0.9
6<
0.0
11
.25
1.2
11
.03
0.6
7
B o
r Hig
her
0.3
30
.01
-2.9
1-1
.37
-0.7
0-0
.23
<0
.01
1.5
50
.87
0.6
10
.37
GPA
Yea
r 1 (o
r Las
t GPA
)2
.0 o
r Hig
her
0.1
80
.01
-3.0
7-1
.87
-1.0
2-0
.52
-0.0
12
.59
1.2
70
.93
0.7
0
3.0
or H
ighe
r0
.01
0.0
1-3
.06
-1.2
9-0
.23
0.4
5-0
.01
2.6
00
.78
0.5
0-0
.05
GPA
Yea
r 22
.0 o
r Hig
her
0.4
80
.01
-3.6
4-1
.32
-0.1
80
.53
-0.0
12
.31
0.3
3-0
.01
-0.3
4
3.0
or H
ighe
r0
.23
0.0
2-4
.05
-1.0
10
.15
0.9
4-0
.01
2.3
80
.24
<0
.01
-0.4
7
GPA
Yea
r 32
.0 o
r Hig
her
0.3
80
.01
-4.1
6-1
.39
-0.2
50
.55
<0
.01
1.9
20
.42
0.1
2-0
.60
3.0
or H
ighe
r0
.24
0.0
2-4
.23
-0.8
60
.21
1.0
3-0
.01
2.0
60
.23
0.1
3-0
.50
Ret
urn
Fall,
Any
Inst
.Ye
ar 2
0.0
3<
0.0
1-1
.76
-2.0
6-1
.67
-1.4
0-0
.01
2.4
21
.44
1.2
71
.15
Year
30
.11
<0
.01
-2.4
2-1
.78
-1.3
8-0
.98
-0.0
12
.78
1.1
61
.03
0.5
7
Pro
gres
s to
Deg
ree
Year
20
.24
<0
.01
-2.7
9-2
.77
-2.0
9-1
.86
<0
.01
0.1
20
.60
0.3
20
.17
Cer
tific
ate
with
in .
. .4
Yea
rs-0
.11
<0
.01
0.3
3-0
.78
-0.2
5-0
.20
<0
.01
0.1
7-0
.13
-0.3
2-0
.35
5 Y
ears
-0.1
8-0
.01
-0.0
9-0
.77
-0.2
3-0
.09
0.0
10
.42
-0.0
9-0
.26
-0.3
7
6 Y
ears
-0.2
0-0
.01
-0.1
4-0
.69
-0.2
40
.05
0.0
11
.06
-0.0
8-0
.37
-0.5
7
Ass
ocia
te’s
Deg
ree
w
ithin
. . .
4 Y
ears
0.1
90
.01
-3.6
0-1
.96
-1.2
0-0
.87
<0
.01
2.1
20
.89
0.4
70
.15
5 Y
ears
0.2
2<
0.0
1-3
.75
-1.8
2-1
.15
-0.6
8<
0.0
12
.46
0.8
50
.41
-0.0
8
6 Y
ears
0.1
6<
0.0
1-3
.56
-1.7
5-1
.20
-0.6
2<
0.0
12
.67
0.8
20
.71
-0.1
1
Ass
ocia
te’s
/Bac
helo
r’s
Deg
ree
with
in .
. .4
Yea
rs0
.20
0.0
1-3
.75
-2.0
3-1
.26
-0.9
1<
0.0
12
.18
0.9
40
.52
0.1
3
5 Y
ears
0.2
70
.01
-4.3
5-1
.98
-1.2
8-0
.82
<0
.01
3.0
50
.93
0.4
5-0
.03
6 Y
ears
0.2
40
.01
-4.1
8-1
.96
-1.4
0-0
.87
<0
.01
2.9
90
.95
0.7
60
.02

54
ACT Research Report Does Taking Developmental Courses Improve the Success of Students Who First Enroll at Two-Year Colleges?
Table C-3. Variance Components of Hierarchical Logistic Regression Models for Predicting Subsequent College Success for Students Who Did/Did Not Take Developmental English Composition before First Standard English Composition
Outcome Variance Component
Type Level Intercept Standard Error
Success in Standard English Composition
C or Higher 0.1450 0.0477
B or Higher 0.1434 0.0417
GPA Year 1 (or Last GPA) 2.0 or Higher 0.0475 0.0155
3.0 or Higher 0.0525 0.0167
GPA Year 2 2.0 or Higher 0.1295 0.0438
3.0 or Higher 0.0361 0.0132
GPA Year 3 2.0 or Higher 0.0676 0.0298
3.0 or Higher 0.0175 0.0088
Return Fall, Any Inst. Year 2 0.0185 0.0063
Year 3 0.0281 0.0095
Progress to Degree Year 2 0.0111 0.0053
Certificate within . . . 4 Years 0.2304 0.0879
5 Years 0.2619 0.1022
6 Years 0.2527 0.1011
Associate’s Degree within . . . 4 Years 0.0515 0.0174
5 Years 0.0592 0.0214
6 Years 0.0543 0.0205
Associate’s/Bachelor’s Degree within . . .
4 Years 0.0492 0.0173
5 Years 0.0464 0.0174
6 Years 0.0453 0.0179

55
Table C-4. Fixed Effects of Hierarchical Logistic Regression Models for Predicting Subsequent College Success for Students Who Took Developmental English Composition (Grade Scale A–F) before Standard English Composition
Outcome Institution-Level Effects
Prop. FT and Age ≤ 21 Vs.
Type Level InterceptProp. PT and
Age ≤ 21Prop. Age
22–25Prop. Age
> 25
Success in Standard English Composition
C or Higher 0.48 1.58 2.73 1.12
B or Higher -0.45 1.83 0.67 1.87
GPA Year 1 (or Last GPA) 2.0 or Higher 0.90 -0.34 5.90 -2.00
3.0 or Higher -0.79 0.07 3.93 -0.20
GPA Year 2 2.0 or Higher 1.15 0.58 2.96 0.22
3.0 or Higher -1.14 0.62 3.28 -0.16
GPA Year 3 2.0 or Higher 1.47 -0.51 4.32 -2.25
3.0 or Higher -1.09 0.51 4.53 -2.38
Return Fall, Any Inst. Year 2 0.94 0.75 5.55 -1.70
Year 3 -0.23 1.86 4.63 1.03
Progress to Degree Year 2 -1.30 -1.43 6.39 -7.17
Certificate within . . . 4 Years -2.03 -3.46 -4.14 -0.32
5 Years -1.85 -3.41 -1.98 -1.42
6 Years -1.81 -4.14 -1.39 -4.30
Associate’s Degree within . . . 4 Years -2.17 -0.99 9.17 -4.51
5 Years -1.84 0.30 7.47 -3.20
6 Years -1.69 -0.44 9.43 -5.78
Associate’s/Bachelor’s Degree within . . .
4 Years -2.16 -0.92 9.18 -4.50
5 Years -1.82 0.72 7.18 -3.79
6 Years -1.59 0.07 8.07 -4.51

56
ACT Research Report Does Taking Developmental Courses Improve the Success of Students Who First Enroll at Two-Year Colleges?
Table C-4. (continued)
Outcome Student-Level Effects
FT and Age ≤ 21 Vs.
Type Level
ACT Compass Writing Score
Prop. Score
Developmental Course Grade
PT and Age ≤ 21
Age 22–25
Age > 25
Test Score by Developmental Course Grade
Interaction
Success in Standard English Composition
C or Higher <0.01 -1.45 0.48 -0.66 -0.44 -0.40 <0.01
B or Higher <0.01 -1.14 0.55 -0.66 -0.28 -0.13 <0.01
GPA Year 1 (or Last GPA) 2.0 or Higher <0.01 -1.06 0.51 -0.59 -0.11 0.12 <0.01
3.0 or Higher <0.01 -0.51 0.62 -0.55 0.13 0.22 <0.01
GPA Year 2 2.0 or Higher <0.01 -1.36 0.52 -1.03 -0.35 -0.03 <0.01
3.0 or Higher <0.01 -1.55 0.78 -0.98 -0.11 0.10 0.01
GPA Year 3 2.0 or Higher <0.01 -2.30 0.53 -0.90 -0.09 -0.12 <0.01
3.0 or Higher <0.01 -1.95 0.64 -0.79 0.08 0.18 0.01
Return Fall, Any Inst. Year 2 -0.01 -0.64 0.26 -0.64 -0.50 -0.23 <0.01
Year 3 -0.01 -0.33 0.34 -0.80 -0.63 -0.59 <0.01
Progress to Degree Year 2 <0.01 -3.08 0.37 -2.20 -1.90 -1.79 <0.01
Certificate within . . . 4 Years <0.01 0.39 0.24 -1.03 -0.74 -0.60 <0.01
5 Years <0.01 0.37 0.31 -0.83 -0.54 -0.44 -0.01
6 Years <0.01 1.40 0.36 -0.63 -0.53 -0.39 -0.01
Associate’s Degree within . . . 4 Years <0.01 -2.06 0.41 -1.29 -1.12 -1.12 <0.01
5 Years <0.01 -1.82 0.36 -1.19 -1.06 -1.03 <0.01
6 Years <0.01 -1.31 0.35 -1.15 -0.82 -1.00 <0.01
Associate’s/Bachelor’s Degree within . . .
4 Years <0.01 -2.03 0.42 -1.31 -1.15 -1.12 <0.01
5 Years <0.01 -2.02 0.38 -1.24 -1.15 -1.06 <0.01
6 Years <0.01 -1.69 0.36 -1.18 -0.87 -1.03 <0.01

57
Table C-5. Variance Components of Hierarchical Logistic Regression Models for Predicting Subsequent College Success for Students Who Took Developmental English Composition (Grade Scale A–F) before Standard English Composition
Outcome Variance Component
Type Level Intercept Standard Error
Success in Standard English Composition
C or Higher 0.0699 0.0330
B or Higher 0.0643 0.0317
GPA Year 1 (or Last GPA) 2.0 or Higher 0.2067 0.0782
3.0 or Higher 0.1741 0.0651
GPA Year 2 2.0 or Higher 0.1924 0.0880
3.0 or Higher 0.2065 0.0943
GPA Year 3 2.0 or Higher 0.1900 0.0978
3.0 or Higher 0.0461 0.0395
Return Fall, Any Inst. Year 2 0.0950 0.0401
Year 3 0.0947 0.0405
Progress to Degree Year 2 0.1318 0.0582
Certificate within . . . 4 Years 0.3227 0.1409
5 Years 0.2711 0.1260
6 Years 0.2360 0.1246
Associate’s Degree within . . . 4 Years 0.3234 0.1298
5 Years 0.3118 0.1334
6 Years 0.2414 0.1135
Associate’s/Bachelor’s Degree within . . .
4 Years 0.3168 0.1276
5 Years 0.2973 0.1283
6 Years 0.2529 0.1183

58
ACT Research Report Does Taking Developmental Courses Improve the Success of Students Who First Enroll at Two-Year Colleges?
Tabl
e C
-6. F
ixed
Effe
cts
of H
iera
rchi
cal L
ogis
tic R
egre
ssio
n M
odel
s fo
r Pre
dict
ing
Sub
sequ
ent C
olle
ge S
ucce
ss fo
r Stu
dent
s W
ho D
id/D
id N
ot T
ake
Arit
hmet
ic b
efor
e E
lem
enta
ry A
lgeb
ra
Out
com
eIn
stitu
tion-
Leve
l Effe
cts
Pro
p. F
T an
d A
ge ≤
21
Vs.
Type
Leve
lIn
terc
ept
Mea
n A
CT
Com
pass
S
core
Pro
p.
Dev
elop
men
tal
Cou
rse
Take
n by
M
ean
Test
Sco
re
Inte
ract
ion
Pro
p. P
T an
d A
ge ≤
21
Pro
p. A
ge
22–
25P
rop.
Age
>
25
Suc
cess
in E
lem
enta
ry
Alg
ebra
C o
r Hig
her
0.0
9-0
.07
-0.0
31
.50
-0.1
63
.95
B o
r Hig
her
-0.5
8-0
.08
-0.0
43
.18
1.0
63
.83
GPA
Yea
r 1 (o
r Las
t GPA
)2
.0 o
r Hig
her
0.9
9-0
.01
0.0
3-0
.80
2.1
81
.58
3.0
or H
ighe
r-0
.50
-0.0
20
.01
-0.2
32
.31
1.7
9
GPA
Yea
r 22
.0 o
r Hig
her
1.3
5<
0.0
10
.02
-0.7
70
.69
2.1
4
3.0
or H
ighe
r-0
.70
-0.0
1<
0.0
1-0
.70
1.0
11
.83
GPA
Yea
r 32
.0 o
r Hig
her
1.6
30
.01
0.0
1-1
.30
-0.0
71
.06
3.0
or H
ighe
r-0
.73
<0
.01
<0
.01
-0.6
5-0
.44
1.5
5
Ret
urn
Fall,
Any
Inst
.Ye
ar 2
0.7
90
.02
0.0
3-0
.15
2.0
91
.34
Year
3-0
.37
0.0
20
.02
0.0
21
.13
1.8
5
Pro
gres
s to
Deg
ree
Year
2-1
.26
0.0
20
.03
-1.9
5-0
.57
-1.3
3
Cer
tific
ate
with
in .
. .4
Yea
rs-2
.28
-0.0
90
.05
-8.7
75
.62
-3.7
1
5 Y
ears
-2.2
5-0
.03
0.0
2-8
.29
-0.0
8-4
.89
6 Y
ears
-1.9
1-0
.02
<0
.01
-5.7
62
.43
-6.6
4
Ass
ocia
te’s
Deg
ree
with
in .
. .4
Yea
rs-2
.22
-0.0
10
.03
-1.6
02
.53
-1.0
3
5 Y
ears
-1.8
70
.01
0.0
2-1
.01
1.9
0-0
.93
6 Y
ears
-1.7
70
.01
0.0
3-0
.59
-0.0
20
.11
Ass
ocia
te’s
/Bac
helo
r’s
Deg
ree
with
in .
. .4
Yea
rs-2
.20
<0
.01
0.0
3-1
.50
2.3
7-0
.85
5 Y
ears
-1.8
10
.01
0.0
2-1
.02
1.1
7-0
.62
6 Y
ears
-1.6
60
.01
0.0
2-0
.67
-0.4
1-0
.10

59
Tabl
e C
-6. (
cont
inue
d)
Out
com
eS
tude
nt-L
evel
Effe
cts
Dev
elop
men
tal C
ours
e Ta
ken
Inte
ract
ion
with
FT a
nd A
ge ≤
21
Vs.
FT a
nd A
ge ≤
21
Vs.
Type
Leve
lD
evel
opm
enta
l C
ours
e Ta
ken
AC
T C
ompa
ss
Pre
-Alg
ebra
S
core
Pro
p.
Sco
re
PT
and
Age
≤
21
Age
22
–25
Age
> 2
5P
rop.
S
core
PT
and
Age
≤
21
Age
22
–25
Age
> 2
5
Suc
cess
in
Ele
men
tary
Alg
ebra
C o
r Hig
her
-0.0
70
.02
0.2
5-1
.18
-1.1
7-0
.95
-0.6
50
.30
0.5
70
.45
B o
r Hig
her
0.0
50
.02
0.8
9-0
.92
-0.8
3-0
.60
-1.6
50
.38
0.5
00
.55
GPA
Yea
r 1 (o
r Las
t GPA
)2
.0 o
r Hig
her
-0.5
00
.01
0.7
3-1
.34
-1.2
1-0
.99
-1.9
20
.85
1.2
41
.45
3.0
or H
ighe
r-0
.34
0.0
11
.54
-0.8
4-0
.44
-0.0
6-1
.18
0.7
90
.98
1.0
4
GPA
Yea
r 22
.0 o
r Hig
her
0.0
60
.01
-0.2
6-0
.99
-0.4
3-0
.01
-1.2
80
.46
0.8
20
.43
3.0
or H
ighe
r0
.01
0.0
20
.02
-0.6
20
.21
0.4
9-1
.17
0.3
00
.23
0.4
6
GPA
Yea
r 32
.0 o
r Hig
her
0.0
70
.01
-1.2
1-1
.01
-0.2
20
.09
-0.2
30
.54
0.3
60
.30
3.0
or H
ighe
r0
.01
0.0
2-0
.20
-0.4
50
.42
0.7
2-1
.21
0.2
20
.11
0.2
5
Ret
urn
Fall,
Any
Inst
.Ye
ar 2
-0.6
5<
0.0
10
.31
-1.8
0-1
.86
-1.6
1-1
.13
0.7
80
.97
0.9
8
Year
3-0
.40
<0
.01
0.1
3-1
.48
-1.5
5-1
.13
-1.0
60
.53
0.9
40
.80
Pro
gres
s to
Deg
ree
Year
2-0
.05
0.0
1-2
.02
-2.5
5-2
.36
-2.0
51
.47
0.2
70
.40
0.3
0
Cer
tific
ate
with
in .
. .4
Yea
rs-0
.11
<0
.01
0.7
7-1
.10
-0.8
0-0
.71
-0.1
30
.01
0.3
0<
0.0
1
5 Y
ears
0.0
6<
0.0
10
.91
-1.1
6-0
.74
-0.7
61
.76
-0.0
50
.12
-0.0
4
6 Y
ears
-0.1
5<
0.0
12
.47
-0.9
8-0
.60
-0.3
9-0
.18
-0.5
8-0
.46
-0.6
2
Ass
ocia
te’s
Deg
ree
w
ithin
. . .
4 Y
ears
<0
.01
0.0
1-0
.17
-1.6
7-1
.40
-1.0
7-0
.78
0.4
60
.64
0.3
6
5 Y
ears
-0.0
40
.01
0.3
3-1
.43
-1.3
6-0
.95
-1.9
40
.36
0.4
10
.31
6 Y
ears
0.0
10
.01
-0.7
6-1
.44
-1.3
0-0
.86
-1.4
60
.32
0.5
30
.41
Ass
ocia
te’s
/Bac
helo
r’s
Deg
ree
with
in .
. .4
Yea
rs-0
.01
0.0
1-0
.31
-1.7
3-1
.47
-1.1
2-0
.74
0.4
80
.67
0.4
0
5 Y
ears
-0.0
30
.01
-0.3
6-1
.59
-1.5
4-1
.10
-1.7
30
.45
0.4
90
.39
6 Y
ears
-0.0
10
.01
-1.4
4-1
.60
-1.4
8-1
.03
-1.2
60
.38
0.5
40
.43

60
ACT Research Report Does Taking Developmental Courses Improve the Success of Students Who First Enroll at Two-Year Colleges?
Table C-7. Variance Components of Hierarchical Logistic Regression Models for Predicting Subsequent College Success for Students Who Did/Did Not Take Arithmetic before Elementary Algebra
Outcome Variance Component
Type Level Intercept Standard Error
Elementary Algebra C or Higher 1.5840 0.4727
B or Higher 1.4609 0.4443
GPA Year 1 (or Last GPA) 2.0 or Higher 0.0851 0.0311
3.0 or Higher 0.0784 0.0293
GPA Year 2 2.0 or Higher 0.0292 0.0190
3.0 or Higher 0.0334 0.0217
GPA Year 3 2.0 or Higher 0.0540 0.0395
3.0 or Higher 0.0000
Return Fall, Any Inst. Year 2 0.0881 0.0340
Year 3 0.1235 0.0487
Progress to Degree Year 2 0.0694 0.0270
Certificate within . . . 4 Years 0.2109 0.0893
5 Years 0.5138 0.2208
6 Years 0.4979 0.2172
Associate’s Degree within . . . 4 Years 0.0657 0.0322
5 Years 0.0980 0.0533
6 Years 0.0830 0.0614
Associate’s/Bachelor’s Degree within . . .
4 Years 0.0542 0.0273
5 Years 0.0576 0.0356
6 Years 0.0429 0.0362

61
Table C-8. Fixed Effects of Hierarchical Logistic Regression Models for Predicting Subsequent College Success for Students Who Took Arithmetic (Grade Scale A–F) before Elementary Algebra
Outcome Institution-Level Effects
Prop. FT and Age ≤ 21 Vs.
Type Level Intercept
Mean Developmental Course Grade
Prop. PT and Age ≤ 21
Prop. Age 22–25
Prop. Age > 25
Success in Elementary Algebra
C or Higher 0.27 0.75 0.79 -3.38 3.79
B or Higher -0.64 0.93 1.45 -1.77 2.24
GPA Year 1 (or Last GPA) 2.0 or Higher 1.08 -0.40 0.20 1.27 0.74
3.0 or Higher -0.56 -0.76 0.45 3.38 0.58
GPA Year 2 2.0 or Higher 1.42 -0.47 -0.47 0.30 0.85
3.0 or Higher -0.86 -0.74 -0.12 1.83 2.04
GPA Year 3 2.0 or Higher 1.75 -0.26 -1.50 -2.03 0.50
3.0 or Higher -0.85 -0.62 -1.04 -0.24 1.07
Return Fall, Any Inst. Year 2 0.98 -0.24 0.87 0.05 1.99
Year 3 -0.18 -0.44 0.97 -0.59 2.84
Progress to Degree Year 2 -1.16 0.02 -1.61 -2.99 -2.33
Certificate within . . . 4 Years -2.10 -0.57 -7.15 1.22 -7.10
5 Years -2.02 0.33 -1.31 1.64 -0.26
6 Years -1.81 0.57 0.78 4.22 0.91
Associate’s Degree within . . . 4 Years -2.19 -0.06 -0.15 1.98 -2.22
5 Years -1.77 -0.06 0.27 0.56 -1.05
6 Years -1.60 0.03 0.18 -1.73 0.39
Associate’s/Bachelor’s Degree within . . .
4 Years -2.18 -0.08 -0.26 1.77 -2.11
5 Years -1.72 -0.04 -0.16 0.12 -1.21
6 Years -1.51 0.03 -0.28 -1.92 -0.02

62
ACT Research Report Does Taking Developmental Courses Improve the Success of Students Who First Enroll at Two-Year Colleges?
Table C-8. (continued)
Outcome Student-Level Effects
FT and Age ≤ 21 Vs.
Type Level
ACT Compass Pre-Algebra
ScoreProp. Score
Developmental Course Grade
PT and Age ≤ 21 Age 22–25 Age > 25
Success in Elementary Algebra
C or Higher 0.01 -0.42 0.63 -0.74 -0.54 -0.59
B or Higher 0.02 -0.52 0.82 -0.33 -0.19 0.02
GPA Year 1 (or Last GPA) 2.0 or Higher <0.01 -1.07 0.40 -0.47 -0.03 0.30
3.0 or Higher <0.01 1.42 0.55 -0.05 0.41 0.82
GPA Year 2 2.0 or Higher <0.01 -1.74 0.55 -0.46 0.36 0.28
3.0 or Higher <0.01 -0.68 0.68 -0.37 0.19 0.69
GPA Year 3 2.0 or Higher <0.01 -2.11 0.51 -0.46 0.13 0.27
3.0 or Higher 0.01 -1.73 0.64 -0.22 0.48 0.86
Return Fall, Any Inst. Year 2 -0.01 -0.98 0.16 -0.97 -0.91 -0.65
Year 3 <0.01 -0.74 0.26 -0.92 -0.62 -0.39
Progress to Degree Year 2 0.01 -1.95 0.22 -2.13 -1.63 -1.45
Certificate within . . . 4 Years 0.01 0.58 0.25 -0.81 -0.33 -0.49
5 Years <0.01 2.29 0.17 -1.14 -0.60 -0.78
6 Years <0.01 1.48 0.15 -1.63 -1.24 -1.18
Associate’s Degree within . . . 4 Years 0.01 -1.22 0.45 -1.16 -0.76 -0.73
5 Years <0.01 -1.71 0.40 -1.01 -1.00 -0.62
6 Years <0.01 -2.85 0.33 -1.06 -0.81 -0.49
Associate’s/Bachelor’s Degree within . . .
4 Years 0.01 -1.41 0.45 -1.18 -0.78 -0.74
5 Years <0.01 -2.03 0.40 -1.04 -1.04 -0.66
6 Years <0.01 -2.81 0.34 -1.11 -0.91 -0.57

63
Table C-9. Variance Components of Hierarchical Logistic Regression Models for Predicting Subsequent College Success for Students Who Took Arithmetic (Grade Scale A–F) before Elementary Algebra
Outcome Variance Component
Type Level Intercept Standard Error
Success in Elementary Algebra
C or Higher 0.1624 0.0757
B or Higher 0.3244 0.1302
GPA Year 1 (or Last GPA) 2.0 or Higher 0.0000
3.0 or Higher 0.0550 0.0352
GPA Year 2 2.0 or Higher 0.0348 0.0540
3.0 or Higher 0.0000
GPA Year 3 2.0 or Higher 0.0000
3.0 or Higher 0.0000
Return Fall, Any Inst. Year 2 0.0167 0.0148
Year 3 0.0262 0.0143
Progress to Degree Year 2 0.1385 0.0681
Certificate within . . . 4 Years 0.1562 0.1006
5 Years 0.3196 0.1848
6 Years 0.3207 0.2038
Associate’s Degree within . . . 4 Years 0.0000
5 Years 0.0000
6 Years 0.0113 0.0225
Associate’s/Bachelor’s Degree within . . .
4 Years 0.0000
5 Years 0.0000
6 Years 0.0179 0.0240

64
ACT Research Report Does Taking Developmental Courses Improve the Success of Students Who First Enroll at Two-Year Colleges?
Tabl
e C
-10.
Fix
ed E
ffect
s of
Hie
rarc
hica
l Log
istic
Reg
ress
ion
Mod
els
for P
redi
ctin
g S
ubse
quen
t Col
lege
Suc
cess
for S
tude
nts
Who
Did
/D
id N
ot T
ake
Ele
men
tary
Alg
ebra
bef
ore
Inte
rmed
iate
Alg
ebra
Out
com
eIn
stitu
tion-
Leve
l Effe
cts
Pro
p. D
evel
opm
enta
l Cou
rse
Ta
ken
Inte
ract
ion
with
Pro
p. F
T an
d A
ge ≤
21
Vs.
Type
Leve
lIn
terc
ept
Mea
n A
CT
Com
pass
P
re-A
lgeb
ra
Sco
reP
rop.
PT
and
Age
≤ 2
1 P
rop.
Age
22
–25
Pro
p. A
ge
> 2
5P
rop.
PT
and
Age
≤ 2
1 P
rop.
Age
22
–25
Pro
p. A
ge
> 2
5
Suc
cess
in
Inte
rmed
iate
Alg
ebra
C o
r Hig
her
0.1
5-0
.08
4.5
22
.44
3.6
5-4
.87
1.4
91
.30
B o
r Hig
her
-0.5
3-0
.08
4.0
40
.61
3.4
0-4
.74
1.4
13
.12
GPA
Yea
r 1 (o
r Las
t GPA
)2
.0 o
r Hig
her
1.2
00
.01
1.0
25
.24
-4.1
9-0
.61
-4.5
86
.66
3.0
or H
ighe
r-0
.56
0.0
10
.68
1.0
4-0
.92
-1.2
8-0
.03
6.4
5
GPA
Yea
r 22
.0 o
r Hig
her
1.6
10
.04
-0.5
31
1.2
3-1
3.2
70
.39
-12
.68
18
.76
3.0
or H
ighe
r-0
.67
0.0
3-0
.87
6.0
3-1
5.2
30
.24
-6.5
72
0.6
5
GPA
Yea
r 32
.0 o
r Hig
her
1.9
30
.02
-0.5
65
.64
-2.0
20
.52
-5.2
25
.44
3.0
or H
ighe
r-0
.73
0.0
2-0
.87
-0.0
5-7
.17
0.6
30
.82
8.4
6
Ret
urn
Fall,
Any
Inst
.Ye
ar 2
1.1
30
.02
-0.4
04
.31
-7.5
10
.93
-2.5
21
0.0
6
Year
30
.02
0.0
2-0
.10
-0.0
1-4
.34
0.5
92
.40
7.6
8
Pro
gres
s to
Deg
ree
Year
2-0
.66
0.0
1-1
.85
6.1
3-6
.91
0.6
9-3
.13
5.4
9
Cer
tific
ate
with
in .
. .4
Yea
rs-2
.01
-0.0
6-4
.81
-2.4
16
.97
1.8
11
.60
-7.5
7
5 Y
ears
-1.8
2-0
.04
-5.5
4-6
.76
0.8
22
.16
4.9
2-2
.92
6 Y
ears
-1.8
2-0
.05
-5.4
1-1
1.2
25
.38
1.4
41
7.1
5-1
3.8
3
Ass
ocia
te’s
Deg
ree
w
ithin
. . .
4 Y
ears
-1.6
4-0
.01
-1.2
76
.79
-7.7
90
.60
-1.7
84
.94
5 Y
ears
-1.2
7<
0.0
1-1
.29
6.3
4-8
.47
0.7
9-2
.90
6.9
0
6 Y
ears
-1.2
20
.01
-1.2
47
.04
-3.5
01
.95
-8.3
14
.02
Ass
ocia
te’s
/Bac
helo
r’s
Deg
ree
with
in .
. .4
Yea
rs-1
.62
-0.0
1-1
.24
6.7
6-7
.56
0.6
2-1
.71
4.7
5
5 Y
ears
-1.2
10
.01
-1.6
56
.92
-8.0
71
.08
-3.8
67
.14
6 Y
ears
-1.1
00
.01
-1.0
28
.12
-2.8
02
.13
-10
.13
4.2
6
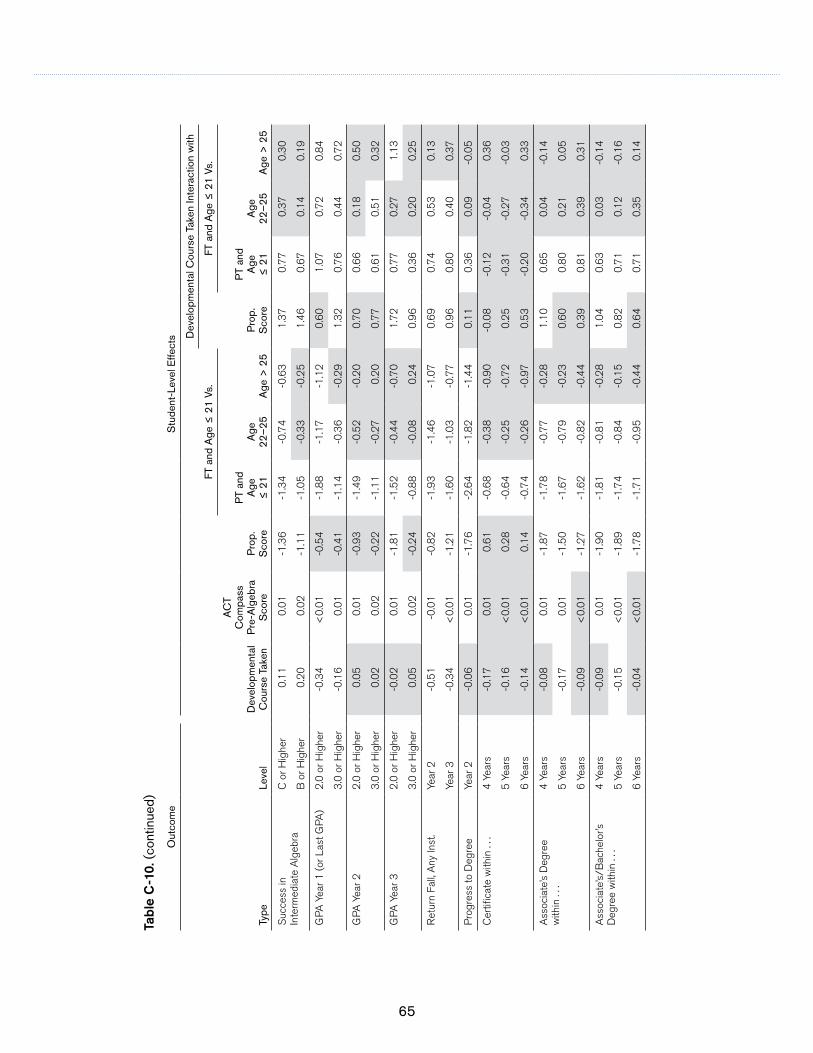
65
Tabl
e C
-10.
(co
ntin
ued)
Out
com
eS
tude
nt-L
evel
Effe
cts D
evel
opm
enta
l Cou
rse
Take
n In
tera
ctio
n w
ith
FT a
nd A
ge ≤
21
Vs.
FT a
nd A
ge ≤
21
Vs.
Type
Leve
lD
evel
opm
enta
l C
ours
e Ta
ken
AC
T C
ompa
ss
Pre
-Alg
ebra
S
core
Pro
p.
Sco
re
PT
and
Age
≤
21
Age
22
–25
Age
> 2
5P
rop.
S
core
PT
and
Age
≤
21
Age
22
–25
Age
> 2
5
Suc
cess
in
Inte
rmed
iate
Alg
ebra
C o
r Hig
her
0.1
10
.01
-1.3
6-1
.34
-0.7
4-0
.63
1.3
70
.77
0.3
70
.30
B o
r Hig
her
0.2
00
.02
-1.1
1-1
.05
-0.3
3-0
.25
1.4
60
.67
0.1
40
.19
GPA
Yea
r 1 (o
r Las
t GPA
)2
.0 o
r Hig
her
-0.3
4<
0.0
1-0
.54
-1.8
8-1
.17
-1.1
20
.60
1.0
70
.72
0.8
4
3.0
or H
ighe
r-0
.16
0.0
1-0
.41
-1.1
4-0
.36
-0.2
91
.32
0.7
60
.44
0.7
2
GPA
Yea
r 22
.0 o
r Hig
her
0.0
50
.01
-0.9
3-1
.49
-0.5
2-0
.20
0.7
00
.66
0.1
80
.50
3.0
or H
ighe
r0
.02
0.0
2-0
.22
-1.1
1-0
.27
0.2
00
.77
0.6
10
.51
0.3
2
GPA
Yea
r 32
.0 o
r Hig
her
-0.0
20
.01
-1.8
1-1
.52
-0.4
4-0
.70
1.7
20
.77
0.2
71
.13
3.0
or H
ighe
r0
.05
0.0
2-0
.24
-0.8
8-0
.08
0.2
40
.96
0.3
60
.20
0.2
5
Ret
urn
Fall,
Any
Inst
.Ye
ar 2
-0.5
1-0
.01
-0.8
2-1
.93
-1.4
6-1
.07
0.6
90
.74
0.5
30
.13
Year
3-0
.34
<0
.01
-1.2
1-1
.60
-1.0
3-0
.77
0.9
60
.80
0.4
00
.37
Pro
gres
s to
Deg
ree
Year
2-0
.06
0.0
1-1
.76
-2.6
4-1
.82
-1.4
40
.11
0.3
60
.09
-0.0
5
Cer
tific
ate
with
in .
. .4
Yea
rs-0
.17
0.0
10
.61
-0.6
8-0
.38
-0.9
0-0
.08
-0.1
2-0
.04
0.3
6
5 Y
ears
-0.1
6<
0.0
10
.28
-0.6
4-0
.25
-0.7
20
.25
-0.3
1-0
.27
-0.0
3
6 Y
ears
-0.1
4<
0.0
10
.14
-0.7
4-0
.26
-0.9
70
.53
-0.2
0-0
.34
0.3
3
Ass
ocia
te’s
Deg
ree
w
ithin
. . .
4 Y
ears
-0.0
80
.01
-1.8
7-1
.78
-0.7
7-0
.28
1.1
00
.65
0.0
4-0
.14
5 Y
ears
-0.1
70
.01
-1.5
0-1
.67
-0.7
9-0
.23
0.6
00
.80
0.2
10
.05
6 Y
ears
-0.0
9<
0.0
1-1
.27
-1.6
2-0
.82
-0.4
40
.39
0.8
10
.39
0.3
1
Ass
ocia
te’s
/Bac
helo
r’s
Deg
ree
with
in .
. .4
Yea
rs-0
.09
0.0
1-1
.90
-1.8
1-0
.81
-0.2
81
.04
0.6
30
.03
-0.1
4
5 Y
ears
-0.1
5<
0.0
1-1
.89
-1.7
4-0
.84
-0.1
50
.82
0.7
10
.12
-0.1
6
6 Y
ears
-0.0
4<
0.0
1-1
.78
-1.7
1-0
.95
-0.4
40
.64
0.7
10
.35
0.1
4
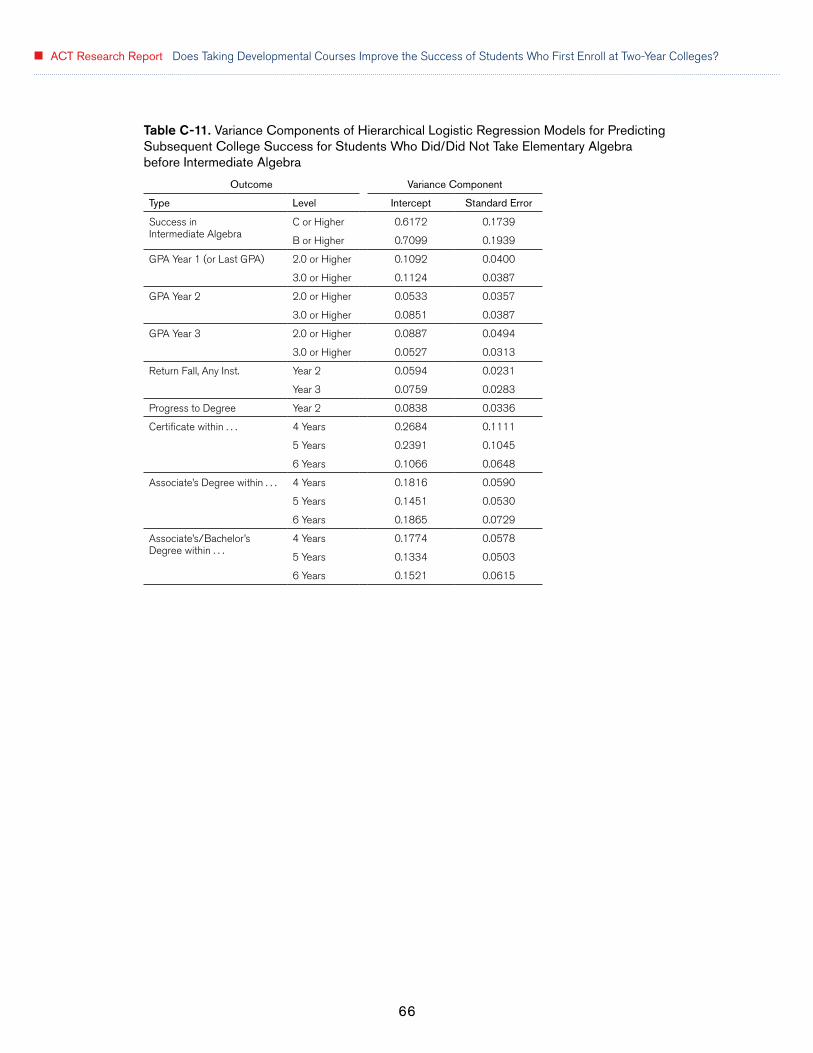
66
ACT Research Report Does Taking Developmental Courses Improve the Success of Students Who First Enroll at Two-Year Colleges?
Table C-11. Variance Components of Hierarchical Logistic Regression Models for Predicting Subsequent College Success for Students Who Did/Did Not Take Elementary Algebra before Intermediate Algebra
Outcome Variance Component
Type Level Intercept Standard Error
Success in Intermediate Algebra
C or Higher 0.6172 0.1739
B or Higher 0.7099 0.1939
GPA Year 1 (or Last GPA) 2.0 or Higher 0.1092 0.0400
3.0 or Higher 0.1124 0.0387
GPA Year 2 2.0 or Higher 0.0533 0.0357
3.0 or Higher 0.0851 0.0387
GPA Year 3 2.0 or Higher 0.0887 0.0494
3.0 or Higher 0.0527 0.0313
Return Fall, Any Inst. Year 2 0.0594 0.0231
Year 3 0.0759 0.0283
Progress to Degree Year 2 0.0838 0.0336
Certificate within . . . 4 Years 0.2684 0.1111
5 Years 0.2391 0.1045
6 Years 0.1066 0.0648
Associate’s Degree within . . . 4 Years 0.1816 0.0590
5 Years 0.1451 0.0530
6 Years 0.1865 0.0729
Associate’s/Bachelor’s Degree within . . .
4 Years 0.1774 0.0578
5 Years 0.1334 0.0503
6 Years 0.1521 0.0615

67
Tabl
e C
-12.
Fix
ed E
ffect
s of
Hie
rarc
hica
l Log
istic
Reg
ress
ion
Mod
els
for P
redi
ctin
g S
ubse
quen
t Col
lege
Suc
cess
for S
tude
nts
Who
Too
k E
lem
enta
ry A
lgeb
ra (G
rade
Sca
le A
–F)
bef
ore
Inte
rmed
iate
Alg
ebra
Out
com
eIn
stitu
tion-
Leve
l E
ffect
sS
tude
nt-L
evel
Effe
cts
FT a
nd A
ge ≤
21
Vs.
Type
Leve
lIn
terc
ept
Mea
n
AC
T C
ompa
ss
Pre
-Alg
ebra
Sco
re
AC
T C
ompa
ss
Pre
-Alg
ebra
S
core
Pro
p.
Sco
reD
evel
opm
enta
l C
ours
e G
rade
PT
and
Age
≤
21
Age
22
–25
Age
> 2
5
Suc
cess
in
Inte
rmed
iate
Alg
ebra
C o
r Hig
her
<0
.01
-0.0
2<
0.0
10
.02
0.7
5-0
.55
-0.4
1-0
.41
B o
r Hig
her
-0.8
6-0
.03
0.0
10
.48
0.9
2-0
.30
-0.2
0-0
.13
GPA
Yea
r 1 (o
r Las
t GPA
)2
.0 o
r Hig
her
1.1
50
.02
<0
.01
-0.1
60
.43
-0.7
7-0
.45
-0.3
4
3.0
or H
ighe
r-0
.66
0.0
2<
0.0
10
.64
0.5
5-0
.43
0.0
20
.31
GPA
Yea
r 22
.0 o
r Hig
her
1.6
10
.02
<0
.01
-0.2
50
.48
-0.8
2-0
.36
0.1
9
3.0
or H
ighe
r-0
.75
0.0
10
.01
0.4
10
.70
-0.5
20
.23
0.4
4
GPA
Yea
r 32
.0 o
r Hig
her
1.9
00
.01
0.0
1-0
.30
0.4
8-0
.68
-0.1
50
.37
3.0
or H
ighe
r-0
.80
0.0
10
.01
0.5
40
.77
-0.5
20
.11
0.3
8
Ret
urn
Fall,
Any
Inst
.Ye
ar 2
1.1
80
.03
-0.0
1-0
.07
0.2
1-0
.98
-0.7
5-0
.77
Year
30
.04
0.0
3-0
.01
-0.2
80
.20
-0.7
0-0
.57
-0.3
4
Pro
gres
s to
Deg
ree
Year
2-0
.80
0.0
20
.01
-1.4
40
.25
-2.2
5-1
.76
-1.5
9
Cer
tific
ate
with
in .
. .4
Yea
rs-1
.92
-0.0
2<
0.0
10
.80
0.2
5-0
.72
-0.4
2-0
.52
5 Y
ears
-1.7
7-0
.02
<0
.01
0.7
80
.18
-0.9
0-0
.55
-0.7
6
6 Y
ears
-1.6
5-0
.02
-0.0
10
.94
0.1
6-0
.77
-0.4
6-0
.52
Ass
ocia
te’s
Deg
ree
w
ithin
. . .
4 Y
ears
-1.6
7<
0.0
1<
0.0
1-0
.62
0.3
7-1
.12
-0.7
6-0
.54
5 Y
ears
-1.3
00
.01
<0
.01
-0.7
00
.32
-0.8
6-0
.64
-0.3
3
6 Y
ears
-1.1
9<
0.0
1<
0.0
1-0
.90
0.2
7-0
.80
-0.4
6-0
.23
Ass
ocia
te’s
/Bac
helo
r’s
Deg
ree
with
in .
. .4
Yea
rs-1
.66
<0
.01
<0
.01
-0.7
70
.39
-1.1
8-0
.81
-0.5
5
5 Y
ears
-1.2
60
.01
<0
.01
-1.0
20
.36
-1.0
2-0
.75
-0.4
2
6 Y
ears
-1.1
2<
0.0
1<
0.0
1-1
.24
0.3
0-0
.96
-0.6
0-0
.35

68
ACT Research Report Does Taking Developmental Courses Improve the Success of Students Who First Enroll at Two-Year Colleges?
Table C-13. Variance Components of Hierarchical Logistic Regression Models for Predicting Subsequent College Success for Students Who Took Elementary Algebra (Grade Scale A–F) before Intermediate Algebra
Outcome Variance Component
Type Level Intercept Standard Error
Success in Intermediate Algebra
C or Higher 0.1804 0.0683
B or Higher 0.2527 0.0932
GPA Year 1 (or Last GPA) 2.0 or Higher 0.2286 0.1099
3.0 or Higher 0.1748 0.0723
GPA Year 2 2.0 or Higher 0.0187 0.0302
3.0 or Higher 0.1256 0.0645
GPA Year 3 2.0 or Higher 0.0000
3.0 or Higher 0.0267 0.0316
Return Fall, Any Inst. Year 2 0.0495 0.0274
Year 3 0.0725 0.0326
Progress to Degree Year 2 0.1112 0.0481
Certificate within . . . 4 Years 0.3235 0.1463
5 Years 0.4132 0.1917
6 Years 0.4253 0.2152
Associate’s Degree within . . . 4 Years 0.2026 0.0737
5 Years 0.0931 0.0413
6 Years 0.0910 0.0457
Associate’s/Bachelor’s Degree within . . .
4 Years 0.2167 0.0785
5 Years 0.1041 0.0442
6 Years 0.1137 0.0520

69
Tabl
e C
-14.
Fix
ed E
ffect
s of
Hie
rarc
hica
l Log
istic
Reg
ress
ion
Mod
els
for P
redi
ctin
g S
ubse
quen
t Col
lege
Suc
cess
for S
tude
nts
Who
Did
/Did
Not
Tak
e In
term
edia
te A
lgeb
ra b
efor
e C
olle
ge A
lgeb
ra
Out
com
eIn
stitu
tion-
Leve
l Effe
cts
Pro
p. D
evel
opm
enta
l Cou
rse
Ta
ken
Inte
ract
ion
with
Pro
p. F
T an
d A
ge ≤
21
Vs.
Type
Leve
lIn
terc
ept
Mea
n A
CT
Com
pass
Alg
ebra
S
core
Pro
p. P
T an
d A
ge
≤ 2
1 P
rop.
Age
22
–25
Pro
p. A
ge
> 2
5
Pro
p. P
T an
d A
ge
≤ 2
1 P
rop.
Age
22
–25
Pro
p. A
ge
> 2
5
Suc
cess
in C
olle
ge
Alg
ebra
C o
r Hig
her
0.6
70
.01
-1.7
00
.49
6.1
93
.74
-18
.63
-4.0
1
B o
r Hig
her
-0.3
5-0
.01
-1.1
6-7
.48
4.5
02
.74
-5.6
9-1
.62
GPA
Yea
r 1 (o
r Las
t GPA
)2
.0 o
r Hig
her
1.8
70
.07
-2.7
4-8
.98
4.5
04
.59
11
.84
-12
.35
3.0
or H
ighe
r-0
.10
0.0
2-1
.07
-10
.93
15
.20
2.3
51
4.0
5-1
4.5
9
GPA
Yea
r 22
.0 o
r Hig
her
2.2
30
.07
-1.9
7-8
.41
7.5
63
.75
9.7
6-2
7.7
8
3.0
or H
ighe
r-0
.09
0.0
2-1
.11
-7.2
61
6.4
22
.47
6.3
9-2
2.6
5
GPA
Yea
r 32
.0 o
r Hig
her
2.6
40
.10
-3.5
1-1
4.1
62
2.6
36
.56
5.8
2-3
2.5
4
3.0
or H
ighe
r-0
.13
0.0
1-0
.63
-4.6
12
1.1
61
.92
-5.0
4-1
9.8
6
Ret
urn
Fall,
Any
Inst
.Ye
ar 2
1.6
40
.03
0.0
3-9
.37
16
.49
1.6
87
.68
-22
.09
Year
30
.59
0.0
30
.20
-14
.26
16
.55
1.2
11
7.4
6-2
1.1
5
Pro
gres
s to
Deg
ree
Year
20
.61
0.0
1-0
.45
6.6
12
.56
0.0
4-5
.98
-5.0
7
Cer
tific
ate
with
in .
. .4
Yea
rs-2
.08
<0
.01
-4.4
3-1
7.0
52
4.2
2-0
.10
33
.57
-22
.45
5 Y
ears
-1.8
8-0
.03
-3.8
5-9
.48
22
.66
-0.5
31
5.5
8-2
5.7
8
6 Y
ears
-1.9
8<
0.0
1-3
.90
-0.7
12
6.5
11
.69
-12
.07
-21
.32
Ass
ocia
te’s
Deg
ree
w
ithin
. . .
4 Y
ears
-0.6
4<
0.0
1-1
.28
6.3
10
.85
-0.5
61
.67
-6.0
6
5 Y
ears
-0.4
80
.01
-1.2
67
.85
4.0
4-0
.56
-1.2
6-6
.58
6 Y
ears
-0.3
40
.02
-1.0
86
.75
6.7
7-0
.29
-3.5
9-7
.00
Ass
ocia
te’s
/Bac
helo
r’s
Deg
ree
with
in .
. .4
Yea
rs-0
.61
<0
.01
-1.1
16
.03
1.6
4-0
.63
2.1
3-5
.87
5 Y
ears
-0.3
30
.02
-1.1
23
.80
4.8
5-0
.13
1.3
2-5
.40
6 Y
ears
-0.0
70
.03
-0.9
92
.16
8.1
7-0
.04
2.9
0-9
.07

70
ACT Research Report Does Taking Developmental Courses Improve the Success of Students Who First Enroll at Two-Year Colleges?
Tabl
e C
-14.
(co
ntin
ued)
Out
com
eS
tude
nt-L
evel
Effe
cts
Dev
elop
men
tal C
ours
e
Take
n In
tera
ctio
n w
ith
FT a
nd A
ge ≤
21
Vs.
FT a
nd A
ge ≤
21
Vs.
Type
Leve
lD
evel
opm
enta
l C
ours
e Ta
ken
AC
T C
ompa
ss
Alg
ebra
S
core
Pro
p.
Sco
re
PT
and
Age
≤
21
Age
22
–25
Age
> 2
5P
rop.
S
core
PT
and
Age
≤
21
Age
22
–25
Age
> 2
5
Suc
cess
in
Col
lege
Alg
ebra
C o
r Hig
her
-0.0
50
.02
-1.2
0-1
.68
-0.8
4-0
.48
0.9
80
.76
0.5
40
.51
B o
r Hig
her
<0
.01
0.0
3-1
.00
-1.3
3-0
.54
-0.0
41
.22
0.7
20
.45
0.5
0
GPA
Yea
r 1 (o
r Las
t GPA
)2
.0 o
r Hig
her
-0.3
5<
0.0
1-1
.52
-2.3
6-1
.30
-0.7
80
.69
1.0
60
.87
0.5
3
3.0
or H
ighe
r-0
.22
0.0
1-1
.76
-1.6
4-0
.37
0.6
61
.22
0.8
20
.42
-0.4
6
GPA
Yea
r 22
.0 o
r Hig
her
0.0
7<
0.0
1-2
.19
-1.8
0-0
.67
0.4
90
.78
0.8
10
.28
-0.3
6
3.0
or H
ighe
r0
.04
0.0
1-2
.57
-1.3
3-0
.04
1.0
91
.86
0.4
50
.08
-0.6
8
GPA
Yea
r 32
.0 o
r Hig
her
-0.1
6<
0.0
1-1
.35
-1.7
6-0
.44
0.0
5-0
.84
0.5
50
.21
-0.0
5
3.0
or H
ighe
r0
.09
0.0
2-2
.27
-1.1
50
.12
1.3
01
.59
0.3
50
.14
-0.7
2
Ret
urn
Fall,
Any
Inst
.Ye
ar 2
-0.4
8-0
.01
-1.1
0-2
.17
-1.3
9-1
.01
0.7
70
.98
0.4
90
.09
Year
3-0
.34
<0
.01
-1.7
1-1
.85
-1.1
5-0
.48
0.8
70
.91
0.4
8-0
.23
Pro
gres
s to
Deg
ree
Year
2-0
.39
>-0
.01
-1.2
9-2
.91
-1.6
0-1
.33
-0.3
80
.70
0.1
20
.13
Cer
tific
ate
with
in .
. .4
Yea
rs-0
.17
<0
.01
-0.0
7-0
.80
-0.6
2-0
.28
1.5
00
.41
0.3
4-1
.51
5 Y
ears
-0.2
6<
0.0
10
.47
-0.6
6-0
.42
0.1
30
.80
0.2
30
.43
-1.7
2
6 Y
ears
-0.1
1<
0.0
10
.66
-0.4
9-0
.49
0.2
00
.55
-0.2
00
.49
-1.8
9
Ass
ocia
te’s
Deg
ree
w
ithin
. . .
4 Y
ears
-0.2
5<
0.0
1-1
.65
-1.9
4-0
.92
-0.4
00
.14
0.7
70
.53
0.1
3
5 Y
ears
-0.2
1<
0.0
1-1
.38
-1.7
7-1
.02
-0.3
70
.24
0.6
70
.62
0.0
6
6 Y
ears
-0.2
7<
0.0
1-1
.42
-1.7
6-0
.95
-0.3
90
.14
0.7
20
.47
0.1
4
Ass
ocia
te’s
/Bac
helo
r’s
Deg
ree
with
in .
. .4
Yea
rs-0
.22
<0
.01
-1.7
9-2
.02
-0.9
5-0
.45
0.1
80
.80
0.5
20
.20
5 Y
ears
-0.1
7<
0.0
1-1
.70
-1.9
8-1
.11
-0.3
80
.27
0.7
60
.59
0.0
8
6 Y
ears
-0.2
3<
0.0
1-1
.82
-2.0
3-1
.10
-0.5
40
.07
0.8
30
.43
0.2
1
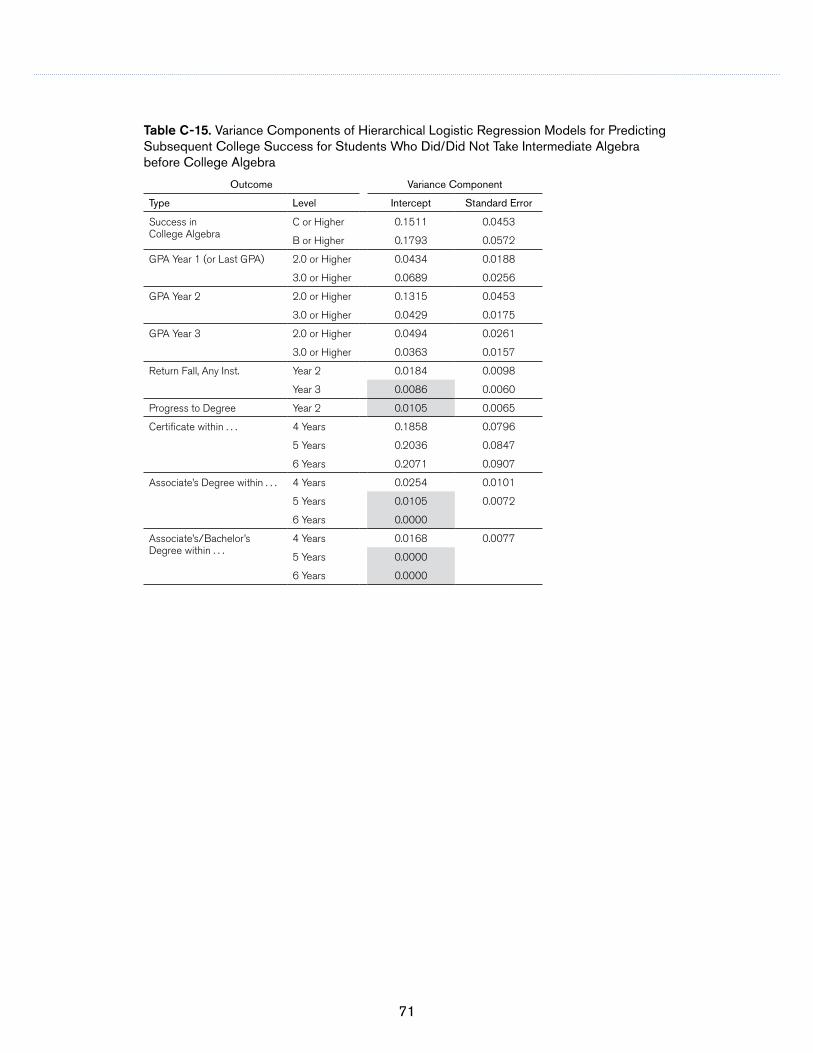
71
Table C-15. Variance Components of Hierarchical Logistic Regression Models for Predicting Subsequent College Success for Students Who Did/Did Not Take Intermediate Algebra before College Algebra
Outcome Variance Component
Type Level Intercept Standard Error
Success in College Algebra
C or Higher 0.1511 0.0453
B or Higher 0.1793 0.0572
GPA Year 1 (or Last GPA) 2.0 or Higher 0.0434 0.0188
3.0 or Higher 0.0689 0.0256
GPA Year 2 2.0 or Higher 0.1315 0.0453
3.0 or Higher 0.0429 0.0175
GPA Year 3 2.0 or Higher 0.0494 0.0261
3.0 or Higher 0.0363 0.0157
Return Fall, Any Inst. Year 2 0.0184 0.0098
Year 3 0.0086 0.0060
Progress to Degree Year 2 0.0105 0.0065
Certificate within . . . 4 Years 0.1858 0.0796
5 Years 0.2036 0.0847
6 Years 0.2071 0.0907
Associate’s Degree within . . . 4 Years 0.0254 0.0101
5 Years 0.0105 0.0072
6 Years 0.0000
Associate’s/Bachelor’s Degree within . . .
4 Years 0.0168 0.0077
5 Years 0.0000
6 Years 0.0000

72
ACT Research Report Does Taking Developmental Courses Improve the Success of Students Who First Enroll at Two-Year Colleges?
Tabl
e C
-16.
Fix
ed E
ffect
s of
Hie
rarc
hica
l Log
istic
Reg
ress
ion
Mod
els
for P
redi
ctin
g S
ubse
quen
t Col
lege
Suc
cess
for S
tude
nts
Who
Too
k In
term
edia
te A
lgeb
ra (G
rade
Sca
le A
–F)
bef
ore
Col
lege
Alg
ebra
Out
com
eIn
stitu
tion-
Leve
l Effe
cts
Stu
dent
-Lev
el E
ffect
s
FT a
nd A
ge ≤
21
Vs.
Type
Leve
lIn
terc
ept
Mea
n D
evel
opm
enta
l C
ours
e G
rade
AC
T C
ompa
ss
Alg
ebra
S
core
Pro
p. S
core
Dev
elop
men
tal
Cou
rse
Gra
deP
T an
d A
ge
≤ 2
1A
ge 2
2–25
Age
> 2
5
Suc
cess
in
Col
lege
Alg
ebra
C o
r Hig
her
0.4
5-0
.37
0.0
10
.14
0.7
5-0
.96
-0.7
1-0
.32
B o
r Hig
her
-0.7
8-0
.09
0.0
20
.33
0.9
3-0
.67
-0.4
20
.20
GPA
Yea
r 1 (o
r Las
t GPA
)2
.0 o
r Hig
her
1.7
5-0
.34
<0
.01
-0.8
90
.56
-1.5
3-0
.74
-0.9
2
3.0
or H
ighe
r-0
.44
-0.6
0<
0.0
1-0
.45
0.7
4-0
.88
-0.2
9-0
.27
GPA
Yea
r 22
.0 o
r Hig
her
2.0
5-0
.45
<0
.01
-1.7
30
.54
-1.1
8-0
.69
-0.3
7
3.0
or H
ighe
r-0
.49
-0.6
90
.01
-0.8
60
.74
-1.0
1-0
.29
-0.1
3
GPA
Yea
r 32
.0 o
r Hig
her
2.4
5-0
.19
<0
.01
-2.5
80
.43
-1.4
9-0
.64
-0.9
2
3.0
or H
ighe
r-0
.55
-0.7
40
.02
-0.8
50
.73
-0.8
8-0
.10
0.2
0
Ret
urn
Fall,
Any
Inst
.Ye
ar 2
1.5
80
.14
-0.0
1-0
.40
0.0
4-1
.08
-0.9
2-0
.98
Year
30
.51
-0.0
4-0
.01
-0.7
80
.11
-0.9
1-0
.82
-0.9
6
Pro
gres
s to
Deg
ree
Year
20
.40
0.0
2-0
.01
-1.8
40
.19
-2.1
5-1
.54
-1.4
3
Cer
tific
ate
with
in .
. .4
Yea
rs-2
.21
0.7
40
.01
1.3
90
.27
-0.2
6-0
.20
-1.7
2
5 Y
ears
-1.8
90
.32
0.0
11
.13
0.2
2-0
.35
0.0
9-1
.58
6 Y
ears
-1.9
90
.23
<0
.01
0.9
80
.20
-0.6
9-0
.03
-1.7
3
Ass
ocia
te’s
Deg
ree
with
in .
. .4
Yea
rs-0
.79
-0.5
6-0
.01
-1.6
60
.30
-1.2
3-0
.60
-0.4
4
5 Y
ears
-0.5
8-0
.47
-0.0
1-1
.17
0.2
8-1
.14
-0.5
3-0
.53
6 Y
ears
-0.4
7-0
.25
-0.0
1-1
.07
0.2
7-1
.04
-0.5
4-0
.43
Ass
ocia
te’s
/Bac
helo
r’s
Deg
ree
with
in .
. .4
Yea
rs-0
.77
-0.4
9-0
.01
-1.6
90
.30
-1.2
7-0
.65
-0.4
2
5 Y
ears
-0.4
9-0
.43
-0.0
1-1
.36
0.2
9-1
.22
-0.6
4-0
.46
6 Y
ears
-0.2
8-0
.19
-0.0
1-1
.44
0.2
9-1
.16
-0.7
6-0
.47

73
Table C-17. Variance Components of Hierarchical Logistic Regression Models for Predicting Subsequent College Success for Students Who Took Intermediate Algebra (Grade Scale A–F) before College Algebra
Outcome Variance Component
Type Level Intercept Standard Error
Success in College Algebra
C or Higher 0.0801 0.0379
B or Higher 0.1857 0.0762
GPA Year 1 (or Last GPA) 2.0 or Higher 0.1282 0.0719
3.0 or Higher 0.1472 0.0605
GPA Year 2 2.0 or Higher 0.0948 0.0648
3.0 or Higher 0.1204 0.0584
GPA Year 3 2.0 or Higher 0.1327 0.1055
3.0 or Higher 0.1141 0.0664
Return Fall, Any Inst. Year 2 0.0298 0.0212
Year 3 0.0302 0.0178
Progress to Degree Year 2 0.0472 0.0257
Certificate within . . . 4 Years 0.4593 0.2188
5 Years 0.3589 0.1735
6 Years 0.3761 0.2059
Associate’s Degree within . . . 4 Years 0.1569 0.0600
5 Years 0.0883 0.0457
6 Years 0.0337 0.0277
Associate’s/Bachelor’s Degree within . . .
4 Years 0.1443 0.0567
5 Years 0.0463 0.0316
6 Years 0.0359 0.0305

74
ACT Research Report Does Taking Developmental Courses Improve the Success of Students Who First Enroll at Two-Year Colleges?
Tabl
e C
-18.
Fix
ed E
ffect
s of
Hie
rarc
hica
l Log
istic
Reg
ress
ion
Mod
els
for P
redi
ctin
g S
ubse
quen
t Col
lege
Suc
cess
for S
tude
nts
Who
Did
/Did
Not
Tak
e D
evel
opm
enta
l Rea
ding
bef
ore
Firs
t Soc
ial S
cien
ce C
ours
e
Out
com
eIn
stitu
tion-
Leve
l Effe
cts
Pro
p. D
evel
opm
enta
l Cou
rse
Ta
ken
Inte
ract
ion
with
Pro
p. F
T an
d A
ge ≤
21
Vs.
Type
Leve
lIn
terc
ept
Mea
n A
CT
Com
pass
R
eadi
ng
Sco
re
Pro
p. P
T an
d A
ge
≤ 2
1P
rop.
Age
22
–25
Pro
p. A
ge
> 2
5
Pro
p. P
T an
d A
ge
≤ 2
1P
rop.
Age
22
–25
Pro
p. A
ge
> 2
5
Suc
cess
in F
irst S
ocia
l S
cien
ce C
ours
eC
or H
ighe
r0
.46
0.0
2-0
.27
-2.4
64
.28
5.2
3-1
.57
-5.8
2
B o
r Hig
her
-0.4
8-0
.01
-0.1
3-0
.54
1.7
14
.94
-9.0
9-1
.25
GPA
Yea
r 1 (o
r Las
t GPA
)2
.0 o
r Hig
her
1.0
2-0
.01
-0.2
40
.54
-0.1
21
.36
1.1
05
.71
3.0
or H
ighe
r-0
.59
-0.0
3-0
.18
2.0
70
.13
0.9
1-5
.00
9.4
2
GPA
Yea
r 22
.0 o
r Hig
her
1.5
10
.04
-0.0
3-0
.96
-2.0
02
.94
9.7
43
.03
3.0
or H
ighe
r-0
.69
-0.0
3-0
.13
5.7
4-2
.12
0.4
2-7
.53
10
.06
GPA
Yea
r 32
.0 o
r Hig
her
1.7
70
.01
0.2
90
.04
1.0
52
.20
5.8
1-3
.35
3.0
or H
ighe
r-0
.78
-0.0
40
.03
5.7
8-1
.26
-0.3
2-5
.15
6.2
7
Ret
urn
Fall,
Any
Inst
.Ye
ar 2
0.8
90
.07
0.8
5-1
.97
-0.4
11
.50
7.2
91
0.7
7
Year
3-0
.14
0.0
70
.95
-1.7
5-1
.40
0.6
55
.55
15
.80
Pro
gres
s to
Deg
ree
Year
2-0
.46
0.0
6-1
.51
1.1
9-3
.00
3.3
85
.45
-0.0
3
Cer
tific
ate
with
in .
. .4
Yea
rs-2
.07
0.0
9-6
.26
10
.71
2.6
11
2.3
4-8
.51
-19
.68
5 Y
ears
-1.9
1<
0.0
1-6
.12
13
.64
2.8
48
.53
-22
.35
-13
.15
6 Y
ears
-1.8
7<
0.0
1-5
.39
4.4
02
.01
5.3
18
.53
-16
.42
Ass
ocia
te’s
Deg
ree
with
in .
. .4
Yea
rs-1
.63
0.0
6-2
.71
6.8
7-2
.43
7.1
0-1
5.6
0-0
.38
5 Y
ears
-1.3
40
.06
-1.9
63
.24
-2.3
95
.41
-4.7
82
.81
6 Y
ears
-1.1
80
.08
-1.5
5-0
.07
-1.6
35
.16
3.1
44
.11
Ass
ocia
te’s
/Bac
helo
r’s
Deg
ree
with
in .
. .4
Yea
rs-1
.61
0.0
6-2
.58
6.6
9-2
.56
7.0
7-1
5.5
10
.55
5 Y
ears
-1.2
50
.07
-1.4
82
.42
-2.8
54
.86
-3.9
75
.65
6 Y
ears
-1.0
20
.07
-0.8
41
.03
-3.0
63
.81
0.3
37
.91

75
Tabl
e C
-18.
(co
ntin
ued)
Out
com
eS
tude
nt-L
evel
Effe
cts
Dev
elop
men
tal C
ours
e Ta
ken
Inte
ract
ion
with
FT a
nd A
ge ≤
21
Vs.
FT a
nd A
ge ≤
21
Vs.
Type
Leve
lD
evel
opm
enta
l C
ours
e Ta
ken
AC
T C
ompa
ss
Rea
ding
S
core
Pro
p.
Sco
re
PT
and
Age
≤
21
Age
22
–25
Age
> 2
5Te
st
Sco
reP
rop.
S
core
PT
and
Age
≤
21
Age
22
–25
Age
> 2
5
Suc
cess
in F
irst S
ocia
l S
cien
ce C
ours
eC
or H
ighe
r0
.46
0.0
2-2
.32
-1.6
1-1
.07
-0.7
1-0
.01
1.1
70
.75
0.4
00
.11
B o
r Hig
her
0.4
40
.02
-2.5
8-1
.15
-0.4
7-0
.06
-0.0
10
.86
0.6
60
.18
-0.1
2
GPA
Yea
r 1 (o
r Las
t GPA
)2
.0 o
r Hig
her
0.1
60
.01
-2.9
1-1
.86
-1.1
5-0
.69
-0.0
11
.44
0.9
10
.37
0.1
1
3.0
or H
ighe
r0
.11
0.0
2-3
.34
-1.2
7-0
.28
0.2
6-0
.02
1.7
90
.83
0.0
6-0
.25
GPA
Yea
r 22
.0 o
r Hig
her
0.4
80
.01
-3.5
7-1
.45
-0.6
50
.01
-0.0
11
.34
0.5
60
.31
-0.1
3
3.0
or H
ighe
r0
.43
0.0
3-4
.57
-1.0
30
.01
0.5
9-0
.01
2.0
70
.31
-0.2
2-0
.41
GPA
Yea
r 32
.0 o
r Hig
her
0.3
90
.02
-3.9
1-1
.39
-0.4
50
.01
-0.0
11
.47
0.3
0-0
.06
-0.3
0
3.0
or H
ighe
r0
.48
0.0
3-4
.56
-0.8
60
.14
0.6
9-0
.02
1.0
30
.32
-0.2
0-0
.27
Ret
urn
Fall,
Any
Inst
.Ye
ar 2
-0.0
9<
0.0
1-1
.39
-2.0
2-1
.72
-1.4
0<
0.0
11
.01
0.5
50
.27
0.1
0
Year
30
.03
<0
.01
-2.0
8-1
.74
-1.4
4-1
.05
<0
.01
1.5
40
.60
0.4
50
.18
Pro
gres
s to
Deg
ree
Year
20
.06
0.0
1-2
.65
-2.8
0-2
.16
-1.8
7<
0.0
1-1
.13
0.0
6-0
.49
-0.4
8
Cer
tific
ate
with
in .
. .4
Yea
rs-0
.12
<0
.01
0.2
5-0
.77
-0.2
0-0
.15
0.0
10
.10
-0.2
3-0
.46
-0.8
2
5 Y
ears
-0.1
2-0
.01
0.2
9-0
.70
-0.2
0-0
.12
0.0
20
.41
-0.2
0-0
.37
-0.8
2
6 Y
ears
-0.0
6-0
.01
0.3
8-0
.66
-0.1
5-0
.01
0.0
10
.12
-0.0
6-0
.52
-0.6
1
Ass
ocia
te’s
Deg
ree
w
ithin
. . .
4 Y
ears
0.1
20
.01
-3.3
7-1
.91
-1.3
0-0
.99
<0
.01
1.5
80
.45
-0.1
9-0
.22
5 Y
ears
0.1
20
.01
-3.1
5-1
.76
-1.3
2-0
.87
<0
.01
1.5
70
.47
0.1
1-0
.36
6 Y
ears
0.0
80
.01
-3.0
5-1
.70
-1.2
6-0
.84
<0
.01
1.7
00
.44
0.2
1-0
.22
Ass
ocia
te’s
/Bac
helo
r’s
Deg
ree
with
in .
. .4
Yea
rs0
.16
0.0
1-3
.60
-1.9
8-1
.36
-1.0
3<
0.0
11
.78
0.5
0-0
.16
-0.1
9
5 Y
ears
0.1
80
.01
-3.7
5-1
.92
-1.4
9-1
.02
<0
.01
2.0
60
.56
0.2
0-0
.29
6 Y
ears
0.1
40
.01
-3.7
8-1
.90
-1.5
0-1
.09
<0
.01
2.1
70
.55
0.3
4-0
.10

76
ACT Research Report Does Taking Developmental Courses Improve the Success of Students Who First Enroll at Two-Year Colleges?
Table C-19. Variance Components of Hierarchical Logistic Regression Models for Predicting Subsequent College Success for Students Who Did/Did Not Take Developmental Reading before First Social Science Course
Outcome Variance Component
Type Level Intercept Standard Error
Success in First Social Science Course
C or Higher 0.1294 0.0364
B or Higher 0.1201 0.0314
GPA Year 1 (or Last GPA) 2.0 or Higher 0.0670 0.0199
3.0 or Higher 0.0760 0.0225
GPA Year 2 2.0 or Higher 0.1122 0.0342
3.0 or Higher 0.0528 0.0174
GPA Year 3 2.0 or Higher 0.0256 0.0134
3.0 or Higher 0.0199 0.0088
Return Fall, Any Inst. Year 2 0.0185 0.0064
Year 3 0.0115 0.0043
Progress to Degree Year 2 0.0220 0.0077
Certificate within . . . 4 Years 0.1732 0.0642
5 Years 0.1571 0.0601
6 Years 0.1782 0.0684
Associate’s Degree within . . . 4 Years 0.0226 0.0072
5 Years 0.0217 0.0074
6 Years 0.0196 0.0072
Associate’s/Bachelor’s Degree within . . .
4 Years 0.0202 0.0066
5 Years 0.0173 0.0062
6 Years 0.0176 0.0066

77
Tabl
e C
-20.
Fix
ed E
ffect
s of
Hie
rarc
hica
l Log
istic
Reg
ress
ion
Mod
els
for P
redi
ctin
g S
ubse
quen
t Col
lege
Suc
cess
for S
tude
nts
Who
Too
k D
evel
opm
enta
l Rea
ding
(Gra
de S
cale
A–
F) b
efor
e Fi
rst S
ocia
l Sci
ence
Cou
rse
Out
com
eIn
stitu
tion-
Leve
l Effe
cts
Pro
p. F
T an
d A
ge ≤
21
Vs.
Type
Leve
lIn
terc
ept
Mea
n A
CT
Com
pass
R
eadi
ng S
core
Mea
n D
evel
opm
enta
l C
ours
e G
rade
Pro
p. P
T an
d
Age
≤ 2
1P
rop.
Age
22–
25P
rop.
Age
> 2
5
Suc
cess
in F
irst S
ocia
l S
cien
ce C
ours
eC
or H
ighe
r0
.18
0.0
4-0
.19
0.1
02
.12
-0.5
6
B o
r Hig
her
-0.9
0<
0.0
1-0
.12
0.5
60
.35
-0.3
3
GPA
Yea
r 1 (o
r Las
t GPA
)2
.0 o
r Hig
her
0.7
10
.03
-0.4
3-0
.59
6.8
3-4
.07
3.0
or H
ighe
r-1
.04
0.0
5-0
.46
0.6
95
.28
-0.1
3
GPA
Yea
r 22
.0 o
r Hig
her
1.1
70
.06
-0.8
40
.30
0.1
20
.39
3.0
or H
ighe
r-1
.29
0.0
3-1
.22
0.9
91
.16
3.1
1
GPA
Yea
r 32
.0 o
r Hig
her
1.3
9<
0.0
1-0
.63
0.2
30
.14
-0.3
5
3.0
or H
ighe
r-1
.39
0.0
1-1
.12
0.1
01
.43
2.8
2
Ret
urn
Fall,
Any
Inst
.Ye
ar 2
0.7
70
.08
-0.3
7-0
.05
4.3
43
.49
Year
3-0
.41
0.0
8-0
.40
0.9
84
.47
2.5
6
Pro
gres
s to
Deg
ree
Year
2-1
.44
0.0
5-0
.60
-0.7
52
.81
-4.9
9
Cer
tific
ate
with
in .
. .4
Yea
rs-2
.19
0.0
3-0
.28
-4.1
61
.23
-2.4
7
5 Y
ears
-2.0
00
.03
-0.1
7-3
.39
-0.9
2-1
.78
6 Y
ears
-1.9
10
.02
-0.0
4-3
.40
-1.5
5-2
.79
Ass
ocia
te’s
Deg
ree
with
in .
. .4
Yea
rs-2
.12
0.0
7-0
.74
0.2
54
.69
-3.7
0
5 Y
ears
-1.7
00
.04
-0.5
70
.91
2.2
1-1
.48
6 Y
ears
-1.5
30
.04
-0.5
71
.55
-0.0
2-0
.17
Ass
ocia
te’s
/Bac
helo
r’s
Deg
ree
with
in .
. .4
Yea
rs-2
.12
0.0
7-0
.74
0.2
94
.72
-3.7
1
5 Y
ears
-1.6
80
.04
-0.5
80
.95
2.2
4-1
.38
6 Y
ears
-1.4
70
.05
-0.5
91
.66
0.5
3-0
.46

78
ACT Research Report Does Taking Developmental Courses Improve the Success of Students Who First Enroll at Two-Year Colleges?
Tabl
e C
-20.
(co
ntin
ued)
Out
com
eS
tude
nt-L
evel
Effe
cts
Dev
elop
men
tal C
ours
e
Take
n In
tera
ctio
n w
ith
Pro
p. F
T an
d A
ge ≤
21
Vs.
Type
Leve
l
AC
T C
ompa
ss
Rea
ding
S
core
Pro
p. S
core
Dev
elop
men
tal
Cou
rse
Gra
deP
T an
d A
ge
≤ 2
1A
ge 2
2–25
Age
> 2
5P
T an
d A
ge
≤ 2
1A
ge 2
2–25
Age
> 2
5
Suc
cess
in F
irst S
ocia
l S
cien
ce C
ours
eC
or H
ighe
r0
.01
-1.3
90
.49
-0.8
9-0
.84
-0.7
50
.04
-0.1
00
.05
B o
r Hig
her
0.0
1-1
.74
0.5
2-0
.53
-0.3
8-0
.37
0.0
40
.09
0.1
6
GPA
Yea
r 1 (o
r Las
t G
PA)
2.0
or H
ighe
r<
0.0
1-1
.33
0.6
2-0
.85
-0.7
1-0
.49
0.1
30
.02
0.3
2
3.0
or H
ighe
r<
0.0
1-1
.15
0.7
5-0
.31
-0.1
5-0
.05
-0.2
8-0
.23
<0
.01
GPA
Yea
r 22
.0 o
r Hig
her
<0
.01
-1.7
70
.64
-0.7
0-0
.20
-0.0
2-0
.08
-0.1
2-0
.13
3.0
or H
ighe
r0
.01
-2.1
30
.76
-0.9
4-0
.49
-0.1
60
.14
0.2
70
.33
GPA
Yea
r 32
.0 o
r Hig
her
<0
.01
-1.8
40
.59
-0.8
8-0
.34
-0.2
10
.10
-0.0
7-0
.07
3.0
or H
ighe
r0
.01
-2.9
90
.84
-0.6
2-0
.24
0.0
60
.28
0.3
00
.59
Ret
urn
Fall,
Any
Inst
.Ye
ar 2
-0.0
1-0
.79
0.4
3-1
.31
-1.4
5-1
.30
0.0
80
.18
0.2
9
Year
3-0
.01
-0.8
50
.45
-1.1
9-1
.15
-1.0
10
.09
0.0
20
.21
Pro
gres
s to
Deg
ree
Year
2<
0.0
1-2
.67
0.5
1-2
.61
-2.7
6-2
.54
0.3
30
.27
0.4
2
Cer
tific
ate
with
in .
. .4
Yea
rs<
0.0
10
.62
0.2
8-1
.06
-0.6
6-1
.00
0.2
50
.24
0.3
3
5 Y
ears
<0
.01
1.0
20
.30
-1.0
1-0
.57
-0.9
50
.35
0.3
30
.35
6 Y
ears
<0
.01
0.6
50
.26
-0.8
4-0
.67
-0.6
60
.41
0.4
30
.46
Ass
ocia
te’s
Deg
ree
with
in .
. .4
Yea
rs0
.01
-1.0
50
.60
-1.5
7-1
.69
-1.3
90
.31
-0.0
90
.22
5 Y
ears
<0
.01
-0.8
60
.57
-1.3
6-1
.37
-1.3
90
.29
-0.0
90
.35
6 Y
ears
<0
.01
-0.8
30
.61
-1.2
2-1
.03
-1.1
10
.10
-0.1
80
.14
Ass
ocia
te’s
/Bac
helo
r’s
Deg
ree
with
in .
. .4
Yea
rs0
.01
-1.0
80
.60
-1.5
8-1
.71
-1.4
10
.32
-0.0
90
.22
5 Y
ears
<0
.01
-1.0
00
.57
-1.4
2-1
.45
-1.4
50
.32
-0.0
80
.38
6 Y
ears
0.0
1-1
.19
0.6
3-1
.28
-1.1
2-1
.17
0.0
6-0
.23
0.1
6

79
Table C-21. Variance Components of Hierarchical Logistic Regression Models for Predicting Subsequent College Success for Students Who Took Developmental Reading (Grade Scale A–F) before First Social Science Course
Outcome Variance Component
Type Level Intercept Standard Error
Success in First Social Science Course
C or Higher 0.2191 0.0757
B or Higher 0.2015 0.0702
GPA Year 1 (or Last GPA) 2.0 or Higher 0.3870 0.1357
3.0 or Higher 0.4087 0.1458
GPA Year 2 2.0 or Higher 0.2360 0.1124
3.0 or Higher 0.2621 0.1053
GPA Year 3 2.0 or Higher 0.0705 0.0517
3.0 or Higher 0.0680 0.0506
Return Fall, Any Inst. Year 2 0.2453 0.0976
Year 3 0.1906 0.0809
Progress to Degree Year 2 0.1111 0.0544
Certificate within . . . 4 Years 0.3508 0.1388
5 Years 0.2804 0.1184
6 Years 0.2380 0.1145
Associate’s Degree within . . . 4 Years 0.1421 0.0655
5 Years 0.0743 0.0480
6 Years 0.1076 0.0635
Associate’s/Bachelor’s Degree within . . .
4 Years 0.1426 0.0655
5 Years 0.0617 0.0434
6 Years 0.1039 0.0653

80
ACT Research Report Does Taking Developmental Courses Improve the Success of Students Who First Enroll at Two-Year Colleges?
Appendix DDifferences in Estimated Probabilities of Success for
All Students and by Developmental Course Grade
Tables D-1 through D-5Note: Shaded cells correspond to course grade regression coefficients (main effects and interactions) that are not statistically significantly different from zero (p > .01). Percentiles (Pctl.) correspond to the 5th and 95th percentiles of the associated ACT Compass scores of students who took the lower-level course.

81
Tabl
e D
-1. D
iffer
ence
s be
twee
n E
stim
ated
Pro
babi
litie
s of
Lon
ger-
Term
Col
lege
Out
com
es fo
r Stu
dent
s W
ho E
nrol
led
in D
evel
opm
enta
l E
nglis
h C
ompo
sitio
n/S
tand
ard
Eng
lish
Com
posi
tion
and
Thos
e W
ho E
nrol
led
in O
nly
Sta
ndar
d E
nglis
h C
ompo
sitio
n, fo
r All
Stu
dent
s an
d by
Dev
elop
men
tal E
nglis
h C
ompo
sitio
n G
rade
Diff
eren
ce b
etw
een
Pro
babi
lity
Ass
ocia
ted
with
Low
er-L
evel
Cou
rse
and
Pro
babi
lity
Ass
ocia
ted
with
Hig
her-
Leve
l Cou
rse
Out
com
eA
ll S
tude
nts
in
Low
er-L
evel
Cou
rse
Stu
dent
s w
ith a
n A
Gra
de in
Lo
wer
-Lev
el C
ours
eS
tude
nts
with
a B
Gra
de in
Lo
wer
-Lev
el C
ours
eS
tude
nts
with
a C
Gra
de in
Lo
wer
-Lev
el C
ours
e
Type
Leve
l5t
h P
ctl.
Med
ian
95th
P
ctl.
5th
Pct
l.M
edia
n95
th
Pct
l.5t
h P
ctl.
Med
ian
95th
P
ctl.
5th
Pct
l.M
edia
n95
th
Pct
l.
Suc
cess
in S
tand
ard
Eng
lish
Com
posi
tion
C o
r Hig
her
0.1
30
.10
0.0
80
.12
0.0
80
.06
0.0
3-0
.02
-0.0
5-0
.07
-0.1
4-0
.18
B o
r Hig
her
0.1
50
.11
0.0
80
.17
0.1
30
.10
0.0
6-0
.01
-0.0
6-0
.04
-0.1
3-0
.19
GPA
Yea
r 1 (o
r Las
t GPA
)2
.0 o
r Hig
her
0.1
20
.07
0.0
40
.17
0.1
30
.11
0.1
00
.04
0.0
00
.02
-0.0
8-0
.14
3.0
or H
ighe
r0
.11
0.0
50
.00
0.2
30
.18
0.1
40
.13
0.0
3-0
.04
0.0
4-0
.09
-0.1
8
GPA
Yea
r 22
.0 o
r Hig
her
0.1
50
.09
0.0
60
.11
0.0
70
.05
0.0
4-0
.01
-0.0
4-0
.05
-0.1
2-0
.16
3.0
or H
ighe
r0
.13
0.1
00
.06
0.1
70
.15
0.1
10
.07
-0.0
2-0
.11
-0.0
1-0
.14
-0.2
5
GPA
Yea
r 32
.0 o
r Hig
her
0.0
90
.06
0.0
40
.10
0.0
50
.03
0.0
2-0
.02
-0.0
4-0
.08
-0.1
1-0
.12
3.0
or H
ighe
r0
.15
0.1
10
.06
0.1
60
.13
0.0
90
.08
-0.0
1-0
.10
0.0
2-0
.11
-0.2
2
Ret
urn
Fall,
Any
Inst
.Ye
ar 2
0.1
10
.05
0.0
10
.20
0.1
00
.02
0.1
40
.05
-0.0
20
.07
0.0
0-0
.06
Year
30
.11
0.0
60
.03
0.2
20
.10
0.0
30
.11
0.0
2-0
.03
0.0
0-0
.06
-0.0
9
Pro
gres
s to
Deg
ree
Year
20
.09
0.0
70
.06
0.0
2-0
.02
-0.0
5-0
.06
-0.0
9-0
.11
-0.1
3-0
.15
-0.1
7
Cer
tific
ate
with
in .
. .4
Yea
rs-0
.03
-0.0
2-0
.01
0.0
40
.02
0.0
1-0
.01
-0.0
1-0
.01
-0.0
4-0
.03
-0.0
2
5 Y
ears
-0.0
8-0
.04
-0.0
20
.03
0.0
20
.02
-0.0
5-0
.02
0.0
0-0
.10
-0.0
5-0
.02
6 Y
ears
-0.1
1-0
.06
-0.0
20
.01
0.0
20
.02
-0.0
9-0
.03
0.0
0-0
.15
-0.0
7-0
.02
Ass
ocia
te’s
Deg
ree
w
ithin
. . .
4 Y
ears
0.0
20
.03
0.0
30
.05
0.0
2-0
.01
0.0
0-0
.03
-0.0
5-0
.04
-0.0
6-0
.08
5 Y
ears
0.0
50
.04
0.0
40
.08
0.0
2-0
.02
0.0
1-0
.03
-0.0
5-0
.04
-0.0
6-0
.08
6 Y
ears
0.0
20
.03
0.0
30
.05
0.0
1-0
.01
-0.0
1-0
.04
-0.0
6-0
.06
-0.0
8-0
.09
Ass
ocia
te’s
/Bac
helo
r’s
Deg
ree
with
in .
. .4
Yea
rs0
.03
0.0
30
.03
0.0
50
.02
-0.0
10
.00
-0.0
3-0
.05
-0.0
3-0
.06
-0.0
8
5 Y
ears
0.0
70
.06
0.0
50
.09
0.0
2-0
.02
0.0
2-0
.03
-0.0
6-0
.04
-0.0
7-0
.10
6 Y
ears
0.0
50
.05
0.0
50
.07
0.0
2-0
.02
0.0
0-0
.04
-0.0
6-0
.05
-0.0
8-0
.10

82
ACT Research Report Does Taking Developmental Courses Improve the Success of Students Who First Enroll at Two-Year Colleges?
Tabl
e D
-2. D
iffer
ence
s be
twee
n E
stim
ated
Pro
babi
litie
s of
Lon
ger-
Term
Col
lege
Out
com
es fo
r Stu
dent
s W
ho E
nrol
led
in A
rithm
etic
/E
lem
enta
ry A
lgeb
ra a
nd T
hose
Who
Enr
olle
d in
Onl
y E
lem
enta
ry A
lgeb
ra, f
or A
ll S
tude
nts
and
by A
rithm
etic
Gra
de
Diff
eren
ce b
etw
een
Pro
babi
lity
Ass
ocia
ted
with
Low
er-L
evel
Cou
rse
and
Pro
babi
lity
Ass
ocia
ted
with
Hig
her-
Leve
l Cou
rse
Out
com
eA
ll S
tude
nts
in
Low
er-L
evel
Cou
rse
Stu
dent
s w
ith a
n A
Gra
de in
Lo
wer
-Lev
el C
ours
eS
tude
nts
with
a B
Gra
de in
Lo
wer
-Lev
el C
ours
eS
tude
nts
with
a C
Gra
de in
Lo
wer
-Lev
el C
ours
e
Type
Leve
l5t
h P
ctl.
Med
ian
95th
P
ctl.
5th
Pct
l.M
edia
n95
th
Pct
l.5t
h P
ctl.
Med
ian
95th
P
ctl.
5th
Pct
l.M
edia
n95
th
Pct
l.
Suc
cess
in
Ele
men
tary
Alg
ebra
C o
r Hig
her
-0.0
2-0
.02
-0.0
20
.25
0.2
30
.19
0.1
00
.09
0.0
6-0
.06
-0.0
7-0
.09
B o
r Hig
her
0.0
10
.01
0.0
10
.23
0.2
30
.22
0.0
40
.03
0.0
2-0
.10
-0.1
3-0
.17
GPA
Yea
r 1 (o
r Las
t GPA
)2
.0 o
r Hig
her
-0.1
2-0
.11
-0.1
10
.13
0.1
00
.06
0.0
60
.04
-0.0
1-0
.02
-0.0
4-0
.09
3.0
or H
ighe
r-0
.07
-0.0
7-0
.08
0.1
90
.15
0.0
90
.05
0.0
2-0
.05
-0.0
7-0
.10
-0.1
6
GPA
Yea
r 22
.0 o
r Hig
her
0.0
10
.01
0.0
10
.11
0.1
00
.07
0.0
30
.02
0.0
1-0
.07
-0.0
8-0
.09
3.0
or H
ighe
r0
.00
0.0
00
.00
0.1
90
.16
0.0
80
.04
0.0
0-0
.08
-0.0
9-0
.12
-0.2
0
GPA
Yea
r 32
.0 o
r Hig
her
0.0
10
.01
0.0
10
.11
0.0
80
.04
0.0
50
.03
-0.0
1-0
.02
-0.0
5-0
.09
3.0
or H
ighe
r0
.00
0.0
00
.00
0.1
60
.14
0.1
10
.02
0.0
0-0
.04
-0.0
9-0
.12
-0.1
7
Ret
urn
Fall,
Any
Inst
.Ye
ar 2
-0.1
5-0
.15
-0.1
50
.09
0.0
80
.05
0.0
60
.05
0.0
10
.03
0.0
1-0
.02
Year
3-0
.09
-0.0
9-0
.09
0.1
50
.12
0.0
90
.08
0.0
60
.02
0.0
20
.00
-0.0
4
Pro
gres
s to
Deg
ree
Year
2-0
.01
-0.0
1-0
.01
0.0
70
.07
0.0
70
.03
0.0
30
.03
-0.0
1-0
.01
-0.0
2
Cer
tific
ate
with
in .
. .4
Yea
rs-0
.01
-0.0
1-0
.01
0.0
40
.05
0.0
60
.02
0.0
20
.03
0.0
00
.00
0.0
0
5 Y
ears
0.0
00
.01
0.0
00
.05
0.0
40
.03
0.0
30
.02
0.0
10
.01
0.0
10
.00
6 Y
ears
-0.0
2-0
.02
-0.0
20
.05
0.0
40
.02
0.0
30
.02
0.0
00
.01
0.0
0-0
.02
Ass
ocia
te’s
Deg
ree
w
ithin
. . .
4 Y
ears
0.0
00
.00
0.0
00
.05
0.0
60
.08
0.0
10
.01
0.0
2-0
.02
-0.0
2-0
.03
5 Y
ears
0.0
00
.00
-0.0
10
.10
0.0
80
.06
0.0
40
.03
0.0
0-0
.01
-0.0
2-0
.04
6 Y
ears
0.0
00
.00
0.0
00
.10
0.0
90
.06
0.0
40
.03
0.0
10
.00
-0.0
1-0
.03
Ass
ocia
te’s
/Bac
helo
r’s
Deg
ree
with
in .
. .4
Yea
rs0
.00
0.0
00
.00
0.0
50
.06
0.0
70
.01
0.0
10
.01
-0.0
2-0
.02
-0.0
3
5 Y
ears
0.0
00
.00
0.0
00
.10
0.0
90
.06
0.0
40
.03
0.0
0-0
.01
-0.0
2-0
.05
6 Y
ears
0.0
00
.00
0.0
00
.10
0.0
90
.07
0.0
50
.03
0.0
10
.00
-0.0
1-0
.03
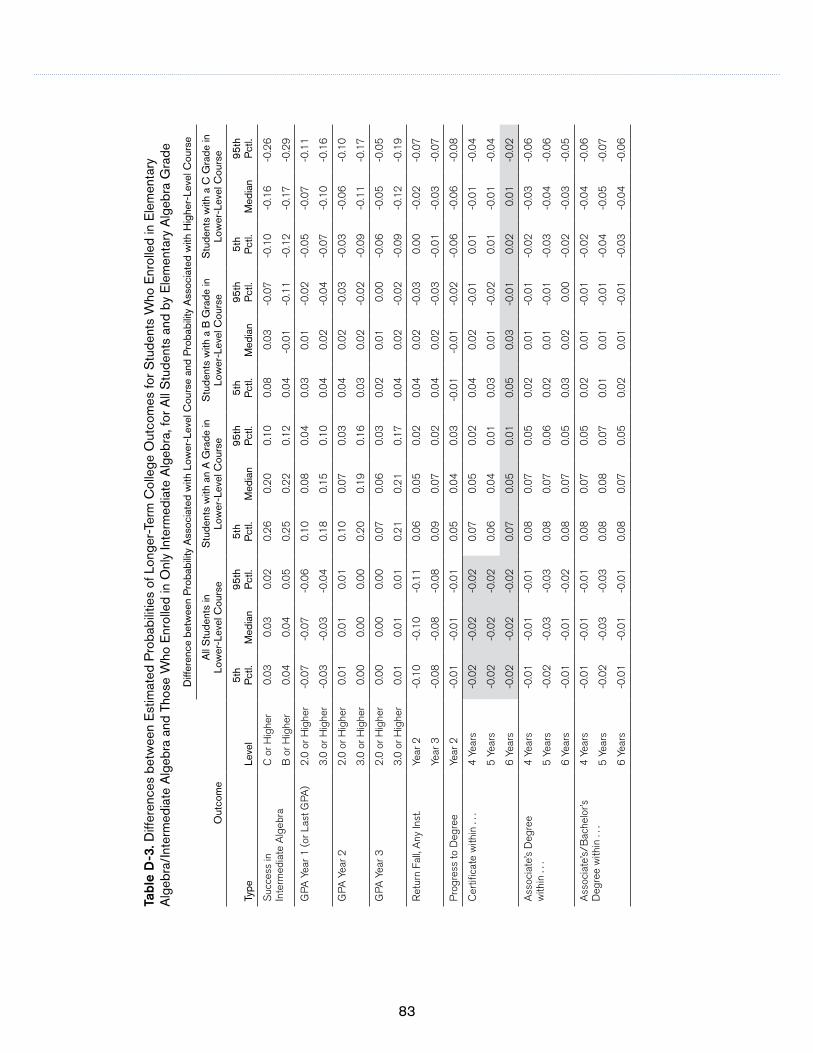
83
Tabl
e D
-3. D
iffer
ence
s be
twee
n E
stim
ated
Pro
babi
litie
s of
Lon
ger-
Term
Col
lege
Out
com
es fo
r Stu
dent
s W
ho E
nrol
led
in E
lem
enta
ry
Alg
ebra
/Int
erm
edia
te A
lgeb
ra a
nd T
hose
Who
Enr
olle
d in
Onl
y In
term
edia
te A
lgeb
ra, f
or A
ll S
tude
nts
and
by E
lem
enta
ry A
lgeb
ra G
rade
Diff
eren
ce b
etw
een
Pro
babi
lity
Ass
ocia
ted
with
Low
er-L
evel
Cou
rse
and
Pro
babi
lity
Ass
ocia
ted
with
Hig
her-
Leve
l Cou
rse
Out
com
eA
ll S
tude
nts
in
Low
er-L
evel
Cou
rse
Stu
dent
s w
ith a
n A
Gra
de in
Lo
wer
-Lev
el C
ours
eS
tude
nts
with
a B
Gra
de in
Lo
wer
-Lev
el C
ours
eS
tude
nts
with
a C
Gra
de in
Lo
wer
-Lev
el C
ours
e
Type
Leve
l5t
h P
ctl.
Med
ian
95th
P
ctl.
5th
Pct
l.M
edia
n95
th
Pct
l.5t
h P
ctl.
Med
ian
95th
P
ctl.
5th
Pct
l.M
edia
n95
th
Pct
l.
Suc
cess
in
Inte
rmed
iate
Alg
ebra
C o
r Hig
her
0.0
30
.03
0.0
20
.26
0.2
00
.10
0.0
80
.03
-0.0
7-0
.10
-0.1
6-0
.26
B o
r Hig
her
0.0
40
.04
0.0
50
.25
0.2
20
.12
0.0
4-0
.01
-0.1
1-0
.12
-0.1
7-0
.29
GPA
Yea
r 1 (o
r Las
t GPA
)2
.0 o
r Hig
her
-0.0
7-0
.07
-0.0
60
.10
0.0
80
.04
0.0
30
.01
-0.0
2-0
.05
-0.0
7-0
.11
3.0
or H
ighe
r-0
.03
-0.0
3-0
.04
0.1
80
.15
0.1
00
.04
0.0
2-0
.04
-0.0
7-0
.10
-0.1
6
GPA
Yea
r 22
.0 o
r Hig
her
0.0
10
.01
0.0
10
.10
0.0
70
.03
0.0
40
.02
-0.0
3-0
.03
-0.0
6-0
.10
3.0
or H
ighe
r0
.00
0.0
00
.00
0.2
00
.19
0.1
60
.03
0.0
2-0
.02
-0.0
9-0
.11
-0.1
7
GPA
Yea
r 32
.0 o
r Hig
her
0.0
00
.00
0.0
00
.07
0.0
60
.03
0.0
20
.01
0.0
0-0
.06
-0.0
5-0
.05
3.0
or H
ighe
r0
.01
0.0
10
.01
0.2
10
.21
0.1
70
.04
0.0
2-0
.02
-0.0
9-0
.12
-0.1
9
Ret
urn
Fall,
Any
Inst
.Ye
ar 2
-0.1
0-0
.10
-0.1
10
.06
0.0
50
.02
0.0
40
.02
-0.0
30
.00
-0.0
2-0
.07
Year
3-0
.08
-0.0
8-0
.08
0.0
90
.07
0.0
20
.04
0.0
2-0
.03
-0.0
1-0
.03
-0.0
7
Pro
gres
s to
Deg
ree
Year
2-0
.01
-0.0
1-0
.01
0.0
50
.04
0.0
3-0
.01
-0.0
1-0
.02
-0.0
6-0
.06
-0.0
8
Cer
tific
ate
with
in .
. .4
Yea
rs-0
.02
-0.0
2-0
.02
0.0
70
.05
0.0
20
.04
0.0
2-0
.01
0.0
1-0
.01
-0.0
4
5 Y
ears
-0.0
2-0
.02
-0.0
20
.06
0.0
40
.01
0.0
30
.01
-0.0
20
.01
-0.0
1-0
.04
6 Y
ears
-0.0
2-0
.02
-0.0
20
.07
0.0
50
.01
0.0
50
.03
-0.0
10
.02
0.0
1-0
.02
Ass
ocia
te’s
Deg
ree
w
ithin
. . .
4 Y
ears
-0.0
1-0
.01
-0.0
10
.08
0.0
70
.05
0.0
20
.01
-0.0
1-0
.02
-0.0
3-0
.06
5 Y
ears
-0.0
2-0
.03
-0.0
30
.08
0.0
70
.06
0.0
20
.01
-0.0
1-0
.03
-0.0
4-0
.06
6 Y
ears
-0.0
1-0
.01
-0.0
20
.08
0.0
70
.05
0.0
30
.02
0.0
0-0
.02
-0.0
3-0
.05
Ass
ocia
te’s
/Bac
helo
r’s
Deg
ree
with
in .
. .4
Yea
rs-0
.01
-0.0
1-0
.01
0.0
80
.07
0.0
50
.02
0.0
1-0
.01
-0.0
2-0
.04
-0.0
6
5 Y
ears
-0.0
2-0
.03
-0.0
30
.08
0.0
80
.07
0.0
10
.01
-0.0
1-0
.04
-0.0
5-0
.07
6 Y
ears
-0.0
1-0
.01
-0.0
10
.08
0.0
70
.05
0.0
20
.01
-0.0
1-0
.03
-0.0
4-0
.06
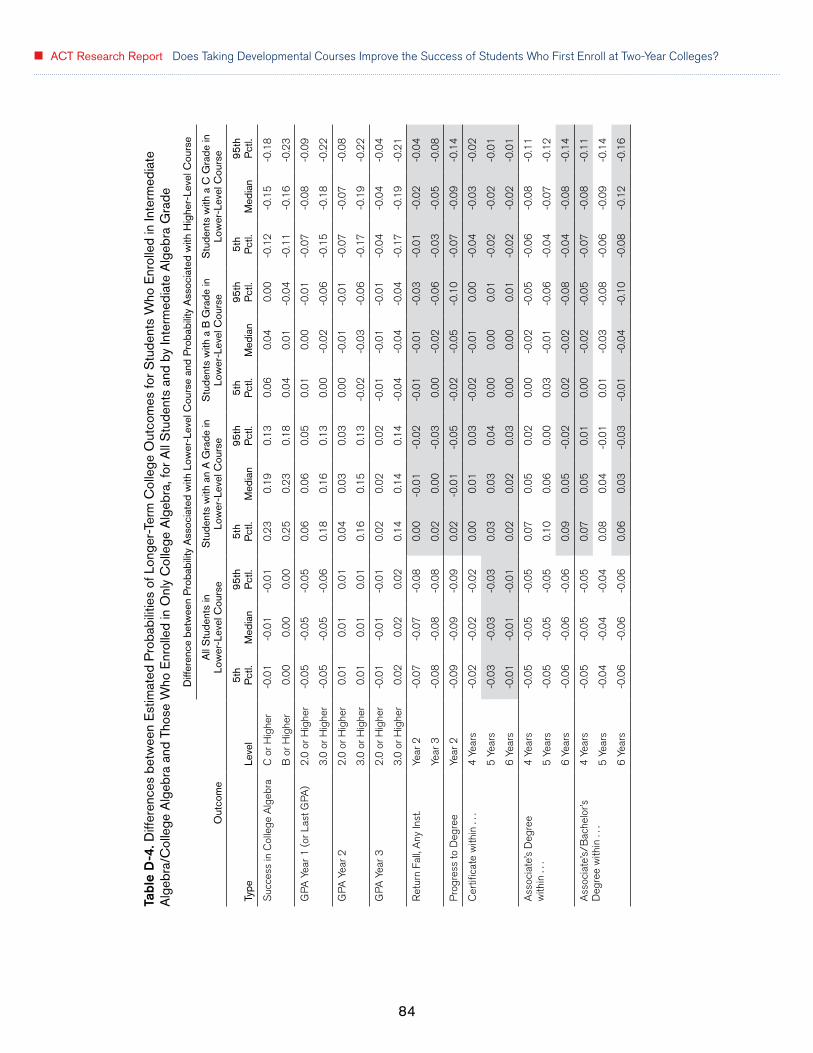
84
ACT Research Report Does Taking Developmental Courses Improve the Success of Students Who First Enroll at Two-Year Colleges?
Tabl
e D
-4. D
iffer
ence
s be
twee
n E
stim
ated
Pro
babi
litie
s of
Lon
ger-
Term
Col
lege
Out
com
es fo
r Stu
dent
s W
ho E
nrol
led
in In
term
edia
te
Alg
ebra
/Col
lege
Alg
ebra
and
Tho
se W
ho E
nrol
led
in O
nly
Col
lege
Alg
ebra
, for
All
Stu
dent
s an
d by
Inte
rmed
iate
Alg
ebra
Gra
de
Diff
eren
ce b
etw
een
Pro
babi
lity
Ass
ocia
ted
with
Low
er-L
evel
Cou
rse
and
Pro
babi
lity
Ass
ocia
ted
with
Hig
her-
Leve
l Cou
rse
Out
com
eA
ll S
tude
nts
in
Low
er-L
evel
Cou
rse
Stu
dent
s w
ith a
n A
Gra
de in
Lo
wer
-Lev
el C
ours
eS
tude
nts
with
a B
Gra
de in
Lo
wer
-Lev
el C
ours
eS
tude
nts
with
a C
Gra
de in
Lo
wer
-Lev
el C
ours
e
Type
Leve
l5t
h P
ctl.
Med
ian
95th
P
ctl.
5th
Pct
l.M
edia
n95
th
Pct
l.5t
h P
ctl.
Med
ian
95th
P
ctl.
5th
Pct
l.M
edia
n95
th
Pct
l.
Suc
cess
in C
olle
ge A
lgeb
raC
or H
ighe
r-0
.01
-0.0
1-0
.01
0.2
30
.19
0.1
30
.06
0.0
40
.00
-0.1
2-0
.15
-0.1
8
B o
r Hig
her
0.0
00
.00
0.0
00
.25
0.2
30
.18
0.0
40
.01
-0.0
4-0
.11
-0.1
6-0
.23
GPA
Yea
r 1 (o
r Las
t GPA
)2
.0 o
r Hig
her
-0.0
5-0
.05
-0.0
50
.06
0.0
60
.05
0.0
10
.00
-0.0
1-0
.07
-0.0
8-0
.09
3.0
or H
ighe
r-0
.05
-0.0
5-0
.06
0.1
80
.16
0.1
30
.00
-0.0
2-0
.06
-0.1
5-0
.18
-0.2
2
GPA
Yea
r 22
.0 o
r Hig
her
0.0
10
.01
0.0
10
.04
0.0
30
.03
0.0
0-0
.01
-0.0
1-0
.07
-0.0
7-0
.08
3.0
or H
ighe
r0
.01
0.0
10
.01
0.1
60
.15
0.1
3-0
.02
-0.0
3-0
.06
-0.1
7-0
.19
-0.2
2
GPA
Yea
r 32
.0 o
r Hig
her
-0.0
1-0
.01
-0.0
10
.02
0.0
20
.02
-0.0
1-0
.01
-0.0
1-0
.04
-0.0
4-0
.04
3.0
or H
ighe
r0
.02
0.0
20
.02
0.1
40
.14
0.1
4-0
.04
-0.0
4-0
.04
-0.1
7-0
.19
-0.2
1
Ret
urn
Fall,
Any
Inst
.Ye
ar 2
-0.0
7-0
.07
-0.0
80
.00
-0.0
1-0
.02
-0.0
1-0
.01
-0.0
3-0
.01
-0.0
2-0
.04
Year
3-0
.08
-0.0
8-0
.08
0.0
20
.00
-0.0
30
.00
-0.0
2-0
.06
-0.0
3-0
.05
-0.0
8
Pro
gres
s to
Deg
ree
Year
2-0
.09
-0.0
9-0
.09
0.0
2-0
.01
-0.0
5-0
.02
-0.0
5-0
.10
-0.0
7-0
.09
-0.1
4
Cer
tific
ate
with
in .
. .4
Yea
rs-0
.02
-0.0
2-0
.02
0.0
00
.01
0.0
3-0
.02
-0.0
10
.00
-0.0
4-0
.03
-0.0
2
5 Y
ears
-0.0
3-0
.03
-0.0
30
.03
0.0
30
.04
0.0
00
.00
0.0
1-0
.02
-0.0
2-0
.01
6 Y
ears
-0.0
1-0
.01
-0.0
10
.02
0.0
20
.03
0.0
00
.00
0.0
1-0
.02
-0.0
2-0
.01
Ass
ocia
te’s
Deg
ree
w
ithin
. . .
4 Y
ears
-0.0
5-0
.05
-0.0
50
.07
0.0
50
.02
0.0
0-0
.02
-0.0
5-0
.06
-0.0
8-0
.11
5 Y
ears
-0.0
5-0
.05
-0.0
50
.10
0.0
60
.00
0.0
3-0
.01
-0.0
6-0
.04
-0.0
7-0
.12
6 Y
ears
-0.0
6-0
.06
-0.0
60
.09
0.0
5-0
.02
0.0
2-0
.02
-0.0
8-0
.04
-0.0
8-0
.14
Ass
ocia
te’s
/Bac
helo
r’s
Deg
ree
with
in .
. .4
Yea
rs-0
.05
-0.0
5-0
.05
0.0
70
.05
0.0
10
.00
-0.0
2-0
.05
-0.0
7-0
.08
-0.1
1
5 Y
ears
-0.0
4-0
.04
-0.0
40
.08
0.0
4-0
.01
0.0
1-0
.03
-0.0
8-0
.06
-0.0
9-0
.14
6 Y
ears
-0.0
6-0
.06
-0.0
60
.06
0.0
3-0
.03
-0.0
1-0
.04
-0.1
0-0
.08
-0.1
2-0
.16

85
Tabl
e D
-5. D
iffer
ence
s be
twee
n E
stim
ated
Pro
babi
litie
s of
Lon
ger-
Term
Col
lege
Out
com
es fo
r Stu
dent
s W
ho E
nrol
led
in D
evel
opm
enta
l R
eadi
ng/F
irst S
ocia
l Sci
ence
Cou
rse
and
Thos
e W
ho E
nrol
led
in O
nly
Firs
t Soc
ial S
cien
ce c
ours
e, fo
r All
Stu
dent
s an
d by
Dev
elop
men
tal
Rea
ding
Gra
de
Diff
eren
ce b
etw
een
Pro
babi
lity
Ass
ocia
ted
with
Low
er-L
evel
Cou
rse
and
Pro
babi
lity
Ass
ocia
ted
with
Hig
her-
Leve
l Cou
rse
Out
com
eA
ll S
tude
nts
in
Low
er-L
evel
Cou
rse
Stu
dent
s w
ith a
n A
Gra
de in
Lo
wer
-Lev
el C
ours
eS
tude
nts
with
a B
Gra
de in
Lo
wer
-Lev
el C
ours
eS
tude
nts
with
a C
Gra
de in
Lo
wer
-Lev
el C
ours
e
Type
Leve
l5t
h P
ctl.
Med
ian
95th
P
ctl.
5th
Pct
l.M
edia
n95
th
Pct
l.5t
h P
ctl.
Med
ian
95th
P
ctl.
5th
Pct
l.M
edia
n95
th
Pct
l.
Suc
cess
in F
irst S
ocia
l S
cien
ce C
ours
eC
or H
ighe
r0
.16
0.1
20
.10
0.1
90
.12
0.0
90
.07
0.0
1-0
.02
-0.0
5-0
.11
-0.1
4
B o
r Hig
her
0.1
80
.14
0.1
10
.18
0.1
20
.09
0.0
60
.00
-0.0
3-0
.02
-0.1
0-0
.14
GPA
Yea
r 1 (o
r Las
t GPA
)2
.0 o
r Hig
her
0.0
80
.04
0.0
30
.17
0.1
00
.07
0.0
5-0
.02
-0.0
4-0
.09
-0.1
6-0
.19
3.0
or H
ighe
r0
.14
0.0
70
.03
0.2
50
.17
0.1
20
.08
-0.0
1-0
.05
-0.0
4-0
.13
-0.1
8
GPA
Yea
r 22
.0 o
r Hig
her
0.1
20
.08
0.0
60
.13
0.0
70
.05
0.0
2-0
.03
-0.0
5-0
.11
-0.1
7-0
.18
3.0
or H
ighe
r0
.15
0.1
30
.11
0.1
70
.10
0.0
60
.03
-0.0
5-0
.10
-0.0
6-0
.15
-0.2
0
GPA
Yea
r 32
.0 o
r Hig
her
0.0
90
.06
0.0
40
.10
0.0
50
.03
0.0
2-0
.03
-0.0
5-0
.10
-0.1
4-0
.16
3.0
or H
ighe
r0
.19
0.1
50
.12
0.2
00
.12
0.0
80
.04
-0.0
4-0
.09
-0.0
4-0
.14
-0.2
0
Ret
urn
Fall,
Any
Inst
.Ye
ar 2
-0.0
2-0
.02
-0.0
20
.11
0.0
70
.05
0.0
3-0
.01
-0.0
4-0
.06
-0.1
1-0
.14
Year
30
.02
0.0
10
.01
0.1
30
.07
0.0
50
.02
-0.0
4-0
.06
-0.0
9-0
.14
-0.1
6
Pro
gres
s to
Deg
ree
Year
20
.00
0.0
10
.01
-0.0
5-0
.06
-0.0
7-0
.14
-0.1
6-0
.17
-0.2
1-0
.23
-0.2
4
Cer
tific
ate
with
in .
. .4
Yea
rs-0
.06
-0.0
3-0
.01
0.0
00
.02
0.0
3-0
.03
-0.0
10
.00
-0.0
5-0
.03
-0.0
2
5 Y
ears
-0.0
9-0
.04
-0.0
1-0
.01
0.0
30
.04
-0.0
5-0
.01
0.0
0-0
.08
-0.0
4-0
.03
6 Y
ears
-0.0
5-0
.02
-0.0
10
.02
0.0
30
.03
-0.0
20
.00
0.0
0-0
.05
-0.0
3-0
.03
Ass
ocia
te’s
Deg
ree
w
ithin
. . .
4 Y
ears
0.0
10
.02
0.0
20
.06
0.0
60
.05
-0.0
1-0
.02
-0.0
3-0
.05
-0.0
7-0
.09
5 Y
ears
0.0
20
.02
0.0
20
.11
0.0
80
.06
0.0
1-0
.02
-0.0
4-0
.05
-0.0
8-0
.10
6 Y
ears
-0.0
10
.01
0.0
10
.10
0.0
90
.08
0.0
0-0
.02
-0.0
3-0
.08
-0.1
0-0
.11
Ass
ocia
te’s
/Bac
helo
r’s
Deg
ree
with
in .
. .4
Yea
rs0
.02
0.0
20
.02
0.0
70
.06
0.0
50
.00
-0.0
2-0
.03
-0.0
5-0
.07
-0.0
9
5 Y
ears
0.0
40
.03
0.0
30
.10
0.0
70
.05
0.0
1-0
.03
-0.0
4-0
.05
-0.0
9-0
.11
6 Y
ears
0.0
00
.02
0.0
30
.10
0.0
80
.07
-0.0
2-0
.04
-0.0
5-0
.09
-0.1
2-0
.14

86
ACT Research Report Does Taking Developmental Courses Improve the Success of Students Who First Enroll at Two-Year Colleges?
Appendix E Probabilities of Success for Students Who Did and Did Not Take Lower-Level Course in a Course Pair, by Enrollment
Status and Age
Tables E-1 through E-5Note: Non-statistically significant differences with full-time, age ≤ 21 students (p > .01) are shaded. Non-statistically significant interactions of dummy variables with course sequence taken (p > .05) are noted with superscript letters.
Table E-1. Probabilities of Success for Students Who Did and Did Not Take Developmental English Composition before Standard English Composition, by Enrollment Status and Age
Outcome
Type Level GroupFT and
Age ≤ 21PT and
Age ≤ 21 Age 22–25 Age > 25
Success in Standard English Composition
C or Higher Took Standard English Composition Only 0.87 0.51 0.63 0.72
Took Developmental English Composition and Standard English Composition
0.82 0.71 0.77 0.78
B or Higher Took Standard English Composition Only 0.67 0.34 0.50 0.62
Took Developmental English Composition and Standard English Composition
0.62 0.50 0.60 0.65
GPA Year 1 (or Last GPA) 2.0 or Higher Took Standard English Composition Only 0.88 0.53 0.73 0.81
Took Developmental English Composition and Standard English Composition
0.80 0.69 0.79 0.83
3.0 or Higher Took Standard English Composition Only 0.52c 0.23 0.46 0.63c
Took Developmental English Composition and Standard English Composition
0.42c 0.30 0.48 0.51c
GPA Year 2 2.0 or Higher Took Standard English Composition Only 0.88c 0.66 0.86 0.93c
Took Developmental English Composition and Standard English Composition
0.91c 0.80 0.90 0.93c
3.0 or Higher Took Standard English Composition Only 0.45b 0.23 0.49b 0.68
Took Developmental English Composition and Standard English Composition
0.49b 0.31 0.53b 0.61
GPA Year 3 2.0 or Higher Took Standard English Composition Only 0.92b 0.73 0.90b 0.95
Took Developmental English Composition and Standard English Composition
0.93b 0.84 0.92b 0.93
3.0 or Higher Took Standard English Composition Only 0.43b 0.25 0.49b 0.68
Took Developmental English Composition and Standard English Composition
0.48b 0.33 0.56b 0.61

87
Outcome
Type Level GroupFT and
Age ≤ 21PT and
Age ≤ 21 Age 22–25 Age > 25
Return Fall, Any Inst. Year 2 Took Standard English Composition Only 0.89 0.50 0.59 0.66
Took Developmental English Composition and Standard English Composition
0.76 0.62 0.67 0.71
Year 3 Took Standard English Composition Only 0.70 0.29 0.37 0.47
Took Developmental English Composition and Standard English Composition
0.56 0.41 0.47 0.46
Progress to Degree Year 2 Took Standard English Composition Only 0.74a,c 0.15a 0.26 0.31c
Took Developmental English Composition and Standard English Composition
0.72a,c 0.23a 0.30 0.32c
Certificate within . . . 4 Years Took Standard English Composition Only 0.18a,c 0.09a 0.14 0.15c
Took Developmental English Composition and Standard English Composition
0.18a,c 0.08a 0.11 0.12c
5 Years Took Standard English Composition Only 0.20a,c 0.11a 0.17 0.19c
Took Developmental English Composition and Standard English Composition
0.19a,c 0.09a 0.13 0.13c
6 Years Took Standard English Composition Only 0.21a,c 0.12a 0.18 0.22c
Took Developmental English Composition and Standard English Composition
0.21a,c 0.11a 0.12 0.13c
Associate’s Degree within . . .
4 Years Took Standard English Composition Only 0.37c 0.08 0.15 0.20c
Took Developmental English Composition and Standard English Composition
0.30c 0.13 0.17 0.17c
5 Years Took Standard English Composition Only 0.41c 0.10 0.18 0.26c
Took Developmental English Composition and Standard English Composition
0.35c 0.17 0.20 0.20c
6 Years Took Standard English Composition Only 0.44c 0.12 0.19 0.30c
Took Developmental English Composition and Standard English Composition
0.37c 0.19 0.26 0.22c
Associate’s/Bachelor’s Degree within . . .
4 Years Took Standard English Composition Only 0.39c 0.08 0.15 0.20c
Took Developmental English Composition and Standard English Composition
0.31c 0.13 0.18 0.17c
5 Years Took Standard English Composition Only 0.46c 0.10 0.19 0.27c
Took Developmental English Composition and Standard English Composition
0.39c 0.18 0.22 0.22c
6 Years Took Standard English Composition Only 0.51c 0.13 0.20 0.30c
Took Developmental English Composition and Standard English Composition
0.43c 0.22 0.28 0.24c
Table E-1. (continued)

88
ACT Research Report Does Taking Developmental Courses Improve the Success of Students Who First Enroll at Two-Year Colleges?
Table E-2. Probabilities of Success for Students Who Did and Did Not Take Arithmetic before Elementary Algebra, by Enrollment Status and Age
Outcome
Type Level GroupFT and
Age ≤ 21PT and
Age ≤ 21 Age 22–25 Age > 25
Success in Elementary Algebra
C or Higher Took Elementary Algebra Only 0.75 0.48 0.48 0.53
Took Arithmetic and Elementary Algebra 0.67 0.45 0.52 0.55
B or Higher Took Elementary Algebra Only 0.54 0.32 0.34 0.39
Took Arithmetic and Elementary Algebra 0.46 0.33 0.38 0.45
GPA Year 1 (or Last GPA) 2.0 or Higher Took Elementary Algebra Only 0.89 0.68 0.70 0.75
Took Arithmetic and Elementary Algebra 0.67 0.55 0.68 0.76
3.0 or Higher Took Elementary Algebra Only 0.51 0.31 0.41 0.50
Took Arithmetic and Elementary Algebra 0.26 0.25 0.38 0.49
GPA Year 2 2.0 or Higher Took Elementary Algebra Only 0.87c 0.72 0.82 0.87c
Took Arithmetic and Elementary Algebra 0.83c 0.74 0.88 0.88c
3.0 or Higher Took Elementary Algebra Only 0.38b 0.25 0.44b 0.50
Took Arithmetic and Elementary Algebra 0.33b 0.26 0.43b 0.55
GPA Year 3 2.0 or Higher Took Elementary Algebra Only 0.90b,c 0.76 0.88b 0.91c
Took Arithmetic and Elementary Algebra 0.87b,c 0.80 0.88b 0.91c
3.0 or Higher Took Elementary Algebra Only 0.34a,b,c 0.25a 0.44b 0.52c
Took Arithmetic and Elementary Algebra 0.31a,b,c 0.26a 0.43b 0.54c
Return Fall, Any Inst. Year 2 Took Elementary Algebra Only 0.91 0.63 0.61 0.67
Took Arithmetic and Elementary Algebra 0.72 0.48 0.52 0.58
Year 3 Took Elementary Algebra Only 0.71 0.35 0.34 0.44
Took Arithmetic and Elementary Algebra 0.48 0.26 0.33 0.40
Progress to Degree Year 2 Took Elementary Algebra Only 0.70c 0.16 0.18 0.23c
Took Arithmetic and Elementary Algebra 0.64c 0.15 0.20 0.23c
Certificate within . . . 4 Years Took Elementary Algebra Only 0.21a,b,c 0.08a 0.10b 0.11c
Took Arithmetic and Elementary Algebra 0.18a,b,c 0.07a 0.12b 0.10c
5 Years Took Elementary Algebra Only 0.22a,b,c 0.08a 0.12b 0.12c
Took Arithmetic and Elementary Algebra 0.23a,b,c 0.08a 0.14b 0.12c
6 Years Took Elementary Algebra Only 0.25a,b,c 0.11a 0.15b 0.18c
Took Arithmetic and Elementary Algebra 0.32b,c 0.09a 0.14b 0.15c
Associate’s Degree within . . .
4 Years Took Elementary Algebra Only 0.29c 0.07 0.09 0.12c
Took Arithmetic and Elementary Algebra 0.21c 0.07 0.11 0.12c
5 Years Took Elementary Algebra Only 0.33b,c 0.10 0.11b 0.16c
Took Arithmetic and Elementary Algebra 0.26b,c 0.11 0.12b 0.15c
6 Years Took Elementary Algebra Only 0.35a,c 0.11a 0.13 0.18c
Took Arithmetic and Elementary Algebra 0.28a,c 0.11a 0.15 0.20c
Associate’s/Bachelor’s Degree within . . .
4 Years Took Elementary Algebra Only 0.31 0.07 0.09 0.13
Took Arithmetic and Elementary Algebra 0.22 0.08 0.11 0.12
5 Years Took Elementary Algebra Only 0.37c 0.11 0.11 0.17c
Took Arithmetic and Elementary Algebra 0.28c 0.11 0.12 0.16c
6 Years Took Elementary Algebra Only 0.41c 0.12 0.13 0.20c
Took Arithmetic and Elementary Algebra 0.32c 0.12 0.16 0.21c

89
Table E-3. Probabilities of Success for Students Who Did and Did Not Take Elementary Algebra before Intermediate Algebra, by Enrollment Status and Age
Outcome
Type Level GroupFT and
Age ≤ 21PT and
Age ≤ 21 Age 22–25 Age > 25
Success in Intermediate Algebra
C or Higher Took Intermediate Algebra Only 0.75b,c 0.44 0.59b 0.61c
Took Elementary Algebra and Intermediate Algebra
0.66b,c 0.52 0.58b 0.58c
B or Higher Took Intermediate Algebra Only 0.54b,c 0.29 0.46b 0.48c
Took Elementary Algebra and Intermediate Algebra
0.48b,c 0.39 0.43b 0.47c
GPA Year 1 (or Last GPA) 2.0 or Higher Took Intermediate Algebra Only 0.93 0.67 0.80 0.81
Took Elementary Algebra and Intermediate Algebra
0.81 0.65 0.73 0.76
3.0 or Higher Took Intermediate Algebra Only 0.55 0.28 0.46 0.48
Took Elementary Algebra and Intermediate Algebra
0.37 0.29 0.39 0.48
GPA Year 2 2.0 or Higher Took Intermediate Algebra Only 0.93b,c 0.74 0.88b 0.91c
Took Elementary Algebra and Intermediate Algebra
0.90b,c 0.79 0.86b 0.92c
3.0 or Higher Took Intermediate Algebra Only 0.49c 0.24 0.43 0.55c
Took Elementary Algebra and Intermediate Algebra
0.40c 0.28 0.45 0.53c
GPA Year 3 2.0 or Higher Took Intermediate Algebra Only 0.95b 0.80 0.92b 0.90
Took Elementary Algebra and Intermediate Algebra
0.91b 0.83 0.90b 0.94
3.0 or Higher Took Intermediate Algebra Only 0.45b,c 0.25 0.43b 0.50c
Took Elementary Algebra and Intermediate Algebra
0.40b,c 0.28 0.43b 0.52c
Return Fall, Any Inst. Year 2 Took Intermediate Algebra Only 0.93b,c 0.65 0.75b 0.81c
Took Elementary Algebra and Intermediate Algebra
0.82b,c 0.58 0.64b 0.64c
Year 3 Took Intermediate Algebra Only 0.76b,c 0.39 0.53b 0.60c
Took Elementary Algebra and Intermediate Algebra
0.56b,c 0.37 0.41b 0.47c
Progress to Degree Year 2 Took Intermediate Algebra Only 0.78b,c 0.20 0.36b 0.45c
Took Elementary Algebra and Intermediate Algebra
0.72b,c 0.21 0.32b 0.37c
Certificate within . . . 4 Years Took Intermediate Algebra Only 0.19a,b,c 0.11a 0.14b 0.09c
Took Elementary Algebra and Intermediate Algebra
0.17a,b,c 0.09a 0.12b 0.11c
5 Years Took Intermediate Algebra Only 0.21a,b,c 0.12a 0.17b 0.12c
Took Elementary Algebra and Intermediate Algebra
0.22a,b,c 0.10a 0.15b 0.12c
6 Years Took Intermediate Algebra Only 0.23a,b,c 0.12a 0.19b 0.10c
Took Elementary Algebra and Intermediate Algebra
0.23a,b,c 0.10a 0.14b 0.14c
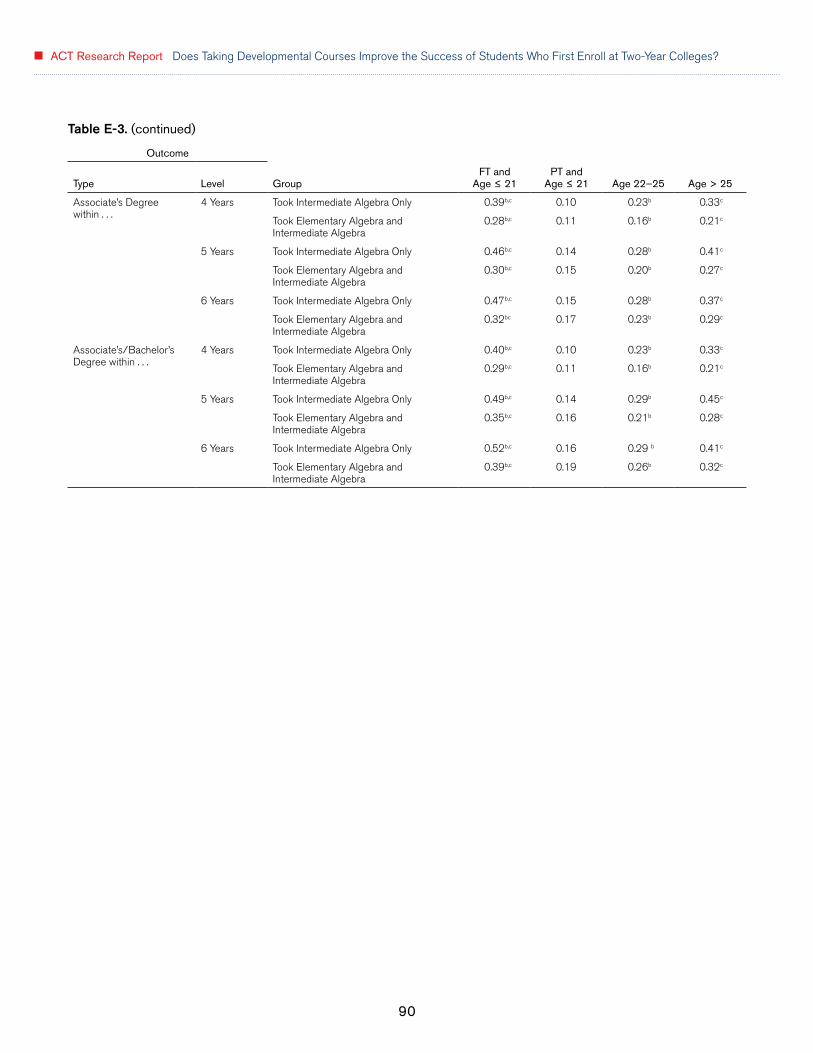
90
ACT Research Report Does Taking Developmental Courses Improve the Success of Students Who First Enroll at Two-Year Colleges?
Outcome
Type Level GroupFT and
Age ≤ 21PT and
Age ≤ 21 Age 22–25 Age > 25
Associate’s Degree within . . .
4 Years Took Intermediate Algebra Only 0.39b,c 0.10 0.23b 0.33c
Took Elementary Algebra and Intermediate Algebra
0.28b,c 0.11 0.16b 0.21c
5 Years Took Intermediate Algebra Only 0.46b,c 0.14 0.28b 0.41c
Took Elementary Algebra and Intermediate Algebra
0.30b,c 0.15 0.20b 0.27c
6 Years Took Intermediate Algebra Only 0.47b,c 0.15 0.28b 0.37c
Took Elementary Algebra and Intermediate Algebra
0.32bc 0.17 0.23b 0.29c
Associate’s/Bachelor’s Degree within . . .
4 Years Took Intermediate Algebra Only 0.40b,c 0.10 0.23b 0.33c
Took Elementary Algebra and Intermediate Algebra
0.29b,c 0.11 0.16b 0.21c
5 Years Took Intermediate Algebra Only 0.49b,c 0.14 0.29b 0.45c
Took Elementary Algebra and Intermediate Algebra
0.35b,c 0.16 0.21b 0.28c
6 Years Took Intermediate Algebra Only 0.52b,c 0.16 0.29 b 0.41c
Took Elementary Algebra and Intermediate Algebra
0.39b,c 0.19 0.26b 0.32c
Table E-3. (continued)

91
Table E-4. Probabilities of Success for Students Who Did and Did Not Take Intermediate Algebra before College Algebra, by Enrollment Status and Age
Outcome
Type Level GroupFT and
Age ≤ 21PT and
Age ≤ 21 Age 22–25 Age > 25
Success in College Algebra
C or Higher Took College Algebra Only 0.81 0.44 0.65 0.73
Took Intermediate Algebra and College Algebra
0.74 0.53 0.68 0.75
B or Higher Took College Algebra Only 0.56 0.26 0.43 0.56
Took Intermediate Algebra and College Algebra
0.48 0.33 0.46 0.59
GPA Year 1 (or Last GPA) 2.0 or Higher Took College Algebra Only 0.95c 0.65 0.84 0.90c
Took Intermediate Algebra and College Algebra
0.89c 0.69 0.84 0.87c
3.0 or Higher Took College Algebra Only 0.65c 0.27 0.57 0.79c
Took Intermediate Algebra and College Algebra
0.51c 0.31 0.52 0.56c
GPA Year 2 2.0 or Higher Took College Algebra Only 0.95b,c 0.74 0.90b 0.97c
Took Intermediate Algebra and College Algebra
0.93b,c 0.84 0.91b 0.94c
3.0 or Higher Took College Algebra Only 0.59b 0.27 0.58b 0.81
Took Intermediate Algebra and College Algebra
0.56b 0.35 0.57b 0.66
GPA Year 3 2.0 or Higher Took College Algebra Only 0.96b,c 0.82 0.95b 0.97c
Took Intermediate Algebra and College Algebra
0.95b,c 0.85 0.94b 0.95c
3.0 or Higher Took College Algebra Only 0.57b,c 0.29 0.60b 0.83c
Took Intermediate Algebra and College Algebra
0.56b,c 0.36 0.62b 0.69c
Return Fall, Any Inst. Year 2 Took College Algebra Only 0.94c 0.62 0.78 0.84c
Took Intermediate Algebra and College Algebra
0.85c 0.63 0.70 0.69c
Year 3 Took College Algebra Only 0.81c 0.40 0.58 0.73c
Took Intermediate Algebra and College Algebra
0.67c 0.44 0.51 0.50c
Progress to Degree Year 2 Took College Algebra Only 0.88b,c 0.28 0.60b 0.66c
Took Intermediate Algebra and College Algebra
0.78b,c 0.28 0.45b 0.52c
Certificate within . . . 4 Years Took College Algebra Only 0.17b 0.08 0.10b 0.13
Took Intermediate Algebra and College Algebra
0.12b 0.08 0.09b 0.02
5 Years Took College Algebra Only 0.18a,b 0.10a 0.13b 0.20
Took Intermediate Algebra and College Algebra
0.13a,b 0.09a 0.13b 0.03
6 Years Took College Algebra Only 0.15a,b 0.10a 0.10b 0.18
Took Intermediate Algebra and College Algebra
0.16a,b 0.09a 0.16b 0.03
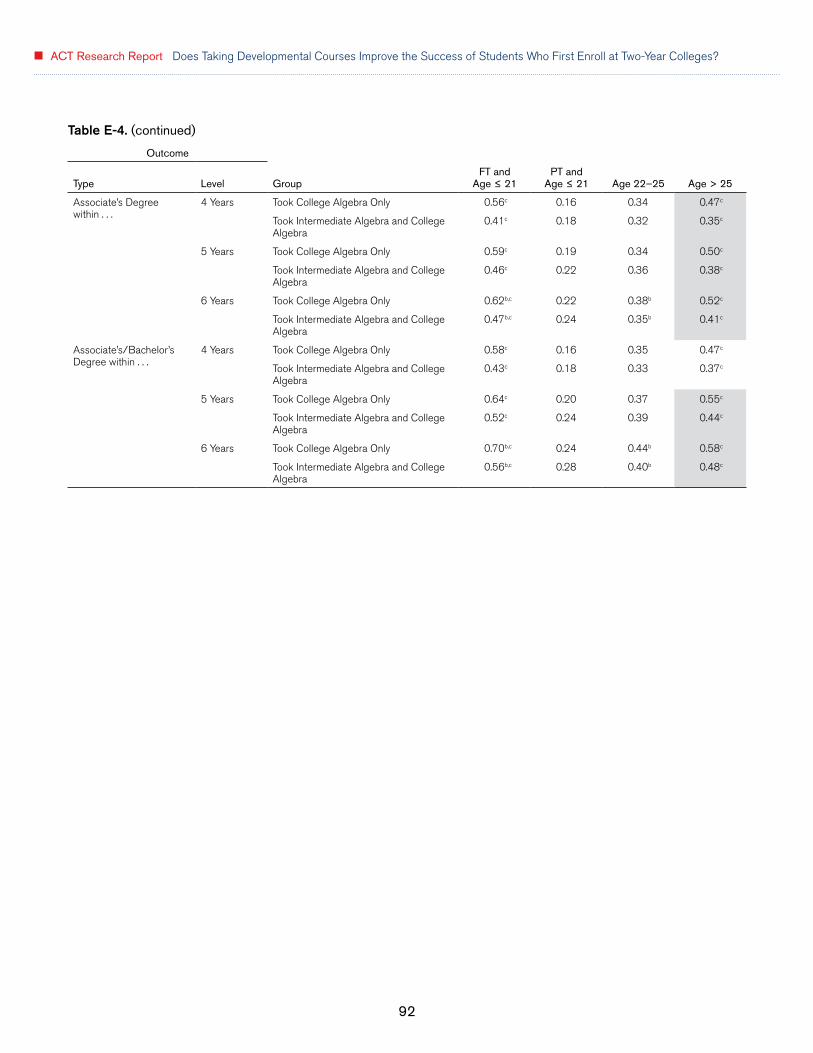
92
ACT Research Report Does Taking Developmental Courses Improve the Success of Students Who First Enroll at Two-Year Colleges?
Outcome
Type Level GroupFT and
Age ≤ 21PT and
Age ≤ 21 Age 22–25 Age > 25
Associate’s Degree within . . .
4 Years Took College Algebra Only 0.56c 0.16 0.34 0.47c
Took Intermediate Algebra and College Algebra
0.41c 0.18 0.32 0.35c
5 Years Took College Algebra Only 0.59c 0.19 0.34 0.50c
Took Intermediate Algebra and College Algebra
0.46c 0.22 0.36 0.38c
6 Years Took College Algebra Only 0.62b,c 0.22 0.38b 0.52c
Took Intermediate Algebra and College Algebra
0.47b,c 0.24 0.35b 0.41c
Associate’s/Bachelor’s Degree within . . .
4 Years Took College Algebra Only 0.58c 0.16 0.35 0.47c
Took Intermediate Algebra and College Algebra
0.43c 0.18 0.33 0.37c
5 Years Took College Algebra Only 0.64c 0.20 0.37 0.55c
Took Intermediate Algebra and College Algebra
0.52c 0.24 0.39 0.44c
6 Years Took College Algebra Only 0.70b,c 0.24 0.44b 0.58c
Took Intermediate Algebra and College Algebra
0.56b,c 0.28 0.40b 0.48c
Table E-4. (continued)
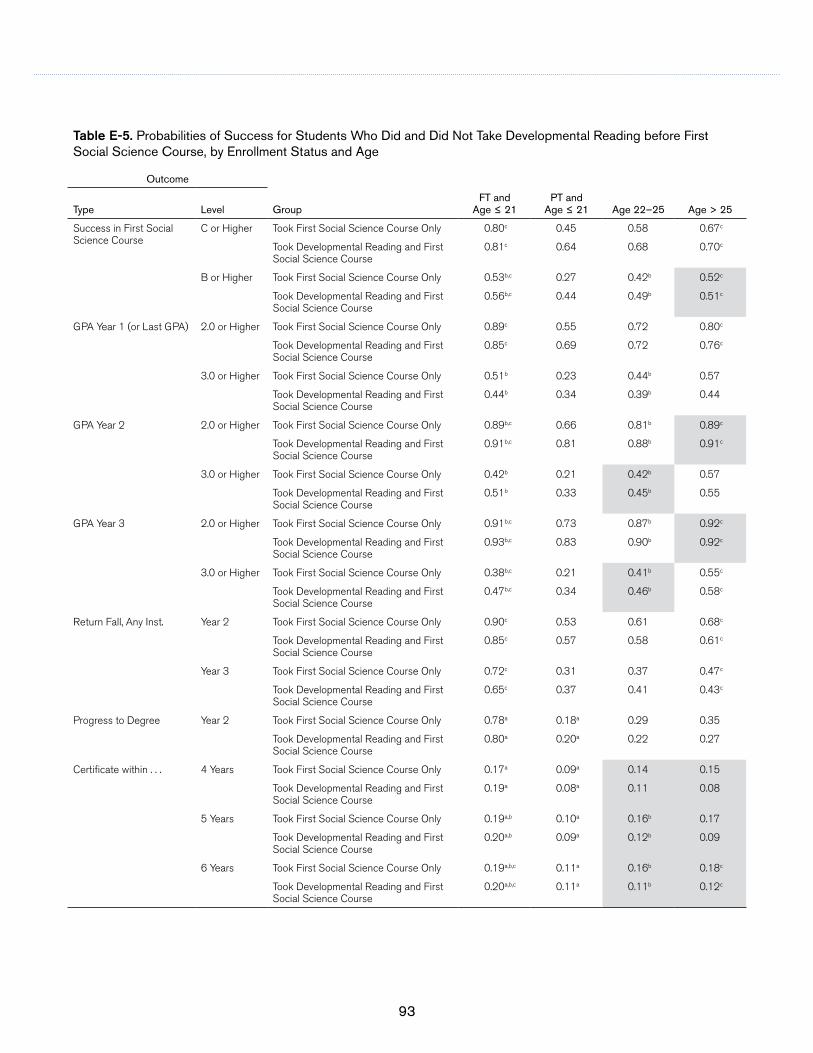
93
Table E-5. Probabilities of Success for Students Who Did and Did Not Take Developmental Reading before First Social Science Course, by Enrollment Status and Age
Outcome
Type Level GroupFT and
Age ≤ 21PT and
Age ≤ 21 Age 22–25 Age > 25
Success in First Social Science Course
C or Higher Took First Social Science Course Only 0.80c 0.45 0.58 0.67c
Took Developmental Reading and First Social Science Course
0.81c 0.64 0.68 0.70c
B or Higher Took First Social Science Course Only 0.53b,c 0.27 0.42b 0.52c
Took Developmental Reading and First Social Science Course
0.56b,c 0.44 0.49b 0.51c
GPA Year 1 (or Last GPA) 2.0 or Higher Took First Social Science Course Only 0.89c 0.55 0.72 0.80c
Took Developmental Reading and First Social Science Course
0.85c 0.69 0.72 0.76c
3.0 or Higher Took First Social Science Course Only 0.51b 0.23 0.44b 0.57
Took Developmental Reading and First Social Science Course
0.44b 0.34 0.39b 0.44
GPA Year 2 2.0 or Higher Took First Social Science Course Only 0.89b,c 0.66 0.81b 0.89c
Took Developmental Reading and First Social Science Course
0.91b,c 0.81 0.88b 0.91c
3.0 or Higher Took First Social Science Course Only 0.42b 0.21 0.42b 0.57
Took Developmental Reading and First Social Science Course
0.51b 0.33 0.45b 0.55
GPA Year 3 2.0 or Higher Took First Social Science Course Only 0.91b,c 0.73 0.87b 0.92c
Took Developmental Reading and First Social Science Course
0.93b,c 0.83 0.90b 0.92c
3.0 or Higher Took First Social Science Course Only 0.38b,c 0.21 0.41b 0.55c
Took Developmental Reading and First Social Science Course
0.47b,c 0.34 0.46b 0.58c
Return Fall, Any Inst. Year 2 Took First Social Science Course Only 0.90c 0.53 0.61 0.68c
Took Developmental Reading and First Social Science Course
0.85c 0.57 0.58 0.61c
Year 3 Took First Social Science Course Only 0.72c 0.31 0.37 0.47c
Took Developmental Reading and First Social Science Course
0.65c 0.37 0.41 0.43c
Progress to Degree Year 2 Took First Social Science Course Only 0.78a 0.18a 0.29 0.35
Took Developmental Reading and First Social Science Course
0.80a 0.20a 0.22 0.27
Certificate within . . . 4 Years Took First Social Science Course Only 0.17a 0.09a 0.14 0.15
Took Developmental Reading and First Social Science Course
0.19a 0.08a 0.11 0.08
5 Years Took First Social Science Course Only 0.19a,b 0.10a 0.16b 0.17
Took Developmental Reading and First Social Science Course
0.20a,b 0.09a 0.12b 0.09
6 Years Took First Social Science Course Only 0.19a,b,c 0.11a 0.16b 0.18c
Took Developmental Reading and First Social Science Course
0.20a,b,c 0.11a 0.11b 0.12c

94
ACT Research Report Does Taking Developmental Courses Improve the Success of Students Who First Enroll at Two-Year Colleges?
Outcome
Type Level GroupFT and
Age ≤ 21PT and
Age ≤ 21 Age 22–25 Age > 25
Associate’s Degree within . . .
4 Years Took First Social Science Course Only 0.38b,c 0.08 0.14b 0.19c
Took Developmental Reading and First Social Science Course
0.36b,c 0.12 0.11b 0.15c
5 Years Took First Social Science Course Only 0.43b 0.11 0.17b 0.24
Took Developmental Reading and First Social Science Course
0.40b 0.16 0.17b 0.17
6 Years Took First Social Science Course Only 0.46b,c 0.13 0.19b 0.27c
Took Developmental Reading and First Social Science Course
0.42b,c 0.17 0.20b 0.20c
Associate’s/Bachelor’s Degree within . . .
4 Years Took First Social Science Course Only 0.39b,c 0.08 0.14b 0.19c
Took Developmental Reading and First Social Science Course
0.38b,c 0.12 0.12b 0.15c
5 Years Took First Social Science Course Only 0.47b,c 0.12 0.17b 0.25c
Took Developmental Reading and First Social Science Course
0.45b,c 0.17 0.18b 0.18c
6 Years Took First Social Science Course Only 0.53b,c 0.14 0.20b 0.27c
Took Developmental Reading and First Social Science Course
0.49b,c 0.20 0.23b 0.23c
Table E-5. (continued)
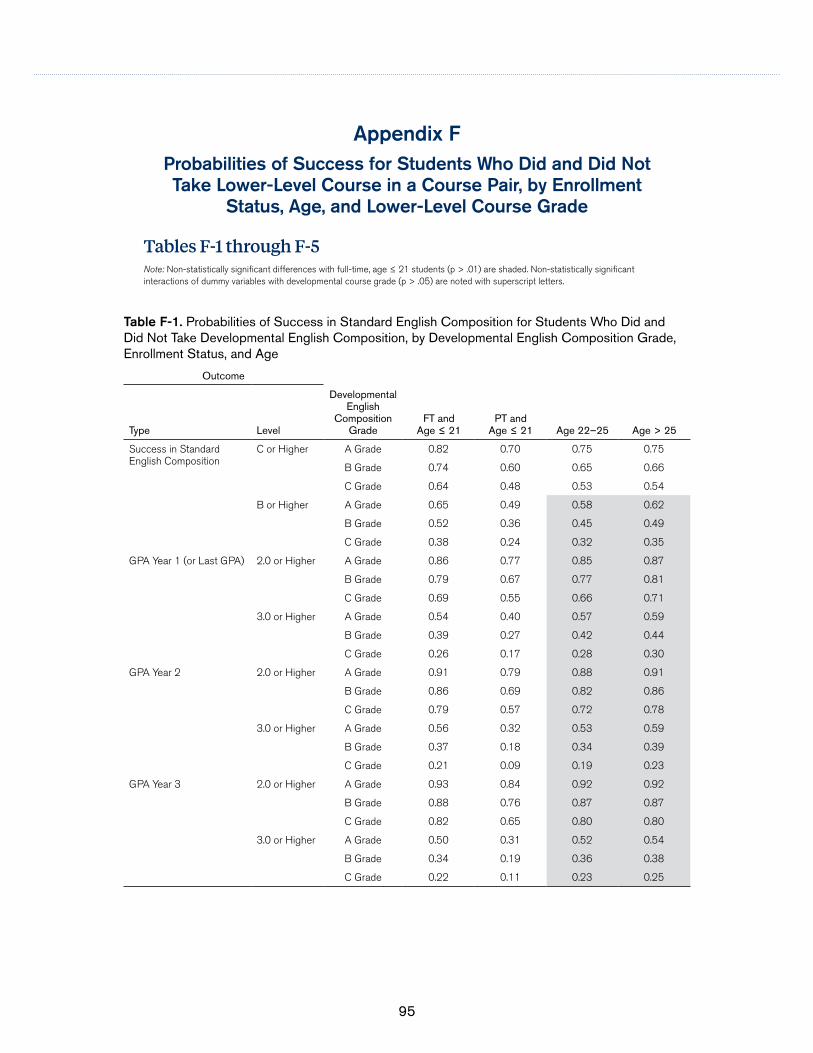
95
Appendix F Probabilities of Success for Students Who Did and Did Not Take Lower-Level Course in a Course Pair, by Enrollment
Status, Age, and Lower-Level Course Grade
Tables F-1 through F-5Note: Non-statistically significant differences with full-time, age ≤ 21 students (p > .01) are shaded. Non-statistically significant interactions of dummy variables with developmental course grade (p > .05) are noted with superscript letters.
Table F-1. Probabilities of Success in Standard English Composition for Students Who Did and Did Not Take Developmental English Composition, by Developmental English Composition Grade, Enrollment Status, and Age
Outcome
Type Level
Developmental English
Composition Grade
FT and Age ≤ 21
PT and Age ≤ 21 Age 22–25 Age > 25
Success in Standard English Composition
C or Higher A Grade 0.82 0.70 0.75 0.75
B Grade 0.74 0.60 0.65 0.66
C Grade 0.64 0.48 0.53 0.54
B or Higher A Grade 0.65 0.49 0.58 0.62
B Grade 0.52 0.36 0.45 0.49
C Grade 0.38 0.24 0.32 0.35
GPA Year 1 (or Last GPA) 2.0 or Higher A Grade 0.86 0.77 0.85 0.87
B Grade 0.79 0.67 0.77 0.81
C Grade 0.69 0.55 0.66 0.71
3.0 or Higher A Grade 0.54 0.40 0.57 0.59
B Grade 0.39 0.27 0.42 0.44
C Grade 0.26 0.17 0.28 0.30
GPA Year 2 2.0 or Higher A Grade 0.91 0.79 0.88 0.91
B Grade 0.86 0.69 0.82 0.86
C Grade 0.79 0.57 0.72 0.78
3.0 or Higher A Grade 0.56 0.32 0.53 0.59
B Grade 0.37 0.18 0.34 0.39
C Grade 0.21 0.09 0.19 0.23
GPA Year 3 2.0 or Higher A Grade 0.93 0.84 0.92 0.92
B Grade 0.88 0.76 0.87 0.87
C Grade 0.82 0.65 0.80 0.80
3.0 or Higher A Grade 0.50 0.31 0.52 0.54
B Grade 0.34 0.19 0.36 0.38
C Grade 0.22 0.11 0.23 0.25

96
ACT Research Report Does Taking Developmental Courses Improve the Success of Students Who First Enroll at Two-Year Colleges?
Outcome
Type Level
Developmental English
Composition Grade
FT and Age ≤ 21
PT and Age ≤ 21 Age 22–25 Age > 25
Return Fall, Any Inst. Year 2 A Grade 0.85 0.75 0.77 0.82
B Grade 0.81 0.70 0.72 0.77
C Grade 0.77 0.64 0.67 0.72
Year 3 A Grade 0.69 0.50 0.54 0.55
B Grade 0.61 0.42 0.46 0.47
C Grade 0.53 0.34 0.37 0.38
Progress to Degree Year 2 A Grade 0.73 0.23 0.28 0.31
B Grade 0.65 0.17 0.22 0.23
C Grade 0.56 0.12 0.16 0.17
Certificate within . . . 4 Years A Grade 0.29 0.13 0.16 0.18
B Grade 0.24 0.10 0.13 0.15
C Grade 0.20 0.08 0.11 0.12
5 Years A Grade 0.31 0.16 0.20 0.22
B Grade 0.24 0.12 0.16 0.17
C Grade 0.19 0.09 0.12 0.13
6 Years A Grade 0.29 0.18 0.20 0.22
B Grade 0.23 0.13 0.15 0.16
C Grade 0.17 0.10 0.11 0.12
Associate’s Degree within . . .
4 Years A Grade 0.35 0.13 0.15 0.15
B Grade 0.26 0.09 0.10 0.10
C Grade 0.19 0.06 0.07 0.07
5 Years A Grade 0.39 0.17 0.18 0.19
B Grade 0.31 0.12 0.14 0.14
C Grade 0.24 0.09 0.10 0.10
6 Years A Grade 0.41 0.18 0.23 0.20
B Grade 0.33 0.14 0.18 0.15
C Grade 0.26 0.10 0.13 0.11
Associate’s/Bachelor’s Degree within . . .
4 Years A Grade 0.36 0.13 0.15 0.15
B Grade 0.27 0.09 0.10 0.11
C Grade 0.19 0.06 0.07 0.07
5 Years A Grade 0.42 0.17 0.18 0.20
B Grade 0.33 0.12 0.13 0.14
C Grade 0.25 0.09 0.10 0.10
6 Years A Grade 0.45 0.20 0.25 0.22
B Grade 0.36 0.15 0.19 0.17
C Grade 0.28 0.11 0.14 0.12
Table F-1. (continued)
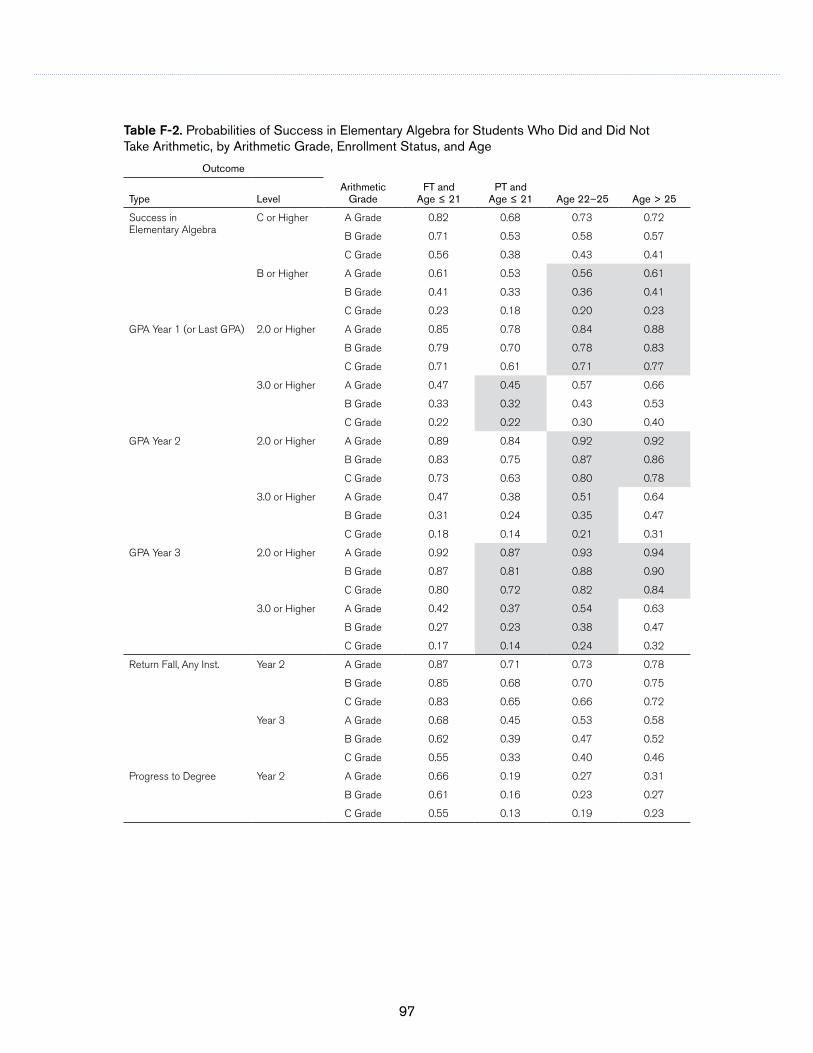
97
Table F-2. Probabilities of Success in Elementary Algebra for Students Who Did and Did Not Take Arithmetic, by Arithmetic Grade, Enrollment Status, and Age
Outcome
Type LevelArithmetic
GradeFT and
Age ≤ 21PT and
Age ≤ 21 Age 22–25 Age > 25
Success in Elementary Algebra
C or Higher A Grade 0.82 0.68 0.73 0.72
B Grade 0.71 0.53 0.58 0.57
C Grade 0.56 0.38 0.43 0.41
B or Higher A Grade 0.61 0.53 0.56 0.61
B Grade 0.41 0.33 0.36 0.41
C Grade 0.23 0.18 0.20 0.23
GPA Year 1 (or Last GPA) 2.0 or Higher A Grade 0.85 0.78 0.84 0.88
B Grade 0.79 0.70 0.78 0.83
C Grade 0.71 0.61 0.71 0.77
3.0 or Higher A Grade 0.47 0.45 0.57 0.66
B Grade 0.33 0.32 0.43 0.53
C Grade 0.22 0.22 0.30 0.40
GPA Year 2 2.0 or Higher A Grade 0.89 0.84 0.92 0.92
B Grade 0.83 0.75 0.87 0.86
C Grade 0.73 0.63 0.80 0.78
3.0 or Higher A Grade 0.47 0.38 0.51 0.64
B Grade 0.31 0.24 0.35 0.47
C Grade 0.18 0.14 0.21 0.31
GPA Year 3 2.0 or Higher A Grade 0.92 0.87 0.93 0.94
B Grade 0.87 0.81 0.88 0.90
C Grade 0.80 0.72 0.82 0.84
3.0 or Higher A Grade 0.42 0.37 0.54 0.63
B Grade 0.27 0.23 0.38 0.47
C Grade 0.17 0.14 0.24 0.32
Return Fall, Any Inst. Year 2 A Grade 0.87 0.71 0.73 0.78
B Grade 0.85 0.68 0.70 0.75
C Grade 0.83 0.65 0.66 0.72
Year 3 A Grade 0.68 0.45 0.53 0.58
B Grade 0.62 0.39 0.47 0.52
C Grade 0.55 0.33 0.40 0.46
Progress to Degree Year 2 A Grade 0.66 0.19 0.27 0.31
B Grade 0.61 0.16 0.23 0.27
C Grade 0.55 0.13 0.19 0.23

98
ACT Research Report Does Taking Developmental Courses Improve the Success of Students Who First Enroll at Two-Year Colleges?
Outcome
Type LevelArithmetic
GradeFT and
Age ≤ 21PT and
Age ≤ 21 Age 22–25 Age > 25
Certificate within . . . 4 Years A Grade 0.23 0.12 0.17 0.15
B Grade 0.19 0.09 0.14 0.12
C Grade 0.15 0.07 0.11 0.10
5 Years A Grade 0.28 0.11 0.18 0.15
B Grade 0.25 0.10 0.16 0.13
C Grade 0.22 0.08 0.14 0.12
6 Years A Grade 0.44 0.13 0.19 0.20
B Grade 0.40 0.12 0.16 0.17
C Grade 0.37 0.10 0.14 0.15
Associate’s Degree within . . .
4 Years A Grade 0.29 0.12 0.16 0.17
B Grade 0.21 0.08 0.11 0.11
C Grade 0.15 0.05 0.07 0.08
5 Years A Grade 0.36 0.17 0.17 0.23
B Grade 0.27 0.12 0.12 0.17
C Grade 0.20 0.08 0.09 0.12
6 Years A Grade 0.38 0.17 0.21 0.27
B Grade 0.30 0.13 0.16 0.21
C Grade 0.24 0.10 0.12 0.16
Associate’s/Bachelor’s Degree within . . .
4 Years A Grade 0.30 0.12 0.16 0.17
B Grade 0.21 0.08 0.11 0.12
C Grade 0.15 0.05 0.07 0.08
5 Years A Grade 0.38 0.18 0.18 0.24
B Grade 0.29 0.13 0.13 0.17
C Grade 0.21 0.09 0.09 0.12
6 Years A Grade 0.41 0.19 0.22 0.29
B Grade 0.33 0.14 0.17 0.22
C Grade 0.26 0.10 0.12 0.17
Table F-2. (continued)

99
Table F-3. Probabilities of Success in Intermediate Algebra for Students Who Did and Did Not Take Elementary Algebra, by Elementary Algebra Grade, Enrollment Status, and Age
Outcome
Type LevelElementary
Algebra GradeFT and
Age ≤ 21PT and
Age ≤ 21 Age 22–25 Age > 25
Success in Intermediate Algebra
C or Higher A Grade 0.80 0.69 0.72 0.72
B Grade 0.65 0.51 0.55 0.55
C Grade 0.46 0.33 0.36 0.36
B or Higher A Grade 0.62 0.54 0.57 0.59
B Grade 0.39 0.32 0.34 0.36
C Grade 0.20 0.16 0.17 0.18
GPA Year 1 (or Last GPA) 2.0 or Higher A Grade 0.90 0.81 0.86 0.87
B Grade 0.86 0.74 0.79 0.81
C Grade 0.80 0.65 0.72 0.74
3.0 or Higher A Grade 0.55 0.45 0.56 0.63
B Grade 0.42 0.32 0.42 0.50
C Grade 0.29 0.21 0.30 0.36
GPA Year 2 2.0 or Higher A Grade 0.94 0.86 0.91 0.95
B Grade 0.90 0.80 0.86 0.92
C Grade 0.85 0.71 0.79 0.87
3.0 or Higher A Grade 0.57 0.44 0.62 0.67
B Grade 0.39 0.28 0.45 0.50
C Grade 0.24 0.16 0.29 0.33
GPA Year 3 2.0 or Higher A Grade 0.94 0.89 0.94 0.96
B Grade 0.91 0.84 0.90 0.94
C Grade 0.87 0.76 0.85 0.90
3.0 or Higher A Grade 0.58 0.45 0.61 0.67
B Grade 0.39 0.27 0.42 0.48
C Grade 0.23 0.15 0.25 0.30
Return Fall, Any Inst. Year 2 A Grade 0.90 0.78 0.81 0.81
B Grade 0.88 0.74 0.78 0.78
C Grade 0.86 0.70 0.74 0.74
Year 3 A Grade 0.70 0.53 0.56 0.62
B Grade 0.65 0.48 0.51 0.57
C Grade 0.60 0.43 0.46 0.52
Progress to Degree Year 2 A Grade 0.79 0.28 0.39 0.43
B Grade 0.74 0.23 0.33 0.37
C Grade 0.69 0.19 0.28 0.31

100
ACT Research Report Does Taking Developmental Courses Improve the Success of Students Who First Enroll at Two-Year Colleges?
Outcome
Type LevelElementary
Algebra GradeFT and
Age ≤ 21PT and
Age ≤ 21 Age 22–25 Age > 25
Certificate within . . . 4 Years A Grade 0.26 0.15 0.19 0.18
B Grade 0.22 0.12 0.16 0.14
C Grade 0.18 0.10 0.12 0.11
5 Years A Grade 0.31 0.16 0.21 0.18
B Grade 0.28 0.13 0.18 0.15
C Grade 0.24 0.11 0.16 0.13
6 Years A Grade 0.31 0.17 0.22 0.21
B Grade 0.27 0.15 0.19 0.18
C Grade 0.24 0.13 0.17 0.16
Associate’s Degree within . . .
4 Years A Grade 0.41 0.18 0.24 0.29
B Grade 0.32 0.13 0.18 0.22
C Grade 0.25 0.10 0.13 0.16
5 Years A Grade 0.43 0.25 0.29 0.35
B Grade 0.36 0.19 0.23 0.29
C Grade 0.29 0.15 0.18 0.23
6 Years A Grade 0.43 0.25 0.32 0.37
B Grade 0.36 0.21 0.27 0.31
C Grade 0.30 0.16 0.22 0.26
Associate’s/Bachelor’s Degree within . . .
4 Years A Grade 0.43 0.19 0.25 0.30
B Grade 0.34 0.13 0.18 0.23
C Grade 0.26 0.10 0.13 0.17
5 Years A Grade 0.49 0.25 0.31 0.38
B Grade 0.40 0.19 0.24 0.30
C Grade 0.32 0.14 0.18 0.23
6 Years A Grade 0.49 0.27 0.34 0.40
B Grade 0.42 0.21 0.28 0.33
C Grade 0.34 0.17 0.22 0.27
Table F-3. (continued)

101
Table F-4. Probabilities of Success in College Algebra for Students Who Did and Did Not Take Intermediate Algebra, by Intermediate Algebra Grade, Enrollment Status, and Age
Outcome
Type LevelIntermediate
Algebra GradeFT and
Age ≤ 21PT and
Age ≤ 21 Age 22–25 Age > 25
Success in College Algebra
C or Higher A Grade 0.87 0.71 0.76 0.82
B Grade 0.75 0.54 0.60 0.69
C Grade 0.59 0.36 0.42 0.51
B or Higher A Grade 0.66 0.49 0.55 0.70
B Grade 0.43 0.28 0.33 0.48
C Grade 0.23 0.13 0.16 0.27
GPA Year 1 (or Last GPA) 2.0 or Higher A Grade 0.97 0.86 0.93 0.92
B Grade 0.94 0.78 0.88 0.87
C Grade 0.90 0.67 0.81 0.79
3.0 or Higher A Grade 0.72 0.51 0.65 0.66
B Grade 0.55 0.33 0.48 0.48
C Grade 0.37 0.19 0.30 0.31
GPA Year 2 2.0 or Higher A Grade 0.97 0.90 0.93 0.95
B Grade 0.94 0.83 0.89 0.92
C Grade 0.90 0.75 0.83 0.87
3.0 or Higher A Grade 0.71 0.47 0.65 0.68
B Grade 0.54 0.30 0.47 0.51
C Grade 0.36 0.17 0.30 0.33
GPA Year 3 2.0 or Higher A Grade 0.98 0.91 0.96 0.95
B Grade 0.97 0.87 0.94 0.92
C Grade 0.95 0.81 0.91 0.89
3.0 or Higher A Grade 0.68 0.47 0.66 0.72
B Grade 0.51 0.30 0.48 0.56
C Grade 0.33 0.17 0.31 0.38
Return Fall, Any Inst. Year 2 A Grade 0.91 0.77 0.80 0.79
B Grade 0.90 0.76 0.79 0.78
C Grade 0.90 0.76 0.78 0.77
Year 3 A Grade 0.77 0.57 0.59 0.56
B Grade 0.75 0.55 0.57 0.53
C Grade 0.73 0.52 0.54 0.50
Progress to Degree Year 2 A Grade 0.87 0.44 0.59 0.62
B Grade 0.85 0.39 0.54 0.57
C Grade 0.82 0.35 0.50 0.53

102
ACT Research Report Does Taking Developmental Courses Improve the Success of Students Who First Enroll at Two-Year Colleges?
Outcome
Type LevelIntermediate
Algebra GradeFT and
Age ≤ 21PT and
Age ≤ 21 Age 22–25 Age > 25
Certificate within . . . 4 Years A Grade 0.16 0.13 0.13 0.03
B Grade 0.12 0.10 0.10 0.02
C Grade 0.10 0.08 0.08 0.02
5 Years A Grade 0.20 0.15 0.22 0.05
B Grade 0.17 0.12 0.18 0.04
C Grade 0.14 0.10 0.15 0.03
6 Years A Grade 0.22 0.12 0.22 0.05
B Grade 0.19 0.10 0.18 0.04
C Grade 0.16 0.09 0.15 0.03
Associate’s Degree within . . .
4 Years A Grade 0.56 0.28 0.42 0.45
B Grade 0.49 0.22 0.35 0.38
C Grade 0.42 0.17 0.28 0.32
5 Years A Grade 0.60 0.32 0.47 0.47
B Grade 0.53 0.27 0.40 0.40
C Grade 0.46 0.21 0.33 0.33
6 Years A Grade 0.61 0.35 0.47 0.50
B Grade 0.54 0.30 0.41 0.44
C Grade 0.48 0.24 0.35 0.37
Associate’s/Bachelor’s Degree within . . .
4 Years A Grade 0.57 0.27 0.41 0.47
B Grade 0.50 0.22 0.34 0.40
C Grade 0.43 0.17 0.28 0.33
5 Years A Grade 0.63 0.34 0.48 0.52
B Grade 0.56 0.28 0.41 0.45
C Grade 0.49 0.22 0.34 0.38
6 Years A Grade 0.68 0.40 0.49 0.56
B Grade 0.61 0.33 0.42 0.49
C Grade 0.54 0.27 0.35 0.42
Table F-4. (continued)

103
Table F-5. Probabilities of Success in First Social Science Course for Students Who Did and Did Not Take Developmental Reading, by Developmental Reading Grade, Enrollment Status, and Age
Outcome
Type LevelDevelopmental Reading Grade
FT and Age ≤ 21
PT and Age ≤ 21 Age 22–25 Age > 25
Success in First Social Science Course
C or Higher A Grade 0.82a,b,c 0.66a 0.63b 0.69c
B Grade 0.73a,b,c 0.53a 0.54b 0.57c
C Grade 0.63a,b,c 0.41a 0.45b 0.44c
B or Higher A Grade 0.52a,b,c 0.40a 0.46b 0.48c
B Grade 0.39a,b,c 0.29a 0.32b 0.33c
C Grade 0.30a,b,c 0.19a 0.21b 0.20c
GPA Year 1 (or Last GPA) 2.0 or Higher A Grade 0.88a,b 0.78a 0.78b 0.87
B Grade 0.80a,b 0.66a 0.68b 0.74
C Grade 0.73a,b 0.51a 0.56b 0.56
3.0 or Higher A Grade 0.58b,c 0.42 0.47b 0.57c
B Grade 0.39b,c 0.27 0.30b 0.33c
C Grade 0.17b,c 0.16 0.17b 0.16c
GPA Year 2 2.0 or Higher A Grade 0.91a,b,c 0.83a 0.88b 0.90c
B Grade 0.85a,b,c 0.72a 0.81b 0.83c
C Grade 0.71a,b,c 0.57a 0.70b 0.74c
3.0 or Higher A Grade 0.49a,b,c 0.30a 0.44b 0.53c
B Grade 0.31a,b,c 0.17a 0.24b 0.31c
C Grade 0.22a,b,c 0.09a 0.12b 0.15c
GPA Year 3 2.0 or Higher A Grade 0.93a,b 0.85a 0.89b 0.91
B Grade 0.88a,b 0.75a 0.84b 0.86
C Grade 0.81a,b 0.62a 0.77b 0.79
3.0 or Higher A Grade 0.40a,b 0.32a 0.41b 0.55
B Grade 0.22a,b 0.16a 0.22b 0.28
C Grade 0.17a,b 0.08a 0.11b 0.11
Return Fall, Any Inst. Year 2 A Grade 0.91a,b 0.75a 0.75b 0.80
B Grade 0.87a,b 0.66a 0.64b 0.68
C Grade 0.84a,b 0.57a 0.51b 0.53
Year 3 A Grade 0.74a,b,c 0.49a 0.48b 0.57c
B Grade 0.64a,b,c 0.38a 0.38b 0.43c
C Grade 0.58a,b,c 0.28a 0.30b 0.29c
Progress to Degree Year 2 A Grade 0.75b 0.25 0.21b 0.28
B Grade 0.65b 0.16 0.14b 0.17
C Grade 0.66b 0.10 0.09b 0.10

104
ACT Research Report Does Taking Developmental Courses Improve the Success of Students Who First Enroll at Two-Year Colleges?
Outcome
Type LevelDevelopmental Reading Grade
FT and Age ≤ 21
PT and Age ≤ 21 Age 22–25 Age > 25
Certificate within . . . 4 Years A Grade 0.23a,b,c 0.13a 0.18b 0.14c
B Grade 0.19a,b,c 0.10a 0.14b 0.10c
C Grade 0.22a,b,c 0.08a 0.11b 0.08c
5 Years A Grade 0.24a,b,c 0.15a 0.22b 0.16c
B Grade 0.19a,b,c 0.12a 0.17b 0.12c
C Grade 0.25a,b,c 0.09a 0.13b 0.09c
6 Years A Grade 0.21a,b,c 0.16a 0.19b 0.20c
B Grade 0.17a,b,c 0.13a 0.15b 0.15c
C Grade 0.26a,b,c 0.10a 0.12b 0.11c
Associate’s Degree within . . .
4 Years A Grade 0.42b,c 0.18 0.11b 0.19c
B Grade 0.29b,c 0.10 0.08b 0.11c
C Grade 0.26b,c 0.05 0.06b 0.07c
5 Years A Grade 0.47b,c 0.24 0.17b 0.25c
B Grade 0.33b,c 0.14 0.13b 0.14c
C Grade 0.31b,c 0.08 0.11b 0.08c
6 Years A Grade 0.53a,b,c 0.27a 0.24b 0.30c
B Grade 0.38a,b,c 0.16a 0.18b 0.18c
C Grade 0.27a,b,c 0.09a 0.13b 0.10c
Associate’s/Bachelor’s Degree within . . .
4 Years A Grade 0.43b,c 0.18 0.11b 0.19c
B Grade 0.29b,c 0.10 0.08b 0.11c
C Grade 0.26b,c 0.05 0.06b 0.07c
5 Years A Grade 0.48b,c 0.25 0.17b 0.26c
B Grade 0.35b,c 0.15 0.14b 0.14c
C Grade 0.33b,c 0.08 0.11b 0.08c
6 Years A Grade 0.57a,b,c 0.28a 0.25b 0.33c
B Grade 0.41a,b,c 0.17a 0.19b 0.19c
C Grade 0.29a,b,c 0.10a 0.14b 0.10c
Table F-5. (continued)


*050209150* Rev 1
ACT is an independent, nonprofit organization that provides assessment, research,
information, and program management services in the broad areas of education
and workforce development. Each year, we serve millions of people in high
schools, colleges, professional associations, businesses, and government agencies,
nationally and internationally. Though designed to meet a wide array of needs, all
ACT programs and services have one guiding purpose—helping people achieve
education and workplace success.
For more information, visit www.act.org.