Anna M. Borghi° & Lucia Riggio* °Department of Psychology ...

1
This is the final pre-publication version of an article submitted to International Journal of Educational Research. Published details: Santiago Cueto, Juan León, Alejandra Miranda, Kirk Dearden, Benjamin T. Crookston and Jere R. Behrman (2016) 'Does Pre-school Improve Cognitive Abilities among Children with Early-life Stunting? A Longitudinal Study for Peru', International Journal of Educational Research 75: 102–114, doi:10.1016/j.ijer.2015.09.011
Does pre-school improve cognitive abilities among children with early-life stunting? A
longitudinal study for Peru
Santiago Cuetoa, Juan León
b, Alejandra Miranda
c, Kirk Dearden
d, Benjamin T. Crookston
e,
Jere R. Behrmanf
Abstract
Several studies in developing countries have found that children who experience growth
faltering in the first years of life show lower cognitive abilities than their peers. In this
study, we use the Young Lives longitudinal dataset in Peru to analyze if attending pre-
school affects cognitive abilities at age five years, and if there is an interaction with HAZ at
age one year. Using instrumental variables we found, for receptive vocabulary, a positive
effect of attending Jardines (formal) pre-schools; the effect of attending PRONOEI
(community-based) pre-schools was not significant. More years attending Jardines was
more beneficial for children who were better nourished. We suggest working to improve
the quality of PRONOEIs, and with teachers on targeting children of lower nutritional
status.
Highlights
An examination of cognitive abilities among a Peruvian child cohort with early-life
stunting
Attending formal pre-schools affects positively children´s receptive vocabulary
Attending community-based pre-schools does not affect children´s vocabulary
More years attending formal preschools benefits more better-nourished children
a Group for the Analysis of Development, Av. Grau 915, Barranco, Lima 4, Peru. Corresponding author.
[email protected]. Tel.: 511 247 9988; fax: 511 247 1854 E-mail [email protected] b
Group for the Analysis of Development, Av. Grau 915, Barranco, Lima 4, Peru. E-mail [email protected] c Group for the Analysis of Development, Av. Grau 915, Barranco, Lima 4, Peru. E-mail [email protected]
d Micronutrient Initiative, 801, Second Floor, B-28, Qutab Institutional Area, Tara Crescent. New Delhi – 110016, India. E-
mail [email protected]. e
The College of Life Sciences, Brigham Young University, 2137 LSB Provo UT 84602, United States. E-mail [email protected] f University of Pennsylvania, 3718 Locust Walk, Philadelphia, PA 19104, United States. E-mail

2
Keywords child development; pre-school; height-for-age; Peru
Acknowledgements
Young Lives is an international study of childhood poverty, following the lives of 12,000
children in 4 countries (Ethiopia, India, Peru and Vietnam) over 15 years
(www.younglives.org.uk).Young Lives is funded by UK aid from the Department for
International Development (DFID), and co-funded by the Netherlands Ministry of Foreign
Affairs from 2010 to 2014 and by Irish Aid from 2014 to 2015. Additional funds for this
study were provided by Bill & Melinda Gates Foundation (BMGF Global Health Grant
OPP1032713), Eunice Shriver Kennedy National Institute of Child Health and
Development (NICHD Grant R01 HD070993), and Grand Challenges Canada (GCC Grant
0072-03). The views expressed are those of the authors. They are not necessarily those of,
or endorsed by, Young Lives, the University of Oxford, DFID or other funders.
1. Introduction
Many empirical studies have shown negative associations between early growth faltering in
children, subsequent low height-for-age z-scores (HAZ) over time relative to the medians
for the WHO (2006) reference for well-nourished populations, and school achievement and
learning. For example, Grantham-McGregor et al. (2007) reviewed the literature in
developing countries and found that early stunting (HAZ<-2 SD from median) and poverty
in the first five years of life were associated with lower subsequent cognitive abilities,
school achievement, and productivity in adult life. Their estimates suggest that worldwide
200 million children under five years of age in developing countries are not fulfilling their
developmental potential. Theoretical models and empirical findings suggest that schooling
(or other formal educational programs) and nutrition may have independent but also
possibly interactive effects in promoting children’s development. For example, Pollitt
(1990 and 2002) reviewed empirical studies that showed that different health and nutrition
deficiencies have impacts on school achievement. Brown and Pollitt (1996) provided a
theoretical model on how undernutrition could affect intellectual development, including
schooling attainment as a mediating mechanism.
Starting interventions early would seem an important consideration, in order to avoid what
could be irreversible damage due to early-life growth faltering and other developmental
deficiencies. This would seem to point to the possible value of pre-school interventions.
Indeed, among educators and many policymakers, early childhood care and education have
become a priority, and were included as the first goal of Education for All [EFA]
(UNESCO, 2006). EFA reports show that pre-school enrolment rates are increasing in most
countries. Internationally, there is evidence of the positive effects of early childhood care
and education on later achievement (Ruhm & Waldfogel, 2011); however, the impacts of
programs vary, suggesting that there are issues of quality in how programs are conceived
and implemented (see Barnett, 1995, for the USA; Goodman & Sianesi, 2005, for the UK;
and Diaz, 2006, for Peru). Montie, Xiang, and Schweinhart (2006) examined the impact of

3
pre-school attendance on cognitive and verbal abilities by age seven years in a 10-country
study. Even though their study included only children enrolled in pre-school, they found
that abilities by four years of age predicted abilities three years later, thus emphasizing the
importance of early interventions. Schady et al. (2015) also report that differences in
cognitive skills by household wealth quartiles begin prior to 30-36 months of age and
persist into the early schooling years in five Latin American countries, including Peru.
Engle et al. (2011) estimate high benefit-cost ratios (6.4 to 17.6, depending on baseline
enrollment and discount rates) for reducing pre-school enrollment gaps by wealth quintiles
in 73 developing countries. In spite of the potential benefits pre-school may have on the
development of cognitive abilities of children in developing countries, to our knowledge
there are only a handful of studies that examine the benefits of pre-school on children who
experience early-life growth faltering. The present study explores if the type of pre-school
and the number of years attended is related to children’s skills by age five years, and also if
there is an interaction between HAZ at age one year and attending either type of pre-school
on children’s cognitive skills.
1.1. Stunting, development of cognitive abilities and schooling
Early-life stunting is widely considered a non-specific indicator of chronic undernutrition.
Though reductions in stunting prevalence are occurring globally, chronic undernutrition
continues to be a major public health issue, especially for developing countries. De Onis,
Blossner, and Borghi (2012) have estimated that worldwide, 171 million children are
stunted (data for 2010). Most stunted children live in developing countries, with
particularly high and stagnant rates in Africa and downward trends in Asia and Latin
America, though still relatively high in much of Asia and a few countries in Latin America.
Causes of early undernutrition are varied and depend upon manifestation. Infants and
young children who fail to thrive (i.e., whose weight, height, head circumference, and
psychosocial development are markedly below age-related norms) may fail because of
organic and non-organic reasons including illnesses and genetic conditions on the one hand
and inadequate parenting and environmental factors on the other (Iwaniec, 2004).
McDougal et al. (2009) found eating difficulties to be associated with early weight
faltering. However, Wright, Parkinson, and Drewett (2006) found that social and maternal
characteristics had little influence. With respect to wasting, Martorell and Young (2012)
found that high levels of undernutrition were associated with the poor status of women, the
“thin-fat“ infant phenotype, chronic dietary insufficiency, poor dietary quality, seasonality,
and poor levels of sanitation. Martorell and Young (2012) and Schott et al. (2013) have
identified a range of factors associated with stunting, including wealth, short stature of the
mother, being a thin mother, mother’s and father’s level of schooling, and early age at first
delivery. Victora et al. (2010) have found that growth faltering begins quickly after birth,
thus suggesting that interventions should start during pregnancy or before children reach
two years of age. In Peru, stunting prevalence has gone down (about 18% of children under
5 years of age are stunted; data for 2009; UNICEF, 2011). The prevalence of chronic
undernutrition in Peru places the country above the mean for Latin America and the
Caribbean, with reductions observed in most countries (UNICEF, 2006).

4
Several longitudinal studies provide ample evidence regarding the association between
early growth faltering and later cognitive abilities and school achievement. For example, in
Zimbabwe, Alderman, Hoddinott, and Kinsey (2006) found that undernutrition in early
childhood had an effect on the number of school grades completed by young adulthood. For
Guatemala, Behrman et al. (2014) found an impact of HAZ by age 72 months (plus or
minus six months) on adult reading and cognitive abilities. The literature review mentioned
above by Grantham-McGregor et al. (2007) also concludes that early stunting predicts later
cognitive ability and school achievement.
Some limited literature has focused on the potential role pre-school and primary school
attendance may have in helping children who experienced early-life growth faltering. For
example, Grantham-McGregor et al. (1994) found that for severely undernourished,
hospitalized, Jamaican children (initial ages six to 24 months), an intervention that started
at the hospital but continued at home (i.e., two visits per week for three years) had an effect
on cognitive development up to 14 years after treatment. This intervention included efforts
to help mothers increase their verbal interactions and improve their play with children.
Also, Walker et al. (2005) report on a study on nutrition and psychosocial stimulation of
Jamaican children. The psychosocial intervention consisted of visiting children at home
once a week for one hour for two years. The purpose of visits was to improve mother-child
interactions. The intervention occurred when children were nine to 24 months. While both
the nutrition and psychosocial interventions had positive impacts in the short term, only the
psychosocial intervention showed an impact on measures of cognitive development and
achievement when children were 17 to 18 years of age. In a longitudinal study in the
Philippines, Mendez and Adair (1999) found that stunting between zero and two years of
age predicted cognitive abilities when children were eight and 11 years old. More
importantly, they found that stunted children were more likely than non-stunted children to
enroll late in primary school, were absent more, and repeated more grades. In a longitudinal
study in Guatemala, Hoddinott et al. (2013), using instrumental variable techniques, found
that a one-SD increase in HAZ at age 24 months was associated with more schooling (0.78
grades) and higher test scores for reading and nonverbal cognitive skills (0.28 and 0.25
SDs, respectively), about 35 years later.
Recently there has been a discussion regarding height gain after the first year of life and
later cognitive development and achievement. For example, Gandhi et al. (2011) found that
for rural Malawian children, height gains between 18 and 60 months (controlling for length
at one and six months of age) predicted mathematics achievement and grade repetition by
the age of 12 years. Crookston et al. (2013) examined associations between recovery from
early stunting and cognitive abilities using longitudinal data from Ethiopia, India, Peru and
Vietnam. They used HAZ at one year and HAZ gains from ages one to eight years as
predictors of achievement and cognitive development by eight years of age. They found
that persistently stunted children had lower test scores, and those who were never stunted
had higher results. However, children who recovered from early stunting had higher scores
than those persistently stunted on several of the cognitive tests investigated across
countries. Therefore, good nutrition early in the child’s life seems important though there
appears to be potential to reverse at least some of the negative effects of early stunting.
These studies suggest a potential beneficial effect of recovery in HAZ, and while this does
not deny the importance of policies and programs aimed at pregnancy and the first two year

5
years of life, a better understanding of influences after the second year of life would be
beneficial in improving understanding of both nutrition and cognitive development as
children age beyond the first two years. While the interventions used in the two Jamaican
studies occurred at home starting at an early age, it is more common in developing
countries to implement large pre-school programs in the period immediately before primary
school (i.e., for children ages three to five), thus making the analysis of the impact of these
programs on children who experience growth faltering an important policy issue. In the
next section we turn briefly to describing pre-school programs in Peru.
1.2. Types of pre-school in Peru
Over the past few decades, early childhood education has become an important issue in
many developing countries, including Peru. For example, the General Education Law of
2003 states that pre-school education is mandatory for ages three to five. According to this
law, the main objectives of pre-school are to help children develop cognitive and socio-
emotional skills and encourage family involvement as part of the socialization process.
While there are a variety of early childhood education programs, including those that are
institutional and home-based (i.e., targeting parents) for children from birth to two years,
coverage for this age group is low. Here we describe programs for children ages three to
five years. For these ages, there are two types of pre-school: Programas no Escolarizados
de Educación Inicial (PRONOEI) and Jardines.
The PRONOEI are public programs created in the late 1960s in an effort to provide an
alternative for children who did not have access to pre-schools, especially in marginal
urban and rural areas. Up to the present, the program has focused on this population as its
main target. PRONOEI´s teachers are mothers from the community who receive training in
child development and teaching techniques from a certified teacher hired by the Ministry of
Education. The Ministry also provides materials, such as toys, but the community usually
provides the building where PRONOEI works. PRONOEI pre-schools are expected to meet
for four hours a day, usually four days a week (the remaining day is expected to be devoted
to training and preparation). According to statistics from the Ministry of Educationg in
2006, there were 259,314 children attending 18,610 PRONOEI pre-schools.
Jardines are set up in more populated areas and in buildings provided by the state or a
private provider. Teachers are usually certified, and they are expected to offer classes for
four or five hours a day, five days a weekh. In 2006, there were 829,526 children enrolled in
Jardines and the number of Jardines was 17,986i. Two studies suggest that after controlling
for several covariates, Jardines have a higher impact than PRONOEI on primary school
achievement (language and mathematics; Cueto & Díaz, 1999; Díaz, 2006).
2. Objectives
g Ministry of Education (2007). Plan Estratégico Institucional 2007-2011.
h The information about pre-schools in Peru is based on the Decreto Supremo N°013-2004-ED
i Numbers calculated using the datasets from the National School Census 2006 retrieved from
escale.minedu.gob.pe.

6
The present study seeks to explore if the type of pre-school (i.e., PRONOEI or Jardin) and
number of years attended is associated with children’s skills, in vocabulary and early
numeracy, by age five years. A second and equally important objective is to determine
whether there is an interaction between HAZ at age one year and attending either type of
pre-school from ages three to five years on the above-mentioned skills at age five years.
3. Methods
3.1. Data
We analyzed data from the Young Lives (YL) longitudinal study. This is an international
study that tracks the development of 12,000 children in four countries (Ethiopia, India,
Vietnam and Peru) since 2002. YL has information on two cohorts of children that were
born around 1994 (older cohort) and 2001 (younger cohort). The present study uses data
from the younger Peruvian cohort only (early-life nutritional status is not available for the
older cohort) and includes two rounds of household surveys gathered in Peru and
administered at home to children and their caretakers in 2002 and 2006.
3.2. Sample
The original sample was selected randomly from 20 sites across the country. However,
since the focus of the study is childhood poverty, the richest 5% of districts were excluded
from the sampling framework (Escobal & Flores, 2008) in order to oversample poor areas
in Peru. Originally, the younger cohort had 2052 children (Round 1) and 1963 in Round 2
(Cueto et al., 2011). From the sample of 1963 children, we only included the 72.5 percent
of the children who attended either a Jardin or a PRONOEI pre-school or no pre-school.
Mixed casesj (i.e. children who attended both in successive years) as well as children who
attended other types of childcare programs from ages three to five years were excluded
from the analysis.
Table 1
Sample size by round, panel and analytical sample
Round 1 Round 2 Panel Analytical Sample
(R1 & R2)
Girls 1,026 973 973 715
Boys 1,026 990 990 708
Total 2,052 1,963 1,963 1,423
3.3.Statistical model
j The total mixed cases were 67, distributed in three groups: one year in Jardin and one year in PRONOEI (21
cases), two years in Jardin and one year in PRONOEI (17 cases) and, two years in PRONOEI and one year in
Jardin (29 cases).

7
To address our research questions, we first considered OLS regression models. This model
permitted the estimation of the main effects of pre-school attendance and child nutritional
status on performance on tests of cognition by age 5, controlling for child and family
characteristics:
𝑌𝑖 = 𝛽0 + 𝛽1𝑆𝑖 + 𝛽2𝐽𝑎𝑟𝑑𝑖𝑛𝑖 + 𝛽3𝑃𝑅𝑂𝑁𝑂𝐸𝐼𝑖 + ∑ 𝛽𝑚𝑋𝑖
𝑝
𝑚=4
+ 𝜀𝑖
Where:
Yi : abilities by age five (PPVT or CDA, see below)
Si : nutritional status at age one (HAZ)
Jardini : number of years attended a Jardin pre-school
PRONOEIi : number of years attended a PRONOEI pre-school
Xi : individual and family variables
𝛽i : regression coefficients
𝜀𝑖 : error term
p : number of control variables included in the model
In this model, β2, and β3 are the main effects of attending a Jardin or PRONOEI pre-school
on cognitive abilities, respectively, and β1 is the main effect of nutritional status, holding
constant child and family characteristics (Xi).
However, one problem with using OLS regressions is the possible endogeneity of
nutritional status, number of years the child attended a Jardin and number of years the child
attended a PRONOEI. For example, there may be unobserved variables (e.g., parenting
skills) that affect positively early-life nutrition and pre-school enrollment as well as
cognitive skills at age five. In our model the unobserved variables for the cognitive skills
equation will be included in the error term and, given the assumptions specified in the
previous sentence, the error term will be positively correlated with the nutritional status and
pre-school variables in our model. As a result the estimated parameters are likely upward
biased, because they are including the effects of these unobserved variables in the
disturbances in addition to the observed nutrition and pre-school variables. Our literature
review indicates that the regression coefficients using OLS in models such as this one are
claimed to be biased in other contexts (Glewwe, Jacoby, & King, 2001; Alderman,
Hoogeven, & Rossi, 2009). To test the robustness of the OLS we used a Two Stage Least
Squares (2SLS) regression model or instrumental variables. To run this type of model it is
necessary to find a variable(s) called an instrument(s). Good instruments predict well the
endogenous variables (nutritional status, number of years the child attended a Jardin and
number of years the child attended a PRONOEI pre-school) in the model and have no direct
impact on the main dependent variable (cognitive abilities). Thus, the first step effectively
is to run OLS regression(s) where the outcome(s) is the right-side endogenous variable(s)
(nutritional status, number of years the child attended a Jardin and number of years the
child attended a PRONOEI pre-school) and the independent variable(s) include all
instrument(s), and estimate the predicted values for the outcome(s). The second step (and
second stage) is to run the original model but instead of using the endogenous variable(s),
use the predicted variable(s) estimated in the first step that are not correlated with the
8
second-stage disturbance term if the instrument(s) is (are) good in the sense defined above.
Finally, to test for possible interaction effects, given the potential high correlation of
interaction terms of our endogenous variables, we divided the analytic sample in two:
children at risk (HAZ below -1 SD) and normal (HAZ above or equal to -1 SD) and we run
the 2SLS model in both samples, in order to explore a possible shift in the slope for Jardin
or PRONOEI that indicates an interaction effect. We used -1 SD as cut-off score since from
this threshold a child is considered mildly malnourished while values above -1 indicate
well-nourished children (Peiris & Wijesinghe 2010).
3.4. Selection of instruments
For this study, we used three instruments, each motivated primarily by one of the three
endogenous variables, though all three enter into the first-stage relation for each of the
endogenous variables. For nutritional status, mother´s height was used given that different
studies with children under five years of age have found that maternal height is highly
correlated with child stunting. Studies in different contexts like Hernandez-Diaz et al.
(1999) in Mexico, Subramanian et al. (2009) in India, and Felisbino-Mendes et al. (2014) in
Brazil show that shorter mothers are more likely to have stunted children, and this
relationship remains after holding constant diverse environmental and socioeconomic
factors. We are aware of literature that describes associations between maternal height and
child cognitive abilities, but this relationship is often indirect. For years the child attended
a PRONOEI pre-school, we used the ratio between the number of these pre-schools and the
total number of all types of pre-schools in each district. We used this instrument given that
those districts with higher ratios are more likely to enroll children in a PRONOEI pre-
school, and this instrument should not be directly correlated with unobserved determinants
(i.e., parenting skills) of children´s cognitive abilities. Finally, the third instrument used for
years the child attended a Jardin was the proportion of household heads in the district that
had completed secondary education or more. Household heads with greater formal
schooling usually invest more in early child development by enrolling their children in
Jardines, given that they are more likely to identify the benefits of a pre-school that are
often regarded as higher quality, given the target families mentioned above.
3.5. Sampling selection bias
We restricted the sample to those children who attended a Jardin or PRONOEI and those
who did not attend pre-school. This could generate a selection bias in our sample. To
control for this, we included the Inverse Mills ratio in all regression models. To calculate
this estimator, we followed the two-step procedures recommended by Heckman (1979). In
the first step, with data from all respondents to the Panel sample of Young Lives (Rounds 1
and 2), we estimated a logistic regression model, where 1 means being part of the analytical
sample, as a function of child and family socio-demographic characteristicsk. Once this
model was estimated, we included the predicted probability of the logistic regression in all
models.
k We included child´s age, mother´s age, child´s sex, child´s mother tongue, HAZ, maternal schooling attainment, place of
residence, household wealth index, if child attended Jardin and if child attended PRONOEI.

9
3.6. Variablesl
3.6.1. Our dependent variables arem
:
Peabody Picture Vocabulary Test (PPVT), Spanish version is a test designed to measure
receptive vocabulary, where the task of the examiner is to show a set of four pictures and
ask the child to select the picture that best represents the word spoken by the examiner
(Dunn, Padilla, Lugo, & Dunn, 1986). The test is orally administered, un-timed and norm-
referenced. It has 125 items and can be used with persons from 2.5 years to 19 years of age.
We used the raw scores, since the standard scores are not adequate because the
normalization sample is from the 1980s and did not include Peru.
Child Development Assessment (CDA) is a test originally developed by the International
Evaluation Association to evaluate three dimensions of child development: early numeracy,
early vocabulary and socio-emotional skills. The YL study only used the subtest that
assesses early numeracy skills. This subtest requires children to pick an image from a
selection of three or four that best reflects the quantitative concept read by the examiner,
such as none, most, few, many, etc. This scale had 15 items; each correct answer was
scored 1 point and 0 if it was wrong. We used the raw score (sum of all correct answers) as
the dependent variable.
3.6.2. Our instrumentals variables:
Maternal height, measured in centimeters. This variable comes from the Young Lives
survey where the fieldworkers measured mother's height following international standards
for anthropometric measures.
Education of the household headn, is the proportion of household heads that had completed
at least secondary schooling in the district where the Young Lives child lived. This variable
comes from the National Census of 2007.
Ratio of PRONOEI pre-schools over total pre-schools, is the ratio between number of
PRONOEI pre-school and number of all type of pre-schools in the district. This variable
comes from the School Census administered by the Ministry of Education (data from
2006).
3.6.3. Our main right-side endogenous variables are:
Height-for-age z-score (HAZ), is commonly used to represent child nutritional status based
on the WHO (2006) growth reference curves. Given that HAZ in round 1 had a negative
correlation with the age at which data were collected (i.e. children were between six and 18
months in Round 1 of Young Lives), we used HAZ adjusted by age to obtain estimates for
12 monthso.
l All variables come from the Young Lives data set unless indicated otherwise. m For more information about the tests see Cueto, Leon, Guerrero, and Muñoz (2009) n Person within the dwelling identified by household members as the head of the family.
o For more information about the adjustment, see Crookston et al. (2013).

10
Years of pre-school attendance, this variable included pre-school attendance (yes/no),
intensity of pre-school (years attended) and school type (Jardin, PRONOEI). Our first
variable is Attended a Jardin which is an ordinal variable taking the value of 0 if a child did
not attend or 1 if the child attended one year, 2 if child attended a Jardin for two years, and
3 if the child attended a Jardin three years between 2004 and 2006 (in Peru, the school year
runs from March to December). We followed the same procedure for Attended a PRONOEI
pre-school. The reference group is children who did not attend pre-school between 2004
and 2006.
Finally, we used the following control variables: sex (female), age of the child in months,
mother tongue (indigenous), mother’s schooling (completed secondary or more), place of
residence (urban), mother´s age, and household wealth index in 2002 (composite score
made up of three indices: housing quality, housing services and durable assets).
4. Results
4.1. Sample characteristics
Table 2 shows the characteristics for our analytical sample by type of pre-school attended.
In terms of individual and family characteristics, children who attended Jardin pre-schools
have better HAZ scores, are a few months older, mainly Spanish speakers, have mothers
with more schooling, live mainly in urban areas, have higher socioeconomic status, and
higher PPVT and CDA test scores than their peers who attended a PRONOEI or did not
attend a pre-school. The only statistically significant difference between children who did
not attend pre-school and those who attended PRONOEI was that the latter were more
likely to be rural. Overall, children who did not attend pre-school or who attended a
PRONOEI tended to be poorer and indigenous, and showed lower test scores by age five
years.
Table 2
Child and family characteristics for YL children by type of pre-school attended
Did not
attend pre-
school
(n=308)
JARDIN
(n=922)
PRONOEI
(n=193)
Total
(n=1423)
HAZ adjusted by age one -1.70a -1.18
b -1.50
a -1.34
(1.25) (1.14) (1.10) (1.18)
Stunted by age one 0.41a 0.22
b 0.32
a 0.27
(0.49) (0.41) (0.47) (0.45)
Age in months 61.71a 64.05
b 62.05
a 63.27
(4.87) (5.36) (5.25) (5.35)
Female 0.54a 0.49
a 0.46
a 0.50

11
(0.50) (0.50) (0.50) (0.50)
Indigenous mother tongue 0.21a 0.09
b 0.21
a 0.13
(0.41) (0.29) (0.41) (0.34)
Mother has complete secondary 0.14a 0.44
b 0.18
a 0.34
(0.35) (0.50) (0.39) (0.47)
Urban 0.53a 0.78
b 0.37
c 0.67
(0.50) (0.42) (0.48) (0.47)
Wealth Index at age one 0.36a 0.50
b 0.34
a 0.44
(0.21) (0.22) (0.19) (0.23)
PPVT score by age five 18.68a 31.53
b 22.00
a 27.46
(13.35) (17.66) (15.03) (17.39)
CDA score by age five 7.66a 8.65
b 7.70
a 8.30
(1.92) (2.03) (2.17) (2.07) Note: Means with the same superscript (i.e., a, b or c) indicate no significant differences at 5% (Bonferroni
and Scheffe tests). Standard deviation reported in parenthesis.
Source: Young Lives Data, Rounds 2 and 3.
Own Elaboration.
4.2. Interactions between child nutritional status and pre-school attendance on
children´s abilities
Table 3 shows that across most groups, non-stunted children have higher CDA and PPVT
raw scores. However, the gap between non-stunted and stunted children is higher for those
who attended a Jardin.
Table 3
CDA and PPVT mean scores by nutritional status and pre-school attendance
CDA PPVT
Not-
stunted Stunted Difference
Not-
stunted Stunted Difference
Did not attend
pre-school
7.79 7.48 .31 21.13 15.09 6.04*
(183) (125) (183) (125)
Attended
PRONOEI
7.92 7.23 .69* 23.79 18.23 5.56*
(131) (62) (131) (62)
Attended
JARDIN
8.82 8.00 .82* 33.74 23.67 10.07*
(720) (202) (720) (202)
*Differences are statistically significant at 5% according to the t-test for independent samples.
Note: Number of children reported in parenthesis.
Source: Young Lives Study, Rounds 1 and 2.
Own Elaboration.
12
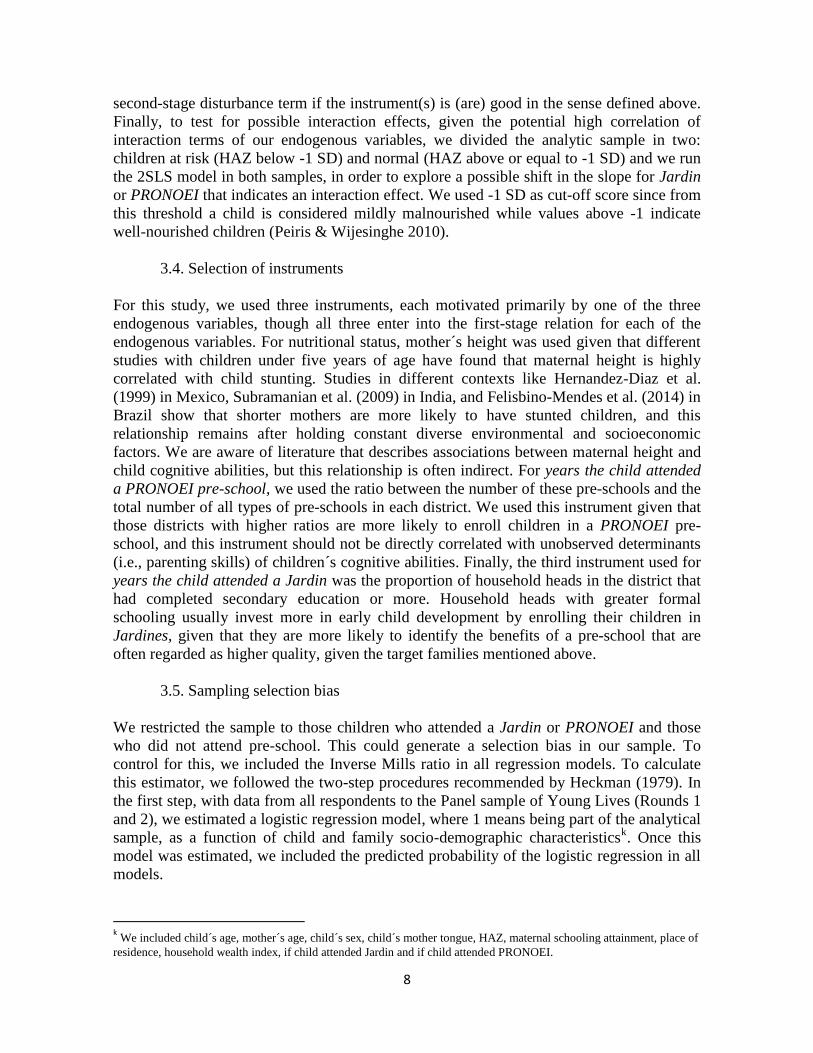
Table 4 shows that children who were not stunted at age one year in most cases had
statistically higher cognitive scores than those who were stunted, and this difference
increases with years of pre-school. Therefore, we use years attending pre-schools, Jardin or
PRONOEI, as the main independent variables in our analysis.
Table 4
CDA and PPVT mean scores by nutritional status and years of pre-school attendance
CDA PPVT
Not-
stunted Stunted Difference
Not-
stunted Stunted Difference
0 years 7.79 7.48 .31 21.13 15.09 6.04*
(183) (125) (183) (125)
1 year 8.39 7.82 .57* 28.44 21.45 6.99*
(349) (130) (349) (130)
2 years 8.74 7.62 1.12* 33.01 21.39 11.62*
(367) (105) (367) (105)
3 years 9.32 8.59 .73 39.74 30.24 9.50*
(135) (29) (135) (29)
*Differences are statistically significant at 5% according to the t test for independent samples.
Note: Number of children reported in parentheses.
Source: Young Lives Study, Rounds 1 and 2.
Own Elaboration.
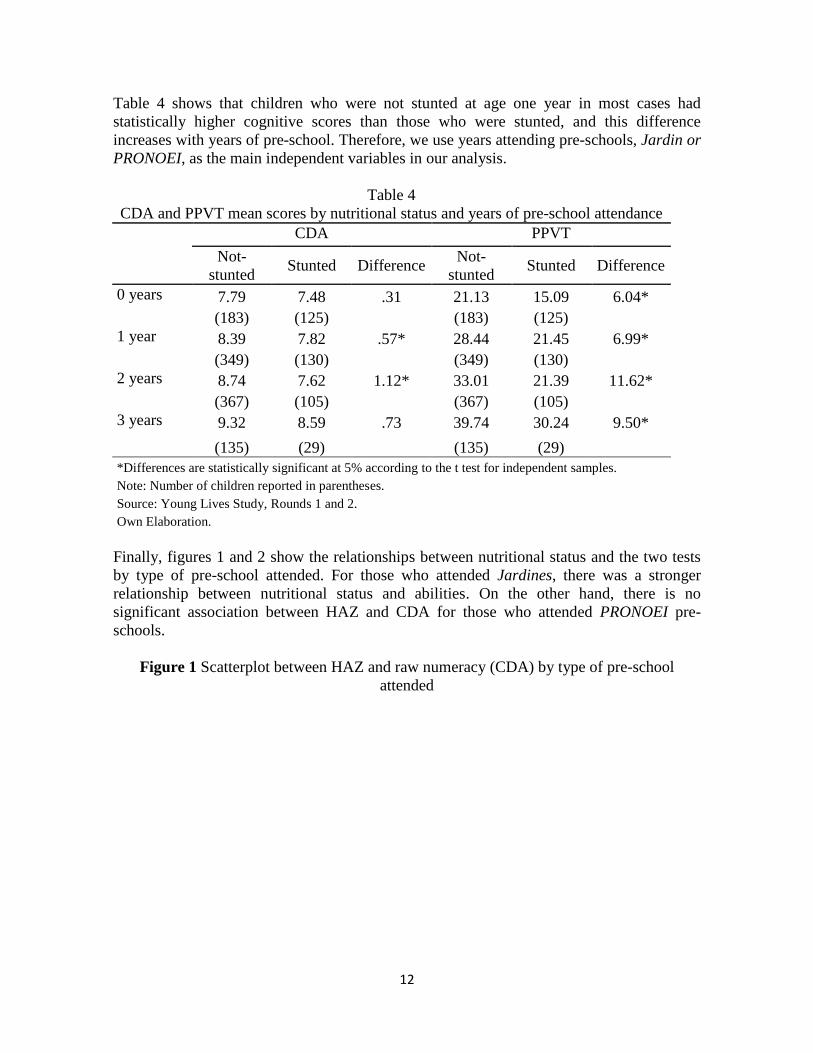
Finally, figures 1 and 2 show the relationships between nutritional status and the two tests
by type of pre-school attended. For those who attended Jardines, there was a stronger
relationship between nutritional status and abilities. On the other hand, there is no
significant association between HAZ and CDA for those who attended PRONOEI pre-
schools.
Figure 1 Scatterplot between HAZ and raw numeracy (CDA) by type of pre-school
attended

13
Source: Young Lives Study, Rounds 1 and 2
Own Elaboration.
Figure 2 Scatterplot between HAZ and PPVT by type of pre-school attended
Source: Young Lives Study, Rounds 1 and 2
Own Elaboration.
4.3.Effects of stunting and pre-school, and their interaction, on children´s abilities
24
68
10
12
CD
A r
aw
sco
re b
y age fiv
e
-6 -4 -2 0 2 4Height for age adjusted by age one
r=0.25 p=0.05
No preschool
24
68
10
12
CD
A r
aw
sco
re b
y age fiv
e
-6 -4 -2 0 2 4Height for age adjusted by age one
r=0.35 p=0.00
Jardin
24
68
10
12
CD
A r
aw
sco
re b
y age fiv
e
-6 -4 -2 0 2 4Height for age adjusted by age one
r=0.12 p=0.40
PRONOEI
020
40
60
80
PP
VT
raw
score
by a
ge fiv
e
-6 -4 -2 0 2 4Height for age adjusted by age one
r=0.31 p=0.01
No preschool
020
40
60
80
PP
VT
raw
score
by a
ge fiv
e
-6 -4 -2 0 2 4Height for age adjusted by age one
r=0.66 p=0.00
Jardin
020
40
60
80
PP
VT
raw
score
by a
ge fiv
e
-6 -4 -2 0 2 4Height for age adjusted by age one
r=0.31 p=0.03
PRONOEI

14
Table 5 shows correlations between nutritional status (HAZ adjusted scores) and the CDA
and PPVT scores, which are positive and significant. Mixed results were found for years of
pre-school attendance. For Jardin, we found a positive and statistically significant
relationship with CDA and PPVT scores, while the opposite relationship was found
between PRONOEI and abilities, although the correlations were low.
Table 5
Correlation among cognitive measures and main independent variables (N=1,423)
PPVT score CDA score
HAZ adjusted
to age one
CDA score .56 - -
(0.00)
HAZ adjusted to age one .32 .19 -
(0.00) (0.00)
Years attending a JARDIN .37 .25 .22
(0.00) (0.00) (0.00)
Years attending a PRONOEI -.11 -.10 -.06
(0.00) (0.00) (0.02)
Note: P-values in parenthesis
Source: Young Lives Study, Rounds 2 and 3
Own Elaboration.
In table 6, we present the main effects of HAZ and pre-school for the two dependent
variables using an OLS model where Model 1 (M1) does not include any control variables
and Model 2 does. For the CDA, HAZ and PRONOEI had significant main effects when no
controls are included, but they become non-significant once control variables are included.
For the PPVT, the main effects for the two types of pre-school and HAZ were significant
even after controlling for child and family characteristics (although the effect of PRONOEI
is marginal). Thus, from the OLS analysis, the main effect of Jardin seems to be stronger
than those of the other two variables.
Table 6
Effect of attending pre-school and nutritional status on cognitive abilities using OLS,
standardized coefficients (N=1,423)
CDA PPVT
M1 M2 M1 M2
Main effects
HAZ adjusted to age one 0.12 ** 0.03
0.22 ** 0.05 *
Years attended JARDIN 0.27 ** 0.08 *
0.42 ** 0.09 **
Years attended PRONOEI 0.05 * 0.00
0.15 ** 0.05 +
Control variables included No
Yes
No
Yes
R-squared 0.09
0.20
0.22
0.51
**p<0.01, *p<0.05, +p<0.10

15
Note: Standard errors are adjusted for possible covariance among children living in the same district.
Model 2 includes as control variables: child´s age, child´s mother tongue, child´s sex, maternal schooling
attainment, mother´s age, place of residence, and household wealth index. Standard errors were
calculated using bootstrapping with 100 replications.
However, as mentioned above, the OLS analysis does not solve endogeneity issues that are
likely to bias the results. Table 7 gives 2SLS estimates for comparisonp. The results show
that the main effect for HAZ was positive and statistically significant, while no significant
effect of years attending pre-school was found for the CDA. The results for the PPVT
indicate that the main effects for JARDIN and HAZ were positive and statistically
significant, while those for PRONOEI were not significant. Thus, at least for the effect of
Jardin and PRONOEI we found consistent results in the OLS and 2SLS for the PPVT.
These statistically significant results using HAZ in the 2SLS are consistent with many
studies summarized above.
Table 7
Effect of attending pre-school and nutritional status on cognitive abilities using 2SLS, standardized
coefficients (N=1,423)
CDA PPVT
M1 M2 M1 M2
Main effects
HAZ adjusted by age one 0.17 ** 0.19 **
0.36 ** 0.39 **
Years attended JARDIN 0.22 ** 0.06
0.30 ** 0.08 *
Years attended PRONOEI -0.07 ** -0.04
-0.04
0.01
Control variables included No
Yes
No
Yes
R-squared 0.13
0.18
0.35
0.44
**p<0.01, *p<0.05, +p<0.10
Note: Standard errors are adjusted for possible covariance among children living in the same district. All models include
as control variables: child´s age, child´s mother tongue, child´s sex, maternal education, mother´s age, place of
residence, and wealth index. Standard errors were calculated using bootstrapping with 100 replications.
Finally, to test the adequacy of the instruments, we used the Stock-Yogo test (2005), which
indicates the percent of bias in the OLS estimates. We rejected the null hypothesis that the
instrument is weak when the F-statistic of the first stage (OLS regression) is higher than the
critical value on tables for 10% of bias tolerance. Table 8 shows that for the three
instruments, the null hypothesis is rejected, which confirms the adequacy of the instruments
used for each endogenous variable in our models in Table 7.
Table 8
Adequacy of the instruments
Maternal
height
Education of the
household head
Ratio of
PRONOEI pre-
schools
F-statistic First step 52.10 52.59 34.68
p Results from the first stage are shown in the Appendix.

16
Stock-Yogo critical values α=5%
Bias 10%, 3 instruments 22.30 22.30 22.30
Bias 15%, 3 instruments 12.83 12.83 12.83
In order to explore our second objective, we run the 2SLS of Table 7 to simulate the PPVT
raw score in children at risk of being stunted (HAZ<-1 SD from mean) as well as not at risk
of being stunted (HAZ>=-1 SD). Figure 3 shows that attending JARDIN three years
increases vocabulary skills, compared to those who do not attend pre-school (zero years);
however, the effect is higher for those children above -1 SD in HAZ. In contrast, Figure 4
suggests that attending PRONOEI does not increase PPVT scores regardless of nutritional
status, which is aligned to the results of Table 7.
Figure 3 PPVT score by nutritional status and years attending JARDIN

17
Figure 4 PPVT score by nutritional status and years attending PRONOEI
5. Discussion
Mitigating cognitive deficits observed for children with early stunting is a matter of
considerable policy and academic interest. While it is known that early stunting is
negatively associated with later cognitive development and school achievement, and that
pre-school education might have a beneficial effect for all children, there are only a handful
of studies that explore the interaction between these two. In this study we focused on
whether or not pre-schools might have not only a main effect on cognitive abilities that
increases with number of years attended, but also if it helps reduce the gaps between
children with differing degrees of stunting at age one. Based on previous studies, we
explored if the quality of the pre-school, approximated here through a differentiation
between Jardines and PRONOEI, made a difference. There are two studies in Peru
suggesting that the Jardines could be of higher quality, a result that is confirmed with the
rigorous analysis performed here. Controlling for endogeneity is particularly important in
this case, as PRONOEI are focused on children who are poorer and more likely to live in
rural areas and be indigenous, while Jardines are set up in urban areas, where Spanish is
predominant and children and their families tend to have access to more resources.
Our dependent variables included a general measure of receptive vocabulary (PPVT) and a
measure of early numeracy skills (CDA). We performed OLS and 2SLS analysis, which
yielded similar results. However since the former does not control for endogeneity, while
the latter does (see Table 7), we concentrate on the 2SLS estimates. Holding constant
individual and family variables, the effect of attending Jardines on the PPVT was positive
(0.08 SD, p<.05), while the effect of attending PRONOEI was not significant for both

18
measures of cognitive skills, which is consistent with previous studies showing a positive
impact for Jardines (Cueto & Diaz, 1999; Diaz, 2006). We also found that HAZ had a
positive and significant effect on PPVT and CDA test scores. In regards to the interaction
between HAZ and attending pre-school for more years from three to five years of age, we
found that attending Jardines is more beneficial for better nourished children, thus
increasing the gap in the PPVT.
We note that we did not find the same results for the CDA and PPVT, which could be
because of the nature of each test used. As mentioned in a previous section, the CDA
evaluates raw numeracy abilities for children aged 3 to 5 years old and most of our sample
is aged 5 years old; therefore, the score variation is small (CV: 0.25) and the CDA scores
are negatively skew distributed (Cueto, Leon, Guerrero & Muñoz, 2009). While, the PPVT
evaluates receptive vocabulary from children aged 2 to 17 years old, therefore, it is possible
to capture the full range of children abilities and avoid possible ceiling effects.
While the positive effects of pre-school in general have been amply demonstrated by the
literature, consistent with some of our findings, our results also suggest that not all types of
pre-schools are equally effective, at least as measured by tests used in this study. It would
seem that there are minimum levels of quality and intensity in the provision of pre-school
education that are not being observed. However, one limitation of this study is that we
cannot provide information on how these preschools worked.
Additionally, our results suggest that preschools in general are not places where inequalities
linked with low height-for-age are overcome. In Jardines, children with higher HAZ had
better results; while in PRONOEI, HAZ made no difference. In Peru and elsewhere, it is
hoped that education will reduce inequalities but this seems to not be the case for the
preschools studied here, although we have no specific information on how children of
different nutritional status are treated by their teachers, peers and families.
In terms of policy, it would seem critical to increase the quality of PRONOEIs, especially
since they are designed for children of lower socioeconomic status. Second, for both
PRONOEI and Jardines, it would be good to work with teachers on how to target children
of lower nutritional status. Improving their skills however might require comprehensive
interventions (i.e. health, nutrition, and poverty reduction, plus work with their parents)
aimed at reducing inequalities in abilities from an early age. Perhaps one way to do this
would be to help teachers identify children who are likely to underperform (including those
with low HAZ), so that they provide special attention to them. As mentioned above, there
are studies suggesting that starting interventions early in life may have a large impact on
development, and particularly it would seem that targeting parents at home may result in
effects that are detectable many years later (e.g. Walker et al, 2005).
For the research agenda, this study includes an analysis of effects, but not of the differential
quality and intensity of Jardines and PRONOEIs. It is surprising how little research
conducted in developing countries addresses why some preschools are more effective than
others. Rigorous research in this area is critical to understanding how to increase the
educational opportunities of all children.

19
References
Alderman, H., Behrman, J.R., Grantham-McGregor, S., Lopez-Boo, F., & Urzua, S. (2014).
Economic perspectives on integrating early child stimulation with nutritional
interventions. Annals of the New York Academy of Sciences- Integrating Nutrition and
Early Childhood Development Interventions, 1308 (1), 129-38.
Alderman, H., Hoddinott, J., & Kinsey, B. (2006). Long term consequences of early
childhood malnutrition. Oxford Economic Papers, 58, 450-474.
Alderman, H., Hoogeveen, H., & Rossi, M. (2009) Pre-school nutrition and subsequent
schooling attainment: longitudinal evidence from Tanzania. Econ Dev Cult Change,
57, 239–60.
Barnett, W. S. (2008). Pre-school education and its lasting effects: research and policy
implications. Boulder and Tempe: Education and the Public Interest Center &
Education Policy Research Unit. Retrieved on April 19 from:
http://nieer.org/resources/research/Pre-schoolLastingEffects.pdf on
Beltran, A., & Seinfeld, J. (2012). La trampa educativa en el Peru. Fondo Editorial de la
Universidad del Pacifico, Lima, Peru.
Behrman, J.R., Hoddinott, J. F., Maluccio, J. A., Soler-Hampejsek, E., Behrman, E.L.,
Martorell, R., Ramirez-Zea, M., & Stein, A. D. (2014). What Determines Adult
Cognitive Skills? Influences of Pre-School, School and Post-School Experiences in
Guatemala. Latin American Economic Review. No. 826.
Brown, J., & Pollitt, E. (1996). Malnutrition, poverty and intellectual development.
Scientific American, 276 (2), 38-43.
Crookston, B. T., Schott, W., Cueto, S., Dearden, K. A., Engle P., Georgiadis, A., Lundeen,
E. A., Penny, M. E., Stein, A. D. , & Behrman, J. R. (2013). Postinfancy growth,
schooling, and cognitive achievement: Young Lives. American Journal of Clinical
Nutrition, 98, 1555–63.
Cueto, S. (2007). Las evaluaciones nacionales e internacionales de rendimiento
escolar en el Perú: balance y perspectivas. In Grupo de Análisis para el
Desarrollo (Editor). Investigación, Políticas y Desarrollo en el Perú. 405-455.
Lima: GRADE.
Cueto, S. & Díaz, J.J (1999). Impacto de la educación inicial en el rendimiento en primer
grado de primaria en escuelas públicas urbanas de Lima. Revista de Psicología de la
Pontificia Universidad Católica del Perú, XVII (1), 74-91.
Cueto, S., Escobal, J., Penny, M. & Ames, P. (2011). Tracking Disparities: Who Gets Left
behind? Initial Findings from Peru. Round 3 Survey Report. Young Lives.
Department of International Development, University of Oxford.

20
Cueto, S., Leon, J., Guerrero, G., & Munoz, I. (2009). Psychometric characteristics of
cognitive development and achievement instruments in Round 2 of Young Lives.
Young Lives Technical Note No. 15. University of Oxford.
De Onis, M., Blossner, M., & Borghi, E. (2012). Prevalence and trends of stunting among
pre-school children, 1990-2020. Public Health Nutrition, 15, 142-148.
Díaz, J. J. (2006). Pre-school Education and Schooling Outcomes in Peru, Retrieved from
http://www.ninosdelmilenio.org/wp-content/uploads/2012/10/Pre-school-Education-
and-Schooling-outcomes-in-Peru.pdf.
Dunn, L., Padilla, E., Lugo, D. & Dunn, L. (1986). Manual del Examinador para el Test de
Vocabulario en Imágenes Peabody (Peabody Picture Vocabulary Test) – Adaptación
Hispanoamericana (Hispanic-American Adaptation). Minnesota: AGS.
Engle, PL., Fernald, LCH., Alderman, H., Behrman, J., O'Gara, C., Yousafzai, A., Cabral
de Mello, M., Hidrobo, M., Ulkuer, N., Ertem, I., Iltus, S., & the Global Child
Development Steering Group. (2011). Strategies for reducing inequalities and
improving developmental outcomes for young children in low-income and middle-
income countries. Lancet 378(9799), 1339-53.
Escobal, J., & Flores, E. (2008). An Assessment of the Young Lives Sampling Approach in
Peru. Young Lives Technical Note No. 3. University of Oxford.
Felisbino-Mendes, M. S., Villamor, E., & Velasquez-Melendez, G. (2014) Association of
Maternal and Child Nutritional Status in Brazil: A Population Based Cross-Sectional
Study. PLoS ONE 9(1) e87486. doi:10.1371/journal.pone.0087486
Gandhi, M., Ashorn, P., Maleta, K., Teivaanmaki, T., Duan, X.,& Cheung, Y. B. (2011).
Height gain during early childhood is an important predictor of schooling and
mathematics ability outcomes. Acta Paediatrica, 100, 113-118.
Goodman, A., & Sianesi, B. (2005). Early education and children´s outcomes: How long to
the impacts last? Fiscal Studies, 26 (4), 1-25.
Grantham-McGregor, S., Cheung, Y. B., Cueto, S., Glewwe, P., Richter, L., Strupp, B. &
the International Child Development Steering Group (2007). Developmental potential
in the first 5 years for children in developing countries. Lancet, 369, 60-70.
Grantham-McGregor, S., Powell, C., Walker, S., Chang, S. & Fletcher, P. (1994). The
long-term follow-up of severly malnourished children who participated in an
intervention program. Child Development, 65, 428-439.
Heckman, J. J. (1979). Sample Selection Bias as a Specification Error. Econometrica,
47(1), 53-161.

21
Hernandez-Diaz, S., Peterson, K., Dixit, S., Hernandez-Prado, B., Parra, S., Barquera, S.,
Sepulveda, J., & Rivera, J. (1999) Association of maternal short stature with stunting
in Mexican children: common genes vs common environment. European Journal of
Clinical Nutrition, 53, 938–45.
Hoddinott, J., Behrman, J. R., Maluccio, J. A., Melgar, P., Quisumbing, A. R., Ramirez-
Zea, M., Stein, A. D., Yount, K. M., & Martorell, R. 2013. Adult Consequences of
Growth Failure in Early Childhood. The American Journal of Clinical Nutrition,
98(5), 1170-78.
Iwaniec, D. (2004). Children who fail to thrive: a practice guide. West Sussex, England:
John Wiley & Sons.
Mendez, M. A., & Adair, L. S. (1999). Severity and timing of stunting in the first two years
of life affect performance on cognitive tests in late childhood. The Journal of
Nutrition, 129, 1555-1562.
Martorell, R., Young, M.F. (2012). Patterns of stunting and wasting: potential explanatory
factors. Advances in Nutrition, 3, 227-233,
McDougall, P., Drewett, R. F., Hungin, A. P. S., & Wright, C. M. (2009). The detection of
early weight faltering at the 6–8-week check and its association with family factors,
feeding and behavioural development. Archives of Disease in Childhood, 94(7), 549-
552.
Ministry of Education (2007). Plan Estratégico Institucional 2007-2011. Retrieved on
April 21, 2014 from http://www.minedu.gob.pe/Publicaciones/PEIMED-05.XI.07.pdf
Monteblanco, E. (2007). Informe macro de los Programas de Complementación y Nutrición
Alimentaria. Contraloría General de la República.
Montie, J. E., Xiang, Z., & Schweinhart, L. J. (2006). Pre-school experience in 10
countries: Cognitive and Language Performance at age 7. Early Childhood Research
Quarterly, 21, 313-331.
Peiris T., Wijesinghe D. (2010) Nutritional Status of under 5 Year-Old Children and its
Relationship with Maternal Nutrition Knowledge in Weeraketiya DS division of Sri
Lanka. Tropical Agricultural Research; 21(4): 330-339.
Pollitt, E. (1990). Malnutrition and Infection in the Classroom. Paris: UNESCO.
Pollitt, E. (2002). Consecuencias de la Desnutrición en el Escolar Peruano. Lima: Fondo
Editorial de la PUCP.
Ruhm, C. & Waldfogel, J. (2011). Long-term effects of early childhood care and education.
IZA Discussion Paper No. 6149.

22
Schady, N., Behrman, J.R., Araujo, M.C., Azuero, R., Bernal, R., Bravo, D., Lopez-Boo,
F., Macours, K., Marshall, D., Paxson, C., & Vakis, R. (2015). Wealth gradients in
early childhood cognitive development in five Latin American countries. Journal of
Human Resources. forthcoming.
Schott, W.B., Crookston, B.T., Lundeen, E.A., Stein, A.D., Behrman, J.R. (2013). Periods
of child growth up to age 8 years in Ethiopia, India, Peru and Vietnam: key distal
household and community factors. Social Science and Medicine, 97, 278-287.
Stock, J. H., & M. Yogo. (2005). Testing for Weak Instruments in Linear IV Regression. In
Identification and Inference for Econometric Models: Essays in Honor of Thomas
Rothenberg, D. W. Andrews and J. H. Stock (Editors), 80–108. Cambridge
University Press.
Subramanian, S.V., Ackerson, L.K., Smith, G.D., & John, N.A. (2009). Association of
maternal height with child mortality, anthropometric failure, and anemia in India.
JAMA, 301(16), 1691–1701.
UNESCO (2006). Strong Foundations. Early Childhood Care and Education. Education for
All Global Monitoring Report 2007. Paris: UNESCO.
UNICEF (2006). Desafíos, Boletín de la Infancia y Adolescencia sobre el avance de los
objetivos de desarrollo del milenio, Número 2.
UNICEF (2011). Estado de la Niñez en el Perú. Lima: UNICEF.
Victora, C. G., de Onis, M., Hallal, P. C., Blossner, M., & Shrimpton, R. (2010).
Worldwide timing of growth faltering: revisiting implications for interventions.
Pediatrics, 125, e473-e480.
Walker, S. P., Chang, S. M., Powell, C. A., & Grantham-McGregor, S. M. (2005). Effects
of early childhood psychosocial stimulation and nutritional supplementation on
cognition and education in growth-stunted Jamaican children: prospective cohort
study. The Lancet, 366, 1804-1807.
WHO. (2006). WHO child growth standards: length/height-for-age, weight-for-age, weight-
for-length, weight-for-height, and body mass index-for-age: methods and
development. Geneva: World Helath Organization.
Wright, C.M., Parkinson, K.N., Drewett, R.F. (2006). The influence of maternal
socioeconomic and emotional factors on infant weight gain and weight faltering
(failure to thrive): data from a prospective birth cohort. Archives of Disease in
Childhood. 91, 312-317.

23
Appendix
Table A1. First stage results of HAZ
HAZ
Instruments
Maternal Height 0.06 **
Education of the household head 0.55
Ratio of PRONOEI pre-schools
over total pre-schools -0.24
Child and family characteristics
Female 0.21 **
Child´s age 0.01
Mother tongue -0.56 **
Maternal education 0.24 **
Mother´s age 0.00
Wealth Index 0.52 *
Place of residence (urban) 0.14 *
R-squared 0.26
**p<0.01, *p<0.05, +p<0.10
Table A2. First stage results of Attending Jardin
Attending
Jardin
Instruments
Education of the household head 1.23 *
Maternal Height 0.43 **
Ratio of PRONOEI pre-schools
over total pre-schools -1.08 *
Child and family characteristics
Female 0.21 *
Child´s age 0.07 **
Mother tongue -0.42
Maternal education 0.19 **
Mother´s age 0.06 **
Wealth Index 2.55 **
Place of residence (urban) 0.55 +
R-squared 0.15
**p<0.01, *p<0.05, +p<0.10

24
Table A3. First stage results of Attending PRONOEI
Attending
PRONOEI
Instruments
Ratio of PRONOEI pre-schools
over total pre-schools 2.45 **
Education of the household head 1.86 +
Maternal Height 0.00
Child and family characteristics
Female -0.01
Child´s age 0.04
Mother tongue -7.68 **
Maternal education 9.88 **
Mother´s age 0.57 **
Wealth Index -0.90
Place of residence (urban) -0.71 +
R-squared 0.69
**p<0.01, *p<0.05, +p<0.10