Regulation of Active Pharmaceutical Ingredients (API) - Sindusfarma

INDIAN INSTITUTE OF MANAGEMENT AHMEDABAD INDIA
Research and Publications
W.P. No. 2016-02-01 Page No. 1
Does Pharmaceutical Price Regulation Result in
Greater Access to Essential Medicines? Study of the impact of drug price control order on sales volume of drugs in India
Arvind Sahay
Saravana Jaikumar
W.P. No. 2016-02-01 January 2016
The main objective of the working paper series of the IIMA is to help faculty members, research staff and doctoral students to speedily share their research findings with professional colleagues
and test their research findings at the pre-publication stage. IIMA is committed to maintain academic freedom. The opinion(s), view(s) and conclusion(s) expressed in the working paper are
those of the authors and not that of IIMA.
INDIAN INSTITUTE OF MANAGEMENT AHMEDABAD-380 015
INDIA
IIMA INDIA Research and Publications
Page No. 2 W.P. No. 2016-02-01
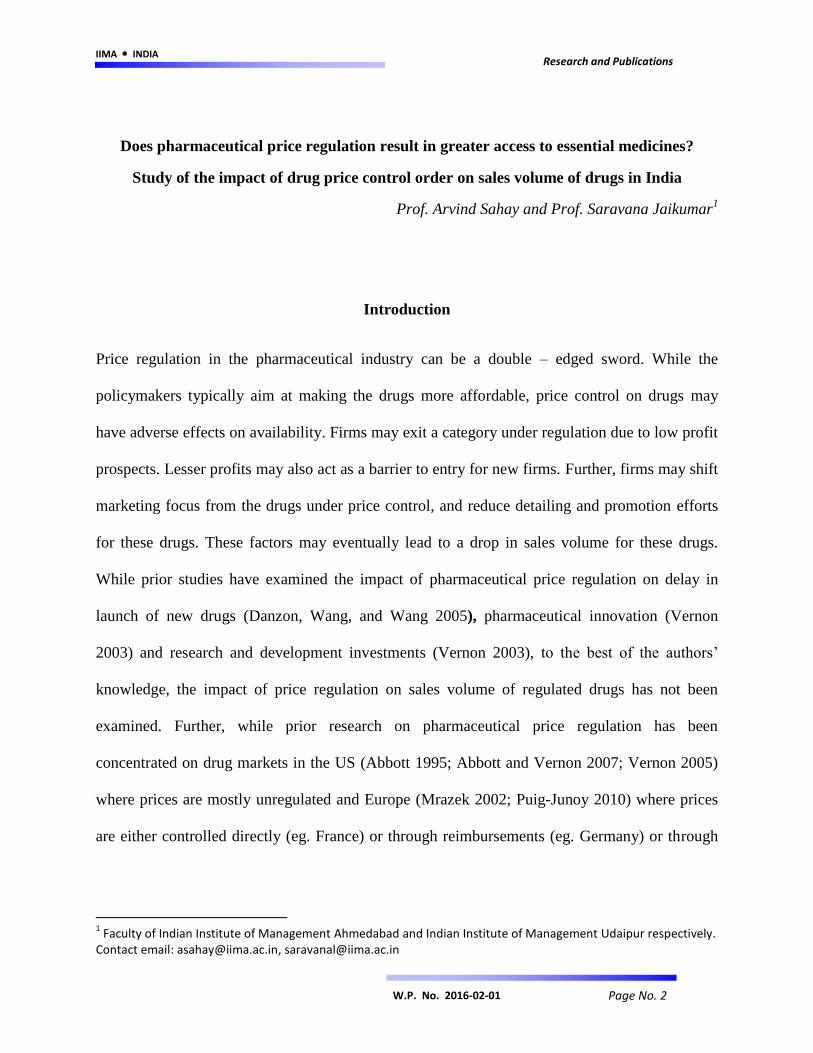
Does pharmaceutical price regulation result in greater access to essential medicines?
Study of the impact of drug price control order on sales volume of drugs in India
Prof. Arvind Sahay and Prof. Saravana Jaikumar1
Introduction
Price regulation in the pharmaceutical industry can be a double – edged sword. While the
policymakers typically aim at making the drugs more affordable, price control on drugs may
have adverse effects on availability. Firms may exit a category under regulation due to low profit
prospects. Lesser profits may also act as a barrier to entry for new firms. Further, firms may shift
marketing focus from the drugs under price control, and reduce detailing and promotion efforts
for these drugs. These factors may eventually lead to a drop in sales volume for these drugs.
While prior studies have examined the impact of pharmaceutical price regulation on delay in
launch of new drugs (Danzon, Wang, and Wang 2005), pharmaceutical innovation (Vernon
2003) and research and development investments (Vernon 2003), to the best of the authors‘
knowledge, the impact of price regulation on sales volume of regulated drugs has not been
examined. Further, while prior research on pharmaceutical price regulation has been
concentrated on drug markets in the US (Abbott 1995; Abbott and Vernon 2007; Vernon 2005)
where prices are mostly unregulated and Europe (Mrazek 2002; Puig-Junoy 2010) where prices
are either controlled directly (eg. France) or through reimbursements (eg. Germany) or through
1 Faculty of Indian Institute of Management Ahmedabad and Indian Institute of Management Udaipur respectively.
Contact email: [email protected], [email protected]
IIMA INDIA Research and Publications
Page No. 3 W.P. No. 2016-02-01
profit controls (eg. United Kingdom) (Vernon 2002), no significant work has been done on price
regulation in India, a ‗branded generics‘ market.
Economic theory would suggest no intervention in the generic drugs market (Puig-Junoy 2010).
However many governments continue to intervene through some form of price regulation in the
pharmaceuticals market. While in the US, the pharmaceutical industry is highly unregulated, in
Europe, the governments are actively involved in price regulation (Vernon 2002). The main
argument in countries that favor price regulation is that neither the doctor nor the patient takes
decisions based on the costs incurred (Green 1998). As these governments typically provide
some form of universal healthcare, the governments intervene in an attempt to reduce the
healthcare expenses incurred. As a result of strict price regulation, pharmaceutical companies in
the European Union attain lesser profits and stock returns, and invest lower R&D amounts
compared to their US counterparts (Golec and Vernon 2010). Further, Abbott and Vernon (2007)
and Vernon (2002) ran simulations and find that price regulation, if introduced in the US, is
likely to result in lowering of R&D investments similar to other countries.
Despite the theoretical attention on price regulation and few studies evaluating the impact on
pharmaceutical business and consequently, the welfare of the society (eg. Podnar, Molj, and
Golob 2007), there is a lack of strong empirical evidence linking price regulation and drug
availability. Examining the effect of price regulation on access and availability of drugs is of
utmost importance to both policy makers and managers in the pharmaceutical industry. This is
also particularly important in India because the ostensible reason for price regulation is to
increase affordability and accessibility in a country that is considered a privatized health
economy (Duggal 2007) with around 80% of healthcare expenses being borne privately, with
majority being out of pocket expenses (Banerji 2013). In this paper, using a unique dataset and

IIMA INDIA Research and Publications
Page No. 4 W.P. No. 2016-02-01
an event study approach, we report the impact of pharmaceutical price regulation on sales
volume of drugs in India.
In May 2013, the Department of Pharmaceuticals (DoP) of India brought 348 medicines under
price control by the Drug Price Control Order (DPCO). The list of 348 medicines was taken from
the National List of Essential Medicines (NLEM) which was compiled by the Ministry of Health
and Family Welfare in 2011. These formulations are considered essential and lifesaving drugs,
and address the priority health needs of the country. The objective of the DPCO 2013 was to
ensure availability of essential medicines at affordable prices for the poorer masses, while still
encouraging innovation and growth in the pharmaceutical industry (DPCO 2013). The order set a
price ceiling for these drugs by averaging the existing market prices (of all brands that have a
market share of 1% or greater). While the brands priced above the ceiling price were to reduce
the prices, the other brands had to maintain the prices at current levels. Further, the order
restrained the price increases (optional) to be in line with or below the wholesale price index in
any one year period.
Using drug sales data from IMS Health (India) and an event study approach, we empirically
assess whether price regulation results in more volume of the regulated drugs (105 oral solids)
being sold in India, an emerging economy. We further analyze the event study results of 46 oral
solids (which form about 90% of the 105 molecules in terms of sales value), by expressing the
volume change induced by regulation, as a function of the absolute price point post regulation,
extent of price reduction faced by the market, whether the molecule is prescribed for acute or
chronic illnesses, percentage prescriptions from CP/GP (Consultant Physicians / General
Practitioners), percentage sales from urban and semi urban (tier-1 and tier-2) cities, industry
level detailing efforts for the drug and an interaction between the last two terms. Our results
IIMA INDIA Research and Publications
Page No. 5 W.P. No. 2016-02-01
suggest that while some molecules had an increase in sales volume that can be attributed to
DPCO, overall the impact has been negative. Further, we find that the impact of increasing
detailing efforts on change in sales volume is moderated by the sales in urban and semi-urban
(tier 1 and tier 2) cities. We also find that the post regulation price level (relative expensiveness
of the molecule) and the type of molecule (acute vs. chronic illnesses) also have marginally
significant impact on the change in sales volume.
The rest of the paper is organized into four sections. First, we provide a brief overview of the
Indian Pharmaceutical Market (IPM) and explain how it differs from the US and European
Markets. We also briefly explain the details of the Drug Price Control Order 2013 and its
objectives. Second, we empirically examine the impact of DPCO on the 105 oral solid molecules
using a modified event study approach. Third, we analyze the results of the event study using
market level data and identify few factors contributing to the increase (decrease) in sales volume
of molecules. Finally, we discuss the policy and marketing implications of our findings.
Background
Indian Pharmaceutical Market
The Indian pharmaceutical industry in 2015 was a $22 billion industry and stands 3rd
in the world
in terms of sales volume of medicines and 13th
in terms of revenue. From humble beginnings in
1969, when 95% of medicines sold in India were sold by multinational pharma firms, Indian
firms, subsequent to the promulgation of the process patent act in 1969 had reverse engineered
many molecules (Bannerji 2009) and grown to become known as suppliers of inexpensive
medicines to the world. The Indian Pharmaceutical Market (IPM) shot to worldwide fame when

IIMA INDIA Research and Publications
Page No. 6 W.P. No. 2016-02-01
they supplied AIDs cocktail drugs to many countries around the world at a price that was 5-10%
of the price of the same therapy being supplied by large Western pharmaceuticals.
By the time, a WTO agreement to bring back product patents in India took effect in 2005, India
had become home to the largest number of US Food and Drug Administration approved plants in
the world; these plants, mostly owned by Indian entrepreneurs who had grown over time,
supplied medicines to India and to markets around the world. Cipla. Sun, Lupin, Wockhardt and
DRL were the five largest firms in India.
The Indian pharmaceutical market itself was a $10 billion market (most firms exported a
substantial proportion of their production to both regulated markets like the USA and to
unregulated markets in Africa). The IPM recorded a growth of 10% for the 12 month period
ending May 2013 over the same period in the previous year (Chemical Business 2013). The
growth slightly dropped to 9.3% in April 2014 and was attributed to the price control order
(Business Standard 2014).
Unlike developed markets, 95% of sales of medicines in India were of pharma molecules that
were off patent (known as generic drugs). Both unbranded generic molecules (amoxycillin,
paracetamol, etc.) and branded generic drugs (e.g., Augmentin - a branded amoxycillin) were
sold in India. While the scale of the market in revenue terms was relatively small compared to
developed markets, (for example, Augmentin, a branded generic antibiotic had annual sales of
INR 2 billion (USD 28 million) in 2014, the volumes were substantial as the prices in India were
a lot lower as compared to developed markets.
India is considered a privatized health economy (Duggal 2007) and around 80% of healthcare
expenses are borne privately, with majority being out of pocket expenses (Banerji 2013); in this,
IIMA INDIA Research and Publications
Page No. 7 W.P. No. 2016-02-01
India is quite different from the USA where insurance pays for more than 90% of health related
expenditure and the UK, where a National Health Service covers majority of costs incurred. As
per capita income in India was also low ($1800 in 2014), and neither universal healthcare nor
universal insurance were available, affordable access to medicines was considered a key policy
goal of the Indian government. Thus, cheaper generic alternatives to expensive medicines were
widely available in India which in turn, reduced the likelihood of high priced therapies launching
successfully (Subramanian, Mutyal, and Nechamkin 2014). Given the low per capita income and
the lack of universal health care provision and the privatized health care access, the Drug Price
Control order came into existence to fulfill a key policy goal of the Indian government - to
provide increased access to medicines to people at an affordable price.
DPCO and Aftermath
The Department of Pharmaceuticals, under a revision of the earlier order, released the Drug Price
Control Order in May 2013, regulating the prices of 348 drugs (borrowed from the National List
of Essential Medicines) in the Indian market. The order‘s primary objective was to ensure that
the essential and lifesaving medicines are readily available and are at affordable prices. Further,
the order authorized the National Pharmaceutical Pricing Authority (NPPA) of India to regulate
the medicine prices of NLEM and monitor price increases of medicines which are not part of
NLEM (non-NLEM) (Subramanian, Mutyal, and Nechamkin 2014).
The price ceilings for NLEM are set using ‗market-based‘ mechanisms. For most drugs, the price
ceiling is the simple average of the prices of all brands in the market with market share of at least
1%. While the brands priced higher than this average are to reduce the prices at or below the
ceiling price, those priced below were to maintain their current price levels. Further, if there is

IIMA INDIA Research and Publications
Page No. 8 W.P. No. 2016-02-01
only one drug in a particular category, then the price is based on a fixed percentage derived from
price reductions in similar categories. While price increases of NLEM were restricted to be in
line with or below the wholesale price index of India, the non-NLEM were allowed a maximum
price increase of 10% in any one year period. The price ceiling set by the DPCO refers to the
price to the retailer. The retailer margin is then fixed at 16% for NLEM. While firms were
allowed to exit from a given category with a six months‘ notice, the NPPA reserved the right to
mandate continued production of up to 12 months (DPCO 2013).
As noted earlier, the impact of DPCO on social welfare, in terms of increased access, availability
and affordability of the essential medicines have not been examined in detail. While few
independent agency reports have attempted to address this issue (eg. IMS Consulting Group
2015), a number of methodological flaws and confounds make the findings inconclusive. An
independent study by Wan (2013) reveals that the molecules under price regulation account for
about 60% of the pharmaceutical market in India and the DPCO was expected to erode the value
of the IPM by about $290 million annually (2.2% drop of the entire market). Launches of new
drugs have also declined from 270 drugs in 2008 to 56 in 2014 (FRPT-Research 2015). Another
independent study by IMS Health comparing the sales growth of few NLEM and non-NLEM
molecules post the DPCO reveals that the growth rate of NLEM molecules (select few) were
lesser than that of their non-NLEM counterparts (IMS Consulting Group 2015). The report
further suggests that the DPCO has not resulted in increased access of essential medicines to
rural areas. The study used CAGR (cumulative annualized growth rate) of NLEM and non-
NLEM molecules (select few) as an indicative measure of access and availability. Comparison of
the CAGR for NLEM and non-NLEM molecules across different town classes reveals that post
DPCO, the CAGR of non-NLEM grew by 7% in rural areas whereas the CAGR of NLEM
IIMA INDIA Research and Publications
Page No. 9 W.P. No. 2016-02-01
declined by 7%. The report concludes that the DPCO was ineffective in reaching rural areas
(IMS Consulting Group 2015, p.15). However, using non-NLEM as a base of comparison might
lead to confounding results. Specifically, the increase in sales volume of non-NLEM molecules
may be attributed to the increased marketing efforts by pharmaceutical companies to increase
their share of the price unregulated segment. Further, the pharmaceutical firms may have also
reduced the marketing efforts of the regulated drugs in an attempt to cut costs. We use a robust
methodology to isolate the impact of DPCO on sales volume of molecules. Further, we use the
entire family of oral solids brought under DPCO in May 2013. In the next section, we explain the
empirical strategy followed in the study.
Empirical Analysis of the Impact of DPCO 2013
Overview
We use a novel event study approach to examine the impact of DPCO 2013 on sales volume of
drugs. Event studies are commonly used in finance (MacKinlay 1997) and marketing (eg.
Jaikumar and Sahay 2015) to estimate the impact of an event on stock returns. In this study, we
adapt the event study to fit the objectives of the research. The event study used in this paper
consists of three stages: estimating a SARIMA function (with or without drift) using historic
sales volume (number of pills) data, creating a baseline using the forecast function for the period
immediately following the event (termed the event window) and comparing the actual sales
volume with the baseline to isolate the impact of the event. Specifically, we estimate the
residuals of the forecast function (termed as ‗abnormal change‘) for the period following the
event and test for direction and statistical significance. While majority of the event studies focus
on stock returns recorded in the financial markets (eg. Jaikumar and Sahay 2015), to the best of
IIMA INDIA Research and Publications
Page No. 10 W.P. No. 2016-02-01
the authors‘ knowledge, this is the first study to use event study mechanics on forecasts based on
seasonal ARIMA.
Timeline
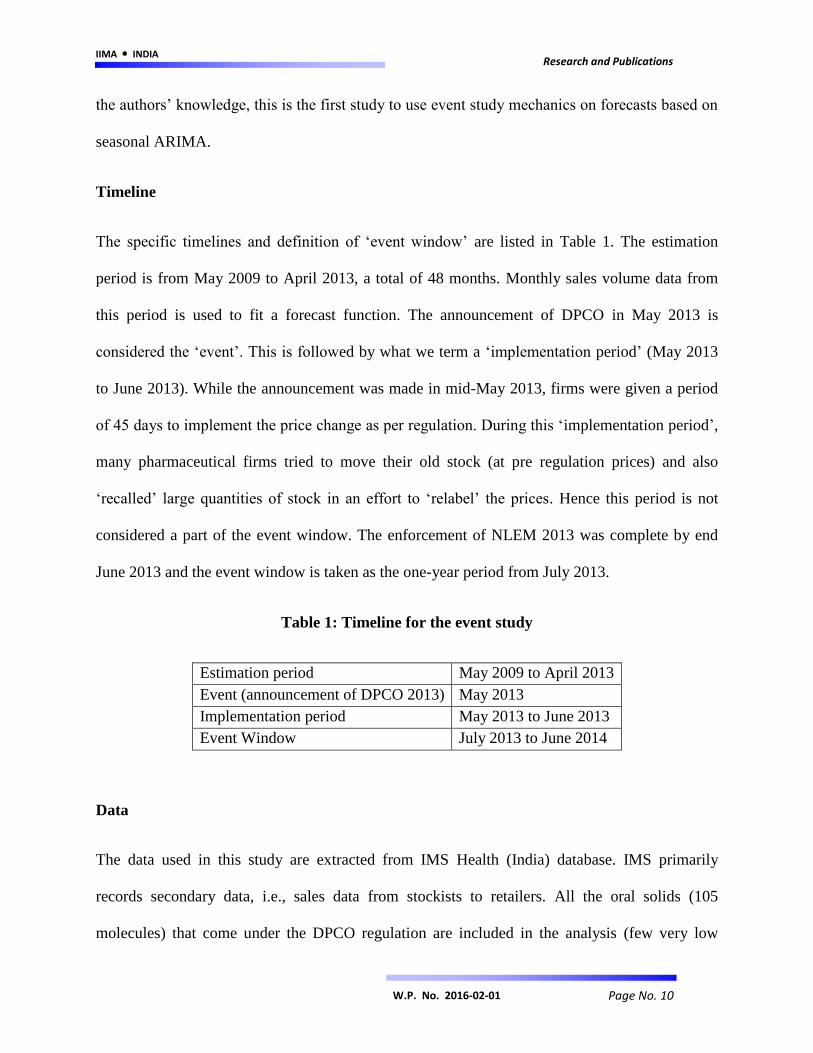
The specific timelines and definition of ‗event window‘ are listed in Table 1. The estimation
period is from May 2009 to April 2013, a total of 48 months. Monthly sales volume data from
this period is used to fit a forecast function. The announcement of DPCO in May 2013 is
considered the ‗event‘. This is followed by what we term a ‗implementation period‘ (May 2013
to June 2013). While the announcement was made in mid-May 2013, firms were given a period
of 45 days to implement the price change as per regulation. During this ‗implementation period‘,
many pharmaceutical firms tried to move their old stock (at pre regulation prices) and also
‗recalled‘ large quantities of stock in an effort to ‗relabel‘ the prices. Hence this period is not
considered a part of the event window. The enforcement of NLEM 2013 was complete by end
June 2013 and the event window is taken as the one-year period from July 2013.
Table 1: Timeline for the event study
Estimation period May 2009 to April 2013
Event (announcement of DPCO 2013) May 2013
Implementation period May 2013 to June 2013
Event Window July 2013 to June 2014
Data
The data used in this study are extracted from IMS Health (India) database. IMS primarily
records secondary data, i.e., sales data from stockists to retailers. All the oral solids (105
molecules) that come under the DPCO regulation are included in the analysis (few very low
IIMA INDIA Research and Publications
Page No. 11 W.P. No. 2016-02-01
volume oral solids that are under NLEM 2013 are not covered by IMS due to insignificant data).
As each molecule has multiple SKUs (stock keeping units) depending on pack size and strength,
we take sales volumes of the largest selling SKU for each molecule as representative of that
molecule. We extracted monthly MAT (Moving Annual Total) sales volume (number of pills)
for all these SKUs from May 2009 to July 2014. As noted earlier in Table 1, data from May 2009
to April 2013 is used for estimation while the data from July 2013 to June 2014 is used to
estimate the ‗abnormal change‘ (residuals) due to the event.
Event Study Methodology
Stage 1: Estimate the Forecast Function
We apply the ‗forecast‘ methodology proposed by Hyndman and Khandakar (2008) using R
statistical software to estimate the forecast function using historic sales data. The forecast
package has been used in a number of research papers to fit forecast functions (eg. Ahrens,
Kovandzic, and Vieraitis 2015; Hassani et al. 2015). The forecast package finds the best fitting
seasonal ARIMA model using the algorithm developed by Hyndman and Khandakar (2008).
Specifically the package identifies an ARIMA (p, d, q) (P, D, Q) [m] model where p and q refer
to the autoregressive and moving average models respectively, d refers to the degree of
differencing, P, D and Q refer to the autoregressive, differencing and moving average terms of
the seasonal component of the model and m refers to the length of seasonality (eg. 12 months in
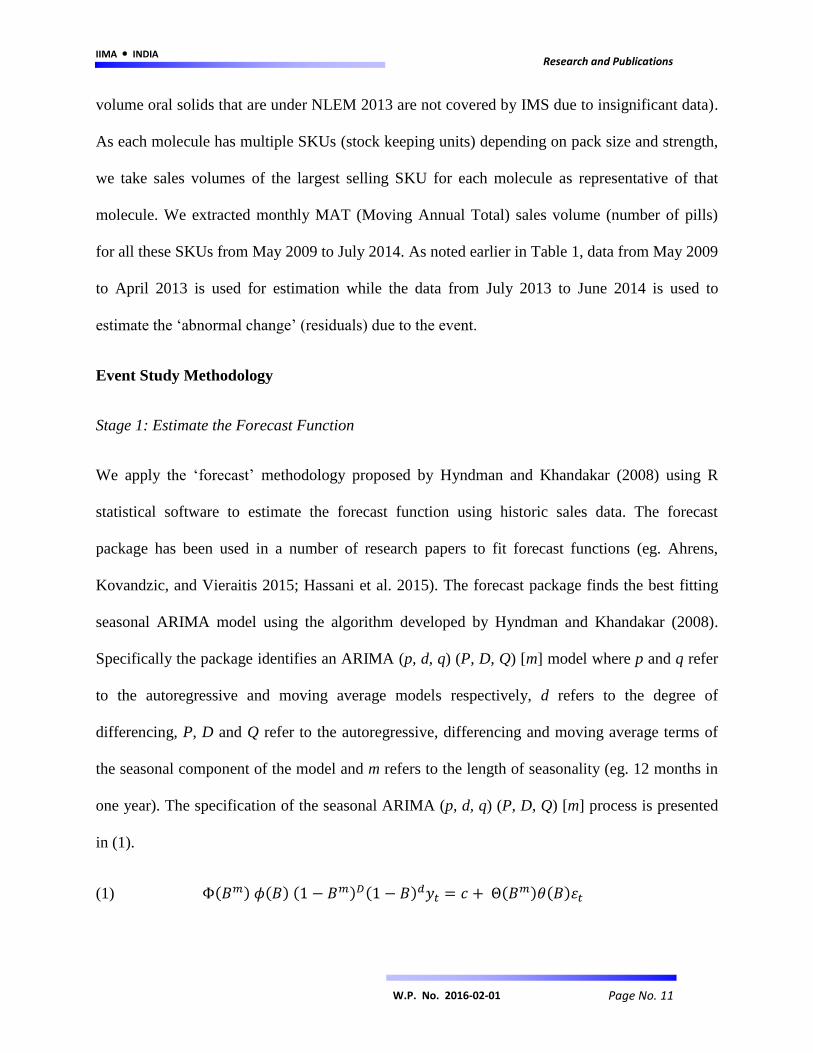
one year). The specification of the seasonal ARIMA (p, d, q) (P, D, Q) [m] process is presented
in (1).
(1) ( ) ( ) ( ) ( ) ( ) ( )
IIMA INDIA Research and Publications
Page No. 12 W.P. No. 2016-02-01
where ( ) and ( ) are polynomials of orders P and Q respectively (both contain no roots in
the unit circle), ( ) and ( ) are polynomials of order p and q respectively (both have no roots
for |z| <1), c is the drift term and if c ≠ 0, then it implies a polynomial of order d + D in (1). B
refers to the backshift operator, denotes the white noise process and refers to the time
indexed variable of interest. The objective of the forecast package is to identify the appropriate p,
d, q, P, D and Q. An overview of the steps followed (Hyndman and Khandakar 2008) to fit the
seasonal ARIMA model is explained below:
1. The value of D is first chosen based on Canova-Hansen test. This test checks whether
seasonal pattern changes significantly over time to warrant a seasonal unit root.
2. The value of d is chosen by using a successive KPSS (Kwiatkowski et al. 1992) unit root
rests. The test is applied on seasonally differenced data if D ≠ 0 and on original data if D
= 0.
3. If d + D < 2, then the drift term c is included in the model.
4. A step-wise algorithm is then used to evaluate different models (for detailed steps of the
algorithm refer Hyndman and Khandakar 2008, p.11).
5. The values of p, q, P and Q are chosen by minimizing the AIC (Akaike Information
Criteria).
The forecast function specified in (1) was estimated for each of the 105 molecules using 48
months of sales volume data. Seasonal ARIMA models were successfully identified for all the
105 molecules using the steps specified above (details of all the models presented in Appendix
A).

IIMA INDIA Research and Publications
Page No. 13 W.P. No. 2016-02-01
Stage 2: Predict Sales Using the Forecast Function
The models identified for the 105 molecules are then used to forecast sales from July 2013 to
June 2014. We use the ‗forecast‘ function part of the ‗forecasts‘ package in R to estimate point
forecasts and confidence intervals around the forecasts (at 80% and 95% level of significance).
The confidence interval (upper and lower limits at 95% significance) is then used to compute the
standard error of the point forecasts. All the monthly point forecasts for each of the 105
molecules were tested for statistical significance. We eliminated 7 molecules from further
analysis as the point forecasts did not reach statistical significance (p>.05).2 The results of the
forecast stage are presented in Appendix A.
Stage 3: Cumulative Abnormal Change - Compare Actual and Predicted Sales
The forecasts of sales volume for the period July 2013 to June 2014 indicate the sales volume
that would have been attained in the case of non-event (i.e., DPCO not being enacted). Hence the
difference between the actual sales volume and the forecasted volume may be attributed to the
event, DPCO 2013. We compute the difference for each of the 98 molecules for the 12 month
period. The differences over the 12 month period is then added for each molecule to arrive at
‗cumulative abnormal change‘ (CAC) for that molecule. This value denotes the impact of DPCO
on that molecule‘s sales volume in the 1 year period.
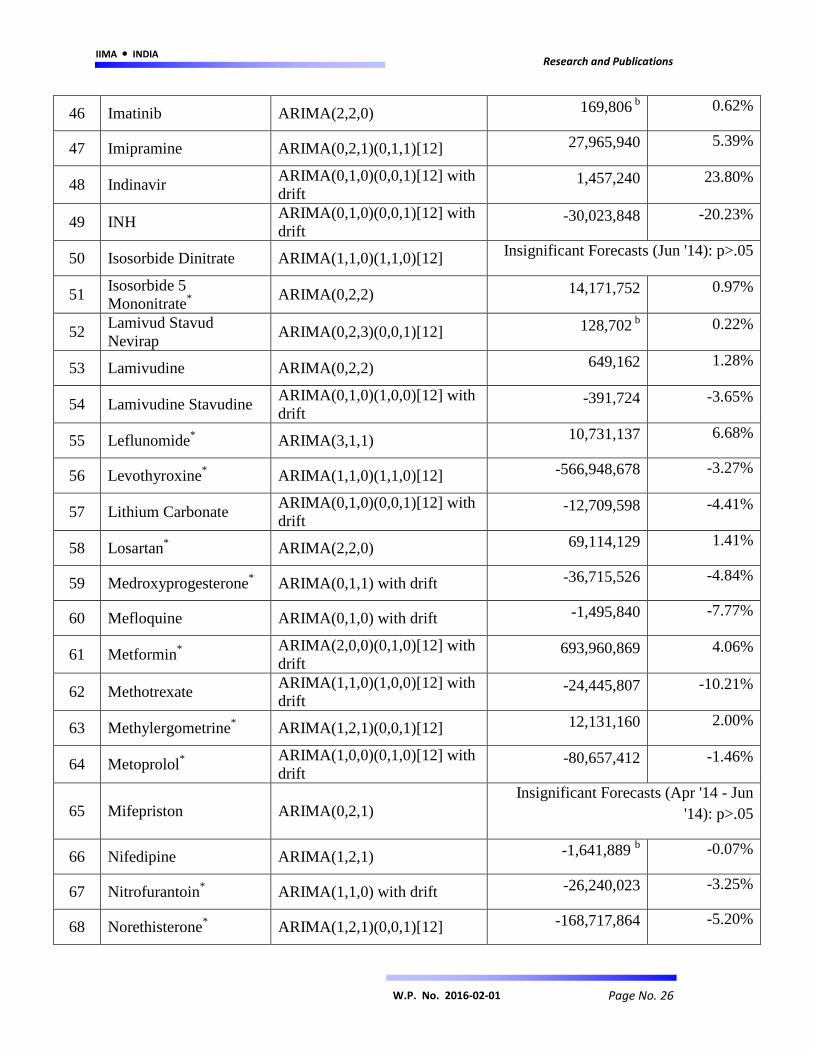
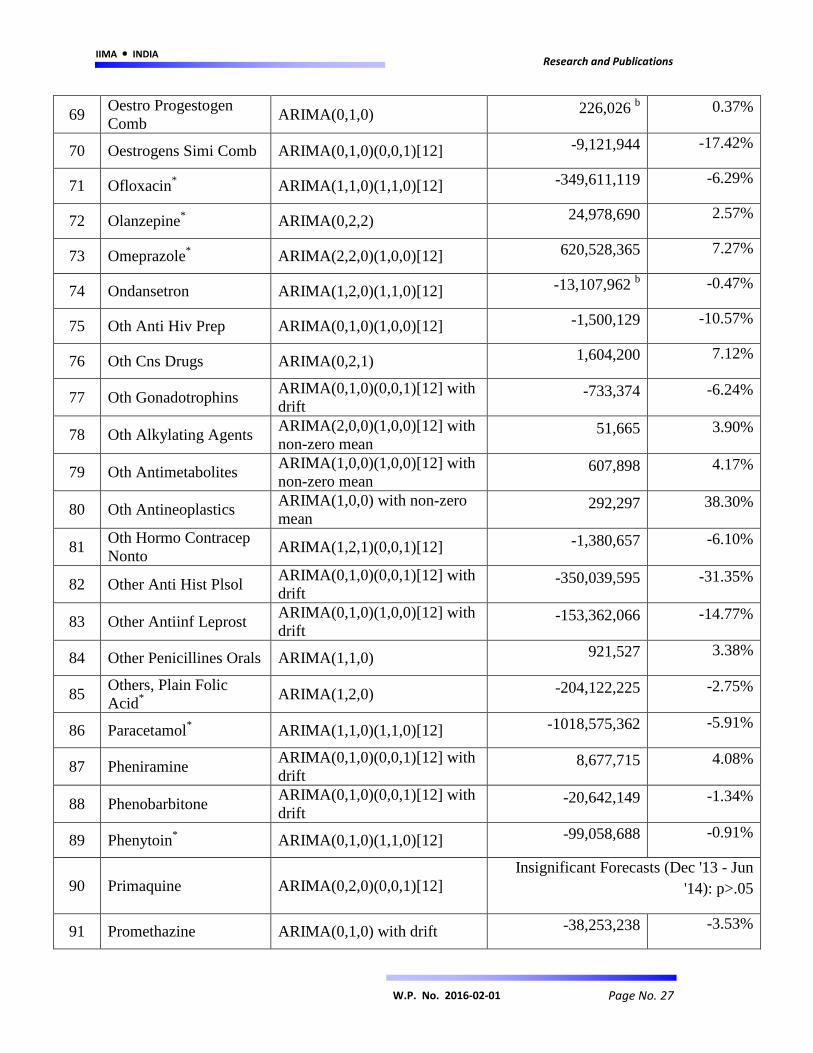
The cumulative abnormal change for the 98 molecules is presented in Appendix A. The CAC
values of 89 molecules are found to be statistically significant (p < .0001). Statistical significance
was tested based on standard event study procedures (refer Brown and Warner 1985; Corrado
and Zivney 1992). A positive value indicates an increase in the sales volume due to DPCO and
2 A molecule was included for further analysis if and only if, all the 12 monthly point forecasts for that molecule
were statistically significant (p<.05).

IIMA INDIA Research and Publications
Page No. 14 W.P. No. 2016-02-01
vice versa. For instance, the sales volume of Acetazolamide decreased by 33,653,525 units over
the 12 month event window. The values range from -1,018,575,362 units for Paracetamol to
693,960,869 units for Metformin. Overall, the mean of the CACs is found to be -33,931,992
units, i.e., overall, there is an average decrease in the number of units sold that can be attributed
to DPCO. A summary of the results is presented in Table 2.
Table 2: Results of event study: Effect of DPCO on sales volume of molecules
Overall statistics
Mean CAC (Δ sales volume)a -33,931,992
Median CAC -3,936,971
Minimum CAC (Paracetamol) -1,018,575,362
Maximum CAC (Metformin) 693,960,869
Molecules with increase in sales volume
No. of Molecules 37
Mean Increaseb 70,215,165
Molecules with decrease in sales volume
No. of Molecules 52
Mean Decreasec -108,036,700
- a,b,c: significant at p<.0001
- CAC: Cumulative abnormal change due to DPCO (over 12 months)
Factors Affecting Change in Sales Volume
While the event study results clearly suggest a negative effect of DPCO on social welfare (in
terms of sales of essential medicines), the analysis does not shed light on the drivers for the
observed results. We use the results of the event study (CACs) of 46 of the molecules
(highlighted in Appendix A) and explain them using few market factors. These 46 molecules
form about 90% of the total value of the 105 molecules (in terms of sales value as of June 2014).
The CAC is converted into percentage change in sales volume (relative to total sales volume

IIMA INDIA Research and Publications
Page No. 15 W.P. No. 2016-02-01
recorded in the 12 month period). The percentage change in sales volume due to DPCO is then
expressed as a function of:
i) absolute price point as per DPCO 2013
ii) price reduction faced by the market - weighted average price cut of top 5 brands per molecule
with their market shares as weights,
iii) whether the molecule is prescribed for acute or chronic illnesses (dummy variable),
iv) percentage prescription from CP/GPs,
v) percentage sales from urban and semi-urban cities,
vi) a proxy for the overall detailing efforts for a molecule3, and
vii) an interaction term between sales from urban and semi-urban cities, and detailing efforts.
Specifically, we estimate the coefficients of Equation (2).
(2)
( )
where the subscript i refers to the molecule, %CAC refers to the percentage change in sales
volume due to DPCO, Pri refers to the price of the molecule as per DPCO 2013, PriRed refers to
the price reduction experienced by the market, Acu is the dummy variable indicating whether the
3 To obtain a proxy for the detailing efforts, two industry experts were consulted. The industry experts ranked the
top 5 brands of each molecule based on the estimated position (page number) in the detailing booklet carried by the
firm‘s medical representatives (post DPCO 2013). For instance, if the medical representatives of a company carry a
booklet in which brand x usually appears in the first 4 pages, then it is an indication that the firm gives high priority
to that brand. Hence the detailing efforts for brand x is marked as high. Similarly, if the brand appears in the fifth to
eighth pages of the detailing booklet, the detailing effort is marked as moderate and the rest are considered to have
low detailing efforts. A detailing effort index was built by estimating weighted average of the scores (high, moderate
or low efforts, with the brand‘s market share as weights) for the top 5 brands of each of the 48 molecules. The
measure is an indication of the overall relative marketing effort for a molecule.
IIMA INDIA Research and Publications
Page No. 16 W.P. No. 2016-02-01
molecule i is prescribed for acute illnesses, CPRx refers to the percentage of prescriptions from
CP/GPs, T1T2 refers to the percentage of sales from urban (tier-1) and semi-urban (tier-2) cities,
Det refers to the relative detailing efforts for the molecule post DPCO and T1T2xDet refers to the
interaction between the last two terms.
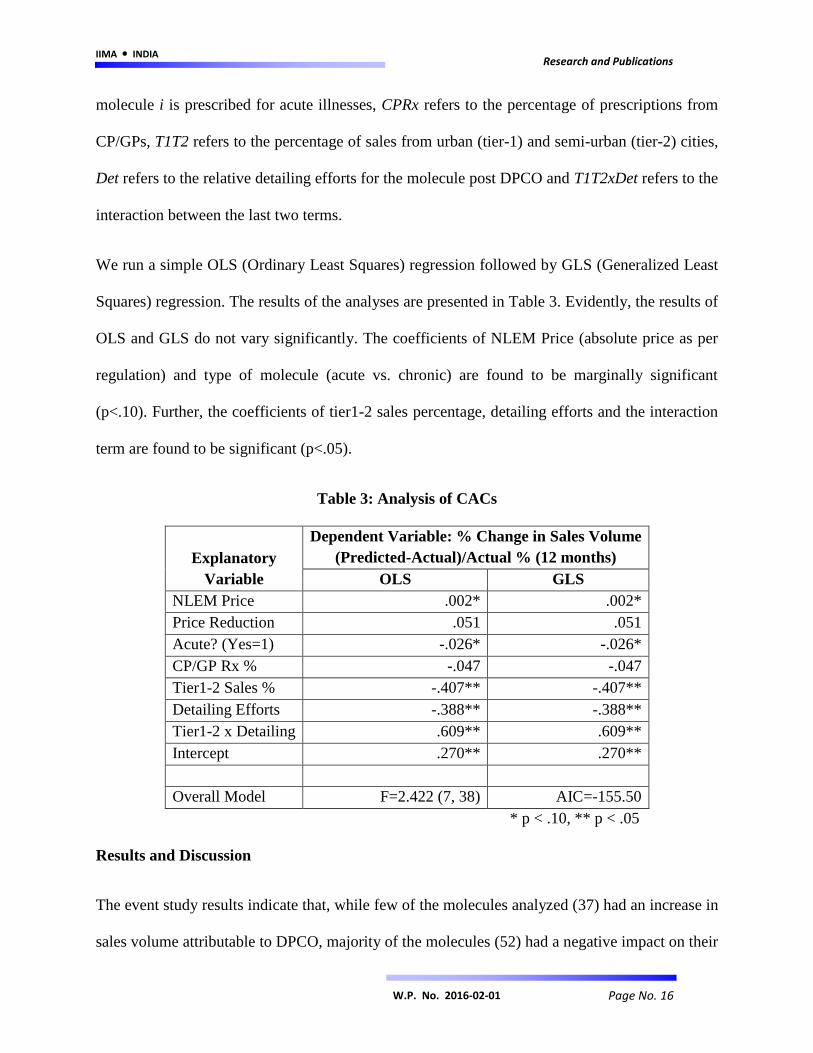
We run a simple OLS (Ordinary Least Squares) regression followed by GLS (Generalized Least
Squares) regression. The results of the analyses are presented in Table 3. Evidently, the results of
OLS and GLS do not vary significantly. The coefficients of NLEM Price (absolute price as per
regulation) and type of molecule (acute vs. chronic) are found to be marginally significant
(p<.10). Further, the coefficients of tier1-2 sales percentage, detailing efforts and the interaction
term are found to be significant (p<.05).
Table 3: Analysis of CACs
Explanatory
Variable
Dependent Variable: % Change in Sales Volume
(Predicted-Actual)/Actual % (12 months)
OLS GLS
NLEM Price .002* .002*
Price Reduction .051 .051
Acute? (Yes=1) -.026* -.026*
CP/GP Rx % -.047 -.047
Tier1-2 Sales % -.407** -.407**
Detailing Efforts -.388** -.388**
Tier1-2 x Detailing .609** .609**
Intercept .270** .270**
Overall Model F=2.422 (7, 38) AIC=-155.50
* p < .10, ** p < .05
Results and Discussion
The event study results indicate that, while few of the molecules analyzed (37) had an increase in
sales volume attributable to DPCO, majority of the molecules (52) had a negative impact on their

IIMA INDIA Research and Publications
Page No. 17 W.P. No. 2016-02-01
sales volume due to DPCO. Overall, the DPCO may have had a negative impact in terms of sales
volume of oral solid molecules, with the average change in sales volume to be -33,931,992 units
(p<.0001). The total actual and projected sales post DPCO is represented graphically in Figure 1.
As illustrated in the figure, the projected sales is consistently higher than the actual sales post
DPCO, indicating that the decline may be attributed to the price regulation order. Evidently, the
DPCO has not been completely effective in terms of increasing access and affordability of
essential medicines.
Figure 1: Actual Sales vs. Forecasts – 81 Molecules under DPCO
Further, we shortlisted 46 of the molecules and expressed the percentage change in sales volume
induced by DPCO as a function of factors including the regulation price, extent of price
reduction, type of molecule (acute vs chronic illnesses), percentage prescriptions from CP/GPs,
percentage sales from tier-1 and tier-2 cities and detailing efforts for the molecule. We found the
1.84E+10
1.85E+10
1.86E+10
1.87E+10
1.88E+10
1.89E+10
1.9E+10
1.91E+10
1.92E+10
1.93E+10
1.94E+10
Jul-12 Oct-12 Jan-13 May-13 Aug-13 Nov-13 Mar-14 Jun-14 Sep-14
Sa
les
Vo
lum
e
Actual vs. Projected Sales Volume
Actual Sales Forecast Sales

IIMA INDIA Research and Publications
Page No. 18 W.P. No. 2016-02-01
impact of regulation price and type of molecule (acute vs. chronic) to be marginally significant.
Evidently, more expensive the molecule, higher the increase in sales volume due to DPCO.
Further, molecules prescribed for chronic illnesses seem to benefit from DPCO. The results
suggest the post DPCO, patients under chronic care are likely to have made the switch to
regulated molecules whereas doctors either continued to prescribe non-NLEM molecules for
acute illnesses or switched to non-NLEM molecules post DPCO. Our results further shed light
on focusing the detailing efforts to increase the sales volume post DPCO. Specifically, increasing
detailing efforts for molecules with a higher presence in the tier 1 – 2 cities may result in a
positive effect due to DPCO. Interaction term between town class sales and detailing is based on
the assumption that detailing efforts are proportional to sales volume in cities. As the interaction
term is significant, we present the impact of increasing the detailing efforts at different tier1-2
sales % levels in Figure 2 (minimum and maximum tier1-2 sales % chosen from the data).
Evidently, in the case of molecules that are above the median level (62%) of percentage sales in
tier 1-2 cities, increasing the detailing efforts in these cities for regulated molecules results in an
increase in the cumulative abnormal change. However for molecules with a relatively higher
presence in the tier 3-4 cities, it may be beneficial to increase the detailing efforts in these cities.
In other words, detailing efforts should be increased in the cities in which the molecule already
has a higher presence, in order to elicit a positive change in sales volume attributable to DPCO.

IIMA INDIA Research and Publications
Page No. 19 W.P. No. 2016-02-01
Figure 2: Effect of Increasing Detailing Efforts on Sales Volume Change due to DPCO
* - increasing detailing efforts from low to moderate / moderate to high
General Discussion
Our findings have the following policy implications. Since price control is actually decreasing
access to the list of drugs that the government considers as essential, it may be time for the
government to re-examine the design and operation of price control in India. The mechanism by
which the policy appears to be failing is that price control leads to a decrease in the marketing
effort by pharmaceutical firms, especially as a reaction to the decrease in the price and
profitability of molecules; this would suggest that, assuming that price control is the way to
increase access, that the price control mechanism being set up by the government needs to be
tweaked. It is worthwhile to note here the drug prices in India are already amongst the lowest in
the world and that profit margins for Indian pharmaceutical firms are much lower than that of big
pharma firms of the west. Another implication is that GoI may want to consider whether there
are other ways of increasing access to drugs for patients in India than through price control.
-0.15
-0.1
-0.05
0
0.05
0.1
0.15
48% 53% 58% 63% 68% 73% 78% 83%
Imp
act
on
Sal
es
Vo
lum
e C
han
ge
Tier 1 - 2 Sales %
Increase in Detailing Efforts*

IIMA INDIA Research and Publications
Page No. 20 W.P. No. 2016-02-01
Indeed, whether there are some positive incentive mechanisms that can be developed to increase
access.
Our research also has the following marketing implications. As expected different town classes
react differently to price changes. As a corollary, therefore, it seems reasonable to state that sales
in the Indian pharma market in urban areas appears to be significantly a function of the
marketing effort and less a function of other variables and that the marketing effort elasticity of
price is high. Indeed, some firms are known to have exited from some product categories after
the price controls came into effect. .
The study has a few limitations. First, this study only examines the impact of DPCO on oral
solids and does not consider injectables and oral solutions that are under price control. Second,
the Department of Health introduced few minor changes (eg., new molecules being added to the
list) during the event window (July 2013 to June 2014). These changes are not taken into account
in the analysis. Third, our focus is on the short term (12 months) impact of DPCO. Further
research may analyze the long term impact of DPCO and examine whether price regulation
results in an increase in sales volume. Finally, we proxy marketing effort using the position of
the molecule in the detailing booklet of the firm / division. Further research may assess the
changes in marketing expenses for the molecules brought under price regulation. Future research
may assess the impact of price regulation at the brand level. Brand level dynamics might be
completely different and may provide richer insights for marketers. Further, the nature of the
marketing action by the pharma firms and the doctor‘s perception of price changes of the
medicines remains to be explored. Our study used a proxy for the marketing effort and did not
take into account any changes in the doctor‘s perception that is changing the prescription
behavior.
IIMA INDIA Research and Publications
Page No. 21 W.P. No. 2016-02-01
References
Danzon, Patricia M., Wang, Richard Y., & Wang, Liang (2005), The Impact Of Price Regulation
On The Launch Delay Of New Drugs—Evidence From Twenty‐Five Major Markets In The
1990s, Health Economics, 14(3), 269-292.
Vernon, John A. (2003), Simulating The Impact Of Price Regulation On Pharmaceutical
Innovation, Pharmaceutical Development and Regulation, 1(1), 55-65.
Vernon, John A. (2005), Examining The Link Between Price Regulation And Pharmaceutical R
& D Investment, Health Economics, 14(1), 1-16.
Puig-Junoy, Jaume. (2010), Impact Of European Pharmaceutical Price Regulation On Generic
Price Competition, Pharmacoeconomics, 28(8), 649-663.
Mrazek, Monique F. (2002), Comparative Approaches To Pharmaceutical Price Regulation In
The European Union, Croatian Medical Journal, 43(4), 453-461.
Abbott, Thomas A. (1995), Price Regulation In The Pharmaceutical Industry: Prescription Or
Placebo? Journal of Health Economics, 14(5), 551-565.
Abbott, Thomas A., & Vernon, John A. (2007), The Cost Of US Pharmaceutical Price
Regulation: A Financial Simulation Model Of R&D Decisions, Managerial and Decision
Economics, 28(4‐5), 293-306.
Hassani, Hossein, Silva, Emmanuel Sirimal, Gupta, Rangan, & Segnon, Mawuli K. (2015),
Forecasting the Price of Gold, Applied Economics, 47(39), 4141-4152.
IIMA INDIA Research and Publications
Page No. 22 W.P. No. 2016-02-01
Ahrens, A., Kovandzic, Tomislav. V., & Vieraitis, L. M. (2015), Do Execution Moratoriums
Increase Homicide? Re-Examining Evidence From Illinois, Applied Economics, 47(31), 3243-
3257.
Hyndman, Rob. J., & Khandakar, Yeasmin (2007), Automatic time series for forecasting: the
forecast package for R, Journal of Statistical Software, 27(3), 1-22.
Podnar, Klement, Molj, Bojan, & Golob, Ursa (2007), How reference pricing for
pharmaceuticals can increase generic share of market: the Slovenian experience, Journal of
Public Policy & Marketing, 26(1), 89-101.
Subramanian, Ram, Mutyal, Nikhil, & Nechamkin, Emma (2014), "Market-Based" Price
Controls In India?, Pharmaceutical Executive, 34(4), 64-65
DPCO (2013), Drug Price Control Order 2013 – National Pharmaceutical Pricing Authority,
http://www.nppaindia.nic.in/DPCO2013.pdf
Chemical Business (2013), Pharma market grew by 6.8 pc at Rs 6,370 cr in May 2013, (2013).
Chemical Business, 27(7), 61.
Business Standard. (2014), Pharma cost to grow by 12% in FY 2014-15, http://www.business-
standard.com/article/companies/pharma-industry-to-clock-10-12-growth-in-fy15-report-
114112900804_1.html
Wan, Jane (2013), Report from: India, Pharmaceutical Technology, 37(8), 32-34.
IMS Consulting Group. (2015), Assessing the impact of price control measures on access to
medicines in India.

IIMA INDIA Research and Publications
Page No. 23 W.P. No. 2016-02-01
MacKinlay, Craig. A, (1997), Event studies in economics and finance. Journal of Economic
Literature, 35(1), 13-39.
Vernon, J. A. (2002), Drug Research and Price Controls. Regulation, 25(4), 22.
FRPT-Research (2015), New drug launches in India dips as price control list expands. (2015),
FRPT- Chemical Snapshot, 6-7.
Banerji, A. (2013), Review of Asia-Pacific's healthcare systems with emphasis on the role of
generic pharmaceuticals, Academy of Health Care Management Journal, 9(1/2), 53A.
Duggal, R. (2007), Healthcare in India: changing the financing strategy. Social Policy &
Administration, 41(4), 386-394.
Green, D. G. (1998). Is Price Regulation Necessary? Pharmacoeconomics, 14(1), 137-142.
Golec, J., & Vernon, J. A. (2010), Financial effects of pharmaceutical price regulation on R&D
spending by EU versus US firms, Pharmacoeconomics, 28(8), 615.
Brown, S. J., and Warner, J. B. (1985), ―Using daily stock returns: the case of event studies‖,
Journal of Financial Economics, Vol. 14 No. 1, pp. 3-31.
Corrado, C. J., and Zivney, T. L. (1992), ―The specification and power of the sign test in event
study hypothesis tests using daily stock returns‖, Journal of Financial and Quantitative Analysis,
Vol. 27 No. 3, pp. 465-478.
Elberse, A., & Verleun, J. (2012). The economic value of celebrity endorsements. Journal of
Advertising Research, 52(2), 149.

IIMA INDIA Research and Publications
Page No. 24 W.P. No. 2016-02-01
Appendix A
No. Molecule Seasonal ARIMA Model Cumulative
Abnormal Change
% Change in
Sales Volumea
1 Acetazolamide ARIMA(2,1,0)(1,0,1)[12] with
drift -33,653,525 -6.65%
2 Acyclovir* ARIMA(0,1,0) with drift 2,721,320 0.94%
3 Albendazole* ARIMA(0,1,0) with drift -20,336,470 -2.83%
4 Allopurinol* ARIMA(0,2,1)(0,0,1)[12] 44,647,411 2.44%
5 Alprazolam* ARIMA(1,2,0) -86,227,030 -1.15%
6 Amiodarone* ARIMA(0,1,0)(1,0,0)[12] -10,191,456 -2.86%
7 Amitriptyline ARIMA(0,2,1) -29,431,468 -2.68%
8 Amlodipine*
ARIMA(2,0,0)(1,1,0)[12] with
drift -493,114,964 -3.28%
9 Amoxyclav* ARIMA(1,1,0)(1,1,0)[12] 25,803,346 0.45%
10 Amoxycillin* ARIMA(0,2,1)(0,0,1)[12] 287,557,364 6.18%
11 Ampicillin ARIMA(0,2,1)(0,0,1)[12] -519,077 b -0.19%
12 Androgens Simicomb ARIMA(0,2,2) 4,945,399 6.55%
13 Antifilarials ARIMA(0,1,0) -72,323,800 -21.08%
14 Antithyroid
Preparations*
ARIMA(0,1,0)(0,0,1)[12] with
drift 60,157,802 5.21%
15 Atenolol* ARIMA(1,2,0) -22,826,275 -0.39%
16 Atorvastatin* ARIMA(1,1,2) 53,884,881 0.63%
17 Azathioprine*
ARIMA(0,1,0)(0,0,1)[12] with
drift -25,832,339 -6.90%
18 Azithromycin* ARIMA(1,2,1)(0,0,1)[12] -70,619,228 -3.52%
19 Bisacodyl* ARIMA(1,2,1)(1,0,0)[12] -54,375,682 -1.61%
20 Bromocriptine ARIMA(1,2,0) 653,456 1.53%
21 Cardglycosides Plain*
ARIMA(1,0,0)(1,0,0)[12] with
non-zero mean 129,714,785 5.81%

IIMA INDIA Research and Publications
Page No. 25 W.P. No. 2016-02-01
22 Cefixime* ARIMA(0,1,0)(0,1,1)[12] -670,752,010 -7.56%
23 Cephalexin*
ARIMA(1,0,0)(1,0,0)[12] with
non-zero mean -41,896,194 -5.11%
24 Cetirizine* ARIMA(0,2,2)(0,0,1)[12] -149,807,646 -1.31%
25 Ciclosporin ARIMA(0,1,0)(0,0,1)[12] with
drift 1,073,774
9.65%
26 Clindamycin* ARIMA(3,1,0) with drift 16,973,120 6.96%
27 Clomifene Citrate ARIMA(1,2,0)(1,0,0)[12] -35,965,131 -11.55%
28 Clopidogrel* ARIMA(1,2,1) 56,319,928 1.15%
29 Colchicine ARIMA(0,1,0)(0,0,1)[12] with
drift -5,238,854 -2.65%
30 Cyclophosphamide ARIMA(0,2,1)(0,0,1)[12] Insignificant Forecasts (Jun '14): p>.05
31 Danazol ARIMA(0,1,0)(0,0,1)[12] with
drift -2,182,827 -2.93%
32 Diazepam ARIMA(1,2,0) -6,480,681 -0.76%
33 Diclofenac* ARIMA(0,2,1)(1,0,0)[12] -280,394,470 -7.56%
34 Diltiazem ARIMA(1,2,1) -4,672,520 -0.55%
35 Domperidone*
ARIMA(1,0,0) with non-zero
mean -137,119,019 -7.42%
36 Efavirenz ARIMA(0,1,0)(1,0,0)[12] -1,104,998 -43.98%
37 Enalapril* ARIMA(1,2,1) -65,108,322 -2.92%
38 Ethambutol Comb ARIMA(0,2,1)(0,0,1)[12] 775,562 b
0.12%
39 Ethinylestradiol
Levonor ARIMA(0,1,0) with drift -11,949,675 -0.48%
40 Fluconazole* ARIMA(1,2,1)(0,0,1)[12] 63,750,220 5.78%
41 Fluoxetine ARIMA(1,2,1) 28,408,078 3.21%
42 Glibenclamide* ARIMA(0,1,0)(1,1,0)[12] 129,679,261 3.61%
43 Hydrochlorothiazide ARIMA(0,2,1)(0,0,1)[12] -8,284,856 -1.36%
44 Hydroxychloroquine*
ARIMA(1,0,0)(1,1,0)[12] with
drift -17,406,601 -1.16%
45 Hyoscine* ARIMA(1,2,1) -3,936,971 -0.36%
IIMA INDIA Research and Publications
Page No. 26 W.P. No. 2016-02-01
46 Imatinib ARIMA(2,2,0) 169,806 b
0.62%
47 Imipramine ARIMA(0,2,1)(0,1,1)[12] 27,965,940 5.39%
48 Indinavir ARIMA(0,1,0)(0,0,1)[12] with
drift 1,457,240 23.80%
49 INH ARIMA(0,1,0)(0,0,1)[12] with
drift -30,023,848 -20.23%
50 Isosorbide Dinitrate ARIMA(1,1,0)(1,1,0)[12] Insignificant Forecasts (Jun '14): p>.05
51 Isosorbide 5
Mononitrate*
ARIMA(0,2,2) 14,171,752 0.97%
52 Lamivud Stavud
Nevirap ARIMA(0,2,3)(0,0,1)[12] 128,702
b 0.22%
53 Lamivudine ARIMA(0,2,2) 649,162 1.28%
54 Lamivudine Stavudine ARIMA(0,1,0)(1,0,0)[12] with
drift -391,724
-3.65%
55 Leflunomide* ARIMA(3,1,1) 10,731,137 6.68%
56 Levothyroxine* ARIMA(1,1,0)(1,1,0)[12] -566,948,678 -3.27%
57 Lithium Carbonate ARIMA(0,1,0)(0,0,1)[12] with
drift -12,709,598 -4.41%
58 Losartan* ARIMA(2,2,0) 69,114,129 1.41%
59 Medroxyprogesterone* ARIMA(0,1,1) with drift -36,715,526 -4.84%
60 Mefloquine ARIMA(0,1,0) with drift -1,495,840 -7.77%
61 Metformin*
ARIMA(2,0,0)(0,1,0)[12] with
drift 693,960,869 4.06%
62 Methotrexate ARIMA(1,1,0)(1,0,0)[12] with
drift -24,445,807 -10.21%
63 Methylergometrine* ARIMA(1,2,1)(0,0,1)[12] 12,131,160 2.00%
64 Metoprolol*
ARIMA(1,0,0)(0,1,0)[12] with
drift -80,657,412 -1.46%
65 Mifepriston ARIMA(0,2,1)
Insignificant Forecasts (Apr '14 - Jun
'14): p>.05
66 Nifedipine ARIMA(1,2,1) -1,641,889 b -0.07%
67 Nitrofurantoin* ARIMA(1,1,0) with drift -26,240,023 -3.25%
68 Norethisterone* ARIMA(1,2,1)(0,0,1)[12] -168,717,864 -5.20%
IIMA INDIA Research and Publications
Page No. 27 W.P. No. 2016-02-01
69 Oestro Progestogen
Comb ARIMA(0,1,0) 226,026
b 0.37%
70 Oestrogens Simi Comb ARIMA(0,1,0)(0,0,1)[12] -9,121,944 -17.42%
71 Ofloxacin* ARIMA(1,1,0)(1,1,0)[12] -349,611,119 -6.29%
72 Olanzepine* ARIMA(0,2,2) 24,978,690 2.57%
73 Omeprazole* ARIMA(2,2,0)(1,0,0)[12] 620,528,365 7.27%
74 Ondansetron ARIMA(1,2,0)(1,1,0)[12] -13,107,962 b -0.47%
75 Oth Anti Hiv Prep ARIMA(0,1,0)(1,0,0)[12] -1,500,129 -10.57%
76 Oth Cns Drugs ARIMA(0,2,1) 1,604,200 7.12%
77 Oth Gonadotrophins ARIMA(0,1,0)(0,0,1)[12] with
drift -733,374
-6.24%
78 Oth Alkylating Agents ARIMA(2,0,0)(1,0,0)[12] with
non-zero mean 51,665
3.90%
79 Oth Antimetabolites ARIMA(1,0,0)(1,0,0)[12] with
non-zero mean 607,898
4.17%
80 Oth Antineoplastics ARIMA(1,0,0) with non-zero
mean 292,297
38.30%
81 Oth Hormo Contracep
Nonto ARIMA(1,2,1)(0,0,1)[12] -1,380,657
-6.10%
82 Other Anti Hist Plsol ARIMA(0,1,0)(0,0,1)[12] with
drift -350,039,595 -31.35%
83 Other Antiinf Leprost ARIMA(0,1,0)(1,0,0)[12] with
drift -153,362,066 -14.77%
84 Other Penicillines Orals ARIMA(1,1,0) 921,527 3.38%
85 Others, Plain Folic
Acid*
ARIMA(1,2,0) -204,122,225 -2.75%
86 Paracetamol* ARIMA(1,1,0)(1,1,0)[12] -1018,575,362 -5.91%
87 Pheniramine ARIMA(0,1,0)(0,0,1)[12] with
drift 8,677,715 4.08%
88 Phenobarbitone ARIMA(0,1,0)(0,0,1)[12] with
drift -20,642,149 -1.34%
89 Phenytoin* ARIMA(0,1,0)(1,1,0)[12] -99,058,688 -0.91%
90 Primaquine ARIMA(0,2,0)(0,0,1)[12]
Insignificant Forecasts (Dec '13 - Jun
'14): p>.05
91 Promethazine ARIMA(0,1,0) with drift -38,253,238 -3.53%

IIMA INDIA Research and Publications
Page No. 28 W.P. No. 2016-02-01
92 Propranolol ARIMA(0,1,0) with drift 2,021,541 b 0.09%
93 Psychostim Neurotonics ARIMA(1,2,1)(0,0,1)[12]
Insignificant Forecasts (Dec '13 - Jun
'14): p>.05
94 Pyrazinamide Plain*
ARIMA(0,1,0)(0,0,1)[12] with
drift -45,275,716 -10.40%
95 Pyridostigmine ARIMA(0,1,0)(1,0,0)[12] with
drift -6,896,149 -5.75%
96 Quinine ARIMA(0,1,0) with drift -4,422,654 b -1.73%
97 Raloxifene Comb ARIMA(0,1,0)(1,0,0)[12] with
drift -9,756,663 -33.53%
98 Sodium Valproate* ARIMA(1,2,0)(1,0,0)[12] 15,912,413 0.64%
99 Tamoxifen ARIMA(0,2,1)(0,0,1)[12] Insignificant Forecasts (Jun '14): p>.05
100 Terbutaline ARIMA(1,2,0)(1,0,0)[12]
Insignificant Forecasts (Oct '13 - Jun
'14): p>.05
101 Tramadol ARIMA(0,2,1)(0,0,1)[12] 20,297,287 5.41%
102 Trihexyphenidyl* ARIMA(1,2,1)(0,0,1)[12] 143,965,007 4.61%
103 Warfarin ARIMA(0,1,0)(1,0,0)[12] with
drift 18,294,141 3.88%
104 Zidovudine ARIMA(1,0,0)(1,0,0)[12] with
non-zero mean 4,629,707 41.10%
105 Zidovudine Lamivudine ARIMA(0,2,1) 728,668 1.94%
- a: CAC / Actual Sales (during event window)
- b: CAC is insignificant (p>.05)
- *: Shortlisted molecules for further analysis