Does offshoring affect the domestic labor market? The case … · · 2015-06-04Does offshoring...
32
Preliminary version Comments welcome Does offshoring affect the domestic labor market? The case of Italy Anna M. Falzoni ∗ and Lucia Tajoli # This version: 30 May 2008 Abstract In this paper we assess the extent of offshoring in the Italian manufacturing industries, and we study how this phenomenon is affecting the Italian labor market, in particular the use of skilled and unskilled workers. Here we measure offshoring in the different Italian sectors using the input-output tables that were recently made available for the Italian economy. In the empirical analysis, firstly we estimate the impact of offshoring on the general level of employment in the manufacturing industries, and we don’t find any significant relationship. Then, we examine the relationship between offshoring and employment composition, to see if this process is associated with a significant shift in the composition by skills of the labor force employed domestically. The recent theory of offshoring suggests that the sign of these relations is a priori quite uncertain. In fact, on the one hand, the extension of offshoring to a larger number of tasks and of countries can affect both skilled and unskilled workers. On the other, if offshoring increases the average productivity, it might benefit different workers' groups. Our results are in line with the view that the use of offshoring in the Italian manufacturing industry is not restricted to the search for cheaper unskilled labor, and therefore its impact on the composition of employment seems to be quite different in different industry groups. JEL codes: F14, F16, J23 Keywords: offshoring, employment, skills. ∗ Università degli Studi di Bergamo and CESPRI, Università Bocconi # Politecnico di Milano and CESPRI, Università Bocconi This paper was prepared for the research project “Intensità di capitale umano nella specializzazione internazionale dell’Italia, outsourcing internazionale di merci e servizi e riflessi sull’occupazione”. Financial support from Unicredit for this project is gratefully acknowledged. Thanks are due to Gianluca Orefice for his helpful research assistance and to Rosario Crinò for kindly providing us with the proxies of offshoring, as well as to participants to seminars at the Politecnico di Milano and the University of Michigan for useful comments to an earlier version of the paper.
Transcript of Does offshoring affect the domestic labor market? The case … · · 2015-06-04Does offshoring...

Preliminary version Comments welcome
Does offshoring affect the domestic labor market? The case of Italy
Anna M. Falzoni∗ and Lucia Tajoli#
This version: 30 May 2008
Abstract
In this paper we assess the extent of offshoring in the Italian manufacturing industries, and we study how this phenomenon is affecting the Italian labor market, in particular the use of skilled and unskilled workers. Here we measure offshoring in the different Italian sectors using the input-output tables that were recently made available for the Italian economy. In the empirical analysis, firstly we estimate the impact of offshoring on the general level of employment in the manufacturing industries, and we don’t find any significant relationship. Then, we examine the relationship between offshoring and employment composition, to see if this process is associated with a significant shift in the composition by skills of the labor force employed domestically. The recent theory of offshoring suggests that the sign of these relations is a priori quite uncertain. In fact, on the one hand, the extension of offshoring to a larger number of tasks and of countries can affect both skilled and unskilled workers. On the other, if offshoring increases the average productivity, it might benefit different workers' groups. Our results are in line with the view that the use of offshoring in the Italian manufacturing industry is not restricted to the search for cheaper unskilled labor, and therefore its impact on the composition of employment seems to be quite different in different industry groups. JEL codes: F14, F16, J23 Keywords: offshoring, employment, skills.
∗ Università degli Studi di Bergamo and CESPRI, Università Bocconi # Politecnico di Milano and CESPRI, Università Bocconi This paper was prepared for the research project “Intensità di capitale umano nella specializzazione internazionale dell’Italia, outsourcing internazionale di merci e servizi e riflessi sull’occupazione”. Financial support from Unicredit for this project is gratefully acknowledged. Thanks are due to Gianluca Orefice for his helpful research assistance and to Rosario Crinò for kindly providing us with the proxies of offshoring, as well as to participants to seminars at the Politecnico di Milano and the University of Michigan for useful comments to an earlier version of the paper.

1. Introduction The debate on the effects on the labor market of the offshoring practices of firms has been revived by the recent theoretical approaches that extend to a much larger number of sectors and tasks the possibilities of offshoring.1 The earlier models of offshoring and the related empirical evidence show that the delocalisation of phases of production was a phenomenon well established only in a small number of sectors and involving only a selection of firms. Not surprisingly, therefore, the effects of offshoring on the labor markets produced by the existing empirical studies are generally quite limited.2 But the new approaches suggest that offshoring might increase rapidly, both in its extension (the number of sectors involved, including services) and in its depth (the number of production phases or tasks that can be delocalized. See, among others, Grossman and Rossi-Hansberg (2006a,b)) and the reported empirical evidence indicates that this is indeed occurring (see for example Havik and Mc Morrow (2006) on the growth of the phenomenon in the EU, IMF (2007) and OECD (2007)).
In this paper we want to assess the evidence of such an increase in offshoring for Italy, and how this is affecting the Italian labor market. As the theoretical models on international fragmentation of production and offshoring illustrate, the effect on factors of production depends crucially on which sectors are involved and on the factor intensity of imported inputs (see for example Deardorff 2001 and 2005; Kohler, 2008). Furthermore, the recent literature indicates that firms’ recourse to offshoring depends not only on factors’ price differences and technological feasibility, but also on goods’ and countries’ “institutional characteristics” (Antras and Helpman, 2006). Different patterns of offshoring can then be observed across countries and industries, with different implications for the domestic labor markets.
The Italian model of specialization is quite peculiar when compared to other industrialized countries, and this leads to a somewhat peculiar pattern of offshoring too. Previous works on Italian international fragmentation of production measured through outward processing data (see for example Helg and Tajoli, 2005) suggest that this practice was concentrated in a few traditional sectors, and it was almost negligible in many industries. But much of the previous work had severe data limitation.3 Offshoring is a much broader phenomenon than what is usually recorded in the statistics of outward processing 1 The definition of offshoring (and consequently its measures) is not clear-cut in the economic literature or in the public debate. Here we adopt the definition given by OECD (2007): offshoring is used to designate outsourcing (i. e. use of goods and services produced outside the firm) abroad. Therefore we use the terms offshoring and international outsourcing interchangeably. These terms cover the situation where production of goods or services is effected or (partially) transferred abroad within the same company, say to a foreign affiliate, as well as transfer of production abroad to a non-affiliated enterprise. Offshoring to non-affiliates implies subcontracting of a permanent and regular character, even if this particular characteristic is very difficult to measure. See OECD (2007) for an extensive discussion of the definition and measurement issues. 2 See for a survey, among others, Feenstra and Hanson (2001) and Crinò (2007). 3 The use of data on outward processing trade (OPT) to measure the extent of international fragmentation of production has the advantage of capturing a precise organizational choice of the firms, but unfortunately not all international fragmentation decisions give rise to processing trade flows that are officially recorded. Therefore OPT measures systematically underestimate the phenomenon.
2

trade or international production sharing, but it is more narrowly defined than overall imports of components and parts, and it is therefore difficult to measure when only trade data are available. Here we measure offshoring in the Italian manufacturing sectors using the import-use and input-output tables that were recently made available, and using both a broad and a narrow indicator of the phenomenon. The use of input-output tables allows combining trade data with information on the underlying structure of the economy. 4
In this paper, the extent of offshoring is first of all related to the employment level in manufacturing, to assess if there is a relationship between offshoring and the general level of employment. Secondly, we examine the relationship between offshoring and the employment composition, to see if this process is associated with a significant shift in the composition by skills of the labor force employed domestically. In the recent debate on the causes of the slowdown of the Italian economy in the past decade, the vicious circle of a "bad endowment" in terms of workers' qualifications, related to a "wrong international specialization" was seen as one of the possible reasons for the loss of competitiveness of the country. An analysis of the changes of the employment composition in relation to the process of internationalization of the economy can shed some light on this issue.5
As mentioned, the recent theory of offshoring suggests that the sign of these relations is a priori quite uncertain. In fact, on the one hand, the extension of offshoring to a larger number of tasks and of countries not necessarily will affect unskilled workers only. On the other, if the new division of labor increases the average productivity, it might benefit different workers' groups (see, among others, Dluhosch, 2006).
The paper is organized as follows: section 2 describes the recent developments of the Italian labor market, particularly the composition of labor demand between skilled and unskilled workers. In section 3, we discuss the trends of various measures of offshoring based on input-output tables. The empirical model and the estimation results are presented in section 4. Section 5 offers some conclusions.
2. Employment levels and composition in the Italian manufacturing sector We start our analysis by observing the changes in employment in the manufacturing sector. We are especially interested in the relative employment of skilled and unskilled workers in Italy, using the available definitions and sources. Our main source for disaggregated data on employment by industry is ISTAT (Italian National Statistical Institute) publication "Conti Economici delle Imprese", covering 23 manufacturing sectors at the level of disaggregation corresponding to 2-digit ATECO 91-NACE Rev.1. From this source we have data on the
4 The recently released input-output tables for Italy have been used by Daveri and Jona-Lasinio (2008) to study the link between offshoring and productivity growth. 5 Recently, other studies have investigated the relationship between offshoring and labor market outcomes in Italy following different lines of research. Broccolini et al. (2008) analyses the impact of international outsourcing and technological change on wages. Costa and Ferri (2007) and Antonietti and Antonioli (2008) study the employment and the skill composition effect of offshoring using firm level data. Bertoli (2008) investigates the relevance of intersectoral effects of offshoring on employment.
3
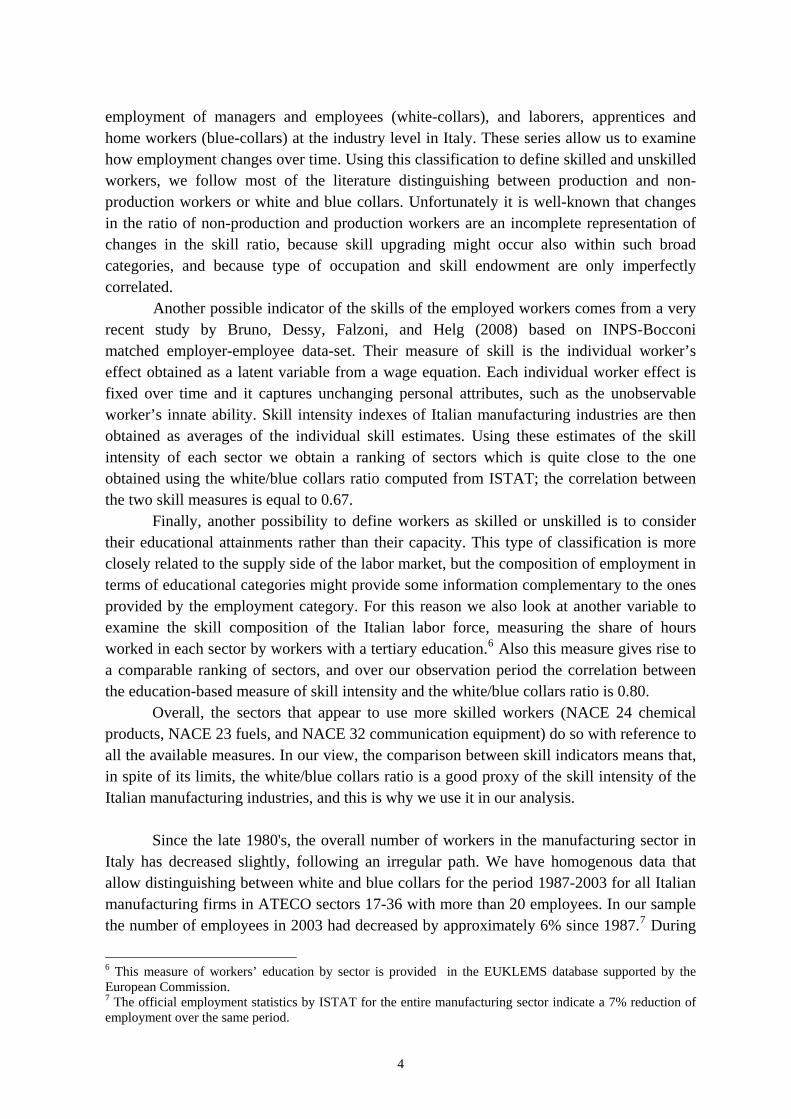
employment of managers and employees (white-collars), and laborers, apprentices and home workers (blue-collars) at the industry level in Italy. These series allow us to examine how employment changes over time. Using this classification to define skilled and unskilled workers, we follow most of the literature distinguishing between production and non-production workers or white and blue collars. Unfortunately it is well-known that changes in the ratio of non-production and production workers are an incomplete representation of changes in the skill ratio, because skill upgrading might occur also within such broad categories, and because type of occupation and skill endowment are only imperfectly correlated.
Another possible indicator of the skills of the employed workers comes from a very recent study by Bruno, Dessy, Falzoni, and Helg (2008) based on INPS-Bocconi matched employer-employee data-set. Their measure of skill is the individual worker’s effect obtained as a latent variable from a wage equation. Each individual worker effect is fixed over time and it captures unchanging personal attributes, such as the unobservable worker’s innate ability. Skill intensity indexes of Italian manufacturing industries are then obtained as averages of the individual skill estimates. Using these estimates of the skill intensity of each sector we obtain a ranking of sectors which is quite close to the one obtained using the white/blue collars ratio computed from ISTAT; the correlation between the two skill measures is equal to 0.67.
Finally, another possibility to define workers as skilled or unskilled is to consider their educational attainments rather than their capacity. This type of classification is more closely related to the supply side of the labor market, but the composition of employment in terms of educational categories might provide some information complementary to the ones provided by the employment category. For this reason we also look at another variable to examine the skill composition of the Italian labor force, measuring the share of hours worked in each sector by workers with a tertiary education.6 Also this measure gives rise to a comparable ranking of sectors, and over our observation period the correlation between the education-based measure of skill intensity and the white/blue collars ratio is 0.80.
Overall, the sectors that appear to use more skilled workers (NACE 24 chemical products, NACE 23 fuels, and NACE 32 communication equipment) do so with reference to all the available measures. In our view, the comparison between skill indicators means that, in spite of its limits, the white/blue collars ratio is a good proxy of the skill intensity of the Italian manufacturing industries, and this is why we use it in our analysis.
Since the late 1980's, the overall number of workers in the manufacturing sector in Italy has decreased slightly, following an irregular path. We have homogenous data that allow distinguishing between white and blue collars for the period 1987-2003 for all Italian manufacturing firms in ATECO sectors 17-36 with more than 20 employees. In our sample the number of employees in 2003 had decreased by approximately 6% since 1987.7 During
6 This measure of workers’ education by sector is provided in the EUKLEMS database supported by the European Commission. 7 The official employment statistics by ISTAT for the entire manufacturing sector indicate a 7% reduction of employment over the same period.
4
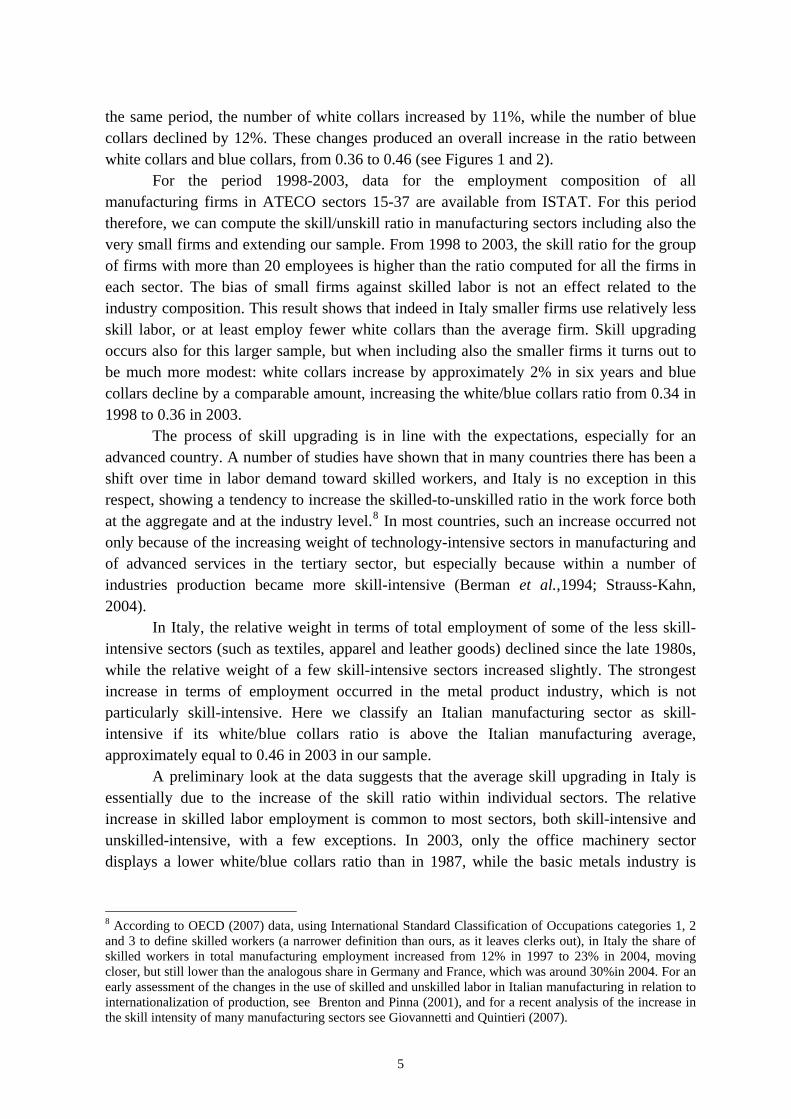
the same period, the number of white collars increased by 11%, while the number of blue collars declined by 12%. These changes produced an overall increase in the ratio between white collars and blue collars, from 0.36 to 0.46 (see Figures 1 and 2).
For the period 1998-2003, data for the employment composition of all manufacturing firms in ATECO sectors 15-37 are available from ISTAT. For this period therefore, we can compute the skill/unskill ratio in manufacturing sectors including also the very small firms and extending our sample. From 1998 to 2003, the skill ratio for the group of firms with more than 20 employees is higher than the ratio computed for all the firms in each sector. The bias of small firms against skilled labor is not an effect related to the industry composition. This result shows that indeed in Italy smaller firms use relatively less skill labor, or at least employ fewer white collars than the average firm. Skill upgrading occurs also for this larger sample, but when including also the smaller firms it turns out to be much more modest: white collars increase by approximately 2% in six years and blue collars decline by a comparable amount, increasing the white/blue collars ratio from 0.34 in 1998 to 0.36 in 2003.
The process of skill upgrading is in line with the expectations, especially for an advanced country. A number of studies have shown that in many countries there has been a shift over time in labor demand toward skilled workers, and Italy is no exception in this respect, showing a tendency to increase the skilled-to-unskilled ratio in the work force both at the aggregate and at the industry level.8 In most countries, such an increase occurred not only because of the increasing weight of technology-intensive sectors in manufacturing and of advanced services in the tertiary sector, but especially because within a number of industries production became more skill-intensive (Berman et al.,1994; Strauss-Kahn, 2004).
In Italy, the relative weight in terms of total employment of some of the less skill-intensive sectors (such as textiles, apparel and leather goods) declined since the late 1980s, while the relative weight of a few skill-intensive sectors increased slightly. The strongest increase in terms of employment occurred in the metal product industry, which is not particularly skill-intensive. Here we classify an Italian manufacturing sector as skill-intensive if its white/blue collars ratio is above the Italian manufacturing average, approximately equal to 0.46 in 2003 in our sample.
A preliminary look at the data suggests that the average skill upgrading in Italy is essentially due to the increase of the skill ratio within individual sectors. The relative increase in skilled labor employment is common to most sectors, both skill-intensive and unskilled-intensive, with a few exceptions. In 2003, only the office machinery sector displays a lower white/blue collars ratio than in 1987, while the basic metals industry is
8 According to OECD (2007) data, using International Standard Classification of Occupations categories 1, 2 and 3 to define skilled workers (a narrower definition than ours, as it leaves clerks out), in Italy the share of skilled workers in total manufacturing employment increased from 12% in 1997 to 23% in 2004, moving closer, but still lower than the analogous share in Germany and France, which was around 30%in 2004. For an early assessment of the changes in the use of skilled and unskilled labor in Italian manufacturing in relation to internationalization of production, see Brenton and Pinna (2001), and for a recent analysis of the increase in the skill intensity of many manufacturing sectors see Giovannetti and Quintieri (2007).
5
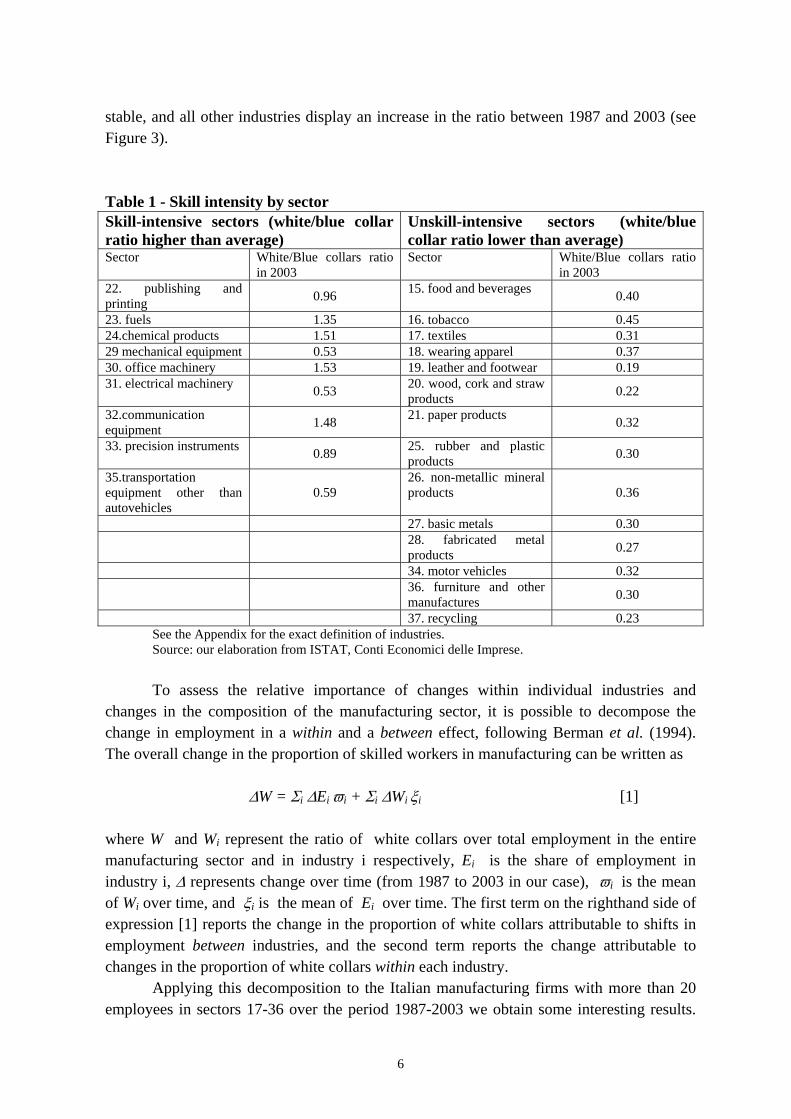
stable, and all other industries display an increase in the ratio between 1987 and 2003 (see Figure 3).
Table 1 - Skill intensity by sector Skill-intensive sectors (white/blue collar ratio higher than average)
Unskill-intensive sectors (white/blue collar ratio lower than average)
Sector White/Blue collars ratio in 2003
Sector White/Blue collars ratio in 2003
22. publishing and printing 0.96 15. food and beverages 0.40
23. fuels 1.35 16. tobacco 0.45 24.chemical products 1.51 17. textiles 0.31 29 mechanical equipment 0.53 18. wearing apparel 0.37 30. office machinery 1.53 19. leather and footwear 0.19 31. electrical machinery 0.53 20. wood, cork and straw
products 0.22
32.communication equipment 1.48 21. paper products 0.32
33. precision instruments 0.89 25. rubber and plastic products 0.30
35.transportation equipment other than autovehicles
0.59 26. non-metallic mineral products 0.36
27. basic metals 0.30 28. fabricated metal
products 0.27
34. motor vehicles 0.32 36. furniture and other
manufactures 0.30
37. recycling 0.23 See the Appendix for the exact definition of industries. Source: our elaboration from ISTAT, Conti Economici delle Imprese. To assess the relative importance of changes within individual industries and
changes in the composition of the manufacturing sector, it is possible to decompose the change in employment in a within and a between effect, following Berman et al. (1994). The overall change in the proportion of skilled workers in manufacturing can be written as
ΔW = Σi ΔEi ϖi + Σi ΔWi ξi [1]
where W and Wi represent the ratio of white collars over total employment in the entire manufacturing sector and in industry i respectively, Ei is the share of employment in industry i, Δ represents change over time (from 1987 to 2003 in our case), ϖi is the mean of Wi over time, and ξi is the mean of Ei over time. The first term on the righthand side of expression [1] reports the change in the proportion of white collars attributable to shifts in employment between industries, and the second term reports the change attributable to changes in the proportion of white collars within each industry.
Applying this decomposition to the Italian manufacturing firms with more than 20 employees in sectors 17-36 over the period 1987-2003 we obtain some interesting results.
6

The share of white collars in manufacturing goes from 0.26 to 0.31, increasing by 0.05 (ΔW). This change is the result of an increase in the within component of 0.057, and a decrease of the between component of -0.007. As suggested by the observation of the data, the skill upgrading in Italian manufacturing is entirely due to changes within individual industries. Contrary to what happened to other countries, in Italy there has not been a shift in the composition of employment in favor of more skill-intensive sectors.9 Overall, the composition effect in terms of sectors on the total skill/unskill ratio appears quite modest, in line with all the studies showing the persistence over time of the Italian model of specialization (see for example De Benedictis, 2005).
The skill upgrading is fairly continuous for most sectors, even if the pattern becomes more irregular in the last few years (see for example the ups and downs in the skill ratio in transport equipment, apparel and paper). The strongest skill upgrading can be observed in communication equipment (a skill-intensive sector), followed by apparel and by leather goods, two very low skill-intensive sectors. It seems that the reasons behind such changes could be different, given the sharp technological differences between these industries.
The variations in the level of employment of managers and clerks and of production workers laying behind the trend in the ratio are differentiated among industries. In some of the most advanced sectors, we see an increase in the number of white collars. In contrast, the upward trend in the skilled/unskilled labor ratio in the textiles and in the apparel industries is essentially due to the fall of employment of blue-collar workers vis-à-vis a stable number of white collars. Some sectors, such as wood, furniture and metal products, show an increase in skill intensity, in spite of the increase in the number of blue-collar workers. Even in presence of a generalized trend of skill upgrading, the different movements in the level of employment of the different groups might imply different types of re-organization of production. One of these is the recourse to offshoring that we discuss in the following section.
3. Has Italy experienced an increase in offshoring?
The empirical literature has used various proxies to measure the extent of international fragmentation of production: data on outward processing trade, statistics on trade in intermediate goods, and input-output tables. Each proxy has pros and cons.10 However, aiming to analyze whether Italy shows an increase in offshoring and if the latter has an impact on the domestic labor market, data from input-output tables have been preferred as they allow to analyze developments across industries and over time, while keeping track of the vertical and horizontal linkages between industries.11 9 This result is in line with the result of a similar decomposition of the between and within effect performed at the firm-level for the Italian mechanical industry by Manasse et al. (2004). 10 For a discussion of the measurement issues see, among others, Hijzen (2005) and OECD (2007). 11 Data on OPT are no more an appropriate source to study recent trends in the Italian case due to major trade arrangements changes (e.g. towards Eastern European Countries). Analyses based on statistics on trade in intermediate goods are difficult given the different level of aggregation for different industries.
7

The proxy for offshoring intensity (OFF) is constructed as:
( ) itIIK
k iktit MOFF ∑ ==
1[2]
where Mikt are imports of intermediate input (service) k by industry i at time t, whereas IIit is total usage of intermediate inputs in the same industry.
We use recently released I-O matrices for Italy up to 2003 to retrieve the main components of OFFit. Mikt comes from the "Import" matrices, giving the amount of intermediate inputs and services acquired by each industry from abroad. IIit comes instead from the "Use" matrices, giving the total amount (domestic plus foreign) of intermediate inputs and services used by each industry. Compared to Feenstra and Hanson (1996, 1999), who employ combined-use matrices, in combination with trade data, using import-use matrices has the advantage that offshoring is measured directly and is no longer driven by increased import penetration of all goods.12
We construct two similar measures for material offshoring and service offshoring. For material offshoring, we use imports of all products classified in NACE categories 15 to 37 (broad offshoring). We also compute a narrow proxy, using only imports from the same industry (the diagonal elements of the import matrix). For service offshoring, we use imports of the following services: financial and insurance services (NACE: 64 to 67), rental services (NACE 71), computer services (NACE 72), research and developments services (NACE 73), professional services (NACE 74), other private services (NACE 93).
As for material offshoring, the narrow measure is usually preferred as it best captures the idea of the fragmentation of production within the same industry, and of delocalization abroad of production phases (Feenstra and Hanson, 1999; Hijzen, 2005). In addition, it seems particularly convenient here because we have to rely on the relatively high aggregation level of 2-digit industries.
When considering the whole manufacturing industry, international outsourcing of materials shows an increasing trend when we refer to the broad measure: the broad OFF index climbs from 18.34% in 1992 to 24.62% in 2003. The narrow proxy of international outsourcing remains fairly constant over the period, from 10.98% in 1992, to a maximum of 12.05% in 1994, with a moderate decline in the last years of our analysis to around 11%. In line with the evidence emerging from other countries (Hijzen, 2005; Amiti and Wei, 2005), international outsourcing of services is growing substantially (the index for services is rising from an average of 0.52 in 1992 to 2.06 in 2003), but its importance is far from the one of offshoring of goods.
Figures 4 to 6 show the different trends in 2-digit NACE industries of our measures of offshoring. A clear upward trend in the narrow offshoring indicator appears in chemical products and in motor vehicles, while other industries show smaller changes in this respect. The picture emerging is one in which the importance of offshoring differs widely across industries. Focusing on the measures of material offshoring, on average in the period 1992-
12 In a very recent paper, Horgos (2007), discussing whether measurement matters in explaining labor market effects of international outsourcing, shows the advantages of our proxy.
8

2003, the three most important offshoring industries were “Office and computing machinery” (NACE 30), “Chemicals” (NACE 24), and “Radio, television and communication equipment” (NACE 32) in terms of the broad indicator (respectively with intensity 54.5, 38.5, and 38.3). “Chemicals” (NACE 24), “Basic metals” (NACE 27), and “Radio, television and communication equipment” (NACE 32) were at the top of the ranking in terms of the narrow definition of offshoring (respectively with intensity 30.5, 24.9, and 22.4).
Even with strong differences in the developments of offshoring, the industries’ ranking doesn’t change much during the period under study. Contrary to anecdotal evidence, but in line with the developments reported for the advanced economies in IMF (2007) and De Backer and Yamano (2007),13 in Italy international fragmentation of production measured through input-output tables seems to characterize mostly high-tech and/or scale intensive industries rather than traditional unskill-intensive productions, typical of the Italian pattern of specialization such as textiles and clothing, footwear.
To shed some light on this point, we continue our analysis looking at the existing relationship between offshoring and industries’ skill intensity. Interesting enough, Table 2 shows that, whichever classification we use to distinguish industries according to their skill intensity, “high-skill intensive industries” show intensity of offshoring greater than “low-skill intensive” ones.
There may be various reasons for this evidence. The intensity of international material outsourcing may represent not only (or not specifically) the search for low-labor cost though international fragmentation of production, but also the extent of the Italian comparative disadvantage in high-tech and scale intensive industries and the need to rely on import of sophisticated or complex components.14
13 According to the IMF (2007) calculations, the rise in offshoring in advanced economies has been driven mostly by imports of skilled rather than unskilled inputs. In spite of this increase, the extent of offshoring is still quite limited in advanced economies, and in 2003 the offshoring of non-energy manufacturing and services inputs averaged roughly 10% of total intermediate inputs in these countries. 14 This explanation diverges from that suggested in IMF (2007), where the fact that the rise in offshoring is driven mostly by imports of skilled rather than unskilled inputs is related to advanced economies’ comparative advantages. In IMF (2007, chapter 5) is suggested that, in line with developed economies’ specialization in skill-intensive production, goods produced in unskilled sectors are more likely to be imported as final goods rather than intermediates.
9
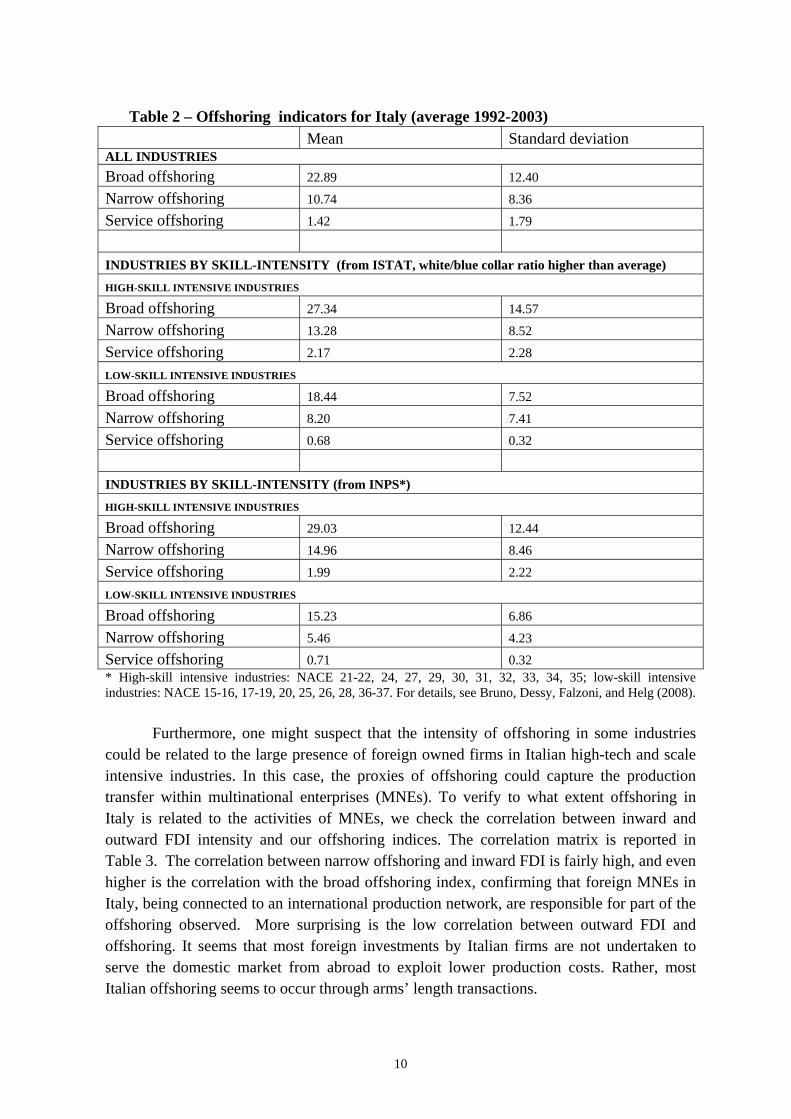
Table 2 – Offshoring indicators for Italy (average 1992-2003) Mean Standard deviation ALL INDUSTRIES
Broad offshoring 22.89 12.40
Narrow offshoring 10.74 8.36
Service offshoring 1.42 1.79
INDUSTRIES BY SKILL-INTENSITY (from ISTAT, white/blue collar ratio higher than average) HIGH-SKILL INTENSIVE INDUSTRIES Broad offshoring 27.34 14.57
Narrow offshoring 13.28 8.52
Service offshoring 2.17 2.28
LOW-SKILL INTENSIVE INDUSTRIES Broad offshoring 18.44 7.52
Narrow offshoring 8.20 7.41
Service offshoring 0.68 0.32
INDUSTRIES BY SKILL-INTENSITY (from INPS*) HIGH-SKILL INTENSIVE INDUSTRIES Broad offshoring 29.03 12.44
Narrow offshoring 14.96 8.46
Service offshoring 1.99 2.22
LOW-SKILL INTENSIVE INDUSTRIES Broad offshoring 15.23 6.86
Narrow offshoring 5.46 4.23
Service offshoring 0.71 0.32 * High-skill intensive industries: NACE 21-22, 24, 27, 29, 30, 31, 32, 33, 34, 35; low-skill intensive industries: NACE 15-16, 17-19, 20, 25, 26, 28, 36-37. For details, see Bruno, Dessy, Falzoni, and Helg (2008).
Furthermore, one might suspect that the intensity of offshoring in some industries could be related to the large presence of foreign owned firms in Italian high-tech and scale intensive industries. In this case, the proxies of offshoring could capture the production transfer within multinational enterprises (MNEs). To verify to what extent offshoring in Italy is related to the activities of MNEs, we check the correlation between inward and outward FDI intensity and our offshoring indices. The correlation matrix is reported in Table 3. The correlation between narrow offshoring and inward FDI is fairly high, and even higher is the correlation with the broad offshoring index, confirming that foreign MNEs in Italy, being connected to an international production network, are responsible for part of the offshoring observed. More surprising is the low correlation between outward FDI and offshoring. It seems that most foreign investments by Italian firms are not undertaken to serve the domestic market from abroad to exploit lower production costs. Rather, most Italian offshoring seems to occur through arms’ length transactions.
10

11
Table 3 – Correlation between internationalization indicators for Italy 1992-2003 (17 sectors, excluding Fuels, 189 yearly observations) Narrow
offshoring index
Broad offshoring index
Service offshoring index
Imports/ Production
Exports/ Production
Inward FDI intensity
Outward FDI intensity
Narrow offshoring index
1.0000
Broad offshoring index
0.5934 1.0000
Service offshoring index
0.0346 0.5539 1.0000
Imports/ Production 0.3395 0.7831 0.7397 1.0000
Exports/ Production 0.0923 0.6167 0.5101 0.7008 1.0000
Inward FDI intensity 0.4918 0.7755 0.4096 0.6803 0.5333 1.0000
Outward FDI intensity
0.1941 0.1867 0.0219 0.3179 0.1912 0.3684 1.0000
Note: Offshoring indices are defined in eq. 2. FDI intensity is defined as the share of employment in domestic affiliates of foreign MNEs (inward FDI) on total employment or the share of employment in foreign affiliates of domestic MNEs (outward FDI) on total employment in a given industry. 4. The relationship between offshoring and employment
The first issue we examine is whether offshoring has an impact on the overall level of employment. As mentioned in the previous section, there is evidence of a small reduction in manufacturing employment in Italy in the past decade, but this observation could result from a combination of factors. This is why when estimating the relationship between offshoring and employment, we regress the two variables controlling also for other openness measures and shift variables.
The empirical specification adopted is the one most often used in the literature, derived from a conditional labor demand model (see for example Hijzen and Swaim, 2007). The results of the regressions, reported in Table 4, show the expected signs for the control variables and a stable and reasonable fit of the equation. The coefficient of offshoring, measured in narrow terms, has the expected negative sign, but it is generally not significant in affecting employment in the manufacturing sector.15
15 Different specifications were also tested, having different types of employment – white or blue collars – as dependent variable. The narrow indicator of outsourcing was not affecting significantly the level of employment in either group.

Table 4 - Regression results for employment levels Dependent variable: ln(total number of employees)
Eq 4.1 LSDV
Eq 4.2 LSDV
Eq 4.3 LSDV
Eq 4.4 LSDV
Eq 4.5 LSDV
Eq 4.6 A-B
Eq 4.7 A-B
Eq 4.8 A-B
lnO – narrow -0.01 (0.02)
-0.01 (0.04)
-0.03 (0.02)
-0.01 (0.01)
lnO narrow (-1)
-0.01 (0.03)
lnO – broad -0.05 (0.03)*
0.03 (0.02)*
lnO – services -0.01 (0.01)
-0.001 (0.01)
ln(K/Y) 0.08 (0.02)***
0.07 (0.02)***
0.08 (0.02)***
0.08 (0.2)***
0.09 (0.02)***
0.03 (0.01)***
0.03 (0.01)***
0.03 (0.01)***
lnY 0.47 (0.07)***
0.45 (0.06)***
0.47 (0.07)***
0.48 (0.06)***
0.34 (0.06)***
0.33 (0.03)***
0.34 (0.03)***
0.34 (0.03)***
lnW -0.85 (0.05)***
-0.81 (0.06)***
-0.84 (0.06)***
-0.84 (0.05)***
-0.66 (0.07)***
-0.91 (0.03)***
-0.92 (0.03)***
-0.91 (0.03)***
lnImp -0.001 (0.04)
0.01 (0.04)
0.01 (0.04)
0.001 (0.03)
0.03 (0.03)
-0.07 (0.02)***
-0.09 (0.02)***
-0.07 (0.02)
lnExp -0.001 (0.05)
-0.01 (0.05)
0.01 (0.04)
-0.002 (0.04)
-0.003 (0.03)
-0.08 (0.02)***
-0.09 (0.02)***
-0.08 (0.02)
lnEmp(-1) 0.34 (0.06)***
0.09 (0.03)***
0.08 (0.03)**
0.08 (0.03)***
No. of obs. 197 180 197 197 179 161 161 161 No. of sectors 18 18 18 18 18 18 18 18
R-squared 0.71 0.71 0.71 0.71 0.89 ABII
(p-value) 0.0433 0.0750 0.0588
Note: heteroskedastic robust standard errors in parentheses. Coefficients with ***, **, * are significant at the 99%, 95% and 90% level, respectively. LSDV indicates least squares dummy variables estimation method, and A-B indicates estimates obtained with the Arellano-Bond method for dynamic panels. . The figures reported for the ABII test are the p-values of the Arellano-Bond test that average autocovariance in residuals of order two is 0.
12

The broad measure of offshoring instead shows a significant and negative sign, indicating the negative, even if small, impact on employment. But this appears to be a short run effect. In fact, when running a regression of the dynamic specification of the equation by introducing the lagged dependent variable, the broad indicator of offshoring changes its sign. Therefore, there is no evidence of a significant permanent negative effect of offshoring of intermediate goods on the employment level in Italy.16 A negative coefficient is obtained using the indicator of offshoring of services in the manufacturing sector, but also this variable is never significant.
Most of the impact of offshoring is expected to be not on the overall level of
employment, but on the type of employment used in manufacturing, as discussed in section 2, and this is the main issue we want to address. To test the effect of international trade and offshoring on relative wages and the composition of labor demand, the recent literature uses a quasi-fixed translog cost function (Brown and Christensen, 1981) with two variable factors, skilled and unskilled labor, and capital as a quasi-fixed factor. Fixing the short-run levels of capital and output, imposing cost minimization and some parameter restrictions to make the function linearly homogeneous in factor prices generate the equations that are usually estimated.17 In the literature, there are estimates both for these cost share equations as well as estimates of the employment-share equations. In this paper, we adopt the latter approach, and following Feenstra and Hanson’s (2001) suggestion, we introduce an index of offhoring as a shift variable in the following employment ratio equation:
Sit = β0 + µi + τt + β1 O it + β2Y it + β3 (Kit/Yit) + β4 Xit + εit [3]
where S is the ratio of skilled (Ssk) and unskilled workers (Sunsk) employed in industry i at time t, K is the net capital stock of industry i, Y is gross output of industry i, O is our offshoring index (broad, narrow or referring to services), X is a vector of additional control variables, and µi and τt are group-specific (industry) and time-specific fixed effects.18 Logarithmic transformation has been applied to all variables. We estimate Eq. 3 in levels across industries and time.
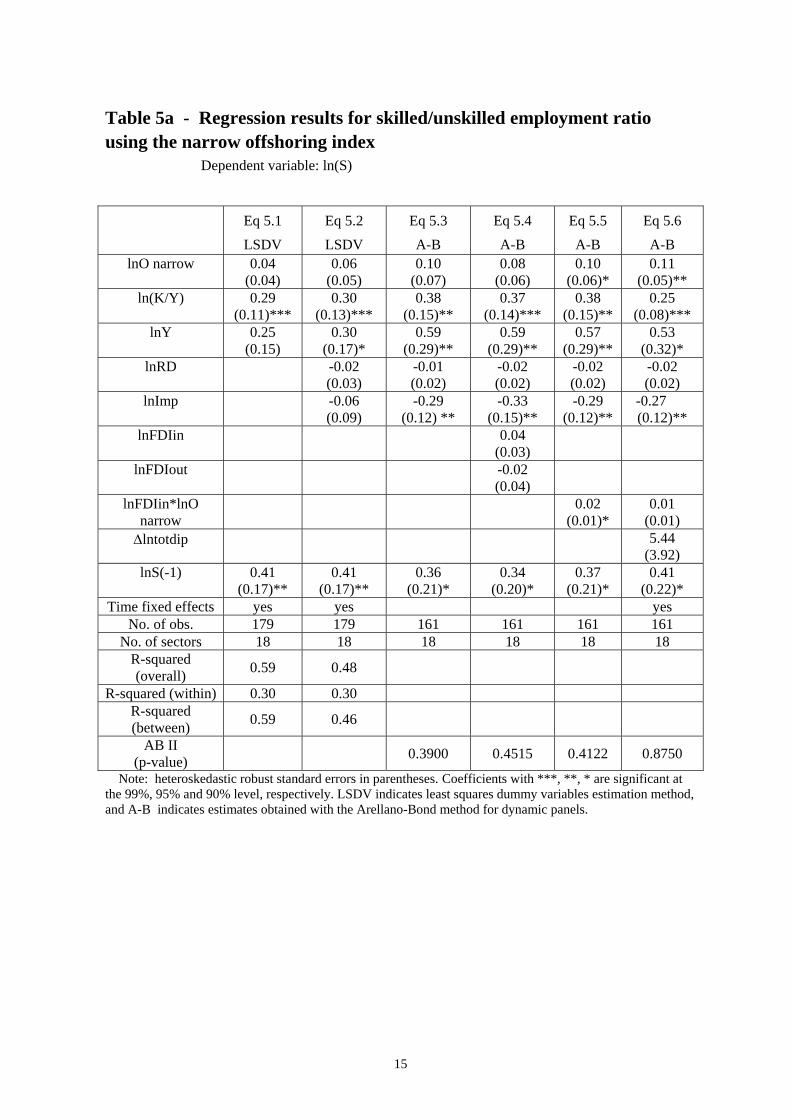
The results of the estimates over our sample of manufacturing industries are reported in Tables 5a and 5b. The most reliable estimates are the ones obtained with the Arellano-Bond method. The coefficient of the capital/output ratio for Italy appears to be positive and significant in all specifications. Estimates of similar equations can yield positive as well as negative signs for the capital variable.19 In this case, the positive sign indicates complementarity between capital and skills, which is what is normally expected. The output
16 This result is in line with the results of Hijzen and Swaim (2007), that offshoring has no effect on sectoral employment in a group of OECD countries that include Italy. 17 See for example Feenstra (2004) Ch. 4 for the derivation of these equations. 18 Time effects are introduced as a proxy of the change over time of the relative wage of skilled and unskilled workers. Lacking reliable data on wages for different groups of workers, this is a proxy often used in the literature. See also the appendix for the exact definition of variables. 19 Results on the capital variable should be interpreted with caution, because ideally one should use data on capital utilization rather than capital stock in this production function.
13

variable is sometimes significant, and among the other shift variables introduced, R&D is generally not significant, while import is negative and significant, suggesting a skill intensive nature of imported goods.20 Overall, the significance of the lagged dependent variable indicates a significant persistence in the skilled/unskilled ratio.21 The characteristics of the Italian labor market suggest that indeed the employment composition in many sectors is sticky and it takes time to absorb the effects of changes in the production functio
turing processes in some manufacturing sectors, also through mergers with foreign firms.
g for the conditions under which offshoring has an impact on the employment composition.
n. Our main variable of interest is of course the index of offshoring. In all the panel
regressions, the indices of offshoring appear to be non-significant, with only two exceptions. The index of narrow offshoring is slightly significant and positive when additional control variables are included in the regression. In particular, in equation 5.4 we control for other forms of internationalization of production activities including the FDI intensities described in the previous section, but these variables don’t seem to impact on the composition of employment across manufacturing industries or on the significance of the offshoring index. The variable of narrow offshoring becomes significant when a term of interaction with the intensity of inward FDI is included and when is added a variable measuring the change in total sectoral employment level (Eq. 5.5 and 5.6). Both variables may control for the presence of major restruc
The results of the previous set of estimates suggested pursuing more checks. While these
panel estimates across industries and over time are very common in the literature, they require making a very strong assumption, that the cost function is the same across industries. The heterogeneity between sectors seems confirmed by the large difference displayed in the regressions in the values of the within and between R-squared. As discussed in Section 2, most of the change in the skill ratio in Italy took place within industries, but a very small part of this change is explained by the previous estimates, that instead show a great deal of heterogeneity between industries. For these reasons, we also run our regressions splitting the sample in two different industry groups, lookin
20 Results for these control variables are in contrast with those obtained by Helg and Tajoli (2005) for the Italian manufacturing sector in an earlier period, using a similar specification, but a different (narrower) measure of offshoring. 21 The goodness of fit of the regressions without the lagged dependent variable dropped significantly and all the tests indicate that this variable should be included in the specification. Therefore, we adopt a dynamic specification via the introduction in Eq. 3 of the lagged dependent variable. Many other studies take first differences of the variables to analyse the dynamic effects, but this implies loosing the level effects, which are likely to be important. As a robustness check, we also run the regression in first differences, obtaining the results very similar to the ones of the regression in levels.
14
15
Table 5a - Regression results for skilled/unskilled employment ratio using the narrow offshoring index
Dependent variable: ln(S) Eq 5.1
LSDV Eq 5.2 LSDV
Eq 5.3 A-B
Eq 5.4 A-B
Eq 5.5 A-B
Eq 5.6 A-B
lnO narrow 0.04 (0.04)
0.06 (0.05)
0.10 (0.07)
0.08 (0.06)
0.10 (0.06)*
0.11 (0.05)**
ln(K/Y) 0.29 (0.11)***
0.30 (0.13)***
0.38 (0.15)**
0.37 (0.14)***
0.38 (0.15)**
0.25 (0.08)***
lnY 0.25 (0.15)
0.30 (0.17)*
0.59 (0.29)**
0.59 (0.29)**
0.57 (0.29)**
0.53 (0.32)*
lnRD -0.02 (0.03)
-0.01 (0.02)
-0.02 (0.02)
-0.02 (0.02)
-0.02 (0.02)
lnImp -0.06 (0.09)
-0.29 (0.12) **
-0.33 (0.15)**
-0.29 (0.12)**
-0.27 (0.12)**
lnFDIin 0.04 (0.03)
lnFDIout -0.02 (0.04)
lnFDIin*lnO narrow
0.02 (0.01)*
0.01 (0.01)
Δlntotdip 5.44 (3.92)
lnS(-1) 0.41 (0.17)**
0.41 (0.17)**
0.36 (0.21)*
0.34 (0.20)*
0.37 (0.21)*
0.41 (0.22)*
Time fixed effects yes yes yes No. of obs. 179 179 161 161 161 161
No. of sectors 18 18 18 18 18 18 R-squared (overall) 0.59 0.48
R-squared (within) 0.30 0.30 R-squared (between) 0.59 0.46
AB II (p-value) 0.3900 0.4515 0.4122 0.8750
Note: heteroskedastic robust standard errors in parentheses. Coefficients with ***, **, * are significant at the 99%, 95% and 90% level, respectively. LSDV indicates least squares dummy variables estimation method, and A-B indicates estimates obtained with the Arellano-Bond method for dynamic panels.

Table 5b - Regression results for skilled/unskilled employment ratio using broad and service offshoring index
Dependent variable: ln(S) Eq 5.6
LSDV Eq 5.7 A-B
Eq 5.8 LSDV
Eq 5.9 A-B
lnO broad 0.004 (0.06)
-0.13 (0.08)
lnO services
0.01 (0.03)
-0.02 (0.03)
ln(K/Y) 0.28 (0.11)**
0.35 (0.05)***
0.28 (0.11)**
0.36 (0.05)***
lnY 0.29 (0.17)*
0.44 (0.14)***
0.26 (0.16)
0.36 (0.12)***
lnRD -0.02 (0.03)
lnImp 0.01 (0.09)
lnS(-1) 0.41 (0.17)**
0.35 (0.08)***
0.41 (0.17)**
0.35 (0.08)***
Time fixed effects
yes yes yes*
No. of obs. 179 161 179 161 No. of sectors 18 18 18 18
R-squared (overall) 0.46 0.57
R-squared (within) 0.29 0.29
R-squared (between) 0.44 0.56
AB II (p-value) 0.2871 0.3587
Note: heteroskedastic robust standard errors in parentheses. Coefficients with ***, **, * are significant at the 99%, 95% and 90% level, respectively. LSDV indicates least squares dummy variables estimation method, and A-B indicates estimates obtained with the Arellano-Bond method for dynamic panels.
We split our sample according to the degree of skill intensity, using two different indicators to measure the skill intensity, one based on the white/blue collars ratio, and the other based on wage differentials, presented in section 3.22 In this set of regressions we focus on the narrow indicator of offshoring, as the most appropriate to capture international fragmentation of production.
22 A similar split of manufacturing industries in two groups with different skill intensities is presented in Geishecker and Gorg (2005), where different results for the two groups are obtained.
16

Table 6 - Regression results for skilled/unskilled employment ratio in different industry groups
Unskill-intensive industries (white/blue collars ratio below
average)
Skill-intensive industries (white/blue collars ratio
above average)
Skill-intensive industries (from INPS ) (a)
Eq 6.1 LSDV
Eq 6.2 A-B
Eq 6.3 LSDV
Eq 6.4 A-B
Eq. 6.5 LSDV
Eq 6.6 A-B
lnO narrow -0.004 (0.04)
-0.11 (0.04)***
0.15 (0.07)**
0.21 (0.03)***
0.09 (0.07)
0.14 (0.05)***
ln(K/Y) -0.06 (0.03)*
-0.06 (0.02)**
0.41 (0.13)***
0.43 (0.16)***
0.35 (0.12)***
0.41 (0.15)***
lnY -0.17 (0.08)**
-0.28 (0.12)**
0.76 (0.30)**
1.22 (0.26)***
0.62 (0.21)***
0.91 (0.26)***
lnRD 0.03 (0.01)**
0.04 (0.01)***
-0.13 (0.06)**
-0.13 (0.06)**
-0.09 (0.05)*
-0.10 (0.06)*
lnImp 0.05 (0.06)
0.10 (0.05)**
-0.09 (0.11)
-0.33 (0.08)***
-0.02 (0.11)
-0.30 (0.05)***
lnS(-1) 0.39 (0.18)**
0.19 (0.11)*
0.39 (0.20)**
0.42 (0.15)***
0.40 (0.19)**
0.41 (0.15)***
Time fixed effects
Yes* Yes Yes*
No. of obs. 90 81 78 70 98 88 No. of sectors 9 9 8 8 10 10
F-test 11.73 5.19 3.96 R-squared (overall)
0.42 0.03 0.005
R-squared (within)
0.53 0.48 0.40
R-squared (between)
0.39 0.08 0.005
ABII (p-value)
0.5460
0.2116 0.3678
(a) In this regression we included sectors 21-22, 24, 27, 29, 30, 31, 32, 33, 34 and 35. According to this classification, only four industries are unambiguously unskill-intensive, leaving too few observations to perform regressions over the unskill industries subset.
Note: The fuel sector (NACE 23) has been dropped from these regressions. Heteroskedastic robust standard errors in parentheses. Coefficients with ***, **, * are
significant at the 99%, 95% and 90% level, respectively. LSDV indicates least squares dummy variables estimation method, and A-B indicates estimates obtained with the Arellano-Bond method for dynamic panels.
The results for the two groups of industries are quite different both from the ones
obtained for the entire sample, and between groups. First of all, the value of the within R-squared is substantially increased. Furthermore, looking at the sign and the value of the coefficients of the control variables, we can confirm that there are remarkable differences in the cost functions of the different industries. The two subsets of skill-intensive industries present similar results for all the control variables. For these groups, increases in production or in the capital intensity always increase the skilled/unskilled ratio in employment. The
17

opposite is true for the unskill-intensive group, even if the significance of these results is weaker.
For the group of skill-intensive industries, the offshoring indicator has a positive sign and it is often significant, while for the unskilled-intensive group when significant the sign is negative. This result appears puzzling, but a possible explanation of this difference in signs lies in the structure of Italian comparative advantages and specialization, giving rise to different types of international outsourcing. Offshoring should be undertaken by firms to offset comparative disadvantages in some phases of production. Offshoring in Italy is generally stronger first of all in some skill-intensive industries, where on average we observe a revealed comparative disadvantage for Italy, and where the productivity gap with respect to other industrialized countries is higher.23 Secondly, the index of offshoring is high in some traditional industries such as apparel and footwear, displaying a comparative advantage, but with many production phases intensive in unskilled labor, which is relatively expensive in Italy. Unfortunately, the data so far do not allow to check which production phases are offshored in the different industries. But the disadvantage leading to fragment production internationally could come from factors’ price differences as well as from productivity gaps. If the pattern of offshoring has not the same factor intensity across production phases and industries (e.g. not all production phases which are located offshore are intensive in unskilled labor), offshoring might very well affect factors differently in different industries.
5. Conclusions Considering the evidence of the last few years, Italy shows like most other countries a general increasing trend in the white/blue collar ratio employed in manufacturing industries, as well as remarkable increase in the use of offshoring in its manufacturing sectors. The relationship between the two phenomena is not straight-forward. The increase in international outsourcing is occurring especially in some of the more advanced industries.
In Italy, two industries in particular display a very high and growing outsourcing index, both in narrow and in broad terms, as well as in terms of service outsourcing: chemical products and communication and telecommunication equipment. These are not particularly labor-intensive industries and they are ranked high in terms of their employment ratio of white and blue collars. These industries are characterized by the presence of a large number of large firms and multinational enterprises.
Given these “stylized facts”, it is not surprising that in Italy the relationship between offshoring and changes in the labor market appears weak in our regressions. It seems in fact that offshoring in Italy is pushed only to a limited extent by the search of low-cost blue collars. Offshoring is more related to the integration of industries in the international production networks for some advanced goods, where Italy does not have a comparative 23 For Italy, there is a negative simultaneous correlation between our offshoring indices and all available measures of productivity at the industry level.
18

advantage, and it needs to obtain from abroad many components. Our analysis underlines the importance to take into account industries’ heterogeneity and the possibility of offshoring production phases with different factors’ intensities.
Overall, this change in the organization of production does not seem to have affected dramatically the Italian labor market. While the general increase in the employment of skilled labor is expected to continue and it can be enhanced in some sectors by the internationalization choices of firms, as some of our results show, in Italy offshoring is not the main reason behind the slow changes we observe in the labor market.
19

Appendix Data and sources
The empirical analysis in this paper was undertaken on 23 manufacturing sectors classified according to the classification ATECO 91 – NACE rev.1
The industry codes and definitions are the following:
15 Manufacture of food and beverages 16 Manufacture of tobacco 17 Manufacture of textiles 18 Manufacture of wearing apparel; dressing and dyeing of fur 19 Tanning and dressing of leather; manufacture of luggage, handbags, saddlery, harness
and footwear 20 Manufacture of wood and of products of wood and cork, except furniture; manufacture
of articles of straw and plaiting materials 21 Manufacture of paper and paper products 22 Publishing, printing and reproduction of recorded media 23 Manufacture of coke, refined petroleum products and nuclear fuel 24 Manufacture of chemicals and chemical products 25 Manufacture of rubber and plastic products 26 Manufacture of other non-metallic mineral products 27 Manufacture of basic metals 28 Manufacture of fabricated metal products, except machinery and equipment 29 Manufacture of machinery and equipment, nec (not elsewhere classified) 30 Manufacture of office, accounting and computing machinery 31 Manufacture of electrical machinery and apparatus, nec 32 Manufacture of radio, television and communication equipment and apparatus 33 Manufacture of medical, precision and optical instruments, watches and clocks 34 Manufacture of motor vehicles, trailers and semi-trailers 35 Manufacture of other transport equipment 36 Manufacture of furniture; manufacturing, nec 37 Treatment and preparation for recycling Variables’ definition and sources: Outsourcing index (O): ( ) it
K
k iktit IIMOFF ∑ ==
1
where Mikt are imports of intermediate input (service) k by industry i at time t, whereas IIit is total usage of intermediate inputs. Source: ISTAT, Conti nazionali: il nuovo sistema input-output, 1995-2003, released on October 2006.
20

Skill intensity (S): computed as the ratio of the number of managers and employees over
the number of workers, apprentices and home workers for each manufacturing sector. Source: ISTAT, Conti Economici delle Imprese, various years.
Capital (K): gross fixed capital formation by sector at current prices. Source: OECD, STAN Database for Industrial Analysis.
Production (Y): production (gross output) by sector at current prices. Source: OECD, STAN Database for Industrial Analysis.
R&D intensity (RD): ratio of the R&D expenditures by sector relative to production at current prices. Source: OECD, STAN Database for Industrial Analysis.
Imports (Imp): imports of goods by sector at current prices. Source: OECD, STAN Database for Industrial Analysis.
Exports (Exp): exports of goods by sector at current prices. Source: OECD, STAN Database for Industrial Analysis.
FDI intensity (FDIin and FDIout): the share of employment in domestic affiliates of foreign MNEs (inward FDI) on total employment, and the share of employment in foreign affiliates of domestic MNEs (outward FDI) on total employment in a given sector. Source: Reprint database, Politecnico di Milano and ICE.
21

References Amiti M. & Wei S. (2005), Fear of Outsourcing: Is it Justified? Economic Policy, April,
308-348.
Antonietti R. & Antonioli D (2008), The impact of production offshoring on the skill composition of manufacturing firms: Evidence from Italy, Università di Bologna, mimeo.
Antràs P. & Helpman E. (2006), Contractual frictions and global sourcing, NBER Working Paper 12747, December.
Berman, E., Bound, J., & Griliches, Z. (1994). Changes in the demand for skilled labor within U.S. manufacturing: evidence from the annual survey of manufacturers. Quarterly Journal of Economics, 109(2), 367-397.
Bertoli S. (2008), The impact of material offshoring on employment in the Italian manufacturing industries: The relevance of intersectoral effects.
Brenton, P., & Pinna, A.M. (2001). The declining use of unskilled labor in Italian manufacturing: is trade to blame? CEPS Working Document No.178.
Broccolini C., Lo Turco A., Presbitero A. & Staffolani S. (2008), Indivudual earnings, International Outsourcing and technological Change. Evidence from Italy, Centro Studi Luca d’Agliano, Development Studies Working Paper No. 242, April.
Brown, R., & Christensen, L. (1981). Estimating elasticities of substitution in a model of partial static equilibrium: an application to US agriculture 1947 to 1974. In Berndt, E., & Fiel, B. (Eds.), Modeling and measuring natural resource substitution. Cambridge, MA: MIT Press.
Bruno G., Dessy O., Falzoni A., & Helg R. (2008), “Estimating Skills in the Italian Manufacturing Sector using the INPS Archives: An application to the Italian pattern of trade”, mimeo.
Costa S. and Ferri G. (2007), The determinants and employment effects of international outsourcing: the case of Italy, SERIES Working Paper No. 16.
Crinò R. (2007), “Offshoring, Multinationals and Labor Market: A Review of the Empirical Literature”, CESPRI-Bocconi University W.P. No.196.
Daveri F., and Iona-Lasinio C. (2008), Offshoring and productivity growth in the Italian manufacturing industries, CESifo working paper No. 2288, April.
Deardorff A.V. (2001), Fragmentation across cones. In Arndt, S.W., & Kierzkowski, H. (Eds.), Fragmentation. New production patterns in the world economy , 35-51). Oxford: Oxford University Press.
Deardorff A.V. (2005), A trade theorist’s take on skilled labor outsourcing. International Review of Economics and Finance 14, 259-271.
22

De Benedictis L. (2005), Three decades of Italian comparative advantages. The World Economy 28 (11), 1679-1709.
Dluhosch B. (2006), Intraindustry trade and the gains from fragmentation, North American Journal of Economics and Finance, 17, 49-64.
Egger, H., & Egger, P. (2001). Cross-border sourcing and outward processing in EU manufacturing. North American Journal of Economics and Finance, 12, 243-256.
Feenstra R.C. (2004) Advanced International Trade. Theory and evidence. Princeton University Press, Princeton.
Feenstra, R.C. & Hanson, G.H. (2001). Global production sharing and rising inequality: a survey on trade and wages. NBER Working Paper No. 8372.
Geishecker I. & Gorg H. (2005). Do unskilled workers always lose from fragmentation? North American Journal of Economics and Finance, 16, 81-92.
Giovannetti G. & Quintieri B. (2007). Globalizzazione, specializzazione produttiva e mercato del lavoro. Working paper Fondazione Masi.
Grossman G. M. & Rossi-Hansberg E. (2006a). Trading Tasks: A Simple Theory of Offshoring,"NBER Working Papers 12721
Grossman G. M. & Rossi-Hansberg E. (2006b). The rise of offshoring: it's not wine for cloth anymore, Proceedings, Federal Reserve Bank of Kansas City, 59-102.
Havik K. & Mc Morrow K. (2006). Global trade integration and outsourcing : how well is the EU coping with the new challenges?. European Economy Economic paper no. 259, European Commission, DG for Economic and Financial Affairs.
Helg R. & Tajoli L. (2005). Patterns of international fragmentation of production and the relative demand for labor. North American Journal of Economics and Finance, 16, 233–254
Hijzen A. (2005), A Bird’s Eye View of International Outsourcing: Data, Measurement and Labor Demand Effects, Economie Internationale, CEPII research center, issue 4Q, 45-63.
Hijzen A. & Swaim P. (2007) Does offshoring reduce industry employment? National Institute Economic Review, 201, 86-96.
Horgos D. (2007), “Labor market effects of international outsourcing: How measurement matters”, Discussion Paper No. 62, Department of Economics, Helmut Schmidt University, Hamburg.
IMF (2007), World Economic Outlook, April.
Kohler W. (2008), Offshoring: Why do stories differ?, CESifo Working Paper no. 2231
Manasse P., Stanca L. & Turrini A. (2004), Wage premia and skill upgrading in Italy: why didn’t the hound bark? Labour Economics, 11, 1, 59-83.
23

24
OECD (2007), Offshoring and Employment. Trends and impacts, Paris.
Strauss-Kahn, V. (2004). The role of globalization in the within-industry shift away from unskilled workers in France. In Baldwin, R.E., & Winters, L.A. (Eds.), Challenges to globalization. NBER and University of Chicago Press.
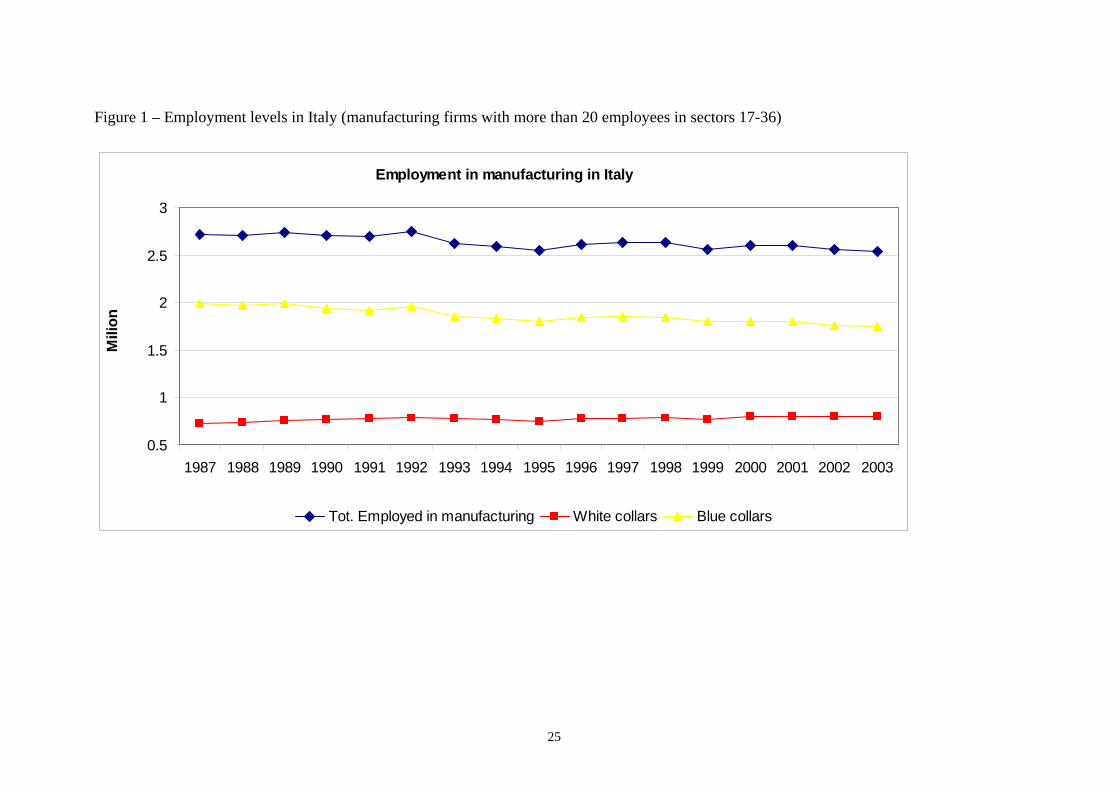
Figure 1 – Employment levels in Italy (manufacturing firms with more than 20 employees in sectors 17-36)
Employment in manufacturing in Italy
0.5
1
1.5
2
2.5
3
1987 1988 1989 1990 1991 1992 1993 1994 1995 1996 1997 1998 1999 2000 2001 2002 2003
Mili
on
Tot. Employed in manufacturing White collars Blue collars
25

Ratio of white/blue collars in italian manufacturing
0.35
0.37
0.39
0.41
0.43
0.45
0.47
0.49
1987 1988 1989 1990 1991 1992 1993 1994 1995 1996 1997 1998 1999 2000 2001 2002 2003
Skilled/Unskilled ratio
Figure 2 – Employment composition in Italy (manufacturing firms with more than 20 employees in sectors 17-36 )
26

Figure 3 – White/blue collars ratio in Italian manufacturing sectors (firms with more than 20 employees)
Manufacture of textiles
0,2
0,22
0,24
0,26
0,28
0,3
0,32
1987 1988 1989 1990 1991 1992 1993 1994 1995 1996 1997 1998 1999 2000 2001 2002 2003
Year
Manufacture of wearing apparel; dressing
0,1
0,15
0,2
0,25
0,3
0,35
0,4
1987 1988 1989 1990 1991 1992 1993 1994 1995 1996 1997 1998 1999 2000 2001 2002 2003
Year
Tanning, dressing of leather; manufacture of luggage
0
0,05
0,1
0,15
0,2
0,25
1987 1988 1989 1990 1991 1992 1993 1994 1995 1996 1997 1998 1999 2000 2001 2002 2003
Year
Manufacture of wood and of products of wood and cork, except furniture; manufacture of articles of straw and plaiting materials
0,150,160,170,180,190,2
0,210,220,230,24
1987 1988 1989 1990 1991 1992 1993 1994 1995 1996 1997 1998 1999 2000 2001 2002 2003
Year
Manufacture of pulp, paper and paper products
0,25
0,26
0,27
0,28
0,29
0,3
0,31
0,32
0,33
0,34
1987 1988 1989 1990 1991 1992 1993 1994 1995 1996 1997 1998 1999 2000 2001 2002 2003
Year
Publishing, printing, reproduction of recorded media
0,6
0,65
0,7
0,75
0,8
0,85
0,9
0,95
1
1987 1988 1989 1990 1991 1992 1993 1994 1995 1996 1997 1998 1999 2000 2001 2002 2003
Year
Manufacture of coke, refined petroleum products and nuclear fuel
0,80,9
11,11,21,3
1,41,51,61,71,8
1987 1988 1989 1990 1991 1992 1993 1994 1995 1996 1997 1998 1999 2000 2001 2002 2003
Year
Manufacture of chemicals and chemical products
0,8
0,9
1
1,1
1,2
1,3
1,4
1,5
1,6
1987 1988 1989 1990 1991 1992 1993 1994 1995 1996 1997 1998 1999 2000 2001 2002 2003
Year
Manufacture of rubber and plastic products
0,250,260,270,280,290,3
0,310,320,330,340,35
1987 1988 1989 1990 1991 1992 1993 1994 1995 1996 1997 1998 1999 2000 2001 2002 2003
Year
Manufacture of other non-metallic mineral products
0,2
0,22
0,24
0,26
0,28
0,3
0,32
0,34
0,36
0,38
1987 1988 1989 1990 1991 1992 1993 1994 1995 1996 1997 1998 1999 2000 2001 2002 2003
Year
27
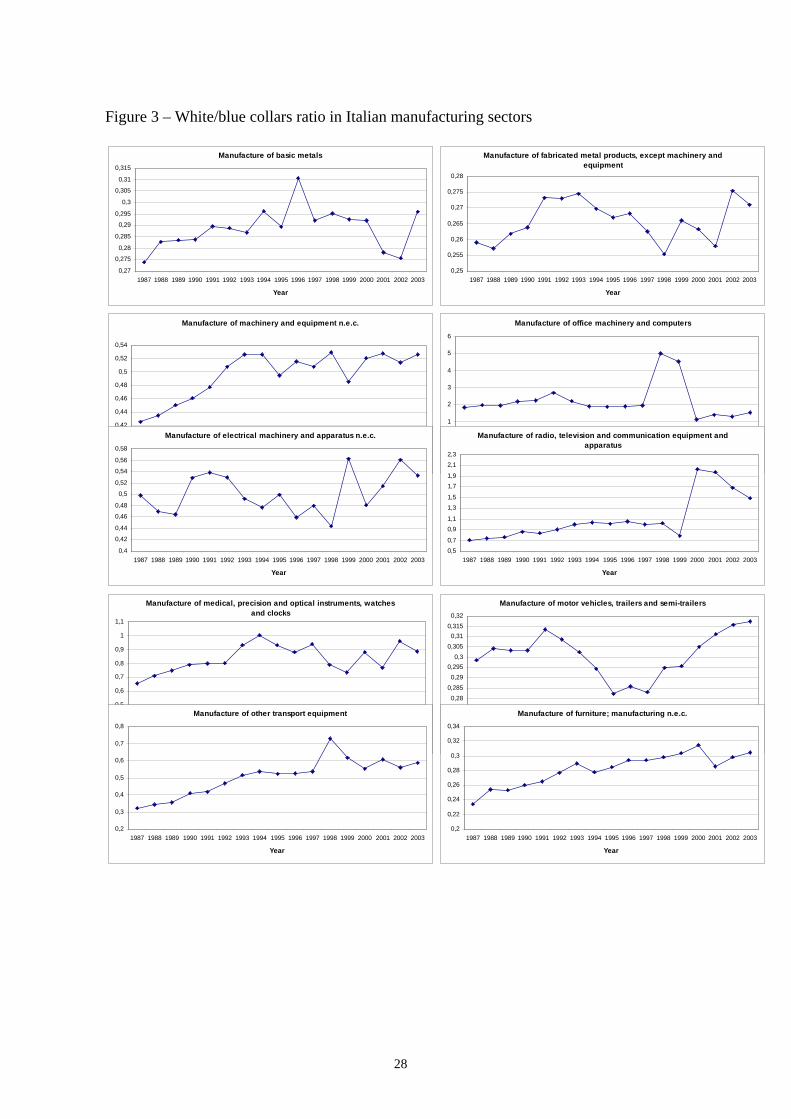
Figure 3 – White/blue collars ratio in Italian manufacturing sectors
Manufacture of basic metals
0,27
0,275
0,28
0,285
0,29
0,295
0,3
0,305
0,31
0,315
1987 1988 1989 1990 1991 1992 1993 1994 1995 1996 1997 1998 1999 2000 2001 2002 2003
Year
Manufacture of fabricated metal products, except machinery and equipment
0,25
0,255
0,26
0,265
0,27
0,275
0,28
1987 1988 1989 1990 1991 1992 1993 1994 1995 1996 1997 1998 1999 2000 2001 2002 2003
Year
Manufacture of machinery and equipment n.e.c.
0,4
0,42
0,44
0,46
0,48
0,5
0,52
0,54
1987 1988 1989 1990 1991 1992 1993 1994 1995 1996 1997 1998 1999 2000 2001 2002 2003
Year
Manufacture of office machinery and computers
0
1
2
3
4
5
6
1987 1988 1989 1990 1991 1992 1993 1994 1995 1996 1997 1998 1999 2000 2001 2002 2003
Year
Manufacture of electrical machinery and apparatus n.e.c.
0,4
0,42
0,44
0,46
0,48
0,5
0,52
0,54
0,56
0,58
1987 1988 1989 1990 1991 1992 1993 1994 1995 1996 1997 1998 1999 2000 2001 2002 2003
Year
Manufacture of radio, television and communication equipment and apparatus
0,50,7
0,91,1
1,31,5
1,71,9
2,12,3
1987 1988 1989 1990 1991 1992 1993 1994 1995 1996 1997 1998 1999 2000 2001 2002 2003
Year
Manufacture of medical, precision and optical instruments, watches and clocks
0,4
0,5
0,6
0,7
0,8
0,9
1
1,1
1987 1988 1989 1990 1991 1992 1993 1994 1995 1996 1997 1998 1999 2000 2001 2002 2003
Year
Manufacture of motor vehicles, trailers and semi-trailers
0,270,2750,28
0,2850,29
0,2950,3
0,3050,31
0,3150,32
1987 1988 1989 1990 1991 1992 1993 1994 1995 1996 1997 1998 1999 2000 2001 2002 2003
Year
Manufacture of other transport equipment
0,2
0,3
0,4
0,5
0,6
0,7
0,8
1987 1988 1989 1990 1991 1992 1993 1994 1995 1996 1997 1998 1999 2000 2001 2002 2003
Year
Manufacture of furniture; manufacturing n.e.c.
0,2
0,22
0,24
0,26
0,28
0,3
0,32
0,34
1987 1988 1989 1990 1991 1992 1993 1994 1995 1996 1997 1998 1999 2000 2001 2002 2003
Year
28
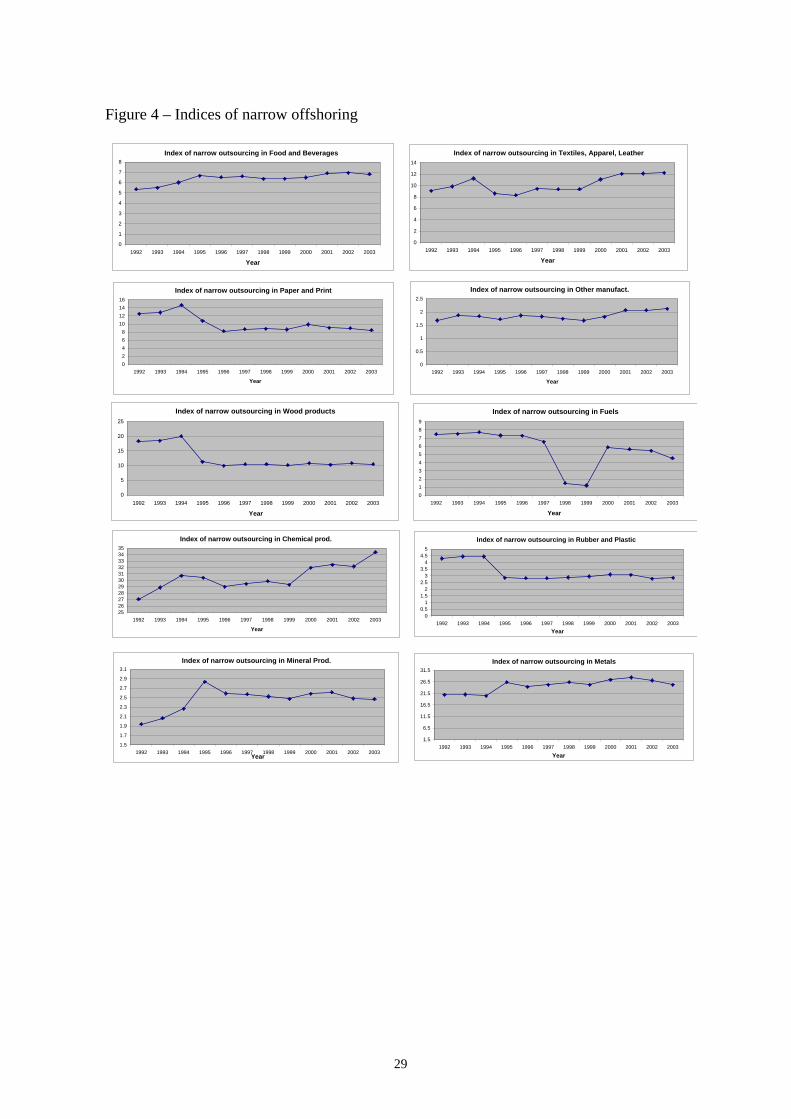
Figure 4 – Indices of narrow offshoring
Index of narrow outsourcing in Food and Beverages
0
1
2
3
4
5
6
7
8
1992 1993 1994 1995 1996 1997 1998 1999 2000 2001 2002 2003
Year
Index of narrow outsourcing in Textiles, Apparel, Leather
0
2
4
6
8
10
12
14
1992 1993 1994 1995 1996 1997 1998 1999 2000 2001 2002 2003
Year
Index of narrow outsourcing in Paper and Print
02468
10121416
1992 1993 1994 1995 1996 1997 1998 1999 2000 2001 2002 2003
Year
Index of narrow outsourcing in Other manufact.
0
0.5
1
1.5
2
2.5
1992 1993 1994 1995 1996 1997 1998 1999 2000 2001 2002 2003
Year
Index of narrow outsourcing in Wood products
0
5
10
15
20
25
1992 1993 1994 1995 1996 1997 1998 1999 2000 2001 2002 2003
Year
Index of narrow outsourcing in Fuels
0123456789
1992 1993 1994 1995 1996 1997 1998 1999 2000 2001 2002 2003
Year
Index of narrow outsourcing in Chemical prod.
2526272829303132333435
1992 1993 1994 1995 1996 1997 1998 1999 2000 2001 2002 2003
Year
Index of narrow outsourcing in Rubber and Plastic
00.5
11.5
22.5
33.5
44.5
5
1992 1993 1994 1995 1996 1997 1998 1999 2000 2001 2002 2003Year
Index of narrow outsourcing in Mineral Prod.
1.5
1.7
1.9
2.1
2.3
2.5
2.7
2.9
3.1
1992 1993 1994 1995 1996 1997 1998 1999 2000 2001 2002 2003Year
Index of narrow outsourcing in Metals
1.5
6.5
11.5
16.5
21.5
26.5
31.5
1992 1993 1994 1995 1996 1997 1998 1999 2000 2001 2002 2003
Year
29

Figure 4 – Indices of narrow offshoring
Index of narrow outsourcing in Metal Prod.
0
0.2
0.4
0.6
0.8
1
1.2
1.4
1992 1993 1994 1995 1996 1997 1998 1999 2000 2001 2002 2003
Year
Index of narrow outsourcing in Machinery
0123456789
10
1992 1993 1994 1995 1996 1997 1998 1999 2000 2001 2002 2003
Year
Index of narrow outsourcing in Office Machinery
0
5
10
15
20
25
30
35
1992 1993 1994 1995 1996 1997 1998 1999 2000 2001 2002 2003
Year
Index of narrow outsourcing in Electric Machinery
0
2
4
6
8
10
12
1992 1993 1994 1995 1996 1997 1998 1999 2000 2001 2002 2003
Year
Index of narrow outsourcing in Communic. Equip.
0
5
10
15
20
25
30
35
1992 1993 1994 1995 1996 1997 1998 1999 2000 2001 2002 2003
Year
Index of narrow outsourcing in Precision Instrum.
0
2
4
6
8
10
12
14
1992 1993 1994 1995 1996 1997 1998 1999 2000 2001 2002 2003Year
Index of narrow outsourcing in Motor Vehicles
02468
10121416
1992 1993 1994 1995 1996 1997 1998 1999 2000 2001 2002 2003
Year
Index of narrow outsourcing in Transport. Equip.
0
5
10
15
20
25
1992 1993 1994 1995 1996 1997 1998 1999 2000 2001 2002 2003Year
30

Figure 5 – Indices of broad offshoring
Broad International outsourcing index for skill-intensive sectors
0
10
20
30
40
50
60
70
80
1992 1993 1994 1995 1996 1997 1998 1999 2000 2001 2002 2003
Year
PapPrintFuelChemMachinOfficeMachinElectMachComEquipPreInstTranspo
Broad International outsourcing index for unskill-intensive sectors
0
5
10
15
20
25
30
35
1992 1993 1994 1995 1996 1997 1998 1999 2000 2001 2002 2003
Year
FoodBeveTexAppLathWood prodRubPlasMinProdMetalsMetalsPrMotorVehOthManuf
31
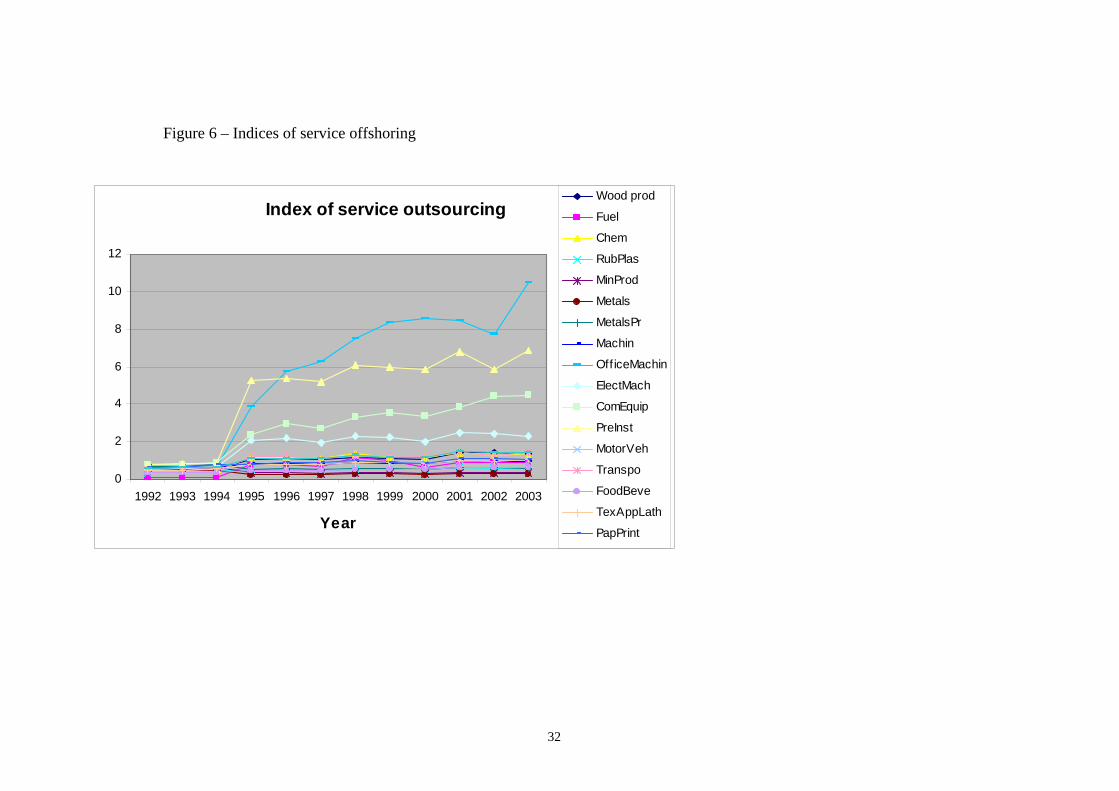
Figure 6 – Indices of service offshoring
Index of service outsourcing
0
2
4
6
8
10
12
1992 1993 1994 1995 1996 1997 1998 1999 2000 2001 2002 2003
Year
Wood prod
Fuel
Chem
RubPlas
MinProd
Metals
MetalsPr
Machin
Off iceMachin
ElectMach
ComEquip
PreInst
MotorVeh
Transpo
FoodBeve
TexAppLath
PapPrint
32