Does Management Matter in schools? - Harvard Business School · DOES MANAGEMENT MATTER IN SCHOOLS?...
28
DOES MANAGEMENT MATTER IN SCHOOLS? Nicholas Bloom, Renata Lemos, Raffaella Sadun and John Van Reenen We collect data on management practices in over 1,800 high schools in eight countries. We show that higher management quality is strongly associated with better educational outcomes. The UK, Sweden, Canada and the US obtain the highest management scores, followed by Germany, with a gap before Italy, Brazil and India. We also show that autonomous government schools (government funded but with substantial independence like UK academies and US charters) have higher management scores than regular government or private schools. Almost half of the difference between the management scores of autonomous and regular government schools is accounted for principal leadership and governance. There are major disparities in the quality of education within and between countries (OECD, 2012). School managerial practices may be an important reason for such differences. Unfortunately, understanding the role of management in schools within and across countries has been held back by a lack of robust and comparable instruments to systematically measure management practices and, thus, a lack of good data. The key purpose of this article is to develop an international management index for schools and present descriptive evidence on management quality and education outcomes across schools of different types within and across countries. We used double-blind telephone interviews with school principals to collect information on management practices for over 1,800 schools across eight countries. To construct our management index, we average across 20 basic management practice measures in four areas of management: operations, monitoring, target setting and people. Each question is evaluated against a scoring grid that ranges from one (‘worst practice’) to five (‘best practice’). Our management index for each school represents the average of these scores. We also constructed measures of school-level pupil outcomes for these schools (when data were available) from examination results across regions and countries, creating a matched management-pupil outcome international data set at the school level. These data allow us to document some stylised facts. First, we show that the adoption of basic managerial practices varies significantly across and within countries. The UK, Sweden, Canada and the US obtain the highest average scores, followed by Germany, Italy and Brazil, while India has the lowest scores. About half of the variance in school management is at the country-level. This share is larger in education than we have * Corresponding author: Nicholas Bloom, 579 Serra Mall, Stanford, CA 94305, USA. Email: nbloom@stan- ford.edu. We thank the ESRC, the IGC and the Ita u Social Foundation for financial support through the Centre for Economic Performance. Frederic Vermeulen, two anonymous referees, Roland Fryer, Gary Chamberlain, Caroline Hoxby, Will Dobbie, Steve Machin, Sandra McNally, Martina Viarengo and participants at seminars in the AEA, Harvard, the Royal Economic Society Conference and Stanford have all given helpful comments. Our partnership with Daniela Scur has been particularly important during this project. Matilde Gawronski and Kalpesh Patil have provided excellent research assistance. [ 647 ] The Economic Journal, 125 (May), 647–674. Doi: 10.1111/ecoj.12267 © 2015 Royal Economic Society. Published by John Wiley & Sons, 9600 Garsington Road, Oxford OX4 2DQ, UK and 350 Main Street, Malden, MA 02148, USA.
Transcript of Does Management Matter in schools? - Harvard Business School · DOES MANAGEMENT MATTER IN SCHOOLS?...

DOES MANAGEMENT MATTER IN SCHOOLS?
Nicholas Bloom, Renata Lemos, Raffaella Sadun and John Van Reenen
We collect data on management practices in over 1,800 high schools in eight countries. We show thathigher management quality is strongly associated with better educational outcomes. The UK,Sweden, Canada and the US obtain the highest management scores, followed by Germany, with a gapbefore Italy, Brazil and India. We also show that autonomous government schools (governmentfunded but with substantial independence like UK academies and US charters) have highermanagement scores than regular government or private schools. Almost half of the differencebetween the management scores of autonomous and regular government schools is accounted forprincipal leadership and governance.
There are major disparities in the quality of education within and between countries(OECD, 2012). School managerial practices may be an important reason for suchdifferences. Unfortunately, understanding the role of management in schools withinand across countries has been held back by a lack of robust and comparable instrumentsto systematically measure management practices and, thus, a lack of good data.
The key purpose of this article is to develop an international management index forschools and present descriptive evidence on management quality and educationoutcomes across schools of different types within and across countries. We useddouble-blind telephone interviews with school principals to collect information onmanagement practices for over 1,800 schools across eight countries. To construct ourmanagement index, we average across 20 basic management practice measures in fourareas of management: operations, monitoring, target setting and people. Eachquestion is evaluated against a scoring grid that ranges from one (‘worst practice’) tofive (‘best practice’). Our management index for each school represents the average ofthese scores.
We also constructed measures of school-level pupil outcomes for these schools(when data were available) from examination results across regions and countries,creating a matched management-pupil outcome international data set at the schoollevel.
These data allow us to document some stylised facts. First, we show that the adoptionof basic managerial practices varies significantly across and within countries. The UK,Sweden, Canada and the US obtain the highest average scores, followed by Germany,Italy and Brazil, while India has the lowest scores. About half of the variance in schoolmanagement is at the country-level. This share is larger in education than we have
* Corresponding author: Nicholas Bloom, 579 Serra Mall, Stanford, CA 94305, USA. Email: [email protected].
We thank the ESRC, the IGC and the Ita�u Social Foundation for financial support through the Centre forEconomic Performance. Frederic Vermeulen, two anonymous referees, Roland Fryer, Gary Chamberlain,Caroline Hoxby, Will Dobbie, Steve Machin, Sandra McNally, Martina Viarengo and participants at seminarsin the AEA, Harvard, the Royal Economic Society Conference and Stanford have all given helpful comments.Our partnership with Daniela Scur has been particularly important during this project. Matilde Gawronskiand Kalpesh Patil have provided excellent research assistance.
[ 647 ]
The Economic Journal, 125 (May), 647–674.Doi: 10.1111/ecoj.12267© 2015Royal Economic Society. Published by JohnWiley & Sons, 9600 Garsington
Road, Oxford OX4 2DQ, UK and 350 Main Street, Malden, MA 02148, USA.

found from similar surveys in other sectors such as manufacturing, where most of thevariation is within countries. This finding suggests that differences in the institutionalenvironment have particularly important effects on the way schools are managed.
Second, higher management scores are positively correlated with better pupiloutcomes. More specifically, we find that a one standard deviation (SD) increase in ourmanagerial index is associated with an increase in pupil outcomes of between 0.2 and0.4 SDs. Although the cross-sectional nature of the data does not allow us to determinewhether this correlation is causal (e.g. unobservable differences across schools mightdrive both pupil outcomes and management quality), the result does suggest that ourmanagement data have some useful informational content.
Third, large disparities in management also exist within countries and regions,especially across types of schools. In particular, autonomous government schools –organisations that are publicly funded but are more decentralised from governmentcontrol, like charter schools in the US and academies in the UK1 – have significantlyhigher management scores than regular government schools and private schools. Thedifference in management of autonomous government schools does not reflectobservable differences in pupil composition, school and regional characteristics, norbasic demographics or principal characteristics such as tenure and gender. It does,however, seem more closely linked to two features:
(i) the strength of governance, i.e. having strong accountability for pupilperformance to an outside body; and
(ii) the degree of school leadership, i.e. developing a long-term strategy for theschool.
Including these governance and leadership variables more than halves the managerialgap between autonomous government schools and other schools (although the gapremains significant).
Previous efforts to survey school practices support our main findings. For example,Dobbie and Fryer (2013) and Angrist et al. (2013) have collected extensive measures ofschool practices, focusing on a smaller sample of US schools. Dobbie and Fryer (2013)report in a sample of 39 New York charter schools that management practices similarto those we measure – in particular teacher feedback, data guided instruction and highexpectations – are associated with substantially higher grades. Angrist et al. (2013)survey a sample of 36 Massachusetts charter schools and link the impact of urbancharter schools2 to practices such as instructional time, classroom technique andschool philosophy – labelled the ‘No Excuses’ approach. Intriguingly both papers alsofind little or no impact of schools inputs – class size, per-pupil expenditure or teachertraining – on pupil performance, a result shared with Hanushek and Woessmann(2010) on a cross-country basis.
1 We define autonomous government schools as schools receiving at least partial funding from thegovernment and with at least limited autonomy to follow school-specific charters in one of three areas:establishing the curriculum content, selecting teachers and admitting pupils. In our data, these are escolas dereferencia in Brazil, separate schools in Canada, private ersatzschulen in Germany, private-aided schools inIndia, friskolor in Sweden, academies, foundation and voluntary-aided schools in the UK (equivalent toautonomous state schools), and charter and magnet schools in the US. See Table 1 for more details.
2 The authors find more mixed results for the non-urban charter schools.
© 2015 Royal Economic Society.
648 TH E E CONOM I C J O U RN A L [ M A Y
In our data collection efforts, we focus on a set of basic management practices, whichwe have shown to matter across other sectors (see the survey of this work in Bloomet al., 2014). The school data are less rich and do not have the compellingexperimental design of the New York and Massachusetts data, however, we have amuch larger sample of schools and an international dimension. Our results extendthe current literature by highlighting the variance of management quality inschools within and across countries; showing the relatively low management qualityin schools compared to other sectors; and the link between management and link topupil outcomes and autonomy levels across countries.
This article also contributes to several literatures. First, we link to work on the role ofinstitutions for school performance, focusing in particular on their implications formanagement practices. Many recent contributions (e.g. from the OECD’s PISAstudies) have also looked at this through the lens of autonomy, centralisedmonitoring, school choice, teacher incentives and instructional time (Woessmann,2005, 2010; Fuchs and Woessmann, 2007; Woessmann et al., 2007; Hanushek andWoessmann, 2010; Lavy, 2010; Hanushek et al., 2013). Second, there is a burgeoningnumber of studies on alternative types of school governance and management onpupil outcomes. These studies have focused on autonomous government schools, suchas US urban charter schools.3 Third, through the analysis of principal-specificcharacteristics we relate to the agenda investigating the effect of school leadership(Clark et al., 2009; Horng et al., 2010; Dhuey and Smith 2011; Grissom and Loeb 2011;Branch et al., 2012; B�eteille et al., 2012; Coelli and Green 2012). Finally and moregenerally, we contribute to the emerging literature investigating managementpractices in public sector institutions (Rasul and Rogger 2013; McCormack et al.,2014; Bloom et al., 2015).
The remainder of this article is organised as follows: Section 1 describes the data andmethodology we use to measure management practices across schools. Section 2provides a basic description of the differences in school management across and withincountries. Section 3 investigates the relationship between school management prac-tices and pupil outcomes. Section 4 explores the factors linked to the variation inmanagement practices across countries, examining the role of school ownership andgovernance within countries. Section 5 concludes.
1. Data
1.1. Measuring Management Practices in Education
To measure management practices in schools, we adapted a survey methodologydescribed in Bloom and Van Reenen (2007), previously employed in themanufacturing, retail and health care sectors. The survey investigates the adoption
3 For examples of studies looking at US urban charter schools see Hoxby and Murarka (2009),Abdulkadiroglu et al. (2011), Angrist et al. (2011, 2013), Dobbie and Fryer (2011, 2013), Fryer (2014), Curtoand Fryer (2014). Other studies looking at US rural charter schools include Angrist et al. (2011), UKacademies include Clark et al. (2009), Machin and Vernoit (2011) and Eyles and Machin (2014). Swedishfriskolor include Sahlgren (2011) and B€ohlmark and Lindahl (2012) and Canadian separate schools includeCard et al. (2010).
© 2015 Royal Economic Society.
2015] DO E S M AN AG EM EN T MA T T E R F O R S CHOO L S ? 649

of 20 basic management practices, where the level of adoption is evaluated against agrid from one to five.4 A high score indicates that a school adopts structuredmanagement practices. Our main measure of management practices represents theaverage of the scores across all 20 questions. To ensure comparability across sectors,we retained most of the questions included in our previous studies of organisationsin other sectors, with modifications to reflect the school context (the full list ofquestions can be found in online Appendix Table A1).5 We interviewed theprincipal/head teacher in each school. We measure four broad areas of manage-ment.
1.1.1. OperationsStandardisation of instructional planning processes : school uses meaningful processesthat allow pupils to learn over time.Personalisation of instruction and learning : school incorporates teaching methods thatensure all pupils can master the learning objectives.Data-driven planning and pupil transitions : school uses assessment and easily availabledata to verify learning outcomes at critical stages.Adopting educational best practices: school incorporates and shares teaching bestpractices and pupil strategies across classrooms accordingly.
1.1.2. MonitoringContinuous improvement : school implements processes towards continuous improve-ment and encourages lessons to be captured and documented.Performance tracking : school performance is regularly tracked with useful metrics.Performance review : school performance is reviewed with appropriate metrics.Performance dialogue : school performance is discussed with appropriate content,depth and communicated to teachers.Consequence management : mechanisms exist to follow-up on performance issues.
1.1.3. Target settingTarget balance : school covers a sufficiently broad set of targets at the school,department and individual levels.Target interconnection : school establishes well-aligned targets across all levels.Time horizon of targets : there is a rational approach to planning and setting targets.Target stretch: school sets targets with the appropriate level of difficulty.Clarity and comparability of targets : school sets understandable targets and openlycommunicates and compares school, department and individual performance.
4 In the earlier manufacturing-focused survey wave, we carried out an extensive evaluation of thisapproach, including comparing telephone interviews with face-to-face visits, running management exper-iments on firms and resurveying 5% of the sample with different interviewers and managers at the same firm.In all cases, we found strong evidence that our telephone surveys were providing a good proxy of firmmanagement practices – see Bloom et al. (2012) for details.
5 Sixteen of these 20 basic practices are considered to be relevant and applicable across all industriespreviously surveyed (e.g. performance-based promotion), while the remaining four are specific to themanagement of schools (e.g. lesson planning).
© 2015 Royal Economic Society.
650 TH E E CONOM I C J O U RN A L [ M A Y
1.1.4. People management 6
Rewarding high performers : school implements a systematic approach to identifyinggood and bad performance, rewarding teachers proportionately.Fixing poor performers : school deals with underperformers promptly.Promoting high performers : school promotes employees based on job performance.Managing talent : school nurtures and develops teaching and leadership talent.Retaining talent : school attempts to retain employees with high performance.Creating a distinctive employee value proposition : school has a thought-through approachto attract employees.
1.2. Obtaining School Surveys Across Countries
We randomly sampled schools that offered education to 15-year olds and had at least50 pupils. These schools are large enough that the type of systematic managementpractices we study here are likely to matter.7 We used a variety of procedures to removepotential sources of bias from our estimates. First, we monitored interviewers’performance in contacting schools and scheduling interviews. The interviewers ran onaverage two interviews a day lasting approximately an hour each and spent theremainder of their time repeatedly contacting principals to schedule interviews.Second, we presented the study as a confidential conversation about managementexperiences, starting with non-controversial questions such as ‘What is your school’splan for the next five years?’ and ‘What tools and resources are provided to teachers?’Third, we never asked principals about the school’s overall pupil performance duringthe interview. Instead, we obtained such data from other sources, which were usuallyfrom administrative information (described in online Appendix A). Fourth, we sentinformational letters and copies of endorsements letters from respected institutions,such as the UK Department for Education, Harvard University’s Program on EducationPolicy and Governance and Brazil’s Ita�u Social Foundation.8
In terms of interviews completed, we obtained an overall high response rate (41%on average9), ranging from 58%, 57% and 42% of eligible schools in Brazil, Italy andIndia respectively to 36%, 26%, 20% and 19% of eligible school in Sweden,Germany, the US and Canada. We obtained a substantially lower response rate in theUK – 8% of eligible schools – most likely due to the proliferation of cold-calling andincreasing number of telephone surveys in schools in the UK, and principals’ slowturnaround time for a response after the initial contact by interviewers (which wascommon throughout the North American and European countries surveyed).
The overall response rate of 41% is similar to our previous manufacturing and healthcare surveys. It is also roughly comparable to other management surveys in education
6 These practices are similar to those emphasised in earlier work on management practices, by for exampleIchniowski et al. (1997) and Black and Lynch (2001).
7 In Brazil, Canada, Italy, Germany, US and UK, these schools are part of the upper secondary or highschool education system. In India, these schools are part of the lower secondary education system while inSweden they are still considered primary schools.
8 Despite the common practice of paying organisations to participate in research, we did not providemanagers with financial incentives to participate.
9 Average weighted by the number of interviews in each country.
© 2015 Royal Economic Society.
2015] DO E S M AN AG EM EN T MA T T E R F O R S CHOO L S ? 651

such as 64% response rate of middle and high schools in Massachusetts (Angrist et al.,2013), 57% response rate of UK university departments (McCormack et al., 2014) and39% response rate of New York charter schools (Dobbie and Fryer, 2013).10
When interviewers were able to talk with school principals they usually agreed totake part in the survey. As such, the explicit refusal rate among eligible schools wasgenerally low across all countries surveyed, ranging from 2% in Sweden, 6% in boththe US and Canada, 9% in India, 13% in both Brazil and the UK, 15% in Italy and16% in Germany. In terms of selection bias, we compare our sample of schools forwhich we secured an interview with the sample of eligible schools in each countryagainst size, ownership and location. We obtain few significant co-efficients withmarginal effects small in magnitude. We further construct sampling weights andobserve that our main unweighted results hold even when using alternative sampleweighting schemes. We describe our selection analysis as well as the sampling framesources and response rates in more detail in the online Appendix C.
1.3. Maximising Response Rates and Interview Quality
We also followed several steps to obtain a high-quality response. First, we use a ‘double-blind’ interview technique. That is, at one end, we conducted the telephone surveywithout informing the principals that their answers would be evaluated against ascoring grid. Thus, we gathered information about actual management practices asopposed to the principal’s aspirations of what should (rather than what does) happen.At the other end, our interviewers did not know in advance anything about the school’sperformance. Interviewers were only provided with the school’s name and telephonenumber and had generally not heard of the schools on their lists before, thus, havingno preconceptions about them.
Second, we used open-ended questions – that is, questions which avoid leadingresponders towards a particular answer. For example, on the first performancemonitoring dimension we start by asking the open question ‘What kind of mainindicators do you use to track school performance?’, rather than a closed-endedquestion like ‘Do you use class-room level test scores indicators [yes/no]?’. The firstopen-ended question is followed by further questions like ‘How frequently are theseindicators measured?’, ‘Who gets to see this data?’ and then ‘If I were to walk throughyour school what could I tell about how you are doing against your indicators?’ Thecombined responses to this dimension are scored against a grid which goes from 1 -defined as ‘Measures tracked do not indicate directly if overall objectives are beingmet. Tracking is an ad hoc process (certain processes aren’t tracked at all)’, up to 5 –defined as ‘Performance is continuously tracked and communicated, both formallyand informally, to all staff using a range of visual management tools’. During theirtraining session, the interviewers are also encouraged to ask follow-up questionswhenever necessary.
10 Other establishment survey response rate benchmarks include at the high-end the US Census responserates to the mandatory Management and Organizational Practices Survey at 80% (Bloom et al., 2013), in themid-range the 30% response rate of small firms by Arora et al. (2014), down to the 7% response rate for chieffinancial officers at medium and large firms (Ben-David et al., 2013).
© 2015 Royal Economic Society.
652 TH E E CONOM I C J O U RN A L [ M A Y

Third, we had rigorous interviewer training. We required all interviewers toundergo one week of initial training, including multiple group scoring sessionsto ensure consistency across countries.11 We also required them to conduct and listento at least 25 interviews to correct any inconsistent interpretation of responses. Fourth,we ‘double-scored’ the majority of interviews (69%). That is, we asked the teammanagers, whose main role was monitoring, to listen silently and score the responsesprovided during each interview. After the end of the interview, the team managerdiscussed these scores with the primary interviewer, providing on-going training andcalibration.
Finally, we also collected ‘noise-controls’, that is data on the interview process itself(such as the time of day and the day of the week), characteristics of the interviewee andthe identity of the interviewer. We include these noise controls in the regressionanalysis to improve the precision of our estimates by reducing some of themeasurement error.
1.4. Choosing Countries to Survey
The choice of countries was driven by funding availability, the availability of schoolsampling frames and research and policy interest. We are continuing to roll theseschool management surveys out across countries, for example hoping to extend thisshortly to China, Colombia and Mexico through collaborations with other researchinstitutions.
1.5. Classifying Differences Across School Types
In order to look at management practices across different types of schools, we classifyregular government schools, autonomous government schools and private schoolsbased on two main characteristics: their source of funding and their degree ofautonomy in establishing the curriculum content, selecting teachers and admittingpupils. Regular government schools receive full funding from the government(national or local level) and follow government-wide rules and regulations with littleor no autonomy in these three areas. Private schools receive solely private funding(they may be for-profit or not-for-profit) and follow school-specific charters, having fullautonomy over all three areas mentioned above. Autonomous government schoolsreceive most of their funding from the government but have more autonomy to followschool-specific charters on curriculum, teacher selection and (sometimes) limitedpupil selection.12
11 During these calibration exercises, the whole team listened to both created role-play interviews andactual live interviews (in English) then subsequently compared scores. Any differences in scoring werediscussed to ensure a common interpretation of the scoring grid. These calibration sessions were runintensively at the beginning and then periodically throughout the project (to avoid any interviewers scoringdrifting over time).
12 Pupil selection in autonomous government schools is usually not based on academic ability (althoughwe will analyse this) but rather on other dimensions. For example, UK academies can select up to 10% ofpupils on ‘aptitude’ (such as sporting or musical ability).
© 2015 Royal Economic Society.
2015] DO E S M AN AG EM EN T MA T T E R F O R S CHOO L S ? 653
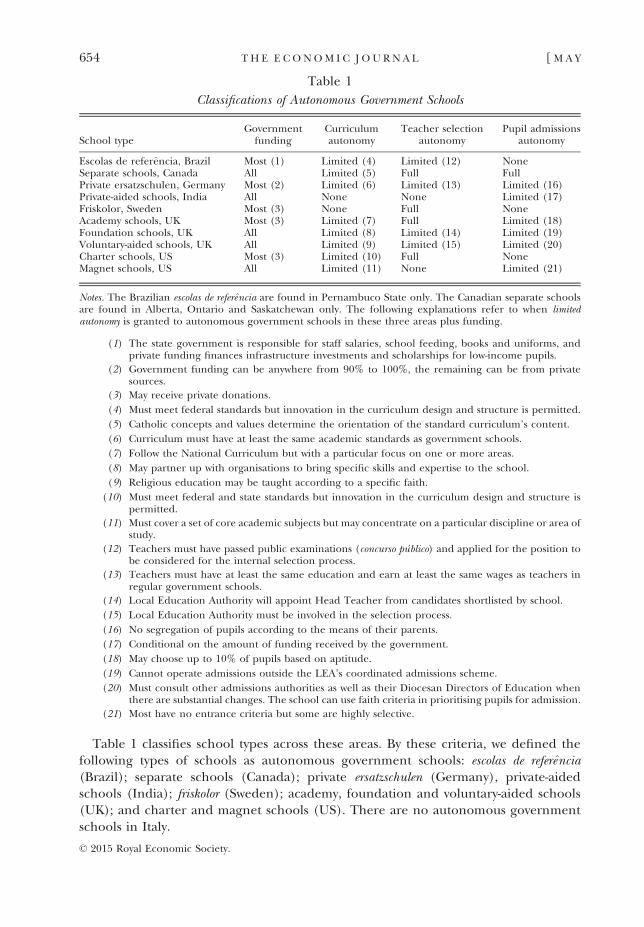
Table 1 classifies school types across these areas. By these criteria, we defined thefollowing types of schools as autonomous government schools: escolas de referencia(Brazil); separate schools (Canada); private ersatzschulen (Germany), private-aidedschools (India); friskolor (Sweden); academy, foundation and voluntary-aided schools(UK); and charter and magnet schools (US). There are no autonomous governmentschools in Italy.
Table 1
Classifications of Autonomous Government Schools
School typeGovernment
fundingCurriculumautonomy
Teacher selectionautonomy
Pupil admissionsautonomy
Escolas de referencia, Brazil Most (1) Limited (4) Limited (12) NoneSeparate schools, Canada All Limited (5) Full FullPrivate ersatzschulen, Germany Most (2) Limited (6) Limited (13) Limited (16)Private-aided schools, India All None None Limited (17)Friskolor, Sweden Most (3) None Full NoneAcademy schools, UK Most (3) Limited (7) Full Limited (18)Foundation schools, UK All Limited (8) Limited (14) Limited (19)Voluntary-aided schools, UK All Limited (9) Limited (15) Limited (20)Charter schools, US Most (3) Limited (10) Full NoneMagnet schools, US All Limited (11) None Limited (21)
Notes. The Brazilian escolas de referencia are found in Pernambuco State only. The Canadian separate schoolsare found in Alberta, Ontario and Saskatchewan only. The following explanations refer to when limitedautonomy is granted to autonomous government schools in these three areas plus funding.
(1) The state government is responsible for staff salaries, school feeding, books and uniforms, andprivate funding finances infrastructure investments and scholarships for low-income pupils.
(2) Government funding can be anywhere from 90% to 100%, the remaining can be from privatesources.
(3) May receive private donations.
(4) Must meet federal standards but innovation in the curriculum design and structure is permitted.
(5) Catholic concepts and values determine the orientation of the standard curriculum’s content.
(6) Curriculum must have at least the same academic standards as government schools.
(7) Follow the National Curriculum but with a particular focus on one or more areas.
(8) May partner up with organisations to bring specific skills and expertise to the school.
(9) Religious education may be taught according to a specific faith.
(10) Must meet federal and state standards but innovation in the curriculum design and structure ispermitted.
(11) Must cover a set of core academic subjects but may concentrate on a particular discipline or area ofstudy.
(12) Teachers must have passed public examinations (concurso p�ublico) and applied for the position tobe considered for the internal selection process.
(13) Teachers must have at least the same education and earn at least the same wages as teachers inregular government schools.
(14) Local Education Authority will appoint Head Teacher from candidates shortlisted by school.
(15) Local Education Authority must be involved in the selection process.
(16) No segregation of pupils according to the means of their parents.
(17) Conditional on the amount of funding received by the government.
(18) May choose up to 10% of pupils based on aptitude.
(19) Cannot operate admissions outside the LEA’s coordinated admissions scheme.
(20) Must consult other admissions authorities as well as their Diocesan Directors of Education whenthere are substantial changes. The school can use faith criteria in prioritising pupils for admission.
(21) Most have no entrance criteria but some are highly selective.
© 2015 Royal Economic Society.
654 TH E E CONOM I C J O U RN A L [ M A Y

Online Appendix Table B1 presents means and SDs of our variables for the overallsample and Table B2 breaks them down by country and shows differences acrossprivate, autonomous government and regular government schools in deviations fromcountry means. In the OECD countries and Brazil autonomous government schoolshave higher management scores than both regular government schools and privateschools. India looks different, with private schools scoring most highly. However, TableB2 also shows that autonomous government schools are systematically different onmany dimensions. For example, they are smaller than regular government schools andmore likely to be in urban areas. Our analysis will consider whether the highermanagement scores (and pupil performance) of such schools is due to suchconfounding influences.
1.6. Collecting Measures of Pupil Performance
Given the absence of publicly comparable metrics of school-level performance acrosscountries,13 we collected several country-specific measures of educational achievementranging from standardised (and sometimes compulsory) examination results to non-standardised examination results.
We use the following main measures in each country:
(i) in the US, we construct measures of school performance using themathematics, science and reading exam pass rate from high school exitexams (HSEEs) and end-of-course (EOCs) exams in states where performancemeasures were available;
(ii) in the UK, we employ the average uncapped GCSE score, the contextual valueadded measure and the proportion of pupils achieving five GCSEs (level 2)including English and mathematics;
(iii) in Canada, we employ the school-level rating produced by the Fraser Institute,which is based on several measures of pupil achievement, including averageprovince exam mark, percentage of exams failed, courses taken per pupil,diploma completion rate and delayed advancement rate;
(iv) in Sweden, we use the GPA in the 9th grade and the percentage of pupilsqualifying for upper secondary school;
(v) in Brazil, we use the average scores for mathematics, natural sciences andlanguage and codes of the non-mandatory high school national examination(Exame Nacional do Ensino Medio, ENEM). We also use 9th grade average scoreof Prova Brasil for government schools; and
(vi) in India, we use the average scores for mathematics, science and first languagein the X standards examinations. The details of these measures and theirsources for each country and are provided in online Appendix A.
13 The main exception to this, which is relevant to our study of schools offering education to 15-year olds,is the pupil-level data on achievement collected in the framework of the PISA project. Unfortunately due toconfidentiality constraints the PISA data cannot be released with school identifiers. We were, therefore,unable to match the two datasets.
© 2015 Royal Economic Society.
2015] DO E S M AN AG EM EN T MA T T E R F O R S CHOO L S ? 655
2. School Management Across and Within Countries
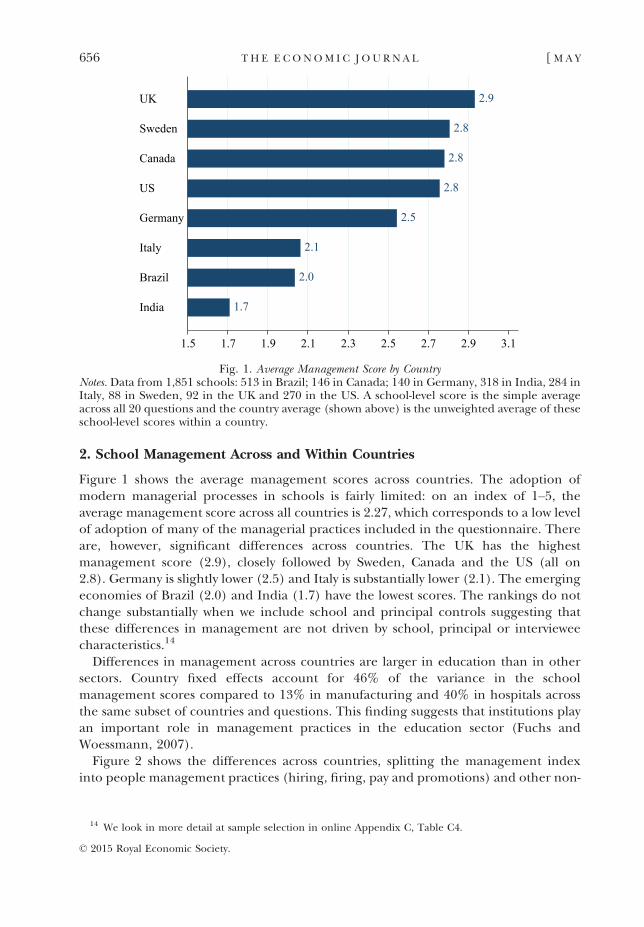
Figure 1 shows the average management scores across countries. The adoption ofmodern managerial processes in schools is fairly limited: on an index of 1–5, theaverage management score across all countries is 2.27, which corresponds to a low levelof adoption of many of the managerial practices included in the questionnaire. Thereare, however, significant differences across countries. The UK has the highestmanagement score (2.9), closely followed by Sweden, Canada and the US (all on2.8). Germany is slightly lower (2.5) and Italy is substantially lower (2.1). The emergingeconomies of Brazil (2.0) and India (1.7) have the lowest scores. The rankings do notchange substantially when we include school and principal controls suggesting thatthese differences in management are not driven by school, principal or intervieweecharacteristics.14
Differences in management across countries are larger in education than in othersectors. Country fixed effects account for 46% of the variance in the schoolmanagement scores compared to 13% in manufacturing and 40% in hospitals acrossthe same subset of countries and questions. This finding suggests that institutions playan important role in management practices in the education sector (Fuchs andWoessmann, 2007).
Figure 2 shows the differences across countries, splitting the management indexinto people management practices (hiring, firing, pay and promotions) and other non-
1.7
2.0
2.1
2.5
2.8
2.8
2.8
2.9
1.5 1.7 1.9 2.1 2.3 2.5 2.7 2.9 3.1
India
Brazil
Italy
Germany
US
Canada
Sweden
UK
Fig. 1. Average Management Score by CountryNotes. Data from 1,851 schools: 513 in Brazil; 146 in Canada; 140 in Germany, 318 in India, 284 inItaly, 88 in Sweden, 92 in the UK and 270 in the US. A school-level score is the simple averageacross all 20 questions and the country average (shown above) is the unweighted average of theseschool-level scores within a country.
14 We look in more detail at sample selection in online Appendix C, Table C4.
© 2015 Royal Economic Society.
656 TH E E CONOM I C J O U RN A L [ M A Y

people management practices (operations, monitoring and target setting). Interest-ingly, there are some clear variations in relative strengths and weaknesses. Across allcountries, schools are notably weaker in people management practices.
Figure 3 shows the distribution of the management scores within each country withthe smoothed (kernel) fit of the US for comparison. Across OECD countries, loweraverage country-level management scores are associated with an increasing dispersiontowards the left tail of the distribution: every country except the UK has someschools scoring below two. A score of below two indicates very poor managementpractices – almost no monitoring, very weak targets (e.g. only an annual school-leveltarget) and extremely weak incentives (e.g. tenure based promotion, no financial ornon-financial incentives and no action taken about underperforming teachers).However, while the fraction of schools scoring between one and two is minimal incountries such as Sweden and Canada (2.2% and 2.7% respectively), it rises to 82%in India.
At the other end of the distribution, we also observe that all OECD countries havesome schools scoring on average above three, which in contrast would correspond tomedium to widespread adoption of the management practices (some reasonableperformance monitoring, a mix of targets and performance-based promotion,rewards and steps taken to address persistent underperformance). The fraction ofschools scoring above three ranges from 46% in the UK to 5% in Italy. While thedistribution of management scores for Brazil is very similar to the Italian distribution(a wide dispersion of scores and a ‘fat’ left tail of weakly managed schools), India is
1.5 1.7 1.9 2.1 2.3 2.5 2.7 2.9 3.1
India
Brazil
Italy
Germany
US
Canada
Sweden
UK
PeopleNon−People
Fig. 2. People and Non-people Management by CountryNotes. Data from 1,851 schools: 513 in Brazil; 146 in Canada; 140 in Germany, 318 in India, 284 inItaly, 88 in Sweden, 92 in the UK and 270 in the US. Country-level averages for peoplemanagement versus non-people management practices. Broadly speaking people managementinvolves pay, promotions, hiring and firing, while non-people involves school operations,monitoring and targets (see the online Appendix Table A1 for the precise definitions).
© 2015 Royal Economic Society.
2015] DO E S M AN AG EM EN T MA T T E R F O R S CHOO L S ? 657
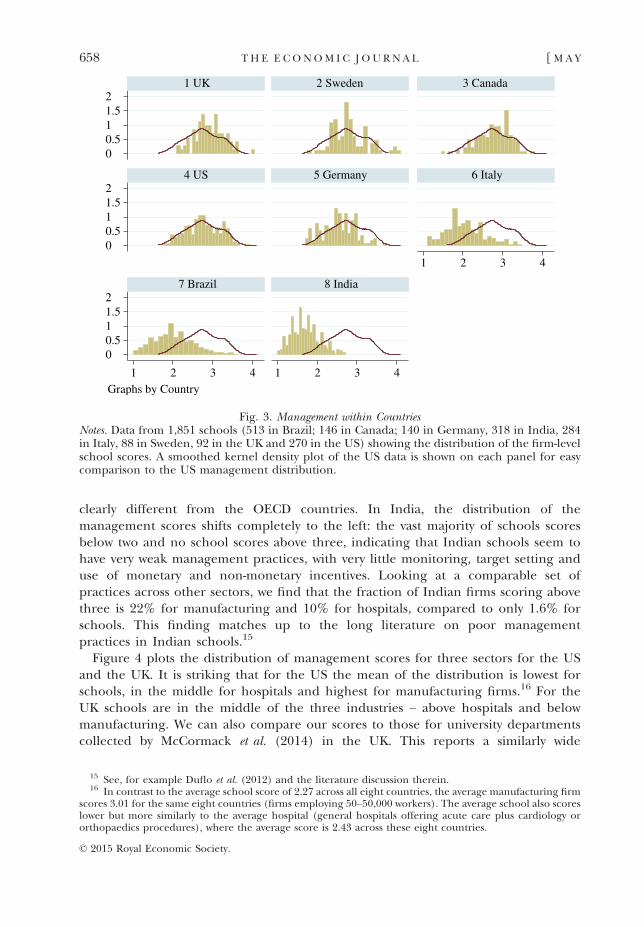
clearly different from the OECD countries. In India, the distribution of themanagement scores shifts completely to the left: the vast majority of schools scoresbelow two and no school scores above three, indicating that Indian schools seem tohave very weak management practices, with very little monitoring, target setting anduse of monetary and non-monetary incentives. Looking at a comparable set ofpractices across other sectors, we find that the fraction of Indian firms scoring abovethree is 22% for manufacturing and 10% for hospitals, compared to only 1.6% forschools. This finding matches up to the long literature on poor managementpractices in Indian schools.15
Figure 4 plots the distribution of management scores for three sectors for the USand the UK. It is striking that for the US the mean of the distribution is lowest forschools, in the middle for hospitals and highest for manufacturing firms.16 For theUK schools are in the middle of the three industries – above hospitals and belowmanufacturing. We can also compare our scores to those for university departmentscollected by McCormack et al. (2014) in the UK. This reports a similarly wide
00.511.52
00.511.52
00.511.52
1 2 3 4
1 2 3 4 1 2 3 4
1 UK 2 Sweden 3 Canada
4 US 5 Germany 6 Italy
7 Brazil 8 India
Graphs by Country
Fig. 3. Management within CountriesNotes. Data from 1,851 schools (513 in Brazil; 146 in Canada; 140 in Germany, 318 in India, 284in Italy, 88 in Sweden, 92 in the UK and 270 in the US) showing the distribution of the firm-levelschool scores. A smoothed kernel density plot of the US data is shown on each panel for easycomparison to the US management distribution.
15 See, for example Duflo et al. (2012) and the literature discussion therein.16 In contrast to the average school score of 2.27 across all eight countries, the average manufacturing firm
scores 3.01 for the same eight countries (firms employing 50–50,000 workers). The average school also scoreslower but more similarly to the average hospital (general hospitals offering acute care plus cardiology ororthopaedics procedures), where the average score is 2.43 across these eight countries.
© 2015 Royal Economic Society.
658 TH E E CONOM I C J O U RN A L [ M A Y
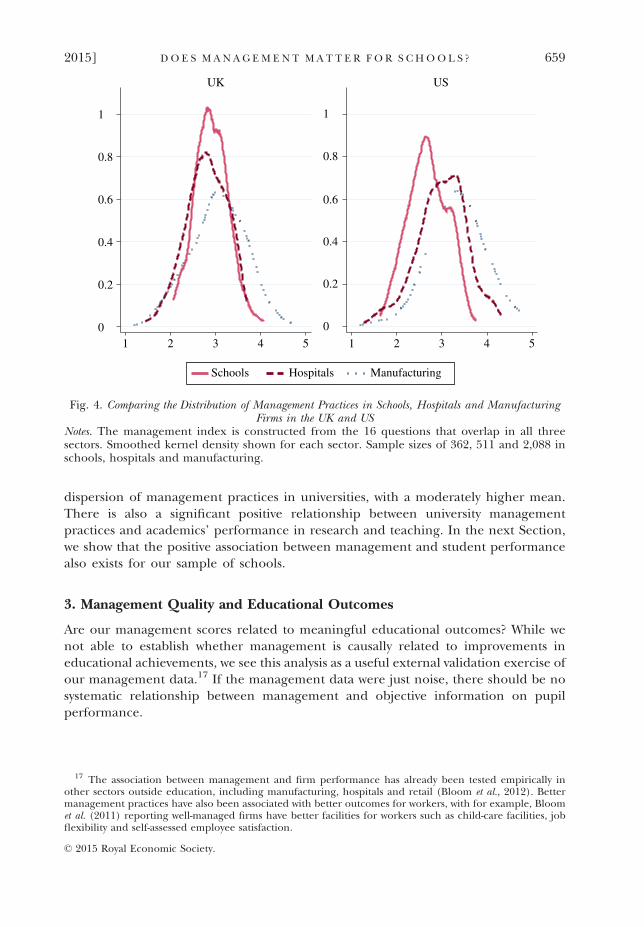
dispersion of management practices in universities, with a moderately higher mean.There is also a significant positive relationship between university managementpractices and academics’ performance in research and teaching. In the next Section,we show that the positive association between management and student performancealso exists for our sample of schools.
3. Management Quality and Educational Outcomes
Are our management scores related to meaningful educational outcomes? While wenot able to establish whether management is causally related to improvements ineducational achievements, we see this analysis as a useful external validation exercise ofour management data.17 If the management data were just noise, there should be nosystematic relationship between management and objective information on pupilperformance.
0
0.2
0.4
0.6
0.8
1
1 2 3 4 5
UK
0
0.2
0.4
0.6
0.8
1
1 2 3 4 5
US
Schools Hospitals Manufacturing
Fig. 4. Comparing the Distribution of Management Practices in Schools, Hospitals and ManufacturingFirms in the UK and US
Notes. The management index is constructed from the 16 questions that overlap in all threesectors. Smoothed kernel density shown for each sector. Sample sizes of 362, 511 and 2,088 inschools, hospitals and manufacturing.
17 The association between management and firm performance has already been tested empirically inother sectors outside education, including manufacturing, hospitals and retail (Bloom et al., 2012). Bettermanagement practices have also been associated with better outcomes for workers, with for example, Bloomet al. (2011) reporting well-managed firms have better facilities for workers such as child-care facilities, jobflexibility and self-assessed employee satisfaction.
© 2015 Royal Economic Society.
2015] DO E S M AN AG EM EN T MA T T E R F O R S CHOO L S ? 659

3.1. Empirical Model of Pupil Performance
We consider a base simple ‘educational production function’,18 where school-levelaverage pupil exam outcomes (Yic) are related to pupil composition, management andother school-level characteristics, where i denotes individual schools and c denotescountry.
Yic ¼ bMMic þ bAUTGOV AUTGOVic þ bPRI PRIVATEic þ kXXic þ uic : (1)
We are particularly interested in the co-efficient on the management index (M is thez-score of the average of the 20 individual management questions). We focus on thethree types of school discussed above: autonomous government schools (AUTGOV),private schools (PRIVATE) and regular government schools as the omitted base. X isthe other controls detailed below and uic is an error term. To control for some of theother dimensions that may differ across type of school we include the type ofcurriculum (the regular academic school programmes versus vocational/technicaleducation) and whether the school can select pupils based on academic merit.
Our empirical proxies for educational outcomes are school-level measures of pupilachievement as described in Section 1 and online Appendix A. In summary, we usecountry-specific measures of educational achievement as follows: the percentage ofpupils who passed their secondary school core subject exit exams (US), the percentageof pupils who qualified for upper secondary school (Sweden), the average overall scoreand subject-specific scores for secondary school exit examinations (India, Sweden andUK), rankings and contextual value added based on several indicators including pupilgrades and characteristics (Canada and UK), and non-mandatory university entrancequalification national examinations (Brazil). Given the differences in school-levelindicators of pupils’ achievement across countries, we standardise outcome measureswithin each country and include country dummies in all specifications when we poolacross countries.
We control for school resources and inputs by including measures of the number ofpupils in the school, the pupil/teacher ratio and a dummy to capture schools thatselect pupils partially based on academic merits. More detailed controls for pupilcharacteristics depend on the data available for each country. These include theproportion of pupils who are female, non-white, who do not speak the nationallanguage as their primary language and who are eligible for free school meals (astandard poverty measure). We consider specifications that estimate (1) by poolingacross all countries and using only basic controls for pupil composition, but we alsoshow specifications where we estimate the equation separately for each country wherewe can control for pupil composition in finer detail (at the cost of smaller samplesizes). Finally, some specifications control for survey measurement error by includinginterviewer dummies, a subjective interview reliability indicator coded by theinterviewer, the day of the week, time in which the interview took place and interviewduration.
18 See Hanushek (1979) for a conceptual and empirical discussion of education production functions.
© 2015 Royal Economic Society.
660 TH E E CONOM I C J O U RN A L [ M A Y

We have a sample of just over 1,000 schools when we estimate (1). This smallersample size is mainly because we do not have access to school-level performance data inItaly and Germany.19 However, we do find a positive relationship between the averagePISA pupil performance score and the average management score in German regions(correlation of 0.65, significant at the 10% level) and Italian regions (correlation of0.63, significant at the 5% level).20
3.2. Main Results on Pupil Performance
Table 2 presents the results of regressing school-level measures of pupil achieve-ment on the management score. The Table shows that management quality ispositively correlated with pupil achievement across all countries. Column (1) reportsthe cross-country pooled regression with controls only for country dummies. Thecoefficient implies that a one SD increase in the management score index (0.65points in the raw management score) is associated with an increase of 0.425 of a SDin pupil achievement. Column (2) includes the dummy variables for school type.Private schools and autonomous government schools obtain significantly higherpupil outcomes than regular government schools. If we drop the managementvariable, the coefficient on these school types rises substantially.21 We return to thedifference between school types in the next Table.
Column (3) includes the set of more general controls which slightly decreases theco-efficient on management to 0.232, and it remains significant at the 1% level.22
The magnitude remains sizeable. For example, a 1 SD improvement in managementis equivalent to 49% of the improvement associated with the selection of pupilsbased on academic merit. In terms of the other characteristics larger schools havehigher performance as do those with a higher teacher–pupil ratio (although notsignificantly so).
In columns (4)–(9), we disaggregate by country and add a richer set of country-specific controls. Across all countries, management quality continues to be positivelyassociated with better pupil outcomes and in most countries this relationship is
19 There are also some schools in the other six countries for which we could not obtain performance data.For example, in the US we did not find public information on pupil performance in private schools and wedid not collect performance data in states where we interviewed only one school or states which do not have ahigh school exit examination or end-of-course assessments. In India, we collected performance measuresover the telephone by calling back the school and speaking to the examinations coordinators (response of50%) but we were not able to collect information with a number of private schools no longer requiring theirstudents to take the X Standard examinations. In Canada, the Fraser Institute 2009 school ratings were onlycollected in Alberta, British Columbia and Ontario. Thus, in the US, India and Canada, we were not able tocollect performance data for approximately 47–53% of the sample. In Brazil, Sweden and the UK, we did notfind public information for a very small portion of the schools surveyed (approximately 7–8% in each).
20 We use 2006 PISA regional average scores for eight German regions and 2009 PISA regional averagescores for 14 Italian regions, restricting to regions with five or more observations.
21 For example, the co-efficient on autonomous government schools rises from 0.23 to 0.30.22 To put this result into perspective in view of the larger literature using educational production
functions, Rivkin et al. (2005) find that a 1 SD reduction in class size (roughly three pupils per class) isassociated with a 0.02 of a SD increase in achievement. Hanushek and Rivkin (2003) find that a 1 SD increasein the degree of competition (0.02 point decline in the Herfindahl Index) is associated with a reduction of0.09 SDs in the within school variance of teacher quality. In other words, performance associations formanagement quality are between two and three times as large as for competition and teacher quality and over10 times as large as for a measured input such as class size.
© 2015 Royal Economic Society.
2015] DO E S M AN AG EM EN T MA T T E R F O R S CHOO L S ? 661

Tab
le2
PupilOutcom
esan
dMan
agem
ent
(1)
(2)
(3)
(4)
(5)
(6)
(7)
(8)
(9)
(10)
Sample
ofco
untries:
All
All
All
Brazil
Can
ada
India
Swed
enUS
UK
UK
Dep
enden
tvariab
le:
Cross-countrypooledpupilachievemen
tAverage
maths
Fraser
rating
Average
maths
9thgrad
eGPA
HSE
Emathspass
Average
GCSE
Contextual
valuead
ded
Man
agem
ent(z-sco
re)
0.42
5***
0.24
2***
0.23
2***
0.10
4**
0.60
90.49
9**
0.24
20.17
0**
0.51
2*0.88
1**
(0.046
)(0.041
)(0.044
)(0.050
)(0.368
)(0.243
)(0.206
)(0.080
)(0.272
)(0.369
)Autonomous
governmen
tschool
0.22
5*0.39
6***
0.23
5�0
.263
0.21
10.61
2**
0.12
30.24
5�0
.309
(0.129
)(0.114
)(0.289
)(0.467
)(0.216
)(0.291
)(0.229
)(0.319
)(0.428
)Private
school
1.24
6***
1.13
9***
1.49
6***
0.93
70.38
3*�0
.633
(0.081
)(0.094
)(0.101
)(0.585
)(0.208
)(1.014
)Log(pupils)
0.07
5*0.12
6**
0.39
6*0.00
10.35
20.20
6**
�0.620
�0.566
(0.042
)(0.060
)(0.213
)(0.136
)(0.262
)(0.103
)(0.441
)(0.610
)Log(pupils/teachers)
�0.014
�0.118
�0.473
0.08
7�0
.103
�0.486
0.45
60.42
4(0.086
)(0.109
)(0.615
)(0.188
)(0.261
)(0.471
)(0.864
)(2.426
)Pupilsselected
on
acad
emic
merit
0.47
7***
0.52
6***
0.58
80.04
82.36
8***
0.74
3**
1.14
5***
�0.260
(0.109
)(0.151
)(0.488
)(0.188
)(0.496
)(0.340
)(0.400
)(0.582
)Gen
eral
controls
No
No
Yes
Yes
Yes
Yes
Yes
Yes
Yes
Yes
Pupilco
ntrols
(country-specific)
No
No
No
Yes
Yes
Yes
Yes
Yes
Yes
Yes
Observations
1,00
21,00
21,00
247
277
152
8213
386
78Dep
enden
tvariab
les
(mean)
514.20
5.92
69.23
211.53
69.96
442.78
1002
.81
Notes.Sign
ificance
atthe1%
levelden
otedby**
*an
d**
for5%
and*1
0%levels.OLSestimates
withrobuststan
darderrors
inparen
theses
under
coefficien
ts.For
thecross-countrypooledmeasure,weuse
themathsex
ampassrate
from
HSE
Esin
US(governmen
tschoolsonly),
uncapped
GCSE
score
inUK,FraserInstitute
schoolratingin
Can
ada,
9thgrad
eGPAin
Swed
en,averagemathsscore
intheHighSchoolNational
Examination(E
NEM)in
Brazil,averagemathsscore
inX
Stan
dardsin
India.In
theUK,wealso
use
aco
ntextual
value-ad
ded
measure
(see
onlineAppen
dix
Afordetails).Pupilachievemen
tdataz-scoredwithin
country.
Autonomousgo
vernmen
tschoolsareescolasde
referenciain
Brazil,separateschoolsin
Can
ada,private
ersatzschu
lenin
German
y,private-aided
schoolsin
India,friskolor
inSw
eden
,academ
ies,foundationan
dvoluntary-aided
schoolsin
theUKan
dch
arteran
dmagnet
schoolsin
theUS.
Man
agem
entisz-score
oftheaveraged
ofthez-
scored20
individual
questions.Allregressionshaveco
untrydummies.Gen
eral
controls:regional
dummies,schoolcu
rriculum
(academ
icversusvocational)an
dnoise(jobpostan
dtenure
ofinterviewee
;interviewer
dummies,day
ofwee
k;timeofday
andinterviewdurationan
dreliab
ilitymeasure).Pupilco
ntrols:B
razil(%
of
femalepupils,%
offoreignan
dnaturalisedpupilsan
d%
ofindigen
ouspupils),Can
ada(%
ofpupilswhose
firstlangu
ageis
known/believedto
beother
than
English),India(%
offemalepupilsan
d%
ofpupilswhoarenativespeake
rsofthelocallan
guage),S
wed
en(%
offemalepupilsan
d%
ofpupilswhose
firstlangu
age
isSw
edishin
Swed
en),UK(%
offemalepupils,%
ofpupilswhose
firstlangu
ageisnotEnglish,%
ofnon-whitepupilsan
d%
ofpupilseligible
foraschoolmeal);
andUS(%
offemalepupils,%
ofnon-whitepupilsan
d%
ofpupilseligible
foraschoolmeal).
© 2015 Royal Economic Society.
662 TH E E CONOM I C J O U RN A L [ M A Y
significant at the 10% level or greater.23 The correlation is largest in Canada(0.609) and smallest in Brazil (0.104).24 It is difficult to interpret the reasons forthe cross-country differences, given the different measures of test scores. Some ofthe differences in significance are related to sample size: the only two countrieswith a statistically insignificant co-efficient on management are the two with thesmallest number of schools (Canada has a sample size of 77 and Sweden has 82).We do not find a systematically larger coefficient in the ‘Anglo-Saxon’ countries(e.g. the US co-efficient on management is smaller than the one in India), which isconsistent with the view that the management measure are not inherently culturallybiased.
A criticism of the results in Table 2 is that we are not fully controlling for the factthat pupil intake is very different across schools, so it may be that the better managedschools are simply lucky enough to have better quality students sorting into theseschools. For one country (the UK) there are published school-level measures of valueadded, which tracks the average improvement in pupils’ grades between entering andexiting the school. Such value-added measures are superior to just using test scoremeasures as their control for initial intake quality. Column (10) uses value added as anoutcome and shows that our management score actually displays a statistically andeconomically stronger correlation with this value-added measure than the raw testscore measure in the previous column (0.881 versus 0.512). Hence, although we do nothave value-added measures for all countries, it seems unlikely that differential studentintake is driving the results in Table 2.
3.3. Robustness of pupil performance results
Online Appendix Table B4 presents some robustness tests of the results of regressingschool-level measures of pupil achievement on the management using column (3) ofTable 2 as a baseline. The management survey includes several questions related topeople management (e.g. use of incentives, practices related to promotion anddismissals of teachers) that are heavily regulated across most of the countries in oursample. One possible concern is that regulatory constraints might reduce theobserved variation along these areas of management, thus inhibiting our ability toestimate their association with school-level pupil outcomes. We look at this issue intwo ways. First, the distribution of people management by country shows substantialwithin-country variation (online Appendix Figure B1). This finding suggests thatnational regulations are not homogenous or completely binding on schools. Second,people management alone is positively and significantly correlated with school-leveloutcomes, with a co-efficient (standard error) of 0.257 (0.046) in an equivalentspecification to column (5) of Table B4. The other non-people-related areas ofmanagement are also significantly correlated with outcomes – coefficients (standard
23 In a companion paper, Di Liberto et al. (2013) find a positive and weakly significant association betweennationally tested student-level mathematics examinations outcomes in Italy and our management measures.
24 In Table B3, we report the results of the association between pupil outcomes and management usingalternative measures of pupil outcomes. The majority of the results are consistent with Table 2, that ismanagement is positively and significantly associated with most available school-level measures of pupiloutcomes.
© 2015 Royal Economic Society.
2015] DO E S M AN AG EM EN T MA T T E R F O R S CHOO L S ? 663

error) of 0.093 (0.036) for operations, 0.133 (0.036) for performance monitoring and0.158 (0.038) for target setting. The subset of 16 questions asked in an almostidentical fashion to other sectors such as manufacturing and health care (e.g.performance tracking, goal setting etc.) has a co-efficient (standard error) of 0.248(0.045). We also looked at a subset of questions that are related to five practicesexamined in Dobbie and Fryer (2013) in New York charter schools – frequent teacherfeedback, the use of data to guide instruction, high dosage tutoring, increasedinstructional time and a culture of high expectations.25 We constructed a similar‘Dobbie and Fryer’ management index from our questions (data-driven planning andpupil transitions, adopting education best practices, personalisation of instructionand learning and clearly defined accountability for principals). The co-efficient(standard error) on this index is 0.134 (0.038).
4. How Management Varies Across Schools: The Role of AutonomousGovernment Schools
4.1. Empirical Model of Management
Having established the presence of a positive correlation between our managementpractices score and school-level educational outcomes, we now turn to studyhow management varies within countries. We distinguish between three main typesof schools: private schools, autonomous government schools and regular govern-ment schools. Recall that we define autonomous government schools asschools receiving at least partial funding from the government and with at leastlimited autonomy in one of three areas: establishing the curriculum content;selecting teachers; and admitting pupils.26 We use a simple regression model ofthe form:
Mic ¼ aAUTGOV AUTGOVic þ aPRIVATEPRIVATEic þ aZX ic þ vic : (2)
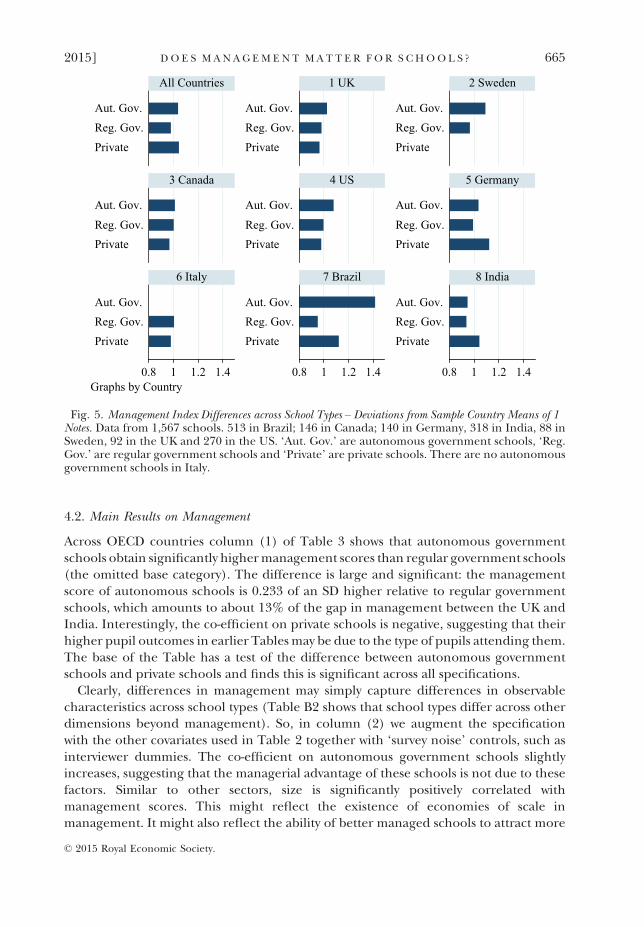
Given the differences between OECD and non-OECD countries, we estimateseparate equations for Brazil and India. Although we pool across OECD countries inthe main specifications, we also consider disaggregating the OECD regressions bycountry (online Appendix Table B5). Figure 5 shows management index differencesacross autonomous government, regular government and private schools indeviations from sample country means of 1. On average across countries, privateschools have the highest scores, followed by autonomous government schools andregular government schools at the bottom. There is much heterogeneity in theranking across countries, however.
25 Dobbie and Fryer (2013) show that this set of five practices are also strongly correlated with pupilachievement and explain approximately 45% of the variation in school effectiveness. In an experimentalsetting, Fryer (2014) shows that the average impact of implementing these policies significantly increasespupil mathematics achievement in treated elementary and secondary schools by 0.15–0.18 SDs.
26 Table 1 provides more details about schools under this classification across countries.
© 2015 Royal Economic Society.
664 TH E E CONOM I C J O U RN A L [ M A Y
4.2. Main Results on Management
Across OECD countries column (1) of Table 3 shows that autonomous governmentschools obtain significantly highermanagement scores than regular government schools(the omitted base category). The difference is large and significant: the managementscore of autonomous schools is 0.233 of an SD higher relative to regular governmentschools, which amounts to about 13% of the gap in management between the UK andIndia. Interestingly, the co-efficient on private schools is negative, suggesting that theirhigher pupil outcomes in earlier Tablesmay be due to the type of pupils attending them.The base of the Table has a test of the difference between autonomous governmentschools and private schools and finds this is significant across all specifications.
Clearly, differences in management may simply capture differences in observablecharacteristics across school types (Table B2 shows that school types differ across otherdimensions beyond management). So, in column (2) we augment the specificationwith the other covariates used in Table 2 together with ‘survey noise’ controls, such asinterviewer dummies. The co-efficient on autonomous government schools slightlyincreases, suggesting that the managerial advantage of these schools is not due to thesefactors. Similar to other sectors, size is significantly positively correlated withmanagement scores. This might reflect the existence of economies of scale inmanagement. It might also reflect the ability of better managed schools to attract more
0.8 1 1.2 1.4 0.8 1 1.2 1.4 0.8 1 1.2 1.4
PrivateReg. Gov.Aut. Gov.
PrivateReg. Gov.
Aut. Gov.
PrivateReg. Gov.Aut. Gov.
PrivateReg. Gov.Aut. Gov.
PrivateReg. Gov.
Aut. Gov.
PrivateReg. Gov.Aut. Gov.
PrivateReg. Gov.Aut. Gov.
PrivateReg. Gov.
Aut. Gov.
PrivateReg. Gov.Aut. Gov.
All Countries 1 UK 2 Sweden
3 Canada 4 US 5 Germany
6 Italy 7 Brazil 8 India
Graphs by Country
Fig. 5. Management Index Differences across School Types – Deviations from Sample Country Means of 1Notes. Data from 1,567 schools. 513 in Brazil; 146 in Canada; 140 in Germany, 318 in India, 88 inSweden, 92 in the UK and 270 in the US. ‘Aut. Gov.’ are autonomous government schools, ‘Reg.Gov.’ are regular government schools and ‘Private’ are private schools. There are no autonomousgovernment schools in Italy.
© 2015 Royal Economic Society.
2015] DO E S M AN AG EM EN T MA T T E R F O R S CHOO L S ? 665

Tab
le3
Man
agem
entRegressions–AccountingforDifferencesBetweenSchool
Types
(1)
(2)
(3)
(4)
(5)
(6)
(7)
(8)
(9)
Dep
enden
tvariab
leMan
agem
ent
Countrysample
OECD
OECD
OECD
Brazil
Brazil
Brazil
India
India
India
Autonomousgo
vernmen
tschool
0.23
3***
0.27
3***
0.24
4***
1.79
0***
0.92
6***
0.89
3***
�0.013
0.00
60.00
2(0.086
)(0.076
)(0.075
)(0.088
)(0.179
)(0.181
)(0.150
)(0.107
)(0.110
)Private
school
�0.149
*0.03
3�0
.004
0.50
4***
0.45
7***
0.47
1***
0.27
3***
0.01
50.00
8(0.078
)(0.071
)(0.076
)(0.089
)(0.083
)(0.082
)(0.074
)(0.067
)(0.069
)Log(pupils)
0.14
1***
0.11
3***
0.10
3*0.12
5**
0.22
6***
0.22
1***
(0.032
)(0.033
)(0.055
)(0.058
)(0.040
)(0.041
)Log(pupils/teachers)
�0.163
**�0
.150
**�0
.066
�0.079
�0.291
***
�0.288
***
(0.070
)(0.070
)(0.102
)(0.103
)(0.063
)(0.063
)Pupilsselected
onacad
emic
merits
0.03
80.03
40.34
5**
0.36
6**
0.23
2***
0.23
0***
(0.088
)(0.087
)(0.141
)(0.144
)(0.055
)(0.056
)Reg
ular(n
on-vocational)cu
rriculum
0.17
0**
0.16
5**
0.11
40.13
3(0.073
)(0.074
)(0.152
)(0.152
)Log(populationden
sity)
0.05
7***
�0.059
0.01
2(0.018
)(0.041
)(0.024
)Noiseco
ntrols
No
Yes
Yes
No
Yes
Yes
No
Yes
Yes
Testprivate
=au
tonomous
governmen
t(p
-value)
0.00
00.01
40.01
20.00
00.02
00.04
00.07
00.93
70.95
9
Observations
1,02
01,02
01,02
051
351
331
831
831
831
8
Notes.Sign
ificance
atthe1%
levelden
otedby**
*an
d**
for5%
and*10
%level.OLSestimates
withrobuststan
darderrors
inparen
theses
under
co-efficien
ts.All
columnshaveco
untryan
dregional
controls.Theman
agem
entvariab
letake
stheaverageofall20
man
agem
entquestions.Autonomousgo
vernmen
tschoolsare
separateschoolsin
Can
ada,
private
ersatzschu
lenin
German
y,friskolorin
Swed
en,acad
emies,foundationan
dvoluntary-aided
schoolsin
theUK;ch
arteran
dmagnet
schools
intheUS;
escolasde
referenciain
Brazil;private-aided
schools
inIndia.Populationden
sity
isat
theNUTS3level.Noiseco
ntrols
include23
interviewer
dummies,day
ofwee
k;timeofday
interviewco
nducted
,interviewduration,reliab
ilitymeasure
andjobpost
ofinterviewee
.
© 2015 Royal Economic Society.
666 TH E E CONOM I C J O U RN A L [ M A Y
pupils, although this is less likely given that schools tend to have difficulty growing inmost systems.27 Management is also significantly negatively correlated with the pupil/teacher ratio which may capture the fact that schools with higher resources may be ableto establish and enforce better management processes (e.g. when teachers are not asoverstretched it might be easier to use merit-based promotions, deal with underper-formance etc.).28
Another possible explanation for the higher management score of autonomousgovernment schools could be differences in location. For example, Angrist et al. (2013)point out that while charter schools in urban areas have positive effects on pupilachievement, non-urban charter schools are on average no more effective than regulargovernment schools and in some instances even detrimental to pupils. To account forlocational differences, we control for regional population density in column (3).29 Wedo find that schools in urban areas tend to have significantly higher managerial scoresbut this only reduces the coefficient on autonomous government schools slightly (from0.273 to 0.244).30
Online Appendix Table B5 explores the heterogeneity of the results across countriesby estimating the same regression in column (3) of Table 3 separately for each of theOECD countries in our sample. The co-efficient on autonomous government schools ispositive across all the countries in our sample, although it is especially large for Swedenwhich had the most radical institutional change towards autonomous governmentschools among our sampled countries.31
In columns (4) to (6) of Table 3, we repeat the specifications for Brazil. We also finda positive managerial differential between autonomous government schools andregular government schools, although this result is based on only three autonomousgovernment schools, thus is difficult to generalise.32 In contrast with OECD countries,
27 Since private (and to a lesser extent autonomous government) schools have more ability to grow, weexamined the reallocation story by looking at whether the association between management and size wasstronger for these schools. We did not find systematic evidence of this, suggesting that the correlation may bemore due to scale economies.
28 Indeed, the negative correlation between management and the pupil/teacher ratio is much larger forthe people management portion of the survey relative to the other non-people management questions.
29 Our measure of population density is at the NUTS 3 level for the OECD, at the municipality level forBrazil and at the sub-district level (Tehsils or Mandals) for India.
30 The density variable is insignificant when included in the performance regressions of column (3) ofTable 2.
31 The co-efficient on the autonomous government schools dummy is very strong and significant in Sweden,and positive but not significant in Canada, Germany, UK and US. The co-efficient on the dummy is stillpositive and significant at the 10% level when we pool all countries except Sweden. The Swedish case presentsunique features as its education system benefited from a series of aggressive and rapid reforms in the early1990s, starting with a decentralisation of education to the municipal level, holding municipalities financiallyaccountable for its schools and implementing a voucher programme which led to a sharp increase in thenumber of friskolor and the number of pupils attending those schools (Sahlgren, 2011). The US charterschools and the UK academies, on the other hand, were being progressively introduced at a much slower pace,starting in the mid to late 1990s. Studying the impact of the introduction of academies on pupil achievement,Machin and Vernoit (2011) find stronger positive results for schools that have been academies for longer andwho have experienced the largest changes in governance practices, suggesting that the benefits of introducingautonomous government schools in an education system may take a while to materialise.
32 In 2007, the state of Pernambuco partnered with a group of companies committed to improvingeducation to convert 10 existing secondary schools into a new model of reference schools. By 2010, theprogramme had expanded to 60 full-day and 100 half-day secondary schools (Bruns et al., 2012). By 2013, itreached a total of 260 schools.
© 2015 Royal Economic Society.
2015] DO E S M AN AG EM EN T MA T T E R F O R S CHOO L S ? 667

however, private schools in Brazil appear to have much higher scores relative to regulargovernment schools. The private-regular government schools gap is substantial (abouthalf of an SD), and is robust to the inclusion of measures of school size, curriculumoffered and the ability to select pupils based on merit. Also in contrast with OECDcountries, the ability to select pupils on the basis of academic merit is positivelycorrelated with management, while the proxy for regional density is not.
The final three columns of Table 3 repeat the specifications for India. The resultsdiffer substantially from the rest of the Table. Column (7) shows that private schoolsscore higher on average in terms of management relative to regular governmentschools, while no significant difference can be found for autonomous governmentschools. However, the private-regular government differential is insignificant when weintroduce basic controls for school size, pupil/teacher ratios and the ability to selectpupils. (Many of the elite Indian government schools use such selection devices; seeRao (2014) for example.) This result suggests the better performance of privateschools is likely to be due to greater resources, which are particularly large in India,and casts doubt on the idea that they may be a possible solution to the chronicinefficiencies experienced in the public sector (OECD, 2012).
In summary, autonomous government schools seem to have significantly bettermanagerial scores than regular government schools in all countries except India.Private schools, by contrast, are no better than government schools in any countryexcept Brazil, implying that their advantages in pupil performance in Table 2 are likelyto be due to selection of pupils from wealthier families.33
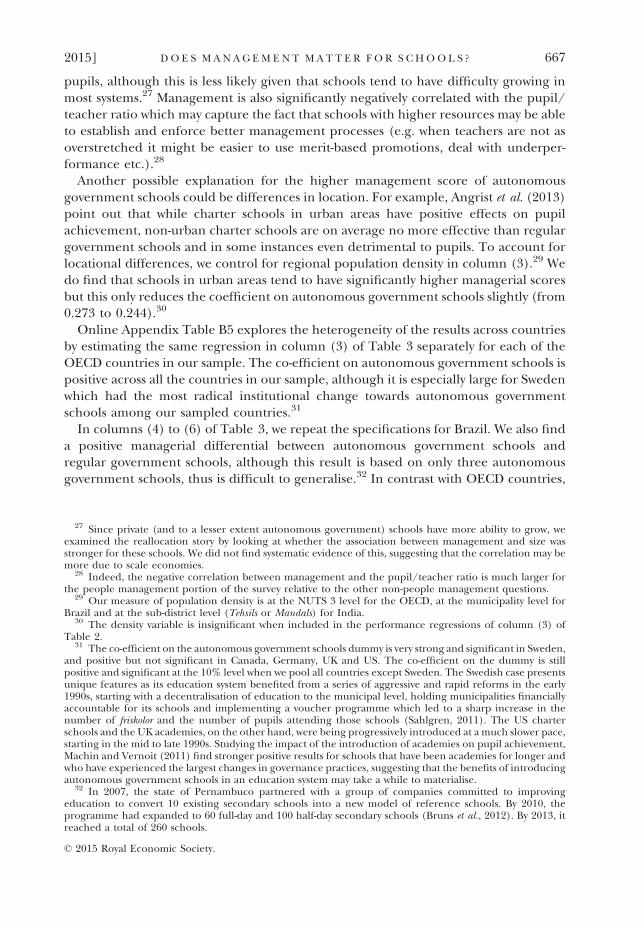
4.3. What Explains the Advantage of Autonomous Government Schools?
Our results indicate that autonomous government schools are fundamentally differentin terms of the processes that they employ in the day-by-day management of theseorganisations. In Table 4, we explore what could account for the advantage ofautonomous government schools focusing on OECD schools because of the differenceswe observed between OECD countries and emerging economies. Column (1) reportsthe baseline specification of column (3) of Table 3. Column (2) includes a measure ofcompetition to see if some schools are in areas where there is more pupil choice.34 Themeasure has a positive but insignificant co-efficient.35 Column (3) adds in some
33 To account for potential differences between faith-based and non-faith-based schools, we introduce adummy for faith-based schools in our sample to the full specifications in columns 3, 6 and 9. In each region,the autonomous government school and the private school co-efficients remain significant and nearlyunchanged. In the OECD the autonomous government co-efficient (standard error) changes to 0.235(0.075)and the private co-efficient (standard error) changes to �0.019(0.094), in Brazil the autonomousgovernment co-efficient (standard error) changes to 0.894(0.182) and the private co-efficient (standarderror) changes to 0.465(0.096) and in India, the autonomous government and the private coefficient remainunchanged. In our sample, 14.2% of interviews in the OECD, 7.8% of interviews in Brazil and 15.7% ofinterviews in India were run with principals of faith-based schools.
34 Our measure of competition is collected during the survey itself by asking the principal ‘How manyother schools offering education to 15-year olds are within a 30-minute drive from your school?’
35 The evidence on the impact of competition and school choice is mixed. Some studies find a positiveeffect (Hoxby, 2000; Ahlin, 2003; Hanushek and Rivkin, 2003; Gibbons et al., 2008; Card et al., 2010), whileother studies find a negative effect or no effect on pupil achievement (Rothstein, 2005; Hsieh and Urquiola,2006).
© 2015 Royal Economic Society.
668 TH E E CONOM I C J O U RN A L [ M A Y

Tab
le4
AccountingfortheAdvan
tage
ofGovernmentSchoolsin
theOECD
(1)
(2)
(3)
(4)
(5)
(6)
(7)
(8)
Dep
enden
tvariab
leMan
agem
ent
Non-peo
ple
Peo
ple
Autonomousgo
vernmen
tschool
0.24
4***
0.24
4***
0.23
3***
0.22
3***
0.21
1***
0.12
9**
0.05
00.29
6***
(0.075
)(0.075
)(0.074
)(0.076
)(0.075
)(0.060
)(0.061
)(0.083
)Private
school
�0.004
�0.006
0.01
3�0
.061
�0.058
�0.049
�0.193
***
0.33
7***
(0.076
)(0.077
)(0.076
)(0.082
)(0.083
)(0.070
)(0.074
)(0.092
)Log(pupils)
0.11
3***
0.11
2***
0.11
5***
0.11
8***
0.12
0***
0.07
0**
0.04
30.12
3***
(0.033
)(0.033
)(0.033
)(0.033
)(0.034
)(0.029
)(0.030
)(0.037
)Log(pupils/teachers)
�0.150
**�0
.151
**�0
.151
**�0
.158
**�0
.163
**�0
.108
*�0
.035
�0.252
***
(0.070
)(0.070
)(0.071
)(0.070
)(0.072
)(0.063
)(0.063
)(0.080
)Competition
0.00
70.02
1�0
.006
�0.013
0.01
5(0.039
)(0.038
)(0.034
)(0.036
)(0.040
)Principal
tenure
(years)
�0.004
�0.004
�0.004
�0.003
�0.004
(0.003
)(0.003
)(0.003
)(0.003
)(0.004
)Principal
gender
(male)
�0.134
***
�0.142
***
�0.097
***
�0.108
***
�0.066
(0.041
)(0.041
)(0.036
)(0.038
)(0.044
)Principal
has
STEM
backg
round
0.07
00.07
20.05
90.07
7*0.01
2(0.046
)(0.046
)(0.041
)(0.042
)(0.049
)Principal
personnel
autonomy
0.05
90.06
5*0.06
0*0.02
60.13
1***
(0.037
)(0.037
)(0.032
)(0.032
)(0.038
)
© 2015 Royal Economic Society.
2015] DO E S M AN AG EM EN T MA T T E R F O R S CHOO L S ? 669
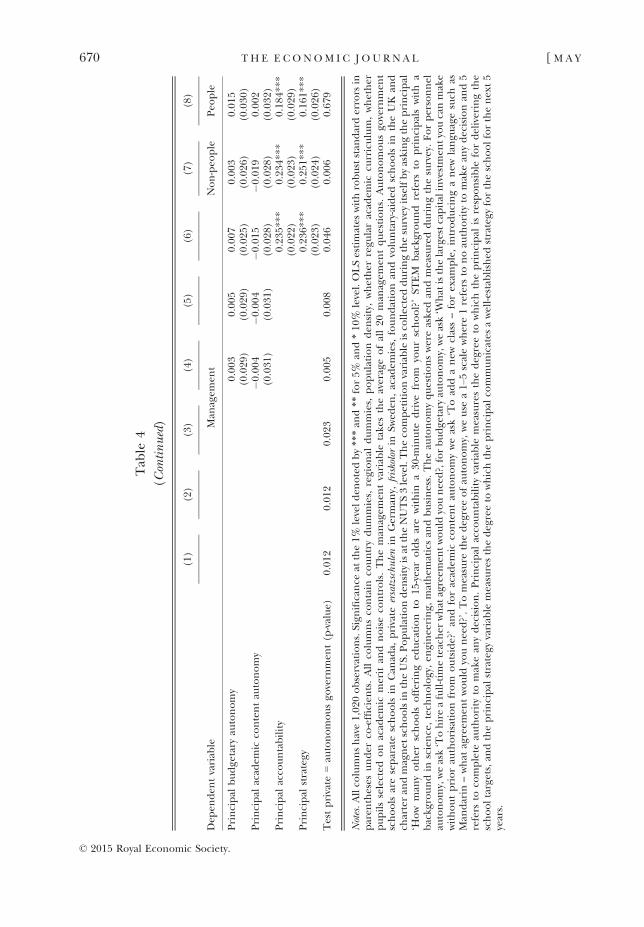
Tab
le4
(Continued)
(1)
(2)
(3)
(4)
(5)
(6)
(7)
(8)
Dep
enden
tvariab
leMan
agem
ent
Non-peo
ple
Peo
ple
Principal
budge
tary
autonomy
0.00
30.00
50.00
70.00
30.01
5(0.029
)(0.029
)(0.025
)(0.026
)(0.030
)Principal
acad
emic
contentau
tonomy
�0.004
�0.004
�0.015
�0.019
0.00
2(0.031
)(0.031
)(0.028
)(0.028
)(0.032
)Principal
acco
untability
0.23
5***
0.23
4***
0.18
4***
(0.022
)(0.023
)(0.029
)Principal
strategy
0.23
6***
0.25
1***
0.16
1***
(0.023
)(0.024
)(0.026
)Testprivate
=au
tonomousgo
vernmen
t(p
-value)
0.01
20.01
20.02
30.00
50.00
80.04
60.00
60.67
9
Notes.Allco
lumnshave1,02
0observations.Sign
ificance
atthe1%
levelden
otedby**
*an
d**
for5%
and*10
%level.OLSestimates
withrobuststan
darderrors
inparen
theses
under
co-efficien
ts.Allco
lumnsco
ntain
countrydummies,
regional
dummies,
population
den
sity,whether
regu
laracad
emic
curriculum,whether
pupilsselected
on
acad
emic
merit
andnoiseco
ntrols.Theman
agem
entvariab
letake
stheaverageofall20
man
agem
entquestions.
Autonomousgo
vernmen
tschools
areseparateschools
inCan
ada,
private
ersatzschu
lenin
German
y,friskolorin
Swed
en,acad
emies,
foundationan
dvoluntary-aided
schools
intheUK
and
charteran
dmagnet
schoolsin
theUS.
Populationden
sityisat
theNUTS3level.Theco
mpetitionvariab
leisco
llectedduringthesurvey
itselfbyaskingtheprincipal
‘How
man
yother
schools
offeringed
ucation
to15
-yearoldsarewithin
a30
-minute
drive
from
yourschool?’ST
EM
backg
round
refers
toprincipalswith
abackg
roundin
science,tech
nology,en
gineering,
mathem
aticsan
dbusiness.Theau
tonomyquestionswereaske
dan
dmeasuredduringthesurvey.Forpersonnel
autonomy,weask‘Tohireafull-tim
eteacher
what
agreem
entwould
younee
d?,forbudge
tary
autonomy,weask‘W
hat
isthelargestcapital
investmen
tyoucanmake
withoutpriorau
thorisationfrom
outside?’an
dforacad
emic
contentau
tonomyweask‘Toad
danew
class–forex
ample,introducinganew
langu
agesuch
asMan
darin
–what
agreem
entwould
younee
d?’.Tomeasure
thedeg
reeofau
tonomy,weuse
a1–
5scalewhere1refers
tonoau
thority
tomakean
ydecisionan
d5
refers
toco
mplete
authority
tomakean
ydecision.Principal
acco
untabilityvariab
lemeasuresthedeg
reeto
whichtheprincipal
isresponsible
fordeliveringthe
schooltargets,an
dtheprincipal
strategy
variab
lemeasuresthedeg
reeto
whichtheprincipal
communicates
awell-e
stab
lished
strategy
fortheschoolforthenex
t5
years.
© 2015 Royal Economic Society.
670 TH E E CONOM I C J O U RN A L [ M A Y
characteristics of the principal36 collected in the survey (tenure, gender and whetherthe principal has a background in STEM ‘science, technology, engineering, mathe-matics’ or business). Of these only gender is significant: female principals are associatedwith higher management scores. But these covariates only reduce the autonomousgovernment co-efficient slightly. Column (4) includes three measures of the autonomyof the principal in terms of hiring and firing, budgetary expense and curriculumchoices. Column (5) includes both the principal characteristics and autonomymeasures. The autonomy measures are generally insignificant with the exception ofpersonnel autonomy (which is significant at the 10% level). Adding all six measuresreduces the co-efficient on the autonomous government dummies to 0.211 from 0.244in column (1). So these measures of principal characteristics and autonomy do notreally account for much of the difference.
So what does matter? We focus on two measures (see online Appendix Table A2 fordetails): first; governance – the degree to which the principal is accountable toinstitutional stakeholders such as school external boards (‘principal accountability’);and second, leadership – the degree to which the principal communicates a well-articulated strategy for the school over the next five years (‘principal strategy’).Column (6) includes the principal accountability and the principal strategy variables,showing that these variables are highly significant and these two factors account foralmost half of the gap between autonomous government and regular governmentschools (the co-efficient falls from 0.211 to 0.129).37 Table B2 in the online Appendixshows that, accountability and strategy are very different between school types. Whenwe break the management questions into its two different subcomponents – peopleand non-people management – we find that the dummy capturing principals with aSTEM or business background is correlated with non-people practices, that is,operations, monitoring and target setting, but not with people management, while theopposite holds for personnel autonomy.
Online Appendix Table B6 shows the results for India and Brazil. Overall, these arebroadly consistent with those shown for OECD countries. In both Brazil and India,competition, principal characteristics and autonomy are not significantly correlatedwith the management score, while the accountability and strategy variables appear tobe large in magnitude, and positively and significantly correlated with highermanagement scores. These findings suggest that governance and leadership may playan important role for the performance of schools even in developing economies.
5. Conclusion
Understanding the factors associated with variations in school performance within andacross countries is important. While many researchers have looked at differences inschool inputs – such as teacher quality, class size and family/pupil characteristics – or
36 For instance, Clark et al. (2009) find some evidence that experience as an assistant principal at theprincipal’s current school is associated with higher performance among inexperienced principals. They alsofind a positive relationship between principal experience and school performance, particularly formathematics test scores and pupil absences.
37 Both are about equally important. For example, just including accountability reduces the co-efficient onautonomous government schools from 0.211 to 0.177.
© 2015 Royal Economic Society.
2015] DO E S M AN AG EM EN T MA T T E R F O R S CHOO L S ? 671

variations in the institutional environment, such as pupil choice – few studies exploredifferences in school management. In this article, we show robust evidence thatmanagement practices vary significantly across and within countries and are stronglylinked to pupil outcomes. Management quality seems to matter for schools.
A new finding is that autonomous government schools appear to have significantlyhigher management scores than both regular government schools and private schools.Their better performance is not linked with autonomy per se but with how autonomy isused. Having strong accountability of principals to an external governing body andexercising strong leadership through a coherent long-term strategy for the schoolappear to be two key features that account for a large fraction of the superiormanagement performance of such schools.
From a policy point of view, our findings suggest that improving management couldbe an important way of raising school standards and give broad support for thefostering of greater autonomy of government schools. While autonomy alone may notdeliver better results, alongside improved governance and motivated principals itshould lead to better standards.
Our work suggests many lines of future inquiry. First, we have only presentedconditional correlations. Thinking of ways to evaluate the causal effects of manage-ment interventions such as randomised control trials (Fryer and Holden, 2012) is ahigh priority. Second, we only account for at most half of the better management ofautonomous government schools with accountability and leadership: what else isimportant? Are there key characteristics of principals and teachers, for example whichwe have missed out? Third, what drives improved school management? We havesuggestive evidence that governance matters (as it does more widely in other sectors)but what about school networks, teacher skills, incentives, pupil choice and informa-tion? There is an exciting research agenda ahead.
Stanford University, Centre for Economic Performance, CEPR and NBERCambridge University and Centre for Economic PerformanceHarvard University, Centre for Economic Performance, CEPR and NBERLondon School of Economics, Centre for Economic Performance, NBER and CEPR
Additional Supporting Information may be found in the online version of this article:
Appendix A. Data.Appendix B. Additional Results.Appendix C. Sampling Frame.Data S1.
ReferencesAbdulkadiroglu, A., Angrist, J.D., Dynarski, S.M., Kane, T.J. and Pathak, P.A. (2011). ‘Accountability and
flexibility in public schools: evidence from Boston’s charters and pilots’, Quarterly Journal of Economics, vol.126(2), pp. 699–748.
Ahlin, �A. (2003). ‘Does school competition matter? Effects of a large-scale school choice reform on studentperformance’. Working Paper No. 2003:2, Uppsala University, Department of Economics.
Angrist, J.D., Dynarski, S.M., Kane, T.J., Pathak, P.A. and Walters, C.R. (2011). ‘Who benefits from KIPP?’Discussion Paper No. 5690. IZA.
© 2015 Royal Economic Society.
672 TH E E CONOM I C J O U RN A L [ M A Y

Angrist, J.D., Pathak, P.A. and Walters, C.R. (2013). ‘Explaining charter school effectiveness’, AmericanEconomic Journal: Applied Economics, vol. 5(4), pp. 1–27.
Arora, A., Cohen, W.M. and Walsh, J.P. (2014). ‘The acquisition and commercialization of invention inAmerican manufacturing: incidence and impact’, Working Paper No. 20264, National Bureau ofEconomic Research.
B�eteille, T., Kalogrides, D. and Loeb, S. (2012). ‘Stepping stones: principal career paths and schooloutcomes’, Social Science Research, vol. 41(4), pp. 904–19.
Ben-David, I., Graham, J.R. and Harvey, C.R. (2013). ‘Managerial miscalibration’, Quarterly Journal ofEconomics, vol. 128(4), pp. 1547–84.
Black, S.E. and Lynch, L.M. (2001). ‘How to compete: the impact of workplace practices and informationtechnology on productivity’, Review of Economics and Statistics, vol. 83(3), pp. 434–45.
Bloom, N., Brynjolfsson, E., Foster, L., Jarmin, R., Saporta-Eksten, I. and Van Reenen, J. (2013).‘Management in America’, mimeo, Stanford University.
Bloom, N., Genakos, C., Sadun, R. and Van Reenen, J. (2012). ‘Management practices across firms andcountries’, Academy of Management Perspectives (AMP), vol. 26(1), pp. 12–33.
Bloom, N., Kretschmer, T. and Van Reenen, J. (2011). ‘Are family friendly workplace practices a valuable firmresource?’, Strategic Management Journal, vol. 32(4), pp. 343–67.
Bloom, N., Lemos, R., Sadun, R., Scur, D. and Van Reenen, J. (2014), ‘The new empirical economics ofmanagement‘, Journal of the European Economics Association, vol. 12(4), pp. 835–76.
Bloom, N., Propper, C., Seiler, S. and Van Reenen, J. (2015). ‘The impact of competition on managementquality: evidence from public hospitals’, Review of Economic Studies, vol. 82(2), pp. 457–89.
Bloom, N. and Van Reenen, J. (2007). ‘Measuring and explaining management practices across firms andcountries’, Quarterly Journal of Economics, vol. 122(4), pp. 1351–408.
Branch, G.F., Hanushek, E.A. and Rivkin, S.G. (2012). ‘Estimating the effect of leaders on public sectorproductivity: the case of school principals’, Working Paper No. 17803, National Bureau of EconomicResearch.
Bruns, B., Evans, D. and Luque, J. (2012). Achieving World-Class Education in Brazil: The Next Agenda.Washington, DC: World Bank Publications.
B€ohlmark, A. and Lindahl, M. (2012). ‘Independent schools and long-run educational outcomes: evidencefrom Sweden’s large scale voucher reform’, Institute for the Study of Labor, Discussion Paper No. 6683.IZA.
Card, D., Dooley, M.D. and Abigail Payne, A. (2010). ‘School competition and efficiency with publicly fundedcatholic schools’, American Economic Journal: Applied Economics, vol. 2(4), pp. 150–76.
Clark, D., Martorell, P. and Rockoff, J.E. (2009). ‘School Principals and School Performance’, Working PaperNo. 38, Center for Analysis of Longitudinal Data in Education Research.
Coelli, M. and Green, D.A. (2012). ‘Leadership effects: school principals and student outcomes’, Economics ofEducation Review, vol. 31(1), pp. 92–109.
Curto, V.E. and Fryer, R.G. (2014). ‘The potential of urban boarding schools for the poor: evidence fromSEED’. Journal of Labor Economics, vol. 32(1), pp. 65–93.
Dhuey, E. and Smith, J. (2011). ‘How important are school principals in the production of studentachievement?’ CLSSRN Working Paper clsrn_admin-2011-33, Vancouver School of Economics.
Di Liberto, A., Schivardi, F. and Sulis, G. (2013). ‘Managerial practices and students performance’, mimeo,Universita Degli Studi Di Milano, November.
Dobbie, W. and Fryer, R.G. (2011). ‘Are high quality schools enough to close the achievement gap? Evidencefrom a social experiment in Harlem’, American Economic Journal: Applied Economics, vol. 3(3), pp. 158–87.
Dobbie, W. and Fryer, R.G. (2013). ‘Getting beneath the veil of effective schools: evidence from New YorkCity’, American Economic Journal: Applied Economics, vol. 5(4), pp. 28–60.
Duflo, E., Hanna, R. and Ryan, S.P. (2012). ‘Incentives work: getting teachers to come to school’, AmericanEconomic Review, vol. 102(4), pp. 1241–78.
Eyles, A. and Machin, S. (2014) ‘The introduction of academy schools to England’s education’, mimeo,Centre for Economic Performance.
Fryer, R.G. (2014). ‘Injecting charter school best practices into traditional public schools: evidence from fieldexperiments. Quarterly Journal of Economics, vol. 129(3), pp. 1355–407.
Fryer, R.G. and Holden, R. (2012). ‘Multitasking, learning, and incentives: a cautionary tale’, Working PaperNo. 17752, National Bureau of Economic Research.
Fuchs, T. and Woessmann, L. (2007). ‘What accounts for international differences in student performance? Are-examination using PISA data’, Empirical Economics, vol. 32(2–3), pp. 433–64.
Gibbons, S., Machin, S. and Silva, O. (2008). ‘Choice, competition, and pupil achievement’, Journal of theEuropean Economic Association, vol. 6(4), pp. 912–47.
Grissom, J.A. and Loeb, S. (2011). ‘Triangulating principal effectiveness how perspectives of parents,teachers, and assistant principals identify the central importance of managerial skills’, AmericanEducational Research Journal, vol. 48(5), pp. 1091–123.
© 2015 Royal Economic Society.
2015] DO E S M AN AG EM EN T MA T T E R F O R S CHOO L S ? 673

Hanushek, E.A. (1979). ‘Conceptual and empirical issues in the estimation of educational productionfunctions’, Journal of Human Resources, vol. 14(3), pp. 351–88.
Hanushek, E.A. and Rivkin, S.G. (2003). ‘Does public school competition affect teacher quality?’ in (C.M.Hoxby, ed.), The Economics of School Choice, pp. 23–48, Chicago, IL: University of Chicago Press.
Hanushek, E.A. and Woessmann, L. (2010). ‘The economics of international differences in educationalachievement’, Working Paper No. 15949, National Bureau of Economic Research.
Hanushek, E.A., Link, S. and Woessmann, L. (2013). ‘Does school autonomy make sense everywhere? Panelestimates from PISA’, Journal of Development Economics, vol. 104(September), pp. 212–32.
Horng, E.L., Klasik, D. and Loeb, S. (2010). ‘Principal’s time use and school effectiveness’, American Journal ofEducation, vol. 116(4), pp. 491–523.
Hoxby, C.M. (2000). ‘Does competition among public schools benefit students and taxpayers?’, AmericanEconomic Review, vol. 90(5), pp. 1209–38.
Hoxby, C.M. and Murarka, S. (2009). ‘Charter schools in New York City: who enrolls and how they affect theirstudents’ achievement’, Working Paper No. 14852, National Bureau of Economic Research.
Hsieh, C.-T. and Urquiola, M. (2006). ‘The effects of generalized school choice on achievement andstratification: evidence from Chile’s voucher program’, Journal of Public Economics, vol. 90(8–9), pp. 1477–503.
Ichniowski, C., Shaw, K. and Prennushi, G. (1997). ‘The effects of human resource management practices onproductivity: a study of steel finishing lines’, American Economic Review, vol. 87(3), pp. 291–313.
Lavy, V. (2010). ‘Do differences in school’s instruction time explain international achievement gaps in math,science, and reading? Evidence from developed and developing countries’, Working Paper No. 16227,National Bureau of Economic Research.
Machin, S. and Vernoit, J. (2011). ‘Changing school autonomy: academy schools and their introduction toengland’s education’, Working Paper No. 123, Centre for the Economics of Education.
McCormack, J., Propper, C. and Smith, S. (2014). ‘Herding cats? Management and university performance’,ECONOMIC JOURNAL, vol. 124(578), pp. 534–64.
OECD. (2012). Public and Private Schools: How Management and Funding Relate to Their Socio-economic Profile.Paris: OECD Publishing.
Rao, G. (2014). ‘Familiarity does not breed contempt: generosity discrimination and diversity in Delhischools’, mimeo, UC Berkeley.
Rasul, I. and Rogger, D. (2013). ‘Management of bureaucrats and public service delivery: evidence from theNigerian civil service’, mimeo, UCL.
Rivkin, S.G., Hanushek, E.A. and Kain, J.F. (2005). ‘Teachers, schools, and academic achievement’,Econometrica, vol. 73(2), pp. 417–58.
Rothstein, J. (2005). ‘Does competition among public schools benefit students and taxpayers? A comment onHoxby (2000)’. Working Paper No. 11215. National Bureau of Economic Research.
Sahlgren, G.H. (2011). ‘Schooling for money: Swedish education reform and the role of the profit motive’,Economic Affairs, vol. 31(3), pp. 28–35.
Woessmann, L. (2005). ‘The effect heterogeneity of central examinations: evidence from TIMSS, TIMSS-repeat and PISA’, Education Economics, vol. 13(2), pp. 143–69.
Woessmann, L. (2010). ‘Cross-country evidence on teacher performance pay’, Working Paper No. 3151.CESifo.
Woessmann, L., L€udemann, E., Sch€utz, G. and West, M.R. (2007). ‘School accountability, autonomy, choice,and the level of student achievement’, Education Working Paper No. 13. OECD.
© 2015 Royal Economic Society.
674 TH E E CONOM I C J O U RN A L [ M A Y 2015]