Does lock-down of Wuhan effectively restrict early ...
8
RESEARCH ARTICLE Open Access Does lock-down of Wuhan effectively restrict early geographic spread of novel coronavirus epidemic during chunyun in China? A spatial model study Yi Hu 1† , Lingcai Kong 2† , Tong Yao 2 , Xinda Chen 2 and Wei Du 3* Abstract Background: Prior to Wuhan lock-down in 2020, chunyun, the largest population mobility on this planet, had begun. We quantified impact of Wuhan lock-down on COVID-19 spread during chunyun across the nation. Methods: During the period of January 1 to February 9, 2020, a total of 40,278 confirmed COVID-19 cases from 319 municipalities in mainland China were considered in this study. The cross-coupled meta-population methods were employed using between-city Baidu migration index. We modelled four scenarios of geographic spread of COVID- 19 including the presence of both chunyun and lock-down (baseline); lock-down without chunyun (scenario 1); chunyun without lock-down (scenario 2); and the absence of both chunyun and lock-down (scenario 3). Results: Compared with the baseline, scenario 1 resulted in 3.84% less cases by February 9 while scenario 2 and 3 resulted in 20.22 and 32.46% more cases by February 9. The geographic distribution of cases revealed that chunyun facilitated the COVID-19 spread in the majority but not all cities, and the effectiveness of Wuhan lock-down was offset by chunyun. Impacts of Wuhan lock-down during chunyun on the COVID-19 spread demonstrated heterogenetic geographic patterns. Conclusion: Our results strongly supported the travel restriction as one of the effective responses and highlighted the importance of developing area-specific rather than universal countermeasures. Keywords: Coronavirus, COVID-19, Geographic spread, Lock-down, Chunyun, China © The Author(s). 2021 Open Access This article is licensed under a Creative Commons Attribution 4.0 International License, which permits use, sharing, adaptation, distribution and reproduction in any medium or format, as long as you give appropriate credit to the original author(s) and the source, provide a link to the Creative Commons licence, and indicate if changes were made. The images or other third party material in this article are included in the article's Creative Commons licence, unless indicated otherwise in a credit line to the material. If material is not included in the article's Creative Commons licence and your intended use is not permitted by statutory regulation or exceeds the permitted use, you will need to obtain permission directly from the copyright holder. To view a copy of this licence, visit http://creativecommons.org/licenses/by/4.0/. The Creative Commons Public Domain Dedication waiver (http://creativecommons.org/publicdomain/zero/1.0/) applies to the data made available in this article, unless otherwise stated in a credit line to the data. * Correspondence: [email protected] † Yi Hu and Lingcai Kong contributed equally to this work. 3 Key Laboratory of Environmental Medicine Engineering, Ministry of Education; School of Public Health, Southeast University, Nanjing 210009, Jiangsu, China Full list of author information is available at the end of the article Hu et al. BMC Public Health (2021) 21:825 https://doi.org/10.1186/s12889-021-10837-2
Transcript of Does lock-down of Wuhan effectively restrict early ...

RESEARCH ARTICLE Open Access
Does lock-down of Wuhan effectivelyrestrict early geographic spread of novelcoronavirus epidemic during chunyun inChina? A spatial model studyYi Hu1†, Lingcai Kong2†, Tong Yao2, Xinda Chen2 and Wei Du3*
Abstract
Background: Prior to Wuhan lock-down in 2020, chunyun, the largest population mobility on this planet, hadbegun. We quantified impact of Wuhan lock-down on COVID-19 spread during chunyun across the nation.
Methods: During the period of January 1 to February 9, 2020, a total of 40,278 confirmed COVID-19 cases from 319municipalities in mainland China were considered in this study. The cross-coupled meta-population methods wereemployed using between-city Baidu migration index. We modelled four scenarios of geographic spread of COVID-19 including the presence of both chunyun and lock-down (baseline); lock-down without chunyun (scenario 1);chunyun without lock-down (scenario 2); and the absence of both chunyun and lock-down (scenario 3).
Results: Compared with the baseline, scenario 1 resulted in 3.84% less cases by February 9 while scenario 2 and 3resulted in 20.22 and 32.46% more cases by February 9. The geographic distribution of cases revealed that chunyunfacilitated the COVID-19 spread in the majority but not all cities, and the effectiveness of Wuhan lock-down wasoffset by chunyun. Impacts of Wuhan lock-down during chunyun on the COVID-19 spread demonstratedheterogenetic geographic patterns.
Conclusion: Our results strongly supported the travel restriction as one of the effective responses and highlightedthe importance of developing area-specific rather than universal countermeasures.
Keywords: Coronavirus, COVID-19, Geographic spread, Lock-down, Chunyun, China
© The Author(s). 2021 Open Access This article is licensed under a Creative Commons Attribution 4.0 International License,which permits use, sharing, adaptation, distribution and reproduction in any medium or format, as long as you giveappropriate credit to the original author(s) and the source, provide a link to the Creative Commons licence, and indicate ifchanges were made. The images or other third party material in this article are included in the article's Creative Commonslicence, unless indicated otherwise in a credit line to the material. If material is not included in the article's Creative Commonslicence and your intended use is not permitted by statutory regulation or exceeds the permitted use, you will need to obtainpermission directly from the copyright holder. To view a copy of this licence, visit http://creativecommons.org/licenses/by/4.0/.The Creative Commons Public Domain Dedication waiver (http://creativecommons.org/publicdomain/zero/1.0/) applies to thedata made available in this article, unless otherwise stated in a credit line to the data.
* Correspondence: [email protected]†Yi Hu and Lingcai Kong contributed equally to this work.3Key Laboratory of Environmental Medicine Engineering, Ministry ofEducation; School of Public Health, Southeast University, Nanjing 210009,Jiangsu, ChinaFull list of author information is available at the end of the article
Hu et al. BMC Public Health (2021) 21:825 https://doi.org/10.1186/s12889-021-10837-2
Contributions to the literature
� Chunyun, the largest population mobility on this planet, was
a stimulus of the early geographic spread of COVID-19 in
China.
� Domestic travel restriction served as one of the effective
emergency responses to the COVID-19 outbreak.
� Area-specific countermeasures with particular relevance to
many countries around the world that faced massive inter-
city travel demands would include continuing restriction on
population mobility.
BackgroundSince early December 2019, an increasing number ofatypical pneumonia have been reported in Wuhan [1], acity with a population of 11 million in the central part ofChina. In response to this outbreak, the Chinese Centerfor Disease Control and Prevention (China CDC) con-ducted an epidemiologic and etiologic investigation onDecember 31, 2019 [2], and found that human-to-human transmission occurred since the middle of De-cember 2019 [3], and isolated and confirmed a novelstrain of coronavirus on 7 January 2020 [4]. Along withthe increasing number of COVID-19 cases in China, thegeographic spread at a meta-population level (e.g. be-tween cities in China, Asia-pacific regions, or northernhemisphere countries) has been reported [5].When human-to-human transmission demonstrated a
population health threat, use of restrictive measuressuch as isolation of cases and quarantine of contacts be-came one of the apparent emergency responses to theCOVID-19 outbreak [6]. However, a substantial chal-lenge has emerged when chunyun, the largest humanmigration on the planet, beginning on Jan 10, 2020 withbillions of trips made for family reunions to celebratethe Spring Festival during the national holidays fromJanuary 24 to 31 [7]. Geographic spread of COVID-19would have potentially be accelerated by chunyun underthis circumstance, and therefore prevention and controlof the COVID-19 infiltration into local communitiesacross the nation would require immediate actions to re-strict human movements. On January 23 and 24, 2020,the Chinese central government implemented themetropolis-wide lock-down of Wuhan and its surround-ing satellite cities [3]. In addition to the Wuhan lock-down, the central government announced the extensionof the national holidays, the Spring Festival, and set theback to work date as of February 10, 2020 (except Wu-han) [8].In the face of this unprecedented threat and lack of ef-
fective countermeasures, the authorities invoked thelock-down of Wuhan as a means to interrupt the
geographic spread of COVID-19 and expected to achievethe disease control goals [9]. Although several studies in-vestigated the impact of city lockdown on the diseasespread [10–12], population based evidence is inadequateregarding their individual roles of city lockdown andchunyun as well as their aggregated role on the spread ofCOVID-19 in real world settings. This study aimed toevaluate the effectiveness of Wuhan lock-down for pre-venting the spread of COVID-19 at an early stage, andexamine whether the effectiveness would vary accordingto the presence or absence of chunyun and lock-down.
MethodsData sourcesProvincial Health Commissions in mainland of China, incollaboration with provincial and municipal CDCs, havevalidated, documented, and reported municipal-level in-cident numbers of COVID-19 suspected, confirmedly in-fected, recovered, and deceased individuals, respectivelyon a daily basis since January 2020 [13]. We included atotal of 319 municipalities having at least onelaboratory-confirmed case and ascertained the dailynumbers of COVID-19 cases in each city from January 1to February 9, 2020. These data were publically availableand therefore this study was exempted for ethics ap-proval by institutional review boards with respect to datacollection, analysis and reporting. The study outcomewas the laboratory-confirmed COVID-19 incidents.Baidu Migration Index is a free data analytic platform
using Baidu web search and Baidu news to presentmassive behavioral data among Baidu users, which hasbeen frequently used to reflect population mobility inChina [14]. We obtained Baidu Migration Index fromJanuary 1 to February 9, 2020 to quantify the daily num-ber of travelers between pair-wise cities. The specificnumber of travelers from city i to j at day t, Xi, j, t, wascalculated as follows:
Xi; j;t ¼ pi; j;t�No whpwh
ð1Þ
where pi, j, t is the migration index from city i to j at dayt, No _wh is the number of travelers leaving Wuhan dur-ing January 10 to January 19, 2020 (prespecified as 4.10million [15]), and pwh is the sum of traveling index fromWuhan to all the other cites during the same period.
Statistical analysisWe used the cross-coupled meta-population (epidemic)model with an addition of population mobility matrix tocomplement the standard Susceptible-Exposed-Infectious-Removed (SEIR) model considering the geo-graphic spread of COVID-19 between cities across thenation:
Hu et al. BMC Public Health (2021) 21:825 Page 2 of 8
dSidt
¼ −βtSiXn
j¼1
φi; j;tI jNi
ð2Þ
dEi
dt¼ βtSi
Xn
j¼1
φi; j;tI jNi
−αEi ð3Þ
dIidt
¼ αEi−γIi ð4Þ
dRi
dt¼ γIi ð5Þ
where Si, Ei, Ii, and Ri are the numbers of susceptible, ex-posed, infectious, and recovered individuals, respectively,and Ni is the total population size of city i, βt is thetransmission parameter (we assumed it is the sameacross all cities) at time t, φi, j, t is the proportion of indi-viduals moving to city i from city j at time t, α is the la-tent rate, and γ is the recovery rate. For the convenienceof model fitting, we added another compartment (K) tothe above equations to keep track of cumulative inci-dence as follows:
dKi
dt¼ αEi ð6Þ
Of meta-population models, there are mainly twotypes: cross-coupled and mobility models, in which in-dividuals in all states move. There is, however, no ad-vantage of one over the other [16]. Model fitting was
achieved by treating the differential equation (Eq. 6) asrepresenting the mean number of cumulative cases perday in China during the study period. Parameter infer-ence was achieved by least square (LS) estimation usingL-BFGS-B optimization with the optim() function in theR statistical language (R Core Team, 2020). Uncertaintywas analyzed using parametric bootstrap method. Atotal of 1000 simulations from the model (Eq. 6) wasfirstly generated using the LS estimates of the parame-ters. Each simulated dataset was then re-fitted into themodel to construct a joint sampling distribution of theparameters, with 95% confidence interval estimatedusing the lower 2.5% and upper 97.5% quantiles.The instantaneous basic reproductive number (R0t)
was calculated by βt/γ. We then simulated the prob-able course of the COVID-19 spread conditioned ondifferent modelling scenarios (ESRI Inc., 2020), in-cluding the presence of both chunyun and lock-down(baseline, the real world scenario); lock-down withoutchunyun (scenario 1); chunyun without lock-down(scenario 2); and the absence of both chunyun andlock-down (scenario 3).
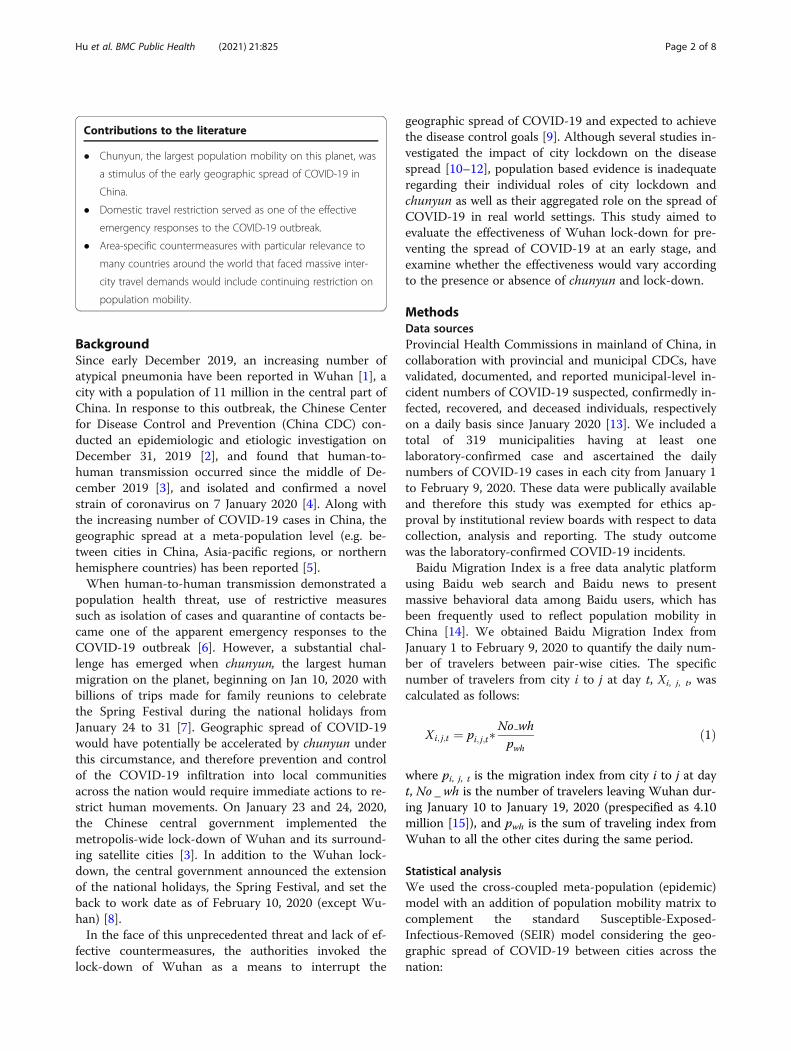
ResultsDuring the period of January 1 to February 9, 2020, atotal of 40,278 confirmed COVID-19 cases from 319municipalities in mainland China were reported(Fig. 1). Across China, the population mobility had
Fig. 1 Cumulative cases of COVID-19 in China on February 9, 2020. This figure was produced in ArcGIS 10.4.1 (ESRI, Redlands, CA, USA) usingshape files representing China’s municipal-level administrative units freely downloaded from Resource and Environment Science and DataCenter (http://www.resdc.cn/data.aspx?DATAID=201)
Hu et al. BMC Public Health (2021) 21:825 Page 3 of 8

been increasing since the start of chunyun andreached the greatest on January 21 and then de-creased afterward (Fig. 2). While the patterns ofpopulation inflow and outflow in China were similar,these patterns for population inflow to and outflowfrom Wuhan presented in different ways. The popula-tion outflow from Wuhan showed a generally increas-ing trend up to January 22 whereas the populationinflow to Wuhan remained almost constant. It isnoteworthy for Wuhan that the population outflowwas always greater than the population inflow untilJanuary 26 (shortly after the announcement of lock-down). Change of population outflow from Wuhanwas also noteworthy for the sharp increase afterannouncement of human-to-human transmission ofCOVID-19 on January 20.Figures 3a and b illustrates a reasonably good model
fit and the time-varying estimates of basic reproductivenumber (R0t) of COVID-19 during the study period.Although we assumed R0t varies over time, it stayed atthe same level from January 1 to 25 and fell from 3.47 to3.24 from January 26 onwards. Note that it slightly in-creased to 3.27 on February 9. The modelled latent andinfectious time of COVID-19 was 6.11 days (95%CI:3.13, 10.63) and 3.26 days (95%CI: 1.06,5.16),respectively.
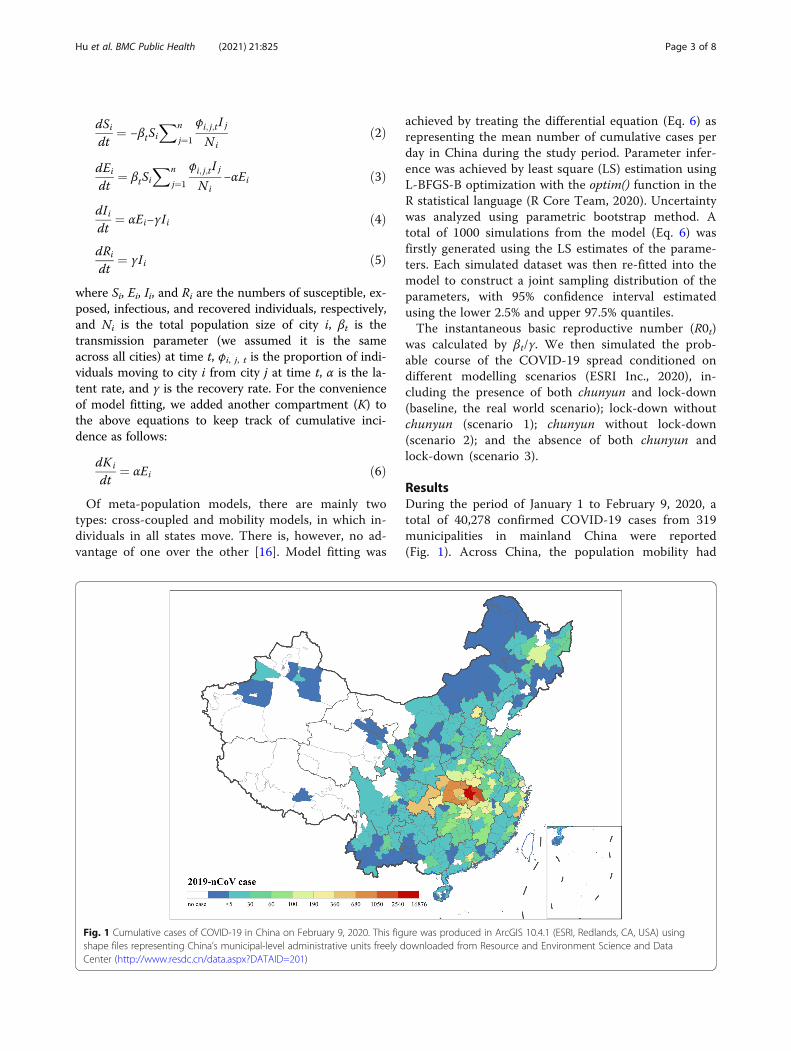
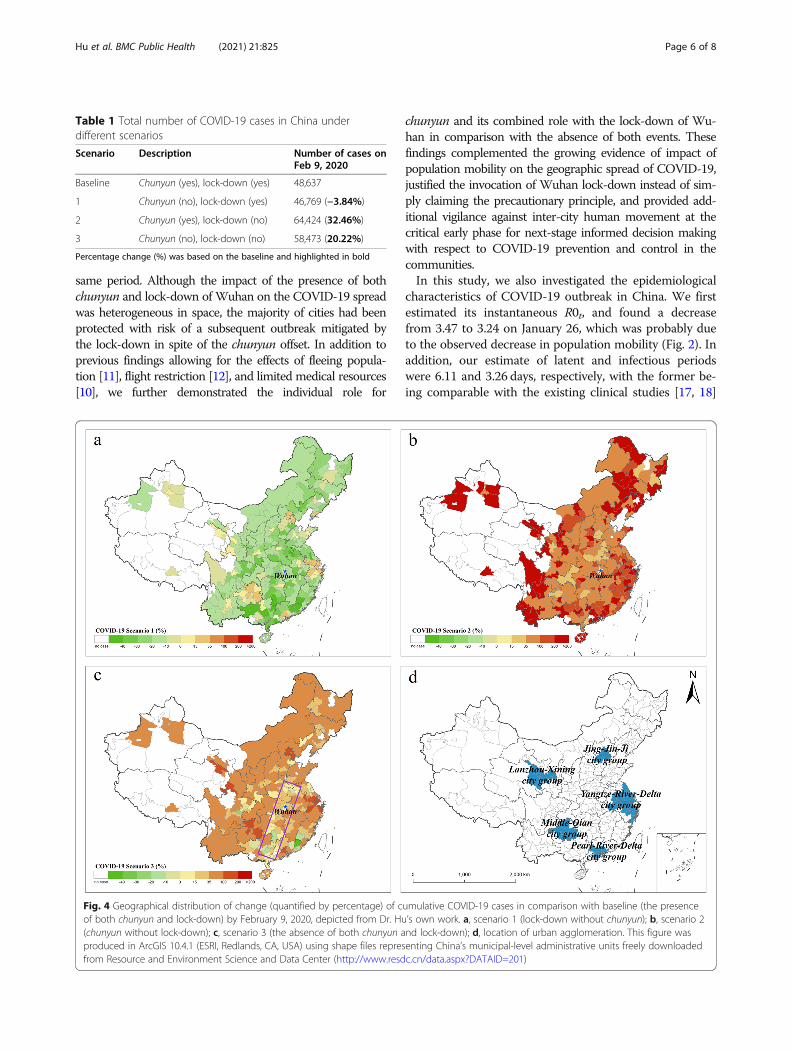
Table 1 displays cumulative number of COVID-19cases in China during the study period under differentmodelling scenarios. Under Scenario 1, the COVID-19epidemic would have resulted in 3.84% less cases thanthe baseline by February 9, indicating that chunyun facil-itated the spread of this infectious disease. Comparedwith the baseline scenario, scenario 2 would have pro-duced 32.46% more COVID-19 cases, demonstrating theprotective effectiveness of Wuhan lock-down. UnderScenario 3, the COVID-19 epidemic would have resultedin 20.22% more cases than the baseline in the absence ofchunyun and lock-down.Figure 4 demonstrates the geographic distribution of
change in cumulative COVID-19 cases comparing differ-ent scenarios with the baseline scenario (the presence ofboth chunyun and lock-down) by February 9, 2020.Under scenario 1 (Fig. 4a), the majority of cities showeda relatively sharp change in case reduction despite thenuance expression in a few populous cities, indicatingthat chunyun was not a common stimulus for theCOVID-19 spread across the nation. Under scenario 2(Fig. 4b), all the cities would have had greater number ofcases in the absence of lock-down, in particular, those innortheast, south and west China would have an increaseover 100%, indicating the protective effect of Wuhanlock-down on preventing additional disease penetration
Fig. 2 Population migration in Wuhan (a) and China (b and c), depicted from Dr. Hu’s own work
Hu et al. BMC Public Health (2021) 21:825 Page 4 of 8

towards all the other cities in China. Under scenario 3(Fig. 4c), the protective effect of Wuhan lock-down var-ied in space and was offset by the presence of chunyun,especially for those corridor cities near Wuhan. Notethat areas with over 100% increase of cases (in dark redcolor) under this scenario were mainly located withinthe five city groups shown in Fig. 4d.
DiscussionIn this retrospective analysis of 40,278 confirmed COVID-19cases in China, we modelled 3 exposure scenarios using
publically available data reported on a daily basis by localpublic health authorities. These scenarios differed in the ex-posure to chunyun, the largest population mobility on theearth, and Wuhan lock-down, the unprecedented control of11 million people’s movement in response to the rapidspread of COVID-19 from the city. Of the simulations ofthree exposure scenarios, the lock-down of Wuhan remark-ably demonstrated the protective effects by preventing32.46% COVID-19 incidents by February 9, 2020, whereaschunyun contributed towards the observed geographicspread and would have produced 3.84% more cases by the
Fig. 3 a, Model fitting with the cumulative cases of COVID-19 in China; b, instantaneous basic reproductive number (R0t) of COVID-19 during Jan1 to Feb 9, 2020
Hu et al. BMC Public Health (2021) 21:825 Page 5 of 8
same period. Although the impact of the presence of bothchunyun and lock-down of Wuhan on the COVID-19 spreadwas heterogeneous in space, the majority of cities had beenprotected with risk of a subsequent outbreak mitigated bythe lock-down in spite of the chunyun offset. In addition toprevious findings allowing for the effects of fleeing popula-tion [11], flight restriction [12], and limited medical resources[10], we further demonstrated the individual role for
chunyun and its combined role with the lock-down of Wu-han in comparison with the absence of both events. Thesefindings complemented the growing evidence of impact ofpopulation mobility on the geographic spread of COVID-19,justified the invocation of Wuhan lock-down instead of sim-ply claiming the precautionary principle, and provided add-itional vigilance against inter-city human movement at thecritical early phase for next-stage informed decision makingwith respect to COVID-19 prevention and control in thecommunities.In this study, we also investigated the epidemiological
characteristics of COVID-19 outbreak in China. We firstestimated its instantaneous R0t, and found a decreasefrom 3.47 to 3.24 on January 26, which was probably dueto the observed decrease in population mobility (Fig. 2). Inaddition, our estimate of latent and infectious periodswere 6.11 and 3.26 days, respectively, with the former be-ing comparable with the existing clinical studies [17, 18]
Fig. 4 Geographical distribution of change (quantified by percentage) of cumulative COVID-19 cases in comparison with baseline (the presenceof both chunyun and lock-down) by February 9, 2020, depicted from Dr. Hu’s own work. a, scenario 1 (lock-down without chunyun); b, scenario 2(chunyun without lock-down); c, scenario 3 (the absence of both chunyun and lock-down); d, location of urban agglomeration. This figure wasproduced in ArcGIS 10.4.1 (ESRI, Redlands, CA, USA) using shape files representing China’s municipal-level administrative units freely downloadedfrom Resource and Environment Science and Data Center (http://www.resdc.cn/data.aspx?DATAID=201)
Table 1 Total number of COVID-19 cases in China underdifferent scenarios
Scenario Description Number of cases onFeb 9, 2020
Baseline Chunyun (yes), lock-down (yes) 48,637
1 Chunyun (no), lock-down (yes) 46,769 (−3.84%)
2 Chunyun (yes), lock-down (no) 64,424 (32.46%)
3 Chunyun (no), lock-down (no) 58,473 (20.22%)
Percentage change (%) was based on the baseline and highlighted in bold
Hu et al. BMC Public Health (2021) 21:825 Page 6 of 8

and the latter, being rarely reported. Compared with thepreviously reported basic reproductive number (R0) whichwere fixed and ranged from 2.24 to 3.80 [3, 18–20], ourestimate was derived from a time varying model, whichwas somewhat more reliable as we have taken into ac-count a larger sample size as well as population mobilitybetween cities that would potentially affect both the con-tact rates between individuals and subsequently the esti-mation of COVID-19 spread. Notwithstanding thedecrease of R0t, there was an increasing trend on February9 which corresponded to the time when migrants returnedto study or work. Considering the contribution of chu-nyun towards geographic spread of COVID-19, this re-bound trend of R0t implied that the epidemic wouldperhaps spread more rapidly and move into the next stageof becoming endemic. Therefore, continuing efforts withrigorous prevention and control measures are requiredand expected to be strictly implemented in the communi-ties including social distancing and home quarantine.We estimated the COVID-19 occurrence under three
scenarios and their respective changes in relation to thebaseline incidents for each city. We found that there wasevidently spatial heterogeneity in effects of chunyun and/or Wuhan lock-down. In principle, chunyun contributedtowards the COVID-19 spread in China (Table 1) butnot specifically for each locality (Fig. 4a), while the Wu-han lock-down restricted the subsequent spread towardsthe other cities across the nation (Table 1, Fig. 4b). Inthe absence of both chunyun and lock-down (Fig. 4c),more evident reduction in COVID-19 incidents wouldhave occurred for five major urban agglomerations.These urban agglomerations (Fig. 4d) consist of twokinds of city clusters, i.e., well-developed megacities, andthe others nested in the undeveloped regions of China.There is an obvious speculation that these clusterswould experience similar outgoing and ingoing travel de-mands all year round, and therefore the effects of chu-nyun would be nuance. It is noteworthy that corridorcities near Wuhan (Fig. 4c) did not benefit much fromthe Wuhan lock-down as its protective effect was offsetby chunyun. These corridor cities would perhaps be-come a case reservoir prior to the lock-down of Wuhan.Therefore, these corridor cities should be given a priorityfor continuing efforts in allocation of healthcare re-sources. Additional strategies should be developed basedon their area-level characteristics.Evidence of comparative effectiveness of large-scale
lock-down on 11-million populations is rare because theoutbreak of contagious disease of this kind is highly un-usual and so is to have reliable national data. Using alarger sample size than previous studies and clear evi-dence of exposure, our findings are somewhat robust.However, there are some limitations. First, the use of de-terministic SEIR model would be acceptable given the
successful control of COVID-19 in China [21]. Yet, ouranalysis did not consider the under-reporting of casesduring the study period, due in part to the pre-symptomatic transmission and asymptomatic individualsare neglected [22], which may result in an underestima-tion bias of our results. Iterated filtering algorithm suchas Maximum Likelihood Estimation or Bayesian ap-proach could be another option [23], especially in othersettings with much more uncertainties than that ofChina. Second, the mathematical model is a determinis-tic model which cannot capture stochastic effects duringthe spread of COVID-19 under the influence of multiplesocio-environmental factors. This may bias the numberof incident cases of a modelled scenario. Third, we con-sidered municipal cities as the spatial components, how-ever, these publically available data were sparse at thecity level for modelling a city-specific reproduction num-ber, and therefore we assumed it the same across all cit-ies. Although that the reproduction number for theentire country we calculated in this study is not substan-tially different from the others using a general SEIRmodel, it is possible that the transmissibility of COVID-19 might change from place to place. The basicreproduction number in the current setting could beunderestimated, especially when the restricted travels ofall SEIR individuals would underestimate the number ofactive cases in each region [24]. Considering that fewerpeople travel making each region behaving as epidemio-logically isolated region in the presence of lockdown, fu-ture studies would focus on the identification of hot-spot cities at risks of becoming endemic allowing forgeographical variation in reproduction number estima-tion. Fourth, the three simulated scenarios were basedon different restrictive measures of population mobility,lacking control of other confounding factors, and there-fore results should be interpreted with caution.
ConclusionSeventeen years after the Severe Acute Respiratory Syn-drome (SARS) epidemic, the current COVID-19 pan-demic serves as a reminder of how rapidly novelpathogens could appear and spread across the nationand in the world with devastating consequences. Our re-sults strongly supported the travel restriction as one ofthe emergency responses to this global population healththreat, provided evidence that chunyun was a stimulusof the geographic spread of COVID-19 in China, andhighlighted the importance of developing area-specificcountermeasures. The simulations suggested continuingrestriction on population mobility where appropriatehelp in prevention and control of the COVID-19 pan-demic. This was in particular relevance to any receivingcities in China and many other countries around theworld that faced massive inter-city travel demands.
Hu et al. BMC Public Health (2021) 21:825 Page 7 of 8
AbbreviationsCDC: Center for Disease Control and Prevention; COVID-19: COrona VIrusDisease 2019; SARS: Severe Acute Respiratory Syndrome
AcknowledgementsWe thank A/Prof Yilan Liao for her advice and critical comments.
Authors’ contributionsAnalyzed the data: YH LCK. Wrote the first draft of the manuscript: YH WD.Contributed to the writing of the manuscript: YH LCK TY XDC WD. Agreewith the manuscript’s results and conclusions: YH LCK TY XDC WD.Conceived and designed the analyses: YH. Contributed data: LCK TY XDC. Allauthors have read, and confirm that they meet, ICMJE criteria for authorship.The author(s) read and approved the final manuscript.
FundingThis study was supported by the Department of Education [No.1125000172],National Science and Technology Major Project of China [No.2018ZX10713001], Jiangsu Provincial Major Science & TechnologyDemonstration Project [No. BE2017749], National Natural Science Foundationof China [Grant Number:41101431, 41531179,41421001, 41471377, 81773487]and Fundamental Research Funds for the Central Universities [No.2017BD0094/9161017003/3225002002A1]. These funders have no roles instudy design, data collection and analysis, preparation of the manuscript, ordecision to publish.
Availability of data and materialsProvincial Health Commissions in mainland of China have reportedmunicipal-level incident numbers of COVID-19 suspected, confirmedly in-fected, recovered, and deceased individuals, respectively on a daily basissince January 2020 (National Health Commission of China. Daily updates onthe pneumonia epidemic situation. http://www.nhc.gov.cn/xcs/yqtb/list_gzbd.shtml). Public access to this daily data release and update is open as atApril 2, 2021. Baidu Migration Index data are publically available and couldbe obtained from https://qianxi.baidu.com/. Data from this study are avail-able from the authors upon reasonable request.
Declarations
Ethics approval and consent to participateNot required.
Consent for publicationNot applicable.
Competing interestsNone declared.
Author details1Department of Epidemiology and Biostatistics, School of Public Health,Fudan University, Shanghai 200032, China. 2Department of Mathematics andPhysics, North China Electric Power University, Baoding 071003, China. 3KeyLaboratory of Environmental Medicine Engineering, Ministry of Education;School of Public Health, Southeast University, Nanjing 210009, Jiangsu, China.
Received: 14 November 2020 Accepted: 13 April 2021
References1. Cohen J, Normile D. New SARS-like virus in China triggers alarm. Science.
2020;367(6475):234–5. https://doi.org/10.1126/science.367.6475.234.2. Zhu N, Zhang D, Wang W, Li X, Yang B, Song J, et al. A novel coronavirus
from patients with pneumonia in China, 2019. New Engl J Med. 2020;382(8):727–33. https://doi.org/10.1056/NEJMoa2001017.
3. Wu JT, Leung K, Leung GM. Nowcasting and forecasting the potentialdomestic and international spread of the 2019-nCoV outbreak originating inWuhan, China: a modelling study. Lancet. 2020;395(10225):689–97. https://doi.org/10.1016/S0140-6736(20)30260-9.
4. Tan W, Zhao X, Ma X, Wang W, Niu P, Xu W, et al. A novel coronavirusgenome identified in a cluster of pneumonia cases—Wuhan, China 2019–
2020. China CDC Weekly. 2020;2(4):61–2. https://doi.org/10.46234/ccdcw2020.017.
5. Paules CI, Marston HD, Fauci AS. Coronavirus infections—more than just thecommon cold. JAMA. 2020;323(8):707–8. https://doi.org/10.1001/jama.2020.0757.
6. Patel A, Marston HD, Fauci AS. Initial public health response and interimclinical guidance for the 2019 novel coronavirus outbreak—United States,December 31, 2019–February 4, 2020. Morb Mortal Wkly Rep. 2020;69(5):140–6. https://doi.org/10.15585/mmwr.mm6905e1.
7. Guide TC: Chunyun - Spring Festival Travel Rush in China; https://www.travelchinaguide.com/china-trains/spring-festival-rush.htm [Accessed 10 Feb2020].
8. The Chinese government. Notice of the General Office of the State Councilon Extending the Spring Festival Holiday of 2020; http://www.bjrd.gov.cn/tzgg/202002/t20200207_201313.html [Accessed 10 Feb 2020].
9. XinHuaNet. WHO praises China's effective control measures, calls for worldpreparedness, not panic; http://www.gov.cn/xinwen/2020-01/27/content_5472383.htm [Accessed 10 Feb 2020].
10. Sun G, Wang S, Li M, Li L, Zhang J, Zhang W, et al. Transmission dynamicsof COVID-19 in Wuhan, China: effects of lockdown and medical resources.Nonlin Dynam. 2020;101(3):1981–93. https://doi.org/10.1007/s11071-020-05770-9.
11. Yuan Z, Xiao Y, Dai Z, Huang J, Zhang Z, Chen Y. Modelling the effects ofWuhan's lockdown during COVID-19, China. Bull World Health Organ. 2020;98(7):484–94. https://doi.org/10.2471/BLT.20.254045.
12. Lau H, Khosrawipour V, Kocbach P, Mikolajczyk A, Schubert J, Bania J, et al.The positive impact of lockdown in Wuhan on containing the COVID-19outbreak in China. J Travel Med. 2020;27(3).
13. National Health Commission of China. Daily updates on the pneumoniaepidemic situation.; http://www.nhc.gov.cn/xcs/yqtb/list_gzbd.shtml[Accessed 11 April 2020].
14. Huang X, Zhang L, Ding Y. The Baidu index: uses in predicting tourismflows –a case study of the Forbidden City. Tour Manag. 2017;58:301–6.https://doi.org/10.1016/j.tourman.2016.03.015.
15. Sina. How many people will leave from Wuhan during chunyun of 2020.;https://finance.sina.cn/2020-01-22/detail-iihnzahk5804703.d.html [Accessed10 Feb 2020].
16. Wang Z, Andrews MA, Wu Z, Wang L, Bauch CT. Coupled disease–behaviordynamics on complex networks: a review. Phys Life Rev. 2016;15:1–29.
17. Li Q, Guan X, Wu P, Wang X, Zhou L, Tong Y, et al. Early transmissiondynamics in Wuhan, China, of novel coronavirus–infected pneumonia. NewEngl J Med. 2020;382(13):1199–207. https://doi.org/10.1056/NEJMoa2001316.
18. Liu T, Hu J. Transmission dynamics of 2019 novel coronavirus (2019-nCoV).medRxiv. 2020. https://doi.org/10.1101/2020.01.25.919787.
19. Read J, Bridgen J, Cummings D, Ho A, Jewell C. Novel coronavirus 2019-nCoV: early estimation of epidemiological parameters and epidemicpredictions. medRxiv. 2020. https://doi.org/10.1101/2020.01.23.20018549.
20. Zhao S, Lin Q, Ran J, Musa SS, Yang G, Wang W, et al. Preliminary estimationof the basic reproduction number of novel coronavirus (2019-nCoV) inChina, from 2019 to 2020: A data-driven analysis in the early phase of theoutbreak. Int J Infect Dis. 2020;92:214–7.
21. Burki T. China's successful control of COVID-19. Lancet Infect Dis. 2020;20(11):1240–1. https://doi.org/10.1016/S1473-3099(20)30800-8.
22. Prem K, Liu Y, Russell TW, Kucharski AJ, Eggo RM, Davies N, et al. The effectof control strategies to reduce social mixing on outcomes of the COVID-19epidemic in Wuhan, China: a modelling study. Lancet Public Health. 2020;5(5):e261–70. https://doi.org/10.1016/S2468-.
23. King AA, de Cellès DM, Magpantay FM, Rohani P. Avoidable errors in themodelling of outbreaks of emerging pathogens, with special reference toEbola. Proc R Soc B Biol Sci. 2015;282(1806):20150347. https://doi.org/10.1098/rspb.2015.0347.
24. Xiaoqian J, Junxi C, Liangjing L, Na J, Bahabaike J, Tao X, Le Z, Zhiwen L,Rongwei Y, Bin W. Modeling the Prevalence of Asymptomatic COVID-19Infections in the Chinese Mainland. The Innovation. 2020;1(2):100026.
Publisher’s NoteSpringer Nature remains neutral with regard to jurisdictional claims inpublished maps and institutional affiliations.
Hu et al. BMC Public Health (2021) 21:825 Page 8 of 8