DOES KNOWLEDGE ACCUMULATION INCREASE THE …
35
NBER WORKING PAPER SERIES DOES KNOWLEDGE ACCUMULATION INCREASE THE RETURNS TO COLLABORATION? Ajay Agrawal Avi Goldfarb Florenta Teodoridis Working Paper 19694 http://www.nber.org/papers/w19694 NATIONAL BUREAU OF ECONOMIC RESEARCH 1050 Massachusetts Avenue Cambridge, MA 02138 December 2013 This research was funded by the Centre for Innovation and Entrepreneurship at the Rotman School of Management, the Martin Prosperity Institute, and the Social Sciences and Humanities Research Council of Canada. We thank Kirk Doran, Danielle Li, and seminar participants at the Organization, Economics, and Policy of Scientific Research workshop, REER, the Workshop on Scholarly Communication and Open Science, Carnegie Mellon University, Indiana University, and the University of Toronto for valuable feedback. The views expressed herein are those of the authors and do not necessarily reflect the views of the National Bureau of Economic Research. At least one co-author has disclosed a financial relationship of potential relevance for this research. Further information is available online at http://www.nber.org/papers/w19694.ack NBER working papers are circulated for discussion and comment purposes. They have not been peer- reviewed or been subject to the review by the NBER Board of Directors that accompanies official NBER publications. © 2013 by Ajay Agrawal, Avi Goldfarb, and Florenta Teodoridis. All rights reserved. Short sections of text, not to exceed two paragraphs, may be quoted without explicit permission provided that full credit, including © notice, is given to the source.
Transcript of DOES KNOWLEDGE ACCUMULATION INCREASE THE …
NBER WORKING PAPER SERIES
DOES KNOWLEDGE ACCUMULATION INCREASE THE RETURNS TO COLLABORATION?
Ajay AgrawalAvi Goldfarb
Florenta Teodoridis
Working Paper 19694http://www.nber.org/papers/w19694
NATIONAL BUREAU OF ECONOMIC RESEARCH1050 Massachusetts Avenue
Cambridge, MA 02138December 2013
This research was funded by the Centre for Innovation and Entrepreneurship at the Rotman Schoolof Management, the Martin Prosperity Institute, and the Social Sciences and Humanities ResearchCouncil of Canada. We thank Kirk Doran, Danielle Li, and seminar participants at the Organization,Economics, and Policy of Scientific Research workshop, REER, the Workshop on ScholarlyCommunication and Open Science, Carnegie Mellon University, Indiana University, and the Universityof Toronto for valuable feedback. The views expressed herein are those of the authors and do notnecessarily reflect the views of the National Bureau of Economic Research.
At least one co-author has disclosed a financial relationship of potential relevance for this research.Further information is available online at http://www.nber.org/papers/w19694.ack
NBER working papers are circulated for discussion and comment purposes. They have not been peer-reviewed or been subject to the review by the NBER Board of Directors that accompanies officialNBER publications.
© 2013 by Ajay Agrawal, Avi Goldfarb, and Florenta Teodoridis. All rights reserved. Short sectionsof text, not to exceed two paragraphs, may be quoted without explicit permission provided that fullcredit, including © notice, is given to the source.

Does Knowledge Accumulation Increase the Returns to Collaboration?Ajay Agrawal, Avi Goldfarb, and Florenta TeodoridisNBER Working Paper No. 19694December 2013JEL No. J24,L23,O31,O33
ABSTRACT
We conduct the first empirical test of the knowledge burden hypothesis, one of several theories advancedto explain increasing team sizes in science. For identification, we exploit the collapse of the USSR asan exogenous shock to the knowledge frontier causing a sudden release of previously hidden research.We report evidence that team size increased disproportionately in Soviet-rich relative to -poor subfieldsof theoretical mathematics after 1990. Furthermore, consistent with the hypothesized mechanism,scholars in Soviet-rich subfields disproportionately increased citations to Soviet prior art and becameincreasingly specialized.
Ajay AgrawalRotman School of ManagementUniversity of Toronto105 St. George StreetToronto, ON M5S 3E6CANADAand [email protected]
Avi GoldfarbRotman School of ManagementUniversity of Toronto105 St George StToronto, ON M5S [email protected]
Florenta TeodoridisRotman School of ManagementUniversity of Toronto105 St. George StreetToronto, ON M5S [email protected]
1 Introduction
Research teams are growing in size (Jones, 2011). Several theories explain the rise in col-
laboration, including the accumulation of knowledge (Jones, 2009), declining communication
costs (Agrawal and Goldfarb, 2008; Kim et al, 2009), increasing capital intensity, shifting au-
thorship norms, and increasing returns to research portfolio diversification (Stephan, 2012).
These different explanations yield distinct policy implications regarding, for example, sub-
sidies to higher education and the composition of research evaluation committees (Jones,
2010).
We examine whether knowledge accumulation leads to increased collaboration and report
evidence consistent with Jones’ (2009) burden of knowledge hypothesis. While we do not
rule out other explanations as possible additional drivers of the increasing rate of collabo-
ration, we document that a shock to the knowledge frontier led to increased collaboration
and specialization. Specifically, we examine whether the sudden and unexpected increase
in knowledge of theoretical mathematics that came with the fall of the Soviet Union led
to an increase in collaboration among non-Soviet scholars. Using an identification strat-
egy inspired by Borjas and Doran (2012), we categorize as “Soviet-rich” those subfields of
theoretical mathematics where Soviet mathematicians made a high contribution relative to
mathematicians from other nations before the collapse of the Soviet Union.
We find that collaboration rose disproportionately in Soviet-rich relative to -poor fields
after 1990. Furthermore, consistent with the hypothesized mechanisms, researchers in Soviet-
rich subfields disproportionately increased their citations to Soviet prior art as well as their
degree of specialization after 1990, relative to researchers in Soviet-poor subfields. More-
over, the knowledge shock is followed by a disproportionate increase in researcher team size
in Soviet-rich subfields in Japan, a region that did not experience a large influx of Soviet
immigrants, suggesting the estimated effect is not caused by an increase in labor market com-
petition. We interpret these findings as consistent with the theory that an outward shift in
the knowledge frontier leads to an increase in the returns to collaboration and specialization.
Several prior studies present evidence that the size of research teams has increased steadily
over time (Adams et al, 2005; Wuchy et al, 2007; Jones, 2009). For example, Wuchy et al
(2007) show that over the latter half of the twentieth century, team size increased in 170 of
171 fields in science and engineering, 54 of 54 fields in the social sciences, and 24 of 27 fields
in the arts and humanities. Furthermore, this increase even occurred in fields traditionally
associated with individual-oriented research: “Surprisingly, even mathematics, long thought
the domain of the loner scientist and least dependent of the hard sciences on lab scale
and capital-intensive equipment, showed a marked increase in the fraction of work done in
2
teams, from 19% to 57%, with mean team size rising from 1.22 to 1.84.” Moreover, they
present citation-based evidence that the relative impact of team versus individual output is
increasing over time, even after controlling for self-citations.
Scholars have advanced a number of hypotheses to explain this trend. Hesse et al (1993)
and others emphasize the role of reduced communication costs due to advances in communi-
cation technology (Agrawal and Goldfarb, 2008; Kim et al, 2009) or reductions in the cost of
travel. Stephan (2012) discusses several more alternatives. For example, increasing capital
intensity in many fields, such as the role of particle accelerators in physics, may increase the
returns to collaboration due to the indivisibilities of research equipment. Changing norms
may mean that contributors who in the past would have been listed in the acknowledge-
ments are increasingly likely to be included as coauthors, especially in lab-based sciences.
Academics also may find increasing returns to mitigating publication risk by diversifying
their research portfolios as publication requirements for promotion and tenure rise.
Jones (2009) emphasizes the “knowledge burden” hypothesis in which successive gener-
ations of innovators face an increasing education burden due to the advancing knowledge
frontier. This advancing frontier, he posits, requires innovators to specialize more and thus
necessitates working more collaboratively, which alters the organization of innovative activ-
ity towards teamwork. Jones provides descriptive statistics consistent with this theory. For
example, he shows that over time: 1) the number of co-authors on academic publications
increases, 2) Nobel laureates are older when they perform their great achievement, 3) the
number of co-inventors per patent increases, 4) the age at first innovation increases, and 5)
the probability of switching fields decreases. However, these statistics are also consistent
with some of the other explanations.
While the various explanations are not mutually exclusive, it is important to determine
whether knowledge accumulation does in fact influence the propensity to collaborate and
specialize, since this raises specific policy implications that do not apply under the alternate
explanations. For example, Jones (2011) presents a model in which the knowledge burden
leads to a poverty trap. As the knowledge frontier shifts outwards, individuals compensate
by specializing, and thus the returns to collaborating increase. However, in economies where
the market for complementary skills is thin, individuals are less likely to invest in the human
capital necessary to reach the frontier. This results in an increasingly thin market for spe-
cialized skills and thus further lowers the returns to human capital acquisition (creating a
trap). Therefore, one policy prescription is to subsidize skills development in a concentrated
area (e.g., infectious diseases) in order to address the complementary skills shortage for a
finite period of time until the private returns to acquiring specialized skills are sufficient for
the labor market to sustain the cycle without further intervention. This policy initiative is
3

not appropriate if knowledge accumulation does not increase the returns to collaboration
and the observed rise in team size is driven by other factors in the economy, such as rising
capital costs and/or falling communication costs.
In a separate paper, Jones (2010) proposes policies involving changes to the way ideas
are evaluated. If research teams, rather than individuals, are needed to work on scientific
problems due to an outward–shifted knowledge frontier, then perhaps teams rather than
individuals are needed to evaluate grant applications. Again, this policy prescription is not
relevant if the observed increase in team size is not due to knowledge accumulation but rather
other factors. For example, if team size is increasing due to rising capital costs, then this does
not imply increasing returns to team-based evaluation since the equipment is not required for
evaluating the grant proposal. Jones also proposes increased subsidies for individuals who
enter into science careers since, under the knowledge accumulation hypothesis, researchers
bear increasing private costs to reach the frontier. Again, this policy prescription is not
appropriate if the observed rise in collaboration is due to other factors.
Therefore, these policy implications suggest that identifying a causal relationship between
an outward shift in the knowledge frontier and an increase in the propensity to collaborate,
separately from other explanations for increasing collaboration, is important. However,
identification is difficult because many unobservables may be (and likely are) correlated with
both collaborative behavior as well as the march of time. In order to provide more compelling
evidence that an outward shift in the knowledge frontier leads to a growing propensity to
collaborate, we need an instrument that is correlated with a shift in the knowledge frontier
but not with collaboration except indirectly through its effect on the frontier.
The collapse of the Soviet Union in 1989 provides such an instrument.1 Although the
USSR was a world leader in various subfields of mathematics, Communist government offi-
cials forced their researchers to work in isolation from the rest of the world. For example,
with few exceptions, scholars were prohibited from traveling, publishing outside of the Soviet
Union, and accessing foreign publications without case-by-case government approval. Thus,
when the Iron Curtain fell and Soviet science became widely available, the knowledge frontier
in mathematics outside the USSR experienced a shock.
1We follow in a long tradition of papers that employ political shocks as an instrument to understandchanges in knowledge production, knowledge dissemination, and growth. Other recent papers that usethis empirical strategy include, for example, Waldinger (2010, 2012), Fons-Rosen (2012), Stuen, Mobarak,and Maskus (2012), Jones and Olken (2005), and Acemoglu, Hassan, and Robinson (2011). Our specificidentification strategy exploits the same political shock as Borjas and Doran (2012, 2013a, 2013b). Theirresearch examines the impact of the collapse of the Soviet Union on the rate of output of American and Sovietmathematicians and on the type of research done by American mathematicians, comparing Soviet-rich andSoviet-poor fields of mathematics. We exploit the same variation across fields to study a different question,emphasizing the impact on knowledge flows rather than labor market flows.
4
Furthermore, the degree of the knowledge shock across subfields of mathematics varied.
Borjas and Doran (2012) show that the Soviet mathematics community was very advanced
relative to the West in some subfields of theoretical mathematics, such as partial differential
equations and operator theory, and much less so in others, such as abstract harmonic analysis
as well as sequences, series, and summability.
Focusing on theoretical mathematics, we exploit this variation in the degree of knowl-
edge shock across subfields using a difference-in-differences type of analysis. Specifically,
we compare the propensity of mathematicians working outside the USSR to collaborate in
Soviet-rich versus -poor subfields before and after the shock. We do this using 41 years of
publication data in theoretical mathematics covering the period 1970-2010, 20 years before
and after the collapse of the Soviet Union.
We categorize papers using the internationally recognized Mathematics Subject Classifi-
cation codes developed and assigned by the Mathematical Reviews division of the American
Mathematical Society. We follow the Soviet-rich versus -poor subfield classification devel-
oped by Borjas and Doran (2012), which they base on the fraction of publications produced
by Soviet researchers during the period 1984-1989. We then focus our attention on mathe-
maticians working outside the USSR and drop observations that involve collaboration with
Soviet researchers.
We find that team size - the number of coauthors on a paper - increased after the fall of the
Iron Curtain, in both Soviet-rich and -poor subfields. However, consistent with the theory,
team size grew disproportionately more in Soviet-rich subfields after the shock. Specifically,
we calculate the mean team size before and after the collapse of the Soviet Union. For the
treated subfields (Soviet-rich), the mean team size for the 20-year period before 1990 was
1.34 compared to 1.78 for the 20-year period after. By comparison, for the control subfields
(Soviet-poor), the mean team size was 1.26 before compared to 1.55 after. These differences
in means suggest a disproportionate increase in team size for Soviet-rich subfields after the
collapse of the Soviet Union (Figure 1). The mean team size for Soviet-rich subfields was just
6% higher than for Soviet-poor before 1990, but 15% higher after. This finding is consistent
with the knowledge burden effect.
However, there may be systematic differences between Soviet-rich and -poor subfields
that are not accounted for when comparing these simple means. Therefore, we turn to our
difference-in-differences estimation to study the relationship further. We find evidence of an
8% disproportionate increase in collaboration for Soviet-rich subfields after the collapse of the
Soviet Union. This result is robust to various definitions of Soviet-rich versus -poor subfields.
Pre-existing time trends do not drive these results: We show that the disproportionate
increase in team size in Soviet-rich fields did not begin until shortly after 1990. It is difficult
5
to explain this result with the alternate theories. For example, there is no obvious reason
why communication costs were disproportionately lowered in 1990 for non-Soviet researchers
in Soviet-rich versus -poor subfields. Similarly, it is difficult to conceive of an increase in
capital costs that disproportionately affected researchers in Soviet-rich versus -poor fields
after 1990 but not before. In other words, to be consistent with this finding, a theory must
explain why team size increased disproportionately for these particular subfields (Soviet-rich)
and at this particular time (after 1990, without a pre-trend).
Next, we examine evidence of the underlying mechanism associated with the knowledge
burden hypothesis. First, analyzing citation data, we find that authors in Soviet-rich fields
disproportionately increased their propensity to draw upon Soviet knowledge after 1990.
This is fully consistent with our knowledge flow interpretation. Second, we find evidence of
an increase in researchers’ specialization in Soviet-rich relative to -poor subfields after the fall
of the Soviet Union. To do this, we employ an author-level measure of specialization based
on the number of fields in which that author published. We observe an increased tendency
for authors publishing in Soviet-rich subfields to specialize (relative to authors publishing in
Soviet-poor subfields) after the collapse of the Iron Curtain.
Another explanation for the increased collaboration in mathematics after the fall of the
Soviet Union is that the influx of Soviet mathematicians to American and European univer-
sities (documented in Borjas and Doran, 2012, 2013a, 2013b) increased competition for jobs
and journal slots. We believe our results more likely are driven by an outward shift in the
knowledge frontier for four reasons. First, we drop all papers with Soviet authors from our
main specifications. Second, we show that papers in Soviet-rich subfields disproportionately
cited Soviet papers after the fall of the Soviet Union, suggesting that non-Soviet scholars did
indeed draw upon the insights of Soviet mathematicians; also, the changes in these subfields
were disproportionately influenced by Soviet knowledge rather than Soviet scholars (espe-
cially given that non-Soviet scholars wrote the focal papers). Third, we report evidence of
increased specialization in Soviet-rich fields, consistent with the direct mechanism described
in Jones (2009). Last, and perhaps most importantly, we show the same patterns persist
even when restricting our attention to journals local to Japan, a country that was not a
destination choice for Soviet scholars, still recognizing that the field is subject to a global
labor market.
We structure the remainder of the paper as follows. In Section 2, we provide historical
context for our instrument, explaining how knowledge was developed in the Soviet Union
and yet kept secret from Western mathematicians, creating the conditions for the 1990 shock
to the frontier. In Section 3, we describe our differences-in-differences empirical strategy by
comparing the propensity to collaborate in Soviet-rich versus -poor subfields before and after
6
the knowledge shock. In Section 4, we describe the mathematics publication data we use to
construct our sample as well as the method we employ for classifying subfields as Soviet-rich
or -poor. We present our results in Section 5 and our conclusions in Section 6.
2 Historical Context
Our empirical strategy relies on the assertion that the collapse of the Soviet Union around
1990 caused an outward shift in the knowledge frontier in mathematics and that it did so more
for some subfields than others. We rely on three observations to substantiate this assertion:
1) the Soviet Union’s effect on the knowledge frontier in mathematics was significant, 2) the
Soviet Union’s effect on the knowledge frontier was greater in some subfields than others,
and 3) the knowledge produced in the Soviet Union was kept secret from the outside world
such that its effect on the frontier came reasonably suddenly in the years following 1990. We
offer historical context for each of these three points below.
The first observation is that the Soviet Union’s contribution to knowledge in the field of
mathematics was meaningful and significant. The Soviet Union was and Russia continues
to be a world-renowned center of scientific research, with mathematics holding a prominent
position. Lauren Graham, a historian of Soviet science and technology, states: “Of all fields
of knowledge, it was mathematics to which Russia and the Soviet Union made the greatest
contributions. The Soviet Union became a world power in mathematics” (Graham, 2008).
Graham attributes the Soviet Union’s strength in scholarly research in mathematics to the
fact that it attracted great minds; mathematics was uniquely detached from politics, con-
ferred status and prestige, and offered financial rewards superior to many other occupations.
The second observation is that the Soviet Union’s contribution to knowledge was signifi-
cantly greater in some subfields of mathematics than others. Borjas and Doran (2012) show
this empirically by comparing across subfields the fraction of Soviet-to-American papers pub-
lished during the period 1984-1989. We provide further evidence below by comparing the
fraction of Soviet-to-non-Soviet papers published worldwide during the period 1970-1989.
Graham (1993) notes that although Soviet mathematicians were strong across the entire
spectrum of theoretical and applied mathematics, they seemed to have made the greatest
advancements, relative to the rest of the world, in pure theory. One explanation for this is
politics. Soviet policies were strict about secrecy and focused on maintaining control over
technological developments. It was easier for Soviet mathematicians to build on their progress
in pure theory than in areas where technology implementation was more immediate. Many
advances in applied mathematics were stalled for political reasons, with exceptions linked
to government interests such as the space program (Graham, 1993). Differences in subfields
7
were further amplified due to path dependency: Subfields that attracted bright minds early
on were more likely to subsequently attract more bright minds due to mentorship oppor-
tunities (Borjas and Doran, 2012). The importance of mentorship is well known in science
(Merton, 1973) and was likely particularly salient in this setting due to restrictions on travel
and access to foreign journals. For example, the success of Moscow mathematics can be
traced back to Ergorov and his student N. N. Luzin (Tikhomirov, 2007). Luzin, whose
famous work was mainly focused on the theory of functions, a subfield of theoretical math-
ematics, mentored subsequent generations of eminent Soviet mathematicians. On the other
hand, little outstanding mentorship was available to practitioners of some other subfields of
theoretical mathematics, like algebraic geometry (Borjas and Doran, 2012).
The third observation is that the knowledge produced in the Soviet Union was kept se-
cret from the outside world such that its effect on the frontier came reasonably suddenly in
the years following 1990. Soviet researchers were prevented from publishing their findings,
traveling to conferences, communicating or collaborating with non-Soviets, and even access-
ing non-Soviet references. The Communist government kept strict control on international
travel. Academics who wished to attend foreign conferences had to go through a stringent
and lengthy approval process, with many researchers blacklisted because of “tainted” back-
grounds. The few approvals granted were typically for travel in Eastern Europe (Ganguli,
2011). Furthermore, Soviet advancements in mathematics remained relatively unknown in
the United States until the collapse of the Soviet Union mainly because the USSR govern-
ment kept much of Soviet science secret (Graham and Dezhina, 2008). In addition, what
escaped the secrecy filter was subject to the natural barrier imposed by the Russian language.
Graham and Dezhina (2008) note: “the Russian language was known by few researchers out-
side the Soviet Union, and consequently the achievements of Soviet researchers were more
frequently overlooked than those presented in more accessible languages.” Borjas and Doran
(2012) provide extensive evidence that Soviet knowledge in mathematics was not known in
the West, although translations of some Soviet scientific journals were available before the
collapse of the Soviet Union.
The limited diffusion of Soviet mathematics into the West is evident in the aftermath of
the collapse of the Soviet Union. Starting in 1990, Soviet discoveries began to spread through
the West and were considered new and important. Communication and travel restrictions
were lifted, publications were translated and indexed, and ideas and knowledge began to
flow out from the former Soviet Union into the broader research community. The following
quotes by Harvard mathematician Persi Diaconis (from an article published on May 8, 1990
in the New York Times), provides an indication of the sudden outward shift of the knowledge
frontier: “It’s been fantastic. You just have a totally fresh set of insights and results.” Dr.
8
Diaconis said he recently asked Dr. Reshetikhin for help with a problem that had stumped
him for 20 years. “I had asked everyone in America who had any chance of knowing” how to
solve a problem of determining how organized sets become disorganized, Dr. Diaconis said.
No one could help. But Dr. Reshetikhin told Dr. Diaconis that Soviet scientists had done
a lot of work on such problems. “It was a whole new world I had access to,” Dr. Diaconis
said.
To be clear, for our identification strategy to work, we do not require there to have
been no information leaking out of the Soviet Union prior to 1990. Instead, we require the
knowledge available to non-Soviet researchers to have increased after 1990 in Soviet-rich
relative to Soviet-poor fields.
In sum, the fall of the Iron Curtain provides a plausible natural experiment differentially
affecting the knowledge frontier across subfields of theoretical mathematics. This historical
event was exogenous to the mathematics research community and set free a large pool of ac-
cumulated knowledge. Furthermore, Borjas and Doran (2012), who pioneered the use of this
event as an instrument for causal identification in the setting of mathematics, present com-
prehensive evidence indicating that the timing of the collapse took the global mathematics
community by surprise; even in the late 1980s, both the Western mathematical community
and Soviet scholars were quite certain that Soviet mathematics would remain secluded for
the foreseeable future.
3 Estimation Strategy
We employ a difference-in-differences estimation strategy in which we compare collabo-
ration rates in subfields where the knowledge frontier was most affected by Soviet knowledge
(treated) with subfields least affected (control), both before and after the fall of the Iron
Curtain (1990). In other words, we examine the difference between treated and control sub-
fields in two periods, before and after the treatment. Thus, we distinguish between the rise
in team size that is directly attributable to the shift in the knowledge frontier from the un-
derlying differences between treated and control subfields as well as the underlying changes
in collaboration patterns in theoretical mathematics over time.
The objective of our empirical analysis is to estimate the effect of the knowledge shock
on collaboration, which we measure as a count of the number of unique authors on a publi-
cation. Thus, we estimate the following linear regression model, using the academic paper
as our unit of analysis:
TeamSizeit = β(SovietRichi × AfterIronCurtaint) + Subfieldi + γt + εit (1)
9

TeamSizeit is the count of authors for each academic paper i published in year t.
SovietRichi is an indicator variable equal to 1 if academic paper i belongs to the treated
group and 0 otherwise. AfterIronCurtaint is an indicator variable equal to 1 if academic
paper i is published after 1990 and 0 otherwise. This applies to academic papers in both
treated and control subfields. We include subfield and time fixed effects. Hence, the main
effects SovietRichi and AfterIronCurtaint drop out of the estimating equation.
We are primarily interested in the estimated coefficient on the interaction between SovietRichi
and AfterIronCurtaint, which equals 1 for publications in treated subfields that were pub-
lished after the knowledge shock and 0 for all others. We interpret a positive estimated value
of this coefficient as implying that the average team size of Soviet-rich subfields increased
disproportionately, relative to Soviet-poor subfields, after the knowledge shock, consistent
with the knowledge frontier theory. After establishing this relationship, we provide evidence
consistent with a mechanism driven by an outward shift in the knowledge frontier.
4 Data
We next describe the three main steps we follow to collect and prepare our data set.
First, we extract publication data, then we rank subfields in mathematics with respect to
the relative contribution by Soviets, and finally we process the data for analysis.
4.1 Data Collection
We collect data on every publication in theoretical mathematics published during the
41-year period 1970 – 2010. This represents 20 years of data both before and after the
collapse of the Soviet Union in 1990. We follow Borjas and Doran’s (2012) interpretation
of historical events that isolates 1990 as the year when academic seclusion was significantly
lessened. We recognize that the political and social turmoil preceding and following the fall
of the Iron Curtain spanned a period of roughly three years, between 1989 and 1991. Our
results are robust to choosing 1989 or 1991 as the cutoff rather than 1990.
We collect these data from the American Mathematical Society (AMS). The Mathemat-
ical Reviews (MR) division of AMS maintains a comprehensive bibliographic database of
worldwide academic publications in mathematics. The MR database includes all mathematics-
related journal publications covering the three main categories of mathematics: mathemat-
ical foundations (including history and biography), pure or theoretical mathematics, and
10
applied mathematics. Our focus is on theoretical mathematics, which includes analysis, al-
gebra, and geometry (Figure 2).
4.2 Classification
Our empirical strategy relies on exploiting variation in the degree to which the knowledge
frontier was shifted outwards as a result of the collapse of the Soviet Union. Specifically, we
distinguish between subfields of theoretical mathematics where the Soviets were particularly
strong in the years prior to the collapse versus subfields where they were less strong. Borjas
and Doran (2012) created this identification tool; we directly employ their insight on how to
classify these data to distinguish between Soviet-rich and -poor.
We rely on the careful and exhaustive work of the MR division, which classifies each paper
in mathematics using Mathematics Subject Classification (MSC) codes. The MSC schema is
used internationally and facilitates targeted searches on research subjects across all subfields
of mathematics. The MR team assigns precisely one primary MSC code to each academic
publication uploaded to the MR database. The theoretical mathematics group is comprised
of a total of 40 active primary MSC codes (14 algebra, 19 analysis, 7 geometry). We drop the
six subfields that did not exist throughout the 40-year duration of our study period as well
as one subfield for which we are not able to obtain the full data, leaving us with 33 subfields
within theoretical mathematics. Next, we adopt the Borjas and Doran (2012) ranking of
the remaining 33 subfields, which is based on the degree to which Soviets contributed to a
particular subfield. They construct their rank by calculating the ratio of Soviet-to-American
publications in the subfield over the period 1984-1989 and define a publication as Soviet
if at least one author has a Soviet institutional affiliation. They similarly define American
publications. We list the 33 subfields and their rank in Table 1.
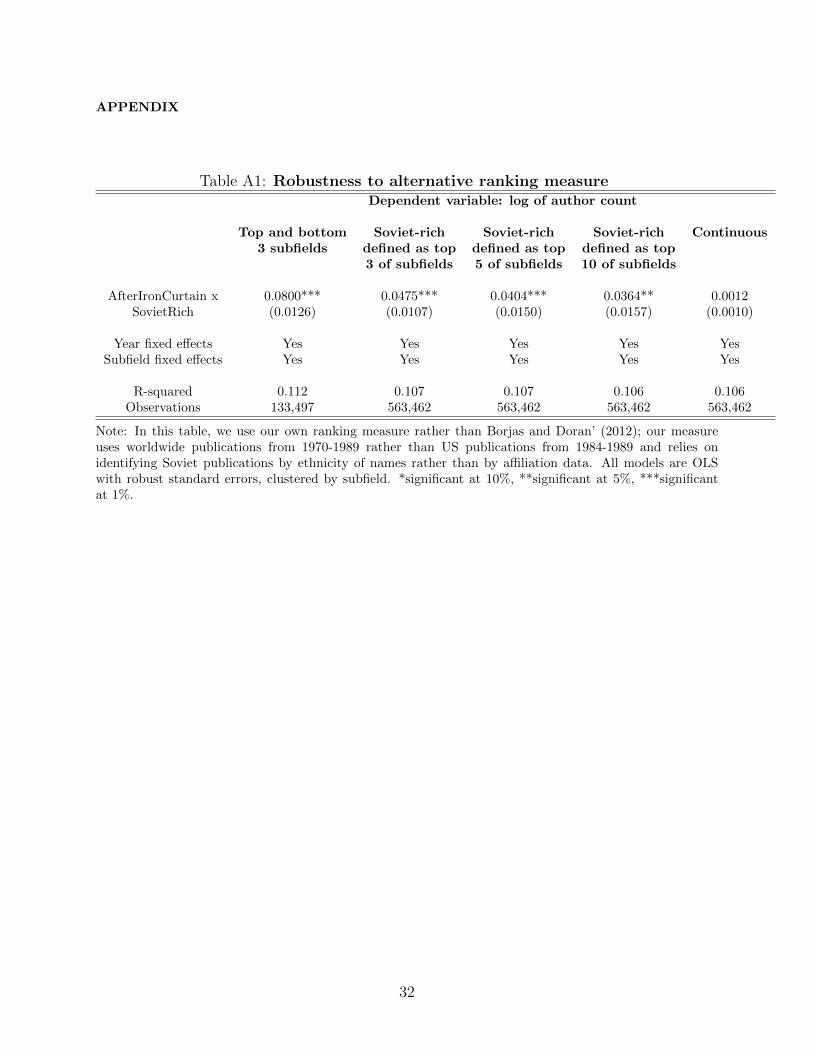
Although we use the Borjas and Doran (2012) ranking throughout the paper, we also
show in Appendix Table 2 that the main results are robust to an alternate measure. While
broadly similar, this alternative measure differs on three dimensions. First, this measure
defines a publication as Soviet based on author name data rather than author affiliation
data.2 Second, this measure compares Soviet publication output relative to the rest of the
world rather than relative to US-only publication output. Third, this measure uses ratios
based on data from 1970 to 1989 rather than from 1984 to 1989. In the end, the rankings
are reasonably similar, with a Spearman Rank Correlation Coefficient of 0.84, and the qual-
2We identify Soviet last names based on conversations with experts and documented rules regardingSoviet surname endings. We then test and calibrate our algorithm by manually looking up and verifying ifacademics identified as having Soviet last names were indeed Soviets.
11
itative results are unchanged.
4.3 Data Processing
In our main specifications, we drop all Soviet publications from the sample. We define
Soviet publications as those with at least one Soviet author. We do this to avoid potential
confounding effects. After 1990, not only was Soviet knowledge set free to contribute to
global advancements in mathematics, but collaboration restrictions were also lifted for Soviet
mathematicians. By excluding publications with at least one Soviet author, we account for
the possibility of increased co-authorship rates due to removing the constraint previously
preventing collaboration with Soviets.3
After dropping Soviet publications, our sample includes 563,462 publications spanning
the 41-year period. We focus on a comparison between the three top (Soviet-rich) and
bottom (Soviet-poor) ranked subfields, which represents 133,497 publications, as our main
specification; however, we show the results are robust to alternative definitions of Soviet-rich:
1) top three ranking subfields relative to all others, 2) top five ranking subfields relative to all
others, 3) top ten ranking subfields relative to all others, and 4) a continuous measure that
relies on variation within the 33 ranked subfields of theoretical mathematics. We provide
descriptive statistics in Table 2.
5 Results
5.1 Main Result: Disproportionate Increase in Team Size in Soviet-
Rich Subfields After 1990
We report the estimated coefficients of Equation 1 in Table 3. We present our main
specification in Column 1. The key result is the estimated coefficient on the interaction
term SovietRichi ×AfterIronCurtaint, which is positive and statistically significant. This
implies that the difference in average team size between papers in Soviet-rich versus -poor
subfields is greater after the shock than before.
We do not present estimates of the main effects of SovietRichi or AfterIronCurtaint
because we drop these terms from the estimating equation due to the year and subfield fixed
effects. Also, we cluster our standard errors by subfield. We cluster to address the possibility
3Our results remain robust when adding Soviet authors back to the sample (Appendix Table 3).
12
that shocks experienced in each of the 33 subfields may be correlated, both within subfield
and over time (Bertrand, Duflo, and Mullainathan, 2004; Donald and Lang, 2007).
This main result is robust to various definitions of Soviet-rich. In the first three columns,
we define Soviet-rich as the top three, five, and ten subfields and Soviet-poor as all other
subfields. The point estimates decrease in magnitude as we broaden the definition of Soviet-
rich, which is not surprising since the difference between Soviet-rich and -poor is less stark,
but the point estimates remain positive and significant. In the last column, we employ a
continuous rank measure of Soviet-rich/poor, assigning the most Soviet-rich field a rank of
33 and the least a rank of 1. The coefficient remains positive, though significance is lost in
the continuous specification.
Next, we examine the timing of this effect, to demonstrate that there was no underlying
trend toward increased collaboration in Soviet-rich relative to -poor fields before 1990. For
example, perhaps the scholars in Soviet-rich fields were better positioned to leverage the
diffusion of electronic communication technology that led to increased scientific collaboration
starting in the 1980s (Agrawal and Goldfarb, 2008). In this case, one might worry that the
effect of lowered collaboration costs, although spread out over many years and during a
slightly earlier period than the 1989-1991 events in the Soviet Union, could explain the
result.
To check for such a possibility, we examine the timing of the relationship between the
collapse of the Soviet Union and changes in the relative team size in Soviet-rich versus poor
subfields. Specifically, we run a similar regression to the one shown in Table 3, Column 1;
however, we replace the single interaction SovietRichi×AfterIronCurtaint with a sequence
of dummy variables representing each year interacted with SovietRich.
We present the results in Figure 3. Each point represents the coefficient value on the
covariate Y ear×SovietRich and thus describes the relative difference in collaboration rates
between Soviet-rich and -poor fields in that year. The bars surrounding each point represent
the 95% confidence interval. All values are relative to the base year of 1970. We also present
these results in table form in the appendix. The most notable insight from Figure 3 is that
the difference between team sizes in Soviet-rich and -poor fields was stable between 1971
and 1990. Then, starting in 1990, the difference in average team size began to increase, as
evidenced by the higher coefficients. The difference in team size became statistically signif-
icant after about eight years and then continued to increase for the twelve remaining years
in the sample.
13
5.2 Evidence that the Collapse of the Soviet Union Generated a
Knowledge Shock
Next, we provide evidence consistent with our interpretation of this result being driven
by a change in the knowledge stock, rather than some other factor, such as a change in the
level of competition for jobs or journal slots due to the influx of Soviet mathematicians to
the United States. To document that the collapse of the Soviet Union did in fact generate a
knowledge shock, we turn to citation data. The intuition is that if the lifting of publication
restrictions did indeed shift the knowledge frontier outwards and more so in Soviet-rich
fields, then this should be observable through (non-Soviet) researchers in Soviet-rich subfields
disproportionately increasing their propensity to cite Soviet prior art after 1990.4
To accomplish this, we collect data on references for a subsample of our data. Specifically,
we collect backward citation data for papers from the top three and bottom three subfields
that were published in one of the top 30 journals of mathematics (as measured by Thomson
Reuters’ impact factor). We further restrict the data to a window of four years before
and after the collapse of the Soviet Union (1988-1993) for tractability (this data collection
process is manual). We extract 1,217 publications that meet these criteria and are authored
by non-Soviet scholars.
Next, we search for these publications in the Web of Knowledge reference database main-
tained by Thompson Reuters. We find full text information on 1,012 papers for which we
extract the list of references. We count references to Soviet prior art and calculate the per-
centage of Soviet references relative to the total number of references. We define a citation
(prior art) as Soviet if at least one of the authors had a Soviet last name as identified by our
name algorithm. We check the robustness of our finding by using an alternative definition,
where we define a citation as Soviet if it was published in a Soviet journal.
We use these data to estimate a difference-in-differences linear regression, similar to the
one estimated in Section 5.1 above, but this time employing a measure of citations to Soviet
prior art as the dependent variable:
SovietArtit = β(SovietRichi × AfterIronCurtaint) + Subfieldi + γt + εit (2)
4To be clear, this evidence does not rule out increased competition in the labor market as an alternativeexplanation. An increase in competition for jobs due to an influx of mathematicians in Soviet-rich subfieldsmight result in an increase in team size and also be associated with an increase in citations to Soviet priorart as scholars also take advantage of this newly available source of knowledge. However, a failure to findevidence of an increase in citations to Soviet prior art would make it difficult to interpret the prior findingsas being driven at least partly by a Soviet shock to the knowledge frontier. That said, we do present data inSection 5.4 concerning evidence of a disproportionate increase in the average team size in Japan, a nation thatdid not experience a notable influx of Soviet mathematicians, as evidence consistent with our interpretationbut not consistent with the alternative explanation of increased competition in the labor market.
14
We report our estimated coefficients in Table 4. In Column 1, we define SovietArtit
as a count of the number of references to Soviet citations (defined by journal affiliation)
by academic paper i published in year t. The estimated coefficient on the interaction
β(SovietRichi × AfterIronCurtaint) is positive and significant, implying that researchers
publishing in Soviet-rich fields disproportionately increased their propensity to cite Soviet
prior art after 1990, relative to those publishing in Soviet-poor fields. Furthermore, this dis-
porportionate increase is driven by Soviet-rich papers with disproportionately higher team
sizes after the collapse of the Soviet Union (Table 5). This suggests that the papers that
most increased team size were closest to the change in the knowledge frontier.
Next, we show that this result is robust to multiple definitions of Soviet prior art. In
Column 2, we define the dependent variable as the percentage of citations to papers published
in Soviet journals relative to the total number of references. In Column 3, we define the
dependent variable as a count of references to papers that have at least one Soviet author
identified using our last name algorithm, and in Column 4, the dependent variable is the
percentage of papers that have at least one Soviet author. The main result persists, though
we lose statistical significance in Column 4.
Thus, the Soviet-rich subfields appear to have experienced a knowledge shock after the
fall of the Soviet Union. Citations to S oviet papers increased substantially, even by non-
Soviet authors.
5.3 Evidence of Specialization
Next, we provide further analysis consistent with our interpretation of the main result as
evidence consistent with the knowledge burden hypothesis. In particular, we document an
increase in researcher specialization (or, conversely, a decrease in diversification) in Soviet-
rich subfields relative to Soviet-poor subfields after the fall of the Iron Curtain.
For this subsection, we switch the unit of analysis to the author-year and examine the
degree of diversification for authors who published in a given year. We measure diversification
using an author-level count of the number of sub-classification areas (as defined by the AMS
in their MSC schema) that were used in the authors’ publications over the previous five
years. Each of the 33 subfields in our data has a large number of sub-classifications.
If the shock to the knowledge frontier does indeed lead to increased specialization, then we
expect to observe a disproportionate decline in the number of sub-classifications for authors
in Soviet-rich relative to -poor fields after 1990. First, we examine all authors, observing
15
authors multiple times if they publish more than once. Then, we examine junior authors
only by looking at the degree of specialization for each author exactly five years after their
first publication. Thus, junior authors each appear just once in the data. We analyze ju-
niors separately because they represent a somewhat cleaner test. Specifically, by comparing
the early research of scholars who began publishing after the collapse of the Soviet Union
with the early research of scholars who entered the field earlier, we examine the degree of
specialization in the years of more rapid knowledge accumulation. Specifically, for author a
in year t, we estimate:
DegreeOfDiversificationat = α(SovietRicha×AfterIronCurtaint)+Subfielda +γt +
εia (3)
We define degree of diversification as the number of sub-classifications in which the author
published over the previous five years.
Table 6 shows a disproportionate decrease in diversification for authors who published in
Soviet-rich fields after the fall of the Soviet Union. Or, stated differently, we find evidence of
a disproportionate increase in specialization for authors who published their work in Soviet-
rich subfields. The second column shows that the average number of primary classification
codes and sub-codes in which Soviet-rich authors published decreases by 7% more than for
Soviet-poor authors after 1990. Even after adding author fixed effects and thereby looking
at changes in specialization within individuals over time, the effect is a still significant 1%
decrease. Furthermore, the results hold if we focus on junior authors only, although we can-
not estimate author fixed effects here because (by construction) we observe junior authors
once. When comparing the degree of specialization of pre- and post-1990 junior scholars, we
find that post-1990 junior scholars from Soviet-rich subfields were disproportionately more
specialized than juniors from Soviet-poor subfields. The average number of primary clas-
sification codes and sub-codes in which Soviet-rich juniors published shows a 6% decrease
relative to Soviet-poor juniors after the collapse of the Soviet Union.
5.4 Knowledge Burden vs. Competition in Labor Markets
Borjas and Doran (2012, 2013a, 2013b) emphasize the labor market impact of increased
competition from Soviet scholars. Increased competition also may explain the observed in-
crease in collaboration in mathematics after the fall of the Soviet Union since the influx of
Soviet mathematicians to American and European universities resulted in increased compe-
16
tition for jobs and journal slots. In order to present results consistent with the knowledge
burden explanation but not with the increased competition explanation, we turn to a set-
ting that experienced the knowledge shock but did not experience a significant labor market
shock. Specifically, we focus on Japan, a country with no documented evidence of Soviet
immigration in mathematics (Dubois et al, 2011) and which consistently ranks in the top ten
in mathematics research (Dubois et al, 2011). We recognize that the labor market for math-
ematicians is to some extent global. In other words, even though Soviet mathematicians did
not migrate en masse to Japan, it’s plausible that, for example, American mathematicians
who were displaced by Soviets moved to Japan, causing a sharp increase in labor supply
leading to more collaboration. We find no evidence of this in our data. However, we do
show a disproportionate team size increase in Japanese journal publications in Soviet-rich
relative to -poor subfields after 1990. This finding is consistent with the knowledge burden
hypothesis, identified separately from the alternative explanation of labor market impact
due to an influx of Soviet scholars.
We start by identifying all Japanese journals in our data. We do so based on journals’
documented affiliation information. Next, we distinguish between those Japanese journals
included in Thomson Reuters’ impact factor ranking and those that are not. The fact
that Japan ranks highly in mathematics research overall raises concerns that some Japanese
journals might be of international interest. Specifically, some journals might have been
of interest to Soviet scholars located elsewhere. We identify Japanese journals ranked by
Thomson Reuters in terms of impact factor as journals of potential international interest.
We use our main difference-in-differences specification (1) to estimate the effect of the
knowledge shock on team size in Soviet-rich versus -poor fields in the Japanese setting by
restricting the data to the subset of publications from Japanese journals. We provide sep-
arate estimates for publications in all Japanese journals, publications in ranked Japanese
journals, and publications in not-ranked Japanese journals. We draw this subset from the
set of publications in mathematics, which already excludes all publications involving Soviet
scholars. Tables 7, 8 and 9 provide strong support for a disproportionate increase in team
size for scholars publishing in Japanese journals, ranked or not.
6 Discussion and Conclusion
We report evidence that an outward shift in the knowledge frontier is associated with
a subsequent increase in research team size and researcher specialization. Importantly, this
evidence is consistent with the knowledge frontier explanation but not the other explanations
17
for the widely documented increase in team size. In other words, although this evidence is
not intended to (and does not) rule out the possibility that the other explanations also play
a role, it suggests that the knowledge frontier hypothesis is a plausible explanation for at
least some of the observed increase in team size in science.
In our setting, a back-of-the-envelope calculation indicates that the knowledge frontier
effect accounts for 24% of the increase in team size in Soviet-rich fields in theoretical math-
ematics. We calculate this as follows: team size in Soviet-rich fields increased by 33%, from
1.34 to 1.78, in the before versus after period. We estimate that the Soviet-rich fields experi-
enced an 8% disproportionate increase (relative to Soviet-poor) during this period (Table 3,
Column 1). This represents 24% of the overall percentage increase. While this rough calcu-
lation can be seen as a lower bound because it assumes none of the increase in Soviet-poor
subfields was due to an outward shift in the knowledge frontier, we resist this interpretation
because of the numerous other assumptions underlying the 24% value.
More broadly, it is important to clarify the limitations of our test of the knowledge burden
hypothesis. First, we test a particular implication of the knowledge burden hypothesis: the
impact of a sudden outward shift in the knowledge frontier on collaboration and specializa-
tion. An underlying assumption of this interpretation of our estimates is that the team size
response to a shock is similar to that for a gradual outward shift in the knowledge frontier.
However, that may not be the case. Researchers may be able to absorb gradual increases in
the knowledge frontier in a manner that does not generate as high returns to collaboration as
those resulting from a sudden shock that may be more costly for researchers to internalize.
Thus, our empirical results may not measure the impact of a gradual shift in the knowledge
frontier.
Second, there may have been other impacts of the collapse of the Soviet Union on the
field of mathematics. Borjas and Doran (2012, 2013a, 2013b) emphasize the labor market
impact of increased competition from Soviet scholars. This increased competition also may
have driven an increase in collaboration if, for example, returns to collaboration increased
due to reasons such as risk mitigation (diversification of research projects). While we view
our results on Japanese publications, citations to Soviet prior art, and specialization as more
consistent with the knowledge burden hypothesis, we cannot definitively reject the possibility
that changing labor markets also played a role.
Third, we focus on one particular field: mathematics. Adams et al (2005) show that
mathematics is somewhat of an outlier in team size relative to other disciplines in having
relatively small teams. In the first year of their study, 1981, mathematics publications
had the fewest number of authors (of 12 fields). Furthermore, mathematics had the lowest
annual growth rate in team size from 1981 to 1990 and the second lowest from 1990 to 1999.
18
In contrast, physics and astronomy had the highest growth rates, which likely was at least
partly driven by the increasing role of capital-intensive equipment (e.g., particle accelerators)
in those fields. Therefore, even if 24% is a reasonable lower-bound estimate of the fraction
of the percentage increase in team size caused by an outward shift in the knowledge frontier
in mathematics, it may be an overestimate in fields where capital equipment plays a more
central role.
Overall, we document that the knowledge shock caused by the exogenous collapse of
the Soviet Union led to a disproportionate increase in collaboration among non-Soviet re-
searchers in those subfields in which Soviet mathematicians were strongest relative to other
subfields of theoretical mathematics. Our examination of citations to Soviet prior art, spe-
cialization, and team sizes in Japan provides further evidence consistent with the burden
of knowledge hypothesis: a knowledge shock leading to increased specialization and collab-
oration. In a series of papers (2009, 2010, 2011), Jones presents a variety of interventions
that are potentially welfare-enhancing in the presence of a knowledge frontier effect. These
include subsidies and rewards to incentivize entry into research careers, team-based evalu-
ation of grant applications, and national or regional subsidies and specialization to prevent
poverty traps due to underinvestment in human capital from coordination failures arising
from thin markets for complementary skills. Although our study offers no means by which to
comment on the suitability of these interventions to particular policy settings, the evidence
we present here does suggest that the knowledge frontier effect is worthy of further research
and possibly policy attention.
19

REFERENCES
Acemoglu, Daron, Hassan, Tarek A., Robinson, James A. 2011. Social Structure and De-velopment: A Legacy of the Holocaust in Russia. Quarterly Journal of Economics, 126(2),895-946.
Adams J.D., Black, G.C., Clemmons, J. R., Stephan P. E. 2005. Scientific Teams and In-stitutional Collaborations: Evidence from U.S. Universities, 1981-1999. Research Policy, 34(3), 259-285.
Agrawal, A., Goldfarb, A. 2008. Restructuring Research: Communication Costs and theDemocratization of University Innovation. American Economic Review, 98(4), 1578-1590.
Borjas, G. J., Doran, K. B. 2012. The Collapse of the Soviet Union and the Productivity ofAmerican Mathematicians. The Quarterly Journal of Economics, 127(3), 1143-1203.
Borjas, G. J., Doran, K. B. 2013a. Cognitive Mobility: Native Responses to Supply Shocksin the Space of Ideas. The Journal of Labor Economics, forthcoming.
Borjas, G. J., Doran, K. B. 2013b. Which Peers Matter? The Relative Impacts of Collabo-rators, Colleagues and Competitors. Working paper, University of Notre Dame.
Dubois, P., Rochet, JC., Schlenker, M. 2013. Productivity and Mobility in Academic Re-search: Evidence from Mathematicians. Scientometrics, forthcoming.
Fons-Rosen, Christian. 2012. Knowledge Flows through FDI: The Case of Privatisations inCentral and Eastern Europe. Working paper, Universitat Pompeu Fabra.
Ganguli, I. 2012. Saving Soviet Science: The Impact of Grants When Government R&DFunding Disappears. Working paper, Stockholm School of Economics.
Graham, L. R. 1993. Science in Russia and the Soviet Union: A Short History. CambridgeUniversity Press.
Graham, L. R., Dezhina, I. 2008. Science in the New Russia: Crisis, Aid, Reform. IndianaUniversity Press.
Grossman, J. W. 2002. The Evolution of the Mathematical Research Collaboration Graph.Congressus Numerantium, 158, 201-212.
Hesse, Bradford W., Sproull, Lee S., Kiesler, Sara B., Walsh, John P. 1993. Returns toScience: Computer Networks in Oceanography. Communications of the ACM, 36(8), 90-101.
Jones, B. 2009. The Burden of Knowledge and the Death of the Renaissance Man: Is Inno-vation Getting Harder? Review of Economic Studies, 76(1), 253-281.
20
Jones, B. 2010. As Science Evolves, How Can Science Policy? NBER Innovation Policy andthe Economy, 11,103-131.
Jones, B. 2011. The Knowledge Trap: Human Capital and Development, Reconsidered.NBER Working paper 14138.
Jones, B., Olken, B.A. 2005. Do Leaders Matter? National Leadership and Growth SinceWorld War II. Quarterly Journal of Economics,120(3), 835-864.
Kim, E.H., Morse, A., Zingales, L. 2009. Are Elite Universities Losing Their CompetitiveEdge? Journal of Financial Economics, 93(3), 353-381.
Merton, R. K. 1973. The Sociology of Science: Theoretical and Empirical Investigations.University of Chicago Press, Chicago.
Mowery, D., Nelson, R., Sampat, B., Ziedonis, A. 2004. Ivory Tower and Industrial Innova-tion. Stanford University Press.
Newman, M. E. J. 2004. Coauthorship Networks and Patterns of Scientific Collaboration.Center for the Study of Complex Systems and Department of Physics, University of Michi-gan, Ann Arbor.
Oettl, Alex. 2012. Reconceptualizing Stars: Scientist Helpfulness and Peer Performance.Management Science, 58(6), 1122-1140.
Polyak, B.T. 2002. History of Mathematical Programming in the USSR: Analyzing the Phe-nomenon. Mathematical Programming, 91, 410-416.
Rosen, S. 1981. The Economics of Superstars. American Economic Review, 71(5), 845858.
Tikhomirov, V. M. 2007. On Moscow Mathematics - Then and Now. Golden Years ofMoscow Mathematics, Second edition, co-publication of the AMS and the London Mathe-matical Society.
Singh, J., Fleming, L. 2010. Lone Inventors as Sources of Break-Through: Myth or Reality?Management Science, 56(1), 4156.
Sonnenwald, D. H. 2007. Scientific Collaboration. Annual Review of Information Scienceand Technology, 41(1), 643-681.
Stephan, P. 2012. How Economics Shapes Science. Harvard University Press.
Stuen, E.T., Mobarak, A.M., Maskus, K.E. 2012. Skilled Immigration and Innovation:Evidence from Enrollment Fluctuations in US Doctoral Programmes. Economic Journal,
21
112(565), 1143-1176.
Waldinger, F. 2010. Quality Matters: The Expulsion of Professors and the Consequencesfor PhD Student Outcomes in Nazi Germany. Journal of Political Economy, 118(4), 787-831.
Waldinger, F. 2012. Peer Effects in Science – Evidence from the Dismissal of Scientists inNazi Germany. Review of Economic Studies, 79(2), 838-861.
Walsh, J. P., Bayma, T. 1996. Computer Networks and Scientific Work. Social Studies ofScience, 26(3), 661-703.
Wuchy, S., Jones, B., Uzzi, B. 2007. The Increasing Dominance of Teams in Production ofKnowledge. Science 316, 1036.
Zucker, L. G., Darby, M. R. and Brewer, M. B. 1998. Intellectual Human Capital and theBirth of U.S. Biotechnology Enterprises. American Economic Review, 88(1) 290306.
22

Figure 1: Disproportionate increase in mean team size in Soviet-rich subfieldsafter 1990
Notes: We base this figure on 40 years of publication data for the three top and three bottom ranked sub-fields of theoretical mathematics. Each point on the graph represents the coefficient value on the covariateY ear × SovietRich and thus describes the relative difference in collaboration rates between Soviet-rich and-poor fields in that year. The bars surrounding each point represent the 95% confidence interval. All valuesare relative to the base year of 1970. We also present these results in table form in Appendix Table 2.
Figure 2: Mathematics Taxonomy
23
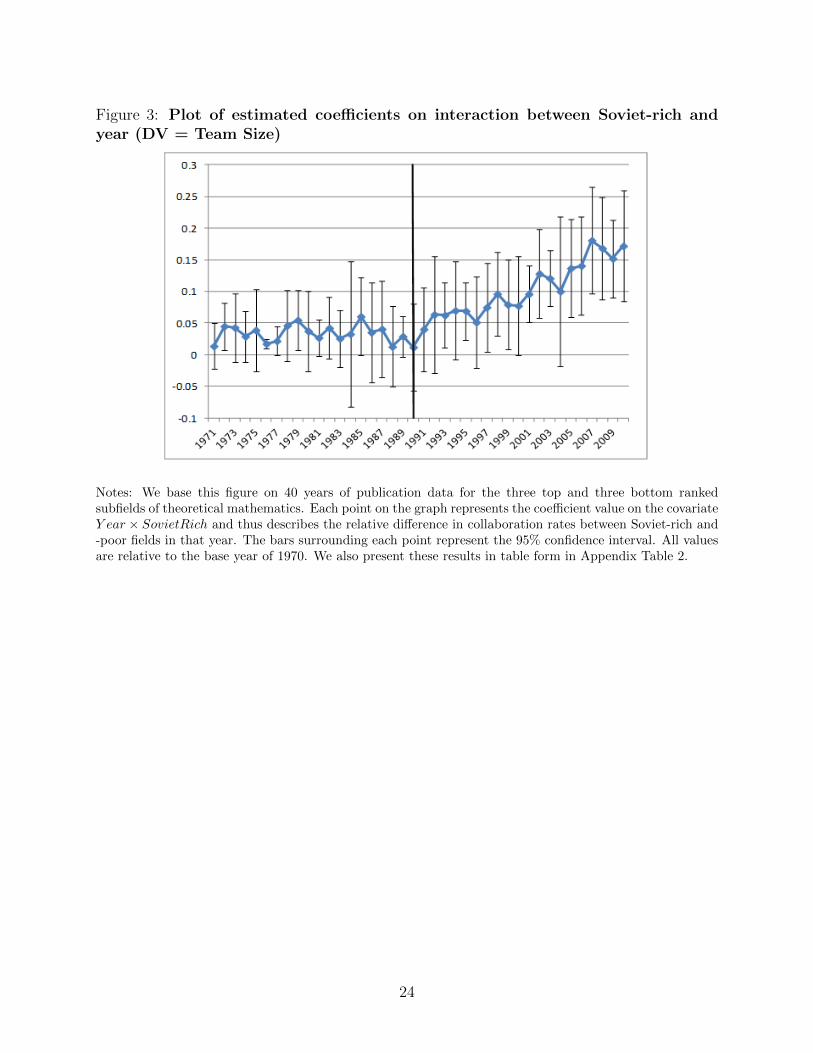
Figure 3: Plot of estimated coefficients on interaction between Soviet-rich andyear (DV = Team Size)
Notes: We base this figure on 40 years of publication data for the three top and three bottom rankedsubfields of theoretical mathematics. Each point on the graph represents the coefficient value on the covariateY ear × SovietRich and thus describes the relative difference in collaboration rates between Soviet-rich and-poor fields in that year. The bars surrounding each point represent the 95% confidence interval. All valuesare relative to the base year of 1970. We also present these results in table form in Appendix Table 2.
24
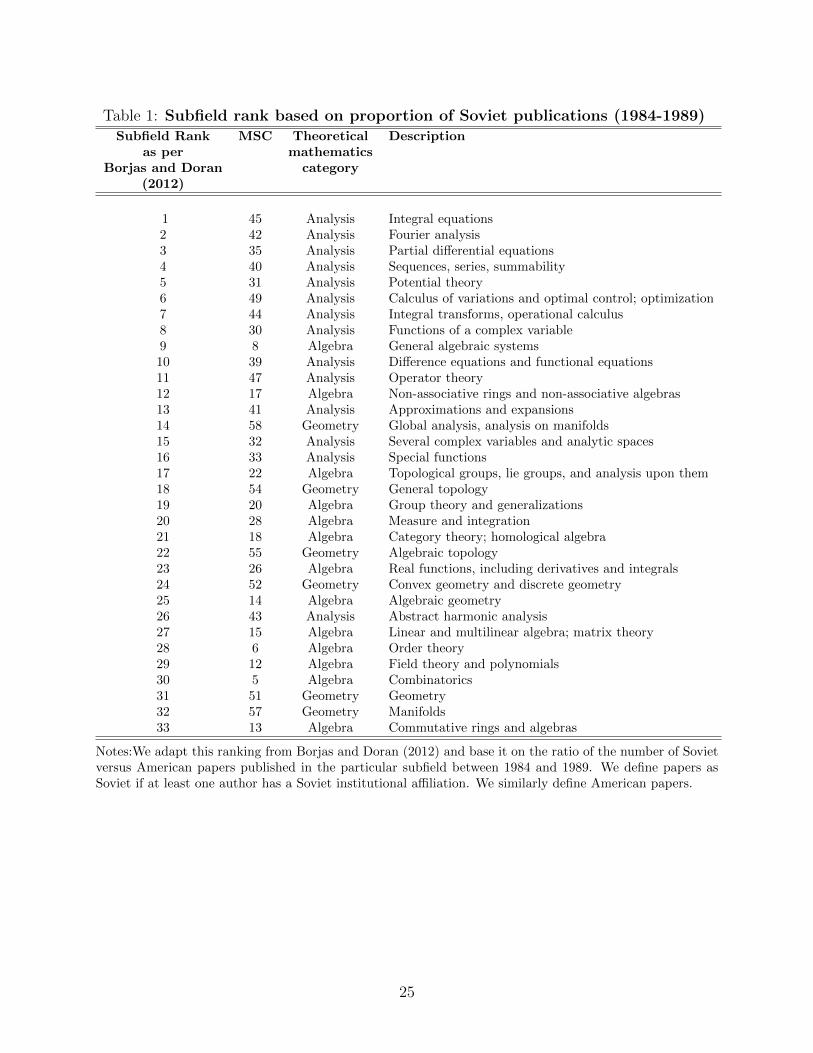
Table 1: Subfield rank based on proportion of Soviet publications (1984-1989)Subfield Rank MSC Theoretical Description
as per mathematicsBorjas and Doran category
(2012)
1 45 Analysis Integral equations2 42 Analysis Fourier analysis3 35 Analysis Partial differential equations4 40 Analysis Sequences, series, summability5 31 Analysis Potential theory6 49 Analysis Calculus of variations and optimal control; optimization7 44 Analysis Integral transforms, operational calculus8 30 Analysis Functions of a complex variable9 8 Algebra General algebraic systems10 39 Analysis Difference equations and functional equations11 47 Analysis Operator theory12 17 Algebra Non-associative rings and non-associative algebras13 41 Analysis Approximations and expansions14 58 Geometry Global analysis, analysis on manifolds15 32 Analysis Several complex variables and analytic spaces16 33 Analysis Special functions17 22 Algebra Topological groups, lie groups, and analysis upon them18 54 Geometry General topology19 20 Algebra Group theory and generalizations20 28 Algebra Measure and integration21 18 Algebra Category theory; homological algebra22 55 Geometry Algebraic topology23 26 Algebra Real functions, including derivatives and integrals24 52 Geometry Convex geometry and discrete geometry25 14 Algebra Algebraic geometry26 43 Analysis Abstract harmonic analysis27 15 Algebra Linear and multilinear algebra; matrix theory28 6 Algebra Order theory29 12 Algebra Field theory and polynomials30 5 Algebra Combinatorics31 51 Geometry Geometry32 57 Geometry Manifolds33 13 Algebra Commutative rings and algebras
Notes:We adapt this ranking from Borjas and Doran (2012) and base it on the ratio of the number of Sovietversus American papers published in the particular subfield between 1984 and 1989. We define papers asSoviet if at least one author has a Soviet institutional affiliation. We similarly define American papers.
25
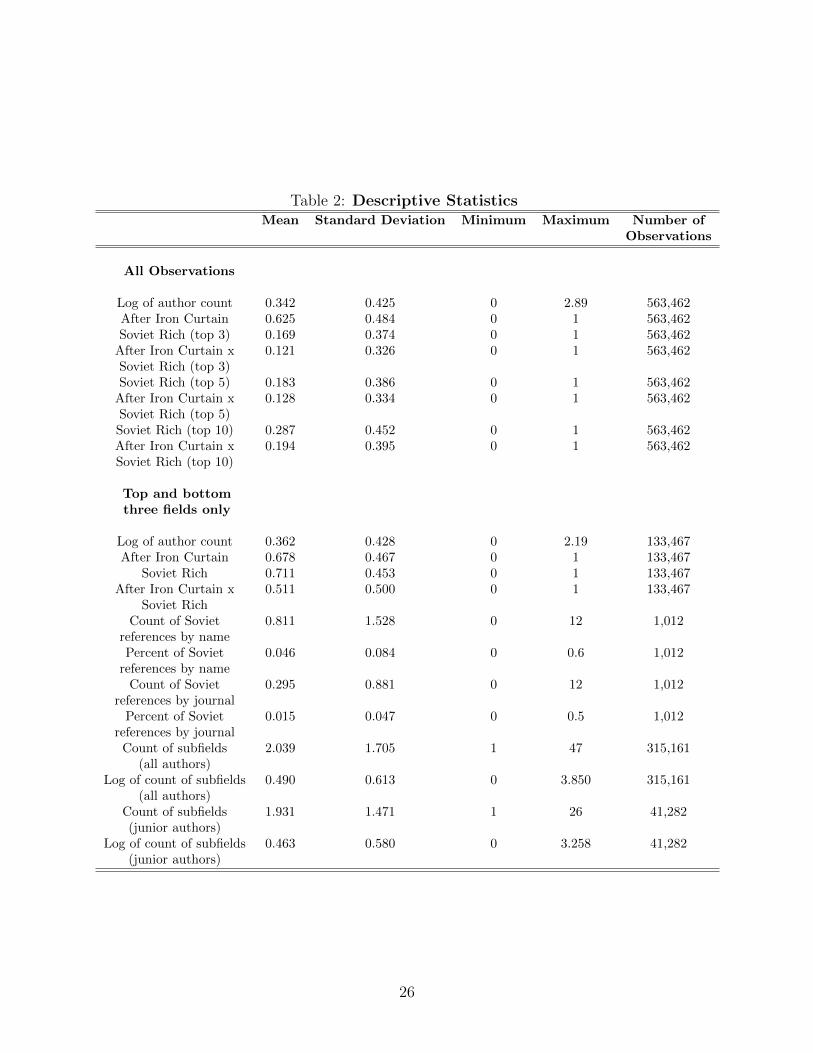
Table 2: Descriptive StatisticsMean Standard Deviation Minimum Maximum Number of
Observations
All Observations
Log of author count 0.342 0.425 0 2.89 563,462After Iron Curtain 0.625 0.484 0 1 563,462Soviet Rich (top 3) 0.169 0.374 0 1 563,462
After Iron Curtain x 0.121 0.326 0 1 563,462Soviet Rich (top 3)Soviet Rich (top 5) 0.183 0.386 0 1 563,462
After Iron Curtain x 0.128 0.334 0 1 563,462Soviet Rich (top 5)Soviet Rich (top 10) 0.287 0.452 0 1 563,462After Iron Curtain x 0.194 0.395 0 1 563,462Soviet Rich (top 10)
Top and bottomthree fields only
Log of author count 0.362 0.428 0 2.19 133,467After Iron Curtain 0.678 0.467 0 1 133,467
Soviet Rich 0.711 0.453 0 1 133,467After Iron Curtain x 0.511 0.500 0 1 133,467
Soviet RichCount of Soviet 0.811 1.528 0 12 1,012
references by namePercent of Soviet 0.046 0.084 0 0.6 1,012
references by nameCount of Soviet 0.295 0.881 0 12 1,012
references by journalPercent of Soviet 0.015 0.047 0 0.5 1,012
references by journalCount of subfields 2.039 1.705 1 47 315,161
(all authors)Log of count of subfields 0.490 0.613 0 3.850 315,161
(all authors)Count of subfields 1.931 1.471 1 26 41,282(junior authors)
Log of count of subfields 0.463 0.580 0 3.258 41,282(junior authors)
26
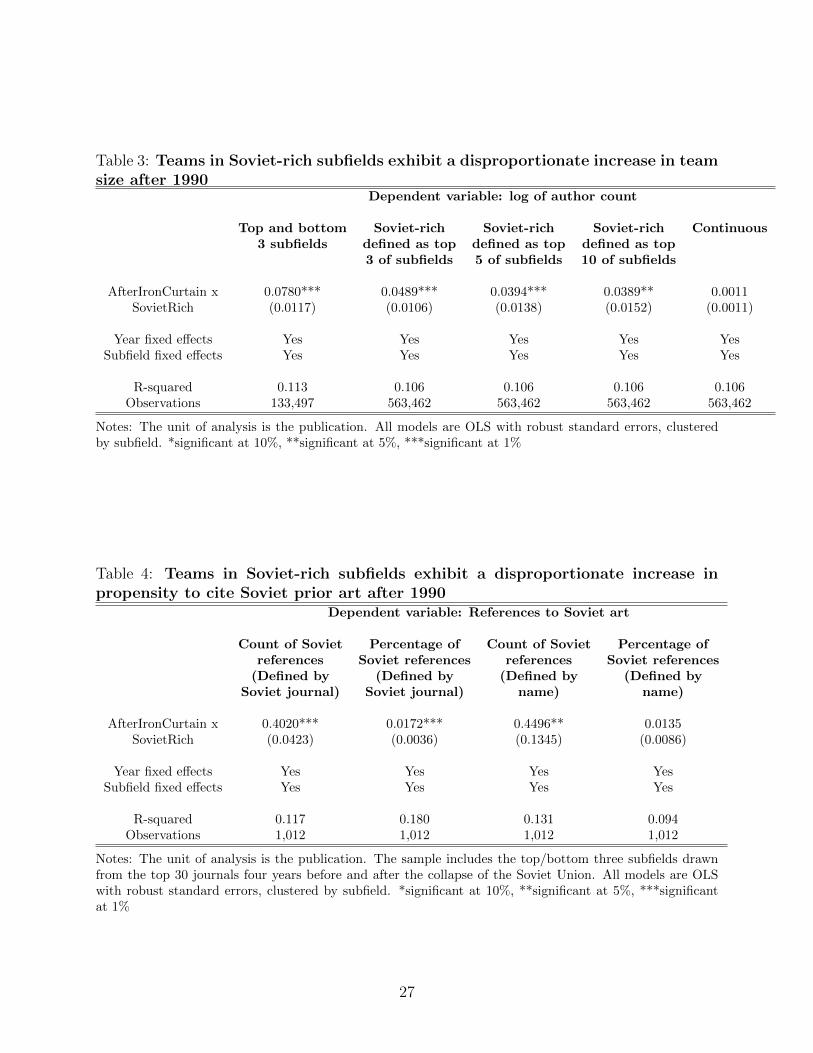
Table 3: Teams in Soviet-rich subfields exhibit a disproportionate increase in teamsize after 1990
Dependent variable: log of author count
Top and bottom Soviet-rich Soviet-rich Soviet-rich Continuous3 subfields defined as top defined as top defined as top
3 of subfields 5 of subfields 10 of subfields
AfterIronCurtain x 0.0780*** 0.0489*** 0.0394*** 0.0389** 0.0011SovietRich (0.0117) (0.0106) (0.0138) (0.0152) (0.0011)
Year fixed effects Yes Yes Yes Yes YesSubfield fixed effects Yes Yes Yes Yes Yes
R-squared 0.113 0.106 0.106 0.106 0.106Observations 133,497 563,462 563,462 563,462 563,462
Notes: The unit of analysis is the publication. All models are OLS with robust standard errors, clusteredby subfield. *significant at 10%, **significant at 5%, ***significant at 1%
Table 4: Teams in Soviet-rich subfields exhibit a disproportionate increase inpropensity to cite Soviet prior art after 1990
Dependent variable: References to Soviet art
Count of Soviet Percentage of Count of Soviet Percentage ofreferences Soviet references references Soviet references
(Defined by (Defined by (Defined by (Defined bySoviet journal) Soviet journal) name) name)
AfterIronCurtain x 0.4020*** 0.0172*** 0.4496** 0.0135SovietRich (0.0423) (0.0036) (0.1345) (0.0086)
Year fixed effects Yes Yes Yes YesSubfield fixed effects Yes Yes Yes Yes
R-squared 0.117 0.180 0.131 0.094Observations 1,012 1,012 1,012 1,012
Notes: The unit of analysis is the publication. The sample includes the top/bottom three subfields drawnfrom the top 30 journals four years before and after the collapse of the Soviet Union. All models are OLSwith robust standard errors, clustered by subfield. *significant at 10%, **significant at 5%, ***significantat 1%
27
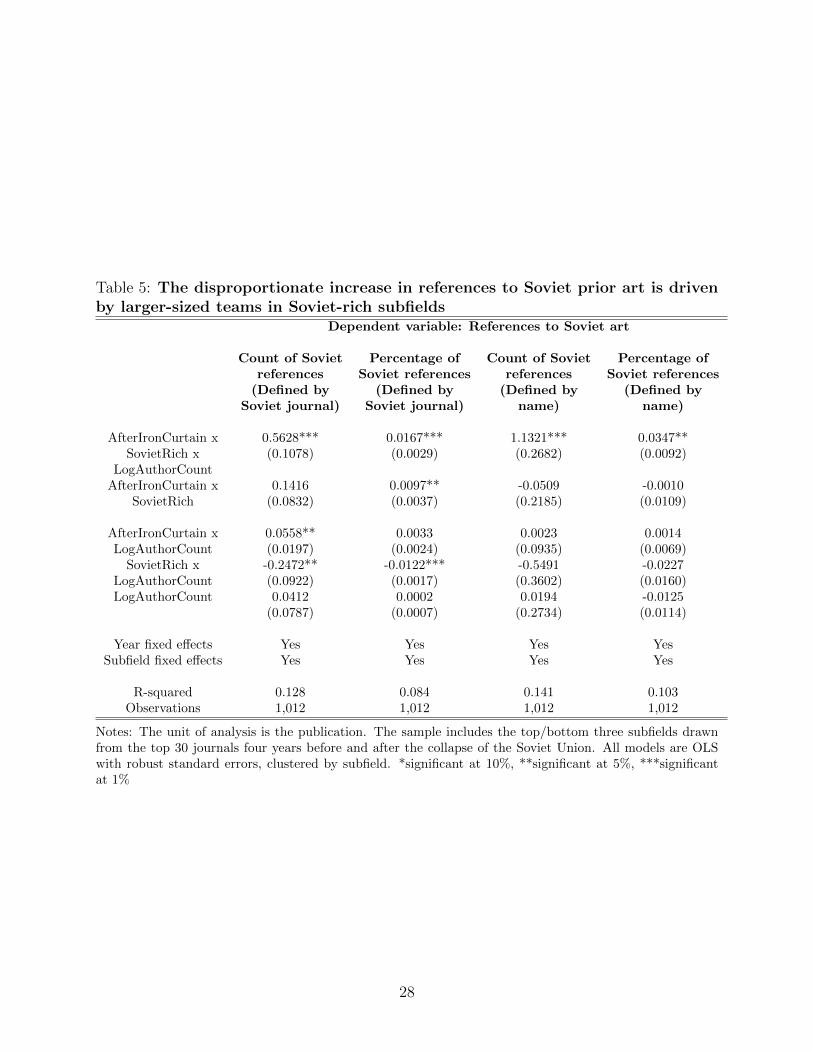
Table 5: The disproportionate increase in references to Soviet prior art is drivenby larger-sized teams in Soviet-rich subfields
Dependent variable: References to Soviet art
Count of Soviet Percentage of Count of Soviet Percentage ofreferences Soviet references references Soviet references
(Defined by (Defined by (Defined by (Defined bySoviet journal) Soviet journal) name) name)
AfterIronCurtain x 0.5628*** 0.0167*** 1.1321*** 0.0347**SovietRich x (0.1078) (0.0029) (0.2682) (0.0092)
LogAuthorCountAfterIronCurtain x 0.1416 0.0097** -0.0509 -0.0010
SovietRich (0.0832) (0.0037) (0.2185) (0.0109)
AfterIronCurtain x 0.0558** 0.0033 0.0023 0.0014LogAuthorCount (0.0197) (0.0024) (0.0935) (0.0069)
SovietRich x -0.2472** -0.0122*** -0.5491 -0.0227LogAuthorCount (0.0922) (0.0017) (0.3602) (0.0160)LogAuthorCount 0.0412 0.0002 0.0194 -0.0125
(0.0787) (0.0007) (0.2734) (0.0114)
Year fixed effects Yes Yes Yes YesSubfield fixed effects Yes Yes Yes Yes
R-squared 0.128 0.084 0.141 0.103Observations 1,012 1,012 1,012 1,012
Notes: The unit of analysis is the publication. The sample includes the top/bottom three subfields drawnfrom the top 30 journals four years before and after the collapse of the Soviet Union. All models are OLSwith robust standard errors, clustered by subfield. *significant at 10%, **significant at 5%, ***significantat 1%
28

Table 6: Authors in Soviet-rich subfields exhibit a disproportionate increase in specializationAll authors; Top and bottom three subfields only Junior authors only
(at 5 years since first publication)
Dep. Var is Count Dep. Var is Logged Dep. Var is Count Dep. Var is Logged Dep. Var is Count Dep. Var is Loggedof subfields count of subfields of subfields count of subfields of subfields count of subfields
AfterIronCurtain x -0.2135*** -0.0709*** -0.0311** -0.0112* -0.1306*** -0.0609***SovietRich (0.0334) (0.0111) (0.0145) (0.0065) (0.0339) (0.0127)SovietRich -0.4174*** -0.1608*** N/A N/A -0.2305*** -0.0927***
(0.0325) (0.0108) (0.0269) (0.0097)
Year fixed effects Yes Yes Yes Yes Yes YesIndividual fixed effects No No Yes Yes Yes Yes
R-squared 0.028 0.030 0.010 0.010 0.085 0.082Observations 315,161 315,161 280,427 280,427 41,282 41,282
All models are OLS with robust standard errors, clustered by author. *significant at 10%, **significant at 5%, ***significant at 1%Note: Author specialization (or negative generalization) is measured by a count of distinct codes published over the last five years. We interpretfewer distinct codes as more specialized. Thus, a negative estimated coefficient implies that the covariate is positively correlated with specialization.
29

Table 7: Teams in Soviet-rich subfields exhibit a disproportionate increase in teamsize after 1990 (all Japanese journals)
Dependent variable: log of author count
Top and bottom Soviet-rich Soviet-rich Soviet-rich Continuous3 subfields defined as top defined as top defined as top
3 of subfields 5 of subfields 10 of subfields
AfterIronCurtain x 0.0692*** 0.0581*** 0.0634*** 0.0699*** 0.0025***SovietRich (0.0173) (0.0154) (0.0162) (0.0150) (0.0006)
Year fixed effects Yes Yes Yes Yes YesSubfield fixed effects Yes Yes Yes Yes Yes
R-squared 0.076 0.068 0.068 0.068 0.068Observations 5,096 17,209 17,209 17,209 17,209
Note: The unit of analysis is the publication. All models are OLS with robust standard errors, clustered bysubfield. *significant at 10%, **significant at 5%, ***significant at 1%
Table 8: Teams in Soviet-rich subfields exhibit a disproportionate increase in teamsize after 1990 (ranked Japanese journals)
Dependent variable: log of author count
Top and bottom Soviet-rich Soviet-rich Soviet-rich Continuous3 subfields defined as top defined as top defined as top
3 of subfields 5 of subfields 10 of subfields
AfterIronCurtain x 0.0678*** 0.0653*** 0.0738*** 0.0751*** 0.0026***SovietRich (0.0203) (0.0175) (0.0189) (0.0143) (0.0007)
Year fixed effects Yes Yes Yes Yes YesSubfield fixed effects Yes Yes Yes Yes Yes
R-squared 0.093 0.070 0.070 0.070 0.070Observations 3,859 13,003 13,003 13,003 13,003
Note: The unit of analysis is the publication. All models are OLS with robust standard errors, clustered bysubfield. *significant at 10%, **significant at 5%, ***significant at 1%
30

Table 9: Teams in Soviet-rich subfields exhibit a disproportionate increase in teamsize after 1990 (not-ranked Japanese journals)
Dependent variable: log of author count
Top and bottom Soviet-rich Soviet-rich Soviet-rich Continuous3 subfields defined as top defined as top defined as top
3 of subfields 5 of subfields 10 of subfields
AfterIronCurtain x 0.0956*** 0.0638* 0.0521 0.0738** 0.0033***SovietRich (0.0206) (0.0329) (0.0378) (0.0321) (0.0011)
Year fixed effects Yes Yes Yes Yes YesSubfield fixed effects Yes Yes Yes Yes Yes
R-squared 0.101 0.109 0.109 0.110 0.110Observations 1,237 4,206 4,206 4,206 4,206
Note: The unit of analysis is the publication. All models are OLS with robust standard errors, clustered bysubfield. *significant at 10%, **significant at 5%, ***significant at 1%
31
APPENDIX
Table A1: Robustness to alternative ranking measureDependent variable: log of author count
Top and bottom Soviet-rich Soviet-rich Soviet-rich Continuous3 subfields defined as top defined as top defined as top
3 of subfields 5 of subfields 10 of subfields
AfterIronCurtain x 0.0800*** 0.0475*** 0.0404*** 0.0364** 0.0012SovietRich (0.0126) (0.0107) (0.0150) (0.0157) (0.0010)
Year fixed effects Yes Yes Yes Yes YesSubfield fixed effects Yes Yes Yes Yes Yes
R-squared 0.112 0.107 0.107 0.106 0.106Observations 133,497 563,462 563,462 563,462 563,462
Note: In this table, we use our own ranking measure rather than Borjas and Doran’ (2012); our measureuses worldwide publications from 1970-1989 rather than US publications from 1984-1989 and relies onidentifying Soviet publications by ethnicity of names rather than by affiliation data. All models are OLSwith robust standard errors, clustered by subfield. *significant at 10%, **significant at 5%, ***significantat 1%.
32
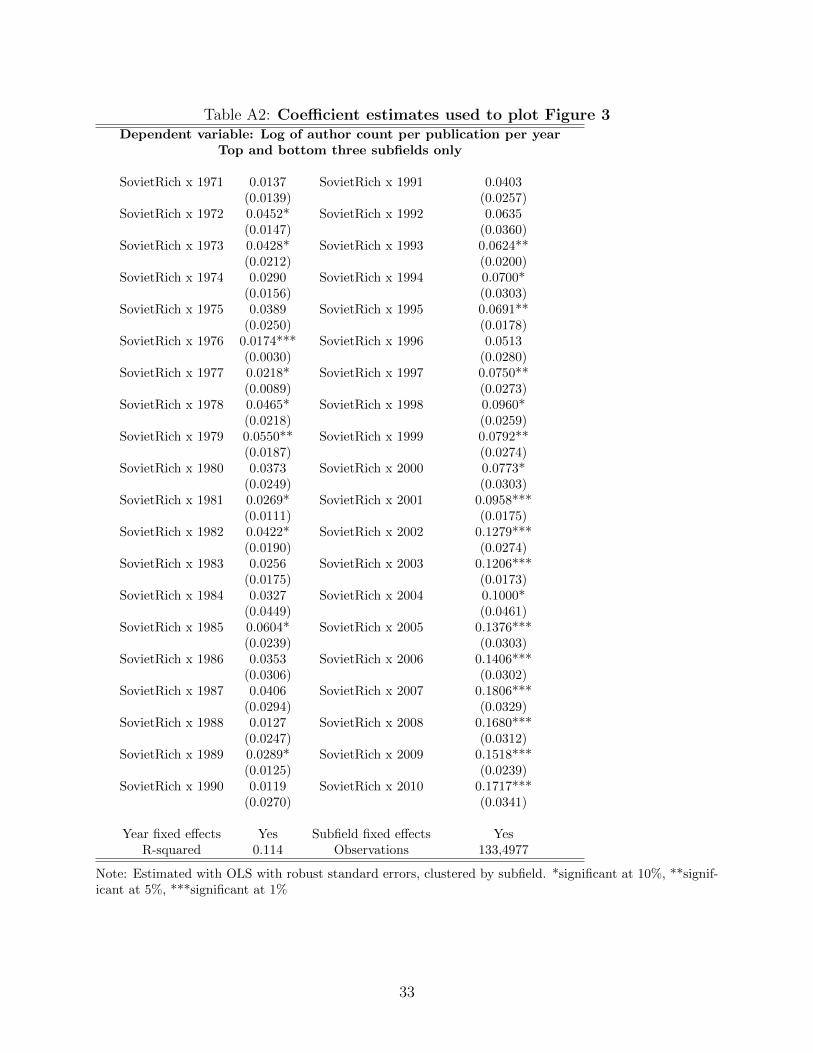
Table A2: Coefficient estimates used to plot Figure 3Dependent variable: Log of author count per publication per year
Top and bottom three subfields only
SovietRich x 1971 0.0137 SovietRich x 1991 0.0403(0.0139) (0.0257)
SovietRich x 1972 0.0452* SovietRich x 1992 0.0635(0.0147) (0.0360)
SovietRich x 1973 0.0428* SovietRich x 1993 0.0624**(0.0212) (0.0200)
SovietRich x 1974 0.0290 SovietRich x 1994 0.0700*(0.0156) (0.0303)
SovietRich x 1975 0.0389 SovietRich x 1995 0.0691**(0.0250) (0.0178)
SovietRich x 1976 0.0174*** SovietRich x 1996 0.0513(0.0030) (0.0280)
SovietRich x 1977 0.0218* SovietRich x 1997 0.0750**(0.0089) (0.0273)
SovietRich x 1978 0.0465* SovietRich x 1998 0.0960*(0.0218) (0.0259)
SovietRich x 1979 0.0550** SovietRich x 1999 0.0792**(0.0187) (0.0274)
SovietRich x 1980 0.0373 SovietRich x 2000 0.0773*(0.0249) (0.0303)
SovietRich x 1981 0.0269* SovietRich x 2001 0.0958***(0.0111) (0.0175)
SovietRich x 1982 0.0422* SovietRich x 2002 0.1279***(0.0190) (0.0274)
SovietRich x 1983 0.0256 SovietRich x 2003 0.1206***(0.0175) (0.0173)
SovietRich x 1984 0.0327 SovietRich x 2004 0.1000*(0.0449) (0.0461)
SovietRich x 1985 0.0604* SovietRich x 2005 0.1376***(0.0239) (0.0303)
SovietRich x 1986 0.0353 SovietRich x 2006 0.1406***(0.0306) (0.0302)
SovietRich x 1987 0.0406 SovietRich x 2007 0.1806***(0.0294) (0.0329)
SovietRich x 1988 0.0127 SovietRich x 2008 0.1680***(0.0247) (0.0312)
SovietRich x 1989 0.0289* SovietRich x 2009 0.1518***(0.0125) (0.0239)
SovietRich x 1990 0.0119 SovietRich x 2010 0.1717***(0.0270) (0.0341)
Year fixed effects Yes Subfield fixed effects YesR-squared 0.114 Observations 133,4977
Note: Estimated with OLS with robust standard errors, clustered by subfield. *significant at 10%, **signif-icant at 5%, ***significant at 1%
33
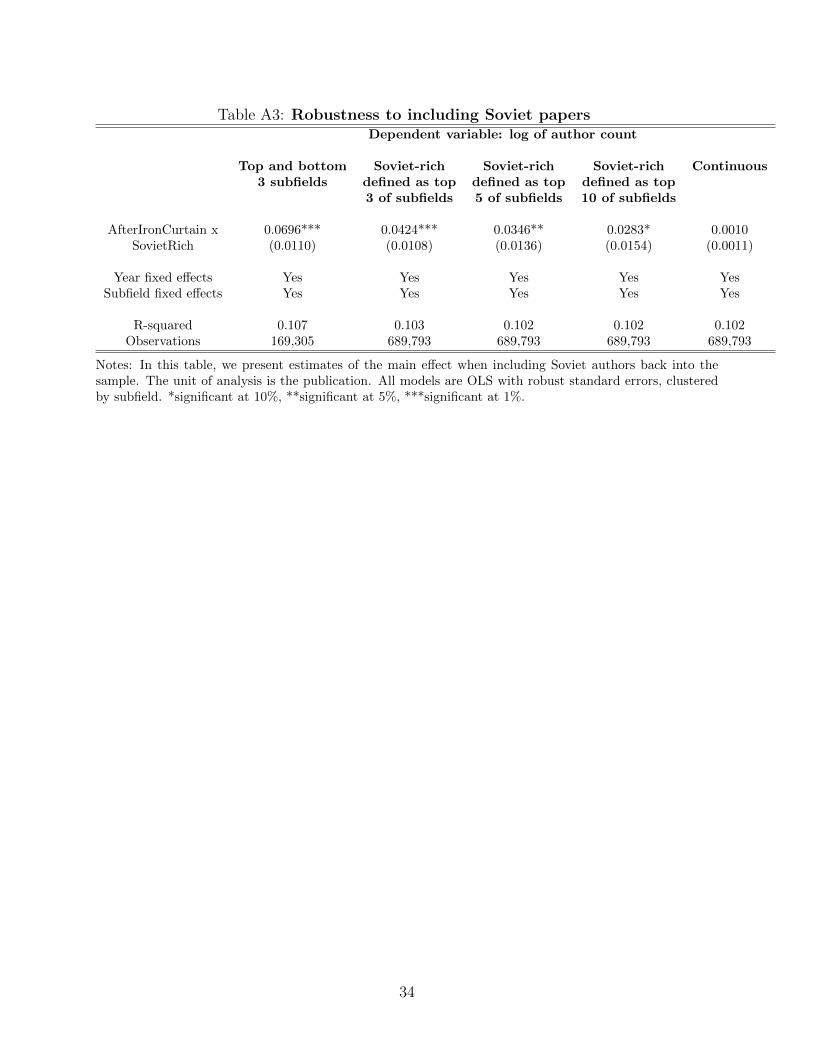
Table A3: Robustness to including Soviet papersDependent variable: log of author count
Top and bottom Soviet-rich Soviet-rich Soviet-rich Continuous3 subfields defined as top defined as top defined as top
3 of subfields 5 of subfields 10 of subfields
AfterIronCurtain x 0.0696*** 0.0424*** 0.0346** 0.0283* 0.0010SovietRich (0.0110) (0.0108) (0.0136) (0.0154) (0.0011)
Year fixed effects Yes Yes Yes Yes YesSubfield fixed effects Yes Yes Yes Yes Yes
R-squared 0.107 0.103 0.102 0.102 0.102Observations 169,305 689,793 689,793 689,793 689,793
Notes: In this table, we present estimates of the main effect when including Soviet authors back into thesample. The unit of analysis is the publication. All models are OLS with robust standard errors, clusteredby subfield. *significant at 10%, **significant at 5%, ***significant at 1%.
34