Does It Matter Where We Publish? Adam Eyre-Walker University of Sussex.
29
Does It Matter Where We Publish? Adam Eyre-Walker University of Sussex
-
date post
19-Dec-2015 -
Category
Documents
-
view
215 -
download
0
Transcript of Does It Matter Where We Publish? Adam Eyre-Walker University of Sussex.

Does It Matter Where We Publish?
Adam Eyre-Walker
University of Sussex

Reasons
• Prestige• peers• employers
• Impact• scientific community• society
Measuring impact
• General• difficult to measure
• Citations• Easy to measure• Velvet Underground effect
• “only sold 10,000 copies, but everyone who bought it formed a band” (Brian Eno)

Question
Do papers of similar quality garner more citations in better quality journals?

Ideal experiment
• Papers made anonymous• authors• journal• structure
• Assessed for quality by experts
• Assessments confidential
• Citations tracked

Research Assessment Exercise (RAE)
• Each department submits• 4 publications per academic (75%)• 4 indicators of Esteem (5%)• Environment
• PhD student numbers• Grant income• Research structure• Facilities
• Superceded by REF
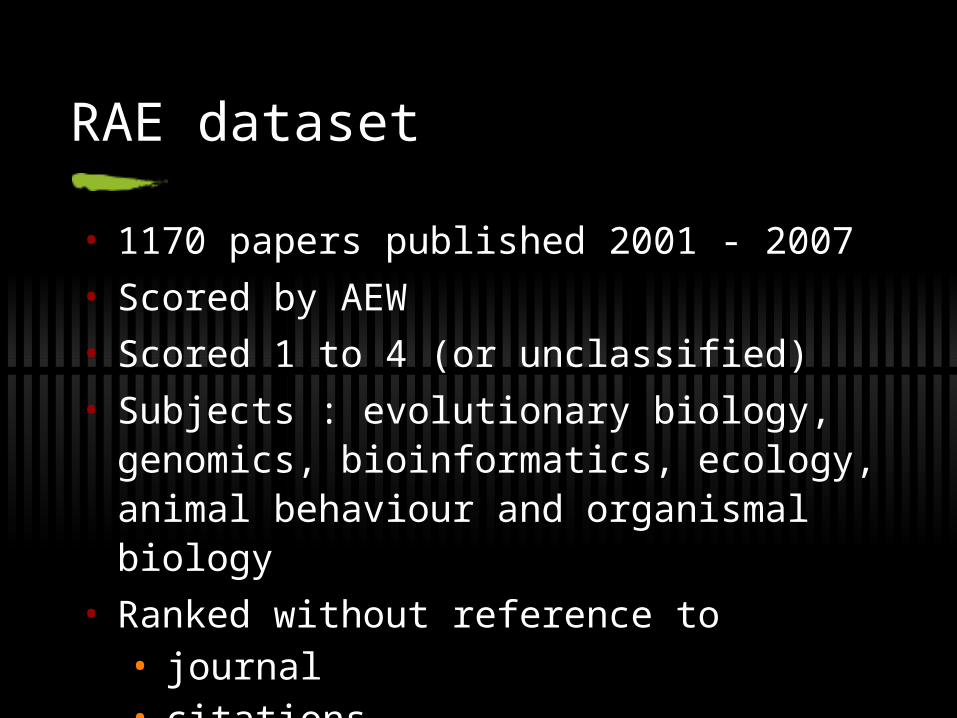
RAE dataset
• 1170 papers published 2001 - 2007
• Scored by AEW
• Scored 1 to 4 (or unclassified)
• Subjects : evolutionary biology, genomics, bioinformatics, ecology, animal behaviour and organismal biology
• Ranked without reference to• journal• citations

RAE scores
RAE score No. of papers
1 74
2 539
3 401
4 103

Journal quality
• Impact factor• Number times papers published in the two
previous years are cited in target year
• Two components• Quality of papers• Effect of the journal on citations
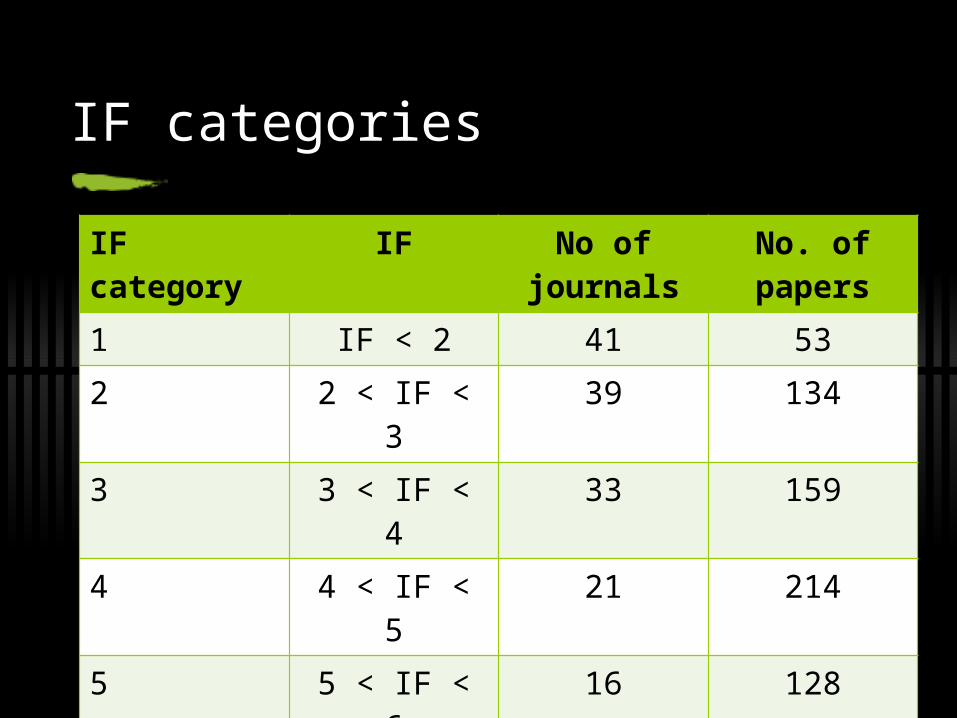
IF categories
IF category IF No of journals
No. of papers
1 IF < 2 41 53
2 2 < IF < 3 39 134
3 3 < IF < 4 33 159
4 4 < IF < 5 21 214
5 5 < IF < 6 16 128
6 6 < IF <10 28 180
7 10 < IF < 20 13 110
8 IF > 20 8 181

Citations
• No. of citations from ISI Web of Science
• October 2008

Data
• For each paper• Year of publication• RAE score (RS)• No. of citations• Impact factor of journal (IF category)• Otherwise anonymous
How good is the assessor?
• Correlation between AEW and co-scorers > 0.7
• Correlation between RS and no. of citations within each IF category and within each year

How good is the assessor?
• Correlation between AEW and co-scorers > 0.7
• Correlation between RS and no. of citations within each IF category and within each year• Average r = 0.27 (p<0.001)
• Average rmax = 0.73
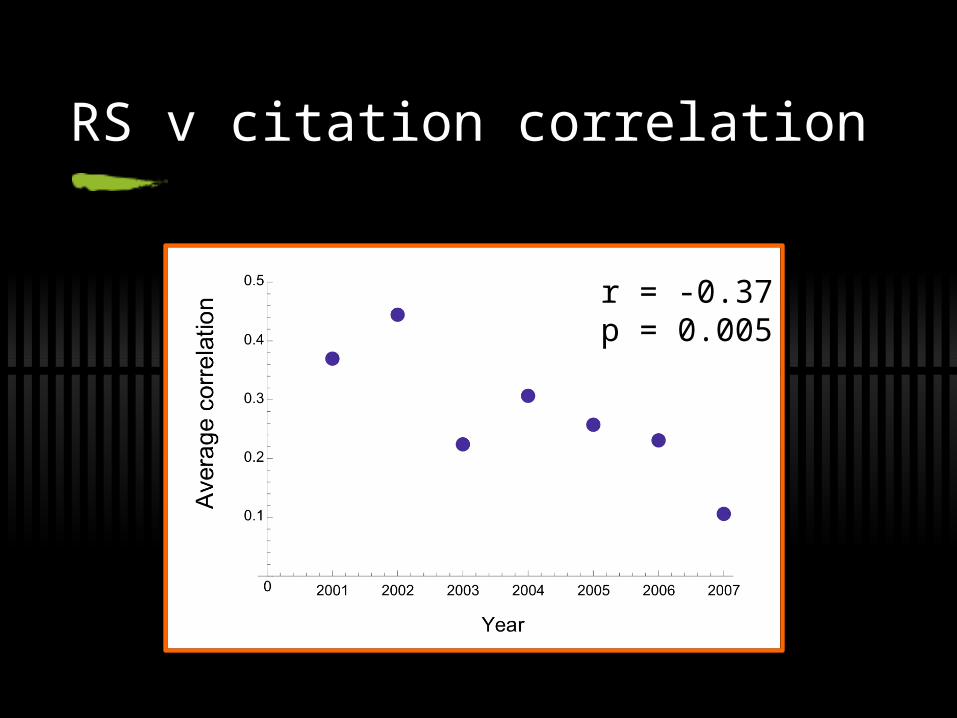
RS v citation correlation
r = -0.37p = 0.005

Central question
• Do papers of similar quality accumulate more citations in some journals than others?

RAE score 2 in 2003
1 2 3 4 5 6 7 80
5
10
15
20
25
30
35
40
45
IF category
Av
era
ge
no
. of
cit
ati
on
s

RAE score 2
p < 0.001
1 2 3 4 5 6 7 80
10
20
30
40
50
60
70
80
IF cat
Av
era
ge
no
. of
cit
ati
on
s

RAE score 3
1 2 3 4 5 6 7 80
20
40
60
80
100
120
IF category
Av
era
ge
no
. of
cit
ati
on
s
p < 0.001

ANCOVA
RS grade p-value 30 v 5
1 0.005 2.1 (1.7)
2 0.000 2.5 (0.3)
3 0.000 2.1 (0.4)
4 0.60 -

ANCOVA
RS grade
p-value All30 v 5
IF<1030 v 5
1 0.005 2.1 (1.7) 1.2 (0.4)
2 0.000 2.5 (0.3) 3.0 (0.3)
3 0.000 2.1 (0.4) 5.4 (1.4)
4 0.60 -

Alternative explanation
• Systematically underestimate quality of papers in high ranking journals
• Test• Assume no effect of journal• Consider correlation between RS and
journal (IF) controlling for citations

Partial correlations
Year Correlation
2001 0.54***
2002 0.49***
2003 0.54***
2004 0.41***
2005 0.31***
2006 0.37***
2007 0.35***

ANCOVA
RS grade p-value 30 v 5
1 0.005 2.1 (1.7)
2 0.000 2.5 (0.3)
3 0.000 2.1 (0.4)
4 0.60 -

Question
• Impact factors – relative contribution of• Paper quality• Journal effect

Summary
• Assessor scores correlated to citations• strength correlated to age
• Assessor scores influenced by journal
• Papers published in higher quality journals accumulate more citations independent of quality
• F1000 data
Question
• Where will we submit?

Thanks
Nina Stoletzki
Assessor and journal
Assume citations measure qualityno journal effect


![Deborah Eyre[1]](https://static.fdocuments.us/doc/165x107/55254e884a795953498b4af7/deborah-eyre1.jpg)