Does Information Feedback Help Reduce Residential ... · Does Information Feedback Help Reduce...
30
1 Does Information Feedback Help Reduce Residential Electricity Consumption? Evidence from a Chinese Houeshold Survey WEI Chu a , GUO Jin a , DU Limin b,* a Department of Energy Economics, Renmin University of China, Beijing b China Academy of West Region Development, Zhejiang University, Hangzhou Abstract: This paper investigates the impact of information feedback on residential electricity conservation, based on a household survey dataset collected in 2012 that covered 26 provinces in China. The results of the basic regression reveal a negative price elasticity but a positive income elasticity. Urban households consume more electricity than do rural households. The electricity consumption is positively associated with family size, dwelling area, householder's years of schooling, and duration of appliance operation. Further tests show that information feedback does have effects on residential electricity consumption. There is reduced electricty consumption when households obtain electricity consumption information through interaction with meter readers, receive ex ante feedback (for households that use a prepaid metering system), and receive explicit feedback by directly paying meter readers. However, the energy conservation effects of increased frequency of information feedback and installation of smart meters are not significant. The sensitivity analysis of quantile regressions confirms the robustness of the results. Keywords: Electricity Conservation; Information Feedback; Household Survey Data; China * Corresponding author. Tel: +0086 571 88273009 E-mail address: [email protected] (Limin DU)
Transcript of Does Information Feedback Help Reduce Residential ... · Does Information Feedback Help Reduce...
1
Does Information Feedback Help Reduce Residential
Electricity Consumption? Evidence from a Chinese
Houeshold Survey
WEI Chua , GUO Jina, DU Liminb,*
a Department of Energy Economics, Renmin University of China, Beijing
b China Academy of West Region Development, Zhejiang University, Hangzhou
Abstract: This paper investigates the impact of information feedback on residential
electricity conservation, based on a household survey dataset collected in 2012 that
covered 26 provinces in China. The results of the basic regression reveal a negative
price elasticity but a positive income elasticity. Urban households consume more
electricity than do rural households. The electricity consumption is positively
associated with family size, dwelling area, householder's years of schooling, and
duration of appliance operation. Further tests show that information feedback does have
effects on residential electricity consumption. There is reduced electricty consumption
when households obtain electricity consumption information through interaction with
meter readers, receive ex ante feedback (for households that use a prepaid metering
system), and receive explicit feedback by directly paying meter readers. However, the
energy conservation effects of increased frequency of information feedback and
installation of smart meters are not significant. The sensitivity analysis of quantile
regressions confirms the robustness of the results.
Keywords: Electricity Conservation; Information Feedback; Household Survey Data;
China
*Corresponding author. Tel: +0086 571 88273009
E-mail address: [email protected] (Limin DU)

2
1. Introduction
The residential electricity consumption of China has increased tremendously over
the past decades. In 1990, residential electricity consumption in China was only 48.1
TWh, but it increased to 621.9 TWh in 2012. The annual growth rate reaches about
12.3%. Moreover, the share of residential consumption in total electricity consumption
increased from 7.7% in 1990 to 12.5% in 2012. It is reasonable to expect that the
increasing trend will continue with further economic growth because electricity demand
and GDP exhibit a positive long-run causal relationship (Shiu and Lam, 2004; Yuan et
al., 2007). Thus, residential electricity conservation is extremely important for energy
saving and carbon abatement in China.
Traditional electricity policies focus on price-based interventions such as multi-part
tariff and peak-load pricing. However, most of the previous studies find that electricity
consumption usually exhibits low income and price elasticities (Reiss and White, 2005;
Shin, 1985; Zhou and Teng, 2013). Thus, price-based interventions are not very useful
for electricity conservation. More recently, policies have begun to pay attention to
information-based interventions. A large number of experiments reveal that residential
electricity consumption may not actually lack price elasticity, but only appear to be lack
of elasticity because they do not have full information on energy price and quantity.
Providing more information on electricity consumptions to the households may help
them to better control their energy consumption (Abrahamse et al., 2005; Darby, 2006;
Faruqui et al., 2010; Fischer, 2008).
Electricity consumption has specific features. The first is that consumption decisions
are made in real time whereas expenditure is only experienced intermittently (usually
monthly when the bill arrives). Such separate experiences of consuming a good and
spending money cause the problem of salience (Gilbert and Graff Zivin, 2014). The
second feature is that the price structure of electricity is usually complicated; consumers
probably do not fully understand the price structure and do not know how to optimize
their electricity consumption (Bushnell and Mansur, 2005; Ito, 2012)1. The consumer
may have no idea about when, how or by which device electric current is used.
Moreover, electricity consumption usually accounts for only a small share of household
budgets; therefore, households may not want to invest too much effort and time to get
information about price and quantity. If the household is provided simple and low-cost
information, such as installation of an in-home display smart meter, residential
electricity consumption may be reduced remarkably (Jessoe and Rapson, 2014).
1 Kempton and Layne (1994) have pointed out that "electricity consumption is like shopping in a grocery store in
which no individual item has a price marking and the consumer receives a monthly bill at an aggregate price for
food consumption".

3
The Chinese government is already aware of the importance of information feedback
for residential electricity savings. A number of policies have been implemented to
improve information feedback to consumers, including in-house display of meters,
development of smart grids and smart meters, etc. Though economic theory predicts a
reduction of electricity consumption through improved information feedback, whether
it works in practice remains an empirical issue. Additionally, which type of information
feedback is most effective among various feedback types needs to be identified.
In this paper, we aim to investigate the energy conservation effect of information
feedback on residential electricity consumption, based on a household survey dataset
collected in 2012 that covered 26 provinces in China. To achieve this goal, we test a
series of hypotheses. The first is whether more information access can help consumers
reduce electricity consumption; the second is whether prepayment of electricity fees
leads to energy savings; the third is whether automatic payment of the bill through a
bank account is harmful to energy conservation; and the fourth and fifth hypotheses test
whether higher billing frequency and installation of smart meters, respectively, are
associated with lower electricity consumption.
The results show that residential electricity consumption is both price- and income-
inelastic. Urban households consume more electricity than do their rural counterparts.
Moreover, residential electricity demand is also positively associated with family size,
dwelling area, heating and cooling degree days, and householders’ years of schooling.
Our results also reveal that information feedback does affect residential electricity
consumption. First, households that obtain electricity consumption information through
interaction with meter readers are associated with lower electricity consumption.
Second, ex ante information feedback (households that use a prepaid metering system)
is associated with less electricity consumption. Third, explicit information feedback
(households that directly pay meter readers) is associated with less electricity
consumption. However, the energy conservation effects of information feedback
frequency and the smart meter program are not significant.
Our paper makes several contributions to the literature. First, we employ a newly
collected, large sample household survey dataset. The dataset not only covers the
majority of Chinese provinces but also includes both urban and rural households. Thus,
it is more representative and reliable. Second, we investigate the effects of a series of
information feedback types on residential electricity savings. To the best of our
knowledge, no previous studies have focused on this topic for the Chinese case.
The paper proceeds as follows: section 2 reviews the previous studies briefly; section
3 describes the dataset; section 4 raises hypotheses; section 5 is the empirical model;
section 6 presents and discusses the estimation results; and the last section concludes.

4
2. Literature review
Early studies on the effect of information feedback on energy conservation, mainly
carried out by psychologists, can be traced back to the 1970s and 1980s, and the
feedback was mostly considered as an intervention (Seligman and Darley, 1977; Winett
et al., 1978; Winkler and Winett, 1982).
The first quantitative analysis of the effectiveness of information feedback on energy
conservation is provided by Sexton et al. (1989). Thereafter, a large number of field
experiments and studies have focused on quantifying the effectiveness of information
on household electricity demand (Darby, 2006; Faruqui et al., 2010; Fischer, 2008). The
literature can be classified into three main branches according to the feedback types.
The first type of information feedback is the energy audit, which is usually offered
for free by utilities. Hartman (1988) estimates the impact of the residential household
conservation programs run by Portland General Electric Company from July 1978
through December 1979. The results show that the amount reasonably attributable to
conservation programs is less than originally thought if self-selection bias is corrected.
The programs accounted for roughly 50% of the electricity savings of the households
and 45-60% of the savings of the higher-income, better-educated, younger home
oweners. Waldman and Ozog (1996) also argue that the incentive-induced energy
savings (including audits, rebates and loans) in the US are overstated. Their results
show that only 71% of total conservation is associated with the incentive program, and
the remaining 29% conservation would have happened regardless.
The second type of information feedback is more informative billing. Henryson et al.
(2000) find that electricity bills have a positive effect on energy savings. Gleerup (2010)
evaluates the effect of information feedback by sending text messages and emails to
consumers. In their randomized field experiment, 1452 households are allocated to
three treatment groups and two comparison groups randomly. Their results show that
text messages and emails reduce annual electricity consumption by about 3%. Allcott
(2011) evaluates a series of non-price energy conservation programs which send Home
Energy Report letters to residential electricity customers. The letters not only compare
the electricity consumptions of the consumers to that of their neighbors, but also
provide energy conservation tips. The results show that about 2% of energy
consumption are reduced because of the information provided by the letters, which is
equivalent to the effect of a 11-20% increase of electricity price. Mizobuchi and
Takeuchi (2013) also find that comparative feedback has a positive effect on energy
savings. Gilbert and Graff Zivin (2014) find that electricity bill can reduce households'
consumption by 0.6-1%.

5
The third type of information feedback is in-home display (IHD) of energy usage,
which is also the most widely employed feedback method. Sexton et al. (1989) find that
the monitoring devices have a significant positive effect on the distribution of electricity
demand. It tends to shift load from the peak period to the off-peak period. Matsukawa
(2004) estimates the effects of information on residential electricity consumption based
on a Japanese experiment. The results find that monitoring device usage leads to energy
conservation. Ueno et al. (2006) find that installation of an on-line interactive energy
consumption information system leads to a 9% reduction in electricity usage. Gans et
al. (2013) find that if the consumer are allowed to track electricity usage in real time,
the electricity consumption in Northern Ireland will decline 11-17%. Carroll et al. (2014)
find that participation in a smart metering program with time-of-use tariff significantly
reduces electricity demand. Jessoe and Rapson (2014) test the effect of information
feedback on the price elasticity of residential electricity demand, based on a randomized
trial. They find that households with IHD treatment are more sensitive to price increases.
However, Hargreaves et al. (2013) find that smart energy monitors do not necessarily
encourage householders to reduce their consumption in the UK.
Very few studies have focused on China's residential electricity savings based on
survey data. Based on a dataset obtained from a questionnaire survey conducted in 13
cities in China, Murata et al. (2008) find that about a 28% reduction in urban households’
electricity usage could be achieved in the year 2020 by improving the efficiency of end-
use appliances. Feng et al. (2010) investigate the barriers to energy efficiency in the
residential sector based on a survey data covering about 600 households in Liaoning
province of China. Zhou and Teng (2013) use annual household survey data for Sichuan
Province from 2007-2009 to estimate the income elasticity and price elasticity of
residential electricity demand. They find that residential electricity demand is both
price- and income-inelastic. To the best of our knowledge, no studies have estimated
the effect of information feedback on residential electricity conservation in China. Our
work is to fill this gap.
3. Description of surveyed residential electricity behavior
Our household survey data is collected from the 2012 China Residential Energy
Consumption Survey (CRECS-2012). The questionnaire covers six parts: household
characteristics, dwelling characteristics, kitchen and home appliances, space heating
and cooling, residential transportation, and electricity billing, metering and pricing
options. The survey was administrated by the Department of Energy Economics at
Renmin University of China during 2012-2013. The sampling distribution among
provinces is based on household population distribution reported in the 6th National
6
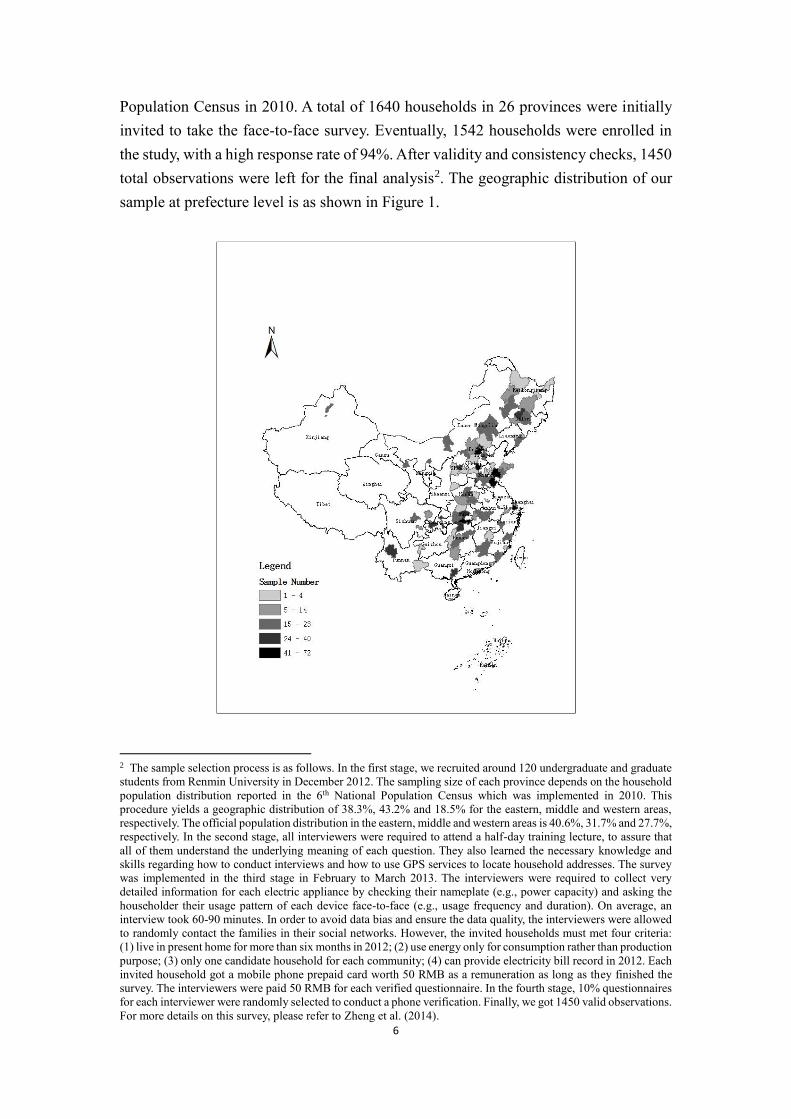
Population Census in 2010. A total of 1640 households in 26 provinces were initially
invited to take the face-to-face survey. Eventually, 1542 households were enrolled in
the study, with a high response rate of 94%. After validity and consistency checks, 1450
total observations were left for the final analysis2. The geographic distribution of our
sample at prefecture level is as shown in Figure 1.
2 The sample selection process is as follows. In the first stage, we recruited around 120 undergraduate and graduate
students from Renmin University in December 2012. The sampling size of each province depends on the household
population distribution reported in the 6th National Population Census which was implemented in 2010. This
procedure yields a geographic distribution of 38.3%, 43.2% and 18.5% for the eastern, middle and western areas,
respectively. The official population distribution in the eastern, middle and western areas is 40.6%, 31.7% and 27.7%,
respectively. In the second stage, all interviewers were required to attend a half-day training lecture, to assure that
all of them understand the underlying meaning of each question. They also learned the necessary knowledge and
skills regarding how to conduct interviews and how to use GPS services to locate household addresses. The survey
was implemented in the third stage in February to March 2013. The interviewers were required to collect very
detailed information for each electric appliance by checking their nameplate (e.g., power capacity) and asking the
householder their usage pattern of each device face-to-face (e.g., usage frequency and duration). On average, an
interview took 60-90 minutes. In order to avoid data bias and ensure the data quality, the interviewers were allowed
to randomly contact the families in their social networks. However, the invited households must met four criteria:
(1) live in present home for more than six months in 2012; (2) use energy only for consumption rather than production
purpose; (3) only one candidate household for each community; (4) can provide electricity bill record in 2012. Each
invited household got a mobile phone prepaid card worth 50 RMB as a remuneration as long as they finished the
survey. The interviewers were paid 50 RMB for each verified questionnaire. In the fourth stage, 10% questionnaires
for each interviewer were randomly selected to conduct a phone verification. Finally, we got 1450 valid observations.
For more details on this survey, please refer to Zheng et al. (2014).

7
Fig.1 Geographic distribution of sample at prefecture level
This survey data shows a high degree of consistency with the official statistics of
the National Bureau of Statistics (NBS) of China (as is shown in Table 1). Taking the
comparable characteristics as an example, the CRECS-2012 shows that males account
for 48.5% in total respondents, for which the NBS number is 51.3%. The average
household size in CRECS-2012 is 2.65 persons in total, 2.57 persons in urban and 2.95
persons in rural areas, which are slightly smaller than the numbers of NBS, i.e. 3.02
persons, 2.86 persons and 3.88 persons, respectively. In addition, the dwelling
characteristics in CRECS-2012 are close to the official report, i.e., the average dwelling
area for urban and rural household in CRECS-2012 is 96 and 135 m2, quite close to the
NBS number of 94 and 143 m2, respectively. We also observe the similar patterns
regarding the ownership of durable goods, i.e., the penetration rate of refrigerator,
washing machine and air-conditioner for urban residences in CRECS-2012 is close to
the number of NBS. However, the ownership of air-conditioner for the rural household
in CRECS-2012 is higher than the NBS’s figure, which may result from the small rural
observations in CRECS-2012.
The survey collected in-depth information for most of electric appliances, including
refrigerator, washing machine, television, personal computer, light bulb, air-conditioner,
water heater and electric fan. The investigator was required to check the physical
nameplate for each device, i.e., the model, power, energy efficiency label, year of
purchase, etc. More importantly, data on usage behavior were also collected, i.e.,
operation duration, operation mode, usage frequency and other information. This
detailed information enables us to estimate the electricity consumption quantity.
Because we need to compare and regress against different end-use purposes, we mainly
rely on device-based estimated electricity consumption. It can be estimated based on
the power capacity, usage frequency, and durations of the devices 3. On average, our
surveyed households consumed 1792 kWh in year 2012, of which 23% was used for
cooking, 47% for home appliances, 12% for water heating, 13% for space cooling and
the remaining 5% for space heating.
3 We use the estimated electricity consumptions rather than the reported ones for two reasons. First, the device-
based estimation can be used to analyze the distribution among various end-use purpose. Second, most of
respondents cannot provide a whole year’s metered record. Instead, they provide an approximate estimation which
shows less variation among seasons. We run a t test to check if the means of the estimated household electricity
consumptions (1792 kWh) and the reported ones (1729 kWh) are the same. The result indicates that we can reject
the null hypothesis at the 10% significance level.

8
Table 1 Comparison of CRECS-2012 with NBS
Index Unit CRECS-2012 NBS
Total Urban Rural Total Urban Rural
Number of observations - 1450 1167 283 - - -
Male percentage % 48.5 48.2 49.5 51.3
a
50.6 51.5
Average household size persons 2.65 2.57 2.95 3.02
a
2.86 3.88
Dwelling area m2 103.73 96.15 134.98 - 94.1 b 143.9
Number of refrigerator per
100 households
- 89 91 77 - 98.5 b 67.3
Number of washing machine
per 100 households
- 91 94 76 - 98 b 67.2
Number of air conditioner
per 100 households
- 113 127 51 - 126.8
b
25.4
Note:
a derived from China Population and Employment Statistical Yearbook (2012);
b derived from China Statistical Yearbook (2013).
The residential electricity consumption pattern shows great spatial heterogeneity.
Urban households used 1892 kWh on average in 2012, nearly 38% more than rural
households (1375 kWh). Figure 2 draws the box plot of the electricity consumptions
over location. The vertical axis of the figure represents electricity consumptions and the
horizontal axis represents locations of the households. The horizontal axis divides the
households into four groups, i.e. households in rural area of northern cities, households
in rural area of southern cities, households in urban area of northern cities, and
households in urban area of southern cities. From the figure, we can observe that urban
residents in the southern area (latitude below 33°) used more electricity than did
households in the northern area significantly. This may be due to the fact that the
northern cities are provided district heating while the southern cities are not4.
4 The cities in northern area of China are provided central heating by the government, while the southern
cities are not. The households in the southern area usually use heating units in the winter. For more details,
please refer to Guo et al. (2015).

9
Fig.2 Household electricity consumption by city and geographic location
Notes: (1) The vertical axis measures electricity consumption and the horizontal axis indicates
location of the household.
(2) Rural: households in rural area; Urban: households in urban area; North: households in
northern area; South: households in southern area.
There are two consumption payment systems in use. One is pre-paid; the power
supply will stop if the pre-paid credits run out. Another method is to pay the bill after
usage. In total, 1379 respondents provided this information, of which around one-third
of households are using a pre-paid metering system and the remaining users are billed
after usage. As we will see, consumers receive information about usage and make
payments in different ways depending on which payment system is in use.
We now look at the different ways in which consumers receive electricity
information. In the questionnaire, the respondents were asked (1) whether they use a
smart-meter; (2) whether they know the quantity or cost of their electricity consumption;
and (3) how they access this information. We have 1389 responses, of which 41% of
households have installed a smart-meter, while the remaining households have not.
Among all the responding households, around 22% respondents do not know any
information about their monthly electricity usage. The remaining users access their
electricity information through four channels: “power grid (or bank) billing statement”
(43%); “informed by meter readers” (19%); “prepayment record” (10%); and other
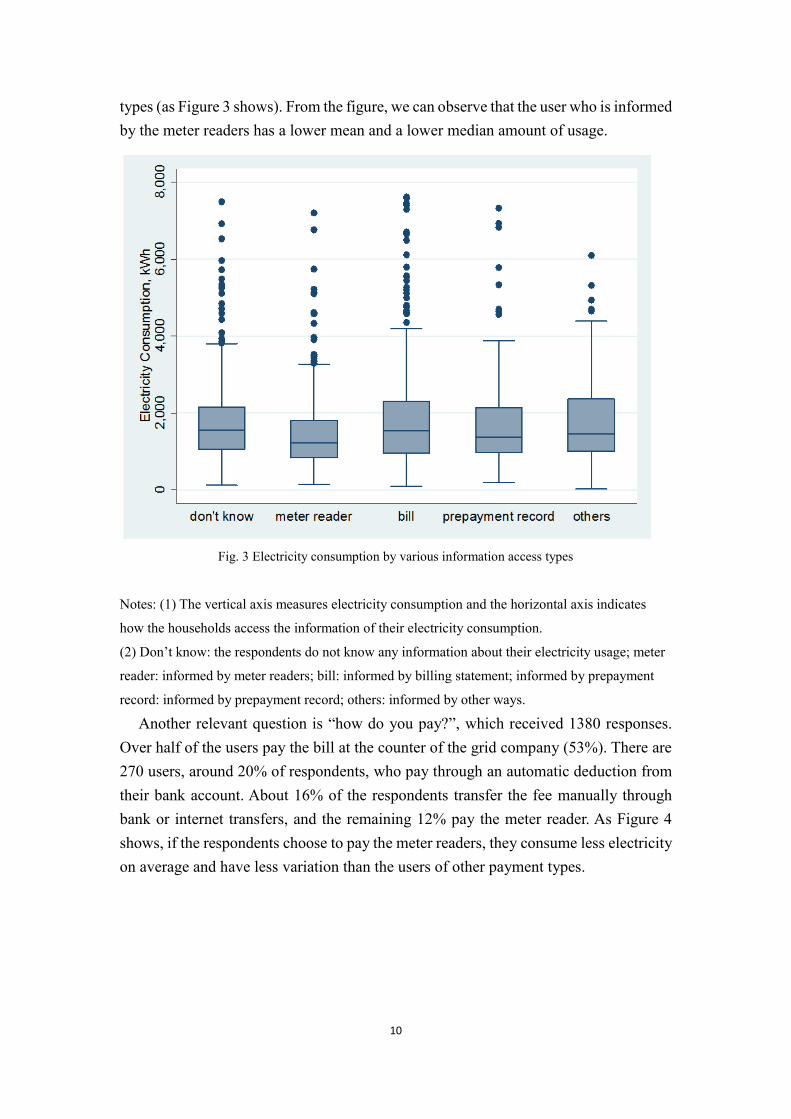
methods (6%). We compared the electricity consumption for various information access
10
types (as Figure 3 shows). From the figure, we can observe that the user who is informed
by the meter readers has a lower mean and a lower median amount of usage.
Fig. 3 Electricity consumption by various information access types
Notes: (1) The vertical axis measures electricity consumption and the horizontal axis indicates
how the households access the information of their electricity consumption.
(2) Don’t know: the respondents do not know any information about their electricity usage; meter
reader: informed by meter readers; bill: informed by billing statement; informed by prepayment
record: informed by prepayment record; others: informed by other ways.
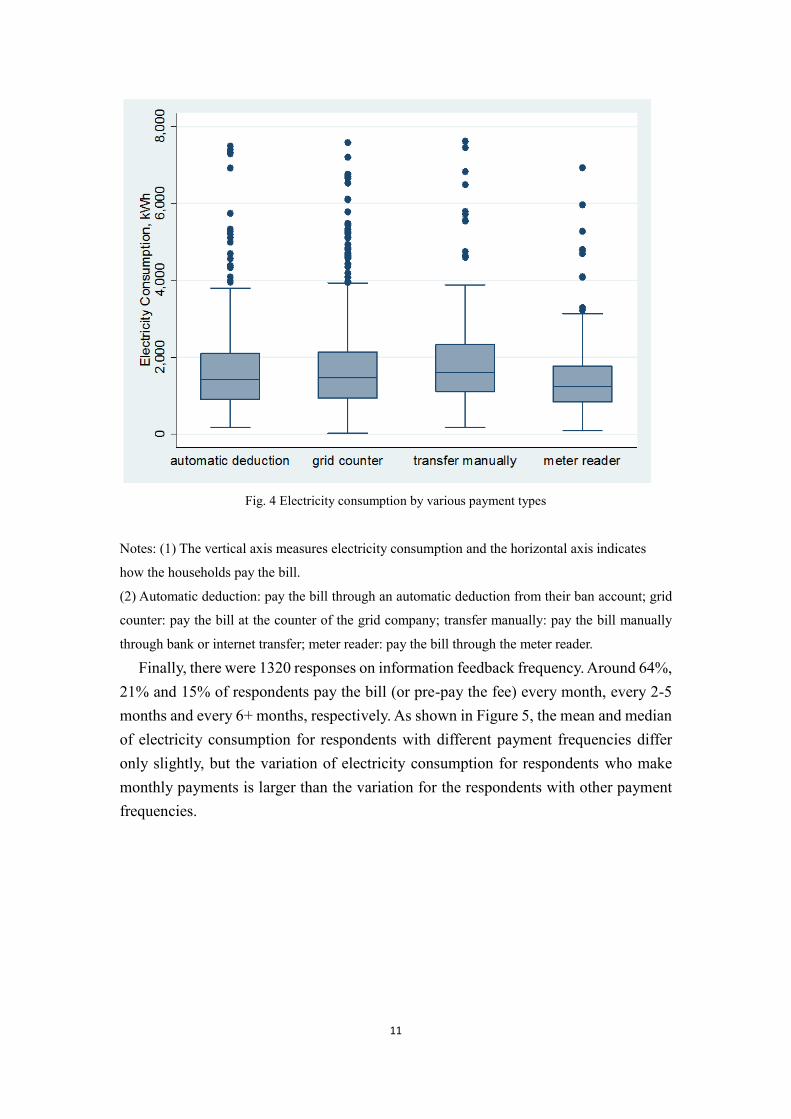
Another relevant question is “how do you pay?”, which received 1380 responses.
Over half of the users pay the bill at the counter of the grid company (53%). There are
270 users, around 20% of respondents, who pay through an automatic deduction from
their bank account. About 16% of the respondents transfer the fee manually through
bank or internet transfers, and the remaining 12% pay the meter reader. As Figure 4
shows, if the respondents choose to pay the meter readers, they consume less electricity
on average and have less variation than the users of other payment types.
11
Fig. 4 Electricity consumption by various payment types
Notes: (1) The vertical axis measures electricity consumption and the horizontal axis indicates
how the households pay the bill.
(2) Automatic deduction: pay the bill through an automatic deduction from their ban account; grid
counter: pay the bill at the counter of the grid company; transfer manually: pay the bill manually
through bank or internet transfer; meter reader: pay the bill through the meter reader.
Finally, there were 1320 responses on information feedback frequency. Around 64%,
21% and 15% of respondents pay the bill (or pre-pay the fee) every month, every 2-5
months and every 6+ months, respectively. As shown in Figure 5, the mean and median
of electricity consumption for respondents with different payment frequencies differ
only slightly, but the variation of electricity consumption for respondents who make
monthly payments is larger than the variation for the respondents with other payment
frequencies.

12
Fig. 5 Electricity consumption by various payment frequencies
Notes: (1) The vertical axis measures electricity consumption and the horizontal axis indicates
how frequent the households pay the bill.
(2) Monthly: pay the bill monthly; quarterly: pay the bill every 2-5 months; half-yearly: pay the
bill every 6+ months.
4. Hypotheses
In the light of previous literature and observations from the survey, we propose the
following hypotheses that need to be empirically examined.
H1: the more information accessed, the less electricity consumed
As Wilhite and Ling (1995) explained, information feedback is put into effect
through the following transmission mechanism. First, the increased information
feedback promotes energy conservation awareness or knowledge; then, this information
enables people to teach themselves how to save energy, promoting and reinforcing self-
efficacy (Oltra et al., 2013); finally, these changes in energy consumption behavior lead
to a decrease in consumption. Thus, we hypothesize that the users who get feedback
about their electricity information are more likely to change their consumption behavior,
leading to lower electricity usage. In contrary, those households that do not access any
information feedback may lack the necessary knowledge and have less incentive to
change their behavior, resulting in higher consumption of electricity.
H2: ex ante information feedback is associated with less electricity compared to

13
ex post feedback
Under the prepayment system, the consumer charges money to her electric meter
account before using power; once the credit points are used up, the power supply stops
until a new payment is made. Usually, the meter will remind the user to charge
immediately when the remaining points trigger a boundary value. In comparison, the
bill payment system allows the user to consume electricity before payment. The grid
company normally sets up a payment period (which could be monthly or less frequently)
when it signs the contract with the user. Even if the consumer does not pay immediately,
the power service will not be stopped, but it incurs an additional overdue fine.
Obviously, the prepayment system feeds back ex ante information to the user, while the
bill payment system provides ex post feedback. Households that receive ex ante
feedback face a more certain and tighter constraint than those that receive ex post
feedback. Similarly to Faruqui et al. (2010), who find that prepaid systems can boost
electricity conservation, we hypothesize that the household with ex ante feedback
consumes less electricity.
H3: explicit information feedback leads to lower electricity demand relative to
implicit feedback
We re-categorize the payment method into two groups. For the householder who
authorizes the bank to automatically deduct from his associated account, he may be
unconscious of the payment record in terms of quantity and price. Thus, we define this
kind of information as implicit and passively delivered to customers. Another category
is defined as explicit information feedback because the payment is implemented in an
active/interactive way, i.e., the householder has to know the consumption quantity and
cost expenditure when she pays the bill (or charges the account) through a grid counter,
bank or internet transfer or meter reader. We hypothesize that implicit information
feedback (i.e., automatic bank deduction) leads to higher electricity consumption.
H4: the more frequent feedback, the less electricity demand
A number of studies conclude that feedback frequency is a key factor in energy
savings (Fischer, 2008; Wood and Newborough, 2003). These studies divide feedback
frequency into three categories: continuous/in-time feedback, daily feedback and
weekly (or monthly) feedback. As Fischer (2008) suggested, quick feedback improves
the link between consumers’ actions and effects; consequently, it increases
consciousness about the action’s outcome. Accordingly, we hypothesize that high-
frequency information feedback leads to lower electricity demand.
H5: smart meter users have lower electricity consumption
14
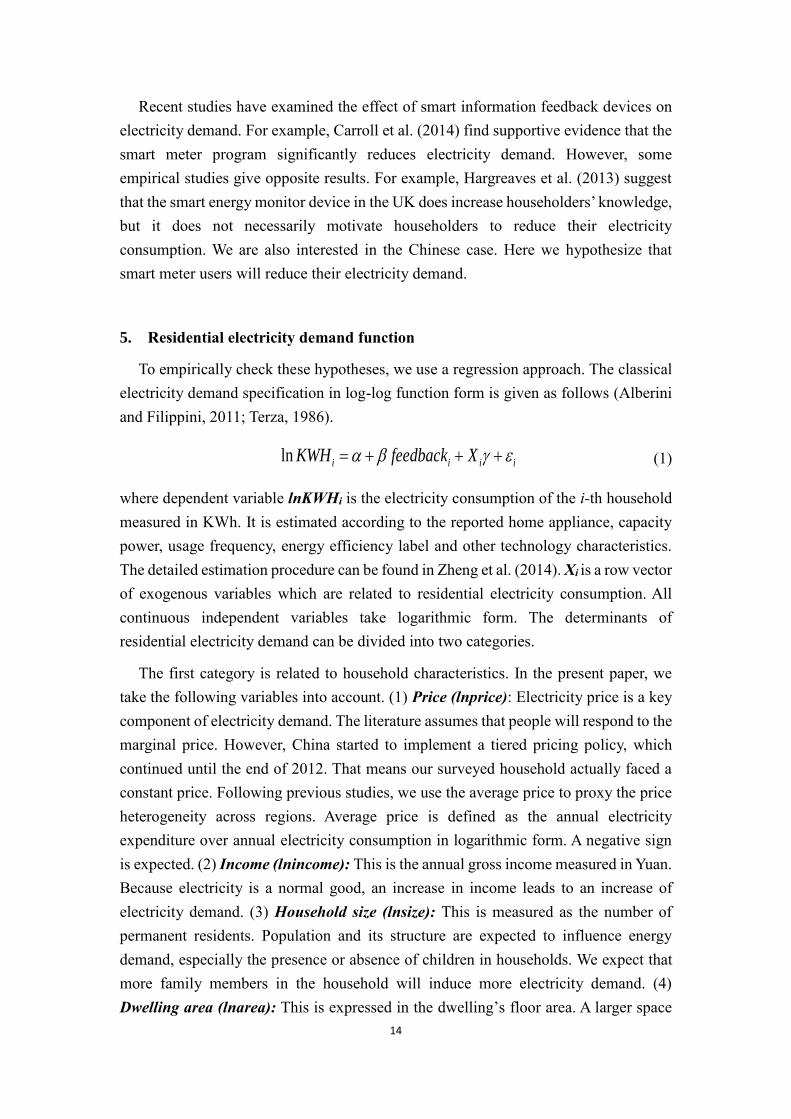
Recent studies have examined the effect of smart information feedback devices on
electricity demand. For example, Carroll et al. (2014) find supportive evidence that the
smart meter program significantly reduces electricity demand. However, some
empirical studies give opposite results. For example, Hargreaves et al. (2013) suggest
that the smart energy monitor device in the UK does increase householders’ knowledge,
but it does not necessarily motivate householders to reduce their electricity
consumption. We are also interested in the Chinese case. Here we hypothesize that
smart meter users will reduce their electricity demand.
5. Residential electricity demand function
To empirically check these hypotheses, we use a regression approach. The classical
electricity demand specification in log-log function form is given as follows (Alberini
and Filippini, 2011; Terza, 1986).
ln i i i iKWH feedback X
(1)
where dependent variable lnKWHi is the electricity consumption of the i-th household
measured in KWh. It is estimated according to the reported home appliance, capacity
power, usage frequency, energy efficiency label and other technology characteristics.
The detailed estimation procedure can be found in Zheng et al. (2014). Xi is a row vector
of exogenous variables which are related to residential electricity consumption. All
continuous independent variables take logarithmic form. The determinants of
residential electricity demand can be divided into two categories.
The first category is related to household characteristics. In the present paper, we
take the following variables into account. (1) Price (lnprice): Electricity price is a key
component of electricity demand. The literature assumes that people will respond to the
marginal price. However, China started to implement a tiered pricing policy, which
continued until the end of 2012. That means our surveyed household actually faced a
constant price. Following previous studies, we use the average price to proxy the price
heterogeneity across regions. Average price is defined as the annual electricity
expenditure over annual electricity consumption in logarithmic form. A negative sign
is expected. (2) Income (lnincome): This is the annual gross income measured in Yuan.
Because electricity is a normal good, an increase in income leads to an increase of
electricity demand. (3) Household size (lnsize): This is measured as the number of
permanent residents. Population and its structure are expected to influence energy
demand, especially the presence or absence of children in households. We expect that
more family members in the household will induce more electricity demand. (4)
Dwelling area (lnarea): This is expressed in the dwelling’s floor area. A larger space

15
is normally associated with more lights and appliances. Therefore, a positive coefficient
is expected. (5) Householder’s education level (lneduyear): This is represented by the
householders’ years of schooling. It has two distinct effects on electricity demand. On
the one hand, households with highly-educated members tend to consume less
electricity because they have a stronger awareness of conservation and environmental
concerns. On the other hand, higher education is normally associated with higher
income, which tends to increase electricity usage. Therefore, the coefficient is uncertain.
(6) Urbanization (citytown): we use a dummy variable to differentiate urban and rural
households. It equals 1 for urban households and 0 for rural residents. A positive
relationship is expected between urbanization and consumption.
Another branch of literature explaining residential electricity demand is related to
household lifestyles and behaviors (Carlsson‐Kanyama et al., 2005; Wyatt, 2013;
Zhou and Teng, 2013), i.e., how the household behaves, how members use appliances,
and their attitude toward energy conservation and other environmental concerns. In the
present paper, we use two variables to reflect appliances usage. One is the heating
degree days (lnHDD). This measures the number of days when the household uses an
electrical device for the purpose of space heating. Similarly, lnCDD is the cooling
degree days. It measures the number of days when the household uses an air
conditioning device for space cooling. It is reasonable to expect that the coefficients of
these two terms are positive, which means that the greater the number of days heating
and cooling appliances are used, the more electricity will be consumed.
Feedback is represented by using five candidate variables according to our
hypotheses. (1) Whether and how the electricity information can be accessed
(H1_infor). It equals 0 if the household doesn’t know any information. A non-zero
value of 1, 2, 3 or 4 indicates the information source is from a meter reader, billing
statement, prepayment record, or other source, respectively. (2) The billing type
(H2_bill_type). It equals 1 if the household prepays the electricity fee. Otherwise, it
equals 2 for a billing statement user. (3) The payment approaches (H3_pay_way). It
equals 1, 2, 3 and 4 for households that pay the bill (or charge) through authorized
automatic deduction from a bank account, at the grid company counter, through a bank
or internet transfer or directly to the meter readers, respectively. (4) The payment
frequency (H4_freq). It is assigned value 1, 2 and 3 for payment every month, 2-5
months or 6 or more months, respectively. (5) The use of smart meter (H5_smart). It
equals 1 if the smart meter is used. Otherwise, it equals 0.
The survey data reflects household information in 2012 and offers cross-sectional
data for analysis. Descriptive statistics of all variables are listed in Table 2. On average,
a surveyed household in the year 2012 had 2.66 persons. The average household
consumed 1738.7 kWh based on device usage with an average cost of 0.53 Yuan per

16
kWh.
Table 2 The descriptive statistics for all variables
Variable obs Unit Mean S.D. Min. Max.
Estimated KWh KWH 1379 kWh 1738.66 1200.28 26.28 7620.68
Electricity price price 1379 Yuan/kWh 0.53 0.05 0.32 0.70
Household income income 1370 10,000 Yuan 9.68 15.51 0.50 350.00
Household size size 1375 person 2.66 1.06 1.00 8.00
Householder’s
schooling years eduyear 1276 year 11.31 3.93 0.00 22.00
Dwelling area area 1366 m2 104.30 49.00 21.00 250.00
Heating degree
days HDD 1379 day/year 27.10 40.51 0.00 195.00
Cooling degree
days CDD 1379 day/year 31.06 33.66 0.00 150.00
Urban or Rural citytown 1377 -- 0.80 0.40 0 1
Information access H1_infor 1379 -- 1.60 1.13 0 4
Billing type H2_bill_type 1369 -- 1.68 0.47 1 2
Payment type H3_pay_way 1370 -- 2.20 0.89 1 4
Payment frequency H4_freq 1310 -- 1.52 0.75 1 3
Smart meter H5_smart 1379 -- 0.41 0.49 0 1
6. Results and discussions
The regression results are listed in Table 35. We firstly regress residential electricity
consumption on the classical driving forces and present the results in column (1).
Considering the possible heterogeneity, an OLS estimation with Huber-White sandwich
standard errors is applied.
(1) Basic Model
Column (1) reports the results for the basic model. The price elasticity is -0.79 and
is significant at the 0.1% level. When the Feedback variables are taken into account,
the price elasticity ranges from -0.82 to -0.6. This finding is consistent with our
expectation and most of the literature. For example, Filippini and Pachauri (2004)
estimate price elasticity in India during 1993-1994, with results ranging from -0.42 to -
0.29; Zhou and Teng (2013) use urban household survey data for Sichuan Province in
China from 2007-2009 to estimate the price elasticity of urban residential electricity
5 We have checked the problem of multi-collinearity for all the regressions by Variance Inflation Factor (VIF), and
the results show that it is not a severe problem.

17
demand and get elasticity ranges from -0.50 to -0.35. The coefficient of household
income is also significant at the 0.1% level. Our estimation gives an income elasticity
of 0.1, which is very close to that found by Yoo et al. (2007), who report income
elasticity of 0.06-0.11 for Seoul’s residents in 2005. It also coincides with Zhou and
Teng (2013)’s finding that the income elasticity in urban China is 0.14-0.33.
As we expected, other explanatory variables positively and significantly contribute
to residential electricity consumption, i.e., the more permanent family members and the
larger the area, the more electricity consumed (Filippini and Pachauri, 2004; Yoo et al.,
2007). As for the householders’ years of schooling, we consider awareness of
conservation and the income effect at the same time. The coefficient of householders’
years of schooling is 0.168, which is significant at the 0.1% level; this indicates that the
income effect is dominant. For the urban dummy variable, the positive coefficient is
significant at the 1% level. It indicates that urban households generally use more
electricity than do rural households.
Regarding lifestyle, most previous studies proxy this dimension by using the number
of appliances, i.e., refrigerators, air conditioners, and computers. However, these
variables cannot capture people’s behavior about how they employ these devices, i.e.,
some appliances that are registered in the survey are not actually in use. Instead, our
data enables us to depict people’s preferences in a more accurate way. The remarkable
positive signs for the heating and cooling days across all columns show that the usage
of home appliances plays a key role. Ceteris paribus, the longer the duration of
operation for home appliances, the more electricity is consumed.
In general, the basic model in column (1) shows results consistent with previous
studies. It reveals a negative price elasticity and positive income elasticity for our
surveyed data. Urbanization does increase residential electricity demand. Moreover,
electricity demand is positively correlated with family size, dwelling area, years of

18
Table 3 Regression results
Variables Model (1) Model (2) Model (3) Model (4) Model (5) Model (6) Model (7)
Basic H1 H2 H3 H4 H5 Mixed
lnPrice -0.789*** -0.703*** -0.817*** -0.731*** -0.801*** -0.793*** -0.659**
(-4.42) (-3.76) (-4.48) (-4.06) (-4.13) (-4.44) (-3.26)
lnIncome 0.0986*** 0.101*** 0.0996*** 0.0955*** 0.0949*** 0.0994*** 0.0981***
(4.25) (4.35) (4.31) (4.09) (3.90) (4.26) (4.04)
x_lnsize 0.162*** 0.161*** 0.158*** 0.182*** 0.183*** 0.160*** 0.188***
(3.44) (3.43) (3.40) (3.85) (3.81) (3.40) (3.90)
x_lneduyear 0.158*** 0.149** 0.161*** 0.160*** 0.151** 0.159*** 0.143**
(3.32) (3.09) (3.39) (3.41) (2.93) (3.35) (2.80)
x_lnarea 0.105* 0.109** 0.104* 0.104* 0.0886* 0.108* 0.104*
(2.50) (2.59) (2.46) (2.45) (1.98) (2.55) (2.34)
x_lnHDD 0.0402*** 0.0431*** 0.0381*** 0.0418*** 0.0381*** 0.0404*** 0.0428***
(3.91) (4.20) (3.67) (4.05) (3.55) (3.93) (3.95)
x_lnCDD 0.0860*** 0.0838*** 0.0858*** 0.0869*** 0.0861*** 0.0866*** 0.0851***
(8.59) (8.34) (8.52) (8.66) (8.28) (8.64) (8.13)
x_citytown 0.142* 0.162** 0.143* 0.148** 0.143* 0.141* 0.156**
(2.49) (2.83) (2.51) (2.59) (2.41) (2.48) (2.63)
H1: Information source (baseline: no information feedback)
1 meter-reader -0.114* -0.152*
(-2.08) (-2.46)

19
Variables Model (1) Model (2) Model (3) Model (4) Model (5) Model (6) Model (7)
Basic H1 H2 H3 H4 H5 Mixed
2 bank billing statement 0.0439 -0.0182
(0.90) (-0.34)
3 prepaid record -0.0423 -0.0126
(-0.68) (-0.20)
4 others 0.0961 0.0821
(1.25) (1.04)
H2: Billtype (baseline: prepay system, or ex-ante feedback)
2 bill (ex-post feedback) 0.0854* 0.131**
(2.45) (2.97)
H3: Payment mode (baseline: bank automatic debit, or implicit information feedback)
2 grid counter -0.0105 -0.0128
(-0.22) (-0.27)
3 bank or internet transfer -0.0264 -0.0296
(-0.45) (-0.46)
4 meter reader -0.160** -0.171*
(-2.59) (-2.58)
H4: information feedback frequency (baseline: monthly pay)
2 quarterly 0.0302 0.0640
(0.67) (1.35)
3 more than half a year -0.0312 0.00457
(-0.60) (0.08)
20
Variables Model (1) Model (2) Model (3) Model (4) Model (5) Model (6) Model (7)
Basic H1 H2 H3 H4 H5 Mixed
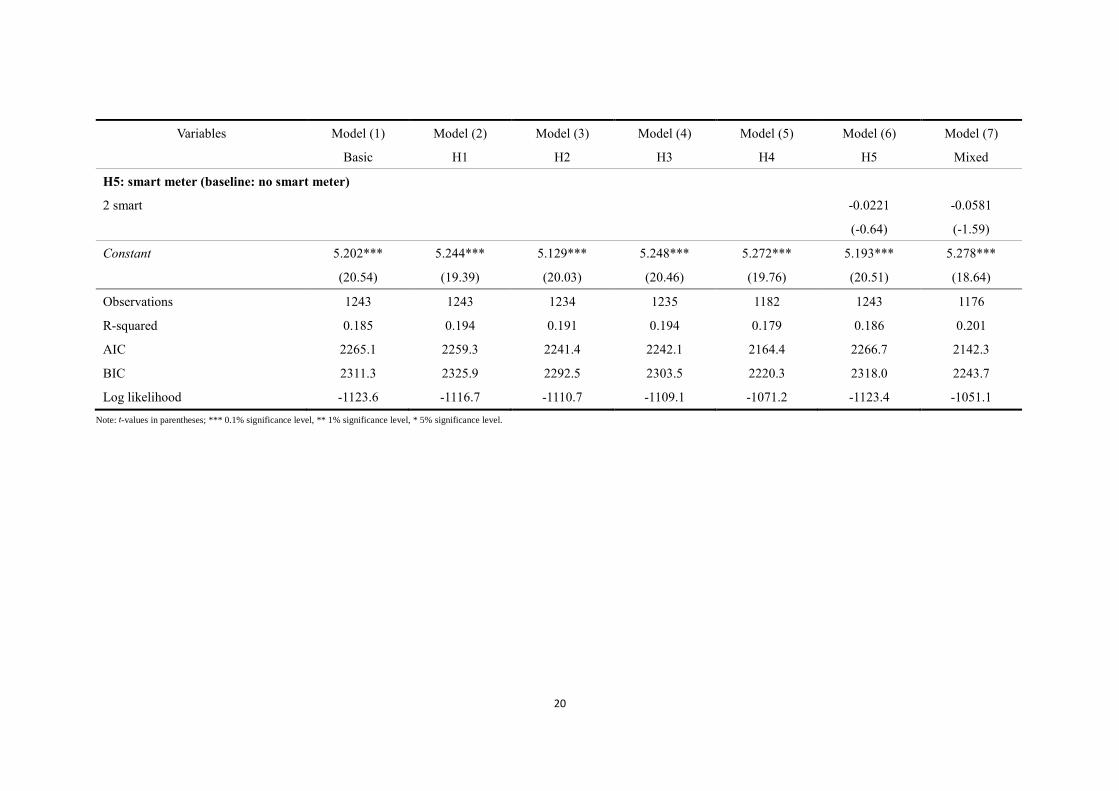
H5: smart meter (baseline: no smart meter)
2 smart -0.0221 -0.0581
(-0.64) (-1.59)
Constant 5.202*** 5.244*** 5.129*** 5.248*** 5.272*** 5.193*** 5.278***
(20.54) (19.39) (20.03) (20.46) (19.76) (20.51) (18.64)
Observations 1243 1243 1234 1235 1182 1243 1176
R-squared 0.185 0.194 0.191 0.194 0.179 0.186 0.201
AIC 2265.1 2259.3 2241.4 2242.1 2164.4 2266.7 2142.3
BIC 2311.3 2325.9 2292.5 2303.5 2220.3 2318.0 2243.7
Log likelihood -1123.6 -1116.7 -1110.7 -1109.1 -1071.2 -1123.4 -1051.1
Note: t-values in parentheses; *** 0.1% significance level, ** 1% significance level, * 5% significance level.
21
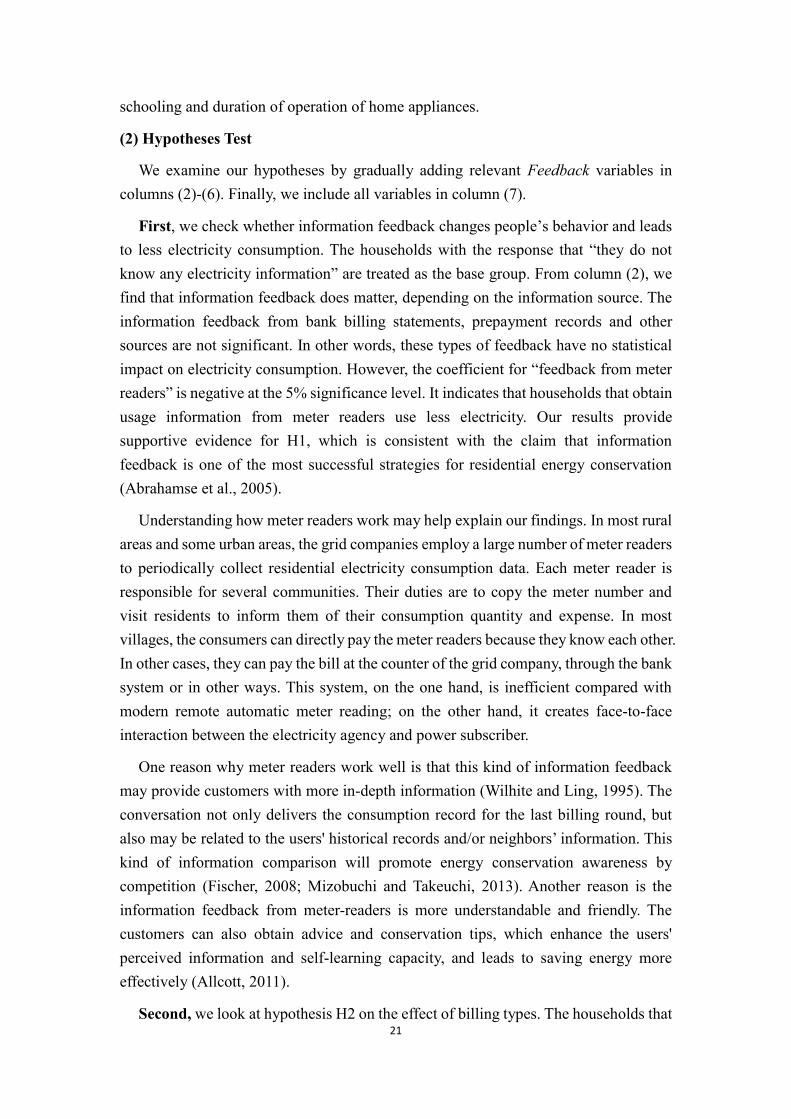
schooling and duration of operation of home appliances.
(2) Hypotheses Test
We examine our hypotheses by gradually adding relevant Feedback variables in
columns (2)-(6). Finally, we include all variables in column (7).
First, we check whether information feedback changes people’s behavior and leads
to less electricity consumption. The households with the response that “they do not
know any electricity information” are treated as the base group. From column (2), we
find that information feedback does matter, depending on the information source. The
information feedback from bank billing statements, prepayment records and other
sources are not significant. In other words, these types of feedback have no statistical
impact on electricity consumption. However, the coefficient for “feedback from meter
readers” is negative at the 5% significance level. It indicates that households that obtain
usage information from meter readers use less electricity. Our results provide
supportive evidence for H1, which is consistent with the claim that information
feedback is one of the most successful strategies for residential energy conservation
(Abrahamse et al., 2005).
Understanding how meter readers work may help explain our findings. In most rural
areas and some urban areas, the grid companies employ a large number of meter readers
to periodically collect residential electricity consumption data. Each meter reader is
responsible for several communities. Their duties are to copy the meter number and
visit residents to inform them of their consumption quantity and expense. In most
villages, the consumers can directly pay the meter readers because they know each other.
In other cases, they can pay the bill at the counter of the grid company, through the bank
system or in other ways. This system, on the one hand, is inefficient compared with
modern remote automatic meter reading; on the other hand, it creates face-to-face
interaction between the electricity agency and power subscriber.
One reason why meter readers work well is that this kind of information feedback
may provide customers with more in-depth information (Wilhite and Ling, 1995). The
conversation not only delivers the consumption record for the last billing round, but
also may be related to the users' historical records and/or neighbors’ information. This
kind of information comparison will promote energy conservation awareness by
competition (Fischer, 2008; Mizobuchi and Takeuchi, 2013). Another reason is the
information feedback from meter-readers is more understandable and friendly. The
customers can also obtain advice and conservation tips, which enhance the users'
perceived information and self-learning capacity, and leads to saving energy more
effectively (Allcott, 2011).
Second, we look at hypothesis H2 on the effect of billing types. The households that
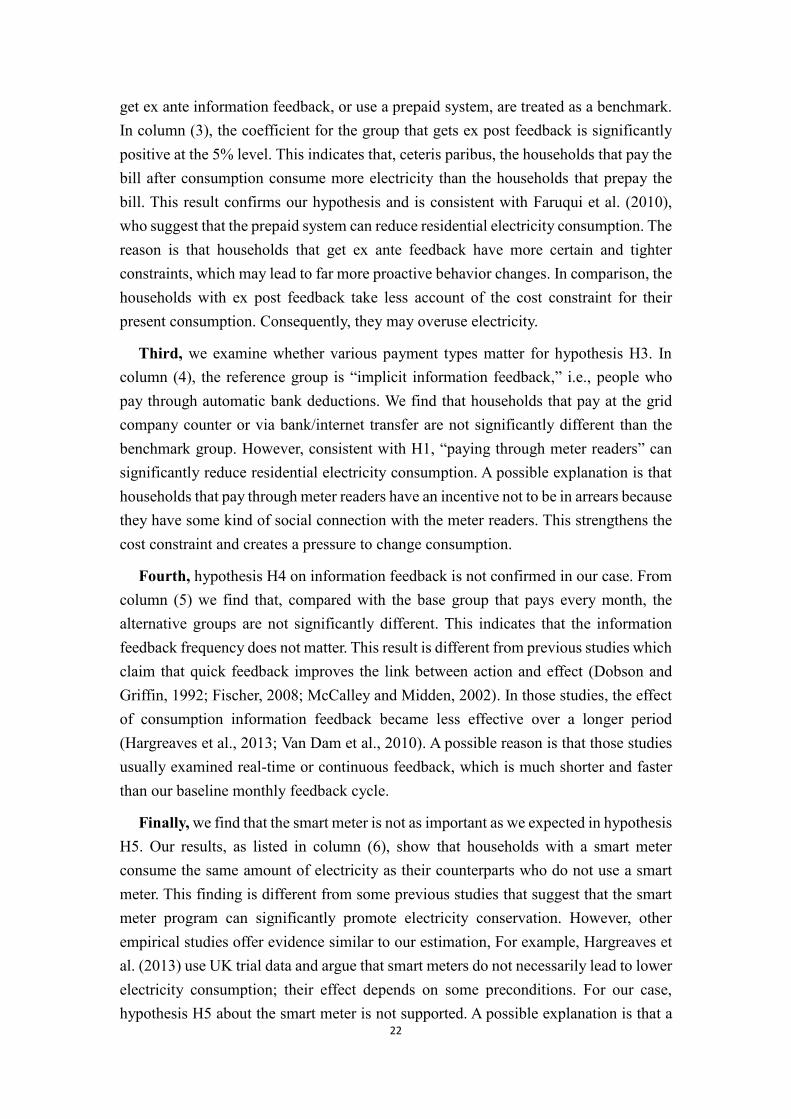
22
get ex ante information feedback, or use a prepaid system, are treated as a benchmark.
In column (3), the coefficient for the group that gets ex post feedback is significantly
positive at the 5% level. This indicates that, ceteris paribus, the households that pay the
bill after consumption consume more electricity than the households that prepay the
bill. This result confirms our hypothesis and is consistent with Faruqui et al. (2010),
who suggest that the prepaid system can reduce residential electricity consumption. The
reason is that households that get ex ante feedback have more certain and tighter
constraints, which may lead to far more proactive behavior changes. In comparison, the
households with ex post feedback take less account of the cost constraint for their
present consumption. Consequently, they may overuse electricity.
Third, we examine whether various payment types matter for hypothesis H3. In
column (4), the reference group is “implicit information feedback,” i.e., people who
pay through automatic bank deductions. We find that households that pay at the grid
company counter or via bank/internet transfer are not significantly different than the
benchmark group. However, consistent with H1, “paying through meter readers” can
significantly reduce residential electricity consumption. A possible explanation is that
households that pay through meter readers have an incentive not to be in arrears because
they have some kind of social connection with the meter readers. This strengthens the
cost constraint and creates a pressure to change consumption.
Fourth, hypothesis H4 on information feedback is not confirmed in our case. From
column (5) we find that, compared with the base group that pays every month, the
alternative groups are not significantly different. This indicates that the information
feedback frequency does not matter. This result is different from previous studies which
claim that quick feedback improves the link between action and effect (Dobson and
Griffin, 1992; Fischer, 2008; McCalley and Midden, 2002). In those studies, the effect
of consumption information feedback became less effective over a longer period
(Hargreaves et al., 2013; Van Dam et al., 2010). A possible reason is that those studies
usually examined real-time or continuous feedback, which is much shorter and faster
than our baseline monthly feedback cycle.
Finally, we find that the smart meter is not as important as we expected in hypothesis
H5. Our results, as listed in column (6), show that households with a smart meter
consume the same amount of electricity as their counterparts who do not use a smart
meter. This finding is different from some previous studies that suggest that the smart
meter program can significantly promote electricity conservation. However, other
empirical studies offer evidence similar to our estimation, For example, Hargreaves et
al. (2013) use UK trial data and argue that smart meters do not necessarily lead to lower
electricity consumption; their effect depends on some preconditions. For our case,
hypothesis H5 about the smart meter is not supported. A possible explanation is that a

23
majority of residents do not understand smart meters, so the meters cannot increase
their consciousness of electricity conservation or change their consumption behavior.
In column (7), we pool all information feedback variables together. The estimation
result is similar to the discussions above. We find positive evidence for H1, H2 and H3.
That is, information feedback through meter readers, ex ante information feedback (i.e.,
the prepaid system) and explicit information feedback through interactions with meter
readers are effective ways to promote electricity conservation in our surveyed
household data.
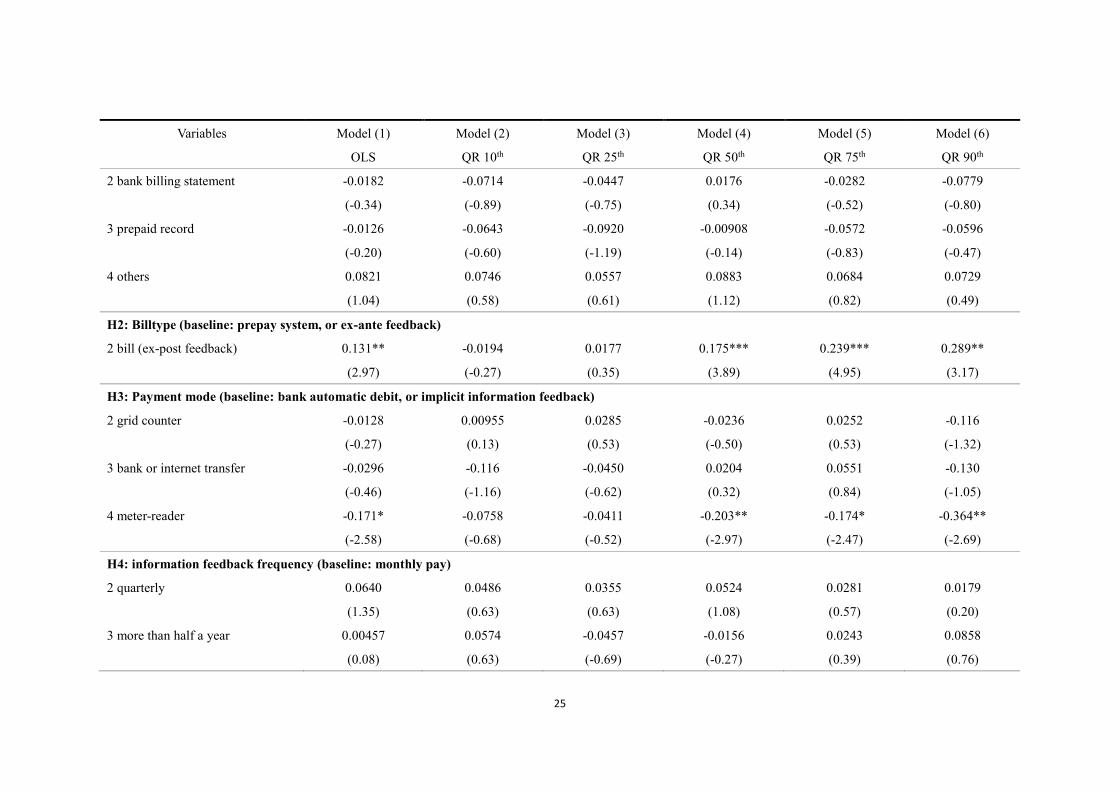
(3) Robustness Test
In this section, we offer a series of quantile regressions for robustness checks.
Compared with the regression curve for averages of distributions corresponding to
exogenous variables by OLS, the quantile regression allows us to compute several
different regression curves at various percentiles of the distribution. It offers detailed
information to show how some percentiles of electricity consumption may be more
affected than others by certain feedback information and other factors. The mixed
model (column 7 in Table 3) is duplicated with various quantile settings and the
regression results are listed in Table 4. The OLS result in column (1) is treated as the
reference group. Quantile regression results (QR hereafter) for 10th, 25th, 50th, 75th, and
90th are presented in column (2)-(6).
Similar to the result given by OLS, residential electricity demand has low price
elasticity in QR results, ranging from -0.827 to -0.452. In particular, the 10th quantile
of electricity consumption is not sensitive to price. The OLS regression seems to
overestimate price elasticity at the 10th quantile. The income elasticity is around 0.100
and significant across all columns. The OLS regression also underestimates income
elasticity at the 10th quantile. For other control variables, family size and lifestyle are
always significant factors in influencing electricity consumption for various quantile
groups. However, the householder’s education level, dwelling area, and location are not
significant for some percentiles.
Now let us look at information feedback. It seems that households reduce electricity
consumption if they get feedback from meter readers, except at the 10th percentile. The
majority of households tend to consume more if they receive ex post feedback, i.e., if
they pay the bill after consumption. Moreover, households that directly pay the
electricity fee to the meter reader tend to use less electricity. However, the OLS

24
Table 4 Robustness test
Variables Model (1) Model (2) Model (3) Model (4) Model (5) Model (6)
OLS QR 10th QR 25th QR 50th QR 75th QR 90th
lnPrice -0.659** -0.488 -0.827*** -0.607** -0.452* -0.737*
(-3.26) (-1.41) (-3.56) (-3.20) (-2.48) (-2.31)
lnIncome 0.0981*** 0.163*** 0.100*** 0.0956*** 0.111*** 0.0978*
(4.04) (4.33) (3.50) (3.98) (4.29) (2.17)
x_lnsize 0.188*** 0.165* 0.199*** 0.189*** 0.169*** 0.204*
(3.90) (2.43) (3.56) (3.92) (3.37) (2.22)
x_lneduyear 0.143** 0.145 0.154** 0.100 0.142** 0.0810
(2.80) (1.83) (2.58) (1.95) (2.83) (0.90)
x_lnarea 0.104* 0.0298 0.0515 0.0501 0.123** 0.114
(2.34) (0.42) (0.99) (1.15) (2.71) (1.37)
x_lnHDD 0.0428*** 0.0428** 0.0442*** 0.0406*** 0.0391*** 0.0760***
(3.95) (2.68) (3.69) (3.99) (3.65) (3.78)
x_lnCDD 0.0851*** 0.109*** 0.0905*** 0.0738*** 0.0752*** 0.0632**
(8.13) (6.67) (7.58) (7.08) (6.76) (3.03)
x_citytown 0.156** -0.0169 0.117 0.200*** 0.151* 0.350**
(2.63) (-0.19) (1.74) (3.50) (2.51) (3.07)
H1: Information source (baseline: no information feedback)
1 meter reader -0.152* -0.0888 -0.217** -0.161** -0.238*** -0.254*
(-2.46) (-0.93) (-3.12) (-2.62) (-3.65) (-2.16)
25
Variables Model (1) Model (2) Model (3) Model (4) Model (5) Model (6)
OLS QR 10th QR 25th QR 50th QR 75th QR 90th
2 bank billing statement -0.0182 -0.0714 -0.0447 0.0176 -0.0282 -0.0779
(-0.34) (-0.89) (-0.75) (0.34) (-0.52) (-0.80)
3 prepaid record -0.0126 -0.0643 -0.0920 -0.00908 -0.0572 -0.0596
(-0.20) (-0.60) (-1.19) (-0.14) (-0.83) (-0.47)
4 others 0.0821 0.0746 0.0557 0.0883 0.0684 0.0729
(1.04) (0.58) (0.61) (1.12) (0.82) (0.49)
H2: Billtype (baseline: prepay system, or ex-ante feedback)
2 bill (ex-post feedback) 0.131** -0.0194 0.0177 0.175*** 0.239*** 0.289**
(2.97) (-0.27) (0.35) (3.89) (4.95) (3.17)
H3: Payment mode (baseline: bank automatic debit, or implicit information feedback)
2 grid counter -0.0128 0.00955 0.0285 -0.0236 0.0252 -0.116
(-0.27) (0.13) (0.53) (-0.50) (0.53) (-1.32)
3 bank or internet transfer -0.0296 -0.116 -0.0450 0.0204 0.0551 -0.130
(-0.46) (-1.16) (-0.62) (0.32) (0.84) (-1.05)
4 meter-reader -0.171* -0.0758 -0.0411 -0.203** -0.174* -0.364**
(-2.58) (-0.68) (-0.52) (-2.97) (-2.47) (-2.69)
H4: information feedback frequency (baseline: monthly pay)
2 quarterly 0.0640 0.0486 0.0355 0.0524 0.0281 0.0179
(1.35) (0.63) (0.63) (1.08) (0.57) (0.20)
3 more than half a year 0.00457 0.0574 -0.0457 -0.0156 0.0243 0.0858
(0.08) (0.63) (-0.69) (-0.27) (0.39) (0.76)

26
Variables Model (1) Model (2) Model (3) Model (4) Model (5) Model (6)
OLS QR 10th QR 25th QR 50th QR 75th QR 90th
H5: smart meter (baseline: no smart meter)
2 smart -0.0581 -0.122* -0.0750 -0.0619 -0.0682 -0.0856
(-1.59) (-2.16) (-1.78) (-1.67) (-1.75) (-1.17)
Constant 5.278*** 5.084*** 5.102*** 5.652*** 5.659*** 5.903***
(18.64) (11.10) (15.49) (20.47) (19.79) (11.79)
Observations 1176 1176 1176 1176 1176 1176
R-squared 0.201
Pseudo R-squared 0.125 0.110 0.109 0.128 0.139
AIC 2142.3
BIC 2243.7
Log likelihood -1051.1
Note: t-values in parentheses; *** 0.1% significance level, ** 1% significance level, * 5% significance level.
27
regression overestimates these two effects at the 10th and 25th quantile groups.
Consistent with the OLS results, the frequency of feedback information has no impact
on electricity consumption for all columns. The effect of the smart meter is also not
significant, except at the 10th quantile.
7. Conclusion
In order to identify and examine the effect of information feedback on residential
electricity consumption, the present paper applies a log-log electricity demand function
on unique micro-level Chinese household survey data from 2012. We found that price
and income elasticity are significantly negative and positive, respectively. Urban
households consume more electricity than do rural residents. Moreover, residential
electricity demand is also positively associated with family size, dwelling area,
householders’ years of schooling, and heating and cooling days.
Beyond these control variables, we also empirically check five hypotheses regarding
information feedback. Our results reveal three points. First, information feedback
matters. The households that obtain electricity consumption information through
interacting with meter readers have lower electricity demand. Second, the ex ante
information feedback, i.e., households that use prepaid metering systems, are associated
with less electricity demand. Third, consumers who receive explicit information
feedback, i.e., households that directly pay meter readers, use less electricity. However,
we do not find supportive evidence for information feedback frequency or for the smart
meter program.
Our study suggests that residential electricity demand is partly determined by
household characteristics and consumers’ behavior and attitudes. Moreover,
information feedback, i.e., the interaction with meter readers and the prepaid system,
do affect residential electricity consumption. These findings do not suggest that the old-
fashioned meter reader system is more efficient in promoting residential energy
conservation. Instead, it reveals that residential energy demand management is
seriously absent in more modern systems for energy payment; either appropriate
measures targeting the household sector are lacking or the energy saving programs that
do exist, such as smart meters, are not effective. In other words, information from
sources other than meter readers does not deliver adequate information or does not
transform information into knowledge or action. Considering that a vast literature has
demonstrated the great potential in developed countries to save electricity through
information feedback, decision makers in China should be aware of the importance of
managing residential electricity demand and should put more attention into policy
design in the future.

28
Reference
Abrahamse W, Steg L, Vlek C, Rothengatter T. A review of intervention studies aimed at household
energy conservation. Journal of Environmental Psychology 2005;25; 273-291.
Alberini A, Filippini M. Response of residential electricity demand to price: The effect of measurement
error. Energy Economics 2011;33; 889-895.
Allcott H. Social norms and energy conservation. Journal of Public Economics 2011;95; 1082-1095.
Bushnell JB, Mansur ET. Consumption under Noisy Price Signals: A Study of Electricity Retail Rate
Deregulation in San Diego. The Journal of Industrial Economics 2005;53; 493-513.
Carlsson‐Kanyama A, Lindén AL, Eriksson B. Residential energy behaviour: does generation matter?
International Journal of Consumer Studies 2005;29; 239-253.
Carroll J, Lyons S, Denny E. Reducing household electricity demand through smart metering: The role
of improved information about energy saving. Energy Economics 2014;45; 234-243.
Darby S, 2006. The Effectiveness of Feedback on Energy Consumption, in: Environmental Change
Institute UoO (Ed.).
Dobson JK, Griffin JA. Conservation effect of immediate electricity cost feedback on residential
consumption behavior. Proceedings of the 7th ACEEE summer study on energy efficiency in buildings
1992;2.
Faruqui A, Sergici S, Sharif A. The impact of informational feedback on energy consumption—A survey
of the experimental evidence. Energy 2010;35; 1598-1608.
Feng D, Sovacool BK, Vu KM. The barriers to energy efficiency in China: Assessing household
electricity savings and consumer behavior in Liaoning Province. Energ Policy 2010;38; 1202-1209.
Filippini M, Pachauri S. Elasticities of electricity demand in urban Indian households. Energy Policy
2004;32; 429-436.
Fischer C. Feedback on household electricity consumption: a tool for saving energy? Energy Efficiency
2008;1; 79-104.
Gans W, Alberini A, Longo A. Smart meter devices and the effect of feedback on residential electricity
consumption: Evidence from a natural experiment in Northern Ireland. Energy Economics 2013;36; 729-
743.
Gilbert B, Graff Zivin J. Dynamic salience with intermittent billing: Evidence from smart electricity
meters. Journal of Economic Behavior & Organization 2014;107, Part A; 176-190.
Gleerup ML, Anders; Leth-Petersen, Søren; Togeby, Mikael. The Effect of Feedback by Text Message

29
(SMS) and Email on Household Electricity Consumption: Experimental Evidence Energy Journal
2010;31; 113-132.
Guo, J., Huang, Y., Wei, C. North–South debate on district heating: Evidence from a household survey.
Energ Policy 2015; 86; 295-302.
Hargreaves T, Nye M, Burgess J. Keeping energy visible? Exploring how householders interact with
feedback from smart energy monitors in the longer term. Energ Policy 2013;52; 126-134.
Hartman RS. Self-Selection Bias in the Evolution of Voluntary Energy Conservation Programs. The
Review of Economics and Statistics 1988;70; 448-458.
Henryson J, Håkansson T, Pyrko J. Energy efficiency in buildings through information – Swedish
perspective. Energ Policy 2000;28; 169-180.
Ito K, 2012. Do Consumers Respond to Marginal or Average Price? Evidence from Nonlinear Electricity
Pricing, NBER working paper No.18533.
Jessoe K, Rapson D. Knowledge Is (Less) Power: Experimental Evidence from Residential Energy Use.
American Economic Review 2014;104; 1417-1438.
Kempton W, Layne LL. The consumer's energy analysis environment. Energ Policy 1994;22; 857-866.
Matsukawa I. The Effects of Information on Residential Demand for Electricity The Energy Journal
2004;25; 1-17.
McCalley LT, Midden CJH. Energy conservation through product-integrated feedback: The roles of goal-
setting and social orientation. Journal of Economic Psychology 2002;23; 589-603.
Mizobuchi K, Takeuchi K. The influences of financial and non-financial factors on energy-saving
behaviour: A field experiment in Japan. Energ Policy 2013;63; 775-787.
Murata A, Kondou Y, Hailin M, Weisheng Z. Electricity demand in the Chinese urban household-sector.
Applied Energy 2008;85; 1113-1125.
Oltra C, Boso A, Espluga J, Prades A. A qualitative study of users' engagement with real-time feedback
from in-house energy consumption displays. Energ Policy 2013;61; 788-792.
Reiss PC, White MW. Household Electricity Demand, Revisited. The Review of Economic Studies
2005;72; 853-883.
Seligman C, Darley JM. Feedback as a means of decreasing residential energy consumption. Journal of
Applied Psychology 1977;62; 363-368.
Sexton RJ, Sexton T, Wann JJ-W, Kling C. The Conservation and Welfare Effects of Information in a
Time-of-Day Pricing Experiment. Land Economics 1989;65; 272-279.
Shin J-S. Perception of Price When Price Information Is Costly: Evidence from Residential Electricity
30
Demand. The Review of Economics and Statistics 1985;67; 591-598.
Shiu A, Lam P-L. Electricity consumption and economic growth in China. Energ Policy 2004;32; 47-54.
Terza JV. Determinants of household electricity demand: A two-stage probit approach. Southern
Economic Journal 1986; 1131-1139.
Ueno T, Sano F, Saeki O, Tsuji K. Effectiveness of an energy-consumption information system on energy
savings in residential houses based on monitored data. Applied Energy 2006;83; 166-183.
Van Dam S, Bakker C, Van Hal J. Home energy monitors: impact over the medium-term. Building
Research & Information 2010;38; 458-469.
Waldman DM, Ozog MT. Natural and Incentive-Induced Conservation in Voluntary Energy Management
Programs. Southern Economic Journal 1996;62; 1054-1071.
Wilhite H, Ling R. Measured energy savings from a more informative energy bill. Energy and Buildings
1995;22; 145-155.
Winett RA, Kagel JH, Battalio RC, Winkler RC. Effects of monetary rebates, feedback, and information
on residential electricity conservation. Journal of Applied Psychology 1978;63; 73-80.
Winkler RC, Winett RA. Behavioral interventions in resource conservation: A systems approach based
on behavioral economics. American Psychologist 1982;37; 421-435.
Wood G, Newborough M. Dynamic energy-consumption indicators for domestic appliances:
environment, behaviour and design. Energy and Buildings 2003;35; 821-841.
Wyatt P. A dwelling-level investigation into the physical and socio-economic drivers of domestic energy
consumption in England. Energy Policy 2013;60; 540-549.
Yoo S-H, Lee JS, Kwak S-J. Estimation of residential electricity demand function in Seoul by correction
for sample selection bias. Energ Policy 2007;35; 5702-5707.
Yuan J, Zhao C, Yu S, Hu Z. Electricity consumption and economic growth in China: Cointegration and
co-feature analysis. Energy Economics 2007;29; 1179-1191.
Zheng X, Wei C, Qin P, Guo J, Yu Y, Song F, Chen Z. Characteristics of Residential Energy Consumption
in China: Findings from a Household Survey. Energy Policy 2014;75;126-135.
Zhou S, Teng F. Estimation of urban residential electricity demand in China using household survey data.
Energ Policy 2013;61; 394-402.