
Does Governance Travel Around the World? Evidence … · Does Governance Travel Around the World?...
58
Does Governance Travel Around the World? Evidence from Institutional Investors ∗ Reena Aggarwal, Georgetown University [email protected] Isil Erel, Ohio State University [email protected] Miguel Ferreira, Universidade Nova de Lisboa [email protected] Pedro Matos, University of Southern California [email protected] October 2009 Abstract We examine whether institutional investors affect corporate governance by analyzing institutional holdings in companies from 23 countries during the period 2003-2008. We find that firm-level governance is positively associated with international institutional investment. Changes in institutional ownership over time positively affect subsequent changes in firm-level governance, but the opposite is not true. Foreign institutions and independent institutions drive governance improvements outside of the U.S. The origin of the institution matters, as institutions in countries with strong shareholder protection are more effective in promoting good governance than are institutions from countries with weak shareholder protection. The shareholder protection of the country where the firm is located also matters, with foreign institutions playing a crucial role in countries with weak shareholder protection. Institutional investors affect not only which corporate governance mechanisms are in place, but also outcomes. Firms with higher institutional ownership are more likely to terminate poorly performing CEOs and exhibit improvements in valuation over time. Our results suggest that institutional investors promote good corporate governance practices around the world. JEL: G32, G34, G38 Keywords: Institutional Investors, Corporate Governance, Shareholder Activism ∗ Corresponding author: Reena Aggarwal, McDonough School of Business, Georgetown University, Washington, D.C. 20057. Tel. (202) 687-3784, Fax (202) 687-4031, [email protected]. We thank Utpal Bhattacharya, Mariassunta Giannetti, Laura Starks, Michael Weisbach, and seminar participants at Georgetown University, Indian School of Business, Indiana University and Stockholm School of Economics for helpful comments. This research is supported by a research grant from the Fundação para a Ciência e Tecnologia (FCT/POCI 2010).
Transcript of Does Governance Travel Around the World? Evidence … · Does Governance Travel Around the World?...
Does Governance Travel Around the World? Evidence from Institutional Investors∗
Reena Aggarwal, Georgetown University
Isil Erel, Ohio State University [email protected]
Miguel Ferreira, Universidade Nova de Lisboa
Pedro Matos, University of Southern California [email protected]
October 2009
Abstract We examine whether institutional investors affect corporate governance by analyzing institutional holdings in companies from 23 countries during the period 2003-2008. We find that firm-level governance is positively associated with international institutional investment. Changes in institutional ownership over time positively affect subsequent changes in firm-level governance, but the opposite is not true. Foreign institutions and independent institutions drive governance improvements outside of the U.S. The origin of the institution matters, as institutions in countries with strong shareholder protection are more effective in promoting good governance than are institutions from countries with weak shareholder protection. The shareholder protection of the country where the firm is located also matters, with foreign institutions playing a crucial role in countries with weak shareholder protection. Institutional investors affect not only which corporate governance mechanisms are in place, but also outcomes. Firms with higher institutional ownership are more likely to terminate poorly performing CEOs and exhibit improvements in valuation over time. Our results suggest that institutional investors promote good corporate governance practices around the world.
JEL: G32, G34, G38 Keywords: Institutional Investors, Corporate Governance, Shareholder Activism
∗ Corresponding author: Reena Aggarwal, McDonough School of Business, Georgetown University, Washington, D.C. 20057. Tel. (202) 687-3784, Fax (202) 687-4031, [email protected]. We thank Utpal Bhattacharya, Mariassunta Giannetti, Laura Starks, Michael Weisbach, and seminar participants at Georgetown University, Indian School of Business, Indiana University and Stockholm School of Economics for helpful comments. This research is supported by a research grant from the Fundação para a Ciência e Tecnologia (FCT/POCI 2010).

1
1. Introduction
There has been a dramatic reduction in barriers to international investment. Financial
globalization and liberalization have contributed to a reduction in the firms’ cost of capital
(Bekaert and Harvey (2000)). Also, financial globalization has led many firms, particularly those
that need access to global capital markets, to adopt better corporate governance practices.
However, there is also evidence on the limits of financial globalization, since corporate insiders
and controlling shareholders are likely to pursue their own interests and ownership structures
(Stulz (2005)).
In this paper, we study the role of institutional investment as a channel for promoting better
governance and convergence in governance practices across countries. Institutional holdings
have been increasing globally, but we know little about their influence on corporations
worldwide. Gillan and Starks (2003) highlight the special role that institutional investors, in
particular foreign institutional investors, play in prompting change in corporate governance
practices in other countries. Ferreira and Matos (2008) find that foreign institutional ownership is
positively associated with firm value and performance outside of the U.S., but there is no direct
evidence that foreign investors are able to change corporate governance mechanisms and
outcomes in other countries.
We examine whether international institutional investors export good governance to other
countries. Thus, we investigate the role of both domestic and foreign institutional investors. We
also analyze whether the legal system of the institution's home country matters. We ask if
institutional money managers from countries with stronger investor protection export good
governance practices through their overseas investment decisions. We also examine the effect of
a firm’s origin country’s legal regime. Firms located in countries with weaker investor protection

2
are likely to benefit more from institutional investment, particularly from investments by foreign
institutions that are located in countries with stronger investor protection. For example, a large
proportion of U.S. corporate boards had voluntarily elected a majority of “independent” directors
even before the Sarbanes-Oxley Act of 2003 made this governance attribute a requirement. U.S.
institutional investors might influence firms overseas to move in this direction, either directly, by
influencing the management and using voting rights (“voice”), or indirectly, by their decisions to
buy or threaten to sell their shares (“voting with their feet”).
To illustrate how the origin country of the institutional money manager can matter, consider
a company based in a civil-law country, say Germany. This firm is owned by two institutional
investors, one from France and the other from the U.K. France scores lower than the U.K.
according to most indicators that measure investor protection and the quality of institutions, so
the French institutional investor might be less willing to change the governance of the German
firm than would the U.K.-based investor.
Anecdotal evidence supports the notion that foreign shareholders, in particular those based
in U.K., lead the changes in governance of German firms. An example is that of a U.K.-based
hedge fund, The Children Investment Fund (TCIF). In 2005 the TCIF forced the management of
Deutsche Börse to abandon a takeover bid for the London Stock Exchange, which led to the
resignation of both chief executives and the chair of the supervisory board (Economist (2008)).
TCIF also had a leading role in the 2007 takeover of ABN AMRO, a Dutch bank. The takeover
was initiated by an open letter to ABN AMRO that proposed five resolutions aimed at forcing
the bank to spin off its different lines of business, which would then lead to bids by foreign
banks (Economist (2007)). Furthermore, activist funds with even small stakes can affect
governance. When Atticus, an activist hedge fund with just 1% of Barclays Bank's shares, stated
3
publicly that Barclays should abandon its bid for ABN AMRO, there was a significant stock
price reaction (Financial Times (2007)). A study by Becht, Franks, and Grant (2008) provides
related evidence on (foreign) hedge-fund investor activism in continental Europe.
Foreign and independent institutions are often credited with taking a more active stance,
while other institutions that have business relations with local corporations may feel compelled
to be loyal to management. For example, Business Week (2006) reported that Fidelity
Investments was more aggressive on governance issues in Europe, but relatively acquiescent in
the U.S. where it manages several corporate pension accounts (Davis and Kim (2006)). Further,
empirical studies by Chen, Harford, and Li (2007) and Ferreira and Matos (2008) suggest that
independent investment advisers and mutual funds are active monitors.
We examine the relation between stock-level institutional holdings and corporate
governance in 23 countries during the period 2003-2008. Although we focus on non-U.S.
companies, we also repeat our analysis for U.S. companies. Our sample comprises more than
2,000 non-U.S. firms (5,000 U.S. firms). We use a composite index of 41 governance attributes,
which we obtain from RiskMetrics (formerly Institutional Shareholder Services). In their study,
Alexander, Chen, Seppi, and Spatt (2008) find that RiskMetrics is the leading proxy advisory
firm in the world, and that its recommendations wield considerable influence in determining
corporate voting outcomes. Following recent literature (e.g., Gompers, Ishii, and Metrick (2003)
and Aggarwal, Erel, Stulz, and Williamson (2009)), we create a governance index. This index
provides a firm-level governance measure that is comparable across countries. The 41 firm-level
governance attributes in the index are those most studied in the related literature, and
incorporates measures of board structure, anti-takeover provisions, auditor selection, and
compensation and ownership structure.

4
We find a positive relation between firm-level governance and institutional ownership.
Moreover, we find that changes in institutional ownership over time drive changes in firm-level
governance, but that the opposite does not hold true. Thus, the direction of the effect is from
institutional ownership to subsequent changes in governance, and not from governance to
institutional ownership. We also find that foreign investors play a predominant role in helping to
improve firm-level governance of non-U.S. corporations over time. U.S. institutions, and more
generally those institutions based in countries with strong protection for minority shareholder
rights, are the main drivers of improvement in governance outside of the U.S., while institutions
from countries with weak shareholder rights are not. Our analysis shows that independent
institutions that are unlikely to have business ties with the invested firm are the main drivers of
governance improvements, rather than non-independent (grey) institutions.
The extent of shareholder protection in the country where the firm is located also matters.
We find that domestic institutions play a crucial role in improving the governance of firms
located in countries with strong shareholder protection but in countries with weak shareholder
protection, the main role in improving governance is played by foreign institutions, particularly
those that come from countries with strong shareholder protection. Further, we find that domestic
institutions play a predominant role in U.S. firms. Our analysis shows that the legal environment
of both the institution and the firm, shape the effectiveness of monitoring by institutional
shareholders. These results are robust to using different proxies for country-level shareholder
protection. Our findings indicate that international portfolio investment contributes to the
convergence of good corporate governance across countries.
We also examine the impact of institutional investors on some specific governance
provisions that have received more attention in the literature and among policy makers. We focus
5
on board structure, the choice of firm auditors, and the existence of multiple share classes. We
find that foreign, but not domestic, institutional ownership enhances the presence of independent
directors, and makes it less likely that a firm has a large board and adopts a staggered board
provision. This evidence is important, because governance indexes have been criticized for not
capturing what really matters in corporate governance. Bebchuk, Cohen, and Ferrell (2009), and
Daines, Gow, and Larcker (2008) suggest adopting alternative metrics and identifying the most
important governance attributes. Bebchuk and Hamdani (2009) highlight the importance of
accounting for ownership structure, which we do in this study by examining institutional
ownership and controlling for closely held ownership. In short, we can disagree with the
governance attributes included and the index calculation. However, if our index were to convey
no information, we would simply find that the index is not related to institutional ownership.
We ask if institutional ownership has real effects on corporate decision making, rather than
just on adopted governance mechanisms. We specifically examine whether the presence of
institutional investors improves institutional investors' ability to identify and terminate poorly
performing CEOs. Institutional investors can force CEO turnover through activism, for example,
by voicing their dissatisfaction over bad firm performance, and by influencing the decision by
the board of directors to oust the CEO (Gillan and Starks (2003)). Or institutions can have an
indirect influence by trading their shares. For instance, institutional investors may act as a group
by “voting with their feet” if the CEO is not terminated when firm performance is poor (Parrino,
Sias, and Starks (2003)). We find that CEO turnover is more sensitive to low abnormal stock
returns when institutional ownership is high.
We also test whether changes in institutional ownership lead to changes in company
valuations as measured by Tobin’s Q ratios. We find that changes in institutional ownership are

6
positively associated with future changes in firm value. However, the opposite is not true. These
findings on corporate outcomes also contribute to relieving concerns with the use of a
governance index.
We perform a variety of robustness checks on our primary findings. In particular we address
omitted-variable and endogeneity concerns. We use firm fixed effects to address the concern that
institutional ownership might be related to some unobserved firm characteristics that explain
governance. We use an instrumental variables method to address the concern that institutions
might be attracted to firms that have higher governance (Giannetti and Simonov (2006)). For
example, investors domiciled in countries with strong legal environments could systematically
avoid weakly governed firms in countries with weak legal environments (Kim, Sung, and Wei
(2008), Leuz, Lins, and Warnock (2008)). Our results are robust with a casual relation from
institutional ownership to corporate governance.
Our paper connects two strands of the literature. The first focuses on the value relevance of
firm-level corporate governance. Becht, Bolton, and Roell (2003) and Dennis and McConnell
(2003) provide reviews of these studies. For the U.S., authors show that firm value is related to
indexes of firm-level governance (e.g., Gompers, Ishii, and Metrick (2003), Bebchuk and Cohen
(2005), Bebchuk, Cohen, and Ferrell (2009)). Outside of the U.S., there is also evidence of a
positive relation between governance and firm value, and that minority shareholders benefit from
better governance (e.g., Doidge, Karolyi and Stulz (2004), Durnev and Kim (2005), Dahya,
Dimitrov, and McConnell (2008), Aggarwal et al. (2009)).
The second strand of the literature focuses on the governance role played by institutional
investors. Gillan and Starks (2007) survey the evolution of institutional shareholder activism in
the U.S. from the value effect of shareholder proposals to the influence on corporate events.

7
Studies find that institutional investors affect CEO turnover (Parrino, Sias and Starks (2003),
antitakeover amendments (Brickley, Lease, and Smith (1988), executive compensation (Hartzell
and Starks (2003), and M&As (Gaspar, Massa, and Matos (2005) and Chen, Harford and Li
(2007). Bushee, Carter, and Gerakos (2008) find evidence that ownership by government-
sensitive institutions in the U.S. is associated with future improvements in shareholder rights.
Recent papers study activism by individual funds, such as pension funds or hedge funds (Brav,
Jiang, Partnoy, and Thomas (2008) and Klein and Zur (2008)).
Outside of the U.S., there is little evidence on the governance role played by institutional
investors. In a survey of institutional investors, McCahery, Sautner, and Starks (2008) find that
corporate governance is of importance to institutional investors, and that many institutions are
willing to engage in shareholder activism. There are several studies that examine the revealed
preference of institutional investors (but not their governance role) in a single destination country
(Japan in Kang and Stulz (1997), and Sweden in Dahlquist and Robertsson (2001) and Giannetti
and Simonov (2006)); from a single origin country (the U.S. in Aggarwal, Klapper and Wysocki
(2005) and Leuz, Lins and Warnock (2008)); and using country-level institutional holdings or
blockholdings (Chan, Covrig, and Ng (2005), Li, Moshirian, Pham, and Zein (2006)). We
complement evidence that cross-border M&A transactions frequently target companies in
countries with low shareholder protection (Rossi and Volpin (2004), Bris and Cabolis (2008)),
and that international investors facilitate cross-border M&A (Ferreira, Massa, and Matos (2009).
In summary, we find that institutional ownership, in particular by foreign institutions, affects the
corporate governance mechanism and outcomes and promote good governance worldwide.
The paper proceeds as follows. In Section 2 we describe the firm-level corporate governance
attributes, the institutional holdings data, and other firm-specific variables. In Section 3, we

8
examine the relation between institutional investment and firm-level corporate governance. In
Section 4, we investigate whether institutional ownership affects corporate governance
outcomes. In Section 5, we conduct robustness checks. Section 6 concludes.
2. Data
In this section, we describe the sample of firms and variables used in this study. We obtain firm-
level institutional ownership and corporate governance for 23 countries for the period 2003-
2008. In our main tests we focus on non-U.S. firms. Table 1 shows that the total number of non-
U.S. firms with both governance and institutional ownership data varies from a minimum of
1,556 in 2004 to a maximum of 2,218 in 2006. In 2008, the non-U.S. firms in our sample account
for 71% of the world market capitalization, excluding the U.S. In the U.S., the number of firms
with both governance and institutional ownership data varies from a minimum of 4,624 in 2008
to a maximum of 5,202 in 2005, thus accounting for approximately 96% of the U.S. market
capitalization in 2008.
2.1. Firm-Level Governance
The data source for firm-level corporate governance attributes is RiskMetrics and our sample of
governance attributes covers the five-year period from 2004 to 2008. The information for non-
U.S. companies is available starting in 2003 but our sample period starts in 2004 because
coverage is better. Also, beginning in 2004, there are fewer missing observations. RiskMetrics
covers U.S. firms if they are included in any of the following indexes: the Standard and Poor’s
500, the Standard and Poor’s Small Cap 600, and the Russell 3000. RiskMetrics also covers non-
U.S. firms that are included in the major stock indexes, such as the MSCI EAFE, which covers

9
1,000 stocks in 21 developed countries outside North America; the FTSE All Share Index, which
consists of the FTSE 100, FTSE 250, and FTSE SmallCap indexes; the FTSE All World
Developed index, which includes the largest firms in the developed markets; and the S&P/TSX
index of the Toronto Stock Exchange. RiskMetrics compiles governance attributes for each firm
by examining the firm’s regulatory filings, annual reports, and the companies’ websites. For each
attribute, RiskMetrics has set a minimally acceptable level of governance for evaluating whether
a firm meets the minimum level. Aggarwal et al. (2009) describe the data in more detail.
We examine 41 firm-level governance attributes that are common to both U.S. and non-U.S.
firms. These attributes cover four broad sub-categories: (1) Board (24 attributes), (2) Audit (three
attributes), (3) Anti-takeover provisions (six attributes), and (4) Compensation and Ownership
(eight attributes). Board attributes capture the aspects of the board of directors such as board
independence, composition of committees, size, transparency, and how the board conducts its
work. Audit includes questions on the independence of the audit committee and the role of
auditors. Anti-takeover Provisions are drawn from the firm’s charter and by-laws and refer to
dual-class structure, role of shareholders, poison pills, and blank check preferred. Compensation
and Ownership deals with executive and director compensation on issues related to options,
stock ownership and loans, and how compensation is set and monitored.
In Appendix A we provide a list of the 41 governance attributes we use in our study. We use
the 41 individual attributes to create a composite governance index, GOV41, for each company.
GOV41 assigns a value of one to each of the 41 governance attributes if the company meets
minimally acceptable guidelines on that attribute, and zero otherwise. It is common in the
literature to use additive indexes (see, for instance, Gompers, Ishii, and Metrick (2003);
Bebchuk, Cohen, and Ferrell (2009)). We choose to express our index as a percentage. If a firm

10
satisfies all 41 governance attributes, then its GOV41 index will be equal to 100%.1 Figure 1 and
Table 2 show that on average, the countries with the highest GOV41 in 2008 are Canada (72.8%),
the U.K. (59.3%), and Switzerland (56.6%). A GOV41 index of 72.8% for Canada implies that on
average, Canadian firms meet the minimum acceptable criteria for 72.8% of the 41 governance
attributes studied (i.e., about 30 of the 41 attributes). The countries with the lowest GOV41 are
Greece (35.9%), Portugal (36.2%), and Belgium (37.8%). The governance level in the U.S. is
high at 62.2%. However, we note that the U.S. sample is more extensive than the international
sample because it includes both large and small firms. The last column of Table 2 shows the
average of the yearly percentage change in GOV41 for each country. For every country except
New Zealand, on average, the governance index has increased. Thus, over our sample period we
see that corporate governance practices improve around the world. We observe the largest
positive changes for Sweden (5.1%), The Netherlands (4.5%), and the U.K. (3.5%). In the U.S.,
some firm-level governance attributes are mandated after the Sarbanes-Oxley Act of 2003, and
so we also observe an improvement in GOV41.
2.2. Institutional Ownership
We use institutional ownership for the period 2003 to 2007 because we study the effect of
institutional ownership (one-year lagged) on the future level of corporate governance from 2004
to 2008. Institutional holdings data are from the FactSet/LionShares database. The institutions
covered in the database are professional money managers such as mutual funds, pension funds,
1 There are only a few missing observations for some attributes in the data for the time period in our sample. We use the Boardex database to fill in the missing observations for board independence, board size, and chairman-CEO duality. For the observations that are still missing, we use the same value as the previous year. BoardEx is a leading database on board composition and compensation of publicly listed firms, and includes detailed biographic information on individual executives and board members of approximately 10,000 firms in nearly 50 countries (see Fernandes, Ferreira, Murphy, and Matos (2008) for details).
11
bank trusts, and insurance companies. FactSet/LionShares collects ownership data directly from
public sources such as national regulatory agencies, stock exchanges, industry directories, and
company proxies, as described in Ferreira and Matos (2008). In calculating institutional
ownership, we include ordinary shares, preferred shares, American Depositary Receipts (ADRs),
Global Depositary Receipts (GDRs), and dual listings.
We define IO_TOTAL as the sum of the holdings of all institutions in a firm’s stock divided
by the stock’s total market capitalization at the end of each calendar year. Following Gompers
and Metrick (2001), we set institutional ownership variables to zero if a stock is not held by any
institution in FactSet/LionShares.2 We separate total institutional ownership in several ways. We
first consider the nationality of the institution. Domestic Institutional Ownership (IO_DOM) is
the sum of the holdings of all institutions domiciled in the same country in which the stock is
listed as a percentage of the firm’s total market capitalization. Foreign institutional ownership
(IO_FOR) is the sum of the holdings of all institutions domiciled in a country different from the
origin country of the stock, expressed as a percentage of the firm’s market capitalization. We
split foreign institutional ownership into ownership by U.S.-based institutions (IO_FOR_US) and
non-U.S. institutions (IO_FOR_NUS). And we partition ownership according to the legal origin
of the institution’s home country: Common Institutional Ownership (IO_COMMON) or Civil
Institutional Ownership (IO_CIVIL).
Figure 2 and Table 3 show that the countries other than the U.S. that have the highest
average total institutional ownership in 2007 are Canada (59.1%), Sweden (36.7%), and the U.K.
(37.9%). We find the lowest average institutional ownership in New Zealand (9.0%), Portugal
(10.3%), and Hong Kong (12.7%). In 2007, the average total institutional ownership of non-US
2 When we repeat the empirical analysis using only firms with positive holdings, our main results are not affected.
12
firms in our sample is 27% in 2007.3 On average, U.S. firms have the highest total institutional
ownership, 57.8% as of 2007. The average institutional ownership increases in all 23 countries
during 2003-2007. The average yearly change in total institutional ownership is 2.4 percentage
points. We observe the largest average yearly increase in institutional ownership in the U.K. (5.7
percentage points), The Netherlands (4.6 percentage points), and Canada (3.9 percentage points).
The smallest increases occur in Portugal (0.7 percentage points), Italy (1.1 percentage points),
Norway (1.1 percentage points), and Sweden (1.1 percentage points).
Table 3 shows that domestic institutions account for more than half of institutional
ownership in several countries, including the U.S. (87%), the U.K. (70%), Canada (60%),
Sweden (60%), and Denmark (53%). But in most countries, the holdings of foreign-based
investors exceed those of domestic institutions. We find the highest foreign ownership in small
countries such as, New Zealand (92%) and Ireland (89%). The correlation between foreign and
domestic institutional ownership is 0.42. In ten of the 22 non-U.S. countries, institutions based
in common-law countries, account for more than half of total institutional ownership. This
ownership pattern is true both for firms located in common-law countries such as the U.K. or
Canada, but also for firms located in civil-law countries, such as The Netherlands, which seem to
attract investment from institutions whose management companies are based in common-law
countries.
2.3. Firm Characteristics
We obtain firm characteristics from Datastream/Worldscope. We use several firm-specific
control variables in our regressions: log of total assets in U.S. dollars (SIZE), two-year annual
3 Institutional ownership is slightly higher for our sample of firms compared to other studies (e.g., Ferreira and Matos (2008)) because our sample covers larger firms for which governance data is available.

13
sales growth in U.S. dollars (SGROWTH), debt to assets (LEV), cash holdings to assets (CASH),
capital expenditure to assets (CAPEX), equity market to book (MB), return on assets (ROA),
R&D expenditures to assets (R&D), property, plant, and equipment to assets (PPE), foreign sales
to total sales (FXSALE), number of analysts following a firm (ANALYST), percentage of shares
closely held (CLOSE), and whether a firm is cross-listed on a U.S. exchange (ADR). We
winsorize the variables, SGROWTH, LEV, CAPEX, MB, ROA, R&D, and FXSALE, at the upper
and lower 1% levels. We also use two other firm characteristics as instruments for institutional
ownership: Morgan Stanley Capital International World index membership (MSCI) and dividend
dummy (DIV). In Appendix B we provide a detailed description of the variables we use in our
study.
3. Institutional Ownership and Governance
To examine whether institutional investors push for better governance, we use panel regressions
with firm-level governance as the dependent variable. We further investigate the relation by
looking into the sample of firms from civil-law versus common-law countries. We next check
whether the causality runs from institutional ownership to governance using regressions on
changes. In a final subsection, we use individual governance attributes.
3.1. Panel Regression Tests
In these tests we use the firm-level governance index, GOV41, as the dependent variable. The
explanatory variable of interest is institutional ownership. All independent variables are lagged
by one year so that we can examine the relation between the explanatory variables and future
governance. Therefore, if GOV41 is for period t, each of the independent variables is for period t-

14
1. Consistent with the literature, we include several firm-level control variables that are related
to governance.4 For example, we include SIZE because other studies show that due to economies
of scale, larger firms have better governance. Industry and country characteristics also affect the
investment in firm-level governance (see, e.g., Doidge, Karolyi, and Stulz (2007)). To account
for industry and country sources of heterogeneity, we include industry and country fixed effects
in each regression. We also include year fixed effects to account for the positive time trend in
governance over the sample period.5 We correct standard errors for clustering of observations at
the country level.
Table 4 reports the results of the panel regression of the governance index. The sample
contains only non-U.S. companies. The regression estimates in column (1) of Table 4 show a
positive and significant association between total institutional ownership and governance. The
table also shows that firms with ADRs, firms with better performance (ROA), growth firms
(MB), firms with higher leverage (LEV), and firms followed by more analysts have better
governance. The percentage of closely held shares is negatively related to governance. The
explanatory power of the models is high, with an R-square of 0.73.
Next, we analyze whether the positive relation between governance and institutional
ownership is driven by the nationality of the institutional investor. In Table 4, column (2) uses
institutional ownership by domestic investors (IO_DOM); column (3) uses foreign ownership
(IO_FOR); and column (4) uses both domestic and foreign ownership in the same regression.
The relation between domestic institutional ownership and governance is positive and
significant, as is the relation between foreign institutional ownership and governance. However,
4 We obtain consistent results if we run the governance regressions without including any control variables. The results of these tests are available from the authors on request. 5 In unreported results, we find that our results are not affected if we also add the interactions of the country and year dummies to capture country-specific time trends.

15
when we use both domestic and foreign institutional ownership in the same regression, we find
that foreign institutional ownership is positive and significant but domestic institutional
ownership is no longer significant.
Our results show a strong positive relation between foreign institutional ownership and
governance. Outside of the U.S., foreign institutions seem to be particularly important in
improving governance. This result complements other studies' findings of an asymmetric effect
of domestic compared to foreign-based institutions (see, e.g., Ferreira and Matos (2008)). The
effect of foreign institutional ownership is economically significant. A ten percentage point
increase in foreign institutional ownership is associated with a subsequent increase in the
governance index of 0.35%, which represents nearly 20% of the average yearly governance
change.
As a more general test, we condition institutional ownership on the legal regime of the
country of origin of the institutional money manager. LaPorta, Lopez-de-Silanes, Shleifer, and
Vishny (1998) argue that investor protection and corporate governance is stronger in common-
law countries as opposed to civil-law countries. We classify institutional investors based on
whether they are domiciled in common- (IO_COMMON) or civil- (IO_CIVIL) law countries.
Columns (5)-(7) use ownership by institutions domiciled in common-law and civil-law countries.
The coefficients for ownership by institutions from both common- and civil-law countries are
positive and significant. However, when we use both IO_COMMON and IO_CIVIL in the same
regression, column (7) shows that only the coefficient on IO_COMMON is positive and
significant. We conclude that there is a positive association between firm-level governance and
“governance at home” of investors holding a firm’s stock. This finding indicates that institutions
“export” good governance across countries. Foreign institutions, in particular those that come

16
from countries with strong shareholder protection, seem to facilitate the convergence of
corporate governance regimes around the world.
3.2. The Role of the Country’s Legal Regime and Shareholder Rights
Shareholder rights in the country where the firm is located can also influence the role that
institutional investors can play. We expect to find that the role of institutions, especially foreign
ones, in prompting governance changes is more important in countries with weak shareholder
protection. Therefore, to distinguish between firms located in countries with strong or weak
shareholder protection, we estimate our panel regressions with governance as the dependent
variable for subsamples based on shareholder protection. We use three proxies for shareholder
protection: the legal regime of the country, anti-self dealing index from Djankov, LaPorta,
Lopez-de-Silanes, and Shleifer (2008), and anti-directors index from La Porta et al. (1998) (as
revised in Djankov et al. (2008)). Panel A of Table 5 shows that there are 4,133 observations for
civil-law countries. Panel B of Table 5 shows 3,443 observations for common-law countries,
excluding the U.S.
In Table 5, we find that the coefficient for total institutional ownership is positive for
governance in firms based in both civil- and common-law countries (column (1) of Panel A and
column (5) of Panel B, respectively). The most interesting finding is that domestic institutional
ownership is the main driver of better governance in common-law countries (column (8) Panel
B), but in civil-law countries (column (4), Panel A) the main driver is foreign institutional
ownership. In fact, the foreign institutional ownership coefficient is positive and significant in
civil-law countries, while the domestic institutional ownership coefficient is negative.
17
There are other differences between firms based in civil-law or common-law countries. For
example, in civil-law countries, smaller firms have better governance, but in common-law
countries, the opposite is true. In common-law countries, there is a statistically significant
negative relation between closely held shares and governance, but for civil-law countries this
relation is not significant.
We repeat the analysis above, but this time we use two other proxies for shareholder rights.
Instead of splitting the sample based on legal regime, we now split the sample based on the
median anti-director index or median anti-self dealing index. We do not report these results in a
table, since the results are similar to those based on the civil- and common-law classification.
The coefficients are positive and significant for domestic and foreign institutional ownership.
However, when we use both domestic and foreign ownership in the same regression, for
countries with weak shareholder protection the coefficient of domestic institutional ownership is
negative and significant, while the coefficient for foreign institutional ownership is positive and
significant. For countries with strong shareholder protection, the coefficient of domestic
institutional ownership is positive and significant at the 5% level, while the coefficient for
foreign institutional ownership is insignificant at the 5% level.
Our findings provide evidence that domestic institutions are associated with better corporate
governance only if there is a strong legal environment in place. In countries with a weaker legal
environment, domestic institutional money managers are more likely to have business ties to
local corporations, to share the benefits of control, and to be more sympathetic to incumbent
management (Gillan and Starks (2003), Stulz (2005), and Ferreira, Massa and Matos (2009)). In
contrast, foreign institutions can exert pressure over local management. The positive relation
between governance and foreign institutional ownership in civil-law countries suggests that

18
international investors promote the convergence of good corporate governance around the
world.6
3.3. Does Institutional Ownership Drive Changes in Governance?
An important concern is whether causality runs from institutional ownership to governance or
the reverse, since firms with expected governance improvements have the potential to attract
institutional investors. This problem is accentuated by Leuz, Lins, and Warnock (2008) recent
findings showing that U.S. investors avoid firms with governance problems when investing
overseas. To address the direction of the causality, we study the relation between changes in
institutional ownership and changes in governance.
Table 6 reports the results for regressions of changes in the governance index as the
dependent variable and (lagged) changes in institutional ownership as the main explanatory
variable. The dependent variable ∆GOV41 is the change in the governance index from period t to
t-1. The explanatory variable ∆IO_TOTAL is the change in total institutional ownership from
period t-2 to t-1. We express all other independent variables in terms of changes; they are lagged
one period relative to the governance index.7
In Table 6, column (1), the results show that the coefficient on ∆IO_TOTAL is positive and
significant at the 10% level, implying that an increase in total institutional ownership leads to an
increase in firm-level governance. Column (2) indicates that the coefficient on change in
domestic ownership (∆IO_DOM) is not significant. In contrast, the coefficient on the change in
6 For example, mutual fund families may be reluctant to engage in activism at firms that they may take as future clients for corporate-sponsored pension plans (Davis and Kim (2007)). Also, recent evidence from Sweden suggests that domestic pension funds affiliated with controlling shareholders limit a firm’s openness to the market for corporate control (Giannetti and Laeven (2007)). 7 In unreported results, we obtain similar findings if we use the control variables in levels, rather than in changes.

19
foreign institutional ownership (∆IO_FOR in column (3)) is positive and significant at the 5%
level. Institutional holdings from common-law-based money managers (∆IO_COMMON in
column (4)) also carry a positive and significant coefficient. Although the coefficient on the
change in civil-law ownership (∆IO_CIVIL) is also positive and significant, the coefficient of
∆IO_COMMON is almost three times larger. These findings are indicative of the special role
played by institutions that originate in countries with good governance, such as common-law
countries. We note that these countries not only have strong country-level governance, but also
strong firm-level governance (see Table 2).
Table 6 also reports that the coefficient of change in closely held shares (∆CLOSELY) is
negative and statistically significant, but the coefficient of ∆ADR is positive and significant.
Therefore, these results suggest that governance improves in firms in which the percentage of
closely held shares declines and in firms that cross-list on a U.S. exchange.
To examine the direction of the causality, we conduct the analysis in the reverse direction,
using change in governance as the explanatory variable and change in institutional ownership as
the dependent variable. We wish to determine whether institutional investors drive improvements
in governance, or whether improvements in governance attract institutional investment. We
estimate five different models, each of which uses a different dependent variable representing the
changes in institutional investment from t-1 to t: ∆IO_TOTAL, ∆IO_DOM, ∆IO_FOR,
∆IO_COMMON, and ∆IO_CIVIL. The independent variables in each specification are the
change in governance during t-2 to t-1 (∆GOV41), and the firm-specific control variables
(coefficients not shown) used in Table 6.

20
Table 7 reports the results of the reverse changes regression. We find that the coefficient on
the change in governance is statistically insignificant or even negative in some cases.8 Thus, the
direction of the effect is from institutional ownership to governance and not from governance to
institutional ownership.9
Our results are consistent with the survey findings of McCahery, Sautner, and Starks (2008),
that institutions play an active role in pushing firms to improve their governance. Overall, the
findings indicate that an increase in institutional ownership leads to improved governance, and
not vice versa.
3.4. Individual Governance Attributes
The composite governance index (GOV41) captures overall firm-level governance and is
comparable across countries. However, we are also interested in examining the impact of
institutional investors on particular governance mechanisms. Governance indexes have been
criticized, and some studies have tried to identify the most important individual attributes (e.g.,
Bebchuk, Cohen, and Ferrell (2009); and Daines, Gow, and Larcker (2008)). Following
Aggarwal et al. (2009), we examine the seven individual governance attributes that have been
most closely studied in the literature and among policy makers. We focus on main board
characteristics of board independence, board size, CEO/chairman separation, and no staggered
8 Further, in unreported regressions, as an alternative to yearly changes, we split our sample period in two and regress changes in governance over 2006-2008, on changes in institutional ownership over the initial period, 2003-2005. We find similar results that lagged changes in institutional ownership drive changes in governance and not in the opposite direction. 9 The number of observation is lower in Table 7, where the dependent variable is institutional ownership change, compared to Table 6, where the dependent variable is governance change, because we do not have institutional ownership data for 2008 and governance data for 2003. However, the results are consistent when we run the regression in Table 6 with the smaller sample used in Table 7.

21
boards; the independence of firm auditors, and ratification of auditors; and the existence of
multiple share classes.
We estimate probit regressions for the seven individual corporate governance attributes on
institutional ownership. The dependent variables are dummy variables that take the value of one
if the board has more than 50% of independent outside directors (BOARD_INDEP, item 3 in
Gov41); the board size is greater than five but less than 16 (BOARD_SIZE, item 4 in Gov41); the
chairman and CEO are separated or there is a lead director (CHAIRMAN_CEO, item 7 in Gov41);
the board is elected annually (NO_STAGGERED_BOARD, item 12 in Gov41); the audit
committee comprises only independent outsiders (AUDIT_COMMIT_INDEP, item 26 in Gov41);
the auditors are ratified annually (AUDITORS_RATIFIED, item 27 in Gov41); there is a single
class of common shares (SINGLE_CLASS, item 28 in Gov41). The main independent variables
are ownership by domestic institutions (IO_DOM) and foreign institutions (IO_FOR). Our
regressions also include the lagged firm-specific control variables (coefficients not shown) used
in Table 4.
Each row in Table 8 corresponds to a different probit regression for each governance
attribute. We present the marginal effects evaluated at the mean for both domestic and foreign
institutional ownership. We find that the marginal effects of foreign institutional ownership are
positive and statistically significant at the 5% level for some of the individual attributes. We find
that foreign institutional ownership is positively associated with board structure. Foreign
institutional ownership increases the likelihood that the board has a majority of independent
directors, that its size is appropriate, and that it does not adopt a staggered board provision.
However, for domestic ownership, our results for all three of these characteristics are different.
22
The marginal effects of domestic institutional ownership are negative but only significant at the
10% level.
We do not find evidence on the relation between institutional investors and firms’ choices of
auditors and multiple class structures. Overall, foreign institutional investors are associated with
more shareholder-friendly board structures.
4. Does Institutional Ownership Affect Corporate Governance Outcomes?
In this section, we provide an example of direct evidence of a corporate action associated with
higher institutional ownership. We explore whether institutional ownership is correlated with
good governance in terms of identifying and terminating poorly performing CEOs. This
complements our evidence in the previous section on governance mechanisms. We then also
analyze whether changes in institutional ownership drive changes in firm valuation.
4.1. CEO Turnover–Performance Sensitivity
We examine whether a higher presence of institutions as shareholders improves the ability of a
firm’s board of directors to identify and terminate poorly performing CEOs. DeFond and Hung
(2004) show that in countries with strong investor protection, there is a stronger association
between CEO turnover and bad firm performance than there is in countries with weak investor
protection. Institutions can be particularly influential in exporting good governance practices in
this area through direct activism or through indirect discipline by selling shares.
We collect data from BoardEx to identity the top executive of each firm in each year. The
BoardEx database contains detailed biographic information on top executives in many countries.
We use the term “CEO” to describe this executive, regardless of whether the firm uses “chief

23
executive officer” or some other designation (such as “managing director” or “executive
chairman”). We start with our main sample of firms from Table 1, but because coverage in
BoardEx is not as extensive for some countries, we drop Hong Kong, Japan, New Zealand,
Singapore and Switzerland from the analysis. For each firm we identify the CEO at each year-
end for 2004-2008. We focus on the sample of non-U.S. firms that contains 3,955 firm-years
observations. At the end of 2008, the sample comprises 909 non-U.S. firms and represents more
than 75% of the market capitalization of the non-U.S. firms in our main sample.
We classify a firm as having experienced a CEO turnover when the top executive at the end
of the year is different from the CEO at the end of the previous year. There are a total of 723
turnover events. These events imply a turnover rate of 18% in 2004-2008, which is in line with
Lel and Miller (2008), who find that the average CEO turnover worldwide is 16% during the
period from 1992 to 2003. As in DeFond and Hung (2004) and Lel and Miller (2008), we cannot
distinguish between voluntary and forced turnovers, but this distinction just leads to additional
noise in the dependent variable, since voluntary turnovers are unlikely to be related to
performance (Hermalin and Weisbach (2003)).
To test the effect of institutional ownership on CEO turnover-performance sensitivity, we
use a probit model of CEO turnover on abnormal stock returns (ABNORMAL_RET), institutional
ownership (IO), and an interaction term of abnormal stock returns and institutional ownership
(ABNORMAL_RET × IO). Following Weisbach (1988) and Lel and Miller (2008), we run a
probit regression:
TURNOVERit = α +b1 ABNORMAL_RETit
+ b2IO +b3(ABNORMAL_RETit × IOit) + b4SIZEit + εit (1)

24
where TURNOVERit is a dummy variable that equals one if the CEO left firm i during year t, and
zero otherwise. We measure the abnormal return ABNORMAL_RET as the firm's annual stock
return in U.S. dollars minus the country’s stock market index return (as given by country-level
Datastream indexes in U.S. dollars) in year t-1. IO is alternatively total (IO_TOTAL), domestic
(IO_DOM), and foreign institutional ownership (IO_FOR) in the previous year. The regression
also includes a lagged log of total assets (SIZE), as well as year, country, and industry dummies.
Our coefficient of interest is the one on the interaction between stock returns and institutional
ownership (b3). Ai and Norton (2003) show that researchers cannot draw conclusions about the
sign and the significance of the interaction term in nonlinear models (such as probit models) by
examining the coefficient on the interaction term. To ensure that we draw valid inferences on the
interactive effect, we estimate the interactive marginal effect and its significance using the delta
method described by Ai and Norton (2003).
Table 9 presents the results of our analysis. The interaction terms show that CEO turnover is
more sensitive to low abnormal stock returns in firms with higher institutional ownership. The
estimated mean interaction effects are negative and statistically significant. We interpret this
result to mean that firms with higher institutional ownership have a greater propensity to shed
poorly performing CEOs. This finding is consistent with institutional investor monitoring having
a direct effect on this corporate governance outcome.
4.2. Changes in Tobin’s Q
Changes in governance attributes or increased CEO turnover performance sensitivity brought by
foreign institutional investment are important if these are conducive to shareholder value
creation. We test whether this is indeed the case.

25
Previous studies (e.g., Gompers, Ishii, and Metrick (2003); and Doidge, Karolyi, and Stulz
(2004)) examine the real effects of good governance and monitoring by measuring the impact of
governance on firm valuation, as measured by Tobin’s Q. Ferreira and Matos (2008) find that
foreign institutions have a significantly positive impact on Tobin’s Q. Tobin’s Q is calculated as
the book value of total assets plus the market value of equity minus the book value of equity
divided by total assets.
We replicate the result in Ferreira and Matos (2008) using our sample of firms. We estimate
regressions of Tobin’s Q ratios on foreign and domestic institutional ownership and other firm
controls, and also on country, industry and year dummies. In unreported regressions, we find
that unlike ownership by domestic institutions, ownership by foreign institutions is positively
associated with Tobin's Q ratios.
We also test whether changes in institutional ownership lead to increases in firm valuation,
which might be due to improvements in corporate governance. Thus, we regress changes in
Tobin’s Q (ΔQ) from t-1 to t on changes in institutional ownership (∆IO_TOTAL, ∆IO_DOM,
∆IO_FOR) from t-2 to t-1 and also on changes in other control variables from t-2 to t-1. The
sample contains non-U.S. firms for the period 2003-2008.
Table 10 presents our results. ∆IO_TOTAL has a positive and significant coefficient. In
column (2), the change in domestic ownership, ∆IO_DOM, has a positive and significant
coefficient. In column (3), the coefficient on changes in foreign institutional ownership,
∆IO_FOR, is also positive and significant. Thus, increases in institutional ownership drive
increases in firm valuation.
We are concerned that the causal relation runs in the opposite direction if firms with better
governance (and higher valuations) attract more foreign capital in the first place. We conduct the

26
analysis in the reverse direction, with changes in institutional ownership as the dependent
variable and changes in Tobin’s Q as the explanatory variable. In unreported regressions, we find
that the coefficient on changes in Tobin’s Q is statistically insignificant. This result suggests that
the direction of the effect is from institutional ownership to firm valuation.
5. Robustness and Additional Tests
We address the potential omitted-variables problems associated with omitted-variables and
endogeneity by using firm fixed effects that control for unobserved sources of firm
heterogeneity. Including firm fixed effects is equivalent to looking at only the within-firm
changes in governance and institutional ownership. Therefore, it solves a “joint determination”
problem in which an unobserved firm-level, time-invariant variable simultaneously determines
both governance and institutional ownership.
Table 11 presents the firm fixed-effects estimates (with t-statistics adjusted for country-level
clustering) we obtain by using our different measures of institutional ownership. There is still
evidence of a positive relation between governance and institutional ownership. Moreover, only
foreign institutional ownership is significant at the 5% level, which confirms our prior findings
that foreign institutions are central to governance improvements outside of the U.S. Because we
take into account only the effects of within-firm changes in governance, firm-specific omitted
variables cannot explain the relation we observe between governance and institutional
ownership. At issue here is whether there is enough variation in institutional ownership and
governance over our study's short sample period to estimate this relation with precision. The
short answer is yes. Although the t-statistics are usually lower, suggesting a lower precision in
the estimates, they are still quite high by traditional standards.

27
To address issues related to the endogeneity of the institutional ownership, we use lagged
values as explanatory variables and use regressions in changes in Section 3. To alleviate any
remaining concerns, we utilize an instrumental variables approach. Under standard identification
assumptions, we apply two-stage least squares (2SLS) tests to isolate the effect of institutional
ownership on governance. Hence, we need an instrument for institutional ownership, a variable
that is correlated with institutional ownership, but uncorrelated with governance except indirectly
through other independent variables.
We use membership in the Morgan Stanley Capital International World index (MSCI) as an
instrumental variable for total (IO_TOTAL) and foreign institutional ownership (IO_FOR). This
is a commonly used benchmark index for foreign portfolio investors. Indeed, Ferreira and Matos
(2008) find that MSCI membership increases the probability that the firm attracts foreign capital.
Following Ferreira and Matos (2008), who find that domestic institutions prefer dividend-paying
stocks, we use a dividend dummy (DIV) as an instrumental variable for total (IO_TOTAL) and
domestic (IO_DOM) institutional ownership. These variables should not drive firm governance
practices directly, but only through the effect they have on institutional ownership.
Columns (1)-(3) of Table 12 present the results of the first-stage regressions that use total,
domestic, and foreign institutional ownership as the dependent variables. The first-stage test
results support our conclusion that foreign ownership is positively associated with MSCI
membership, and that domestic fund managers are attracted by dividend-paying stocks. F-tests
indicating that the instruments can be excluded from the first stage regressions are strongly
rejected.
Columns (4)-(6) of Table 12 present the coefficients of the second-stage regression that uses
the governance index GOV41 as the dependent variable. After we take into account the possibility

28
that institutional ownership is endogenous, we find evidence of a positive relation between
governance and foreign institutional ownership. However, we note that we do not find a similar
relation between governance and domestic institutional ownership. This evidence supports our
previous findings that there is a causal link from institutional ownership to governance, and that
foreign institutions are the main force of governance improvement outside of the U.S. Thus, we
conclude that omitted variables are unlikely to explain the relation between institutional
ownership and corporate governance, particularly for investment by foreign institutions.
We also examine whether U.S.-based institutions (IO_FOR_US) play a special role in the
governance of the foreign firms in which they invest, because the U.S. is a country that is
considered to have a high level of investor protection. In Table 13, Panel A, columns (1)-(3)
show that there is a positive relation between governance and both U.S.-based institutions
(IO_FOR_US) and non-U.S. foreign institutions (IO_FOR_NUS).10
To study the relation between governance and type of institution, we follow Chen, Harford,
and Li (2007) and Ferreira and Matos (2008). Thus, we classify institutions according to the
potential for business ties to a corporation as independent compared to grey institutions.
Independent institutional ownership (IO_IND) is the percentage of shares held by mutual fund
managers and investment advisers. These institutions are more likely to collect information, and
are subject to fewer regulatory restrictions or have fewer potential business relationships with the
corporations in which they invest. We anticipate that this group will be more involved in
monitoring corporate management. Brickley, Lease, and Smith (1988) refer to these institutions
as “pressure-resistant,” and Almazan, Hartzell, and Starks (2005) call them “active.” Grey
10 In unreported results, we find that the coefficients on U.S. and non-U.S. foreign institutional ownership are both significant in the sample of civil-law countries, but in the sample of common-law countries only the U.S. foreign institutional ownership coefficient is significant.
29
institutional ownership (IO_GREY) is the percentage of shares held by bank trusts, insurance
companies, and other institutions (e.g., pension funds, endowments). The current or prospective
business relationships of these types of institutions with corporations tend to make this group
more “pressure-sensitive” with respect to corporate management. Alternatively, we think of
these groups of institutions as having higher monitoring costs. We anticipate that this group will
be more loyal to corporate management and thus more likely to hold shares without reacting to
management actions that do not align with the interests of shareholders. Brickley, Lease, and
Smith (1988) refer to these institutions “pressure-sensitive” and Almazan, Hartzell, and Starks
(2005) call them “passive.”
Table 13, columns (4)-(6), presents our results based on classifying institutions as
independent (IO_IND) compared to grey (IO_GREY) institutions. When we include both
IO_IND and IO_GREY in the same regression, the coefficient of IO_IND is positive and
significant, while the coefficient of IO_GREY is insignificant.
The change analysis in Panel B of Table 13 shows that changes in U.S. institutional
ownership (column (1)) and changes in independent institutional ownership (column (3)) drive
changes in governance, unlike changes in non-U.S. foreign and grey institutional ownership. We
conclude that foreign institutions, especially institutions located in countries with strong
shareholder protection such as the U.S., and independent institutions are less likely to have
potential conflicts of interest that impede their monitoring ability and therefore are more likely to
drive improvements in governance.
In unreported results, similar to Table 7 we also conduct the analysis in the reverse direction,
using change in governance as the explanatory variable and change in institutional ownership

30
(∆IO_FOR_US, ∆IO_FOR_NUS, ∆IO_IND, and ∆IO_GREY) as the dependent variables. We
find that the coefficient on the change in governance is not significant.
Table 14 reports our base results for the sample of U.S. firms. Panel A of Table 14 presents
the results of the governance panel regressions. We note that the specifications are similar to
those in Table 4 for non-U.S. firms, but now we estimate them for our sample of U.S. firms. The
results in column (4) show the coefficient of domestic institutional ownership to be significant
but foreign institutional ownership is not significant for U.S. firms when both variables are
included in the same regression. This finding accords with our earlier results for common-law
countries in Table 5. Panel B of Table 14 reports the results of the regression of changes in
governance for the sample of U.S. firms. We find that U.S.-based institutions are among the most
active promoters of good governance practices, particularly in their home market, but also
around the world.
We also perform a variety of other robustness checks (not tabulated here). We rerun our
tests, now excluding firms from regulated industries (Utilities, Transportation,
Telecommunication Service, Insurance, Energy, and Banking). The results are similar and lead to
the same conclusions. Further, we use GDP per capita, market capitalization to GDP, and
country-level governance attributes as country-level control variables as an alternative to country
fixed effects. Country-level governance attributes include legal origin, rule of law, anti-director
rights, and anti-self dealing index. We still find a positive relation between governance and
institutional ownership. The relation is particularly strong and positive if the institution is
domiciled in a common-law country, but negative if the institution is domiciled in civil-law
countries. When we also include stock returns as a firm-level control variable, the coefficient is
not significant, and our primary results do not change.

31
6. Conclusion
We find that institutional investors promote good governance practices in firms around the
world. In particular, foreign institutional investors and institutions from countries with strong
shareholder protection are the main promoters of good governance outside of the U.S. Our
results are stronger for firms located in civil-law countries. Thus, international institutional
investment is especially effective in improving governance when the investor protection in the
institution’s home country is stronger than the one in the portfolio firm’s country.
Our results suggest that it is changes in institutional ownership over time that drive changes
in firm-level governance, but the opposite is not true. We also provide evidence that institutional
ownership has a direct effect on corporate governance outcomes, functioning as a disciplinary
mechanism in terminating poorly performing CEOs. Furthermore, increases in institutional
ownership lead to increases in firm valuation, suggesting that institutional investment not only
affects governance mechanisms, but also has real effects on firm value and board decisions.
To our knowledge, our paper is the first to establish a direct link between international
portfolio investment and the adoption of better corporate governance standards that promote
corporate accountability and empower shareholders worldwide. We also shed light on the issue
of whether institutions are simply attracted to firms with stronger governance or whether they
also play a direct role in improving governance. We conclude that the causality runs from
institutional ownership to corporate governance. Our findings suggest that foreign institutions
take a lead role in shareholders activism that local investors seem unable to take. A particular
aspect of foreign institutions that seems to be important is their independence with respect to the
local corporate management. Monitoring and activism by institutions travels beyond country
borders and leads to better firm performance.

32
References
Aggarwal, R., I. Erel, R. Stulz, and R. Williamson, 2009, Differences in Governance Practices
between U.S. and Foreign Firms: Measurement, Causes, and Consequences, Review of
Financial Studies, 22, 3131-3169.
Aggarwal, R., L. Klapper, and P. Wysocki, 2005, Portfolio Preferences of Foreign Institutional
Investors, Journal of Banking and Finance 29, 2919-2946.
Ai, C., and E. Norton, 2003, Interaction Terms in Logit and Probit Models, Economics Letters
80, 123-129
Alexander, C., M. Chen, D. Seppi, and C. Spatt, 2008, The Role of Advisory Services in Proxy
Voting, Working Paper, Yale Law School.
Almazan, A., J. Hartzell, L. Starks, 2005, Active Institutional Shareholders and Cost of
Monitoring: Evidence from Executive Compensation, Financial Management 34, 5-34.
Bebchuk, L., and A. Cohen, 2005, The Costs of Entrenched Boards, Journal of Financial
Economics 78, 409-433.
Bebchuk, L., A. Cohen, and A. Ferrell, 2009, What Matters in Corporate Governance? Review of
Financial Studies 22, 783-827.
Bebchuk, L., and A. Hamdani, 2009, The Elusive Quest for Global Governance Standards,
University of Pennsylvania Law Review, 157, 1263-1317.
Becht, M., P. Bolton, and A. Roell, 2003, Corporate Governance and Control, in G.
Constantinides et al (eds.), Handbook of the Economics of Finance, Amsterdam, North
Holland.

33
Becht, M., J. Franks, and J. Grant, 2008, The Returns to Public and Private Activism in Europe,
Working Paper, London Business School.
Becht, M., J. Franks, C. Mayer, and S. Rossi, 2008, Returns to Shareholder Activism: Evidence
from a Clinical Study of the Hermes U.K. Focus Fund, Review of Financial Studies, 22,
3093-3129.
Bekaert, G., and C. Harvey, 2000, Foreign Speculators and Emerging Equity Markets, Journal of
Finance 55, 565-613.
Brav, A., W. Jiang, F. Partnoy, and R. Thomas, 2008, Hedge Fund Activism, Corporate
Governance, and Firm Performance, Journal of Finance 63, 1729-1775.
Brickley, J., R. Lease, and C. Smith Jr., 1988, Ownership Structure and Voting on Antitakeover
Amendments, Journal of Financial Economics 20, 267-291.
Bris, A., and C. Cabolis, 2008, The Value of Investor Protection: Firm Evidence from Cross-
Border Mergers, Review of Financial Studies 21, 605-648.
Bushee, B., M. Carter, and J. Gerakos, 2008, Institutional Investor Preferences for Corporate
Governance Mechanisms, Working Paper, Wharton School, University of Pennsylvania.
Business Week, 2006, Special Report: Fidelity’s Divided Loyalties.
Chan, K., V. Covrig, and L. Ng, 2005, What Determines the Domestic Bias and Foreign Bias?
Evidence from Mutual Fund Equity Allocations Worldwide, Journal of Finance 60, 1495-
1534.
Chen, X., J. Harford, and K. Li, 2007, Monitoring: Which Institutions Matter? Journal of
Financial Economics 86, 279-305.

34
Dahlquist, M., and G. Robertsson, 2001, Direct Foreign Ownership, Institutional Investors, and
Firm Characteristics, Journal of Financial Economics 59, 413-440.
Daines, R., Gow, I. and D. Larcker, 2008, Rating the Ratings: How Good Are Commercial
Governance Ratings? Working paper, Stanford University.
Dahya, J., O. Dimitrov, and J. McConnell, 2008, Dominant Shareholders, Corporate Boards, and
Corporate Value: A Cross-Country Analysis, Journal of Financial Economics 87, 73-100.
Davis, G., and E. H. Kim, 2007, Business Ties and Proxy Voting by Mutual Funds, Journal of
Financial Economics 85, 552-570.
DeFond, M., and M. Hung, 2004, Investor Protection and Corporate Governance: Evidence from
Worldwide CEO Turnover, Journal of Accounting Research 42, 269-312.
Djankov, S., R. La Porta, F. Lopez-de-Silanes, and A. Shleifer, 2008, The Law and Economics
of Self-Dealing, Journal of Financial Economics 88: 430-465.
Doidge, C., G. A. Karolyi, and R. Stulz, 2004, Why are Foreign Firms Listed in the U.S. Worth
More? Journal of Financial Economics 71, 205-238.
Doidge, C., G. A. Karolyi, and R. Stulz, 2007, Why Do Countries Matter so Much for Corporate
Governance? Journal of Financial Economics 86, 1-39.
Doidge, C., G. A. Karolyi, K. Lins, D. Miller, and R. Stulz, 2008, Private Benefits of Control,
Ownership, and the Cross-Listing Decision, Journal of Finance, 64, 425-466.
Durnev, A., and E. H. Kim, 2005, To Steal or Not to Steal: Firm Attributes, Legal Environment,
and Valuation, Journal of Finance 60, 1461-1493.
Economist, 2007, Leader of the Swarn, July 12th edition

35
Economist, 2008, German Corporate Governance: Raising their Voices, March 19th edition
Fernandes, N., M. Ferreira, P. Matos, and K. Murphy, 2008, The Pay Divide: (Why) Are U.S.
CEOs Paid More? Working Paper, University of Southern California.
Ferreira, M., M. Massa, and P. Matos, 2009, Shareholders at the Gate? Institutional Investors and
Cross-Border Mergers and Acquisitions, Review of Financial Studies, forthcoming.
Ferreira, M., and P. Matos, 2008, The Colors of Investors’ Money: The Role of Institutional
Investors Around the World, Journal of Financial Economics 88, 499-533.
Financial Times, 2007, Tangled Relationships Make Choices Tough.
Francis, J., I. Khurana, and R. Pereira, 2005, Disclosure Incentives and Effects on Cost of
Capital around the World, The Accounting Review 80, 1125-1162.
Gaspar, J., M. Massa, and P. Matos, 2005, Shareholder Investment Horizons and the Market for
Corporate Control, Journal of Financial Economics 76, 135-165.
Giannetti, M. and A. Simonov, 2006, Which Investors Fear Expropriation? Evidence from
Investors' Portfolio Choices, Journal of Finance 61, 1507-1547.
Gillan, S., and L. Starks, 2003, Corporate Governance, Corporate Ownership, and the Role of
Institutional Investors: A Global Perspective, Journal of Applied Finance 13, 4-22.
Gillan, S., and L. Starks, 2007, The Evolution of Shareholder Activism in the United States,
Journal of Applied Corporate Finance 19, 55-73.
Gompers, P., J. Ishii, and A. Metrick, 2003, Corporate Governance and Equity Prices, Quarterly
Journal of Economics 118, 107-155.

36
Gompers, P., and A. Metrick, 2001, Institutional Investors and Equity Prices, Quarterly Journal
of Economics 116, 229-259.
Hartzell, J., and L. Starks, 2003, Institutional Investors and Executive Compensation, Journal of
Finance 58, 2351-2374.
Kang, J., and R. Stulz, 1997, Why is There a Home Bias? An Analysis of Foreign Portfolio
Equity Ownership in Japan, Journal of Financial Economics 46, 3-28.
Kim, W., T. Sung, and S. Wei, 2008, How Does Corporate Governance Risk at Home Affect
Investment Choices Abroad? Working Paper, NBER.
Klapper, L., and I. Love, 2004, Corporate Governance, Investor Protection, and Performance in
Emerging Markets, Journal of Corporate Finance 10, 703-728.
Klein, A., and E. Zur, 2009, Entrepreneurial Shareholder Activism: Hedge Funds and Other
Private Investors, Journal of Finance 64, 187-229.
La Porta, R., F. Lopez-de-Silanes, A. Shleifer, and R. Vishny, 1998, Law and Finance, Journal
of Political Economy 106, 1113-1155.
Lel, U., and D. Miller, 2008, International Cross-listing, Firm Performance and Top
Management Turnover: A Test of the Bonding Hypothesis, Journal of Finance 63, 1897 -
1937
Leuz, C., K. Lins, and F. Warnock, 2008, Do Foreigners Invest Less in Poorly Governed Firms?
Review of Financial Studies, forthcoming.
Li, D., F. Moshirian, P. Pham, and J. Zein, 2006, When Financial Institutions Are Large
Shareholders: The Role of Macro Corporate Governance Environments, Journal of Finance,
61, 2975-3007.
37
McCahery, J., Z. Sautner, and L. Starks, 2008, Behind the Scenes: The Corporate Governance
Preferences of Institutional Investors, Working Paper, University of Amsterdam.
Parrino, R., R. Sias, and L. Starks, 2003, Voting with Their Feet: Institutional Ownership
Changes around Forced CEO Turnover, Journal of Financial Economics 68, 3-46.
Rossi, S., and P. Volpin, 2004, Cross-Country Determinants of Mergers and Acquisitions,
Journal of Financial Economics 74, 277-304.
Stulz, R., 2005, The Limits of Financial Globalization, Journal of Finance 60, 1595-1638.
Weisbach, M., 1988, Outside Directors and CEO Turnover, Journal of Financial Economics 20,
431-460.

38
Figure 1 Governance Index by Country and Year
This figure shows the average of the firm level governance index (GOV41) by country and year for the period 2004 to 2008. GOV41 is the percentage of 41 governance attributes that a firm meets, as described in Appendix A. An index of 100% means a firm has adopted all 41 governance provisions.
0%
10%
20%
30%
40%
50%
60%
70%
80%
90%
100%
U.S
.
Can
ada
U.K
.
Fran
ce
Ger
man
y
Switz
erla
nd
Italy
Spai
n
Net
herla
nds
Swed
en
Finl
and
Bel
gium
Nor
way
Den
mar
k
Gre
ece
Aus
tria
Irel
and
Portu
gal
Japa
n
Aus
tralia
Hon
g K
ong
Sing
apor
e
New
Zea
land

39
Figure 2 Total Institutional Ownership by Country and Year
This figure shows the average total institutional ownership by country and year for the period 2003 to 2007. We define institutional ownership as the sum of the holdings of all institutions in a firm’s stock divided by its market capitalization at the end of each calendar year.
0%10%20%30%40%50%60%70%80%90%
100%
U.S
.
Can
ada
U.K
.
Fran
ce
Ger
man
y
Switz
erla
nd
Italy
Spai
n
Net
herla
nds
Swed
en
Finl
and
Bel
gium
Nor
way
Den
mar
k
Gre
ece
Aus
tria
Irel
and
Portu
gal
Japa
n
Aus
tralia
Hon
g K
ong
Sing
apor
e
New
Zea
land

40
Figure 3 Institutional Ownership by Location and Legal Origin
In this figure, Panel A shows the average institutional ownership by domestic and foreign institutions as of December 2007. Domestic (foreign) institutional ownership is the sum of the holdings of all institutions domiciled in the same country (in a different country) in which the stock is issued, expressed as a percentage of the firm’s market capitalization. Panel B shows the average institutional ownership by the institutions’ country of legal origin. Common (civil) is the sum of the holdings of all institutions domiciled in countries that have common (civil) law, expressed as a percentage of total market capitalization of the firm.
0%10%20%30%40%50%60%70%80%90%
100%
U.S
.
Can
ada
U.K
.
Fran
ce
Ger
man
y
Switz
erla
nd
Italy
Spai
n
Net
herla
nds
Swed
en
Finl
and
Bel
gium
Nor
way
Den
mar
k
Gre
ece
Aus
tria
Irel
and
Portu
gal
Japa
n
Aus
tralia
Hon
g K
ong
Sing
apor
e
New
Zea
land
Panel A: Domestic vs. Foreign Institutional Ownership
Foreign IODomestic IO
0%10%20%30%40%50%60%70%80%90%
100%
U.S
.
Can
ada
U.K
.
Fran
ce
Ger
man
y
Switz
erla
nd
Italy
Spai
n
Net
herla
nds
Swed
en
Finl
and
Bel
gium
Nor
way
Den
mar
k
Gre
ece
Aus
tria
Irel
and
Portu
gal
Japa
n
Aus
tralia
Hon
g K
ong
Sing
apor
e
New
Zea
land
Panel B: Common-Law vs. Civil-Law Institutional Ownership
Civil Law IO
Common Law IO

41
Table 1 Number of Firms by Country and Year
This table shows, for each of the 23 countries in the sample during 2004-2008, the number of firms that have both firm-level governance and institutional ownership data. The row titled “Total ex U.S.” refers to the number of non-U.S. firms, which constitute our sample in the main regressions. We measure coverage as the total market capitalization of the companies in our sample, expressed as a fraction of the Worldscope total market capitalization at the end of the sample period.
Country 2004 2005 2006 2007 2008
Coverage
% market cap.
Australia 72 117 118 117 83 75%
Austria 16 17 18 18 18 56%
Belgium 19 24 27 27 27 79%
Canada 161 164 188 188 127 75%
Denmark 21 21 22 22 21 78%
Finland 27 28 30 30 27 85%
France 72 83 87 87 80 71%
Germany 80 83 90 90 86 82%
Greece 42 43 43 43 31 70%
Hong Kong 32 65 65 65 56 93%
Ireland 15 15 16 16 15 81%
Italy 41 69 73 72 70 86%
Japan 491 584 598 598 581 39%
Netherlands 44 43 44 44 33 66%
New Zealand 14 17 18 18 18 72%
Norway 20 21 23 23 22 81%
Portugal 13 14 14 14 14 88%
Singapore 53 59 60 60 54 70%
Spain 35 53 57 56 55 83%
Sweden 40 40 47 46 46 78%
Switzerland 54 56 61 61 59 81%
U.K. 194 514 519 518 460 84%
U.S. 4,776 5,202 5,152 4,853 4,624 96%
Total ex U.S. 1,556 2,130 2,218 2,213 1,983 71%

42
Table 2 Firm-Level Governance Index
This table presents average governance index (GOV41) for each country in the sample during the 2004-2008 period. GOV41 is the percentage of 41 governance attributes that a firm meets, as described in Appendix A. A score of 100% means a firm has adopted all 41 governance provisions. The column titled Average Yearly Change shows the average annual change in GOV41 during 2004-2008.
Country 2004 2005 2006 2007 2008
Average Yearly
Change
Australia 46.6% 47.0% 47.2% 47.3% 48.0% 0.3%
Austria 42.2% 41.3% 42.0% 40.0% 45.1% 0.7%
Belgium 31.2% 33.8% 36.8% 36.7% 37.8% 1.6%
Canada 62.4% 65.4% 67.4% 68.5% 72.8% 2.6%
Denmark 37.0% 41.0% 44.3% 48.2% 39.4% 0.6%
Finland 39.6% 52.8% 53.7% 52.7% 52.5% 3.2%
France 40.6% 43.7% 42.8% 44.8% 44.9% 1.1%
Germany 38.4% 44.9% 48.7% 45.8% 48.2% 2.5%
Greece 35.5% 38.4% 32.1% 27.3% 35.9% 0.1%
Hong Kong 39.3% 39.8% 43.9% 44.2% 47.7% 2.1%
Ireland 40.8% 48.9% 48.8% 47.0% 55.0% 3.5%
Italy 33.6% 39.1% 41.8% 41.4% 46.4% 3.2%
Japan 35.2% 37.0% 37.4% 37.7% 40.9% 1.4%
Netherlands 37.7% 46.5% 49.0% 49.0% 55.7% 4.5%
New Zealand 45.6% 45.2% 45.7% 45.7% 45.4% -0.1%
Norway 33.0% 38.8% 43.4% 44.4% 37.3% 1.1%
Portugal 31.1% 36.2% 35.9% 36.2% 36.2% 1.3%
Singapore 38.5% 42.5% 45.2% 45.4% 51.8% 3.3%
Spain 34.2% 42.8% 45.1% 47.0% 46.8% 3.2%
Sweden 31.6% 40.4% 46.2% 44.9% 51.9% 5.1%
Switzerland 40.7% 51.0% 52.1% 52.2% 56.6% 4.0%
U.K. 45.2% 52.1% 54.1% 50.8% 59.3% 3.5%
U.S. 53.8% 58.1% 59.9% 60.9% 62.2% 2.1%

43
Table 3 Institutional Ownership by Country and Year
The table shows the average firm-level total institutional ownership in each country during 2003-2007. We define institutional ownership as the sum of the holdings of all institutions in a firm’s stock divided by its market capitalization at the end of each calendar year. Domestic (foreign) institutional ownership is the percentage of total institutional holdings of all institutions domiciled in the same country (in a different country) in which the stock is issued, expressed as a percentage of total institutional ownership at the end of the sample period. Common (civil) law is the percentage of total institutional holding of all institutions domiciled in countries that have common (civil) law, expressed as a percentage of total institutional ownership at the end of the sample period.
Country Total Institutional Ownership Domestic vs. Foreign Common vs. Civil
2003 2004 2005 2006 2007 Domestic Foreign Common Civil Australia 4.8% 6.5% 8.7% 9.9% 14.3% 22% 78% 85% 15% Austria 8.3% 13.0% 13.7% 16.8% 21.3% 13% 87% 45% 55% Belgium 10.2% 10.7% 13.4% 16.2% 20.0% 26% 74% 37% 63% Canada 43.7% 45.8% 47.4% 46.7% 59.1% 60% 40% 97% 3% Denmark 14.1% 18.3% 23.5% 23.2% 27.6% 53% 47% 30% 70% Finland 25.3% 27.6% 30.7% 29.2% 35.7% 28% 72% 35% 65% France 20.7% 21.6% 23.7% 26.5% 30.9% 41% 59% 39% 61% Germany 16.6% 20.6% 22.8% 24.3% 27.7% 37% 63% 42% 58% Greece 3.4% 5.5% 8.4% 9.9% 14.3% 12% 88% 51% 49% Hong Kong 7.6% 8.5% 9.1% 10.9% 12.7% 16% 84% 83% 17% Ireland 25.9% 26.1% 29.6% 30.0% 33.5% 11% 89% 63% 37% Italy 9.2% 9.2% 11.0% 12.4% 13.8% 23% 77% 39% 61% Japan 13.9% 15.2% 15.1% 17.4% 18.3% 41% 59% 44% 56% Netherlands 10.4% 14.4% 19.7% 22.3% 28.9% 13% 87% 55% 45% New Zealand 5.4% 7.0% 9.9% 8.6% 9.0% 8% 92% 87% 13% Norway 26.3% 27.8% 30.3% 29.9% 30.7% 32% 68% 43% 57% Portugal 6.9% 7.8% 10.1% 8.6% 10.3% 26% 74% 41% 59% Singapore 4.8% 7.0% 10.2% 10.6% 14.5% 17% 83% 79% 21% Spain 7.8% 9.3% 13.0% 12.5% 13.3% 35% 65% 34% 66% Sweden 32.3% 37.0% 36.0% 36.1% 36.7% 60% 40% 23% 77% Switzerland 12.2% 16.6% 21.6% 23.9% 28.1% 25% 75% 51% 49% U.K. 15.3% 21.4% 26.2% 26.9% 37.9% 70% 30% 89% 11% U.S. 40.1% 41.1% 46.1% 52.6% 57.8% 87% 13% 96% 4%
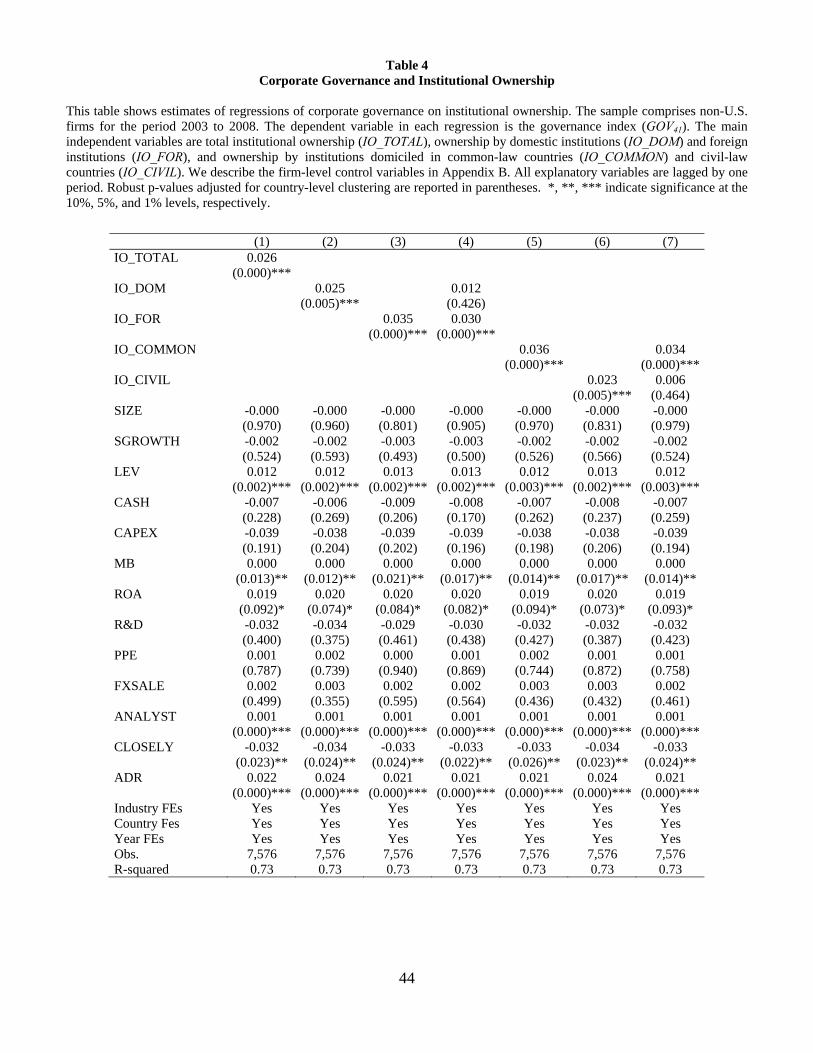
44
Table 4 Corporate Governance and Institutional Ownership
This table shows estimates of regressions of corporate governance on institutional ownership. The sample comprises non-U.S. firms for the period 2003 to 2008. The dependent variable in each regression is the governance index (GOV41). The main independent variables are total institutional ownership (IO_TOTAL), ownership by domestic institutions (IO_DOM) and foreign institutions (IO_FOR), and ownership by institutions domiciled in common-law countries (IO_COMMON) and civil-law countries (IO_CIVIL). We describe the firm-level control variables in Appendix B. All explanatory variables are lagged by one period. Robust p-values adjusted for country-level clustering are reported in parentheses. *, **, *** indicate significance at the 10%, 5%, and 1% levels, respectively.
(1) (2) (3) (4) (5) (6) (7) IO_TOTAL 0.026 (0.000)*** IO_DOM 0.025 0.012 (0.005)*** (0.426) IO_FOR 0.035 0.030 (0.000)*** (0.000)*** IO_COMMON 0.036 0.034 (0.000)*** (0.000)***IO_CIVIL 0.023 0.006 (0.005)*** (0.464) SIZE -0.000 -0.000 -0.000 -0.000 -0.000 -0.000 -0.000 (0.970) (0.960) (0.801) (0.905) (0.970) (0.831) (0.979) SGROWTH -0.002 -0.002 -0.003 -0.003 -0.002 -0.002 -0.002 (0.524) (0.593) (0.493) (0.500) (0.526) (0.566) (0.524) LEV 0.012 0.012 0.013 0.013 0.012 0.013 0.012 (0.002)*** (0.002)*** (0.002)*** (0.002)*** (0.003)*** (0.002)*** (0.003)***CASH -0.007 -0.006 -0.009 -0.008 -0.007 -0.008 -0.007 (0.228) (0.269) (0.206) (0.170) (0.262) (0.237) (0.259) CAPEX -0.039 -0.038 -0.039 -0.039 -0.038 -0.038 -0.039 (0.191) (0.204) (0.202) (0.196) (0.198) (0.206) (0.194) MB 0.000 0.000 0.000 0.000 0.000 0.000 0.000 (0.013)** (0.012)** (0.021)** (0.017)** (0.014)** (0.017)** (0.014)** ROA 0.019 0.020 0.020 0.020 0.019 0.020 0.019 (0.092)* (0.074)* (0.084)* (0.082)* (0.094)* (0.073)* (0.093)* R&D -0.032 -0.034 -0.029 -0.030 -0.032 -0.032 -0.032 (0.400) (0.375) (0.461) (0.438) (0.427) (0.387) (0.423) PPE 0.001 0.002 0.000 0.001 0.002 0.001 0.001 (0.787) (0.739) (0.940) (0.869) (0.744) (0.872) (0.758) FXSALE 0.002 0.003 0.002 0.002 0.003 0.003 0.002 (0.499) (0.355) (0.595) (0.564) (0.436) (0.432) (0.461) ANALYST 0.001 0.001 0.001 0.001 0.001 0.001 0.001 (0.000)*** (0.000)*** (0.000)*** (0.000)*** (0.000)*** (0.000)*** (0.000)***CLOSELY -0.032 -0.034 -0.033 -0.033 -0.033 -0.034 -0.033 (0.023)** (0.024)** (0.024)** (0.022)** (0.026)** (0.023)** (0.024)** ADR 0.022 0.024 0.021 0.021 0.021 0.024 0.021 (0.000)*** (0.000)*** (0.000)*** (0.000)*** (0.000)*** (0.000)*** (0.000)***Industry FEs Yes Yes Yes Yes Yes Yes Yes Country Fes Yes Yes Yes Yes Yes Yes Yes Year FEs Yes Yes Yes Yes Yes Yes Yes Obs. 7,576 7,576 7,576 7,576 7,576 7,576 7,576 R-squared 0.73 0.73 0.73 0.73 0.73 0.73 0.73

45
Table 5 Corporate Governance, Institutional Ownership: The Role of Legal Origin
This tables shows estimates of regressions of corporate governance on institutional ownership separately for non-U.S. firms located in civil-law (Panel A) and common-law countries (Panel B) for the period 2003 to 2008. The dependent variable in each regression is the governance index GOV41. The main independent variables are total institutional ownership (IO_TOTAL), and ownership by domestic institutions (IO_DOM) and foreign institutions (IO_FOR). We describe the firm-level control variables in Appendix B. All explanatory variables are lagged by one period. Robust p-values adjusted for country-level clustering are reported in parentheses. *, **, *** reflects significance at the 10%, 5% and 1% levels.
Panel A: Civil-law Countries Panel B: Common-law Countries (1) (2) (3) (4) (5) (6) (7) (8) IO_TOTAL 0.018 0.044 (0.016)** (0.001)*** IO_DOM 0.010 -0.023 0.047 0.043 (0.062)* (0.030)** (0.002)*** (0.003)***IO_FOR 0.031 0.044 0.039 0.031 (0.014)** (0.005)*** (0.028)** (0.088)* SIZE -0.002 -0.002 -0.002 -0.002 0.008 0.008 0.007 0.008 (0.052)* (0.035)** (0.044)** (0.030)** (0.003)*** (0.002)*** (0.007)*** (0.003)***SGROWTH 0.000 0.001 -0.000 -0.000 -0.010 -0.010 -0.010 -0.010 (0.874) (0.714) (0.998) (0.912) (0.121) (0.113) (0.126) (0.119) LEV 0.014 0.014 0.014 0.014 0.011 0.010 0.013 0.011 (0.081)* (0.086)* (0.080)* (0.077)* (0.030)** (0.036)** (0.017)** (0.039)** CASH -0.003 -0.003 -0.003 -0.003 -0.006 -0.003 -0.012 -0.006 (0.574) (0.617) (0.592) (0.597) (0.528) (0.723) (0.208) (0.514) CAPEX -0.033 -0.032 -0.034 -0.032 -0.014 -0.011 -0.017 -0.013 (0.180) (0.204) (0.176) (0.195) (0.805) (0.841) (0.791) (0.820) MB 0.000 0.000 0.000 0.000 0.000 0.001 0.000 0.000 (0.727) (0.753) (0.778) (0.880) (0.051)* (0.042)** (0.051)* (0.036)** ROA 0.007 0.008 0.007 0.007 0.041 0.040 0.041 0.041 (0.352) (0.302) (0.353) (0.357) (0.010)*** (0.009)*** (0.015)** (0.010)***R&D 0.020 0.020 0.022 0.024 0.028 0.027 0.029 0.030 (0.574) (0.594) (0.548) (0.527) (0.433) (0.399) (0.449) (0.422) PPE -0.004 -0.004 -0.003 -0.003 -0.005 -0.004 -0.006 -0.005 (0.514) (0.485) (0.527) (0.539) (0.620) (0.729) (0.554) (0.623) FXSALE 0.002 0.003 0.002 0.002 -0.003 -0.002 -0.004 -0.003 (0.565) (0.458) (0.615) (0.582) (0.446) (0.631) (0.377) (0.470) ANALYST 0.001 0.001 0.001 0.001 0.001 0.001 0.001 0.001 (0.001)*** (0.001)*** (0.001)*** (0.001)*** (0.121) (0.070)* (0.118) (0.127) CLOSELY -0.015 -0.016 -0.015 -0.015 -0.057 -0.060 -0.060 -0.058 (0.163) (0.179) (0.148) (0.154) (0.000)*** (0.000)*** (0.000)*** (0.000)***ADR 0.029 0.029 0.028 0.027 0.005 0.010 0.007 0.006 (0.000)*** (0.000)*** (0.000)*** (0.001)*** (0.118) (0.017)** (0.072)* (0.104) Industry FEs Yes Yes Yes Yes Yes Yes Yes Yes Country Fes Yes Yes Yes Yes Yes Yes Yes Yes Year FEs Yes Yes Yes Yes Yes Yes Yes Yes Obs. 4,133 4,133 4,133 4,133 3,443 3,443 3,443 3,443 R-squared 0.523 0.521 0.524 0.525 0.68 0.67 0.67 0.68

46
Table 6 Changes in Corporate Governance and Changes in Institutional Ownership
This table shows estimates of regressions of changes in corporate governance (ΔGOV41) from t-1 to t on changes in institutional ownership from t-2 to t-1. The sample comprises non-U.S. firms for the period 2003 to 2008. The main independent variables are (lagged) changes in total institutional ownership (∆IO_TOTAL), domestic ownership (∆IO_DOM), foreign ownership (∆IO_FOR), and ownership by institutions domiciled in common-law (∆IO_COMMON) and civil-law (∆IO_CIVIL) countries. The firm-level control variables are changes from t-2 to t-1. Robust p-values adjusted for country-level clustering are reported in parentheses. *, **, *** reflects significance at the 10%, 5% and 1% levels.
(1) (2) (3) (4) (5) ΔIO_TOTAL 0.016 (0.070)* ΔIO_DOM 0.020 (0.108) ΔIO_FOR 0.011 (0.013)** ΔIO_COMMON 0.025 (0.015)** ΔIO_CIVIL 0.009 (0.046)** ΔSIZE -0.007 -0.007 -0.007 -0.007 -0.007 (0.016)** (0.017)** (0.015)** (0.016)** (0.015)** ΔSGROWTH -0.004 -0.004 -0.004 -0.004 -0.004 (0.262) (0.263) (0.245) (0.251) (0.247) ΔLEV 0.007 0.007 0.007 0.007 0.007 (0.467) (0.488) (0.477) (0.486) (0.484) ΔCASH -0.014 -0.014 -0.014 -0.014 -0.014 (0.165) (0.169) (0.167) (0.168) (0.167) ΔCAPEX -0.020 -0.020 -0.021 -0.021 -0.021 (0.328) (0.332) (0.306) (0.314) (0.311) ΔMB -0.000 -0.000 -0.000 -0.000 -0.000 (0.618) (0.652) (0.583) (0.581) (0.610) ΔROA -0.004 -0.005 -0.004 -0.004 -0.004 (0.762) (0.746) (0.803) (0.807) (0.793) ΔR&D -0.006 -0.004 -0.005 -0.005 -0.004 (0.913) (0.937) (0.931) (0.932) (0.939) ΔPPE -0.011 -0.011 -0.010 -0.011 -0.010 (0.373) (0.377) (0.422) (0.374) (0.428) ΔFXSALE -0.003 -0.002 -0.002 -0.003 -0.002 (0.700) (0.727) (0.742) (0.675) (0.758) ΔANALYST -0.000 -0.000 -0.000 -0.000 -0.000 (0.781) (0.802) (0.795) (0.766) (0.809) ΔCLOSELY -0.013 -0.014 -0.014 -0.014 -0.014 (0.008)*** (0.007)*** (0.008)*** (0.007)*** (0.007)*** ΔADR 0.021 0.021 0.021 0.021 0.022 (0.012)** (0.011)** (0.011)** (0.012)** (0.011)** Industry FEs Yes Yes Yes Yes Yes Country Fes Yes Yes Yes Yes Yes Year FEs Yes Yes Yes Yes Yes Obs. 5,677 5,677 5,677 5,677 5,677 R-squared 0.21 0.20 0.20 0.21 0.20

47
Table 7 Changes in Institutional Ownership and Changes in Corporate Governance
This table shows estimates of regressions of changes in institutional ownership from t-1 to t on changes in corporate governance (∆GOV41) from t-2 to t-1. The sample comprises non-U.S. firms for the period 2003 to 2008. We estimate five models in which the dependent variables are changes in total institutional ownership (∆IO_TOTAL), domestic ownership (∆IO_DOM), foreign ownership (∆IO_FOR), and ownership by institutions domiciled in common-law (∆IO_COMMON) and civil-law (∆IO_CIVIL) countries. The firm-level control variables are changes from t-2 to t-1 and are the same variables as used in Table 6 (coefficients are not shown). Regressions include industry, country, and year fixed effects. Robust p-values adjusted for country-level clustering are reported in parentheses. *, **, *** reflects significance at the 10%, 5% and 1% levels.
Dependent Variable Coefficient of Obs. R-squared
ΔGOV41
ΔIO_TOTAL -0.054 2,669 0.05
(0.098)*
ΔIO_DOM -0.050 2,669 0.06
(0.198)
ΔIO_FOR 0.001 2,669 0.03
(0.959)
ΔIO_COMMON -0.054 2,669 0.07
(0.025)**
ΔIO_CIVIL 0.004 2,669 0.03
(0.839)

48
Table 8 Individual Corporate Governance Attributes and Institutional Ownership
This table shows estimates of probit regressions of individual corporate governance attributes on institutional ownership. We evaluate marginal effects at the sample mean. The sample comprises non-U.S. firms for the period 2003 to 2008. The dependent variables are dummy variables that take the value of one if board has more than 50% of independent directors (BOARD_INDEP, item 3 in Gov41); board size is at greater than five but less than 16 (BOARD_SIZE, item 4 in Gov41); chairman and CEO are separated or there is a lead director (CHAIRMAN_CEO, item 7 in Gov41); annually elected board (NO_STAGGERED_BOARD, item 12 in Gov41); audit committee composed solely of independent outsiders (AUDIT_COMMIT_INDEP, item 26 in Gov41); auditors ratified at most recent annual meeting (AUDITORS_RATIFIED, item 27 in Gov41); single class, common (SINGLE_CLASS, item 28 in Gov41). The main independent variables are ownership by domestic institutions (IO_DOM) and foreign institutions (IO_FOR). Regressions include the same firm-level controls variables as in Table 4 (coefficients are not shown). Robust p-value adjusted for country-level clustering are reported in parentheses. *, **, *** reflects significance at the 10%, 5% and 1% levels.
Marginal Effect of Marginal Effect of Pseudo
Dependent Variable IO_DOM IO_FOR Obs. R-squared
BOARD_INDEP -0.121 0.278 7,576 0.40
(0.074)* (0.016)**
BOARD_SIZE -0.113 0.195 7,394 0.10
(0.097)* (0.004)***
CHAIRMAN_CEO 0.211 -0.143 7,325 0.73
(0.083)* (0.073)*
NO_STAGGERED_BOARD -0.148 0.156 6,828 0.43
(0.000)*** (0.038)**
AUDIT_COMMIT_INDEP 0.107 0.056 7,576 0.44
(0.161) (0.403)
AUDITORS_RATIFIED -0.040 0.017 7,538 0.67
(0.641) (0.774)
SINGLE_CLASS -0.041 0.005 4,991 0.38
(0.207) (0.828)

49
Table 9 Probit Regression of CEO Turnover and Institutional Ownership
This table presents estimates of probit regressions of CEO turnover on abnormal stock returns and institutional ownership. The sample comprises non-U.S. firms for the period 2003 to 2008. The dependent variable is CEO turnover, which equals one if the CEO at the end of the year is different from the CEO at the end of the previous year, and zero otherwise. The main independent variables are total institutional ownership in the company (IO_TOTAL), ownership by domestic institutions (IO_DOM), ownership by foreign institutions (IO_FOR), and one-year abnormal stock return (adjusted by the local stock market return) in U.S. dollars (ABNORMAL_RET). All explanatory variables are lagged by one period. The interaction effect is defined as the change in the predicted probability of CEO turnover for a change in both the firm performance and the institutional ownership using the method described in Ai and Norton (2003). Robust p-values adjusted for country-level clustering are reported in parentheses. *, **, *** reflects significance at the 10%, 5% and 1% levels.
(1) (2) (3) ABNORMAL_RET -0.041 -0.090 -0.137 (0.395) (0.081)* (0.004)*** IO_TOTAL -0.436 (0.044)** IO_TOTAL × ABNORMAL_RET -0.866 (0.000)*** IO_DOM -0.718 (0.000)*** IO_DOM × ABNORMAL_RET -1.220 (0.000)*** IO_FOR -0.195 (0.446) IO_FOR × ABNORMAL_RET -0.897 (0.011)** SIZE 0.037 0.025 0.036 (0.000)*** (0.001)*** (0.007)*** Industry FEs Yes Yes Yes Country FEs Yes Yes Yes Year FEs Yes Yes Yes Obs. 3,955 3955 3,955 Pseudo R-squared 0.067 0.067 0.065 Mean interaction effect: IO_TOTAL × ABNORMAL_RET -0.189 (0.000)*** Mean interaction effect: IO_DOM × ABNORMAL_RET -0.261 (0.000)*** Mean interaction effect: IO_FOR × ABNORMAL_RET -0.211 (0.000)***
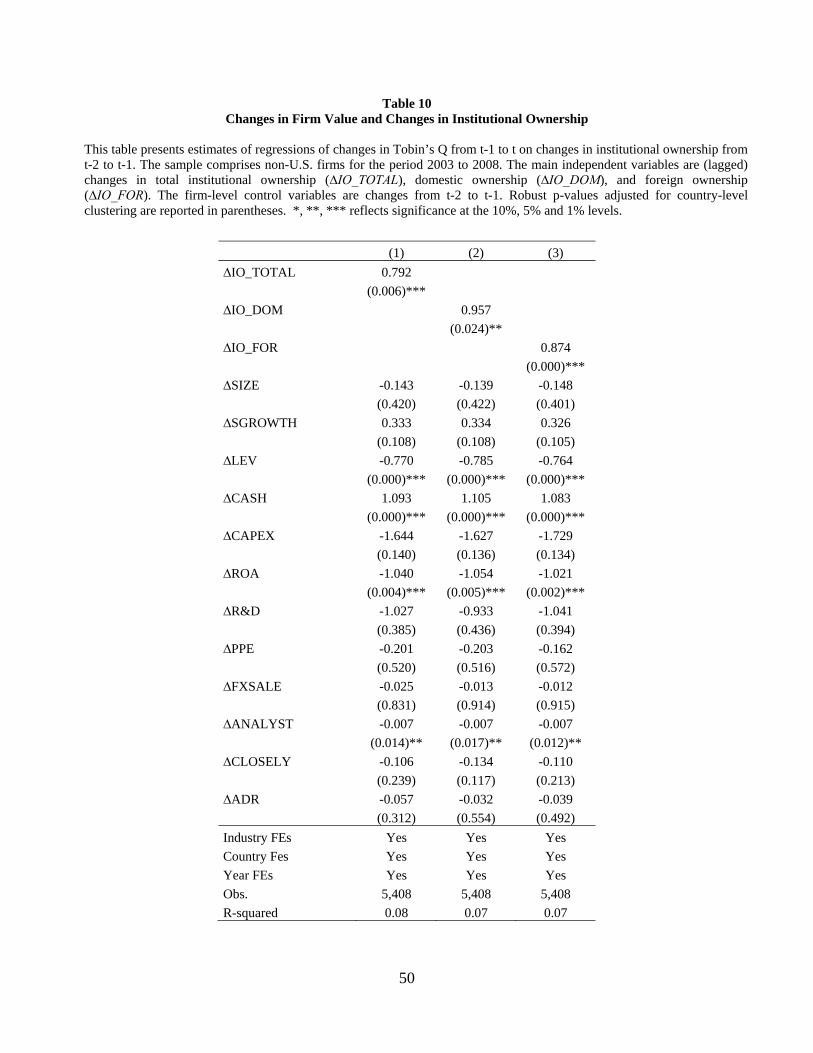
50
Table 10 Changes in Firm Value and Changes in Institutional Ownership
This table presents estimates of regressions of changes in Tobin’s Q from t-1 to t on changes in institutional ownership from t-2 to t-1. The sample comprises non-U.S. firms for the period 2003 to 2008. The main independent variables are (lagged) changes in total institutional ownership (∆IO_TOTAL), domestic ownership (∆IO_DOM), and foreign ownership (∆IO_FOR). The firm-level control variables are changes from t-2 to t-1. Robust p-values adjusted for country-level clustering are reported in parentheses. *, **, *** reflects significance at the 10%, 5% and 1% levels.
(1) (2) (3) ∆IO_TOTAL 0.792 (0.006)*** ∆IO_DOM 0.957 (0.024)** ∆IO_FOR 0.874 (0.000)*** ∆SIZE -0.143 -0.139 -0.148 (0.420) (0.422) (0.401) ∆SGROWTH 0.333 0.334 0.326 (0.108) (0.108) (0.105) ∆LEV -0.770 -0.785 -0.764 (0.000)*** (0.000)*** (0.000)*** ∆CASH 1.093 1.105 1.083 (0.000)*** (0.000)*** (0.000)*** ∆CAPEX -1.644 -1.627 -1.729 (0.140) (0.136) (0.134) ∆ROA -1.040 -1.054 -1.021 (0.004)*** (0.005)*** (0.002)*** ∆R&D -1.027 -0.933 -1.041 (0.385) (0.436) (0.394) ∆PPE -0.201 -0.203 -0.162 (0.520) (0.516) (0.572) ∆FXSALE -0.025 -0.013 -0.012 (0.831) (0.914) (0.915) ∆ANALYST -0.007 -0.007 -0.007 (0.014)** (0.017)** (0.012)** ∆CLOSELY -0.106 -0.134 -0.110 (0.239) (0.117) (0.213) ∆ADR -0.057 -0.032 -0.039 (0.312) (0.554) (0.492) Industry FEs Yes Yes Yes Country Fes Yes Yes Yes Year FEs Yes Yes Yes Obs. 5,408 5,408 5,408 R-squared 0.08 0.07 0.07
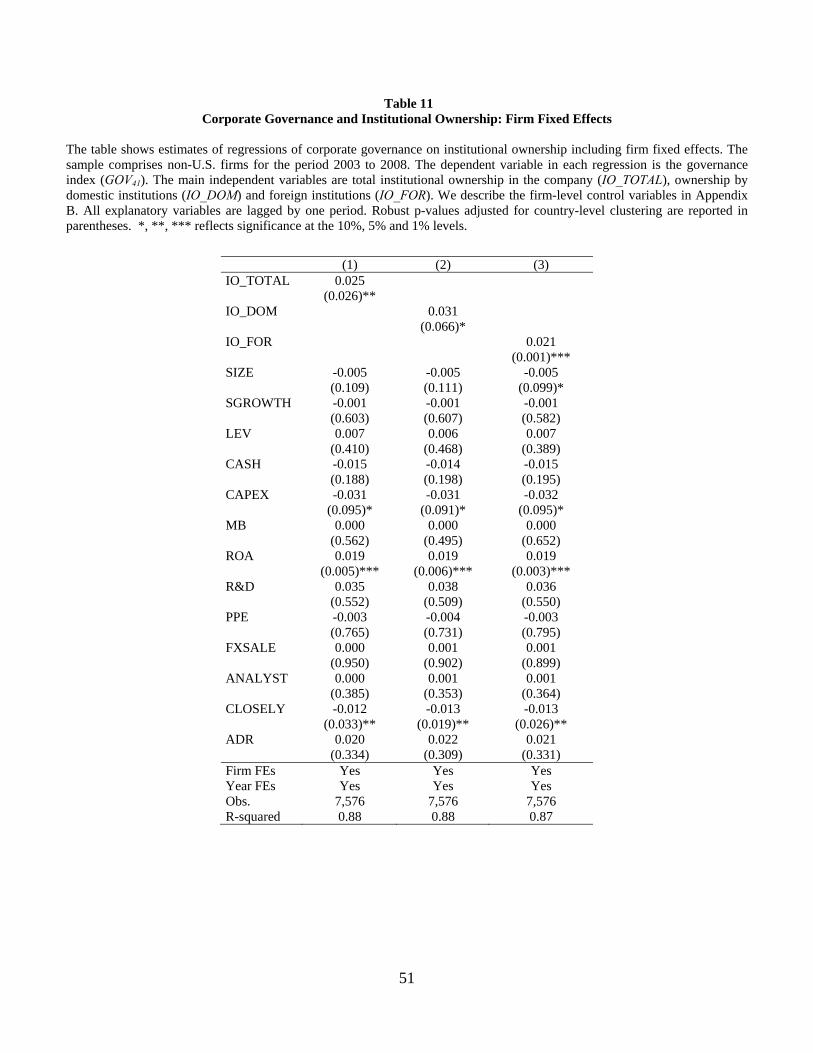
51
Table 11 Corporate Governance and Institutional Ownership: Firm Fixed Effects
The table shows estimates of regressions of corporate governance on institutional ownership including firm fixed effects. The sample comprises non-U.S. firms for the period 2003 to 2008. The dependent variable in each regression is the governance index (GOV41). The main independent variables are total institutional ownership in the company (IO_TOTAL), ownership by domestic institutions (IO_DOM) and foreign institutions (IO_FOR). We describe the firm-level control variables in Appendix B. All explanatory variables are lagged by one period. Robust p-values adjusted for country-level clustering are reported in parentheses. *, **, *** reflects significance at the 10%, 5% and 1% levels.
(1) (2) (3) IO_TOTAL 0.025 (0.026)** IO_DOM 0.031 (0.066)* IO_FOR 0.021 (0.001)*** SIZE -0.005 -0.005 -0.005 (0.109) (0.111) (0.099)* SGROWTH -0.001 -0.001 -0.001 (0.603) (0.607) (0.582) LEV 0.007 0.006 0.007 (0.410) (0.468) (0.389) CASH -0.015 -0.014 -0.015 (0.188) (0.198) (0.195) CAPEX -0.031 -0.031 -0.032 (0.095)* (0.091)* (0.095)* MB 0.000 0.000 0.000 (0.562) (0.495) (0.652) ROA 0.019 0.019 0.019 (0.005)*** (0.006)*** (0.003)*** R&D 0.035 0.038 0.036 (0.552) (0.509) (0.550) PPE -0.003 -0.004 -0.003 (0.765) (0.731) (0.795) FXSALE 0.000 0.001 0.001 (0.950) (0.902) (0.899) ANALYST 0.000 0.001 0.001 (0.385) (0.353) (0.364) CLOSELY -0.012 -0.013 -0.013 (0.033)** (0.019)** (0.026)** ADR 0.020 0.022 0.021 (0.334) (0.309) (0.331) Firm FEs Yes Yes Yes Year FEs Yes Yes Yes Obs. 7,576 7,576 7,576 R-squared 0.88 0.88 0.87
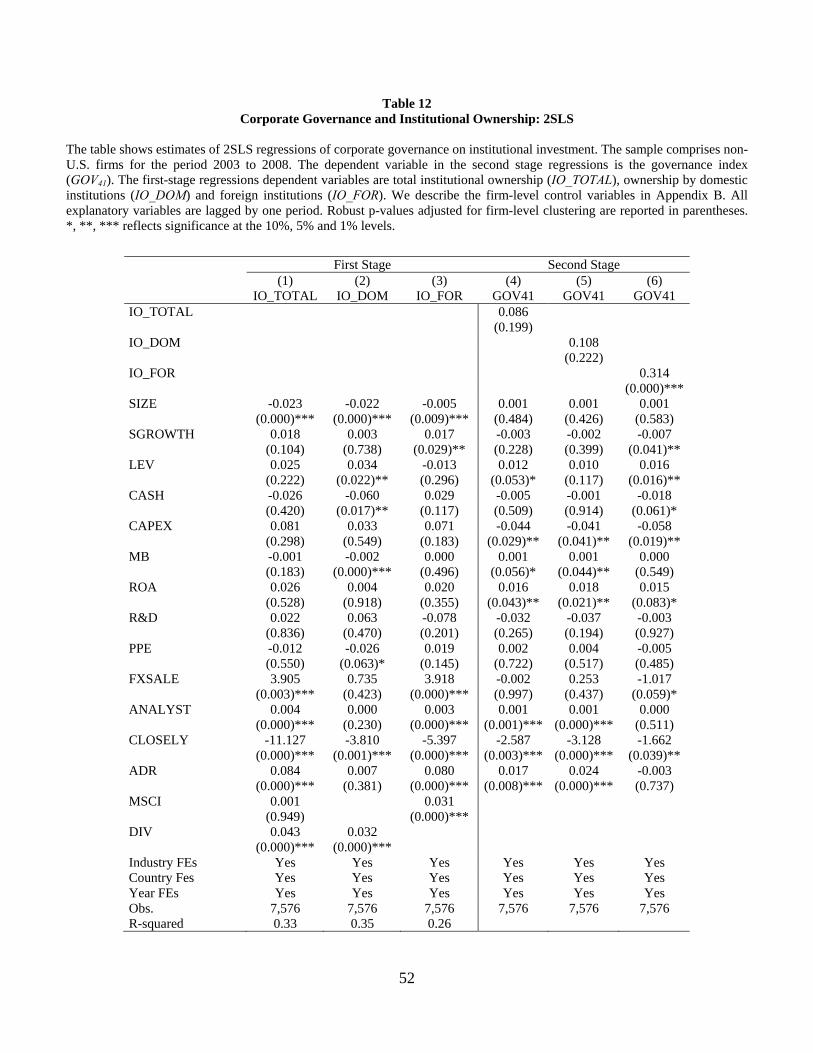
52
Table 12 Corporate Governance and Institutional Ownership: 2SLS
The table shows estimates of 2SLS regressions of corporate governance on institutional investment. The sample comprises non-U.S. firms for the period 2003 to 2008. The dependent variable in the second stage regressions is the governance index (GOV41). The first-stage regressions dependent variables are total institutional ownership (IO_TOTAL), ownership by domestic institutions (IO_DOM) and foreign institutions (IO_FOR). We describe the firm-level control variables in Appendix B. All explanatory variables are lagged by one period. Robust p-values adjusted for firm-level clustering are reported in parentheses. *, **, *** reflects significance at the 10%, 5% and 1% levels.
First Stage Second Stage (1) (2) (3) (4) (5) (6) IO_TOTAL IO_DOM IO_FOR GOV41 GOV41 GOV41 IO_TOTAL 0.086 (0.199) IO_DOM 0.108 (0.222) IO_FOR 0.314 (0.000)***SIZE -0.023 -0.022 -0.005 0.001 0.001 0.001 (0.000)*** (0.000)*** (0.009)*** (0.484) (0.426) (0.583) SGROWTH 0.018 0.003 0.017 -0.003 -0.002 -0.007 (0.104) (0.738) (0.029)** (0.228) (0.399) (0.041)** LEV 0.025 0.034 -0.013 0.012 0.010 0.016 (0.222) (0.022)** (0.296) (0.053)* (0.117) (0.016)** CASH -0.026 -0.060 0.029 -0.005 -0.001 -0.018 (0.420) (0.017)** (0.117) (0.509) (0.914) (0.061)* CAPEX 0.081 0.033 0.071 -0.044 -0.041 -0.058 (0.298) (0.549) (0.183) (0.029)** (0.041)** (0.019)** MB -0.001 -0.002 0.000 0.001 0.001 0.000 (0.183) (0.000)*** (0.496) (0.056)* (0.044)** (0.549) ROA 0.026 0.004 0.020 0.016 0.018 0.015 (0.528) (0.918) (0.355) (0.043)** (0.021)** (0.083)* R&D 0.022 0.063 -0.078 -0.032 -0.037 -0.003 (0.836) (0.470) (0.201) (0.265) (0.194) (0.927) PPE -0.012 -0.026 0.019 0.002 0.004 -0.005 (0.550) (0.063)* (0.145) (0.722) (0.517) (0.485) FXSALE 3.905 0.735 3.918 -0.002 0.253 -1.017 (0.003)*** (0.423) (0.000)*** (0.997) (0.437) (0.059)* ANALYST 0.004 0.000 0.003 0.001 0.001 0.000 (0.000)*** (0.230) (0.000)*** (0.001)*** (0.000)*** (0.511) CLOSELY -11.127 -3.810 -5.397 -2.587 -3.128 -1.662 (0.000)*** (0.001)*** (0.000)*** (0.003)*** (0.000)*** (0.039)** ADR 0.084 0.007 0.080 0.017 0.024 -0.003 (0.000)*** (0.381) (0.000)*** (0.008)*** (0.000)*** (0.737) MSCI 0.001 0.031 (0.949) (0.000)*** DIV 0.043 0.032 (0.000)*** (0.000)*** Industry FEs Yes Yes Yes Yes Yes Yes Country Fes Yes Yes Yes Yes Yes Yes Year FEs Yes Yes Yes Yes Yes Yes Obs. 7,576 7,576 7,576 7,576 7,576 7,576 R-squared 0.33 0.35 0.26

53
Table 13 Corporate Governance and Alternative Measures of Institutional Ownership
In this table, Panel A shows estimates of regressions of corporate governance on institutional ownership. The dependent variable in each regression is the governance index (GOV41). Panel B shows estimates of regressions of changes in corporate governance (ΔGOV41) from t-1 to t on changes in institutional ownership from t-2 to t-1. The main independent variables are foreign ownership by U.S. institutions (IO_FOR_US) and non-U.S. institutions (IO_FOR_NUS), ownership by independent institutions (IO_IND) and non-independent/grey institutions (IO_GREY). Regressions include the same firm-level control variables as in Table 4 for non-U.S. firms (coefficients are not shown here). All explanatory variables are lagged by one period. Robust p-values adjusted for country-level clustering are reported in parentheses. *, **, *** reflects significance at the 10%, 5% and 1% levels.
Panel A: Level Regressions (1) (2) (3) (4) (5) (6) IO_FOR_US 0.045 0.033 (0.000)*** (0.005)*** IO_FOR_NUS 0.051 0.037 (0.000)*** (0.001)*** IO_IND 0.069 0.052 (0.000)*** (0.005)*** IO_GREY 0.027 0.011 (0.002)** (0.326) Industry FEs Yes Yes Yes Yes Yes Yes Country FEs Yes Yes Yes Yes Yes Yes Year FEs Yes Yes Yes Yes Yes Yes Obs. 7,576 7,576 7,576 7,576 7,576 7,576 R-squared 0.73 0.73 0.73 0.728 0.728 0.728
Panel B: Change Regressions
(1) (2) (3) (4) ΔIO_FOR_US 0.020 (0.016)** ΔIO_FOR_NUS 0.011 (0.290) ΔIO_IND 0.037 (0.048)** ΔIO_GREY 0.015 (0.080)* Industry FEs Yes Yes Yes Yes Country FEs Yes Yes Yes Yes Year FEs Yes Yes Yes Yes Obs. 5,677 5,677 5,677 5,677 R-squared 0.20 0.20 0.20 0.20

54
Table 14 Corporate Governance and Institutional Ownership: U.S. Firms
In this table, Panel A shows estimates of regressions of corporate governance on institutional ownership. The dependent variable in each regression is the governance index (GOV41). Panel B shows estimates of regressions of changes in corporate governance (ΔGOV41) from t-1 to t on changes in institutional ownership from t-2 to t-1. The sample comprises U.S. firms during the period 2003 to 2008. The main independent variables are total institutional ownership in the company (IO_TOTAL), and ownership by domestic institutions (IO_DOM) and foreign institutions (IO_FOR). Regressions include the same firm-level control variables as in Table 4 for non-U.S. firms (coefficients are not shown here). All explanatory variables are lagged by one period. Robust p-values adjusted for industry-level clustering are reported in parentheses. *, **, *** reflects significance at the 10%, 5% and 1% levels.
Panel A: Level Regressions
(1) (2) (3) (4) IO_TOTAL 0.033 (0.000)*** IO_DOM 0.033 0.032 (0.000)*** (0.000)*** IO_FOR 0.051 0.028 (0.030)** (0.132) Industry FEs Yes Yes Yes Yes Year FEs Yes Yes Yes Yes Obs. 17,522 17,522 17,522 17,522 R-squared 0.43 0.43 0.42 0.43
Panel B: Change Regressions
(1) (2) (3) (4) ∆IO_TOTAL 0.007 (0.024)** ∆IO_DOM 0.008 0.008 (0.016)** (0.017)** ∆IO_FOR 0.008 0.006 (0.420) (0.510) Industry FEs Yes Yes Yes Yes Year FEs Yes Yes Yes Yes Obs. 13,289 13,289 13,289 13,289 R-squared 0.09 0.09 0.09 0.09

55
Appendix A: Firm-Level Governance Attributes
We separate the 41 governance attributes in the GOV41 index into four subcategories: Board, Audit, Anti-takeover Provisions, and Compensation & Ownership. The data source is RiskMetrics.
BOARD 1 All directors attended 75% of board meetings or had a valid excuse 2 CEO serves on the boards of two or fewer public companies 3 Board is controlled by more than 50% independent outside directors 4 Board size is at greater than five but less than 16 5 CEO is not listed as having a related-party transaction 6 Compensation committee composed solely of independent outsiders 7 Chairman and CEO positions are separated, or there is a lead director 8 Nominating committee composed solely of independent outsiders 9 Governance committee exists and met in the past year
10 Shareholders vote on directors selected to fill vacancies 11 Governance guidelines are publicly disclosed 12 Annually elected board (no staggered board) 13 Policy exists on outside directorships (four or fewer boards is the limit) 14 Shareholders have cumulative voting rights 15 Shareholder approval is required to increase/decrease board size 16 Majority vote requirement to amend charter/bylaws (not supermajority) 17 Board has the express authority to hire its own advisers 18 Performance of the board is reviewed regularly 19 Board-approved succession plan in place for the CEO 20 Outside directors meet without CEO and disclose number of times met 21 Directors are required to submit resignation upon a change in job 22 Board cannot amend bylaws without shareholder approval or can do so only under limited circumstances 23 Does not ignore shareholder proposal 24 Qualifies for proxy contest defenses combination points
AUDIT
25 Consulting fees paid to auditors are less than audit fees paid to auditors 26 Audit committee composed solely of independent outsiders 27 Auditors ratified at most recent annual meeting
ANTI-TAKEOVER PROVISIONS
28 Single class, common 29 Majority vote requirement to approve mergers (not supermajority) 30 Shareholders may call special meetings 31 Shareholders may act by written consent 32 Company either has no poison pill or a pill that is shareholder approved. 33 Company is not authorized to issue blank check preferred
COMPENSATION & OWNERSHIP
34 Directors are subject to stock ownership requirements 35 Executives are subject to stock ownership guidelines 36 No interlocks among compensation committee members 37 Directors receive all or a portion of their fees in stock 38 All stock-incentive plans adopted with shareholder approval 39 Options grants align with company performance and reasonable burn rate 40 Officers’ and directors’ stock ownership is at least 1% but not over 30% of total shares outstanding 41 Repricing prohibited

56
Appendix B: Variables Definitions
Variable Definition
Total institutional ownership IO_TOTAL Holdings (end-of-year) by all institutions, expressed as a percentage of market capitalization (FactSet/LionShares)
Domestic institutional ownership IO_DOM Holdings (end-of-year) by institutions located in the same country in which the stock is issued, expressed as a percentage of market capitalization (FactSet/LionShares)
Foreign institutional ownership IO_FOR Holdings (end-of-year) by institutions located in a different country from the where the stock is issued, expressed as a percentage of market capitalization (FactSet/LionShares)
Common-law institutional ownership IO_COMMON Holdings (end-of-year) by institutions located in common-law countries, expressed as a percentage of market capitalization (FactSet/LionShares)
Civil-law institutional ownership IO_CIVIL Holdings (end-of-year) by institutions located in civil-law countries, expressed as a percentage of market capitalization (FactSet/LionShares)
U.S. foreign institutional ownership IO_FOR_US Holdings (end-of-year) by U.S. institutions, expressed as a percentage of market capitalization (FactSet/LionShares)
Non-U.S. foreign institutional ownership IO_FOR_NUS Holdings (end-of-year) by non-U.S. institutions, expressed as a percentage of market capitalization (FactSet/LionShares)
Independent institutional ownership IO_IND Institutional ownership by independent institutions (mutual funds and independent investment advisers) , expressed as a percentage of market capitalization (FactSet/LionShares)
Grey institutional ownership IO_GREY Institutional ownership by grey institutions (bank trusts, insurance companies, and other institutions), expressed as a percentage of market capitalization (FactSet/LionShares)
Firm size SIZE Log of total assets in thousands of U.S. dollars (WS 02999)
Sales growth SGROWTH Two-year geometric average of annual growth rate in net sales in U.S. dollars (WS 01001)
Leverage LEV Total debt (WS 03255) divided by total assets (WS 02999)
Cash CASH Cash and short term investments (WS 02001) divided by total assets (WS 02999)
Capital expenditures CAPEX Capital expenditures (WS 04601) divided by total assets (WS 02999)
Market-to-book MB Market value of equity (WS 08001) divided by book value of equity (WS 03501)
Return on assets ROA Ratio of net income before extraordinary items (WS 01551) plus interest expenses (WS 01151) to total assets (WS 02999)
Research & development expenditures R&D Research and development expenditures (WS 01201) divided by total assets (WS 02999)
Property, plant and equipment PPE Property, plant and equipment (WS 02501) divided by total assets (WS 02999)
Foreign sales FXSALE International annual net sales (WS 07101) as a proportion of net sales (WS 01001)

57
Variable Definition
Insider ownership CLOSELY Number of shares held by insiders (shareholders who hold 5% or more of the outstanding shares, such as officers and directors and immediate families, other corporations or individuals), expressed as a proportion of the number of shares outstanding (WS 08021)
Cross-listing dummy ADR U.S. cross-listing dummy, equal to one if a firm is cross-listed on a U.S. exchange through a level 2-3 ADR (source: major depository institutions) or direct listing of ordinary shares (U.S. stock exchanges), and zero otherwise.
Analyst coverage ANALYST Number of analysts following a firm (IBES)
Tobin’s Q Q Total assets (WS 02999) plus market value of equity (WS 08001) minus book value of equity (WS 03501) divided by total assets (WS 02999)
Dividend payment Dummy DIV Dummy that equals one if total cash dividends (WS item 04551) are positive, zero otherwise
MSCI member dummy MSCI MSCI member dummy, equal to one if a firm is a member of the MSCI All-country World Index, and zero otherwise.
Abnormal stock return ABNORMAL_RET Annual stock return minus the stock market index return of the country where the firm is located (DS)