Does chewing gum have an impact on student performance...
13
Does chewing gum have an impact on student performance? : An analysis of quiz grades Abstract: In this paper, we will discuss the results of an experiment measuring whether chewing gum during a quiz impacts student quiz grades. We found that there was no significant difference between the average scores of students who chewed gum during the quiz versus those who didn’t chew gum. Logan Kramer Dual Credit Statistics with Mr. Crow Period 0B 5/20/16 2016-2017 Final Project
Transcript of Does chewing gum have an impact on student performance...

Does chewing gum have an impact on student performance? : An analysis of quiz grades
Abstract: In this paper, we will discuss the results of an experiment measuring
whether chewing gum during a quiz impacts student quiz grades. We found that there was no significant difference between the average scores of students who
chewed gum during the quiz versus those who didn’t chew gum.
Logan Kramer
Dual Credit Statistics with Mr. Crow
Period 0B
5/20/16
2016-2017 Final Project
Table of Contents
Table of Contents ............................................................................. 2 Analysis ............................................................................................... 3 Introduction ........................................................................................................................................................... 3 Body ........................................................................................................................................................................... 3 Conclusion ............................................................................................................................................................... 5 Graphics ............................................................................................... 6 Works Cited ....................................................................................... 8 Appendices ......................................................................................... 8 Appendix A: R Code and Output Used for Analysis ............................................................................... 8 Appendix B: Website Link ................................................................................................................................ 9 Appendix C: Bellringer Quiz ............................................................................................................................ 9 Appendix D: Raw Collected Data ................................................................................................................ 12

Analysis
Introduction
Students sit at school for 7-8 hours a day, often detached from their surroundings as they
struggle to pay attention. The act of chewing gum has been proven to stimulate brain activity,
and Dr. Serge Onyper found in recent studies that chewing gum before a cognitive test will
improve performance for the first few minutes of testing. Additionally other studies have found
that chewing gum impacts students later in an activity that requires concentration. One study
found that chewing gum lowered reaction time and increased correct answers on a concentration
assessment which required the use of short-term memory (Morgan, et al.). Thus, I was interested
in discovering whether chewing gum, and the increased brain activity which comes with it, could
help students better perform on a quiz. Though other studies focused on concentration tests and
relied on the chewing of gum occurring before any assessment began, I hoped to research the
short-term effects chewing gum could have on student performance. My hypothesis was that
student grades would be dependent on whether or not a student chewed gum. If this hypothesis
proved to be true, it could have important implications for students because those who easily lose
focus or have trouble on assessments could perform better by simply chewing mint gum.
Body In order to conduct this experiment, I worked with the five pre-AP biology classes taught
by Ms. Hutson at LASA High School. These classes had a total of 126 students, who I tested
over the course of two days while they all took identical bellringer quizzes. (The quiz can be
found attached as Appendix B.) The students were given the option to opt out of the study at any
point. After eliminating absent students and those who opted out, there were 111 total
participants in the survey. I assigned each student a unique “student number” to ensure that their
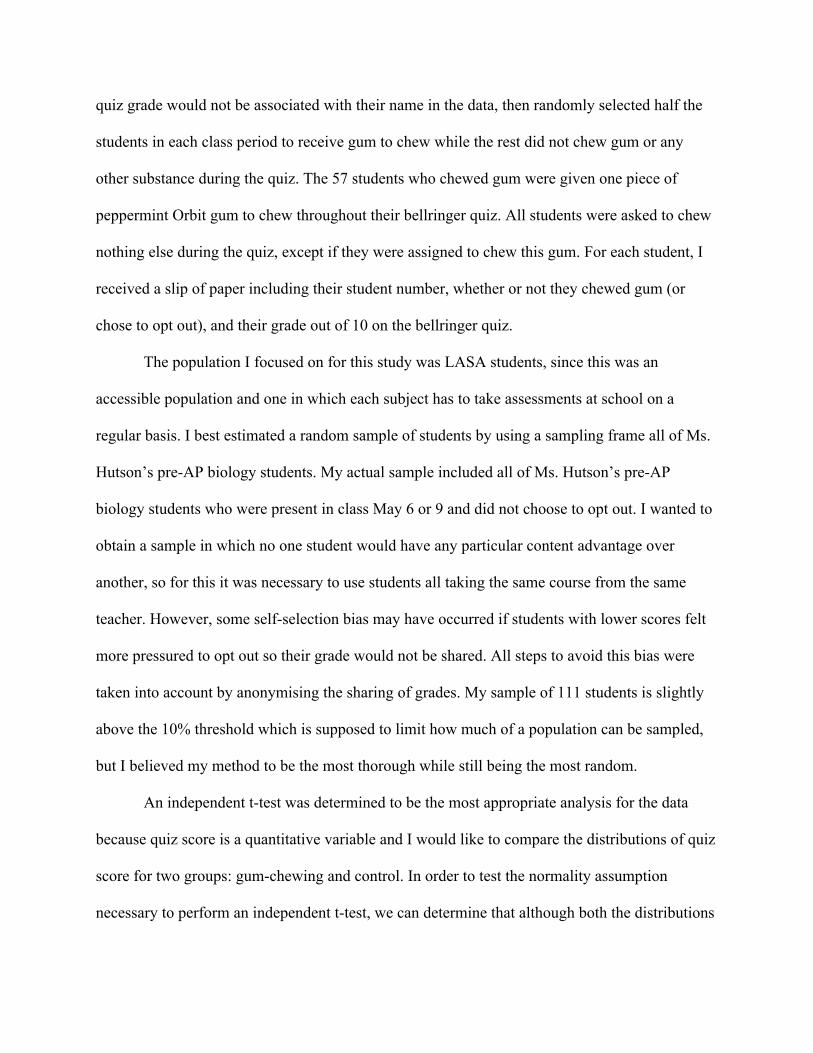
quiz grade would not be associated with their name in the data, then randomly selected half the
students in each class period to receive gum to chew while the rest did not chew gum or any
other substance during the quiz. The 57 students who chewed gum were given one piece of
peppermint Orbit gum to chew throughout their bellringer quiz. All students were asked to chew
nothing else during the quiz, except if they were assigned to chew this gum. For each student, I
received a slip of paper including their student number, whether or not they chewed gum (or
chose to opt out), and their grade out of 10 on the bellringer quiz.
The population I focused on for this study was LASA students, since this was an
accessible population and one in which each subject has to take assessments at school on a
regular basis. I best estimated a random sample of students by using a sampling frame all of Ms.
Hutson’s pre-AP biology students. My actual sample included all of Ms. Hutson’s pre-AP
biology students who were present in class May 6 or 9 and did not choose to opt out. I wanted to
obtain a sample in which no one student would have any particular content advantage over
another, so for this it was necessary to use students all taking the same course from the same
teacher. However, some self-selection bias may have occurred if students with lower scores felt
more pressured to opt out so their grade would not be shared. All steps to avoid this bias were
taken into account by anonymising the sharing of grades. My sample of 111 students is slightly
above the 10% threshold which is supposed to limit how much of a population can be sampled,
but I believed my method to be the most thorough while still being the most random.
An independent t-test was determined to be the most appropriate analysis for the data
because quiz score is a quantitative variable and I would like to compare the distributions of quiz
score for two groups: gum-chewing and control. In order to test the normality assumption
necessary to perform an independent t-test, we can determine that although both the distributions
of gum-chewing and non-gum-chewing grades are certainly not normal, both have n>30, so the
normality assumption is met. We assume a random sample given that my population is all
students, and one teacher’s five classes at LASA should give a somewhat accurate representation
of the population as a whole. The samples are independent of one another because each student
either chewed gum or did not, so there is no overlap. Additionally, each test subject was
independent of one another because one student’s grade had no effect on any other students’
grades. With all of these assumptions met, an independent t-test could be performed.
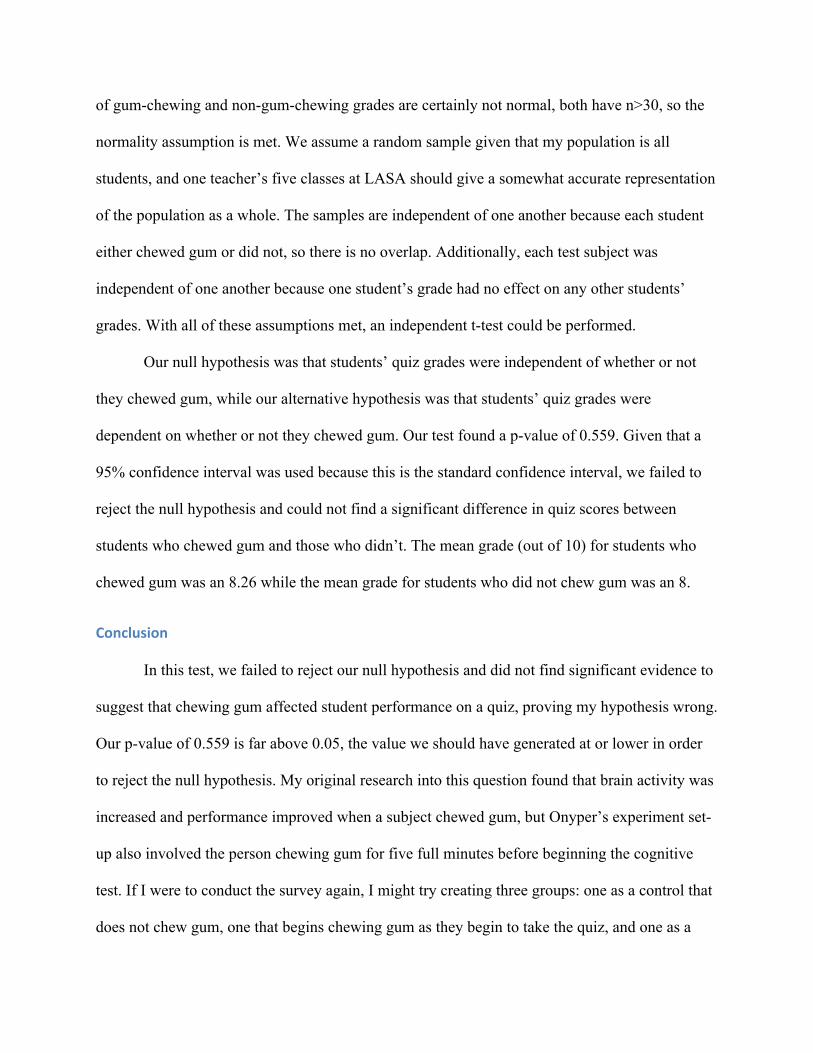
Our null hypothesis was that students’ quiz grades were independent of whether or not
they chewed gum, while our alternative hypothesis was that students’ quiz grades were
dependent on whether or not they chewed gum. Our test found a p-value of 0.559. Given that a
95% confidence interval was used because this is the standard confidence interval, we failed to
reject the null hypothesis and could not find a significant difference in quiz scores between
students who chewed gum and those who didn’t. The mean grade (out of 10) for students who
chewed gum was an 8.26 while the mean grade for students who did not chew gum was an 8.
Conclusion
In this test, we failed to reject our null hypothesis and did not find significant evidence to
suggest that chewing gum affected student performance on a quiz, proving my hypothesis wrong.
Our p-value of 0.559 is far above 0.05, the value we should have generated at or lower in order
to reject the null hypothesis. My original research into this question found that brain activity was
increased and performance improved when a subject chewed gum, but Onyper’s experiment set-
up also involved the person chewing gum for five full minutes before beginning the cognitive
test. If I were to conduct the survey again, I might try creating three groups: one as a control that
does not chew gum, one that begins chewing gum as they begin to take the quiz, and one as a

group which gets the gum five minutes before they begin the quiz to see if there is any
significant difference between these groups. I would also consider doing this experiment with a
test graded on a 100 point scale, because a quiz on a 10 point scale with no grades in between
whole numbers gave less range in scores. However, the experiment set-up generally worked very
well and it was interesting to note that there is not enough evidence to prove a relationship
between chewing gum and grade on a quiz.
Graphics Figure A: The right-skewed distribution of grades of students who chewed gum during their quiz
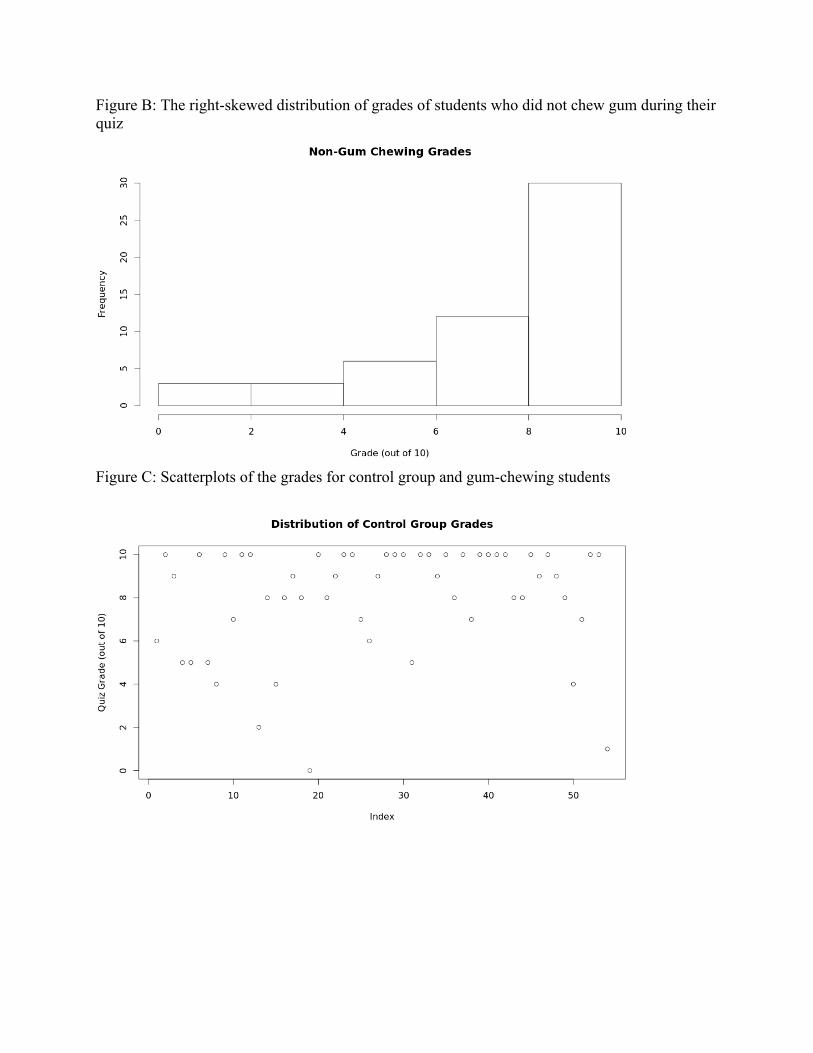
Figure B: The right-skewed distribution of grades of students who did not chew gum during their quiz
Figure C: Scatterplots of the grades for control group and gum-chewing students

Works Cited Morgan, Kate, Andrew J. Johnson, and Christopher Miles. "Chewing Gum Helps You
Concentrate for Longer." The British Psychological Society, 3 Aug. 2013. Web. 19 May 2016. <http://www.bps.org.uk/news/chewing-gum-helps-you-concentrate-longer>.
Onyper, Serge V., Timothy L. Carr, John S. Farrar, and Brittney R. Floyd. "Cognitive
Advantages of Chewing Gum. Now You See Them, Now You Don’t." Appetite 57.2 (2011): 321-28. PubMed.gov. Web. 6 May 2016.
Appendices
Appendix A: R Code and Output Used for Analysis > ###Final Project Code### > > #Eliminate rows where grade equals NA > project <- proj[-c(14, 15, 21, 33, 60, 70, 71, 72, 77, 84, 86, 88, 90, 112, 118),] > > #Make vectors for gum chewing and non-gum chewing groups' grades > gum_grade <- project$Grade[project$Gum == 1] > nogum_grade <- project$Grade[project$Gum == 0] > > # Check the normality assumption > hist(gum_grade,xlab = 'Grade (out of 10)', main = 'Gum Chewing Grades') > hist(nogum_grade,xlab = 'Grade (out of 10)', main = 'Non-Gum Chewing Grades') > > # Run independent t-test

> t.test(gum_grade,nogum_grade) Welch Two Sample t-test data: gum_grade and nogum_grade t = 0.5855, df = 104.064, p-value = 0.5594 alternative hypothesis: true difference in means is not equal to 0 95 percent confidence interval: -0.628054 1.154370 sample estimates: mean of x mean of y 8.263158 8.000000
Appendix B: Website Link http://www.gumstatsproject.weebly.com This website features my report as well as additional information about my analysis.
Appendix C: Bellringer Quiz This is the 10-question quiz administered for the survey.

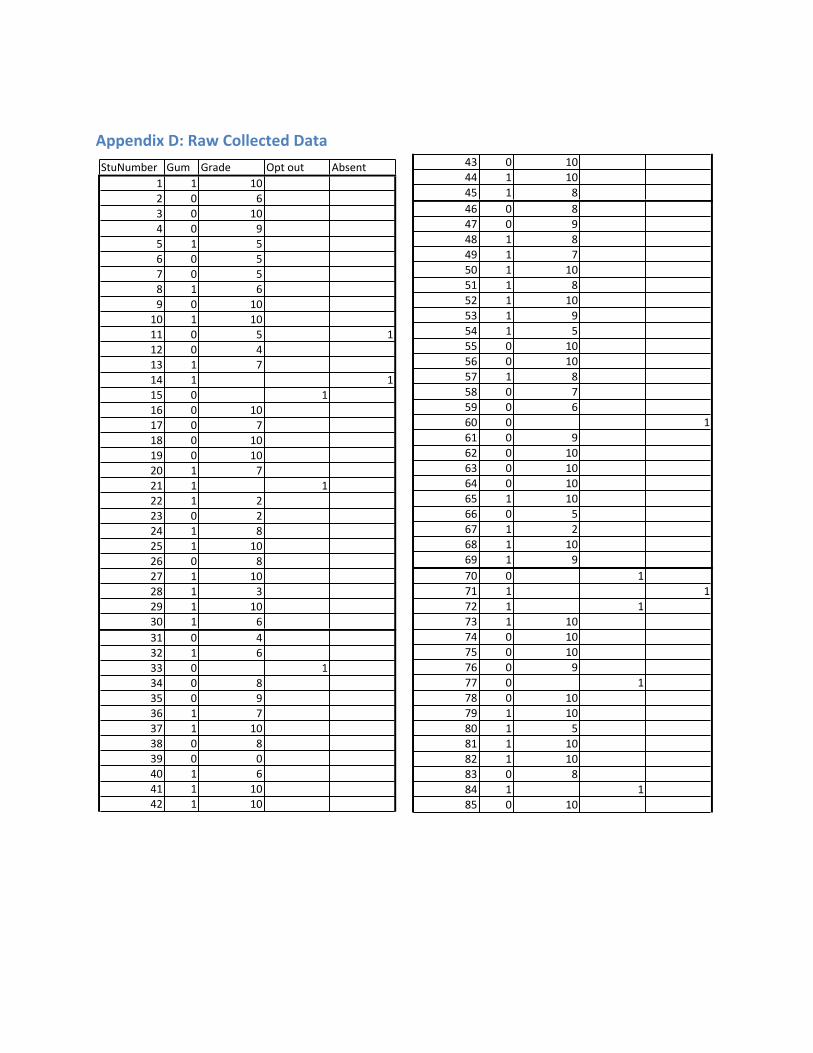
Appendix D: Raw Collected Data 43 0 1044 1 1045 1 846 0 847 0 948 1 849 1 750 1 1051 1 852 1 1053 1 954 1 555 0 1056 0 1057 1 858 0 759 0 660 0 161 0 962 0 1063 0 1064 0 1065 1 1066 0 567 1 268 1 1069 1 970 0 171 1 172 1 173 1 1074 0 1075 0 1076 0 977 0 178 0 1079 1 1080 1 581 1 1082 1 1083 0 884 1 185 0 10
StuNumber Gum Grade Opt.out Absent1 1 102 0 63 0 104 0 95 1 56 0 57 0 58 1 69 0 1010 1 1011 0 5 112 0 413 1 714 1 115 0 116 0 1017 0 718 0 1019 0 1020 1 721 1 122 1 223 0 224 1 825 1 1026 0 827 1 1028 1 329 1 1030 1 631 0 432 1 633 0 134 0 835 0 936 1 737 1 1038 0 839 0 040 1 641 1 1042 1 10
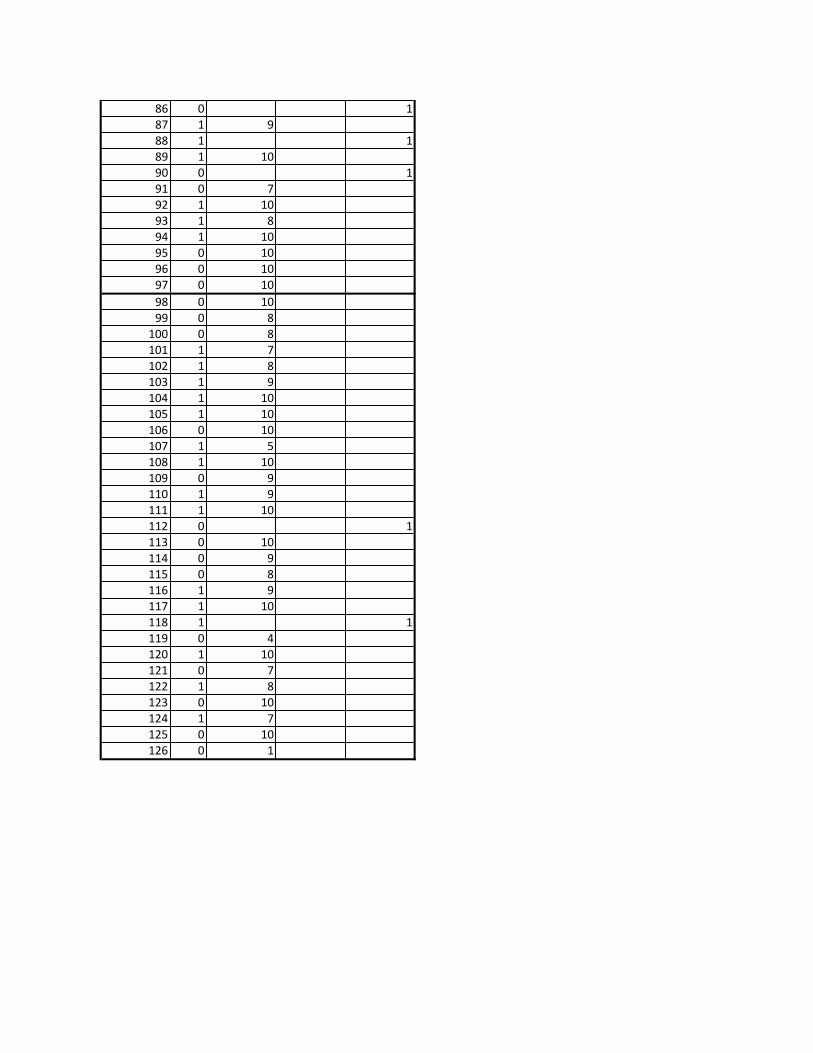
86 0 187 1 988 1 189 1 1090 0 191 0 792 1 1093 1 894 1 1095 0 1096 0 1097 0 1098 0 1099 0 8
100 0 8101 1 7102 1 8103 1 9104 1 10105 1 10106 0 10107 1 5108 1 10109 0 9110 1 9111 1 10112 0 1113 0 10114 0 9115 0 8116 1 9117 1 10118 1 1119 0 4120 1 10121 0 7122 1 8123 0 10124 1 7125 0 10126 0 1