Does board gender diversity affect renewable energy ...
29
Journal of Corporate Finance 66 (2021) 101665 Available online 6 June 2020 0929-1199/© 2020 The Authors. Published by Elsevier B.V. This is an open access article under the CC BY license (http://creativecommons.org/licenses/by/4.0/). Does board gender diversity affect renewable energy consumption? Muhammad Atif a , Mohammed Hossain b , Md Samsul Alam c , Marc Goergen d, e, * a Department of Accounting and Corporate Governance, Macquarie University, Sydney, Australia b College of Business Administration, Gulf University for Science and Technology, West Mishref, Hawalli, Kuwait c Leicester Castle Business School, De Montfort University, Leicester, UK d IE Business School, IE University, Madrid, Spain e European Corporate Governance Institute, Brussels, Belgium A R T I C L E INFO JEL codes: G30 G34 Keywords: Corporate governance Renewable energy GBoard gender diversity Corporate social responsibility Environmental protection Global warming ABSTRACT This paper examines the effect of board gender diversity on renewable energy consumption. Using a panel of 11,677 firm-year observations from the USA for 2008–2016, we find a positive rela- tionship between board gender diversity and renewable energy consumption. Moreover, boards require two or more women for women to have a significant impact on renewable energy con- sumption, consistent with the critical mass theory. Further, we document that the positive impact of female directors on renewable energy consumption stems from female independent rather than female executive directors. Finally, we find a positive effect of the interaction between renewable energy consumption and board gender diversity on firm financial performance. Our findings are robust to different identification strategies and estimation techniques. 1. Introduction Climate change, caused by the rapid rise in carbon dioxide (CO 2 ) emissions from fossil fuel combustion, 1 has emerged as one of the grand challenges for society (IPCC, 2007). To reduce such emissions, it is imperative to substitute clean or renewable energy for fossil energy (Lash and Wellington, 2007; Ben-Amar et al., 2017). 2 However, the increase in the share of renewable energy in the total energy mix largely depends on the efforts of firms, since they consume significant amounts of energy and generate a substantial percentage of * Corresponding author at: IE Business School, IE University, Madrid, Spain. E-mail addresses: [email protected] (M. Atif), [email protected] (M. Hossain), [email protected] (M.S. Alam), marc. [email protected] (M. Goergen). 1 Since the industrial revolution, CO 2 emissions from fossil fuel combustion have increased rapidly from almost zero to 33 Giga tons (Gt) in 2017 (IEA, 2019). Specifically, the consumption of fossil energy, such as coal, oil, and natural gas, has been shown to account for 99.3% of global CO 2 emissions in 2017. Hence, the consumption of traditional energy represents an alarming environmental issue (Bang et al., 2000; Alam et al., 2019). 2 Renewable energy sources include solar energy, wind, falling water, the heat of the earth (geothermal energy), plant materials (biomass), waves, ocean currents, temperature differences in the oceans, and the energy of the tides (Owusu and Asumadu-Sarkodie, 2016) that deliver low carbon energy (United Nations’ 21st Conference of the Parties (COP21), 2015). Contents lists available at ScienceDirect Journal of Corporate Finance journal homepage: www.elsevier.com/locate/jcorpfin https://doi.org/10.1016/j.jcorpfin.2020.101665 Received 27 August 2018; Received in revised form 29 May 2020; Accepted 31 May 2020
Transcript of Does board gender diversity affect renewable energy ...

Journal of Corporate Finance 66 (2021) 101665
Available online 6 June 20200929-1199/© 2020 The Authors. Published by Elsevier B.V. This is an open access article under the CC BY license(http://creativecommons.org/licenses/by/4.0/).
Does board gender diversity affect renewable energy consumption?
Muhammad Atif a, Mohammed Hossain b, Md Samsul Alam c, Marc Goergen d,e,*
a Department of Accounting and Corporate Governance, Macquarie University, Sydney, Australia b College of Business Administration, Gulf University for Science and Technology, West Mishref, Hawalli, Kuwait c Leicester Castle Business School, De Montfort University, Leicester, UK d IE Business School, IE University, Madrid, Spain e European Corporate Governance Institute, Brussels, Belgium
A R T I C L E I N F O
JEL codes: G30 G34
Keywords: Corporate governance Renewable energy GBoard gender diversity Corporate social responsibility Environmental protection Global warming
A B S T R A C T
This paper examines the effect of board gender diversity on renewable energy consumption. Using a panel of 11,677 firm-year observations from the USA for 2008–2016, we find a positive rela-tionship between board gender diversity and renewable energy consumption. Moreover, boards require two or more women for women to have a significant impact on renewable energy con-sumption, consistent with the critical mass theory. Further, we document that the positive impact of female directors on renewable energy consumption stems from female independent rather than female executive directors. Finally, we find a positive effect of the interaction between renewable energy consumption and board gender diversity on firm financial performance. Our findings are robust to different identification strategies and estimation techniques.
1. Introduction
Climate change, caused by the rapid rise in carbon dioxide (CO2) emissions from fossil fuel combustion,1 has emerged as one of the grand challenges for society (IPCC, 2007). To reduce such emissions, it is imperative to substitute clean or renewable energy for fossil energy (Lash and Wellington, 2007; Ben-Amar et al., 2017).2 However, the increase in the share of renewable energy in the total energy mix largely depends on the efforts of firms, since they consume significant amounts of energy and generate a substantial percentage of
* Corresponding author at: IE Business School, IE University, Madrid, Spain. E-mail addresses: [email protected] (M. Atif), [email protected] (M. Hossain), [email protected] (M.S. Alam), marc.
[email protected] (M. Goergen). 1 Since the industrial revolution, CO2 emissions from fossil fuel combustion have increased rapidly from almost zero to 33 Giga tons (Gt) in 2017
(IEA, 2019). Specifically, the consumption of fossil energy, such as coal, oil, and natural gas, has been shown to account for 99.3% of global CO2 emissions in 2017. Hence, the consumption of traditional energy represents an alarming environmental issue (Bang et al., 2000; Alam et al., 2019).
2 Renewable energy sources include solar energy, wind, falling water, the heat of the earth (geothermal energy), plant materials (biomass), waves, ocean currents, temperature differences in the oceans, and the energy of the tides (Owusu and Asumadu-Sarkodie, 2016) that deliver low carbon energy (United Nations’ 21st Conference of the Parties (COP21), 2015).
Contents lists available at ScienceDirect
Journal of Corporate Finance
journal homepage: www.elsevier.com/locate/jcorpfin
https://doi.org/10.1016/j.jcorpfin.2020.101665 Received 27 August 2018; Received in revised form 29 May 2020; Accepted 31 May 2020
Journal of Corporate Finance 66 (2021) 101665
2
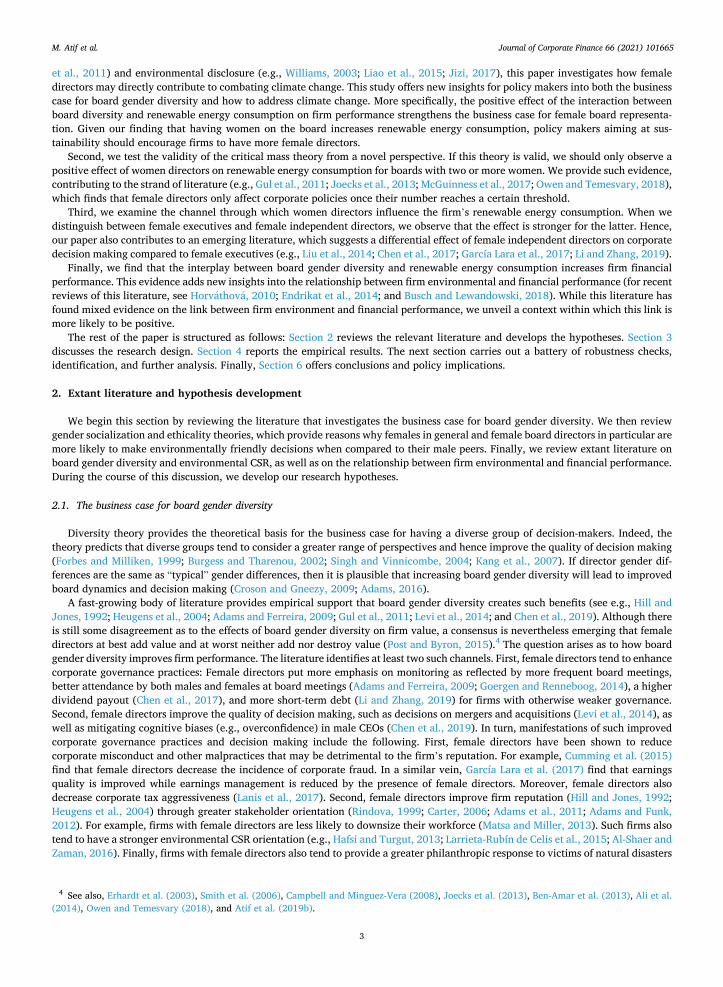
total greenhouse gases emitted into the atmosphere.3 The question that arises is whether there is a business case for firms playing a role in environmental activities, including tackling climate change. As it stands, the literature is as yet inconclusive as to the link between environmental performance and financial performance. Nevertheless, recent meta-analytical reviews of the literature (Horvathova, 2010; Endrikat et al., 2014; and Busch and Lewandowski, 2018) suggest that typically the link between the two is a positive one and our study contributes to this stream by identifying a context in which this link is more likely to be positive. Importantly, for businesses the decision to consume renewable energy hinges – at least to some extent – on the board of directors, i.e., the firm’s main governance body (Hill and Jones, 1992; Prado-Lorenzo and Garcia-Sanchez, 2010; Borghesi et al., 2014). In turn, female directors have been shown to be more concerned about societal issues, including environmental concerns (e.g. Liu, 2018). Hence, female directors are more likely to advocate the use of renewable energy, which may then also improve financial performance.
Why would female directors be more concerned about global warming? Women have been shown to be more caring and ethically sensitive. This includes a greater emphasis on corporate social responsibility (CSR) (Shaukat et al., 2016) as well as the reduction in negative business practices (Boulouta, 2013; Cumming et al., 2015) and related lawsuits (Liu, 2018). Women are also more likely to support environmental protection and to adopt pro-environmental behaviors (McCright and Xiao, 2014; Kennedy and Dzialo, 2015). With direct relevance to our paper, perceptions of gender differences in energy choices are significant because women tend to favor ‘soft’ energies (i.e., renewables) and men ‘hard’ energies (i.e., fossil fuel and nuclear energy) (Longstreth et al., 1989). Importantly, recent research suggests that female leadership encourages tackling global warming as reflected by the move toward energy efficiency and green building, as well as the implementation of climate change policies. Hence, we expect that women play a key role on corporate boards in promoting renewable energy consumption. This paper contributes to the literature on board gender diversity and environmental CSR (e.g., Boulouta, 2013; Jia and Zhang, 2013; McGuinness et al., 2017; Liu, 2018) by examining a unique new angle of environmental CSR, i.e., renewable energy consumption, which has not been examined before.
To the best of our knowledge, this is the first study investigating the impact of board gender diversity on firms’ renewable energy consumption. We investigate this issue by attempting to answer two important questions. Do women on the board affect the firm’s renewable energy consumption? Does the interplay between renewable energy consumption and board gender diversity have an impact on firm financial performance? We proceed by investigating a panel of data consisting of 1491 firms for the period of 2008–2016, amounting to 11,677 firm-year observations from the USA. We find that renewable energy consumption is positively related to the percentage of women on the board as well as their number. Nevertheless, there needs to be a critical mass of women (Kristie, 2011) as the effect is only observed if there are at least two women on the board. The effect is more pronounced for female independent (outside) directors than for female executive (inside) directors. This result is intuitive given the monitoring and advisory roles of independent directors. Moreover, while both the literature on the performance effect of female directors and the literature on the link between environmental CSR and financial performance are still somewhat inconclusive, we find a positive effect of the interaction of board gender diversity and renewable energy consumption on firm financial performance. This suggests that the presence of female directors and the greater use of renewable energy jointly enhance firm value more than each of the two in isolation. Finally, our results are robust to the use of alternative econometric specifications, as well as alternative measures for renewable energy, firm financial performance, and the presence of women on the board.
Unsurprisingly, our study is subject to endogeneity concerns as omitted variables may drive the positive association between women on the board and renewable energy consumption. For example, male directors responsive to environmental concerns may also be more open to calls for greater board gender diversity. This would suggest correlation between female board representation and renewable energy consumption rather than causality. We employ three identification strategies to address endogeneity concerns. First, we implement the instrumental variable (IV) approach to extract the exogenous component from the percentage of women on the board. We confirm the positive association between women on the board and renewable energy consumption. Second, we employ propensity score matching (PSM) to identify firms with two or more female directors, which are indistinguishable from firms with less than two female directors. Post-matching, we still find that the presence of two or more women on the board is positively associated with renewable energy consumption. Third, we perform a difference-in-differences (DID) analysis to investigate the change in renewable energy consumption around female director appointments (the treatment group) compared with the equivalent change around male director appointments (the control group), with both types of appointments replacing an incumbent male director. Further, to ensure that we compare like with like, we match the observations for the treatment group with observations for the control group using propensity score matching. We find that renewable energy consumption is higher one year after the appointment of a female director than one year after the appointment of a male director. In a nutshell, our identification strategies indicate that board gender diversity has a positive causal effect on renewable energy consumption.
Our paper makes four important contributions to the literature on board gender diversity and firms’ environmental performance. First, to the best of our knowledge, this is the first study investigating the relationship between board gender diversity and renewable energy consumption. The findings of this study have important implications for both academic research and policy making. From an academic perspective, the study contributes to the literature on board gender diversity and environmental CSR (e.g., Boulouta, 2013; Jia and Zhang, 2013; McGuinness et al., 2017; Liu, 2018) by investigating the link between board gender diversity and renewable energy consumption. While extant literature tends to focus on the impact of female directors on environmental CSR ratings (e.g., Post
3 The Environmental Protection Agency (EPA) estimates that in 2018 industry accounted for a total of 22% of greenhouse gas emissions (CO2 emissions accounted for 81% of greenhouse gases) in the USA. Agriculture was responsible for 10%, whereas transportation (which includes cars run by households) caused 28% of emissions. The production of electricity generated 27% of the greenhouse gases whereas commercial property and residential homes accounted for the remainder, i.e., 12% (EPA, 2020).
M. Atif et al.
Journal of Corporate Finance 66 (2021) 101665
3
et al., 2011) and environmental disclosure (e.g., Williams, 2003; Liao et al., 2015; Jizi, 2017), this paper investigates how female directors may directly contribute to combating climate change. This study offers new insights for policy makers into both the business case for board gender diversity and how to address climate change. More specifically, the positive effect of the interaction between board diversity and renewable energy consumption on firm performance strengthens the business case for female board representa-tion. Given our finding that having women on the board increases renewable energy consumption, policy makers aiming at sus-tainability should encourage firms to have more female directors.
Second, we test the validity of the critical mass theory from a novel perspective. If this theory is valid, we should only observe a positive effect of women directors on renewable energy consumption for boards with two or more women. We provide such evidence, contributing to the strand of literature (e.g., Gul et al., 2011; Joecks et al., 2013; McGuinness et al., 2017; Owen and Temesvary, 2018), which finds that female directors only affect corporate policies once their number reaches a certain threshold.
Third, we examine the channel through which women directors influence the firm’s renewable energy consumption. When we distinguish between female executives and female independent directors, we observe that the effect is stronger for the latter. Hence, our paper also contributes to an emerging literature, which suggests a differential effect of female independent directors on corporate decision making compared to female executives (e.g., Liu et al., 2014; Chen et al., 2017; García Lara et al., 2017; Li and Zhang, 2019).
Finally, we find that the interplay between board gender diversity and renewable energy consumption increases firm financial performance. This evidence adds new insights into the relationship between firm environmental and financial performance (for recent reviews of this literature, see Horvathova, 2010; Endrikat et al., 2014; and Busch and Lewandowski, 2018). While this literature has found mixed evidence on the link between firm environment and financial performance, we unveil a context within which this link is more likely to be positive.
The rest of the paper is structured as follows: Section 2 reviews the relevant literature and develops the hypotheses. Section 3 discusses the research design. Section 4 reports the empirical results. The next section carries out a battery of robustness checks, identification, and further analysis. Finally, Section 6 offers conclusions and policy implications.
2. Extant literature and hypothesis development
We begin this section by reviewing the literature that investigates the business case for board gender diversity. We then review gender socialization and ethicality theories, which provide reasons why females in general and female board directors in particular are more likely to make environmentally friendly decisions when compared to their male peers. Finally, we review extant literature on board gender diversity and environmental CSR, as well as on the relationship between firm environmental and financial performance. During the course of this discussion, we develop our research hypotheses.
2.1. The business case for board gender diversity
Diversity theory provides the theoretical basis for the business case for having a diverse group of decision-makers. Indeed, the theory predicts that diverse groups tend to consider a greater range of perspectives and hence improve the quality of decision making (Forbes and Milliken, 1999; Burgess and Tharenou, 2002; Singh and Vinnicombe, 2004; Kang et al., 2007). If director gender dif-ferences are the same as “typical” gender differences, then it is plausible that increasing board gender diversity will lead to improved board dynamics and decision making (Croson and Gneezy, 2009; Adams, 2016).
A fast-growing body of literature provides empirical support that board gender diversity creates such benefits (see e.g., Hill and Jones, 1992; Heugens et al., 2004; Adams and Ferreira, 2009; Gul et al., 2011; Levi et al., 2014; and Chen et al., 2019). Although there is still some disagreement as to the effects of board gender diversity on firm value, a consensus is nevertheless emerging that female directors at best add value and at worst neither add nor destroy value (Post and Byron, 2015).4 The question arises as to how board gender diversity improves firm performance. The literature identifies at least two such channels. First, female directors tend to enhance corporate governance practices: Female directors put more emphasis on monitoring as reflected by more frequent board meetings, better attendance by both males and females at board meetings (Adams and Ferreira, 2009; Goergen and Renneboog, 2014), a higher dividend payout (Chen et al., 2017), and more short-term debt (Li and Zhang, 2019) for firms with otherwise weaker governance. Second, female directors improve the quality of decision making, such as decisions on mergers and acquisitions (Levi et al., 2014), as well as mitigating cognitive biases (e.g., overconfidence) in male CEOs (Chen et al., 2019). In turn, manifestations of such improved corporate governance practices and decision making include the following. First, female directors have been shown to reduce corporate misconduct and other malpractices that may be detrimental to the firm’s reputation. For example, Cumming et al. (2015) find that female directors decrease the incidence of corporate fraud. In a similar vein, García Lara et al. (2017) find that earnings quality is improved while earnings management is reduced by the presence of female directors. Moreover, female directors also decrease corporate tax aggressiveness (Lanis et al., 2017). Second, female directors improve firm reputation (Hill and Jones, 1992; Heugens et al., 2004) through greater stakeholder orientation (Rindova, 1999; Carter, 2006; Adams et al., 2011; Adams and Funk, 2012). For example, firms with female directors are less likely to downsize their workforce (Matsa and Miller, 2013). Such firms also tend to have a stronger environmental CSR orientation (e.g., Hafsi and Turgut, 2013; Larrieta-Rubín de Celis et al., 2015; Al-Shaer and Zaman, 2016). Finally, firms with female directors also tend to provide a greater philanthropic response to victims of natural disasters
4 See also, Erhardt et al. (2003), Smith et al. (2006), Campbell and Minguez-Vera (2008), Joecks et al. (2013), Ben-Amar et al. (2013), Ali et al. (2014), Owen and Temesvary (2018), and Atif et al. (2019b).
M. Atif et al.
Journal of Corporate Finance 66 (2021) 101665
4
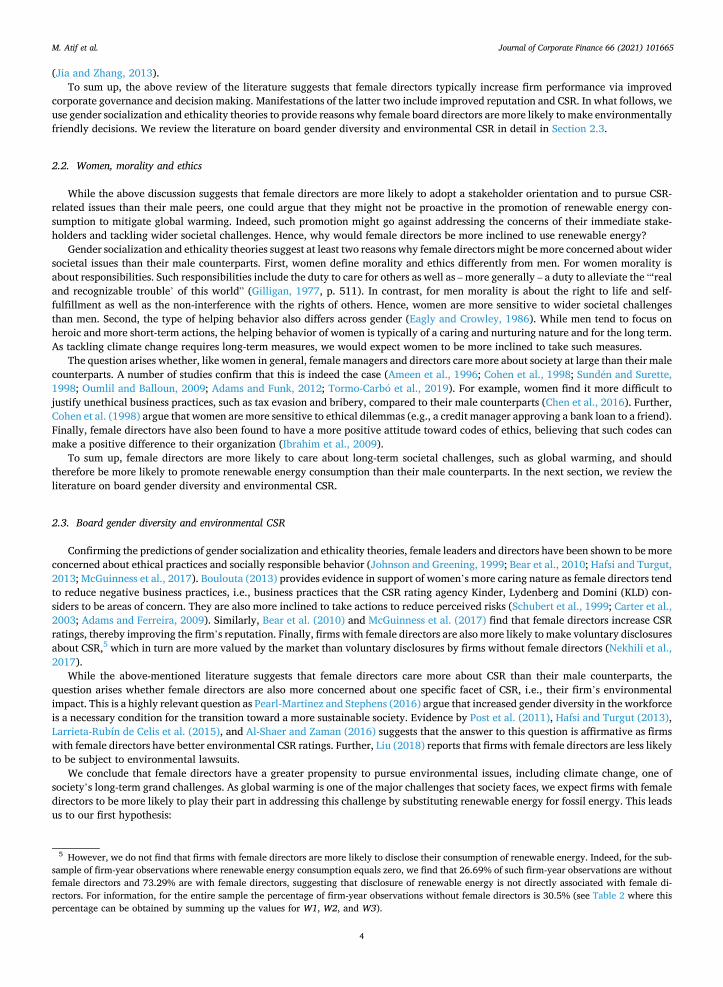
(Jia and Zhang, 2013). To sum up, the above review of the literature suggests that female directors typically increase firm performance via improved
corporate governance and decision making. Manifestations of the latter two include improved reputation and CSR. In what follows, we use gender socialization and ethicality theories to provide reasons why female board directors are more likely to make environmentally friendly decisions. We review the literature on board gender diversity and environmental CSR in detail in Section 2.3.
2.2. Women, morality and ethics
While the above discussion suggests that female directors are more likely to adopt a stakeholder orientation and to pursue CSR- related issues than their male peers, one could argue that they might not be proactive in the promotion of renewable energy con-sumption to mitigate global warming. Indeed, such promotion might go against addressing the concerns of their immediate stake-holders and tackling wider societal challenges. Hence, why would female directors be more inclined to use renewable energy?
Gender socialization and ethicality theories suggest at least two reasons why female directors might be more concerned about wider societal issues than their male counterparts. First, women define morality and ethics differently from men. For women morality is about responsibilities. Such responsibilities include the duty to care for others as well as – more generally – a duty to alleviate the “‘real and recognizable trouble’ of this world” (Gilligan, 1977, p. 511). In contrast, for men morality is about the right to life and self- fulfillment as well as the non-interference with the rights of others. Hence, women are more sensitive to wider societal challenges than men. Second, the type of helping behavior also differs across gender (Eagly and Crowley, 1986). While men tend to focus on heroic and more short-term actions, the helping behavior of women is typically of a caring and nurturing nature and for the long term. As tackling climate change requires long-term measures, we would expect women to be more inclined to take such measures.
The question arises whether, like women in general, female managers and directors care more about society at large than their male counterparts. A number of studies confirm that this is indeed the case (Ameen et al., 1996; Cohen et al., 1998; Sunden and Surette, 1998; Oumlil and Balloun, 2009; Adams and Funk, 2012; Tormo-Carbo et al., 2019). For example, women find it more difficult to justify unethical business practices, such as tax evasion and bribery, compared to their male counterparts (Chen et al., 2016). Further, Cohen et al. (1998) argue that women are more sensitive to ethical dilemmas (e.g., a credit manager approving a bank loan to a friend). Finally, female directors have also been found to have a more positive attitude toward codes of ethics, believing that such codes can make a positive difference to their organization (Ibrahim et al., 2009).
To sum up, female directors are more likely to care about long-term societal challenges, such as global warming, and should therefore be more likely to promote renewable energy consumption than their male counterparts. In the next section, we review the literature on board gender diversity and environmental CSR.
2.3. Board gender diversity and environmental CSR
Confirming the predictions of gender socialization and ethicality theories, female leaders and directors have been shown to be more concerned about ethical practices and socially responsible behavior (Johnson and Greening, 1999; Bear et al., 2010; Hafsi and Turgut, 2013; McGuinness et al., 2017). Boulouta (2013) provides evidence in support of women’s more caring nature as female directors tend to reduce negative business practices, i.e., business practices that the CSR rating agency Kinder, Lydenberg and Domini (KLD) con-siders to be areas of concern. They are also more inclined to take actions to reduce perceived risks (Schubert et al., 1999; Carter et al., 2003; Adams and Ferreira, 2009). Similarly, Bear et al. (2010) and McGuinness et al. (2017) find that female directors increase CSR ratings, thereby improving the firm’s reputation. Finally, firms with female directors are also more likely to make voluntary disclosures about CSR,5 which in turn are more valued by the market than voluntary disclosures by firms without female directors (Nekhili et al., 2017).
While the above-mentioned literature suggests that female directors care more about CSR than their male counterparts, the question arises whether female directors are also more concerned about one specific facet of CSR, i.e., their firm’s environmental impact. This is a highly relevant question as Pearl-Martinez and Stephens (2016) argue that increased gender diversity in the workforce is a necessary condition for the transition toward a more sustainable society. Evidence by Post et al. (2011), Hafsi and Turgut (2013), Larrieta-Rubín de Celis et al. (2015), and Al-Shaer and Zaman (2016) suggests that the answer to this question is affirmative as firms with female directors have better environmental CSR ratings. Further, Liu (2018) reports that firms with female directors are less likely to be subject to environmental lawsuits.
We conclude that female directors have a greater propensity to pursue environmental issues, including climate change, one of society’s long-term grand challenges. As global warming is one of the major challenges that society faces, we expect firms with female directors to be more likely to play their part in addressing this challenge by substituting renewable energy for fossil energy. This leads us to our first hypothesis:
5 However, we do not find that firms with female directors are more likely to disclose their consumption of renewable energy. Indeed, for the sub- sample of firm-year observations where renewable energy consumption equals zero, we find that 26.69% of such firm-year observations are without female directors and 73.29% are with female directors, suggesting that disclosure of renewable energy is not directly associated with female di-rectors. For information, for the entire sample the percentage of firm-year observations without female directors is 30.5% (see Table 2 where this percentage can be obtained by summing up the values for W1, W2, and W3).
M. Atif et al.

Journal of Corporate Finance 66 (2021) 101665
5
H1a. Having women on the board increases the firm’s renewable energy consumption.
Although the literature implies that women have a significant impact on CSR and environmental policies, it also suggests that having a single female director on the board is not sufficient to affect corporate decision making. Kanter (1977a) argues that domi-nantly male observers tend to distort women’s image by molding women into a gender-role stereotype (Block, 1973; Sherrick et al., 2014) rather than valuing their individual leadership qualities. Such a distorted image creates difficulties for women directors to be heard and, importantly, listened to on an equal footing to male board members (Terjesen et al., 2009). Hence, Kanter (1977a) con-cludes that a single woman on the board is a “token”, i.e., an individual whose role is to be the sole representative of a specific group (e. g., women). This token status of women in top management reinforces the stereotypes that women have weaker attributes for serving in such positions (Lee and James, 2007).
Given this token status of women, there is a need for a critical mass of women on the board of directors to ensure their influence on decision making. Kristie (2011) summarizes the critical mass theory as follows: The presence of one female director is a token, while two is a presence but three helps to raise their voice. Hence, real change only occurs when there are enough women on the board (Konrad et al., 2008; Joecks et al., 2013; Jia and Zhang, 2013; Owen and Temesvary, 2018; Atif et al., 2019b) since women feel more comfortable, and less constrained (Terjesen et al., 2009). Critical mass theory predicts that only once their number has reached two or more, women become influential in decision making. This prediction is validated by Post et al. (2011) who find that firms with three or more female directors have higher KLD scores for environmental CSR than other firms.6 Therefore, we posit our second hypothesis as follows:
H1b. Two or more women on the board have a significant effect on renewable energy consumption whereas a single woman on the board does not result in significantly more renewable energy consumption.
In turn, the board’s influence on renewable energy consumption is facilitated by its monitoring and advisory roles (Hillman and Dalziel, 2003; García Lara et al., 2017). Hence, we expect that female independent directors are more likely to affect the consumption of renewable energy than female executives. In support of our argument, the literature on female board representation suggests that female independent directors have a more significant impact on corporate decision making than female executives (e.g., Liu et al., 2014; Chen et al., 2017; García Lara et al., 2017; Li and Zhang, 2019). For example, Chen et al. (2017) find that female independent directors increase the dividends paid to the shareholders rather than female executives. Further, Li and Zhang (2019) find that firms with a greater percentage of female independent directors have relatively more short-term debt. They do not find such a link for female executive directors.7 Hence, we expect that female independent directors, rather than female executive directors, increase renewable energy consumption. Therefore, we posit the following hypothesis:
H1c. The presence of female independent directors rather than female executive directors increases renewable energy consumption.
2.4. Relationship between firm environmental and financial performance
Several empirical studies investigate the relationship between environmental responsibility and financial performance. One group of these studies, such as Walley and Whitehead (1994), Klassen and Whybark (1999), and Telle (2006), find a negative relationship between firm environmental management and financial performance. They justify this result by arguing that, by investing in envi-ronmental protection, firms deploy their scarce assets and resources away from the central areas of the business, resulting in lower financial performance.
In contrast, another group of these studies, such as Porter and Van der Linde (1995), Hart (1995), Gallego-Alvarez et al. (2015), and Lee et al. (2015), report that firms can be both environmentally and financially competitive. These studies indicate that firms can reduce global warming through various environmental initiatives (e.g., renewable energy consumption) while generating new busi-ness opportunities, and ultimately achieving both greater environmental and financial performance. Still, a few other studies – including Graves and Waddock (1999) and Qiu et al. (2016) – find no evidence that environmentally responsible firms have signif-icantly better or worse financial performance.
Given this inconclusive empirical evidence, Horvathova (2010), Endrikat et al. (2014), and Busch and Lewandowski (2018) perform a meta-analytic review to draw overall conclusions about the relationship between firm environmental and financial per-formance. Summarising 64 empirical studies conducted between 1978 and 2008, Horvathova (2010) concludes that 55% of the studies found a positive, 15% a negative, and the remainder an insignificant effect of environmental improvements on financial performance. In the same vein, reviewing the findings of 149 studies, Endrikat et al. (2014) report a generally positive relationship between firm environmental and financial performance. Finally, Busch and Lewandowski (2018), using 101,775 observations from 32 empirical studies, conclude that better carbon performance is positively linked to greater financial performance. Hence, the evidence suggests that typically there is a positive relationship between firm environment performance and financial performance.
Similarly, while the literature on the impact of female directors on firm performance and firm value is somewhat inconclusive, a recent meta-analysis review by Hoobler et al. (2018) suggests that the effect on firm performance of more women on the board is
6 As afore-mentioned, Owen and Temesvary (2018) find that female directors have a positive effect on firm performance once a certain threshold of female board representation has been reached.
7 Similar to Chen et al. (2017) who conclude that female directors consider dividends to play a monitoring role; Li and Zhang (2019) also consider short-term debt to be a monitoring device.
M. Atif et al.
Journal of Corporate Finance 66 (2021) 101665
6
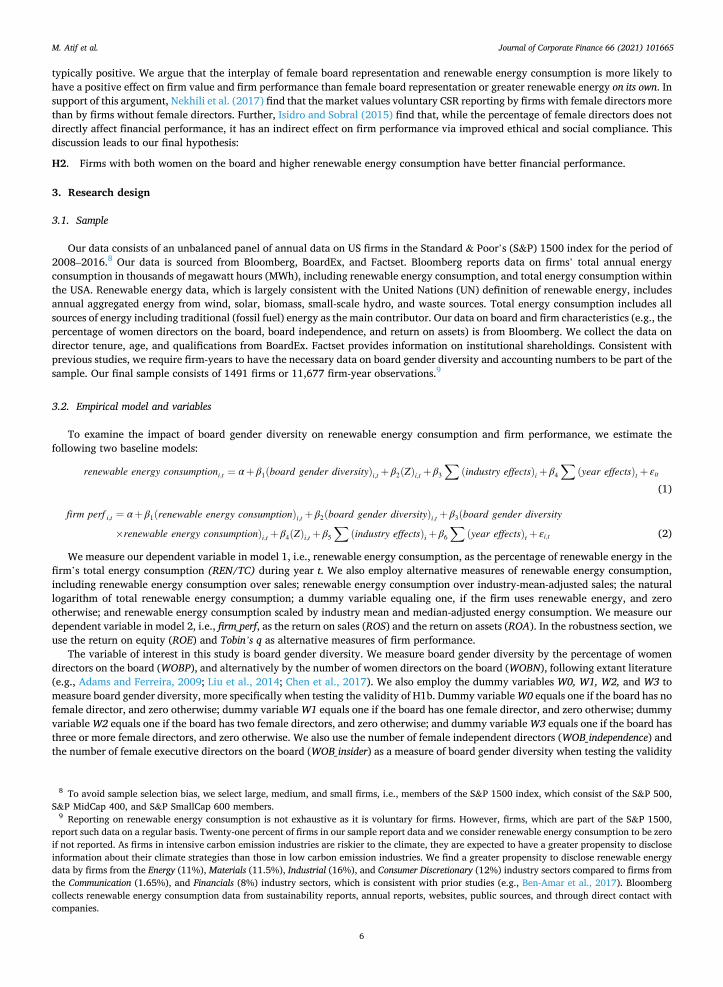
typically positive. We argue that the interplay of female board representation and renewable energy consumption is more likely to have a positive effect on firm value and firm performance than female board representation or greater renewable energy on its own. In support of this argument, Nekhili et al. (2017) find that the market values voluntary CSR reporting by firms with female directors more than by firms without female directors. Further, Isidro and Sobral (2015) find that, while the percentage of female directors does not directly affect financial performance, it has an indirect effect on firm performance via improved ethical and social compliance. This discussion leads to our final hypothesis:
H2. Firms with both women on the board and higher renewable energy consumption have better financial performance.
3. Research design
3.1. Sample
Our data consists of an unbalanced panel of annual data on US firms in the Standard & Poor’s (S&P) 1500 index for the period of 2008–2016.8 Our data is sourced from Bloomberg, BoardEx, and Factset. Bloomberg reports data on firms’ total annual energy consumption in thousands of megawatt hours (MWh), including renewable energy consumption, and total energy consumption within the USA. Renewable energy data, which is largely consistent with the United Nations (UN) definition of renewable energy, includes annual aggregated energy from wind, solar, biomass, small-scale hydro, and waste sources. Total energy consumption includes all sources of energy including traditional (fossil fuel) energy as the main contributor. Our data on board and firm characteristics (e.g., the percentage of women directors on the board, board independence, and return on assets) is from Bloomberg. We collect the data on director tenure, age, and qualifications from BoardEx. Factset provides information on institutional shareholdings. Consistent with previous studies, we require firm-years to have the necessary data on board gender diversity and accounting numbers to be part of the sample. Our final sample consists of 1491 firms or 11,677 firm-year observations.9
3.2. Empirical model and variables
To examine the impact of board gender diversity on renewable energy consumption and firm performance, we estimate the following two baseline models:
renewable energy consumptioni,t = α+ β1(board gender diversity)i,t + β2(Z)i,t + β3
∑(industry effects)i + β4
∑(year effects)t + εit
(1)
firm perf i,t = α+ β1(renewable energy consumption)i,t + β2(board gender diversity)i,t + β3(board gender diversity
×renewable energy consumption)i,t + β4(Z)i,t + β5
∑(industry effects)i + β6
∑(year effects)t + εi,t (2)
We measure our dependent variable in model 1, i.e., renewable energy consumption, as the percentage of renewable energy in the firm’s total energy consumption (REN/TC) during year t. We also employ alternative measures of renewable energy consumption, including renewable energy consumption over sales; renewable energy consumption over industry-mean-adjusted sales; the natural logarithm of total renewable energy consumption; a dummy variable equaling one, if the firm uses renewable energy, and zero otherwise; and renewable energy consumption scaled by industry mean and median-adjusted energy consumption. We measure our dependent variable in model 2, i.e., firm_perf, as the return on sales (ROS) and the return on assets (ROA). In the robustness section, we use the return on equity (ROE) and Tobin’s q as alternative measures of firm performance.
The variable of interest in this study is board gender diversity. We measure board gender diversity by the percentage of women directors on the board (WOBP), and alternatively by the number of women directors on the board (WOBN), following extant literature (e.g., Adams and Ferreira, 2009; Liu et al., 2014; Chen et al., 2017). We also employ the dummy variables W0, W1, W2, and W3 to measure board gender diversity, more specifically when testing the validity of H1b. Dummy variable W0 equals one if the board has no female director, and zero otherwise; dummy variable W1 equals one if the board has one female director, and zero otherwise; dummy variable W2 equals one if the board has two female directors, and zero otherwise; and dummy variable W3 equals one if the board has three or more female directors, and zero otherwise. We also use the number of female independent directors (WOB_independence) and the number of female executive directors on the board (WOB_insider) as a measure of board gender diversity when testing the validity
8 To avoid sample selection bias, we select large, medium, and small firms, i.e., members of the S&P 1500 index, which consist of the S&P 500, S&P MidCap 400, and S&P SmallCap 600 members.
9 Reporting on renewable energy consumption is not exhaustive as it is voluntary for firms. However, firms, which are part of the S&P 1500, report such data on a regular basis. Twenty-one percent of firms in our sample report data and we consider renewable energy consumption to be zero if not reported. As firms in intensive carbon emission industries are riskier to the climate, they are expected to have a greater propensity to disclose information about their climate strategies than those in low carbon emission industries. We find a greater propensity to disclose renewable energy data by firms from the Energy (11%), Materials (11.5%), Industrial (16%), and Consumer Discretionary (12%) industry sectors compared to firms from the Communication (1.65%), and Financials (8%) industry sectors, which is consistent with prior studies (e.g., Ben-Amar et al., 2017). Bloomberg collects renewable energy consumption data from sustainability reports, annual reports, websites, public sources, and through direct contact with companies.
M. Atif et al.
Journal of Corporate Finance 66 (2021) 101665
7
of H1c. We interact renewable energy and WOBP to form our variable of interest when testing the validity of H2. Z (in both models) represents the vector of control variables as defined in Table 1. We use two types of control variables: corporate
governance characteristics and firm characteristics. Our selection of control variables is based on previous studies (e.g., Harford et al., 2008; Liu et al., 2014; Chen et al., 2017). For example, Chen et al. (2017) argue that board characteristics, including board gender diversity, are important determinants of corporate policies (e.g., the dividend payout). Therefore, we include a variety of board- specific variables to capture the quality of corporate governance, such as a female CEO (WCEO) (a dummy variable equal to one if the CEO is a woman, and zero otherwise); board size (Board size) (measured by the total number of directors on the board); CEO duality (Duality) (a dummy variable equal to one if the CEO is also the chairman of the board, and zero otherwise); board independence (% _Board independence) (measured by the number of independent directors expressed as a percentage of board size); and board meetings (B_meeting), a proxy for monitoring intensity (Rutherford and Buchholtz, 2007) (measured by the total number of board meetings held during the year).
Based on extant literature (e.g., Liu et al., 2014), we also control for firm characteristics, which may influence renewable energy
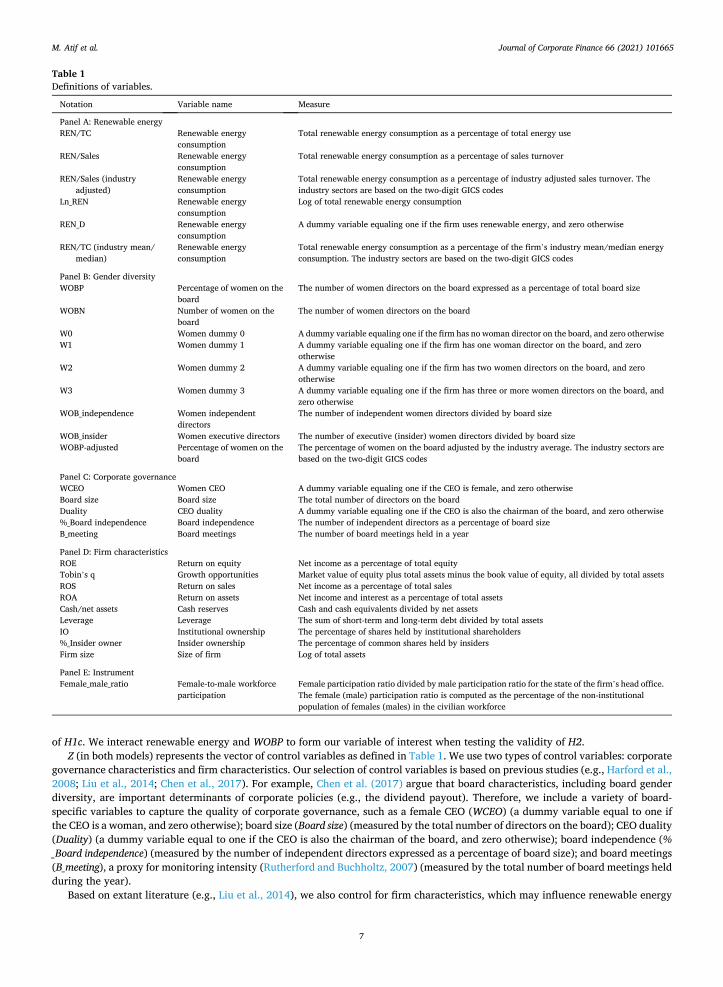
Table 1 Definitions of variables.
Notation Variable name Measure
Panel A: Renewable energy REN/TC Renewable energy
consumption Total renewable energy consumption as a percentage of total energy use
REN/Sales Renewable energy consumption
Total renewable energy consumption as a percentage of sales turnover
REN/Sales (industry adjusted)
Renewable energy consumption
Total renewable energy consumption as a percentage of industry adjusted sales turnover. The industry sectors are based on the two-digit GICS codes
Ln_REN Renewable energy consumption
Log of total renewable energy consumption
REN_D Renewable energy consumption
A dummy variable equaling one if the firm uses renewable energy, and zero otherwise
REN/TC (industry mean/ median)
Renewable energy consumption
Total renewable energy consumption as a percentage of the firm’s industry mean/median energy consumption. The industry sectors are based on the two-digit GICS codes
Panel B: Gender diversity WOBP Percentage of women on the
board The number of women directors on the board expressed as a percentage of total board size
WOBN Number of women on the board
The number of women directors on the board
W0 Women dummy 0 A dummy variable equaling one if the firm has no woman director on the board, and zero otherwise W1 Women dummy 1 A dummy variable equaling one if the firm has one woman director on the board, and zero
otherwise W2 Women dummy 2 A dummy variable equaling one if the firm has two women directors on the board, and zero
otherwise W3 Women dummy 3 A dummy variable equaling one if the firm has three or more women directors on the board, and
zero otherwise WOB_independence Women independent
directors The number of independent women directors divided by board size
WOB_insider Women executive directors The number of executive (insider) women directors divided by board size WOBP-adjusted Percentage of women on the
board The percentage of women on the board adjusted by the industry average. The industry sectors are based on the two-digit GICS codes
Panel C: Corporate governance WCEO Women CEO A dummy variable equaling one if the CEO is female, and zero otherwise Board size Board size The total number of directors on the board Duality CEO duality A dummy variable equaling one if the CEO is also the chairman of the board, and zero otherwise %_Board independence Board independence The number of independent directors as a percentage of board size B_meeting Board meetings The number of board meetings held in a year
Panel D: Firm characteristics ROE Return on equity Net income as a percentage of total equity Tobin’s q Growth opportunities Market value of equity plus total assets minus the book value of equity, all divided by total assets ROS Return on sales Net income as a percentage of total sales ROA Return on assets Net income and interest as a percentage of total assets Cash/net assets Cash reserves Cash and cash equivalents divided by net assets Leverage Leverage The sum of short-term and long-term debt divided by total assets IO Institutional ownership The percentage of shares held by institutional shareholders %_Insider owner Insider ownership The percentage of common shares held by insiders Firm size Size of firm Log of total assets
Panel E: Instrument Female_male_ratio Female-to-male workforce
participation Female participation ratio divided by male participation ratio for the state of the firm’s head office. The female (male) participation ratio is computed as the percentage of the non-institutional population of females (males) in the civilian workforce
M. Atif et al.
Journal of Corporate Finance 66 (2021) 101665
8
consumption. These firm characteristics are as follows. Tobin’s q, a proxy for growth opportunities, is measured as market value of equity plus total assets minus the book value of equity, all divided by total assets. ROA, the return on assets, is a measure of profit-ability. It is computed as net income and interest scaled by total assets. Cash/net assets, is a proxy for cash reserves, and it is measured as cash and cash equivalents divided by net assets (total assets minus cash and cash equivalents). Leverage is measured by the ratio of total debt (short-term and long-term debt) to total assets. Institutional ownership (IO) is measured by the percentage of shares held by institutional owners. %_Insider owner, measuring insider ownership, is measured by the number of shares held by insiders expressed as a percentage of total shares outstanding. Finally, the size of the firm (Firm size) is measured by the natural logarithm of total assets. These variables, as well as all others, are defined in Table 1.
To estimate our empirical models, we use ordinary least squares (OLS) as the baseline method while controlling for industry (based on two-digit GICS industry sector codes) and year effects. The standard errors are corrected for clustering at the firm level to control for heteroscedasticity and within-firm correlation in the residuals (Petersen, 2009). We also use one-year (t-1, Table B in the Appendix), two-year (t-2), and three-year lagged (t-3) independent variables by replacing the contemporaneous variables to mitigate the endo-geneity concerns in all the regressions (Harford et al., 2008). The underlying rationale is that female directors and board characteristics require time to influence firm policies, including the use of renewable energy. In the robustness section, we use Tobit, firm-fixed effects, four-digit GICS industry codes, alternative dependent variables, and additional director characteristics. We also exclude firm-year observations with a female CEO10 as well as firm-year observations for the Consumer Discretionary and Industrial sectors, the two industry sectors with the highest numbers of observations (Consumer Discretionary and Industrial). We still find a positive effect of female directors on renewable energy consumption.
3.3. Descriptive statistics
Table 2 presents summary statistics. Panel A suggests that the sample’s average usage of renewable energy as a percentage of total energy consumption is 28.77%. When comparing the sub-sample of firm-year observations with female directors with the sub-sample of firm-year observations without female directors, the former sub-sample has higher renewable energy consumption on average (31.18% versus 20.96%). This difference is significant at the 1% level. Panel B shows that 13.50% of all directors on the board are women and there are on average 1.24 women on the boards of our sample firms. About 32%, 24%, and 13% of observations have one woman, two women, and three or more women on the board, respectively. The remaining 31% of firm-year observations have no women on their boards. Finally, our sample firms have on average 11% of women that are independent directors and 0.9% of women that are inside directors.
As to the corporate governance characteristics, Panel C of Table 2 shows that the percentage of female CEOs is only 0.31 on average, average board size is 9.61, 63% of firms have CEO duality, the percentage of independent directors is 81, and the average number of board meetings per year is 8.65. A comparison of the firm-year observations with female directors with those without shows that the former sub-sample tends to have a significantly larger board (10.15 versus 7.87), greater board independence (82.09% versus 76.27%), and more board meetings (8.71 versus 8.48). Chen et al. (2017, 2019) find similar differences between firms with and without female directors. Further, a comparison of the firm-year observations with renewable energy data with those without reveals significant differences (except for Duality) in the corporate governance characteristics between the two sub-samples.
Finally, Panel D of Table 2 focuses on the firm-specific variables that may have an impact on renewable energy. Tobin’s q is on average 1.90, and ROS and ROA have an average of 9.07% and 5.08%, respectively. Cash/net assets is on average 0.25, Leverage has an average of 0.24, IO has an average of 0.77, and %_Insider owner is on average 3.44. The size of the firm (Firm size) has an average value of 8.68. The sub-sample of firm-year observations with renewable energy data is largely different from that without renewable energy data in terms of firm characteristics.
Table A in the Appendix reports the use of renewable energy and raw energy across various sectors of industry. On average, the Real Estate sector uses the most renewable energy as a percentage of total energy consumption (56.92%), followed by the Materials (51.85%) and Information Technology industry sectors (28.28%).
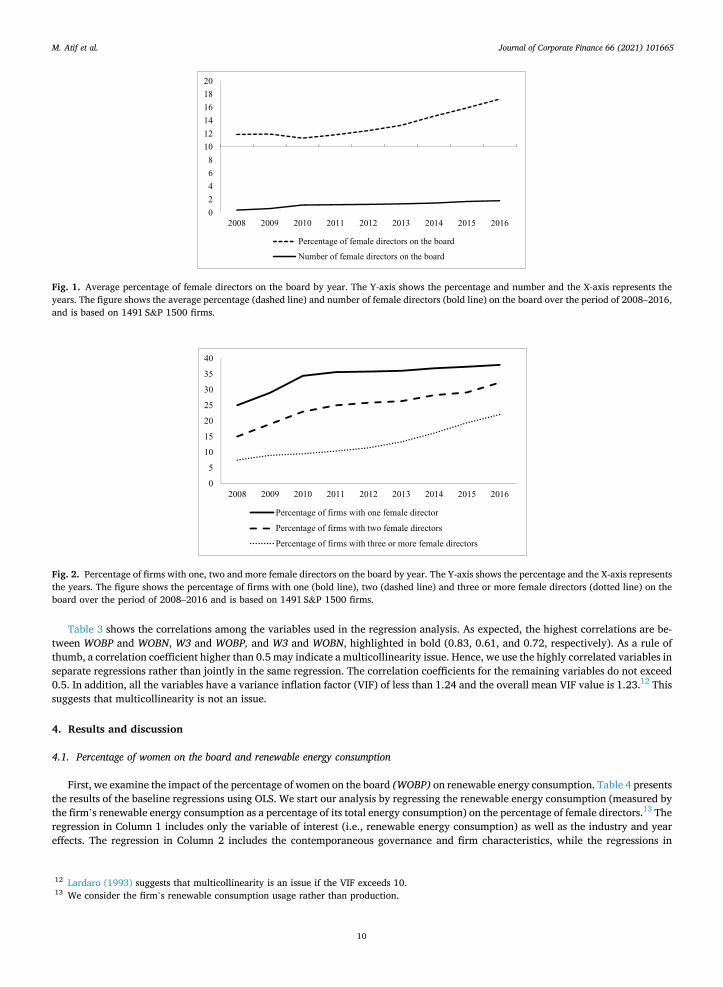
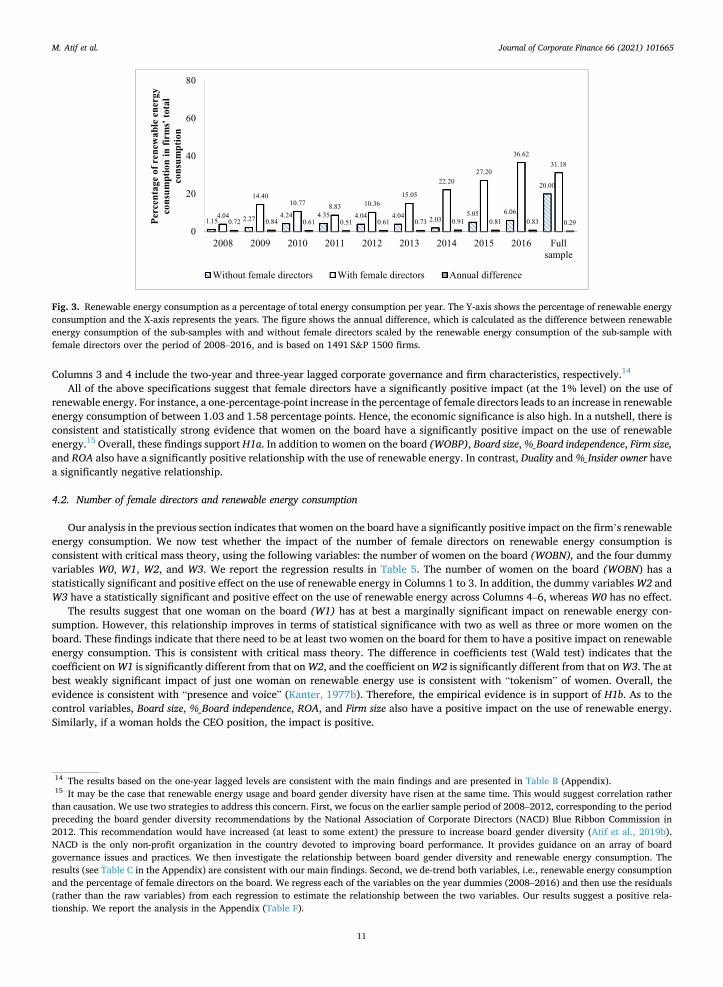
Fig. 1 depicts the evolution of board gender diversity over the period of 2008–2016. The percentage of women on the board (WOBP) increased from 12% in 2008 to 18% in 2016 and the average number of women on the board (WOBN) also increased during the same period, from 0.36 to 1.80. Fig. 2 shows the percentages of firms with one female director, two female directors and three or more female directors on the board. The percentage of firms with one female director on the board increased from 25% to 38%, the percentage of firms with two female directors increased from 15% to 32%, and the percentage of firms with three or more directors increased from 7.5% to 22%. This suggests that over the period not only more boards appointed their first female director, but that the number and percentage of female directors on boards also increased over the period. These patterns are in line with those reported by Chen et al. (2017, 2019). Fig. 3 compares the annual renewable energy consumption (as a percentage of total energy consumption) of the sub-sample of firm-year observations with female directors with the sub-sample of firm-year observations without female directors. For each year, the renewable energy consumption of firm-year observations with female directors exceeds that of firm-year obser-vations without female directors.11
10 The reason why we exclude such observations is that the positive effect of female directors may be driven by female CEOs rather than female independent directors. 11 The annual difference is calculated as the difference between renewable energy consumption of the sub-samples with and without female di-
rectors scaled by the renewable energy consumption of the sub-sample with female directors.
M. Atif et al.

JournalofCorporateFinance66(2021)101665
9
Table 2 Descriptive statistics.
Full Sample With female Without female Firms with REN Firms without REN
N = 11,677 N = 8926 N = 2751
Variable Mean Std. Dev. Mean Std. Dev. Mean Std. Dev. Mean Diff t-stat Mean Std. Dev. Mean Std. Dev. Mean Diff t-stat
Panel A: Renewable energy REN/TC 28.766 3341.769 31.175 3822.092 20.963 1164.279 10.212*** 10.989 33.154 4216.033 0.000 0.000 33.154*** 5.126
Panel B: Gender diversity WOBP 13.503 10.303 17.665 8.084 0.000 0.000 17.665*** 110.023 17.239 10.286 12.418 8.525 4.821*** 3.231 WOBN 1.242 1.122 1.624 1.013 0.000 0.000 1.624*** 84.116 1.245 1.081 1.241 1.222 0.004*** 4.332 W1 0.323 0.468 0.459 0.493 0.000 0.000 0.459*** 44.866 0.332 0.472 0.321 0.467 0.011 1.198 W2 0.244 0.429 0.349 0.468 0.000 0.000 0.349*** 35.873 0.241 0.420 0.245 0.429 − 0.004*** − 2.891 W3 0.128 0.335 0.189 0.374 0.000 0.000 0.189*** 23.561 0.124 0.310 0.129 0.334 − 0.005*** − 6.134 WOB_independence 0.112 0.081 0.158 0.067 0.000 0.000 0.158*** 105.432 0.113 0.083 0.112 0.082 0.001*** 2.882 WOB_insider 0.009 0.310 0.011 0.039 0.000 0.000 0.011*** 29.872 0.012 0.029 0.008 0.033 0.004*** 2.458
Panel C: Corporate governance CEO 0.031 0.174 0.041 0.199 0.000 0.000 0.041*** 10.861 0.033 0.169 0.030 0.154 0.003*** 4.123 Board size 9.614 2.398 10.153 2.290 7.865 1.842 2.287*** 47.842 7.837 2.010 10.104 1.692 − 2.267*** − 6.132 Duality 0.632 0.367 0.674 0.398 0.559 0.513 0.115*** 15.372 0.465 0.428 0.673 0.591 − 0.208 − 1.162 %_Board independence 80.724 11.440 82.098 10.771 76.265 12.375 5.833*** 23.949 76.112 8.184 81.985 13.125 − 5.873*** − 13.911 B_meeting 8.651 1.763 8.714 1.732 8.486 1.863 0.228*** 6.024 8.551 1.723 8.712 0.186 − 0.161*** − 4.112
Panel D: Firm characteristics Tobin’s q 1.903 1.312 1.884 1.278 1.965 1.416 − 0.081*** − 4.832 1.956 1.391 1.879 1.286 0.077*** 3.122 ROS 9.070 1.330 11.400 0.375 1.614 2.620 9.876*** 4.143 5.167 1.645 10.114 2.732 − 4.947*** 3.323 ROA 5.081 9.025 5.129 7.938 4.926 11.893 0.203 1.031 5.221 9.757 5.051 10.193 0.170 1.711 Cash/net assets 0.249 0.441 0.190 0.396 0.318 0.514 0.128*** − 12.14 0.301 0.506 0.232 0.348 0.069*** 8.133 Leverage 0.235 0.204 0.243 0.202 0.209 0.208 0.033*** 7.511 0.211 0.210 0.239 0.205 − 0.028*** − 4.263 IO 0.767 0.210 0.773 0.192 0.746 0.260 0.027 1.811 0.748 0.249 0.771 0.199 − 0.023 − 1.362 %_Insider owner 3.439 6.344 2.840 5.584 5.382 8.047 − 2.541*** − 18.641 5.321 7.998 2.968 5.505 2.353*** 7.121 Firm size 8.675 0.753 8.713 0.741 7.094 0.575 1.618*** 56.221 7.883 0.550 8.855 0.725 − 0.972*** − 5.154
Table 2 presents descriptive statistics for the full sample and the sub-samples with women and without women as well as the sub-samples with reported renewable energy and without. For each variable, the differences in means between the sub-samples are reported along with t-statistics based on the two-sample t-test. ***Denotes statistical significance at the 1% level. Refer to Table 1 for the definitions of the variables.
M. A
tif et al.
Journal of Corporate Finance 66 (2021) 101665
10
Table 3 shows the correlations among the variables used in the regression analysis. As expected, the highest correlations are be-tween WOBP and WOBN, W3 and WOBP, and W3 and WOBN, highlighted in bold (0.83, 0.61, and 0.72, respectively). As a rule of thumb, a correlation coefficient higher than 0.5 may indicate a multicollinearity issue. Hence, we use the highly correlated variables in separate regressions rather than jointly in the same regression. The correlation coefficients for the remaining variables do not exceed 0.5. In addition, all the variables have a variance inflation factor (VIF) of less than 1.24 and the overall mean VIF value is 1.23.12 This suggests that multicollinearity is not an issue.
4. Results and discussion
4.1. Percentage of women on the board and renewable energy consumption
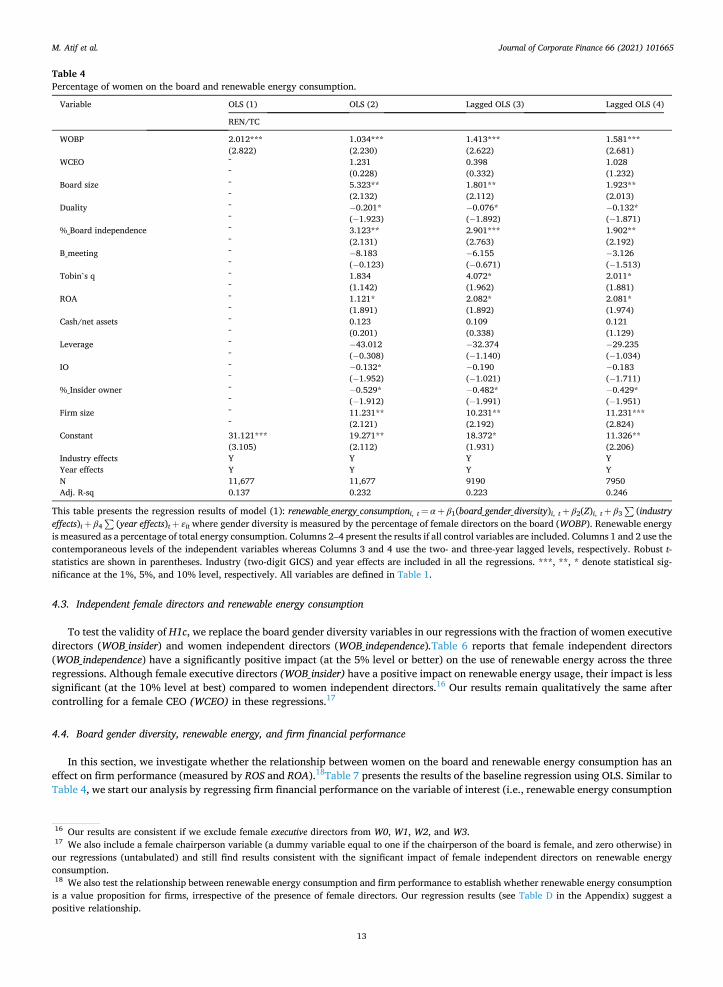
First, we examine the impact of the percentage of women on the board (WOBP) on renewable energy consumption. Table 4 presents the results of the baseline regressions using OLS. We start our analysis by regressing the renewable energy consumption (measured by the firm’s renewable energy consumption as a percentage of its total energy consumption) on the percentage of female directors.13 The regression in Column 1 includes only the variable of interest (i.e., renewable energy consumption) as well as the industry and year effects. The regression in Column 2 includes the contemporaneous governance and firm characteristics, while the regressions in
02468
101214161820
2008 2009 2010 2011 2012 2013 2014 2015 2016
Percentage of female directors on the board
Number of female directors on the board
Fig. 1. Average percentage of female directors on the board by year. The Y-axis shows the percentage and number and the X-axis represents the years. The figure shows the average percentage (dashed line) and number of female directors (bold line) on the board over the period of 2008–2016, and is based on 1491 S&P 1500 firms.
0
5
10
15
20
25
30
35
40
2008 2009 2010 2011 2012 2013 2014 2015 2016
Percentage of firms with one female director
Percentage of firms with two female directors
Percentage of firms with three or more female directors
Fig. 2. Percentage of firms with one, two and more female directors on the board by year. The Y-axis shows the percentage and the X-axis represents the years. The figure shows the percentage of firms with one (bold line), two (dashed line) and three or more female directors (dotted line) on the board over the period of 2008–2016 and is based on 1491 S&P 1500 firms.
12 Lardaro (1993) suggests that multicollinearity is an issue if the VIF exceeds 10. 13 We consider the firm’s renewable consumption usage rather than production.
M. Atif et al.
Journal of Corporate Finance 66 (2021) 101665
11
Columns 3 and 4 include the two-year and three-year lagged corporate governance and firm characteristics, respectively.14
All of the above specifications suggest that female directors have a significantly positive impact (at the 1% level) on the use of renewable energy. For instance, a one-percentage-point increase in the percentage of female directors leads to an increase in renewable energy consumption of between 1.03 and 1.58 percentage points. Hence, the economic significance is also high. In a nutshell, there is consistent and statistically strong evidence that women on the board have a significantly positive impact on the use of renewable energy.15 Overall, these findings support H1a. In addition to women on the board (WOBP), Board size, %_Board independence, Firm size, and ROA also have a significantly positive relationship with the use of renewable energy. In contrast, Duality and %_Insider owner have a significantly negative relationship.
4.2. Number of female directors and renewable energy consumption
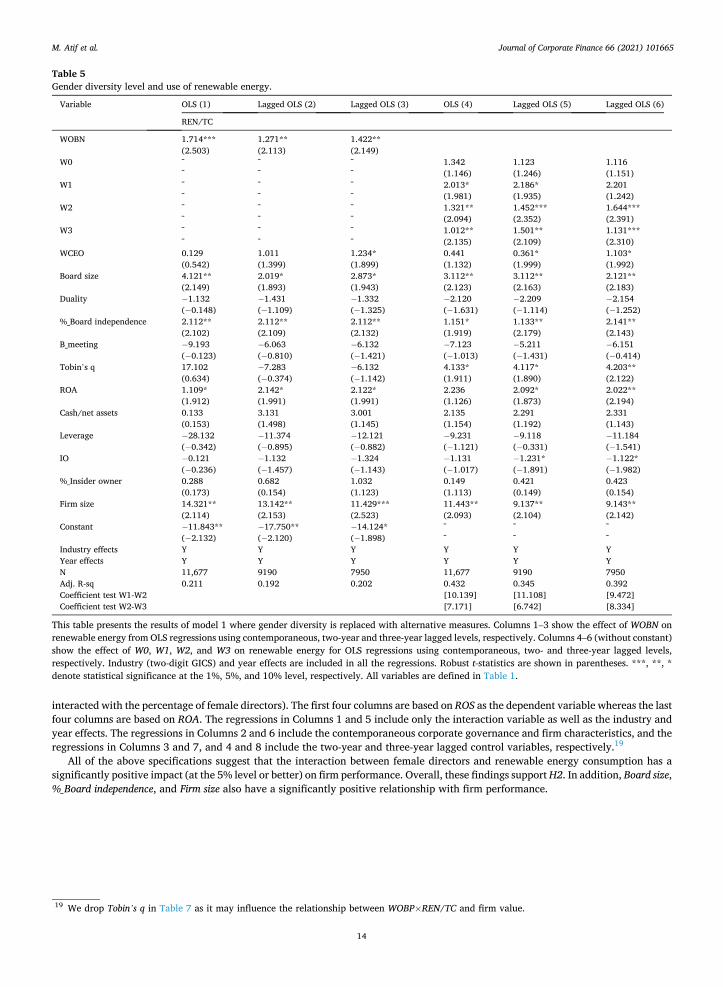
Our analysis in the previous section indicates that women on the board have a significantly positive impact on the firm’s renewable energy consumption. We now test whether the impact of the number of female directors on renewable energy consumption is consistent with critical mass theory, using the following variables: the number of women on the board (WOBN), and the four dummy variables W0, W1, W2, and W3. We report the regression results in Table 5. The number of women on the board (WOBN) has a statistically significant and positive effect on the use of renewable energy in Columns 1 to 3. In addition, the dummy variables W2 and W3 have a statistically significant and positive effect on the use of renewable energy across Columns 4–6, whereas W0 has no effect.
The results suggest that one woman on the board (W1) has at best a marginally significant impact on renewable energy con-sumption. However, this relationship improves in terms of statistical significance with two as well as three or more women on the board. These findings indicate that there need to be at least two women on the board for them to have a positive impact on renewable energy consumption. This is consistent with critical mass theory. The difference in coefficients test (Wald test) indicates that the coefficient on W1 is significantly different from that on W2, and the coefficient on W2 is significantly different from that on W3. The at best weakly significant impact of just one woman on renewable energy use is consistent with “tokenism” of women. Overall, the evidence is consistent with “presence and voice” (Kanter, 1977b). Therefore, the empirical evidence is in support of H1b. As to the control variables, Board size, %_Board independence, ROA, and Firm size also have a positive impact on the use of renewable energy. Similarly, if a woman holds the CEO position, the impact is positive.
1.15 2.27 4.24 4.35 4.04 4.04 2.035.05 6.06
20.00
4.04
14.4010.77 8.83 10.36
15.05
22.2027.20
36.6231.18
0.72 0.84 0.61 0.51 0.61 0.73 0.91 0.81 0.83 0.290
20
40
60
80
2008 2009 2010 2011 2012 2013 2014 2015 2016 Fullsample
Per
cent
age
of r
enew
able
ene
rgy
cons
umpt
ion
in fi
rms'
tot
al
cons
umpt
ion
Without female directors With female directors Annual difference
Fig. 3. Renewable energy consumption as a percentage of total energy consumption per year. The Y-axis shows the percentage of renewable energy consumption and the X-axis represents the years. The figure shows the annual difference, which is calculated as the difference between renewable energy consumption of the sub-samples with and without female directors scaled by the renewable energy consumption of the sub-sample with female directors over the period of 2008–2016, and is based on 1491 S&P 1500 firms.
14 The results based on the one-year lagged levels are consistent with the main findings and are presented in Table B (Appendix). 15 It may be the case that renewable energy usage and board gender diversity have risen at the same time. This would suggest correlation rather
than causation. We use two strategies to address this concern. First, we focus on the earlier sample period of 2008–2012, corresponding to the period preceding the board gender diversity recommendations by the National Association of Corporate Directors (NACD) Blue Ribbon Commission in 2012. This recommendation would have increased (at least to some extent) the pressure to increase board gender diversity (Atif et al., 2019b). NACD is the only non-profit organization in the country devoted to improving board performance. It provides guidance on an array of board governance issues and practices. We then investigate the relationship between board gender diversity and renewable energy consumption. The results (see Table C in the Appendix) are consistent with our main findings. Second, we de-trend both variables, i.e., renewable energy consumption and the percentage of female directors on the board. We regress each of the variables on the year dummies (2008–2016) and then use the residuals (rather than the raw variables) from each regression to estimate the relationship between the two variables. Our results suggest a positive rela-tionship. We report the analysis in the Appendix (Table F).
M. Atif et al.

JournalofCorporateFinance66(2021)101665
12
Table 3 Correlation matrix.
Varia
bles
1 2 3 4 5 6 7 8 9 10
11
12
13
14
15
16
17
18
19
20
21
22
1 REN/TC 1.000 2 WOBP 0.009 1.000 3 WOBN 0.016 0.830 1.000 4 W0 0.011 0.106 0.042 1.000 5 W1 − 0.012 − 0.147 − 0.152 0.134 1.000 6 W2 0.014 0.358 0.382 0.161 − 0.364 1.000 7 W3 0.014 0.611 0.721 0.214 − 0.266 − 0.213 1.000 8 WOB_
independence 0.023 0.216 0.133 0.001 0.041 0.104 0.108 1.000
9 WOB_insider − 0.050 0.381 0.321 0.002 0.008 0.042 0.075 0.026 1.000 10 WCEO − 0.003 0.262 0.242 0.005 − 0.075 0.025 0.223 0.274 0.023 1.000 11 Board size 0.024 0.274 0.419 − 0.111 − 0.131 0.190 0.317 0.078 0.184 0.042 1.000 12 Duality − 0.003 0.208 0.192 0.005 − 0.055 0.002 0.195 0.123 0.035 0.545 0.039 1.000 13 %_Board independence 0.017 0.220 0.224 0.001 − 0.041 0.134 0.133 0.112 0.101 0.047 0.193 0.068 1.000 14 B_meeting 0.006 0.068 0.061 0.003 − 0.023 0.007 0.062 0.019 0.047 0.029 0.107 0.057 0.147 1.000 15 Tobin’s q − 0.001 0.005 0.013 0.031 0.034 − 0.015 0.010 0.036 − 0.002 − 0.018 − 0.110 − 0.030 − 0.053 − 0.145 1.000 16 ROS 0.002 0.001 0.004 0.010 0.011 0.035 0.022 0.034 0.021 − 0.014 − 0.035 − 0.015 0.024 0.133 0.544 1.000 17 ROA 0.001 0.013 0.001 0.002 0.010 − 0.023 0.014 0.033 0.013 − 0.016 − 0.080 − 0.017 − 0.032 − 0.135 0.513 0.113 1.000 18 Cash/net assets 0.030 − 0.302 − 0.355 − 0.100 − 0.132 − 0.181 − 0.264 − 0.068 − 0.246 0.048 0.553 0.058 0.174 0.100 − 0.013 − 0.133 0.142 1.000 19 Leverage − 0.004 0.074 0.082 0.001 − 0.008 0.076 0.021 − 0.032 0.028 0.000 0.117 0.030 0.017 0.072 − 0.134 0.133 − 0.253 0.171 1.000 20 IO − 0.062 0.015 0.040 0.023 0.043 0.039 − 0.035 0.052 0.032 0.041 0.026 0.044 − 0.020 0.016 0.027 0.093 0.212 0.122 0.132 1.000 21 %_Insider owner − 0.009 − 0.119 − 0.105 0.032 0.039 − 0.056 − 0.075 0.016 − 0.065 − 0.016 − 0.206 − 0.024 − 0.278 − 0.115 0.101 − 0.125 0.085 − 0.251 − 0.134 0.030 1.000 22 Firm size 0.033 0.233 0.353 0.121 − 0.131 0.185 0.265 0.045 0.240 0.044 0.585 0.063 0.198 0.183 − 0.253 0.135 − 0.193 0.080 0.265 − 0.052 − 0.287 1.000
Table 3 shows the correlation matrix. Refer to Table 1 for the definitions of the variables.
M. A
tif et al.
Journal of Corporate Finance 66 (2021) 101665
13
4.3. Independent female directors and renewable energy consumption
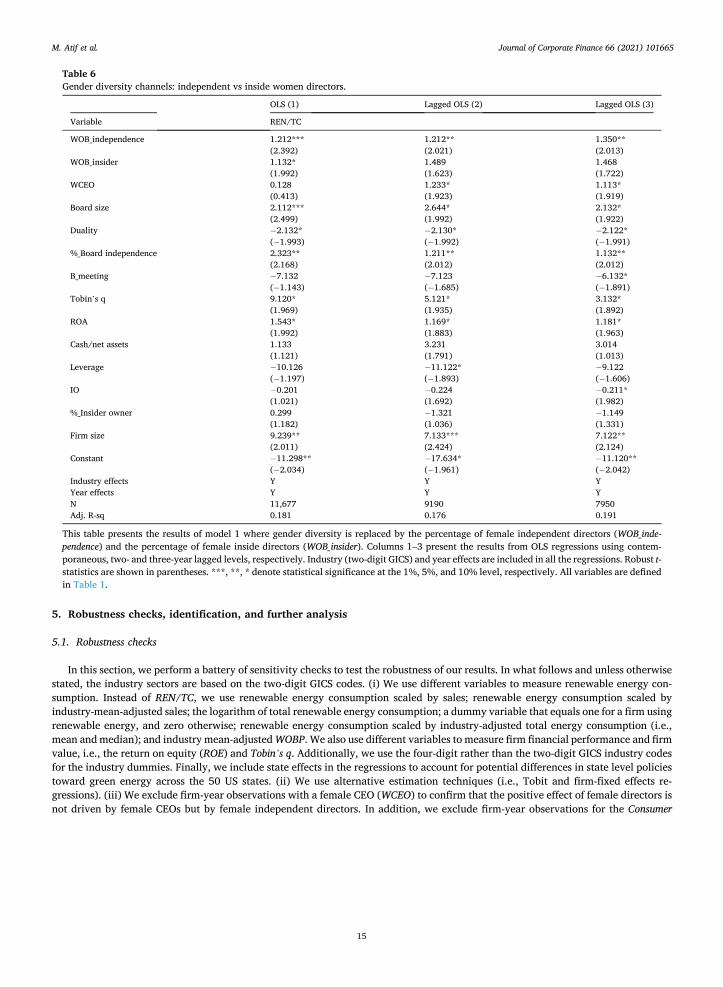
To test the validity of H1c, we replace the board gender diversity variables in our regressions with the fraction of women executive directors (WOB_insider) and women independent directors (WOB_independence).Table 6 reports that female independent directors (WOB_independence) have a significantly positive impact (at the 5% level or better) on the use of renewable energy across the three regressions. Although female executive directors (WOB_insider) have a positive impact on renewable energy usage, their impact is less significant (at the 10% level at best) compared to women independent directors.16 Our results remain qualitatively the same after controlling for a female CEO (WCEO) in these regressions.17
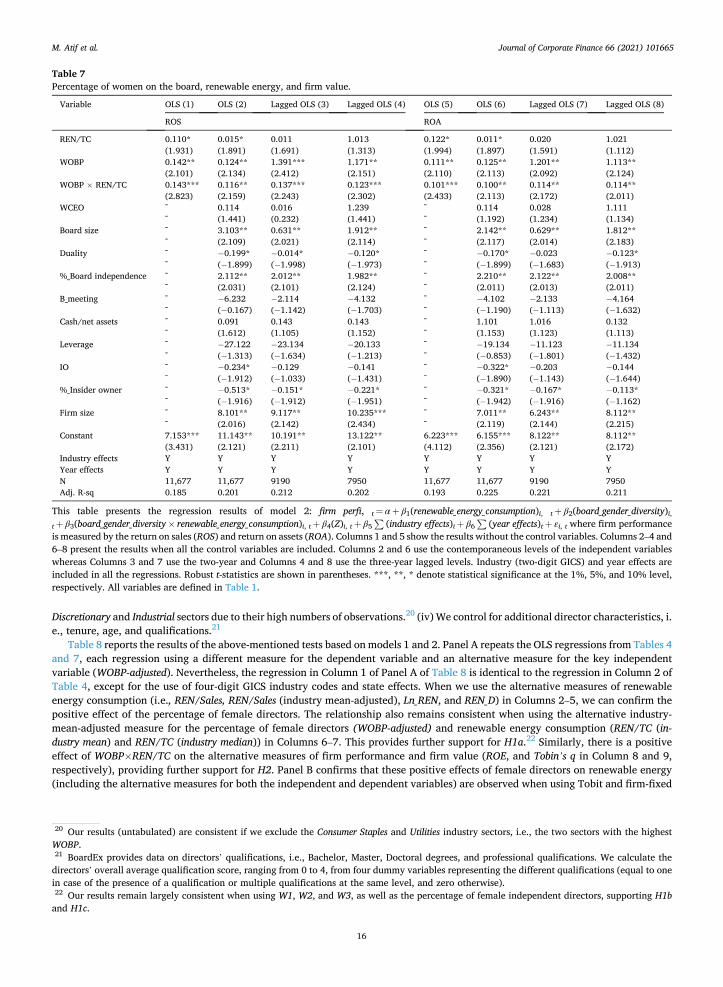
4.4. Board gender diversity, renewable energy, and firm financial performance
In this section, we investigate whether the relationship between women on the board and renewable energy consumption has an effect on firm performance (measured by ROS and ROA).18Table 7 presents the results of the baseline regression using OLS. Similar to Table 4, we start our analysis by regressing firm financial performance on the variable of interest (i.e., renewable energy consumption
Table 4 Percentage of women on the board and renewable energy consumption.
Variable OLS (1) OLS (2) Lagged OLS (3) Lagged OLS (4)
REN/TC
WOBP 2.012*** 1.034*** 1.413*** 1.581*** (2.822) (2.230) (2.622) (2.681)
WCEO ˉ 1.231 0.398 1.028 ˉ (0.228) (0.332) (1.232)
Board size ˉ 5.323** 1.801** 1.923** ˉ (2.132) (2.112) (2.013)
Duality ˉ − 0.201* − 0.076* − 0.132* ˉ (− 1.923) (− 1.892) (− 1.871)
%_Board independence ˉ 3.123** 2.901*** 1.902** ˉ (2.131) (2.763) (2.192)
B_meeting ˉ − 8.183 − 6.155 − 3.126 ˉ (− 0.123) (− 0.671) (− 1.513)
Tobin’s q ˉ 1.834 4.072* 2.011* ˉ (1.142) (1.962) (1.881)
ROA ˉ 1.121* 2.082* 2.081* ˉ (1.891) (1.892) (1.974)
Cash/net assets ˉ 0.123 0.109 0.121 ˉ (0.201) (0.338) (1.129)
Leverage ˉ − 43.012 − 32.374 − 29.235 ˉ (− 0.308) (− 1.140) (− 1.034)
IO ˉ − 0.132* − 0.190 − 0.183 ˉ (− 1.952) (− 1.021) (− 1.711)
%_Insider owner ˉ − 0.529* − 0.482* − 0.429* ˉ (− 1.912) (− 1.991) (− 1.951)
Firm size ˉ 11.231** 10.231** 11.231*** ˉ (2.121) (2.192) (2.824)
Constant 31.121*** 19.271** 18.372* 11.326** (3.105) (2.112) (1.931) (2.206)
Industry effects Y Y Y Y Year effects Y Y Y Y N 11,677 11,677 9190 7950 Adj. R-sq 0.137 0.232 0.223 0.246
This table presents the regression results of model (1): renewable_energy_consumptioni, t = α + β1(board_gender_diversity)i, t + β2(Z)i, t + β3 ∑
(industry effects)i + β4
∑(year effects)t + εit where gender diversity is measured by the percentage of female directors on the board (WOBP). Renewable energy
is measured as a percentage of total energy consumption. Columns 2–4 present the results if all control variables are included. Columns 1 and 2 use the contemporaneous levels of the independent variables whereas Columns 3 and 4 use the two- and three-year lagged levels, respectively. Robust t- statistics are shown in parentheses. Industry (two-digit GICS) and year effects are included in all the regressions. ***, **, * denote statistical sig-nificance at the 1%, 5%, and 10% level, respectively. All variables are defined in Table 1.
16 Our results are consistent if we exclude female executive directors from W0, W1, W2, and W3. 17 We also include a female chairperson variable (a dummy variable equal to one if the chairperson of the board is female, and zero otherwise) in
our regressions (untabulated) and still find results consistent with the significant impact of female independent directors on renewable energy consumption. 18 We also test the relationship between renewable energy consumption and firm performance to establish whether renewable energy consumption
is a value proposition for firms, irrespective of the presence of female directors. Our regression results (see Table D in the Appendix) suggest a positive relationship.
M. Atif et al.
Journal of Corporate Finance 66 (2021) 101665
14
interacted with the percentage of female directors). The first four columns are based on ROS as the dependent variable whereas the last four columns are based on ROA. The regressions in Columns 1 and 5 include only the interaction variable as well as the industry and year effects. The regressions in Columns 2 and 6 include the contemporaneous corporate governance and firm characteristics, and the regressions in Columns 3 and 7, and 4 and 8 include the two-year and three-year lagged control variables, respectively.19
All of the above specifications suggest that the interaction between female directors and renewable energy consumption has a significantly positive impact (at the 5% level or better) on firm performance. Overall, these findings support H2. In addition, Board size, %_Board independence, and Firm size also have a significantly positive relationship with firm performance.
Table 5 Gender diversity level and use of renewable energy.
Variable OLS (1) Lagged OLS (2) Lagged OLS (3) OLS (4) Lagged OLS (5) Lagged OLS (6)
REN/TC
WOBN 1.714*** 1.271** 1.422** (2.503) (2.113) (2.149)
W0 ˉ ˉ ˉ 1.342 1.123 1.116 ˉ ˉ ˉ (1.146) (1.246) (1.151)
W1 ˉ ˉ ˉ 2.013* 2.186* 2.201 ˉ ˉ ˉ (1.981) (1.935) (1.242)
W2 ˉ ˉ ˉ 1.321** 1.452*** 1.644*** ˉ ˉ ˉ (2.094) (2.352) (2.391)
W3 ˉ ˉ ˉ 1.012** 1.501** 1.131*** ˉ ˉ ˉ (2.135) (2.109) (2.310)
WCEO 0.129 1.011 1.234* 0.441 0.361* 1.103* (0.542) (1.399) (1.899) (1.132) (1.999) (1.992)
Board size 4.121** 2.019* 2.873* 3.112** 3.112** 2.121** (2.149) (1.893) (1.943) (2.123) (2.163) (2.183)
Duality − 1.132 − 1.431 − 1.332 − 2.120 − 2.209 − 2.154 (− 0.148) (− 1.109) (− 1.325) (− 1.631) (− 1.114) (− 1.252)
%_Board independence 2.112** 2.112** 2.112** 1.151* 1.133** 2.141** (2.102) (2.109) (2.132) (1.919) (2.179) (2.143)
B_meeting − 9.193 − 6.063 − 6.132 − 7.123 − 5.211 − 6.151 (− 0.123) (− 0.810) (− 1.421) (− 1.013) (− 1.431) (− 0.414)
Tobin’s q 17.102 − 7.283 − 6.132 4.133* 4.117* 4.203** (0.634) (− 0.374) (− 1.142) (1.911) (1.890) (2.122)
ROA 1.109* 2.142* 2.122* 2.236 2.092* 2.022** (1.912) (1.991) (1.991) (1.126) (1.873) (2.194)
Cash/net assets 0.133 3.131 3.001 2.135 2.291 2.331 (0.153) (1.498) (1.145) (1.154) (1.192) (1.143)
Leverage − 28.132 − 11.374 − 12.121 − 9.231 − 9.118 − 11.184 (− 0.342) (− 0.895) (− 0.882) (− 1.121) (− 0.331) (− 1.541)
IO − 0.121 − 1.132 − 1.324 − 1.131 − 1.231* − 1.122* (− 0.236) (− 1.457) (− 1.143) (− 1.017) (− 1.891) (− 1.982)
%_Insider owner 0.288 0.682 1.032 0.149 0.421 0.423 (0.173) (0.154) (1.123) (1.113) (0.149) (0.154)
Firm size 14.321** 13.142** 11.429*** 11.443** 9.137** 9.143** (2.114) (2.153) (2.523) (2.093) (2.104) (2.142)
Constant − 11.843** − 17.750** − 14.124* ˉ ˉ ˉ (− 2.132) (− 2.120) (− 1.898) ˉ ˉ ˉ
Industry effects Y Y Y Y Y Y Year effects Y Y Y Y Y Y N 11,677 9190 7950 11,677 9190 7950 Adj. R-sq 0.211 0.192 0.202 0.432 0.345 0.392 Coefficient test W1-W2 [10.139] [11.108] [9.472] Coefficient test W2-W3 [7.171] [6.742] [8.334]
This table presents the results of model 1 where gender diversity is replaced with alternative measures. Columns 1–3 show the effect of WOBN on renewable energy from OLS regressions using contemporaneous, two-year and three-year lagged levels, respectively. Columns 4–6 (without constant) show the effect of W0, W1, W2, and W3 on renewable energy for OLS regressions using contemporaneous, two- and three-year lagged levels, respectively. Industry (two-digit GICS) and year effects are included in all the regressions. Robust t-statistics are shown in parentheses. ***, **, * denote statistical significance at the 1%, 5%, and 10% level, respectively. All variables are defined in Table 1.
19 We drop Tobin’s q in Table 7 as it may influence the relationship between WOBP×REN/TC and firm value.
M. Atif et al.
Journal of Corporate Finance 66 (2021) 101665
15
5. Robustness checks, identification, and further analysis
5.1. Robustness checks
In this section, we perform a battery of sensitivity checks to test the robustness of our results. In what follows and unless otherwise stated, the industry sectors are based on the two-digit GICS codes. (i) We use different variables to measure renewable energy con-sumption. Instead of REN/TC, we use renewable energy consumption scaled by sales; renewable energy consumption scaled by industry-mean-adjusted sales; the logarithm of total renewable energy consumption; a dummy variable that equals one for a firm using renewable energy, and zero otherwise; renewable energy consumption scaled by industry-adjusted total energy consumption (i.e., mean and median); and industry mean-adjusted WOBP. We also use different variables to measure firm financial performance and firm value, i.e., the return on equity (ROE) and Tobin’s q. Additionally, we use the four-digit rather than the two-digit GICS industry codes for the industry dummies. Finally, we include state effects in the regressions to account for potential differences in state level policies toward green energy across the 50 US states. (ii) We use alternative estimation techniques (i.e., Tobit and firm-fixed effects re-gressions). (iii) We exclude firm-year observations with a female CEO (WCEO) to confirm that the positive effect of female directors is not driven by female CEOs but by female independent directors. In addition, we exclude firm-year observations for the Consumer
Table 6 Gender diversity channels: independent vs inside women directors.
OLS (1) Lagged OLS (2) Lagged OLS (3)
Variable REN/TC
WOB_independence 1.212*** 1.212** 1.350** (2.392) (2.021) (2.013)
WOB_insider 1.132* 1.489 1.468 (1.992) (1.623) (1.722)
WCEO 0.128 1.233* 1.113* (0.413) (1.923) (1.919)
Board size 2.112*** 2.644* 2.132* (2.499) (1.992) (1.922)
Duality − 2.132* − 2.130* − 2.122* (− 1.993) (− 1.992) (− 1.991)
%_Board independence 2.323** 1.211** 1.132** (2.168) (2.012) (2.012)
B_meeting − 7.132 − 7.123 − 6.132* (− 1.143) (− 1.685) (− 1.891)
Tobin’s q 9.120* 5.121* 3.132* (1.969) (1.935) (1.892)
ROA 1.543* 1.169* 1.181* (1.992) (1.883) (1.963)
Cash/net assets 1.133 3.231 3.014 (1.121) (1.791) (1.013)
Leverage − 10.126 − 11.122* − 9.122 (− 1.197) (− 1.893) (− 1.606)
IO − 0.201 − 0.224 − 0.211* (1.021) (1.692) (1.982)
%_Insider owner 0.299 − 1.321 − 1.149 (1.182) (1.036) (1.331)
Firm size 9.239** 7.133*** 7.122** (2.011) (2.424) (2.124)
Constant − 11.298** − 17.634* − 11.120** (− 2.034) (− 1.961) (− 2.042)
Industry effects Y Y Y Year effects Y Y Y N 11,677 9190 7950 Adj. R-sq 0.181 0.176 0.191
This table presents the results of model 1 where gender diversity is replaced by the percentage of female independent directors (WOB_inde-pendence) and the percentage of female inside directors (WOB_insider). Columns 1–3 present the results from OLS regressions using contem-poraneous, two- and three-year lagged levels, respectively. Industry (two-digit GICS) and year effects are included in all the regressions. Robust t- statistics are shown in parentheses. ***, **, * denote statistical significance at the 1%, 5%, and 10% level, respectively. All variables are defined in Table 1.
M. Atif et al.
Journal of Corporate Finance 66 (2021) 101665
16
Discretionary and Industrial sectors due to their high numbers of observations.20 (iv) We control for additional director characteristics, i. e., tenure, age, and qualifications.21
Table 8 reports the results of the above-mentioned tests based on models 1 and 2. Panel A repeats the OLS regressions from Tables 4 and 7, each regression using a different measure for the dependent variable and an alternative measure for the key independent variable (WOBP-adjusted). Nevertheless, the regression in Column 1 of Panel A of Table 8 is identical to the regression in Column 2 of Table 4, except for the use of four-digit GICS industry codes and state effects. When we use the alternative measures of renewable energy consumption (i.e., REN/Sales, REN/Sales (industry mean-adjusted), Ln_REN, and REN_D) in Columns 2–5, we can confirm the positive effect of the percentage of female directors. The relationship also remains consistent when using the alternative industry- mean-adjusted measure for the percentage of female directors (WOBP-adjusted) and renewable energy consumption (REN/TC (in-dustry mean) and REN/TC (industry median)) in Columns 6–7. This provides further support for H1a.22 Similarly, there is a positive effect of WOBP×REN/TC on the alternative measures of firm performance and firm value (ROE, and Tobin’s q in Column 8 and 9, respectively), providing further support for H2. Panel B confirms that these positive effects of female directors on renewable energy (including the alternative measures for both the independent and dependent variables) are observed when using Tobit and firm-fixed
Table 7 Percentage of women on the board, renewable energy, and firm value.
Variable OLS (1) OLS (2) Lagged OLS (3) Lagged OLS (4) OLS (5) OLS (6) Lagged OLS (7) Lagged OLS (8)
ROS ROA
REN/TC 0.110* 0.015* 0.011 1.013 0.122* 0.011* 0.020 1.021 (1.931) (1.891) (1.691) (1.313) (1.994) (1.897) (1.591) (1.112)
WOBP 0.142** 0.124** 1.391*** 1.171** 0.111** 0.125** 1.201** 1.113** (2.101) (2.134) (2.412) (2.151) (2.110) (2.113) (2.092) (2.124)
WOBP × REN/TC 0.143*** 0.116** 0.137*** 0.123*** 0.101*** 0.100** 0.114** 0.114** (2.823) (2.159) (2.243) (2.302) (2.433) (2.113) (2.172) (2.011)
WCEO ˉ 0.114 0.016 1.239 ˉ 0.114 0.028 1.111 ˉ (1.441) (0.232) (1.441) ˉ (1.192) (1.234) (1.134)
Board size ˉ 3.103** 0.631** 1.912** ˉ 2.142** 0.629** 1.812** ˉ (2.109) (2.021) (2.114) ˉ (2.117) (2.014) (2.183)
Duality ˉ − 0.199* − 0.014* − 0.120* ˉ − 0.170* − 0.023 − 0.123* ˉ (− 1.899) (− 1.998) (− 1.973) ˉ (− 1.899) (− 1.683) (− 1.913)
%_Board independence ˉ 2.112** 2.012** 1.982** ˉ 2.210** 2.122** 2.008** ˉ (2.031) (2.101) (2.124) ˉ (2.011) (2.013) (2.011)
B_meeting ˉ − 6.232 − 2.114 − 4.132 ˉ − 4.102 − 2.133 − 4.164 ˉ (− 0.167) (− 1.142) (− 1.703) ˉ (− 1.190) (− 1.113) (− 1.632)
Cash/net assets ˉ 0.091 0.143 0.143 ˉ 1.101 1.016 0.132 ˉ (1.612) (1.105) (1.152) ˉ (1.153) (1.123) (1.113)
Leverage ˉ − 27.122 − 23.134 − 20.133 ˉ − 19.134 − 11.123 − 11.134 ˉ (− 1.313) (− 1.634) (− 1.213) ˉ (− 0.853) (− 1.801) (− 1.432)
IO ˉ − 0.234* − 0.129 − 0.141 ˉ − 0.322* − 0.203 − 0.144 ˉ (− 1.912) (− 1.033) (− 1.431) ˉ (− 1.890) (− 1.143) (− 1.644)
%_Insider owner ˉ − 0.513* − 0.151* − 0.221* ˉ − 0.321* − 0.167* − 0.113* ˉ (− 1.916) (− 1.912) (− 1.951) ˉ (− 1.942) (− 1.916) (− 1.162)
Firm size ˉ 8.101** 9.117** 10.235*** ˉ 7.011** 6.243** 8.112** ˉ (2.016) (2.142) (2.434) ˉ (2.119) (2.144) (2.215)
Constant 7.153*** 11.143** 10.191** 13.122** 6.223*** 6.155*** 8.122** 8.112** (3.431) (2.121) (2.211) (2.101) (4.112) (2.356) (2.121) (2.172)
Industry effects Y Y Y Y Y Y Y Y Year effects Y Y Y Y Y Y Y Y N 11,677 11,677 9190 7950 11,677 11,677 9190 7950 Adj. R-sq 0.185 0.201 0.212 0.202 0.193 0.225 0.221 0.211
This table presents the regression results of model 2: firm perfi, t = α + β1(renewable_energy_consumption)i, t + β2(board_gender_diversity)i,
t + β3(board_gender_diversity × renewable_energy_consumption)i, t + β4(Z)i, t + β5 ∑
(industry effects)i + β6 ∑
(year effects)t + εi, t where firm performance is measured by the return on sales (ROS) and return on assets (ROA). Columns 1 and 5 show the results without the control variables. Columns 2–4 and 6–8 present the results when all the control variables are included. Columns 2 and 6 use the contemporaneous levels of the independent variables whereas Columns 3 and 7 use the two-year and Columns 4 and 8 use the three-year lagged levels. Industry (two-digit GICS) and year effects are included in all the regressions. Robust t-statistics are shown in parentheses. ***, **, * denote statistical significance at the 1%, 5%, and 10% level, respectively. All variables are defined in Table 1.
20 Our results (untabulated) are consistent if we exclude the Consumer Staples and Utilities industry sectors, i.e., the two sectors with the highest WOBP. 21 BoardEx provides data on directors’ qualifications, i.e., Bachelor, Master, Doctoral degrees, and professional qualifications. We calculate the
directors’ overall average qualification score, ranging from 0 to 4, from four dummy variables representing the different qualifications (equal to one in case of the presence of a qualification or multiple qualifications at the same level, and zero otherwise). 22 Our results remain largely consistent when using W1, W2, and W3, as well as the percentage of female independent directors, supporting H1b
and H1c.
M. Atif et al.
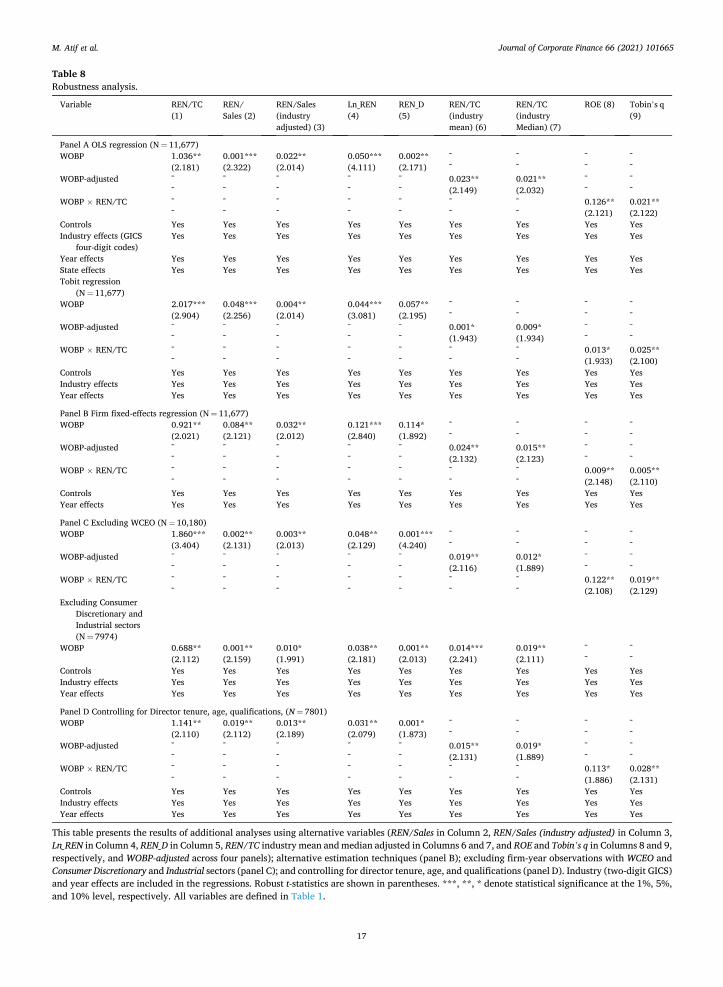
Journal of Corporate Finance 66 (2021) 101665
17
Table 8 Robustness analysis.
Variable REN/TC (1)
REN/ Sales (2)
REN/Sales (industry adjusted) (3)
Ln_REN (4)
REN_D (5)
REN/TC (industry mean) (6)
REN/TC (industry Median) (7)
ROE (8) Tobin’s q (9)
Panel A OLS regression (N = 11,677) WOBP 1.036** 0.001*** 0.022** 0.050*** 0.002** ˉ ˉ ˉ ˉ
(2.181) (2.322) (2.014) (4.111) (2.171) ˉ ˉ ˉ ˉ WOBP-adjusted ˉ ˉ ˉ ˉ ˉ 0.023** 0.021** ˉ ˉ
ˉ ˉ ˉ ˉ ˉ (2.149) (2.032) ˉ ˉ WOBP × REN/TC ˉ ˉ ˉ ˉ ˉ ˉ ˉ 0.126** 0.021**
ˉ ˉ ˉ ˉ ˉ ˉ ˉ (2.121) (2.122) Controls Yes Yes Yes Yes Yes Yes Yes Yes Yes Industry effects (GICS
four-digit codes) Yes Yes Yes Yes Yes Yes Yes Yes Yes
Year effects Yes Yes Yes Yes Yes Yes Yes Yes Yes State effects Yes Yes Yes Yes Yes Yes Yes Yes Yes Tobit regression
(N = 11,677) WOBP 2.017*** 0.048*** 0.004** 0.044*** 0.057** ˉ ˉ ˉ ˉ
(2.904) (2.256) (2.014) (3.081) (2.195) ˉ ˉ ˉ ˉ WOBP-adjusted ˉ ˉ ˉ ˉ ˉ 0.001* 0.009* ˉ ˉ
ˉ ˉ ˉ ˉ ˉ (1.943) (1.934) ˉ ˉ WOBP × REN/TC ˉ ˉ ˉ ˉ ˉ ˉ ˉ 0.013* 0.025**
ˉ ˉ ˉ ˉ ˉ ˉ ˉ (1.933) (2.100) Controls Yes Yes Yes Yes Yes Yes Yes Yes Yes Industry effects Yes Yes Yes Yes Yes Yes Yes Yes Yes Year effects Yes Yes Yes Yes Yes Yes Yes Yes Yes
Panel B Firm fixed-effects regression (N = 11,677) WOBP 0.921** 0.084** 0.032** 0.121*** 0.114* ˉ ˉ ˉ ˉ
(2.021) (2.121) (2.012) (2.840) (1.892) ˉ ˉ ˉ ˉ WOBP-adjusted ˉ ˉ ˉ ˉ ˉ 0.024** 0.015** ˉ ˉ
ˉ ˉ ˉ ˉ ˉ (2.132) (2.123) ˉ ˉ WOBP × REN/TC ˉ ˉ ˉ ˉ ˉ ˉ ˉ 0.009** 0.005**
ˉ ˉ ˉ ˉ ˉ ˉ ˉ (2.148) (2.110) Controls Yes Yes Yes Yes Yes Yes Yes Yes Yes Year effects Yes Yes Yes Yes Yes Yes Yes Yes Yes
Panel C Excluding WCEO (N = 10,180) WOBP 1.860*** 0.002** 0.003** 0.048** 0.001*** ˉ ˉ ˉ ˉ
(3.404) (2.131) (2.013) (2.129) (4.240) ˉ ˉ ˉ ˉ WOBP-adjusted ˉ ˉ ˉ ˉ ˉ 0.019** 0.012* ˉ ˉ
ˉ ˉ ˉ ˉ ˉ (2.116) (1.889) ˉ ˉ WOBP × REN/TC ˉ ˉ ˉ ˉ ˉ ˉ ˉ 0.122** 0.019**
ˉ ˉ ˉ ˉ ˉ ˉ ˉ (2.108) (2.129) Excluding Consumer
Discretionary and Industrial sectors (N = 7974)
WOBP 0.688** 0.001** 0.010* 0.038** 0.001** 0.014*** 0.019** ˉ ˉ (2.112) (2.159) (1.991) (2.181) (2.013) (2.241) (2.111) ˉ ˉ
Controls Yes Yes Yes Yes Yes Yes Yes Yes Yes Industry effects Yes Yes Yes Yes Yes Yes Yes Yes Yes Year effects Yes Yes Yes Yes Yes Yes Yes Yes Yes
Panel D Controlling for Director tenure, age, qualifications, (N = 7801) WOBP 1.141** 0.019** 0.013** 0.031** 0.001* ˉ ˉ ˉ ˉ
(2.110) (2.112) (2.189) (2.079) (1.873) ˉ ˉ ˉ ˉ WOBP-adjusted ˉ ˉ ˉ ˉ ˉ 0.015** 0.019* ˉ ˉ
ˉ ˉ ˉ ˉ ˉ (2.131) (1.889) ˉ ˉ WOBP × REN/TC ˉ ˉ ˉ ˉ ˉ ˉ ˉ 0.113* 0.028**
ˉ ˉ ˉ ˉ ˉ ˉ ˉ (1.886) (2.131) Controls Yes Yes Yes Yes Yes Yes Yes Yes Yes Industry effects Yes Yes Yes Yes Yes Yes Yes Yes Yes Year effects Yes Yes Yes Yes Yes Yes Yes Yes Yes
This table presents the results of additional analyses using alternative variables (REN/Sales in Column 2, REN/Sales (industry adjusted) in Column 3, Ln_REN in Column 4, REN_D in Column 5, REN/TC industry mean and median adjusted in Columns 6 and 7, and ROE and Tobin’s q in Columns 8 and 9, respectively, and WOBP-adjusted across four panels); alternative estimation techniques (panel B); excluding firm-year observations with WCEO and Consumer Discretionary and Industrial sectors (panel C); and controlling for director tenure, age, and qualifications (panel D). Industry (two-digit GICS) and year effects are included in the regressions. Robust t-statistics are shown in parentheses. ***, **, * denote statistical significance at the 1%, 5%, and 10% level, respectively. All variables are defined in Table 1.
M. Atif et al.

Journal of Corporate Finance 66 (2021) 101665
18
effects regressions across all the columns (Columns 1–9). Our findings are also robust to the exclusion of firm-year observations relating to female CEOs and the exclusion of firm-year observations for the Consumer Discretionary and Industrial industry sectors using OLS in Panel C. Finally, Panel D suggests that our results remain consistent even after controlling for additional characteristics of directors, i.e., age, tenure, and qualifications. Control variables, as specified in models 1 and 2, are included in all the regression specifications across the four panels.
To sum up, we find that having women on the board is positively associated with renewable energy consumption. Further, the interaction between women on the board and renewable energy consumption has a positive effect on firm performance. We can confirm the existence of both effects when using alternative measures for the dependent and independent variables, using alternative estimation techniques, excluding firm-year observations relating to female CEOs and the two industry sectors with the highest numbers of observations, and including additional director characteristics.
5.2. Identification
The gender diversity literature typically faces concerns about the potential endogeneity of female board representation (see also Abdallah et al., 2015). For instance, male directors sensitive to the positive effect of renewable energy on the environment may also be more responsive to calls for greater board gender diversity (Chen et al., 2017). Hence, our key results may reflect correlation rather
Table 9 Two-stage least squares.
Variable First-stage Second-stage
WOBP REN/TC
(1) (2)
Female_male_ratio 0.189** ˉ (2.172) ˉ
WOBP-Fitted ˉ 1.002** ˉ (2.112)
WCEO 1.131 0.132 (1.032) (1.121)
Board size 0.091** 1.341** (2.011) (2.179)
Duality 0.922 − 1.123* (0.123) (− 1.921)
%_Board independence 0.121** 3.122** (2.120) (2.117)
B_meeting 1.122 − 3.183* (1.134) (− 1.924)
Tobin’s q 0.023** 2.103 (2.081) (− 1.629)
ROA 0.023** 1.121* (2.019) (1.899)
Cash/net assets 1.121 0.214 (1.022) (1.463)
Leverage − 0.132 − 19.123 (− 0.731) (− 1.638)
IO 1.211* − 1.120* (1.891) (− 1.881)
%_Insider owner − 0.014 − 0.531 (− 1.125) (− 1.448)
Firm size 2.128* 6.132** (1.092) (2.134)
Constant 3.174*** 3.134*** (2.453) (2.331)
Industry effects Y Y Year effects Y Y N 11,677 11,677 Model fits F-statistic 10.241***
[0.001] Cragg-Donald Wald F-statistic 202.170 Stock-Yogo weak ID test critical values at 10% IV size 13.121
The table presents the results of the 2SLS regressions. Column 1 shows the first-stage regression where WOBP is the dependent variable and model fits for the instrumental variable. Female_male_ratio is the ratio of female workforce participation rate to male workforce participation rate in a given state. Column 2 shows the second-stage regression results where REN/TC is the dependent variable. Industry (two-digit GICS) and year effects are included in the regressions. Robust t-statistics are shown in parentheses. ***, **, * denote statistical significance at the 1%, 5%, and 10% level, respectively. All variables are defined in Table 1.
M. Atif et al.
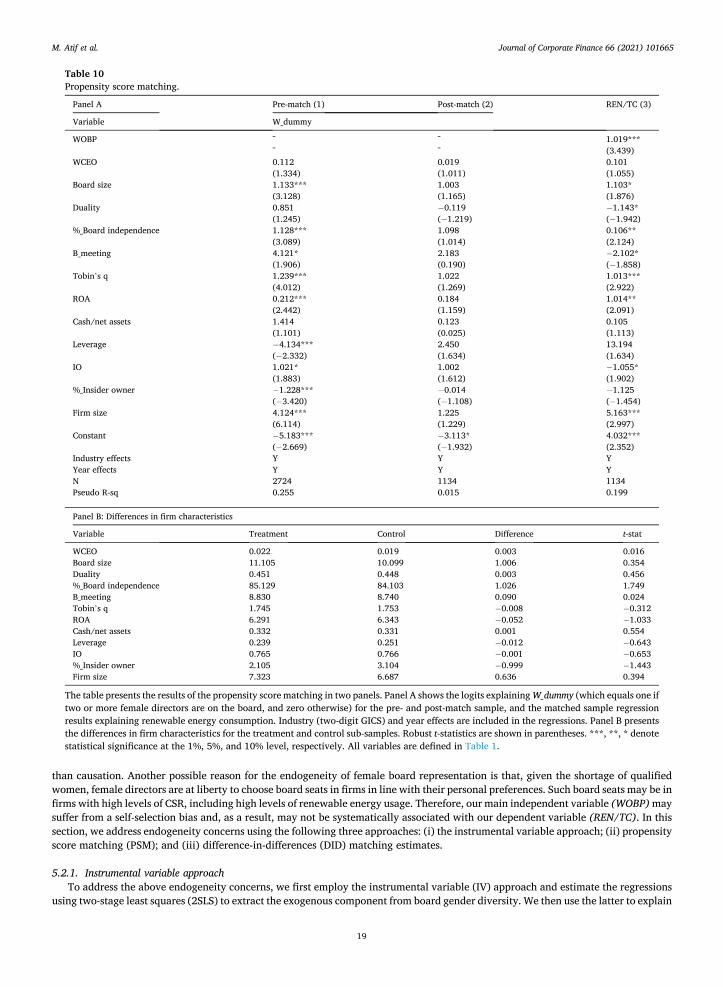
Journal of Corporate Finance 66 (2021) 101665
19
than causation. Another possible reason for the endogeneity of female board representation is that, given the shortage of qualified women, female directors are at liberty to choose board seats in firms in line with their personal preferences. Such board seats may be in firms with high levels of CSR, including high levels of renewable energy usage. Therefore, our main independent variable (WOBP) may suffer from a self-selection bias and, as a result, may not be systematically associated with our dependent variable (REN/TC). In this section, we address endogeneity concerns using the following three approaches: (i) the instrumental variable approach; (ii) propensity score matching (PSM); and (iii) difference-in-differences (DID) matching estimates.
5.2.1. Instrumental variable approach To address the above endogeneity concerns, we first employ the instrumental variable (IV) approach and estimate the regressions
using two-stage least squares (2SLS) to extract the exogenous component from board gender diversity. We then use the latter to explain
Table 10 Propensity score matching.
Panel A Pre-match (1) Post-match (2) REN/TC (3)
Variable W_dummy
WOBP ˉ ˉ 1.019*** ˉ ˉ (3.439)
WCEO 0.112 0.019 0.101 (1.334) (1.011) (1.055)
Board size 1.133*** 1.003 1.103* (3.128) (1.165) (1.876)
Duality 0.851 − 0.119 − 1.143* (1.245) (− 1.219) (− 1.942)
%_Board independence 1.128*** 1.098 0.106** (3.089) (1.014) (2.124)
B_meeting 4.121* 2.183 − 2.102* (1.906) (0.190) (− 1.858)
Tobin’s q 1.239*** 1.022 1.013*** (4.012) (1.269) (2.922)
ROA 0.212*** 0.184 1.014** (2.442) (1.159) (2.091)
Cash/net assets 1.414 0.123 0.105 (1.101) (0.025) (1.113)
Leverage − 4.134*** 2.450 13.194 (− 2.332) (1.634) (1.634)
IO 1.021* 1.002 − 1.055* (1.883) (1.612) (1.902)
%_Insider owner − 1.228*** − 0.014 − 1.125 (− 3.420) (− 1.108) (− 1.454)
Firm size 4.124*** 1.225 5.163*** (6.114) (1.229) (2.997)
Constant − 5.183*** − 3.113* 4.032*** (− 2.669) (− 1.932) (2.352)
Industry effects Y Y Y Year effects Y Y Y N 2724 1134 1134 Pseudo R-sq 0.255 0.015 0.199
Panel B: Differences in firm characteristics
Variable Treatment Control Difference t-stat
WCEO 0.022 0.019 0.003 0.016 Board size 11.105 10.099 1.006 0.354 Duality 0.451 0.448 0.003 0.456 %_Board independence 85.129 84.103 1.026 1.749 B_meeting 8.830 8.740 0.090 0.024 Tobin’s q 1.745 1.753 − 0.008 − 0.312 ROA 6.291 6.343 − 0.052 − 1.033 Cash/net assets 0.332 0.331 0.001 0.554 Leverage 0.239 0.251 − 0.012 − 0.643 IO 0.765 0.766 − 0.001 − 0.653 %_Insider owner 2.105 3.104 − 0.999 − 1.443 Firm size 7.323 6.687 0.636 0.394
The table presents the results of the propensity score matching in two panels. Panel A shows the logits explaining W_dummy (which equals one if two or more female directors are on the board, and zero otherwise) for the pre- and post-match sample, and the matched sample regression results explaining renewable energy consumption. Industry (two-digit GICS) and year effects are included in the regressions. Panel B presents the differences in firm characteristics for the treatment and control sub-samples. Robust t-statistics are shown in parentheses. ***, **, * denote statistical significance at the 1%, 5%, and 10% level, respectively. All variables are defined in Table 1.
M. Atif et al.
Journal of Corporate Finance 66 (2021) 101665
20
renewable energy consumption. The challenge in using 2SLS is the identification of exogenous IVs that do not have a direct relationship with the dependent variable. We use the female-to-male workforce participation ratio (Female_male_ratio) as an IV for WOBP. The IV is computed as the female participation ratio divided by the male participation ratio for the state of the firm’s head office.23 The female (male) participation ratio is computed as the percentage of the non-institutional population of females (males) in the civilian work-force. Similar to Chen et al. (2017), we use this instrument given that firms in states with a higher female-to-male participation ratio are more likely to find good female directors due to the larger pool of candidates and should therefore have a higher percentage of female directors. In contrast, there is little evidence, if any, that suggests that the female-to-male participation ratio of the state affects the firm’s renewable energy consumption. Hence, we expect the IV to be positively correlated with WOBP. Column 1 of Table 9 shows the results of the first-stage regression where the dependent variable is the percentage of women on the board (WOBP). The regression includes the same explanatory variables as the regression in Column 2 of Table 4. Consistent with the requirements for a valid in-strument, WOBP is positively correlated with the IV in Column 1 and the coefficient is significant at the 5% level, suggesting the validity of the IV. Moreover, the value of the F-statistic is high, and the p-value of the Cragg-Donald F weak-instrument test is 0.001, rejecting the null hypothesis that the instrument is weak (Cragg and Donald, 1993; Stock and Yogo, 2005).
Column 2 of Table 9 reports the results for the second-stage regression, which uses the predicted percentage of women on the board from the first-stage regression (WOBP-Fitted) to estimate renewable energy consumption. The results are similar to those from our main regression analysis that suggests a positive relationship between the percentage of women on the board and renewable energy con-sumption. The coefficient on the predicted percentage of women on the board is significant at the 5% level in Column 2.
5.2.2. Propensity score matching Second, we use propensity score matching (PSM) (e.g., Rosenbaum and Rubin, 1983; Lennox et al., 2011; Hossain et al., 2019) to
address the above endogeneity concerns. We assign firm-year observations with two or more female directors to the treatment group and those with fewer than two female directors to the control group. We then proceed as follows. First, we estimate the probability that a firm has two or more female directors. We run a logit regression to explain W_dummy (which equals one if two or more female directors are on the board, and zero otherwise) with the same explanatory variables used in the regression in Column 2 of Table 4. Panel A (Column 1) of Table 10 reports the results for the logit regression. The pseudo R-square for the regression is high (0.255) and most of the independent variables are (highly) significant.
Further, we use the nearest neighbor approach to ensure that firms in the treatment and control groups are sufficiently identical. Notably, each firm-year observation with two or more female directors on the board is matched with a firm-year observation with less than two female directors and with the closest propensity score. We further require the maximum difference between the propensity score of each firm-year observation and that of its matched peer not to exceed 0.1% in absolute value.24
To verify that the firm-year observations in the treatment and control groups are indistinguishable in terms of observable char-acteristics, we conduct two diagnostic tests following Chen et al. (2017) and Atif et al. (2019a). The first test consists of re-estimating the logit regression for the post-match sample. The results (Column 2 in Table 10) suggest that none of the coefficients on the explanatory variables is statistically significant, indicating that there are no significant differences in renewable energy consumption between the two groups. Moreover, the coefficients in Column 2 are typically smaller in magnitude than those in Column 1 indicating the decline in the degrees of freedom in the restricted sample. Finally, the pseudo R-square declines from 0.255 to 0.015. This suggests that propensity score matching removes all observable differences other than the difference in the presence of two or more female directors. The second test examines the differences in the mean of each observable characteristic between the treatment and the control firm-year observations. Panel B of Table 10 shows that none of the differences in the observable characteristics between the treatment and control groups is statistically significant.25 Overall, the two diagnostic tests suggest that the propensity score matching removes all of the observable differences in the explanatory variables other than those relating to female board representation.
We rerun the regression explaining renewable energy consumption based on the matched sample of firm-year observations (Column 3, Panel A in Table 10). The coefficient on WOBP is significantly positive suggesting that women on the board have a strong impact on renewable energy consumption.26 This confirms our previous results and suggests that our results are not driven by (observable) differences between firm-year observations with two or more women and those with fewer than two women.
5.2.3. Difference-in-differences matching estimates Third, we employ a difference-in-differences (DID) analysis around female director board appointments to adjust for possible
endogeneity. The DID exploits the assumption of “parallel trends” using two groups (i.e., the treatment and the control groups) to
23 The data for female-to-male participation is sourced from the US Census Bureau website. 24 Our results hold if we allow firm-year observations with female directors to be matched with multiple firm-year observations without female
directors, as well as increasing the permissible difference in propensity scores (i.e., the caliper) to 0.5% or 1.0% in absolute value. These results are not tabulated. 25 The mean difference between the treatment group and the control group is based on the average treatment effect on the treated group (ATT). 26 We also check the average treatment effect. The (untabulated) results suggest that there are significant differences (at the 1% level) in renewable
energy consumption between firm-year observations with female directors and those without. These results confirm that an increase in the use of renewable energy is attributable to the systematic difference in the presence of female directors on the board and is not attributable to other differences between firm-year observations with and those without female directors.
M. Atif et al.
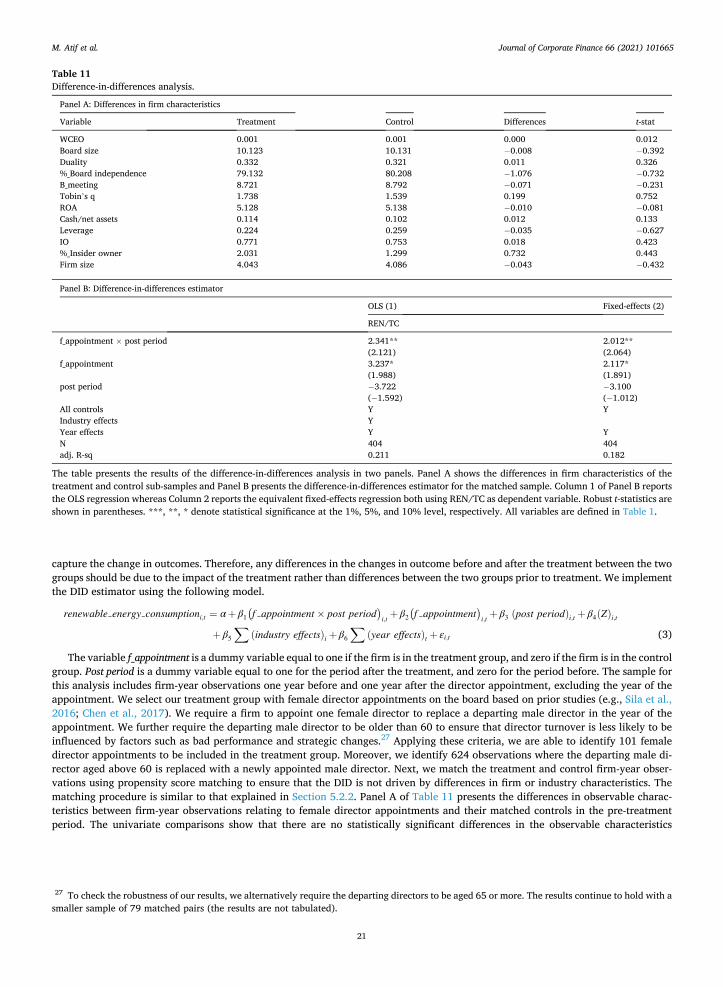
Journal of Corporate Finance 66 (2021) 101665
21
capture the change in outcomes. Therefore, any differences in the changes in outcome before and after the treatment between the two groups should be due to the impact of the treatment rather than differences between the two groups prior to treatment. We implement the DID estimator using the following model.
renewable energy consumptioni,t = α+ β1(f appointment × post period
)
i,t + β2(f appointment
)
i,t + β3 (post period)i,t + β4(Z)i,t
+ β5
∑(industry effects)i + β6
∑(year effects)t + εi,t (3)
The variable f_appointment is a dummy variable equal to one if the firm is in the treatment group, and zero if the firm is in the control group. Post period is a dummy variable equal to one for the period after the treatment, and zero for the period before. The sample for this analysis includes firm-year observations one year before and one year after the director appointment, excluding the year of the appointment. We select our treatment group with female director appointments on the board based on prior studies (e.g., Sila et al., 2016; Chen et al., 2017). We require a firm to appoint one female director to replace a departing male director in the year of the appointment. We further require the departing male director to be older than 60 to ensure that director turnover is less likely to be influenced by factors such as bad performance and strategic changes.27 Applying these criteria, we are able to identify 101 female director appointments to be included in the treatment group. Moreover, we identify 624 observations where the departing male di-rector aged above 60 is replaced with a newly appointed male director. Next, we match the treatment and control firm-year obser-vations using propensity score matching to ensure that the DID is not driven by differences in firm or industry characteristics. The matching procedure is similar to that explained in Section 5.2.2. Panel A of Table 11 presents the differences in observable charac-teristics between firm-year observations relating to female director appointments and their matched controls in the pre-treatment period. The univariate comparisons show that there are no statistically significant differences in the observable characteristics
Table 11 Difference-in-differences analysis.
Panel A: Differences in firm characteristics
Variable Treatment Control Differences t-stat
WCEO 0.001 0.001 0.000 0.012 Board size 10.123 10.131 − 0.008 − 0.392 Duality 0.332 0.321 0.011 0.326 %_Board independence 79.132 80.208 − 1.076 − 0.732 B_meeting 8.721 8.792 − 0.071 − 0.231 Tobin’s q 1.738 1.539 0.199 0.752 ROA 5.128 5.138 − 0.010 − 0.081 Cash/net assets 0.114 0.102 0.012 0.133 Leverage 0.224 0.259 − 0.035 − 0.627 IO 0.771 0.753 0.018 0.423 %_Insider owner 2.031 1.299 0.732 0.443 Firm size 4.043 4.086 − 0.043 − 0.432
Panel B: Difference-in-differences estimator
OLS (1) Fixed-effects (2)
REN/TC
f_appointment × post period 2.341** 2.012** (2.121) (2.064)
f_appointment 3.237* 2.117* (1.988) (1.891)
post period − 3.722 − 3.100 (− 1.592) (− 1.012)
All controls Y Y Industry effects Y Year effects Y Y N 404 404 adj. R-sq 0.211 0.182
The table presents the results of the difference-in-differences analysis in two panels. Panel A shows the differences in firm characteristics of the treatment and control sub-samples and Panel B presents the difference-in-differences estimator for the matched sample. Column 1 of Panel B reports the OLS regression whereas Column 2 reports the equivalent fixed-effects regression both using REN/TC as dependent variable. Robust t-statistics are shown in parentheses. ***, **, * denote statistical significance at the 1%, 5%, and 10% level, respectively. All variables are defined in Table 1.
27 To check the robustness of our results, we alternatively require the departing directors to be aged 65 or more. The results continue to hold with a smaller sample of 79 matched pairs (the results are not tabulated).
M. Atif et al.

Journal of Corporate Finance 66 (2021) 101665
22
between the two groups. The results, based on the matched sample from the DID analysis, are reported in Panel B. The coefficient on the interaction variable
(f_appointment × post period) is statistically significant (at the 5% level) and positive using OLS and fixed effects (Column 1 and 2, respectively). This suggests that, a year after the appointment of a female director, firms use significantly more renewable energy than after the appointment of a male director.28
5.3. Further analysis
In this section, we investigate the relationship between renewable energy consumption and board gender diversity for different industry sectors to rule out that our results are driven by any specific industry sector (see also Cumming et al., 2015). We also study the impact of board gender diversity in traditionally male dominated industry sectors because one could argue that its impact may be different in such industry sectors. According to the Institute for Women’s Policy Research, the Manufacturing, Communication, Utilities, Mining and Construction industry sectors are male dominated. Column 1 in Table 12 reports the coefficient of interest (i.e., the coef-ficient on WOBP) for each OLS regression based on model 1 for the 11 industry sectors (based on the two-digit GICS codes). The regressions also include the control variables as specified in model 1. Although there are differences across industry sectors, there are no clear patterns for the industry sector differences we obtain. More importantly, we still observe a positive effect of female directors on renewable energy consumption in all industry sectors. To sum up, these results are consistent with our main findings.
Finally, we investigate the effect of the interaction between board gender diversity and renewable energy on firm financial
Table 12 Industry sub-sample analysis.
GICS Industry sector OLS (1) OLS (2)
REN/TC ROS
Energy 0.073** 0.021** (2.097) (2.127)
Materials 0.024** 0.001* (2.112) (1.891)
Industrial 0.011** 0.212** (2.110) (2.190)
Consumer Discretionary 0.012** 0.032* (2.031) (1.869)
Consumer Staples 0.123* 0.033** (1.859) (2.105)
Health Care 0.253* 0.115 (1.876) (1.701)
Financials 0.021*** 0.033** (2.891) (2.025)
Information Technology 0.023** 0.001** (2.173) (2.179)
Communication 1.042** 2.004** (2.091) (2.111)
Utilities 0.011*** 1.341** (2.431) (2.152)
Real Estate 0.210* 1.042** (1.932) (2.119)
Other controls Y Y Year effects Y Y
Column 1 reports the coefficient on the percentage of women on the board for regressions explaining renewable energy consumption. The regression is run separately for each GICS (two- digit) industry sector. Column 2 shows the coefficient on the interaction between renewable energy and gender diversity for regressions explaining the firm financial performance (measured by ROS). Both columns use OLS regressions controlling for year effects and including the control variables as specified in models 1 and 2. Robust t-statistics are shown in parentheses. ***, **, * denote statistical significance at the 1%, 5%, and 10% level, respectively. All variables are defined in Table 1.
28 To establish further whether female directors increase renewable energy, we redo the difference-in-differences analysis considering only those female director appointments as part of the treatment group for which renewable energy is reported as zero prior to the appointment. Our results suggest a positive relationship (at the 10% level of significance) and we report the analysis as well as its discussion in the Appendix (Table E).
M. Atif et al.
Journal of Corporate Finance 66 (2021) 101665
23
performance (ROS). Our results suggest a positive impact of this interaction on firm financial performance (Column 2) across all in-dustry sectors, except for the Health Care sector, at the 10% level of significance or better. These results provide further support for H2.
6. Conclusions, policy implications, and limitations
This study extends the existing gender diversity literature by providing novel empirical evidence that women on the board have a significantly positive impact on the use of renewable energy. Our main results are as follows. First, our findings suggest that there is a positive impact of board gender diversity on renewable energy consumption. Importantly, this effect is only observed if the number of female directors exceeds one, supporting critical mass theory. Second, the impact of women directors on renewable energy con-sumption is mainly attributable to female independent directors rather than female executive directors. Finally, our results also indicate that firms that both use more renewable energy and have gender diverse boards enjoy better financial performance. These findings are robust to alternative econometric specifications and alternative measures of board gender diversity, renewable energy consumption, and firm performance, as well as the exclusion of certain observations and the inclusion of additional director char-acteristics variables. When using two-stage least squares (2SLS), propensity score matching (PSM), and a difference-in-differences (DID) analysis to adjust for potential endogeneity, we can confirm our results.
The main policy implication of our study is that gender-diverse boards are beneficial in terms of greater renewable energy con-sumption and that the interaction between board gender diversity and renewable energy consumption improves firm financial per-formance. As a result, firms with fewer than two women on their board should consider adding female directors to their boards.
Our study is limited to renewable energy consumption. Unfortunately, our data does not allow us to distinguish between the various sources of energy as this information is typically not disclosed. It also does not allow us to identify whether firms that use renewable energy produce part or all of that energy themselves. Future research, benefiting from improved disclosure, should re-investigate the relationship between board gender diversity and the various sources of renewable energy. Importantly, better disclosure should make it possible to distinguish between the consumption of renewable energy and its production. Future research may also investigate the relationship between female directors and renewable energy in different markets with a distinct cultural background and institutional setting, as well as with different female director traits.
Acknowledgements
We are grateful to Douglas Cumming, the Managing Editor, and two anonymous reviewers, as well as Lorne Switzer and Samuel Vigne for comments and suggestions, which have helped to improve this paper. Thanks are also due to the participants at the European Commission Conference on Promoting Sustainable Finance, Brussels, 8-9 January 2019; the Corporate Finance and Corporate Governance Workshop, Sheffield University Management School, 5 June 2019; the Annual Event of Finance Research Letters, Puerto Vallarta, 12-13 March 2020; and research seminars at the Autonomous University of Madrid, the University of Essex, and De Montfort University.
Appendix A. Difference-in-differences analysis
We employ a difference-in-differences (DID) analysis similar to that in Section 5.2.3. The sample for this analysis includes firm-year observations one year before and one year after the director appointment, excluding the year of the appointment. We require a firm to appoint one female director to replace a departing male director in the year of appointment. We only retain in the treatment group female director appointments for firms with zero renewable energy consumption prior to the appointment. Applying these criteria, we are able to identify 32 female director appointments to be included in the treatment group. Moreover, we identify 86 observations where the departing male director is replaced with a newly appointed male director. We use the following model.
renewable energy consumptioni,t = α+ β1(f appointment × post period
)
i,t + β2(f appointment
)
i,t + β3 (post period)i,t + β4(Z)i,t
+ β5
∑(industry effects)i + β6
∑(year effects)t + εi,t (4)
The variable f_appointment is a dummy variable equal to one if the firm is in the treatment group, and zero if the firm is in the control group. Post period is a dummy variable equal to one for the period after the treatment, and zero for the period before. We match the treatment and control firm-year observations using propensity score matching similar to that used in Section 5.2.2.
The results, based on the matched sample from the DID analysis, are reported in Table E. The coefficient on the interaction f_appointment × post period is statistically significant (at the 10% level) and positive. This suggests that, a year after the appointment of a female director, firms use significantly more renewable energy than after the appointment of a male director. The lower level of coefficient significance may be due to the relatively low number of observations.
M. Atif et al.
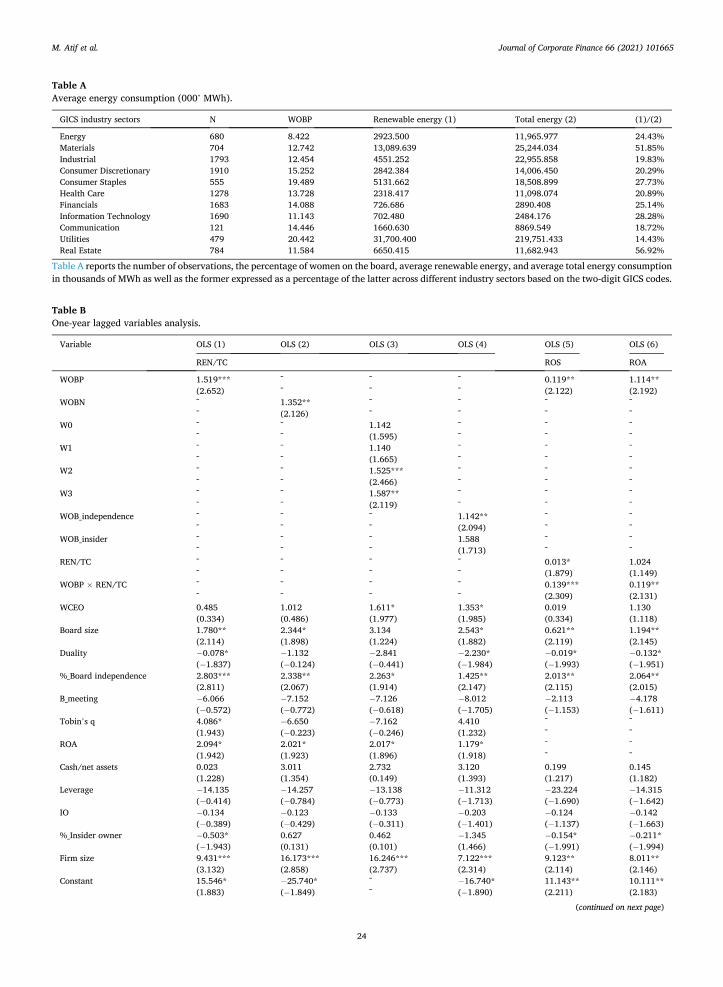
Journal of Corporate Finance 66 (2021) 101665
24
Table A Average energy consumption (000’ MWh).
GICS industry sectors N WOBP Renewable energy (1) Total energy (2) (1)/(2)
Energy 680 8.422 2923.500 11,965.977 24.43% Materials 704 12.742 13,089.639 25,244.034 51.85% Industrial 1793 12.454 4551.252 22,955.858 19.83% Consumer Discretionary 1910 15.252 2842.384 14,006.450 20.29% Consumer Staples 555 19.489 5131.662 18,508.899 27.73% Health Care 1278 13.728 2318.417 11,098.074 20.89% Financials 1683 14.088 726.686 2890.408 25.14% Information Technology 1690 11.143 702.480 2484.176 28.28% Communication 121 14.446 1660.630 8869.549 18.72% Utilities 479 20.442 31,700.400 219,751.433 14.43% Real Estate 784 11.584 6650.415 11,682.943 56.92%
Table A reports the number of observations, the percentage of women on the board, average renewable energy, and average total energy consumption in thousands of MWh as well as the former expressed as a percentage of the latter across different industry sectors based on the two-digit GICS codes.
Table B One-year lagged variables analysis.
Variable OLS (1) OLS (2) OLS (3) OLS (4) OLS (5) OLS (6)
REN/TC ROS ROA
WOBP 1.519*** ˉ ˉ ˉ 0.119** 1.114** (2.652) ˉ ˉ ˉ (2.122) (2.192)
WOBN ˉ 1.352** ˉ ˉ ˉ ˉ ˉ (2.126) ˉ ˉ ˉ ˉ
W0 ˉ ˉ 1.142 ˉ ˉ ˉ ˉ ˉ (1.595) ˉ ˉ ˉ
W1 ˉ ˉ 1.140 ˉ ˉ ˉ ˉ ˉ (1.665) ˉ ˉ ˉ
W2 ˉ ˉ 1.525*** ˉ ˉ ˉ ˉ ˉ (2.466) ˉ ˉ ˉ
W3 ˉ ˉ 1.587** ˉ ˉ ˉ ˉ ˉ (2.119) ˉ ˉ ˉ
WOB_independence ˉ ˉ ˉ 1.142** ˉ ˉ ˉ ˉ ˉ (2.094) ˉ ˉ
WOB_insider ˉ ˉ ˉ 1.588 ˉ ˉ ˉ ˉ ˉ (1.713) ˉ ˉ
REN/TC ˉ ˉ ˉ ˉ 0.013* 1.024 ˉ ˉ ˉ ˉ (1.879) (1.149)
WOBP × REN/TC ˉ ˉ ˉ ˉ 0.139*** 0.119** ˉ ˉ ˉ ˉ (2.309) (2.131)
WCEO 0.485 1.012 1.611* 1.353* 0.019 1.130 (0.334) (0.486) (1.977) (1.985) (0.334) (1.118)
Board size 1.780** 2.344* 3.134 2.543* 0.621** 1.194** (2.114) (1.898) (1.224) (1.882) (2.119) (2.145)
Duality − 0.078* − 1.132 − 2.841 − 2.230* − 0.019* − 0.132* (− 1.837) (− 0.124) (− 0.441) (− 1.984) (− 1.993) (− 1.951)
%_Board independence 2.803*** 2.338** 2.263* 1.425** 2.013** 2.064** (2.811) (2.067) (1.914) (2.147) (2.115) (2.015)
B_meeting − 6.066 − 7.152 − 7.126 − 8.012 − 2.113 − 4.178 (− 0.572) (− 0.772) (− 0.618) (− 1.705) (− 1.153) (− 1.611)
Tobin’s q 4.086* − 6.650 − 7.162 4.410 ˉ ˉ (1.943) (− 0.223) (− 0.246) (1.232) ˉ ˉ
ROA 2.094* 2.021* 2.017* 1.179* ˉ ˉ (1.942) (1.923) (1.896) (1.918) ˉ ˉ
Cash/net assets 0.023 3.011 2.732 3.120 0.199 0.145 (1.228) (1.354) (0.149) (1.393) (1.217) (1.182)
Leverage − 14.135 − 14.257 − 13.138 − 11.312 − 23.224 − 14.315 (− 0.414) (− 0.784) (− 0.773) (− 1.713) (− 1.690) (− 1.642)
IO − 0.134 − 0.123 − 0.133 − 0.203 − 0.124 − 0.142 (− 0.389) (− 0.429) (− 0.311) (− 1.401) (− 1.137) (− 1.663)
%_Insider owner − 0.503* 0.627 0.462 − 1.345 − 0.154* − 0.211* (− 1.943) (0.131) (0.101) (1.466) (− 1.991) (− 1.994)
Firm size 9.431*** 16.173*** 16.246*** 7.122*** 9.123** 8.011** (3.132) (2.858) (2.737) (2.314) (2.114) (2.146)
Constant 15.546* − 25.740* ˉ − 16.740* 11.143** 10.111** (1.883) (− 1.849) ˉ (− 1.890) (2.211) (2.183)
(continued on next page)
M. Atif et al.
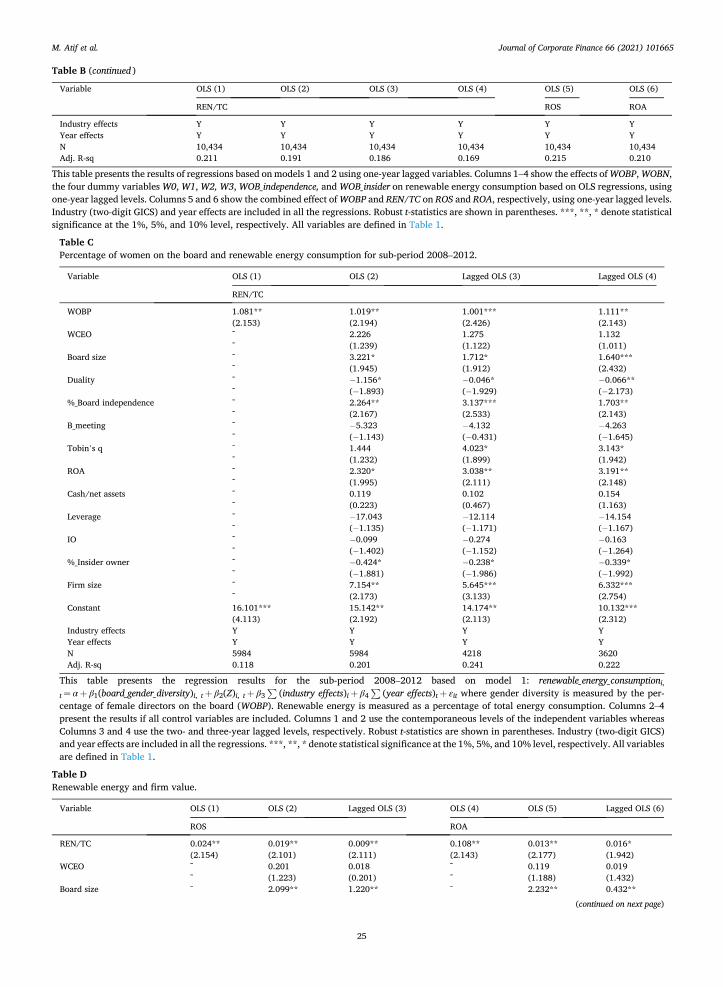
Journal of Corporate Finance 66 (2021) 101665
25
Table B (continued )
Variable OLS (1) OLS (2) OLS (3) OLS (4) OLS (5) OLS (6)
REN/TC ROS ROA
Industry effects Y Y Y Y Y Y Year effects Y Y Y Y Y Y N 10,434 10,434 10,434 10,434 10,434 10,434 Adj. R-sq 0.211 0.191 0.186 0.169 0.215 0.210
This table presents the results of regressions based on models 1 and 2 using one-year lagged variables. Columns 1–4 show the effects of WOBP, WOBN, the four dummy variables W0, W1, W2, W3, WOB_independence, and WOB_insider on renewable energy consumption based on OLS regressions, using one-year lagged levels. Columns 5 and 6 show the combined effect of WOBP and REN/TC on ROS and ROA, respectively, using one-year lagged levels. Industry (two-digit GICS) and year effects are included in all the regressions. Robust t-statistics are shown in parentheses. ***, **, * denote statistical significance at the 1%, 5%, and 10% level, respectively. All variables are defined in Table 1.
Table C Percentage of women on the board and renewable energy consumption for sub-period 2008–2012.
Variable OLS (1) OLS (2) Lagged OLS (3) Lagged OLS (4)
REN/TC
WOBP 1.081** 1.019** 1.001*** 1.111** (2.153) (2.194) (2.426) (2.143)
WCEO ˉ 2.226 1.275 1.132 ˉ (1.239) (1.122) (1.011)
Board size ˉ 3.221* 1.712* 1.640*** ˉ (1.945) (1.912) (2.432)
Duality ˉ − 1.156* − 0.046* − 0.066** ˉ (− 1.893) (− 1.929) (− 2.173)
%_Board independence ˉ 2.264** 3.137*** 1.703** ˉ (2.167) (2.533) (2.143)
B_meeting ˉ − 5.323 − 4.132 − 4.263 ˉ (− 1.143) (− 0.431) (− 1.645)
Tobin’s q ˉ 1.444 4.023* 3.143* ˉ (1.232) (1.899) (1.942)
ROA ˉ 2.320* 3.038** 3.191** ˉ (1.995) (2.111) (2.148)
Cash/net assets ˉ 0.119 0.102 0.154 ˉ (0.223) (0.467) (1.163)
Leverage ˉ − 17.043 − 12.114 − 14.154 ˉ (− 1.135) (− 1.171) (− 1.167)
IO ˉ − 0.099 − 0.274 − 0.163 ˉ (− 1.402) (− 1.152) (− 1.264)
%_Insider owner ˉ − 0.424* − 0.238* − 0.339* ˉ (− 1.881) (− 1.986) (− 1.992)
Firm size ˉ 7.154** 5.645*** 6.332*** ˉ (2.173) (3.133) (2.754)
Constant 16.101*** 15.142** 14.174** 10.132*** (4.113) (2.192) (2.113) (2.312)
Industry effects Y Y Y Y Year effects Y Y Y Y N 5984 5984 4218 3620 Adj. R-sq 0.118 0.201 0.241 0.222
This table presents the regression results for the sub-period 2008–2012 based on model 1: renewable_energy_consumptioni,
t = α + β1(board_gender_diversity)i, t + β2(Z)i, t + β3 ∑
(industry effects)i + β4 ∑
(year effects)t + εit where gender diversity is measured by the per-centage of female directors on the board (WOBP). Renewable energy is measured as a percentage of total energy consumption. Columns 2–4 present the results if all control variables are included. Columns 1 and 2 use the contemporaneous levels of the independent variables whereas Columns 3 and 4 use the two- and three-year lagged levels, respectively. Robust t-statistics are shown in parentheses. Industry (two-digit GICS) and year effects are included in all the regressions. ***, **, * denote statistical significance at the 1%, 5%, and 10% level, respectively. All variables are defined in Table 1.
Table D Renewable energy and firm value.
Variable OLS (1) OLS (2) Lagged OLS (3) OLS (4) OLS (5) Lagged OLS (6)
ROS ROA
REN/TC 0.024** 0.019** 0.009** 0.108** 0.013** 0.016* (2.154) (2.101) (2.111) (2.143) (2.177) (1.942)
WCEO ˉ 0.201 0.018 ˉ 0.119 0.019 ˉ (1.223) (0.201) ˉ (1.188) (1.432)
Board size ˉ 2.099** 1.220** ˉ 2.232** 0.432**
(continued on next page)
M. Atif et al.
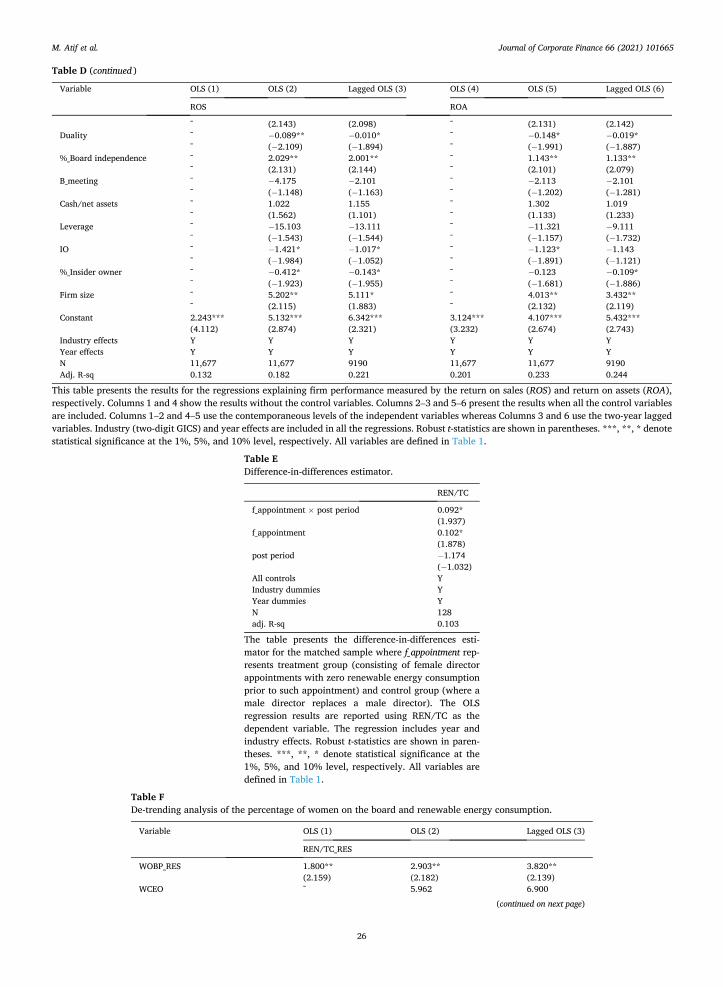
Journal of Corporate Finance 66 (2021) 101665
26
Table D (continued )
Variable OLS (1) OLS (2) Lagged OLS (3) OLS (4) OLS (5) Lagged OLS (6)
ROS ROA
ˉ (2.143) (2.098) ˉ (2.131) (2.142) Duality ˉ − 0.089** − 0.010* ˉ − 0.148* − 0.019*
ˉ (− 2.109) (− 1.894) ˉ (− 1.991) (− 1.887) %_Board independence ˉ 2.029** 2.001** ˉ 1.143** 1.133**
ˉ (2.131) (2.144) ˉ (2.101) (2.079) B_meeting ˉ − 4.175 − 2.101 ˉ − 2.113 − 2.101
ˉ (− 1.148) (− 1.163) ˉ (− 1.202) (− 1.281) Cash/net assets ˉ 1.022 1.155 ˉ 1.302 1.019
ˉ (1.562) (1.101) ˉ (1.133) (1.233) Leverage ˉ − 15.103 − 13.111 ˉ − 11.321 − 9.111
ˉ (− 1.543) (− 1.544) ˉ (− 1.157) (− 1.732) IO ˉ − 1.421* − 1.017* ˉ − 1.123* − 1.143
ˉ (− 1.984) (− 1.052) ˉ (− 1.891) (− 1.121) %_Insider owner ˉ − 0.412* − 0.143* ˉ − 0.123 − 0.109*
ˉ (− 1.923) (− 1.955) ˉ (− 1.681) (− 1.886) Firm size ˉ 5.202** 5.111* ˉ 4.013** 3.432**
ˉ (2.115) (1.883) ˉ (2.132) (2.119) Constant 2.243*** 5.132*** 6.342*** 3.124*** 4.107*** 5.432***
(4.112) (2.874) (2.321) (3.232) (2.674) (2.743) Industry effects Y Y Y Y Y Y Year effects Y Y Y Y Y Y N 11,677 11,677 9190 11,677 11,677 9190 Adj. R-sq 0.132 0.182 0.221 0.201 0.233 0.244
This table presents the results for the regressions explaining firm performance measured by the return on sales (ROS) and return on assets (ROA), respectively. Columns 1 and 4 show the results without the control variables. Columns 2–3 and 5–6 present the results when all the control variables are included. Columns 1–2 and 4–5 use the contemporaneous levels of the independent variables whereas Columns 3 and 6 use the two-year lagged variables. Industry (two-digit GICS) and year effects are included in all the regressions. Robust t-statistics are shown in parentheses. ***, **, * denote statistical significance at the 1%, 5%, and 10% level, respectively. All variables are defined in Table 1.
Table E Difference-in-differences estimator.
REN/TC
f_appointment × post period 0.092* (1.937)
f_appointment 0.102* (1.878)
post period − 1.174 (− 1.032)
All controls Y Industry dummies Y Year dummies Y N 128 adj. R-sq 0.103
The table presents the difference-in-differences esti-mator for the matched sample where f_appointment rep-resents treatment group (consisting of female director appointments with zero renewable energy consumption prior to such appointment) and control group (where a male director replaces a male director). The OLS regression results are reported using REN/TC as the dependent variable. The regression includes year and industry effects. Robust t-statistics are shown in paren-theses. ***, **, * denote statistical significance at the 1%, 5%, and 10% level, respectively. All variables are defined in Table 1.
Table F De-trending analysis of the percentage of women on the board and renewable energy consumption.
Variable OLS (1) OLS (2) Lagged OLS (3)
REN/TC_RES
WOBP_RES 1.800** 2.903** 3.820** (2.159) (2.182) (2.139)
WCEO ˉ 5.962 6.900
(continued on next page)
M. Atif et al.
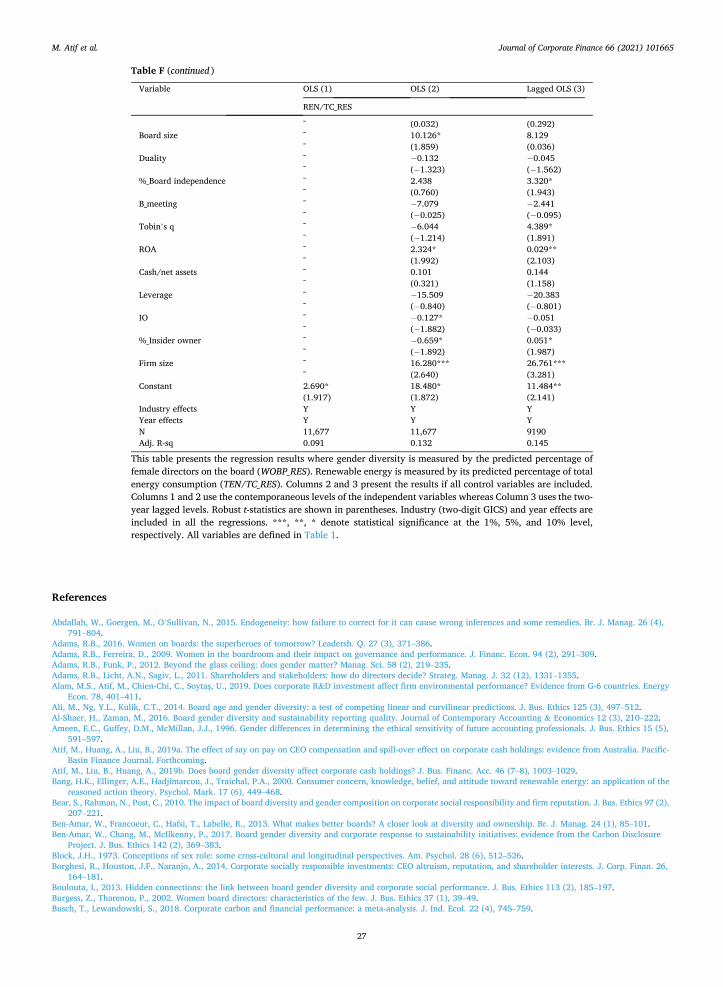
Journal of Corporate Finance 66 (2021) 101665
27
Table F (continued )
Variable OLS (1) OLS (2) Lagged OLS (3)
REN/TC_RES
ˉ (0.032) (0.292) Board size ˉ 10.126* 8.129
ˉ (1.859) (0.036) Duality ˉ − 0.132 − 0.045
ˉ (− 1.323) (− 1.562) %_Board independence ˉ 2.438 3.320*
ˉ (0.760) (1.943) B_meeting ˉ − 7.079 − 2.441
ˉ (− 0.025) (− 0.095) Tobin’s q ˉ − 6.044 4.389*
ˉ (− 1.214) (1.891) ROA ˉ 2.324* 0.029**
ˉ (1.992) (2.103) Cash/net assets ˉ 0.101 0.144
ˉ (0.321) (1.158) Leverage ˉ − 15.509 − 20.383
ˉ (− 0.840) (− 0.801) IO ˉ − 0.127* − 0.051
ˉ (− 1.882) (− 0.033) %_Insider owner ˉ − 0.659* 0.051*
ˉ (− 1.892) (1.987) Firm size ˉ 16.280*** 26.761***
ˉ (2.640) (3.281) Constant 2.690* 18.480* 11.484**
(1.917) (1.872) (2.141) Industry effects Y Y Y Year effects Y Y Y N 11,677 11,677 9190 Adj. R-sq 0.091 0.132 0.145
This table presents the regression results where gender diversity is measured by the predicted percentage of female directors on the board (WOBP_RES). Renewable energy is measured by its predicted percentage of total energy consumption (TEN/TC_RES). Columns 2 and 3 present the results if all control variables are included. Columns 1 and 2 use the contemporaneous levels of the independent variables whereas Column 3 uses the two- year lagged levels. Robust t-statistics are shown in parentheses. Industry (two-digit GICS) and year effects are included in all the regressions. ***, **, * denote statistical significance at the 1%, 5%, and 10% level, respectively. All variables are defined in Table 1.
References
Abdallah, W., Goergen, M., O’Sullivan, N., 2015. Endogeneity: how failure to correct for it can cause wrong inferences and some remedies. Br. J. Manag. 26 (4), 791–804.
Adams, R.B., 2016. Women on boards: the superheroes of tomorrow? Leadersh. Q. 27 (3), 371–386. Adams, R.B., Ferreira, D., 2009. Women in the boardroom and their impact on governance and performance. J. Financ. Econ. 94 (2), 291–309. Adams, R.B., Funk, P., 2012. Beyond the glass ceiling: does gender matter? Manag. Sci. 58 (2), 219–235. Adams, R.B., Licht, A.N., Sagiv, L., 2011. Shareholders and stakeholders: how do directors decide? Strateg. Manag. J. 32 (12), 1331–1355. Alam, M.S., Atif, M., Chien-Chi, C., Soytas, U., 2019. Does corporate R&D investment affect firm environmental performance? Evidence from G-6 countries. Energy
Econ. 78, 401–411. Ali, M., Ng, Y.L., Kulik, C.T., 2014. Board age and gender diversity: a test of competing linear and curvilinear predictions. J. Bus. Ethics 125 (3), 497–512. Al-Shaer, H., Zaman, M., 2016. Board gender diversity and sustainability reporting quality. Journal of Contemporary Accounting & Economics 12 (3), 210–222. Ameen, E.C., Guffey, D.M., McMillan, J.J., 1996. Gender differences in determining the ethical sensitivity of future accounting professionals. J. Bus. Ethics 15 (5),
591–597. Atif, M., Huang, A., Liu, B., 2019a. The effect of say on pay on CEO compensation and spill-over effect on corporate cash holdings: evidence from Australia. Pacific-
Basin Finance Journal. Forthcoming. Atif, M., Liu, B., Huang, A., 2019b. Does board gender diversity affect corporate cash holdings? J. Bus. Financ. Acc. 46 (7–8), 1003–1029. Bang, H.K., Ellinger, A.E., Hadjimarcou, J., Traichal, P.A., 2000. Consumer concern, knowledge, belief, and attitude toward renewable energy: an application of the
reasoned action theory. Psychol. Mark. 17 (6), 449–468. Bear, S., Rahman, N., Post, C., 2010. The impact of board diversity and gender composition on corporate social responsibility and firm reputation. J. Bus. Ethics 97 (2),
207–221. Ben-Amar, W., Francoeur, C., Hafsi, T., Labelle, R., 2013. What makes better boards? A closer look at diversity and ownership. Br. J. Manag. 24 (1), 85–101. Ben-Amar, W., Chang, M., McIlkenny, P., 2017. Board gender diversity and corporate response to sustainability initiatives: evidence from the Carbon Disclosure
Project. J. Bus. Ethics 142 (2), 369–383. Block, J.H., 1973. Conceptions of sex role: some cross-cultural and longitudinal perspectives. Am. Psychol. 28 (6), 512–526. Borghesi, R., Houston, J.F., Naranjo, A., 2014. Corporate socially responsible investments: CEO altruism, reputation, and shareholder interests. J. Corp. Finan. 26,
164–181. Boulouta, I., 2013. Hidden connections: the link between board gender diversity and corporate social performance. J. Bus. Ethics 113 (2), 185–197. Burgess, Z., Tharenou, P., 2002. Women board directors: characteristics of the few. J. Bus. Ethics 37 (1), 39–49. Busch, T., Lewandowski, S., 2018. Corporate carbon and financial performance: a meta-analysis. J. Ind. Ecol. 22 (4), 745–759.
M. Atif et al.
Journal of Corporate Finance 66 (2021) 101665
28
Campbell, K., Minguez-Vera, A., 2008. Gender diversity in the boardroom and firm financial performance. J. Bus. Ethics 83 (3), 435–451. Carter, S.M., 2006. The interaction of top management group, stakeholder, and situational factors on certain corporate reputation management activities. J. Manag.
Stud. 43 (5), 1145–1176. Carter, D.A., Simkins, B.J., Simpson, W.G., 2003. Corporate governance, board diversity, and firm value. Financ. Rev. 38 (1), 33–53. Chen, C.-W., Velasquez Tuliao, K., Cullen, J.B., Chang, Y.-Y., 2016. Does gender influence managers’ ethics? A cross-cultural analysis. Business Ethics 25 (4), 345–362. Chen, J., Leung, W.S., Goergen, M., 2017. The impact of board gender composition on dividend payouts. J. Corp. Finan. 43, 86–105. Chen, J., Leung, W.S., Song, W., Goergen, M., 2019. Why female board representation matters: the role of female directors in reducing male CEO overconfidence.
J. Empir. Financ. 53, 70–90. Cohen, J.R., Pant, L.W., Sharp, D.J., 1998. The effect of gender and academic discipline diversity on the ethical evaluations, ethical intentions and ethical orientation
of potential public accounting recruits. Account. Horiz. 12 (3), 250–270. United Nations’ 21st Conference of the Parties (COP21). http://www.cop21paris.org/about/cop21, 2015 (accessed on 21st April 2017). Cragg, J., Donald, S., 1993. Testing identifiability and specification in instrumental variable models. Econometric Theory 9 (2), 222–240. Croson, R., Gneezy, U., 2009. Gender differences in preferences. J. Econ. Lit. 47 (2), 448–474. Cumming, D., Leung, T.Y., Rui, O., 2015. Gender diversity and securities fraud. Acad. Manag. J. 58 (5), 1572–1593. Eagly, A.H., Crowley, M., 1986. Gender and helping behavior: a meta-analytic review of the social psychological literature. Psychol. Bull. 100 (3), 283–308. Endrikat, J., Guenther, E., Hoppe, H., 2014. Making sense of conflicting empirical findings: a meta-analytic review of the relationship between corporate
environmental and financial performance. Eur. Manag. J. 32 (5), 735–751. Environmental Protection Agency (EPA), 2020. Overview of Greenhouse Gases. Available at. https://www.epa.gov/ghgemissions/overview-greenhouse-gases.
Accessed on 23 May 2020. Erhardt, N.L., Werbel, J.D., Shrader, C.B., 2003. Board of director diversity and firm financial performance. Corporate Governance: An International Review 11 (2),
102–111. Forbes, D.P., Milliken, F.J., 1999. Cognition and corporate governance: understanding boards of directors as strategic decision-making groups. Acad. Manag. Rev. 24
(3), 489–505. Gallego-Alvarez, I., Segura, L., Martínez-Ferrero, J., 2015. Carbon emission reduction: the impact on the financial and operational performance of international
companies. J. Clean. Prod. 103, 149–159. García Lara, J.M., García Osma, B., Mora, A., Scapin, M., 2017. The monitoring role of female directors over accounting quality. J. Corp. Finan. 45, 651–668. Gilligan, C., 1977. In a different voice: Women’s conceptions of self and of morality. Harv. Educ. Rev. 47 (4), 481–517. Goergen, M., Renneboog, L., 2014. Inside the board room. J. Corp. Finan. 28, 1–5. Graves, S.B., Waddock, S.A., 1999. A look at the financial-social performance nexus when quality of management is held constant. International Journal of Value-
Based Management 12 (1), 87–99. Gul, F.A., Srinidhi, B., Ng, A.C., 2011. Does board gender diversity improve the informativeness of stock prices? J. Account. Econ. 51, 314–338. Hafsi, T., Turgut, G., 2013. Boardroom diversity and its effect on social performance: conceptualization and empirical evidence. J. Bus. Ethics 112 (3), 463–479. Harford, J., Mansi, S., Maxwell, W., 2008. Corporate governance and firm cash holdings in the US. J. Financ. Econ. 87, 535–555. Hart, S.L., 1995. A natural-resource-based view of the firm. Acad. Manag. Rev. 20 (4), 986–1014. Heugens, P.P.M.A.R., Van Riel, C.B.M., Van Den Bosch, F.A.J., 2004. Reputation management capabilities as decision rules. Journal of Management Studies 41 (8),
1349–1377. Hill, C.W., Jones, T.M., 1992. Stakeholder-agency theory. J. Manag. Stud. 29 (2), 131–154. Hillman, A.J., Dalziel, T., 2003. Boards of directors and firm performance: integrating agency and resource dependence perspectives. Acad. Manag. Rev. 28 (3),
383–396. Hoobler, J.M., Masterson, C.R., Nkomo, S.M., Michel, E.J., 2018. The business case for women leaders: meta-analysis, research critique, and path forward. J. Manag.
44 (6), 2473–2499. Horvathova, E., 2010. Does environmental performance affect financial performance? A meta-analysis. Ecol. Econ. 70 (1), 52–59. Hossain, M., Atif, M., Ahmed, A., Mia, L., 2019. Do LGBT workplace diversity policies create value for firms? J. Bus. Ethics 1–17. Ibrahim, N., Angelidis, J., Tomic, I.M., 2009. Managers’ attitudes toward codes of ethics: are there gender difference. J. Bus. Ethics 90 (S3), 343–353. Intergovernmental Panel on Climate Change (IPCC), 2007. Climate Change 2007: The Physical Science Basis. Available at. https://www.ipcc.ch/pdf/assessment-
report/ar4/wg1/ar4-wg1-frontmatter.pdf. Accessed on 12 April 2016. International Energy Agency, IEA, 2019. Key World Energy Statistics. OECD, IEA Paris. http://www.oecd.org/publications/key-world-energy-statistics-22202811.
htm. Isidro, H., Sobral, M., 2015. The effects of women on corporate boards on firm value, financial performance, and ethical and social compliance. J. Bus. Ethics 132 (1),
1–19. Jia, M., Zhang, Z., 2013. Critical mass of women on BODs, multiple identities, and corporate philanthropic disaster response: evidence from privately owned Chinese
firms. J. Bus. Ethics 118 (2), 303–317. Jizi, M., 2017. The influence of board composition on sustainable development disclosure. Bus. Strateg. Environ. 26 (5), 640–655. Joecks, J., Pull, K., Vetter, K., 2013. Gender diversity in the boardroom and firm performance: what exactly constitutes a “critical mass”? J. Bus. Ethics 118 (1), 61–72. Johnson, R.A., Greening, D.W., 1999. The effects of corporate governance and institutional ownership types on corporate social performance. Acad. Manag. J. 42 (5),
564–576. Kang, H., Cheng, M., Gray, S.J., 2007. Corporate governance and board composition: diversity and independence of Australian boards. Corporate Governance: An
International Review 15 (2), 194–207. Kanter, R.M., 1977a. Men and Women of the Corporation. Publishers of New York. Kanter, R.M., 1977b. Some effects of proportions on group life. Am. J. Sociol. 82 (5), 965–990. Kennedy, E.H., Dzialo, L., 2015. Locating gender in environmental sociology. Sociol. Compass 9 (10), 920–929. Klassen, R.D., Whybark, D.C., 1999. Environmental management in operations: the selection of environmental technologies. Decis. Sci. 30 (3), 601–631. Konrad, A.M., Kramer, V., Erkut, S., 2008. Critical mass: the impact of three or more women on corporate boards. Organ. Dyn. 37 (2), 145–164. Kristie, J., 2011. The power of three. Directors & Boards 35 (5), 22–32. Lanis, R., Richardson, G., Taylor, G., 2017. Board of director gender and corporate tax aggressiveness: an empirical analysis. J. Bus. Ethics 144 (3), 577–596. Lardaro, L., 1993. Applied Econometrics. Harper Collins, New York. Larrieta-Rubín de Celis, I., Velasco-Balmaseda, E., Fernandez de Bobadilla, S., Alonso-Almeida, M.D.M., Intxaurburu-Clemente, G., 2015. Does having women
managers lead to increased gender equality practices in corporate social responsibility? Business Ethics: A European Review 24 (1), 91–110. Lash, J., Wellington, F., 2007. Competitive advantage on a warming planet. Harv. Bus. Rev. 85 (3), 94–102. Lee, P.M., James, E.H., 2007. She’-e-os: gender effects and investor reactions to the announcements of top executive appointments. Strateg. Manag. J. 28 (3),
227–241. Lee, K.H., Min, B., Yook, K.H., 2015. The impacts of carbon (CO2) emissions and environmental research and development (R&D) investment on firm performance.
Int. J. Prod. Econ. 167, 1–11. Lennox, C.S., Francis, J.R., Wang, Z., 2011. Selection models in accounting research. Account. Rev. 87 (2), 589–616. Levi, M., Li, K., Zhang, F., 2014. Director gender and mergers and acquisitions. J. Corp. Finan. 28, 185–200. Li, Y., Zhang, X.-Y., 2019. Impact of board gender composition on corporate debt maturity structures. Eur. Financ. Manag. 25 (5), 1286–1320. Liao, L., Luo, L., Tang, Q., 2015. Gender diversity, board independence, environmental committee and greenhouse gas disclosure. British Accounting Review 47 (4),
409–424. Liu, C., 2018. Are women greener? Corporate gender diversity and environmental violations. J. Corp. Finan. 52, 118–142.
M. Atif et al.
Journal of Corporate Finance 66 (2021) 101665
29
Liu, Y., Wei, Z., Xie, F., 2014. Do women directors improve firm performance in China? J. Corp. Finan. 28, 169–184. Longstreth, M., Turner, J., Topliff, M.L., Iams, D.R., 1989. Support for soft and hard path American energy policies: does gender play a role? Women’s Stud. Int. Forum
12 (2), 213–226. Mactsa, D.A., Miller, A.R., 2013. A female style in corporate leadership? Evidence from quotas. American Economic Journal: Applied Economics 5, 136–169. McCright, A.M., Xiao, C., 2014. Gender and environmental concern: insights from recent work and for future research. Soc. Nat. Resour. 27 (10), 1109–1113. McGuinness, P.B., Vieito, J.P., Wang, M., 2017. The role of board gender and foreign ownership in the CSR performance of Chinese listed firms. J. Corp. Finan. 42,
75–99. Nekhili, M., Nagati, H., Chtioui, T., Nekhili, A., 2017. Gender-diverse board and the relevance of voluntary CSR reporting. Int. Rev. Financ. Anal. 50, 81–100. Oumlil, A.B., Balloun, J.L., 2009. Ethical decision-making differences between American and Moroccan managers. J. Bus. Ethics 84 (4), 457–478. Owen, A.L., Temesvary, J., 2018. The performance effects of gender diversity on bank boards. J. Bank. Financ. 90, 50–63. Owusu, P.A., Asumadu-Sarkodie, S., 2016. A review of renewable energy sources, sustainability issues and climate change mitigation. Cogent Engineering 3 (1), 1–14. Pearl-Martinez, R., Stephens, J.C., 2016. Toward a gender diverse workforce in the renewable energy transition. Sustainability: Science, Practice and Policy 12 (1),
8–15. Petersen, M.A., 2009. Estimating standard errors in finance panel data sets: comparing approaches. Rev. Financ. Stud. 22 (1), 435–480. Porter, M.E., Van der Linde, C., 1995. Toward a new conception of the environment-competitiveness relationship. J. Econ. Perspect. 9 (4), 97–118. Post, C., Byron, K., 2015. Women on boards and firm financial performance: a meta-analysis. Acad. Manag. J. 58 (5), 1546–1571. Post, C., Rahman, N., Rubow, E., 2011. Green governance: boards of directors’ composition and environmental corporate social responsibility. Bus. Soc. 50 (1),
189–223. Prado-Lorenzo, J.M., Garcia-Sanchez, I.M., 2010. The role of the board of directors in disseminating relevant information on greenhouse gases. J. Bus. Ethics 97 (3),
391–424. Qiu, Y., Shaukat, A., Tharyan, R., 2016. Environmental and social disclosures: link with corporate financial performance. British Accounting Review 48 (1), 102–116. Rindova, V.P., 1999. What corporate boards have to do with strategy: a cognitive perspective. J. Manag. Stud. 36 (7), 953–975. Rosenbaum, P.R., Rubin, D.B., 1983. The central role of the propensity score in observational studies for causal effects. Biometrika 70 (1), 41–55. Rutherford, M.A., Buchholtz, A.K., 2007. Investigating the relationship between board characteristics and board information. Corporate Governance: An International
Review 15 (4), 576–584. Schubert, R., Brown, M., Gysler, M., Brachinger, H.W., 1999. Financial decision-making: are women really more risk-averse? Am. Econ. Rev. 89 (2), 381–385. Shaukat, A., Qiu, Y., Trojanowski, G., 2016. Board attributes, corporate social responsibility strategy, and corporate environmental and social performance. J. Bus.
Ethics 135, 569–585. Sherrick, B., Hoewe, J., Waddell, T.F., 2014. The role of stereotypical beliefs in gender-based activation of the Proteus effect. Comput. Hum. Behav. 38, 17–24. Sila, V., Gonzalez, A., Hagendorff, J., 2016. Women on board: does boardroom gender diversity affect firm risk? J. Corp. Finan. 36, 26–53. Singh, V., Vinnicombe, S., 2004. Why so few women directors in top UK boardrooms? Evidence and theoretical explanations. Corporate Governance: An International
Review 12 (4), 479–488. Smith, N., Smith, V., Verner, M., 2006. Do women in top management affect firm performance? A Panel study of 2,300 Danish firms. Int. J. Product. Perform. Manag.
55 (7), 569–593. Stock, J., Yogo, M., 2005. Testing for Weak Instruments in Linear IV Regression. Identification and Inference for Econometric Models: Essays in Honor of Thomas
Rothenberg. Cambridge University Press, Cambridge, pp. 80–108. Sunden, A.E., Surette, B.J., 1998. Gender differences in the allocation of assets in retirement savings plans. Am. Econ. Rev. 88 (2), 207–211. Telle, K., 2006. “It pays to be green”–a premature conclusion? Environ. Resour. Econ. 35 (3), 195–220. Terjesen, S., Sealy, R., Singh, V., 2009. Women directors on corporate boards: a review and research agenda. Corporate Governance: An International Review 17 (3),
320–337. Tormo-Carbo, G., Oltra, V., Klimkiewicz, K., Seguí-Mas, E., 2019. “Don’t try to teach me, I got nothing to learn”: management students’ perceptions of business ethics
teaching. Business Ethics 28 (4), 506–528. Walley, N., Whitehead, B., 1994. It’s not easy being green. Reader in Bus. Environ. 36, 81. Williams, R.J., 2003. Women on corporate boards of directors and their influence on corporate philanthropy. J. Bus. Ethics 42 (1), 1–10.
M. Atif et al.


![[MozCon] How Gender and Cultural Differences in Web Psychology Affect the Customer Experience](https://static.fdocuments.us/doc/165x107/54c7338a4a7959d67c8b461a/mozcon-how-gender-and-cultural-differences-in-web-psychology-affect-the-customer-experience.jpg)