“Does Anyone Know How to Get Good Answers?” How Social...
25
“Does Anyone Know How to Get Good Answers?” How Social Network Questions Shape Replies JAIME TEEVAN, MEREDITH RINGEL MORRIS and KATRINA PANOVICH Microsoft Research, Redmond, WA, USA and Massachusetts Institute of Technology, Cambridge, MA, USA ________________________________________________________________________ Social networking tools make it easy for people to ask questions of large groups of their personal acquaintances. In this article, we explore how the questions people ask of their social networks via status message updates shape the replies they receive. We present the results of a survey of 624 people, in which participants were asked to share the questions they have asked and answered of their online social networks. We observe interesting variations in how people ask natural, real-world questions that suggest that the effectiveness of a question posed to one’s social network could depend on who asks the question, when the question is asked, and how the question is phrased. To understand whether these factors actually do shape question replies, we conducted a controlled study in which 282 participants posted variants of the same question as their status message on Facebook. By analyzing the quantity, quality, and speed of the responses, we find that by controlling the time of day a question is posed and how the question is phrased, and by maintaining a strong network, a person can increase the likelihood of quickly receiving many high-quality answers. ________________________________________________________________________ 1. INTRODUCTION In addition to using status messages to simply describe one’s current status, many social network users use their status messages to ask questions of their networks (Morris et al. CHI 2010). The way that questions are asked can range from straightforward: Can anyone recommend a good zombie-pocalypse novel? to quite involved: I’m looking for suggestions of a good post-apocalyptic novel to read. Recent books I’ve enjoyed were World War Z and The Passage; zombie or vampire-caused apocalypse suggestions are extra-good. Question-based status updates can serve multiple purposes, including creating social awareness, encouraging the asker to reflect on a current information need, building social ties, and, of course, finding answers (Morris et al. ICWSM 2010). For example, the request for a book suggestion both helps the asker find a book to read and lets people know that she enjoys zombie-themed fiction. Valuable replies might include book recommendations, but could also include discussions of other forms of zombie-tainment or an invitation to have coffee together at the bookstore. In this article, we begin by investigating the way people naturally use social networks for question asking, and find that there are strong trends in the way people phrase their questions. Social psychology research suggests that how people make requests of others influences the responses they receive. For example, a study of people waiting in line to make photocopies revealed that those in line were much more likely to let someone cut in front of them if the request to do so included a meaningless justification (“because I need __________________________________________________________________________________________ Authors’ addresses: Jaime Teevan, E-mail: [email protected]; Meredith Ringel Morris, E-mail: [email protected]; Katrina Panovich, E-mail: [email protected].
Transcript of “Does Anyone Know How to Get Good Answers?” How Social...
“Does Anyone Know How to Get Good Answers?” How Social Network Questions Shape Replies
JAIME TEEVAN, MEREDITH RINGEL MORRIS and KATRINA PANOVICH
Microsoft Research, Redmond, WA, USA and
Massachusetts Institute of Technology, Cambridge, MA, USA ________________________________________________________________________
Social networking tools make it easy for people to ask questions of large groups of their personal acquaintances.
In this article, we explore how the questions people ask of their social networks via status message updates
shape the replies they receive. We present the results of a survey of 624 people, in which participants were
asked to share the questions they have asked and answered of their online social networks. We observe
interesting variations in how people ask natural, real-world questions that suggest that the effectiveness of a
question posed to one’s social network could depend on who asks the question, when the question is asked, and how the question is phrased. To understand whether these factors actually do shape question replies, we
conducted a controlled study in which 282 participants posted variants of the same question as their status
message on Facebook. By analyzing the quantity, quality, and speed of the responses, we find that by controlling the time of day a question is posed and how the question is phrased, and by maintaining a strong
network, a person can increase the likelihood of quickly receiving many high-quality answers.
________________________________________________________________________
1. INTRODUCTION
In addition to using status messages to simply describe one’s current status, many social
network users use their status messages to ask questions of their networks (Morris et al.
CHI 2010). The way that questions are asked can range from straightforward:
Can anyone recommend a good zombie-pocalypse novel?
to quite involved:
I’m looking for suggestions of a good post-apocalyptic novel to read. Recent books
I’ve enjoyed were World War Z and The Passage; zombie or vampire-caused
apocalypse suggestions are extra-good.
Question-based status updates can serve multiple purposes, including creating social
awareness, encouraging the asker to reflect on a current information need, building social
ties, and, of course, finding answers (Morris et al. ICWSM 2010). For example, the
request for a book suggestion both helps the asker find a book to read and lets people
know that she enjoys zombie-themed fiction. Valuable replies might include book
recommendations, but could also include discussions of other forms of zombie-tainment
or an invitation to have coffee together at the bookstore.
In this article, we begin by investigating the way people naturally use social networks
for question asking, and find that there are strong trends in the way people phrase their
questions. Social psychology research suggests that how people make requests of others
influences the responses they receive. For example, a study of people waiting in line to
make photocopies revealed that those in line were much more likely to let someone cut in
front of them if the request to do so included a meaningless justification (“because I need
__________________________________________________________________________________________
Authors’ addresses: Jaime Teevan, E-mail: [email protected]; Meredith Ringel Morris, E-mail:
[email protected]; Katrina Panovich, E-mail: [email protected].
J. Teevan, M. R. Morris and K. Panovich
to make copies”) (Langer et al. 1978). To explore this phenomenon in online
communications, we conducted a controlled experiment designed to tease out how the
way online social network questions are asked influences the answers received. We show
that question phrasing, who poses the question, and when the question is asked influence
the online responses received. For example, the straightforward question about zombie-
pocalypse books will probably receive more recommendations, while the longer one may
receive more social comments about the genre.
The article is structured as follows. Following an overview of social question asking
research, we highlight relevant findings from a survey of 624 users of social networking
services (Morris et al. CHI 2010). We describe the survey methodology, and show that
there are common, and at times unexpected, ways that people phrase the questions they
ask of their social networks. We then present and expand on the results of a controlled
experiment that reveals how the questions posed to a social network influence the
answers received (Teevan et al. ICWSM 2011). We describe the experimental
framework, wherein 282 Facebook users posted experimenter-selected variants of the
same question as their status messages and sent us the responses they received, and
present the results. We look at how who asks the question, when the question is asked,
and how the question is phrased affect the quantity, quality, and speed of the replies. We
conclude by discussing the implications of our findings.
2. RELATED WORK Status message question-asking is a way to find information online, making it a type of
“social search”. We begin our discussion of related work with a brief overview of what
social search is and what makes it different from other, more traditional forms of search.
Because this article focuses on a particular aspect of social search, namely question
asking, we then review the most well-studied type of online question asking, Community
Q&A. Although question asking on Q&A sites has been well studied, a more natural way
for people to ask for information is the less understood behavior of broadcasting
questions via a social networking tool. We conclude our discussion of related work with
an overview of why this behavior is particularly interesting to study and what is currently
known about it.
2.1 Social Search
The term social search refers broadly to the process of finding information online with
the assistance of social resources, such as by asking friends, reference libraries, or
unknown persons online for assistance. Social search also sometimes refers to the process
of conducting a search over an existing database of social content created by other users,
such as searching over the collection of public Twitter posts (Teevan et al. WSDM 2011)
or searching through an archive of questions and answers (Ackerman and Malone 1990).
Unlike this work, our research focuses on instances of social search where the desired
content is generated in direct response to a need.
Collaborative search (Morris & Teevan, 2010; Golovchinsky et al. 2010) is a type of
social search where several users share an information need, and they actively work
together to fulfill that need, sometimes using specialized collaborative search tools
(Morris & Horvitz 2007). In this article, rather than studying groups explicitly
collaborating on shared information needs, we focus on cases where individual
information seekers turn to their social network as an information resource.
Wells and Ranie (2008) found that people use a mixture of internet searching and
social resources (e.g., phone calls or face-to-face meetings) to answer many types of

Does Anyone Know How to Get Good Answers?
questions. Torrey et al. (2009) found that craft-artists kept their social networks informed
of current projects in the hopes of receiving “gifts of information”, i.e., pointers to
relevant online resources that might benefit their projects. Some researchers have
proposed more formal models of information seeking with the use of social resources.
For example, Pirolli (2009) developed a model of social information foraging, and Evans
and Chi (2008) described the various stages in the search process at which searchers
engaged with other people.
To understand how the use of social resources compares to solitary search, Evans et
al. (2010) conducted a study in which eight participants completed two searches. For one,
participants used only non-social resources (e.g., search engines and link following); for
the other they used only social resources (e.g., calls or emails to friends or using a Q&A
site). They found targeting questions to specific friends versus asking a social network
had similar outcomes; questions posed to the social network received more answers, but
those targeted to individuals received richer answers. Morris et al. (ICWSM 2010)
observed twelve people simultaneously querying their Facebook friends and conducting
Web searches on the same topic, and found that users valued the quick response times of
search engines, but also appreciated the personalized and occasionally serendipitous
nature of answers from social contacts. In this article we look more deeply into the
logistics of questioning one’s network in order to understand how properties of the
question and of the asker affect outcomes.
Social search and traditional search approaches can work in support of each other.
Some researchers have built special tools to integrate social information with search
engine use. For example, HeyStaks (Smyth et al. 2009) is a browser plug-in that enables
users to mark search results as relevant; these results are then boosted in the rankings of
socially connected users who do searches on similar topics. Working in the other
direction, Search Buddies (Hecht et al. 2012) explored providing algorithmic search
content to the questions people ask naturally in social contexts.
2.2 Community Q&A
One of the best studied forms of question asking online is the use of venues such as
electronic bulletin boards, newsgroups, and question-answering sites to post questions
targeted either at a particular community or to the world at large. We refer to the class of
sites where users post questions to be answered by a set of users who they do not know
personally as Q&A sites. Harper et al. (2008) identified two categories of questions
posted to Q&A sites: conversational questions, intended to spark discussion, and
informational questions, soliciting specific facts. They found that informational questions
have higher archival value than conversational ones.
In this article, we explore factors related to the quantity, quality, and speed of the
replies people receive to their social network status message questions. Researchers have
found that questions posted to Q&A sites receive answers within 2 (Zhang et al. 2007) to
9 hours (Hsieh and Counts 2009), although recent work suggests that questions on some
sites, like Stack Overflow, can receive responses much faster. Mamykina et al. (2011)
found that 92% of Stack Overflow questions are answered in a median time of 11
minutes. Their research suggests that aspects of the question may influence the speed of
response, with, for example, questions that invite discussion being less likely to receive
fast responses. Harper et al. (2008) found that the properties of answers on Q&A sites
most related to judged quality were the length of the answer and the number of
hyperlinks it contained. We have explored both of these properties as measures of the

J. Teevan, M. R. Morris and K. Panovich
quality of social network responses. However, as less than 1% of the observed responses
contained a hyperlink, we focus on length in the studies that follow.
Market-based (Hsieh and Counts 2009) and reputation-based (Chen et al. 2006)
systems have been explored as ways to add value to Q&A sites. Raban and Harper (2008)
point out that a mixture of intrinsic (e.g., gratitude) and extrinsic (e.g., reputation or
money) factors motivate Q&A site users to answer questions. Beenan et al. (2004) found
social psychology techniques, such as making users feel their contributions are unique,
result in increased participation, and Ackerman and Palen (1996) found intrinsic
motivations, such as the visibility of expertise, were important. Liu et al. (2008) used
machine learning to predict satisfaction with answers received on a Q&A site, and found
important predictive factors included the asker’s length of membership and the question
topic, while the answerer’s reputation played only a small role. Burke et al. (2007)
studied how post phrasing impacted response likelihood on Usenet groups, and found that
messages making requests were likely to get more responses than those not making
requests.
2.3 Social Network Question Asking
Although question asking on Q&A sites is reasonably well understood, a more natural
way for people to ask questions of their network is to broadcast the question via a social
networking tool. Many popular social networking services, such as Facebook and
Twitter, enable users to write a brief status message, which is then visible to their
connections on the network. For example, at the time the studies presented in this article
were conducted (summer 2009), Facebook’s status message could be up to 423 characters
long, and the prompt “What’s on your mind?” encouraged the user to fill in the status
box. On Twitter, status updates could be up to 140 characters long, and the prompt “What
are you doing?” was used. Work by Madden and Zickuhr (2011) found that 65% of
online U.S. adults used status updating services like Twitter or Facebook, and the number
is growing rapidly.
There are several factors that differentiate the experience of asking a question on a
Q&A site (Section 2.2) from that of asking on a social networking site. First, questions on
Q&A sites can be posted anonymously (or under a pseudonym), whereas on a social
networking site, the asker’s identity is known to the readers of the question. Second, the
audience of potential answerers is typically much smaller on a social networking site than
on a Q&A site, since it consists of only the direct contacts of the asker rather than an
entire community or the internet at large. Also, social networking sites typically impose a
limit of only a few hundred characters on message length, whereas many Q&A sites
allow much longer, more detailed questions to be posted. Additionally, social network
Q&A occurs naturally in the course of the other social interactions that are the primary
purpose of such sites. In contrast, Q&A sites require a user to visit a specialized site with
the explicit intent of information seeking. As a result of these differences the questions in
these two venues represent different formalities, urgencies, and types of information
needs, making it is valuable to study question asking behavior on social networks.
Researchers have tried to understand the extent and manner of use of social network
status messages for question asking. Honeycutt and Herring (2009) analyzed Twitter
messages containing @ symbols and found 3 of 200 were meant to “solicit information.”
Naaman et al. (2010) found that questions to followers comprised approximately 5% of
Twitter posts that they manually coded. We conducted two surveys on the topic. The first
survey (Morris et al. CHI 2010) looked at the social network question asking behavior of
624 U.S.-based Microsoft employees (73% full-time employees and 27% college-student

Does Anyone Know How to Get Good Answers?
interns). In this article, we highlight important findings from this work, showing that
there are common, and at times unexpected, ways that people phrase the questions they
ask of their social networks. We also present the results of a controlled experiment
inspired by these survey findings, to help us better understand effective social network
questioning techniques. Our second survey (Yang et al. 2011) studied 933 Microsoft
employees from four countries (the U.S., U.K., China, and India) to measure cultural
differences in social network question asking. The findings from the cross-cultural survey
were largely similar to those of the initial one, lending support to the notion that our
findings extend beyond a single demographic.
Subsequent studies of information seeking on Twitter by Efron and Winget (2010)
and Paul et al. (2011), and on Facebook by Lampe et al. (2012) provide findings that
complement the results from our surveys. For instance, Efron and Winget (2010) create a
taxonomy of question types on Twitter that is similar to ours, but also includes categories
for non-information-seeking “questions,” such as spam. Lampe et al. (2012) use
regression models to identify what factors make people more likely to view Facebook as
a good source for information seeking. Panovich et al. (2012) explored who is likely to
contribute valuable information in social network Q&A, and found that strong ties offer
more valued contributions than weak ones.
Some question answering systems use social networking services as their
infrastructure, but questions are posted to a large audience of unknown users, rather than
to known connections. As an example, LazyTweet [lazytweet.com] aggregates Twitter-
based questions and allows any Twitter user to view and respond to them. Recent work
by Nichols and Kang (2012) explores factors impacting question responses from targeted
strangers on Twitter. Other question answering tools, like Q&A sites, allow people to
post questions to be answered by people who are not part of the asker’s network. Newer
services like Quora [quora.com] seek to create a network structure based on non-
anonymous Q&A interchanges, thus creating an experience that combines expertise-
finding, social-network communication, and information-seeking. In contrast, we study
Q&A exchanges that occur informally among a closed, pre-established network of users.
Some systems help people connect with expert individuals to ask questions directly.
For example, Collabio (Bernstein et al. 2009) and Aardvark (Horowitz and Kamvar 2010)
are expertise-finding tools that use social networking infrastructure, and Farrell et al.
(2007) explored how tagging can be used to identify expertise within a corporate
community. Although we observe people sometimes target questions at expert responders
with the questions they broadcast, the questions are still seen by a person’s entire network
rather than routed directly to pre-identified experts.
In summary, social network question asking as a type of social search is an emerging
area for exploration. Researchers have shown that the behavior is prevalent and have
begun to characterize it. But unlike with community Q&A, little is known about what
makes for a successful social network question. To fill this gap, we present a descriptive
survey of effective natural question asking behavior. We then go a step beyond the
descriptive studies that have been used to understand all types of online question asking,
and present a unique controlled study that reveals causality among a number of question
factors and the response quality, quantity, and speed.
3. METHODOLOGY: SURVEY OF NATURAL QUESTION ASKING We being by looking at people’s natural social network question asking behavior. We
conducted a survey on the topic in the summer of 2009. Our initial findings were
presented at CHI, the ACM Conference on Human-Computer Interaction (Morris et al.

J. Teevan, M. R. Morris and K. Panovich
CHI 2010). In this article, we reiterate and expand on the survey findings that motivate
our subsequent experiment regarding the impact of Facebook question phrasing and user
demographics on replies received. We focus on discussing the naturally-occurring
variations in question-phrasing and their reported impact on responses. Morris et al. (CHI
2010) also contains a detailed qualitative analysis of the types and topics of questions
asked and the motivations behind social network Q&A, which we do not discuss here.
3.1 Survey Content
In addition to collecting basic demographic information and background information
about participants’ use of social networking services such as Facebook and Twitter, the
survey asked a series of questions related to social network question asking, such as
whether respondents had ever used their status message to ask a question of their social
network. If they had done so, they completed several follow-up questions about the
frequency of this behavior, the types of questions asked, and the responses received.
Additionally, we asked participants who reported asking a question to log onto the social
network and copy and paste an example of a question they had recently asked into the
survey form.
We also asked whether participants had ever answered a question they had seen
posted by someone else as a status message. We then asked several follow-up questions
to understand the motivation behind choosing to answer or not answer questions. Those
who reported answering a question were asked to log onto the social network and copy
and paste an example of a question they had answered, along with the text of their
answer.
As with all survey studies, there are inherent inaccuracies possible in self-report data.
It is also possible there was a selection biases in the questions participants chose to share
with us. For example, participants may have primarily chosen to copy and paste questions
that were successful or on socially acceptable topics.
3.2 Participants
Six hundred and twenty four people completed our survey. Respondents were all
Microsoft employees. Consistent with company demographics, 25.5% female and 74.5%
male. Most (72.8%) were full-time employees, although 27.2% were university students
working as summer interns. Participants were recruited by advertisements to the
company’s e-mail distribution lists on the topics of social networking, and to lists
targeted toward summer interns, with a response rate of approximately 20%. We
specifically advertised the study to the interns in order to ensure a diverse perspective
representative of typical social networking system users, since studies show that such
tools are heavily used by university students. Of our survey respondents, 28.3% were
aged 18-25, 40.1% aged 26 – 35, 25.5% aged 36 – 45, and only 6.1% aged 46 and over.
Participants reported using a variety of social networking technologies, including
Facebook, Twitter, MySpace, Friendster, LinkedIn, and Orkut. However, Facebook and
Twitter were the two most prominent services, with 98.1% of participants having a
Facebook account and 71% having a Twitter account. We therefore focus our discussion
of the survey results only on the use of these two services. Participants with Facebook
accounts reported a median network size of 209 friends, while those with Twitter
accounts reported a median of 25 followers.
Our findings should be interpreted in light of possible biases introduced by the
demographic of our survey population. The demographic issue is somewhat mitigated by

Does Anyone Know How to Get Good Answers?
the inclusion of a large number of college interns in the survey sample; the age ranges
and network sizes of our participants were reasonably close to those of the broader social
network user population. However, our survey population was more tech-savvy and less
gender-balanced than the general social networking audience. A subsequent cross-
cultural survey (Yang et al. 2011) of social network Q&A behavior found largely similar
results (with a few noteworthy differences between Asian and Western cultures), lending
increased confidence that our findings were reasonably representative.
4. RESULTS: THE QUESTIONS PEOPLE ASK THEIR SOCIAL NETWORKS
As expected, participants in our study reported sometimes using social network services
to find practical information, indicating agreement (median = 4 on a five-point Likert
scale) with the statement, “I use sites like Facebook and Twitter to get useful
information.” Half (50.6%) of respondents said they had used their status messages to
ask a question. We were provided with a total of 249 examples of questions participants
had posted or answered (some participants were unable to provide an example despite
having asked or answered a question due to inability to locate the example or privacy
concerns). Examples ranged from silly (“Didn't it used to be a requirement to have talent
to be famous?”) to complex (“Bikers: Any advice on the right bike for me? Doing it for
exercise. Around town (suburban, not city). No offroading. Under $200?”). In this
section, we examine this set of questions to better understand how participants phrased
the questions they asked of their social network, and to explore which ones received the
fasted, most useful responses.
4.1 How the Questions Were Phrased
The questions we collected were generally short. Although during the study Twitter
allowed status updates to be up to 140 characters long, and Facebook up to 423, the
example questions had a mean length of only 75.1 characters (13.8 words), or about the
same length as the title of this article. The majority of the questions (71.9%) consisted of
a single sentence (mean = 1.4 sentences). Multi-sentence questions typically used the
extra sentence(s) to provide additional context about the question, such as explaining the
motivation for asking. For example, one participant asked, “Just went curling today.
Guess I'm into weird sports. What should be my next sport?”
A majority of the examples (81.5%) were explicitly phrased as questions and
included a question mark. For example, one respondent asked, “So what's the going rate
for the tooth fairy?” However, a minority of the examples (the remaining 18.5%) were
phrased in statement form and ended with a period. Questions that were phrased as a
statement were often preceded by inquisitive phrases such as “I wonder,” or “I need.” An
example of a question phrased as a statement includes, “I am looking for a good point
and shoot camera. Suggestions are welcome.”
Although most questions were implicitly directed to the asker’s entire network (e.g.,
“How do I put sunblock on my back?”), many of the questions (20.9%) used the phrase
“anyone” to explicitly indicate that the asker was seeking an answer from any member of
their network. For example, one participant asked, “Does anyone know who won
American Idol?” Questions were also often directed to “someone,” “somebody,” or
“anybody.” Some askers scoped their question even more specifically, directing it only
at a subset of their network that had a particular expertise. For example, one participant
asked, “Can anyone in Puget Sound area recommend a stylist?”

J. Teevan, M. R. Morris and K. Panovich
Response actually received in
5 mins. 15 mins. 30 mins. 1 hour 6 hours 1 day >1 day Never Total
Res
pon
se e
xp
ecte
d i
n
5 mins. 19 8 5 5 3 7 0 1 48
15 mins. 1 10 4 9 1 7 0 1 33
30 mins. 1 0 6 9 5 10 0 5 36
1 hour 1 0 2 13 9 19 1 1 46
6 hours 0 0 0 7 1 26 5 3 42
1 day 0 0 0 1 2 15 9 0 27
>1 day 0 0 0 0 0 0 5 3 8
Never 1 0 1 1 1 9 5 3 21
Total 23 18 18 45 22 93 25 17 23
Table 1. The speed in which participants expected a response compared with the speed in
which participants actually received a response. For example, 19 people expected a
response within 5 minutes and received a response within that speed. Cells are shaded to
represent the number of participants in each cell. Overall, participants expected faster
responses than they actually received.
4.2 Which Questions Received Answers
In addition to providing information about question asking on social networks,
participants also provided information about question answering. They shared with us
their subjective experience with the speed and helpfulness of the replies they received to
their question, and provided information about when they themselves chose to answer
and not answer questions that others had posted. Many participants reported having
answered questions. Three-quarters (73.4%) had seen a question posted as a status
message by another member of their network. Of those, nearly all (93.4%) said they had
answered such a question on at least one occasion. Here we examine the factors affecting
answer speed and helpfulness.
Social network question asking appeared very likely to generate a response. All but
6.5% of questions shared via the survey received an answer. It is possible, however, that
respondents were biased towards sharing examples with us that had received responses.
Overall, the 93.5% of respondents who shared a question that received a response
reported that their questions were answered promptly; 24.3% claimed to have received a
response in 30 minutes or less, 42.8% in one hour or less, and 90.1% within one day. As
can be seen in Table 1, participants generally expected fast response times, and received
slower responses than expected. A third (31%) expected a response within 15 minutes or
less, but only 15.7% received one that quickly; 62.5% expected a response within one
hour, but only 39.8% got one. Expectations and reality approached each other at the one
day mark, with 88.9% of participants expecting a response within a day or less and 83.9%
receiving one. Despite the discrepancy between expected and reported answer speed,
getting a response within one day seemed acceptable to most people, with 89.3%
reporting they were satisfied with the response time they experienced.
The responses gathered via a social network appear to be very valuable. Participants
were asked to characterize whether or not the responses they received were helpful. Of
Does Anyone Know How to Get Good Answers?
the participants who received a response, 69.3% reported that they found the responses
helpful. The remaining 30.7% reported receiving unhelpful responses.
We examined whether the common question phrasings described earlier influenced
the self-reported speed or helpfulness of the responses received. We found that question
length influenced response helpfulness, with the questions that had fewer sentences
receiving more useful responses than those with many sentences (r = -0.13); we found no
correlation between question length and response speed. It may be that multi-sentence
inquiries appear more similar to a typical social status update and less like an actual
question. The use of punctuation and scoping terms did not correlate strongly with
reported response speed or helpfulness.
We also explored whether traits of the asker influenced answer speed and
helpfulness. Demographic factors like gender and age did not significantly influence
either answer speed or helpfulness. However, when we looked at the asker’s social
network habits, such as the network posted to or the frequency of updating one’s status,
we found significant influence. The frequency of using the social network holds was
particularly important, with those who update their status frequently receiving faster
responses (z = -2.1, p = .033). Most (87.0%) frequent updaters reported receiving
responses in one day or less, while only 64.5% of infrequent updaters received responses
within one day. We found no difference in answer speed or helpfulness regardless of
whether the question was posted to Facebook or Twitter.
5. METHODOLOGY: CONTROLLED STUDY OF QUESTION ASKING The survey revealed strong trends in question phrasing, and suggested some
characteristics of question phrasing and the asker’s social network use that might
influence the question’s response. Our curiosity piqued by these results, we set out to
better understand the factors affecting the responses to social network questions. To do
this in a controlled (rather than descriptive) manner, we asked many different people to
post the exact same question as their status message and send us the answers that
question received. By looking at the differences in replies received by different subsets of
askers, we are able to understand how who asks a question influences the replies. By
having some participants to post the question in the morning and others in the afternoon,
we gain insight into the effect of time of day. And by carefully varying the question
phrasing along the important axes we observed in the survey, we are able to explore the
impact of how a question is worded.
In this section, after describing the study protocol we present the question variants
we analyzed and the measures we used to compare the success of the responses received.
Portions of the work presented here related to question phrasing were presented as a
poster at ICWSM, the International AAAI Conference on Weblogs and Social Media
(Teevan et al. ICWSM 2011).
5.1 Study Protocol
In the controlled study, we asked 282 people to post a variant of the question, “Should I
watch E.T.?” as their Facebook status message (see Figure 1 for an example). We chose
for people to ask for opinions about a movie because the question type (opinion) and
topic (entertainment) are popular among natural social network questions. Morris et al.
(CHI 2012) report opinion questions represent 22% of the questions asked of social
networks, and entertainment questions represent 17%. The popular science fiction film
E.T. [Universal Studios, 1982] chosen due to its popularity across age groups and its
J. Teevan, M. R. Morris and K. Panovich
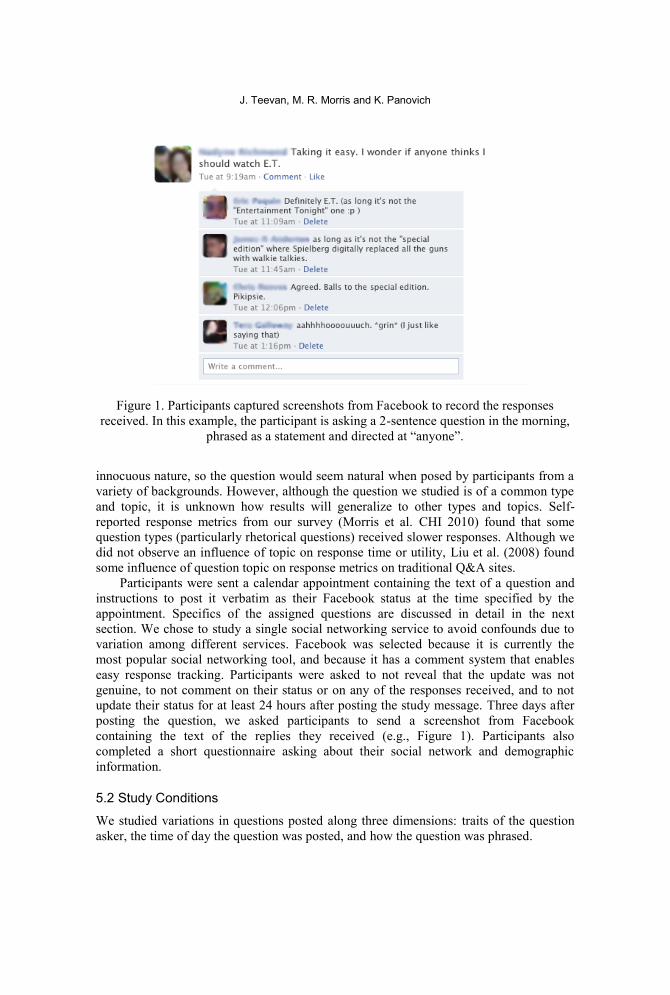
Figure 1. Participants captured screenshots from Facebook to record the responses
received. In this example, the participant is asking a 2-sentence question in the morning,
phrased as a statement and directed at “anyone”.
innocuous nature, so the question would seem natural when posed by participants from a
variety of backgrounds. However, although the question we studied is of a common type
and topic, it is unknown how results will generalize to other types and topics. Self-
reported response metrics from our survey (Morris et al. CHI 2010) found that some
question types (particularly rhetorical questions) received slower responses. Although we
did not observe an influence of topic on response time or utility, Liu et al. (2008) found
some influence of question topic on response metrics on traditional Q&A sites.
Participants were sent a calendar appointment containing the text of a question and
instructions to post it verbatim as their Facebook status at the time specified by the
appointment. Specifics of the assigned questions are discussed in detail in the next
section. We chose to study a single social networking service to avoid confounds due to
variation among different services. Facebook was selected because it is currently the
most popular social networking tool, and because it has a comment system that enables
easy response tracking. Participants were asked to not reveal that the update was not
genuine, to not comment on their status or on any of the responses received, and to not
update their status for at least 24 hours after posting the study message. Three days after
posting the question, we asked participants to send a screenshot from Facebook
containing the text of the replies they received (e.g., Figure 1). Participants also
completed a short questionnaire asking about their social network and demographic
information.
5.2 Study Conditions
We studied variations in questions posted along three dimensions: traits of the question
asker, the time of day the question was posted, and how the question was phrased.

Does Anyone Know How to Get Good Answers?
Properties of the Asker
We explored how the properties of the person asking the question affected the responses
received. All 282 participants were Microsoft employees and recruited via email
distribution lists related to social networking or college-aged interns, but participants’
demographics, social network use, social network makeup, and avatars varied.
Demographics: We explored how gender and age influenced responses. Ninety
seven (34.4%) of the participants were female. The median age of participants was 34.
Social network use: In our survey we observed that a question asker’s social
network habits, such as the network posted to or the frequency of updating one’s status,
significantly influenced the responses they received. Thus we also looked at how factors
such as network size, update frequency, length of membership, and even whether the
participant had asked a question previously affected the responses received. Participants
in the study were required to have an existing Facebook account. Most (238, 84.4%)
reported having had the account for over a year. The median social network size was 215.
Social network makeup: In addition to network used, we explored whether the
composition of people’s networks was important. Participants identified what portion of
their network was composed of colleagues, classmates (current or former), family, and
social acquaintances. Classmates and social acquaintances were the most common
relationship types, and family the least. While we examined relationship categories, we
did not explicitly explore tie strength (Gilbert & Karahalios, 2009). A study by Panovich
et al. (2012) found that strong ties were slightly more likely to provide valuable response
to Facebook-based inquiries.
A few participants had network members in common, and responses occasionally
included observations from mutual friends noting duplicate status messages across
individuals. Such overlaps were infrequent, however, as our 282 participants were
selected from a company of over 80,000 employees, and reported that social friends,
rather than colleagues, were the most common type of network member. These infrequent
observations of similar posts due to network overlap affected all study conditions equally
and thus are unlikely to impact our results. Respondents that commented on the question
similarity did not seem to suspect anything amiss. Rather, their response indicated that
they assumed the phenomenon was due to an external event, such as a news article about
the movie E.T. or a re-release of the DVD. For example, one response stated, “Strange,
you're the second person in the past few days to ask the same question. And I have no
opinion, might have seen it once when I was little, but I've forgotten!”
Profile Picture: We also looked at how participants represented themselves to their
social network by analyzing their profile picture. These pictures were coded along two
dimensions: (1) cinematographic measures of how close the shot was (from extreme
close-up to extreme long shot), and (2) the presence of someone other than the participant
in the shot.
Time of Day
We also explored how the time of day the question was posted affected the responses.
Participants were asked to update their status message with the provided question either
in the morning (7 am to 10 am) or afternoon (4 pm to 7 pm). Although we were not easily
able to control for time zones, these time intervals ensured non-overlapping periods for
questions posted within the continental United States (all but three participants). While
the question askers and respondents were occasionally in different time zones (50%
estimated that most or all of their network lived in the same time zone as they did), this

J. Teevan, M. R. Morris and K. Panovich
Punctuation Length Scoping Example # posted
Question 1 sentence None Should I watch E.T.? 26
Anyone Does anyone think I should watch E.T.? 26
Movie buff Do my movie buff friends think I should watch E.T.? 27
2 sentences None Taking it easy. Should I watch E.T.? 18
Anyone Taking it easy. Does anyone think I should watch E.T.? 26
Movie buff Taking it easy. Do my movie buff friends think I should watch E.T.? 20
Statement 1 sentence None I wonder if I should watch E.T. 24
Anyone I wonder if anyone thinks I should watch E.T. 27
Movie buff I wonder if my movie buff friends think I should watch E.T. 23
2 sentences None Taking it easy. I wonder if I should watch E.T. 21
Anyone Taking it easy. I wonder if anyone thinks I should watch E.T. 22
Movie buff Taking it easy. I wonder if my movie buff friends think I should watch E.T. 22
Table 2. The different question phrasings studied, and the number of participants who
posted each.
factor affected all conditions equally and thus was unlikely to influence our results. Of
the 282 participants, 138 posted their question in the morning and 143 in the afternoon.
Phrasing
We varied how the basic question (“Should I watch E.T.?”) was phrased along three axes:
punctuation, number of sentences, and scope (see Table 2 for specific phrasing). The axes
were chosen based on findings from our survey of social network question-asking, which
found that questions naturally varied in these ways.
Punctuation: The basic inquiry was phrased as a question (ending with a question
mark) or as a statement (ending with a period), since we found that 18.5% of the
questions in their sample were actually phrased as statements. Prior research in the
“offline” world (Francik and Clark 1985) has found that explicit requests are more
successful than implicit ones. Our hypothesis was that stating the question explicitly as a
clear question would help distinguish it from a more typical status update and increase
the number of responses the question received.
Number of Sentences: The basic question either was only one sentence long, or
included a preceding sentence (“Taking it easy.”) to provide some additional information
about why the asker was considering watching the movie. In our survey we found longer
questions to social networks reportedly got slower answers, so our hypothesis was that
the additional context-setting sentence would increase the appearance that the question
was a regular status update, and hurt response metrics. Our goal in choosing the
contextual sentence was for it to be vague enough to be plausible for users having a
variety of backgrounds. Other choices for the additional sentence may have affected
responses differently.
Scope: The basic question provided no explicit scoping. However, in our survey we
observed that 21% of questions were addressed to “anyone”. For this reason, we tested
variants that used the term “anyone” to signal that an answer from any of the user’s
contacts was welcome, or referred specifically to “my movie buff friends.” We
hypothesized that specific scopings would encourage responses by reminding users of the
unique contributions they could bring to bear on the questions (Breenan et al. 2004;
Karau and Williams 1993).

Does Anyone Know How to Get Good Answers?
Each of the twelve phrasing variants was posted by anywhere from 18 to 27
participants (Table 2). Participants were randomly assigned a variant, with effort made to
balance demographics across conditions. The distribution of participants to each variant
was initially equal, but some participants dropped out; all analysis is based on the 282
participants that completed the entire study. Post-hoc analyses verified that the
assignment of participants to condition resulted in approximately equal distributions of
traits (demographic, social network use, and social network makeup) across conditions.
By partitioning the question space evenly across each axis, we were able to explore
each overarching difference with a larger number of participants (from 89 to 153). For
example, each inquiry can be phrased as a question or as a statement regardless of how it
is scoped; 143 participants posted the question phrased as a question, and 139 participants
posted the question phrased as a statement. See Table 7 for a summary of the total
number of participants in each question-phrasing condition.
5.3 Response Metrics
In our analysis, we compare the quantity, quality, and speed of the responses received as a
function of the different experimental conditions described above.
Quantity
Quantity measures relate to how many responses were received. We looked at several
quantity measures, all of which provide a consistent picture. The measures of quantity we
present here are: the portion of questions under a particular condition that received
responses (referred to as “percent with response”), and, on average, how many responses
were received given that the question was responded to (referred to as “number of
responses”).
Quality
We also explored several measures of response quality. Not all responses were directly
useful to the task of deciding whether or not to watch E.T. Responses were coded along
two quality dimensions. The first quality dimension coded whether the question received
a direct answer recommending whether or not the participant should watch E.T. (e.g.,
“YESSS! One of my favorite movies of ALL time,” or, “Soooo boring. I vote no.”). The
second quality dimension coded whether the response provided potentially valuable
information that might interest someone who is deciding whether to watch E.T., even
though such responses may not directly answer the initial question. In addition to offering
a direct answer, other examples of “useful” responses included providing facts about E.T.
(“… Drew Barrymore’s first time in a movie…”) and suggestions of alternative films the
asker might enjoy (“I'd suggest Weird Science…”). Coding was done using a grounded
theory approach (Glaser and Strauss, 1977), with a two-phase process that involved a first
pass through all of the responses to develop a coding scheme of answer types, followed
by a second pass to label each response. In this article we talk about the percent of
questions that received direct answers (referred to as “percent answered”), and the
percent that received responses containing useful information (“percent useful”).
Response length is another potential measure of quality. Longer responses can contain
more information, and previous research (Harper et al. 2008) shows response length is an
indicator of response quality on Q&A sites. Given that a question received a response, we
also used the average length in characters of the responses as a measure of quality
(“response length”).
J. Teevan, M. R. Morris and K. Panovich
Count
Quantity Quality Speed
Percent with
response
Number of
responses
Percent
answered
Percent
useful
Response
length
Time to first
response
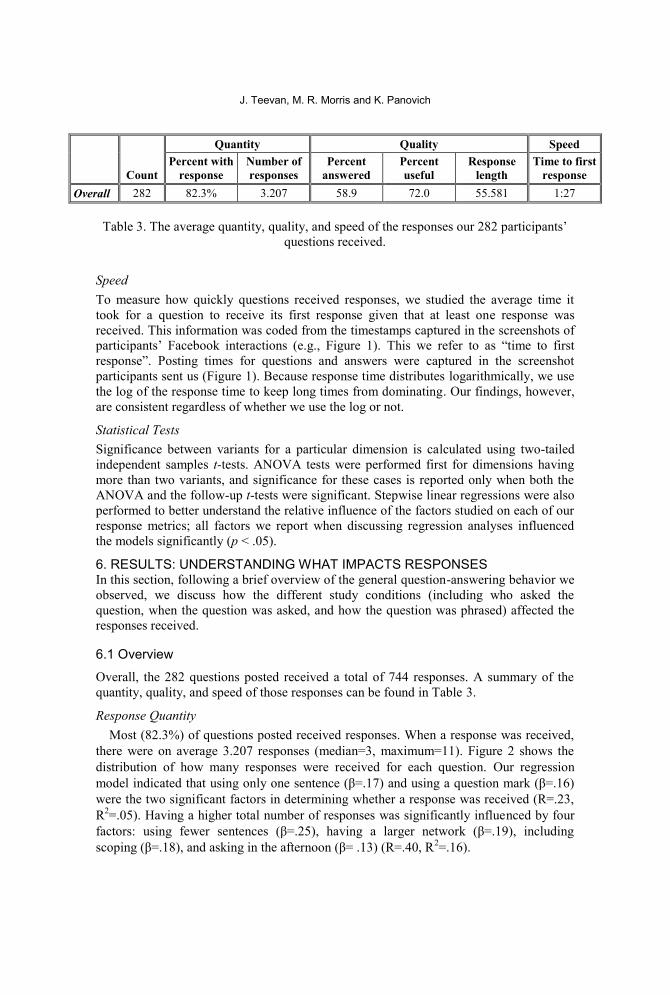
Overall 282 82.3% 3.207 58.9 72.0 55.581 1:27
Table 3. The average quantity, quality, and speed of the responses our 282 participants’
questions received.
Speed
To measure how quickly questions received responses, we studied the average time it
took for a question to receive its first response given that at least one response was
received. This information was coded from the timestamps captured in the screenshots of
participants’ Facebook interactions (e.g., Figure 1). This we refer to as “time to first
response”. Posting times for questions and answers were captured in the screenshot
participants sent us (Figure 1). Because response time distributes logarithmically, we use
the log of the response time to keep long times from dominating. Our findings, however,
are consistent regardless of whether we use the log or not.
Statistical Tests
Significance between variants for a particular dimension is calculated using two-tailed
independent samples t-tests. ANOVA tests were performed first for dimensions having
more than two variants, and significance for these cases is reported only when both the
ANOVA and the follow-up t-tests were significant. Stepwise linear regressions were also
performed to better understand the relative influence of the factors studied on each of our
response metrics; all factors we report when discussing regression analyses influenced
the models significantly (p < .05).
6. RESULTS: UNDERSTANDING WHAT IMPACTS RESPONSES In this section, following a brief overview of the general question-answering behavior we
observed, we discuss how the different study conditions (including who asked the
question, when the question was asked, and how the question was phrased) affected the
responses received.
6.1 Overview
Overall, the 282 questions posted received a total of 744 responses. A summary of the
quantity, quality, and speed of those responses can be found in Table 3.
Response Quantity
Most (82.3%) of questions posted received responses. When a response was received,
there were on average 3.207 responses (median=3, maximum=11). Figure 2 shows the
distribution of how many responses were received for each question. Our regression
model indicated that using only one sentence (β=.17) and using a question mark (β=.16)
were the two significant factors in determining whether a response was received (R=.23,
R2=.05). Having a higher total number of responses was significantly influenced by four
factors: using fewer sentences (β=.25), having a larger network (β=.19), including
scoping (β=.18), and asking in the afternoon (β= .13) (R=.40, R2=.16).

Does Anyone Know How to Get Good Answers?
Figure 2. The total number of responses and the number of useful responses received to
the 282 questions posted to Facebook. Overall, 744 responses were received.
Response Quality
The average response was 55.7 characters long, which is even shorter than the average
question we observed in the survey. Many of the responses were useful. Of the 744
responses received, 346 (46.5%) included a direct answer to the question. As mentioned
earlier, even responses that did not answer the question often included useful information
to help the asker make the decision on their own. In total, 513 responses (69.0%)
included either an answer or useful information relating to the movie (or both). The
distribution of how many useful responses each question received can be seen in Figure
2. A majority of the questions (72.0%) received at least one useful response.
A number of questions received a mixture of some useful answers and some purely
social responses. Purely social responses can provide the user with utility (e.g., a feeling
of connectedness with friends, humor, etc.). Many of the social responses included jokes
(63, 8.5%) or social comments (183, 24.6%) inspired by the question’s topic, although
some responses did not refer to the question at all (e.g., “Missing you at MGX!!”). For
the purposes of this study we only classified responses pertaining directly to the movie
recommendation task as useful, as described earlier in the Response Metrics section.
Although participants were instructed not to respond to any requests for clarification,
120 (16.1%) of the responders tried to engage the participant in a dialog in order to better
answer the question. The types of clarifications people requested ranged from asking who
the person would be watching the movie with (“With family or without?”) to what
version of the movie would be watched (“Is it the one where they changed the guns to
radios?”). The most common requests for clarification included asking whether the
person had seen the movie before (“Watch it again or for the first time?”), and what was
meant by E.T. (“The movie or the entertainment show [Entertainment Tonight]? I will
reserve my judgment until you answer.”). Clarification was not always necessary, though,
because the responders often knew a lot of background about the asker. In 43 responses
(5.8% of the total responses received) there was evidence that the responder used
information about the asker to answer the question. For example, one person replied, “If I
remember correctly, you watched it and cried like a baby.”
Respondents also talked among themselves, for social reasons, to clarify the
question, or to comment on others’ answers. Fifty-five of the 512 follow-up responses
(10.7%) referred to a previous response (we compare only with follow-up responses
because it is impossible for the first response to a question to comment on a previous
01020304050607080
0 1 2 3 4 5 6 7 8 9 10 11
Co
un
t
Number of responses received
Useful
Total

J. Teevan, M. R. Morris and K. Panovich
Figure 3. The average time to first response as a function of the number of responses a
question received.
response). Examining the text of the responses, it appears many subsequent responders
are influenced by earlier responders even when that influence is not overt. There are
many examples of strings of similar jokes and similar wording in response to the same
question. For example, all of the responders might phrase their response as, “You
should,” instead of “Yes,” or they might expresses opinions about Drew Barrymore’s role
without directly referring to the previous responder’s comments.
As further evidence that previous responders influenced subsequent responders,
questions were most likely to receive an answer in the first response. A majority (56.5%)
of the first responses answered the question, while only 42.0% of the subsequent
responses answered the question (p < .01). Controlling for number of responses, the trend
is even more obvious. For example, when comparing the first and second response of the
51 questions that received exactly two responses, we observe that 68.6% of the first
responses included an answer, while only 35.3% of the second responses did (p < .01).
Our regression models indicated that using scoping (β=.24), using fewer sentences
(β=.18), and having a prior history of using status messages for question asking (β=.15)
were the most significant factors in increasing response length (R=.33, R2=.11).
Eliminating the extra sentence (β=.26) and asking in the afternoon (β=.19) were the most
significant factors in eliciting responses that directly answered the question (R=.34,
R2=.11).
Response Speed
The first response appeared on average 1 hour and 27 minutes after the question was
posted, and all responses appeared on average 3 hours and 34 minutes after. The time to
response is heavy-tailed and appears to follows a power-law distribution. Half of all the
questions that received a response received their first response within 22 minutes. Half of
all responses occurred in the first hour and 25 minutes after the question was posted.
Participants who received their first response quickly were more likely to get more
responses in total. This may be due to the increased prominence of commented-upon
items in the Facebook News Feed. The News Feed feature also makes it less likely people
notice status messages after long intervals, since newer updates seem to receive prime
screen real estate. Figure 3 shows the number of responses received compared with the
time to the first response. Our regression model indicated that having a large network
0:00
0:30
1:00
1:30
2:00
2:30
3:00
0 1 2 3 4 5 6 7 8 9 10 11
Tim
e to
fir
st r
ep
ly
Number of responses received

Does Anyone Know How to Get Good Answers?
Asker Count
Quantity Quality Speed
Percent with
response
Number of
responses
Percent
answered
Percent
useful
Response
length
Time to first
response
Dem
o.
Gender Male 185 80.0% 3.115 56.8% 68.1% 53.251 1:20
Female 97 86.6% 3.369 62.9% 79.4% 59.687 1:40
Age ≤ 35 150 83.3% 3.384 62.7% 73.3% 52.304 1:02
36+ 132 81.1% 3.000 54.5% 70.5% 59.410 1:57
So
cial
net
wo
rk u
se
Number of
friends ≤ 200 133 75.2%* 2.600* 50.4%* 63.2%* 53.854 2:15*
201+ 148 88.6%* 3.667* 66.4%* 79.9%* 56.890 0:52*
Time on
network < 1 year 44 79.5% 2.914 43.2% 63.6% 56.541 1:53
> 1 year 238 82.8% 3.259 61.8% 73.5% 55.411 1:23
Update
frequency
< weekly 181 83.4% 3.351 59.1% 73.5% 54.322 1:09
> weekly 100 80.2% 2.938 58.4% 69.3% 57.929 2:03
Asked
before No 113 80.5% 2.736* 55.8% 67.3% 59.090 1:23
Yes 168 83.4% 3.511* 60.9% 75.1% 53.317 1:30
So
cial
net
wo
rk m
akeu
p Friends Few 185 80.0% 3.135 55.7% 70.3% 56.457 1:28
Lots 95 86.6% 3.333 64.9% 75.3% 54.039 1:27
Family Few 59 83.1% 3.449 57.6% 67.8% 58.079 1:44
Lots 222 82.0% 3.137 59.0% 73.0% 54.753 1:23
Classmates Few 211 80.6% 3.041 56.4% 69.2% 57.211 1:47*
Lots 69 87.0% 3.667 65.2% 79.7% 50.673 0:35*
Work Few 236 83.5% 3.259 60.6% 74.2% 54.690 1:24
Lots 45 75.6% 2.882 48.9% 60.0% 59.910 1:46
Pic
ture
Closeness of
shot Close-up 85 88.2% 3.080 60.0% 78.8% 56.919 1:52
Long shot 95 75.8% 2.722 54.7% 63.2% 49.732 1:25
Another
person No 218 80.7% 2.926* 56.4% 69.3% 53.995 1:41
Yes 48 87.5% 4.310* 70.8% 79.2% 62.755 0:45
Table 4. The quantity, quality, and speed of response along the dimensions studied.
Significant differences (p <.05) are shaded and (p < .01) are indicated with a *. Counts do
not always sum to 282 because not all participants reported in all cases.
(β=.22) and eliminating the extra sentence (β=.13) were the two most significant factors
in reducing time to first response (R=.26, R2=.06).
6.2 How Who Asked Affected Responses
We looked at features of the person asking the question to see if traits of the asker
influenced the types of answers that person received. As discussed in greater detail
below, the biggest predictors of response quantity, quality, and speed proved to be social,
with the number and types of friends a person has being particularly important. Table 4
shows the average quantity, quality, and speed of the responses for different groups of
participants. Note that the properties of the asker were not always independent of each
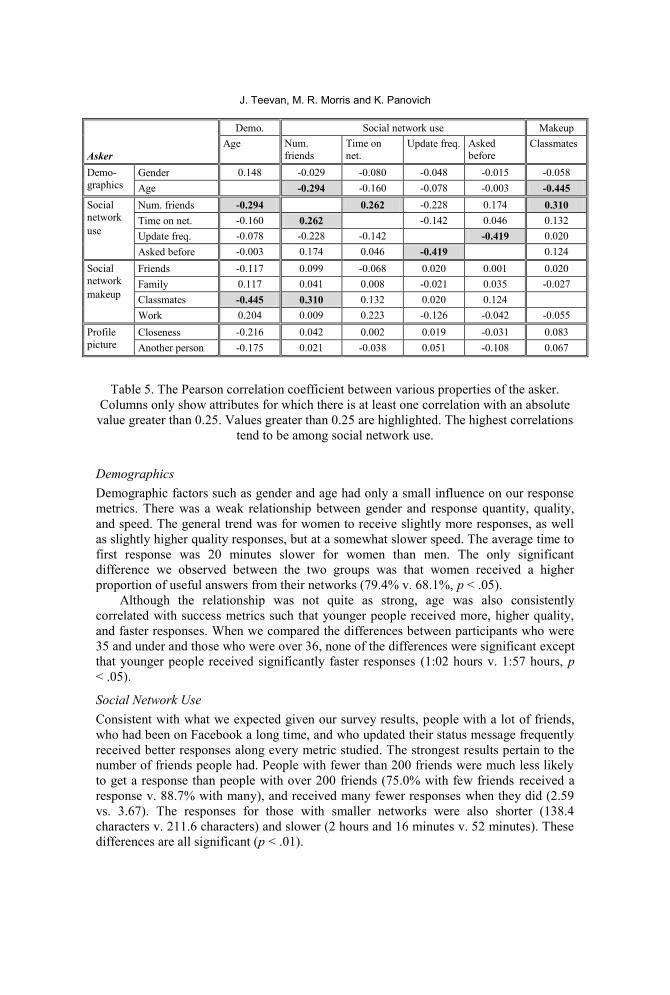
other. Table 5 shows the correlations between the dimensions we studied. Age, for
example, tends to correlate with social network use (younger people tend to have more
friends) and social network makeup (younger people have a higher proportion of their
network made up of college friends than of work friends).
J. Teevan, M. R. Morris and K. Panovich
Asker
Demo. Social network use Makeup
Age Num.
friends
Time on
net. Update freq. Asked
before Classmates
Demo-
graphics Gender 0.148 -0.029 -0.080 -0.048 -0.015 -0.058
Age -0.294 -0.160 -0.078 -0.003 -0.445
Social
network
use
Num. friends -0.294 0.262 -0.228 0.174 0.310
Time on net. -0.160 0.262 -0.142 0.046 0.132
Update freq. -0.078 -0.228 -0.142 -0.419 0.020
Asked before -0.003 0.174 0.046 -0.419 0.124
Social
network
makeup
Friends -0.117 0.099 -0.068 0.020 0.001 0.020
Family 0.117 0.041 0.008 -0.021 0.035 -0.027
Classmates -0.445 0.310 0.132 0.020 0.124
Work 0.204 0.009 0.223 -0.126 -0.042 -0.055
Profile
picture Closeness -0.216 0.042 0.002 0.019 -0.031 0.083
Another person -0.175 0.021 -0.038 0.051 -0.108 0.067
Table 5. The Pearson correlation coefficient between various properties of the asker.
Columns only show attributes for which there is at least one correlation with an absolute
value greater than 0.25. Values greater than 0.25 are highlighted. The highest correlations
tend to be among social network use.
Demographics
Demographic factors such as gender and age had only a small influence on our response
metrics. There was a weak relationship between gender and response quantity, quality,
and speed. The general trend was for women to receive slightly more responses, as well
as slightly higher quality responses, but at a somewhat slower speed. The average time to
first response was 20 minutes slower for women than men. The only significant
difference we observed between the two groups was that women received a higher
proportion of useful answers from their networks (79.4% v. 68.1%, p < .05).
Although the relationship was not quite as strong, age was also consistently
correlated with success metrics such that younger people received more, higher quality,
and faster responses. When we compared the differences between participants who were
35 and under and those who were over 36, none of the differences were significant except
that younger people received significantly faster responses (1:02 hours v. 1:57 hours, p
< .05).
Social Network Use
Consistent with what we expected given our survey results, people with a lot of friends,
who had been on Facebook a long time, and who updated their status message frequently
received better responses along every metric studied. The strongest results pertain to the
number of friends people had. People with fewer than 200 friends were much less likely
to get a response than people with over 200 friends (75.0% with few friends received a
response v. 88.7% with many), and received many fewer responses when they did (2.59
vs. 3.67). The responses for those with smaller networks were also shorter (138.4
characters v. 211.6 characters) and slower (2 hours and 16 minutes v. 52 minutes). These
differences are all significant (p < .01).

Does Anyone Know How to Get Good Answers?
Time of day Count
Quantity Quality Speed
Percent
with
response
Number of
responses
Percent
answered
Percent
useful
Response
length
Time to first
response
Morning 138 84.1% 2.802* 52.2% 73.9% 61.186 1:50
Afternoon 143 80.4% 3.609* 65.0% 69.9% 49.761 1:05
Table 6. The quantity, quality, and speed of response along the dimensions studied.
Significant differences (p <.05) are shaded and (p < .01) are indicated with a *. Time of
day data is missing for one participant.
The content of the responses also varied somewhat as a function of how many
friends people had. People with larger networks were more likely to get an answer
(66.4% v. 50.4%, p < .01) or to receive useful information (79.9% v. 63.2%, p < .01).
People with more friends also got many more social responses; 46.7% of their responses
included some social commentary, compared with only 35.7% of responses to people
with fewer friends (p < .05). This may be because people with many friends use
Facebook to help maintain those real-world connections, and the social exchanges
necessary for that maintenance may spill over into all uses of the network, including
question asking.
Social Network Makeup
In general, the self-reported makeup of our participants’ social networks did not seem to
be particularly related to response success, with almost no significant differences
emerging. The one exception was that people who had many current or former classmates
in their social network appeared more likely to receive more, better, and faster responses.
The time to first response was significantly (p < .01) faster (1:47 hours v. 0:35 hours) for
people with lots of classmates in their network. This may be because people who joined a
social network while in school are younger (online social networks being a relatively new
phenomenon) and have larger networks (students often forge network connections that
persist after a person graduates).
Profile Picture
We also observed a relatively strong relationship between how people chose to present
themselves to their social networks via their profile picture and the responses they
received. Profile photographs that showed the participant closely were significantly (p
< .05) more likely to receive a response (getting responses for 88.2% of all questions,
rather than 75.8%), and significantly (p < .05) more likely to receive a useful response
(78.8% v. 63.2%). More social profile pictures also seemed to be relate to more
successful question asking, with all measures being somewhat better if another person
was included in the picture, and significantly (p < .01) more responses being received in
such cases (4.310 v. 2.926).
6.3 How the Time of Day Affected Responses
We explored how when the question was posted affected the responses received. Table 6
shows how time of day influenced responses. Participants received significantly (p < .01)
more responses in the afternoon (3.609) than in the morning (2.802). However,
participants received significantly longer answers in the morning (61.2 characters long v.

J. Teevan, M. R. Morris and K. Panovich
Phrasing Count
Quantity Quality Speed
Percent with
response
Number of
responses
Percent
answered
Percent
useful
Response
length
Time to first
response
Punctuation Question 143 88.1%* 3.413 63.6% 80.4%* 56.930 1:25
Statement 139 76.3%* 2.962 54.0% 63.3%* 53.979 1:30
Length 1 sentence 153 88.2%* 3.681* 72.5%* 80.4%* 55.246 1:08
2 sentences 129 75.2%* 2.546* 42.6%* 62.0%* 56.048 1:55
Scope None 89 77.5% 2.623 53.9% 62.9%* 43.837* 1:37
Anyone 95 83.2% 3.241 61.1% 73.7% 57.671* 1:20
Movie buff 98 85.7% 3.655* 61.2% 78.6%* 63.264* 1:27
Table 7. The quantity, quality, and speed of response as broken down by how the
question was phrased. Significant differences (p < .05) are shaded and (p < .01) are
indicated with a *. For scope, significance is marked as compared with None. There were
no significant differences between Anyone and Movie buff.
49.8 characters long, p < .05), and there was a trend towards having a somewhat higher
proportion of their questions answered then. This may be because more users check
Facebook toward the end of the day, resulting in more reactions to afternoon posts, but
those who also check in the morning have fewer new items in their News Feed and can
therefore devote more time to crafting high-quality answers to the messages they see.
The differences in the types of responses offered in the morning compared with the
afternoon reflect this. Questions posted in the afternoon were significantly more likely to
receive an answer than those posted in the morning (65.0% v. 52.2%, p < .01). They also
received those answers faster; the time to the first response was, on average, 45 minutes
faster in the afternoon (a marginally significant difference, p = 0.053). Responders were
significantly more likely to offer alternative movie suggestions in the morning (11.7% v.
5.3%, p < .01). This may be because respondents assumed a question about movies
posted in the morning asked about an event that would occur farther in the future,
whereas a question about movies in the afternoon might reflect a more immediate desire
to begin watching a film. A handful of responders wondered why the question was posed
in the morning, asking, for example, “So are we going to watch E.T. for our 9 am
meeting?”
6.4 How Phrasing Affected Responses
How the question was phrased strongly affected response quantity, quality, and speed.
The general trend we observed is that better question phrasing resulted in better
responses, where “better” phrasing means the question was stated as a question, posed as
a single sentence, and explicitly scoped. Table 7 summarizes the impact of phrasing on
responses.
Punctuation
Questions phrased clearly as a question received better responses. A higher portion of
questions with a “?” received responses (88.1% v 76.3%, p < .01), and those responses
contained more answers and useful information. Questions phrased as statements may
look more like regular status updates, and thus not be responded to as a question as often.
This suggests that prior psychosocial research findings that explicitly phrased requests

Does Anyone Know How to Get Good Answers?
are more effective than implicit requests extend to online environments, as well (Francik
& Clark 1985). A few responders commented on the statement phrasing, mentioning the
use of “wonder.” One asked, “Why are you wondering about that now, almost 30 years
later?”
Number of Sentences
Of the phrasing variants we explored, it appears that the presence of an additional
contextualizing sentence was particularly influential. The differences in success metrics
were all significant (p < .01, except for speed, which was p < .05). Questions that
included the additional sentence, “Taking it easy,” fared worse, receiving fewer and
slower responses. Questions with context were also much less likely to receive actual
“yes” or “no” answers. Only 42.6% of questions with context received an answer, while
75.4% of the questions without it did.
Rather than providing additional motivation to provide a response, the extra sentence
we studied seemed to interfere with the ability to get an answer. This may be because the
extra sentence hid the fact that there was a question being asked, because people are less
likely to read longer status updates, or may relate to the specifics of the contextual
sentence we provided. We saw a number of people comment on the fact that the
questioner said they were taking it easy, from references to the Eagles song “Take It
Easy”, to demands that the person stop taking it easy (“What are you doing taking it
easy? Get over here and work!”). None of the ten responders who commented on the
presence of the phrase “Taking it easy” answered the actual opinion question. A more
user-specific context may not cause such a detriment. However, the strangeness of the
phrase was clearly related to the time of day; almost all of the participants who got a
comment on the contextual sentence were in the morning condition, when it was expected
the asker should be working rather than relaxing.
When we compare the content of responses received (as opposed to comparing the
questions), we see a similar pattern arising based on the presence of the extra sentence as
we saw with the time of day. Although the responses received were equally likely to
include useful information (68.4% of the questions with two sentences included useful
information, and 69.2% with one sentence did), the particular useful information varied;
when the question was posed with context people were more likely to get an alternative
movie suggestion (13.4% v. 5.4%, p < .01), and questions without the extra sentence
were more likely to get a yes or no answer (49.3% v. 40.9%, p < .05).
One benefit of including a contextualizing sentence is that it reduced requests for
clarification. Only 33% of the two sentence questions received responses requesting
clarifications, as compared to 49.6% of the one sentence questions (p < .01).
Scope
One of the more interesting findings of our study was that scoping made a significant
difference in the responses received, with explicitly scoped questions resulting in better
responses. For example, asking “my movie buff friends” yielded significantly (p < .01)
more replies, more useful information, and longer replies. In contrast, the particulars of
the scoping did not affect responses in significant ways. Scoping the question broadly to
indicate that an answer was welcome from “anyone” resulted in more or less the same
improvement noting that inquiry was meant for the specific sub-group “my movie buff
friends.”
The scoping, however, may also carry a penalty. While scoping may make people
more likely to answer if they feel they have expertise, it may also make them less likely

J. Teevan, M. R. Morris and K. Panovich
to answer if they do not. People who responded to “movie buff” questions sometimes
excused themselves for not being a movie buff, saying, for example, “I don't think I
qualify to answer…but I would say you should.” One respondent even went as far as to
ask someone else who did have the appropriate expertise. “Ron says ‘Yes, it's a classic. It
might seem dated, but it has lots of topical references and you get to see Drew Barrymore
in her non-nude phase.’ (I don't qualify to comment.)”
7. DISCUSSION Although originally designed for social purposes, social networking tools are increasingly
being appropriated for productivity-oriented tasks. This was seen both in the survey we
presented as well as work by others (e.g., DiMicco et al. 2008; Lampe et al. 2008). The
findings of the studies presented in this article contribute to the open problem of
understanding how to harness the power of social media to accomplish productivity tasks.
The results from both studies indicate that response times to questions posed on
social networks can be faster than those on traditional Q&A sites, despite the reduced
audience size (Hsieh and Counts 2009; Zhang et al. 2007). The results also suggest that
social network questions are particularly likely to receive useful responses, with 69% of
the questions collected via the survey and 72% of the questions in the controlled study
receiving useful responses. It is likely that many more questions received responses that
provided value, as even responses that appear purely social can often be valuable to the
question asker (Morris et al. ICWSM 2010).
By having a large number of people post carefully designed variants of a single
question on Facebook, we were able to tease apart in a controlled manner how important
factors identified via our survey affected response quantity, quality, and speed. We
manipulated the time of day questions were posted, punctuation, length, and scoping, and
explored how properties of the asker and their social network related to these response
metrics. Our findings demonstrate that seemingly small changes to the questions people
post to their social networks can result in significant changes in response quantity,
quality, and speed.
The characterization of the questions we collected via the survey proved valuable in
identifying interesting variations to study in a controlled manner, and even correctly
identified some of the potential impacts of these question styles and user characteristics.
For example, survey participants reported that questions with fewer sentences received
more useful responses, and this finding was confirmed in the controlled study. Likewise,
social network use appeared important in both studies. Those who update their status
frequently reported receiving faster responses in the survey. In the controlled study, the
frequency of update seemed relatively less important, but social network size was very
important. Gender and age did not appear to be significant influencers in the survey, nor
in the controlled study.
However, lack of significance in the characterization survey did not inherently lead
to lack of significance in the controlled study. The use of punctuation and scoping terms,
for example, did not correlate strongly with reported response speed or utility in the
survey, but did in the controlled study. This could be the result of a number of factors,
such as the particulars of our question topic and additional contextual sentence, or survey
respondents’ inability to accurately self-report their question asking experience.
Nonetheless, studying people’s natural question asking patterns was useful in identifying
common variations worthy of further study.
Understanding how to effectively get high-quality information from social networks
has implications both for individual users of social networking sites, as well as for those

Does Anyone Know How to Get Good Answers?
designing social search tools. Individual users can use what is presented here to pose
questions at the right time of day and with the right structure so as to prompt additional or
quicker responses. The development and maintenance of one’s social networks also
seems important if a person is to use it to maximum effect. The projection of a more
social persona may lead to better responses (e.g., if a person were to change their profile
photo to include other people), but it is also possible that the relationship we observed
arises merely because more social people project more social personas and have stronger
networks.
Since some of the questions people post to their social networks are ones that they
have first tried to answer on their own via Web search (Morris et al. 2010), search
engines could use what we have learned to prompt users to turn to their social network
when appropriate. Appropriate times to transition may include instances where the asker
needs assistance (e.g., they cannot find the answer on their own) or is particularly likely
to receive a response (e.g., the searcher has a large network or it is the right time of day to
receive a quick response). If a search engine were to automatically federate a query to a
social network on behalf of a user, then using questions that prompt quick and numerous
responses could increase the likelihood that results could be reintegrated into the user’s
search engine experience during a search session. Additionally, phrasing using the
techniques described here could assist a search engine in generating human-sounding
queries despite potential computer generation.
Hecht et al. (2012) have explored an approach to merge social question asking and
search engines by providing algorithmic responses to Facebook questions. In addition to
observing that the way a question is asked can influence the question’s responses, we also
saw evidence that the initial replies people provided influenced subsequent replies. It is
likewise likely that the algorithmic responses provided by Hecht et al. (2012) will
influence subsequent responses, and a controlled study along the lines of what we have
presented here would be interesting to further understand the influence of responses.
While the studies presented in this article provided many insights into the factors
influencing the quantity, quality, and speed of responses to questions posed on Facebook,
they also raise new questions. For example, although the movie review question we
studied represents a very common question type and topic for social network status
questions (Morris et al. 2010), it is unknown how our results will generalize to other
question types and topics. Likewise, the exact content of the additional sentence is
probably important, and a more urgent sentence (such as, “Need help now!”) might make
it so that longer questions receive faster responses. There is also much that can be learned
by studying other phrasing variants, other additional sentences, or other participant
demographics.
Given the importance of a person’s social network on the replies received, we
suspect the strength of social ties between the asker and respondent (Gilbert and
Karahalios, 2009; Panovich et al., 2012) is likely to impact response metrics. However,
who sees a social network question is not easy to control. We do not know exactly who
sees the questions a person posts, since details of the Facebook News Feed are not
published. The feed might, for example, bias toward showing users posts containing
certain urgent keywords. Even by studying only a few such variations, we were able to
identify several factors that influence social Q&A responses, and we believe there is
significant promise in the approach. We plan to investigate these topics in future studies
to further understand the nuanced issues influencing Q&A exchanges on social networks.

J. Teevan, M. R. Morris and K. Panovich
8. CONCLUSION In this article we presented an investigation of question asking behavior on the popular
social networking services Facebook and Twitter by surveying 624 people on their use of
these services for question asking. Our analysis identified several interesting
characteristics of the questions asked and explored the relationships between answer
speed and quality, properties of users’ questions (phrasing), and properties of users
themselves (age, gender, and social network use habits). Building on these naturalistic
findings, we conducted a controlled study in which 282 participants posted a question as
their Facebook status message, with variations in time of day, length, punctuation, and
scoping. We found that a more social question asker will get a better response from their
social network, especially in the afternoon, and that phrasing a question well leads to
better responses. Keeping the question stated as a question (as opposed to a statement),
explicitly scoping the audience (even using the generic scoping “anyone”), and keeping
the question short (even at the expense of removing context) led to more, better, and
faster responses.
The data presented contributes to our understanding of social networks, in particular
by exploring how a variety of factors impact social networking tools’ utility at helping
users achieve a question-asking task. In addition to deepening our knowledge of social
networks, these findings can also be used by people creating social search and social
Q&A tools to optimize system features.
ACKNOWLEDGMENTS The authors would like to thank our collaborators Mark Ackerman, Lada Adamic, Darren
Gergle, Brent Hecht, Dan Liebling, and Jiang Yang, as well as the participants in our
studies.
REFERENCES ACKERMAN, M. AND MALONE, T. Answer Garden: A Tool for Growing Organizational Memory. In
Proceedings of SIGOIS 1990. ACKERMAN, M. AND PALEN, L. The Zephyr Help Instance: Promoting Ongoing Activity in a CSCW System. In
Proceedings of CHI 1996, 268-275.
ADAMIC, L.A., ZHANG, J., BAKSHY, E., AND ACKERMAN, M.S. Everyone knows something: Examining knowledge sharing on Yahoo Answers. In Proceedings of WWW 2008.
BEENAN, G., LING, K., WANG, X., CHANG, K., FRANKOWSKI, D., RESNICK, P., AND KRAUT, R.E. Using Social
Psychology to Motivate Contributions to Online Communities. In Proceedings of CSCW 2004, 212-221. BERNSTEIN, M., TAN, D., SMITH, G., CZERWINSKI, M., AND HORVITZ, E. Collabio: A Game for Annotating
People within Social Networks. In Proceedings of UIST 2009, 97-100.
BURKE, M., JOYCE, E., KIM, T., ANAND, V., AND KRAUT, R. Introductions and Requests: Rhetorical Strategies That Elicit Response in Online Communities. Communities & Technologies, 2007.
CHEN, W., ZENG, Q., AND WENYIN, L. A User Reputation Model for a User-Interactive Question Answering
System. In Proceedings of SKG 2006, 40-45. DIMICCO, J., MILLEN, D., GEYER, W., DUGAN, C., BROWNHOLTZ, B., AND MULLER, M. Motivations for Social
Networking at Work. In Proceedings of CSCW 2008, 711-720.
EFRON, M. AND WINGET, M. Questions are Content: A Taxonomy of Questions in a Microblogging
Environment. In Proceedings of ASIS&T 2010.
EVANS, B. AND CHI, E. Towards a Model of Understanding Social Search. In Proceedings of CSCW 2008, 485-494.
EVANS, B., KAIRAM, S., AND PIROLLI, P. Do Your Friends Make You Smarter?: An Analysis of Social
Strategies in Online Information Seeking. Information Processing and Management, 2010. FARRELL, S., LAU, T., WILCOX, E., NUSSER, S., AND MULLER, M. Socially Augmenting Employee Profiles with
People-Tagging. In Proceedings of UIST 2007, 91-100.
FRANCIK, E. AND CLARK, H. How to Make Requests that Overcome Obstacles to Compliance. Journal of Memory and Language, 24 (1985), 560-568.
GILBERT, E. AND KARAHALIOS, K. Predicting Tie Strength with Social Media. In Proceedings of CHI 2009,
211-220.

Does Anyone Know How to Get Good Answers?
GLASER, B.G. AND STRAUSS, A.L. The Discovery of Grounded Theory: Strategies for Qualitative Research.
Aldine, 1977.
GOLOVCHINSKY, G., MORRIS, M.R., AND PICKENS, J. Information Processing &Management, special issue on Collaborative Information Seeking, 2010, 46 (6): 629-631.
HARPER, F.M., RABAN, D., RAFAELI, S., AND KONSTAN, J.A. Predictors of Answer Quality in Online Q&A
Sites. In Proceedings of CHI 2008, 865-874. HECHT, B., TEEVAN, J., MORRIS, M.R., AND LIEBLING, D. SearchBuddies: Bringing Search Engines into the
Conversation. In Proceedings of ICWSM 2012.
HONEYCUTT, C. AND HERRING, S. Beyond Microblogging: Conversation and Collaboration via Twitter. In Proceedings of HICSS 2009, 1-10.
HOROWITZ, D. AND KAMVAR, S.D. Anatomy of a Large-Scale Social Search Engine. In Proceedings of WWW
2010, 431-440. HSIEH, G. AND COUNTS, S. mimir: A Market-Based Real-Time Question and Answer Service. In Proceedings of
CHI 2009.
KARAU, S., AND WILLIAMS, K. Social Loafing: A Meta-Analytic Review and Theoretical Integration. Journal of
Personality and Social Psychology, 65:1993.
LAMPE, C., ELLISON, N., AND STEINFIELD, C. Changes in Use and Perception of Facebook. In Proceedings of
CSCW 2008, 721-730. LAMPE, C., VITAK, J., GRAY, R., AND ELLISON, N. Perceptions of Facebook’s Value as an Information Source.
In Proceedings of CHI 2012.
LANGER, E., BLANK, A., AND CHANOWITZ, B. The Mindlessness of Ostensibly Thoughtful Action. Journal of Personality and Social Psychology, 36:1978, 635-642.
LIU, Y., BIAN, J., AND AGICHTEIN, E. Predicting Information Seeker Satisfaction in Community Question
Answering. In Proceedings of SIGIR 2008, 483-490. MADDEN, M. AND ZICKUHR, K. 65% of Online Adults Use Social Networking Sites. Pew Internet and American
Life Project, August 26, 2011. MAMYKINA, L., MANOIM, B., MITTAL, M., HRIPCSAK, G. AND HARTMANN, B. Design Lessons from the Fastest
Q&A Site in the Web. In Proceedings of CHI 2011.
MORRIS, M.R. AND HORVITZ, E. SearchTogether: An Interface for Collaborative Web Search. In Proceedings of UIST 2007.
MORRIS, M.R., TEEVAN, J., AND PANOVICH, K. What Do People Ask Their Social Networks, and Why? A
Survey Study of Status Message Q&A Behavior. In Proceedings of CHI 2010.
MORRIS, M.R., TEEVAN, J., AND PANOVICH, K. A Comparison of Information Seeking Using Search Engines
and Social Networks. In Proceedings of ICWSM 2010, 291-294.
MORRIS, M.R. AND TEEVAN, J. Collaborative Web Search: Who, What, When, Where, and Why? Morgan & Claypool, 2010.
NAAMAN, M., BOASE, J., AND LAI, C.-H. Is it Really About Me? Message Content in Social Awareness Streams.
In Proceedings of CSCW 2010, 189-192. NICHOLS, J. AND KANG, J-H. Asking Questions of Targeted Strangers on Social Networks. In Proceedings of
CSCW 2012.
PANOVICH, K., MILLER, R., AND KARKER, K. Tie Strength in Question & Answer on Social Network Sites. In Proceedings of CSCW 2012.
PAUL, S.A., HONG, L., AND CHI, E.H. Is Twitter a Good Place for Asking Questions? A Characterization Study.
In Proceedings of ICWSM 2011. PIROLLI, P. An Elementary Social Information Foraging Model. In Proceedings of CHI 2009, 605-614.
RABAN, D., AND HARPER, F. Motivations for Answering Questions Online. In New Media and Innovative
Technologies, 2008. TEEVAN, J., MORRIS, M.R., AND PANOVICH, K. Factors Affecting Response Quantity, Quality, and Speed for
Questions Asked via Social Network Status Messages. In Proceedings of ICWSM 2011.
TEEVAN, J., RAMAGE D. AND MORRIS, M.R. #TwitterSearch: A Comparison of Microblog Search and Web Search. In Proceedings of WSDM 2011.
TORREY, C., CHURCHILL, E. AND MCDONALD, D. Learning How: The Search for Craft Knowledge on the
Internet. In Proceedings of CHI 2009. WELLS, A.T. AND RAINIE, L. The Internet as Social Ally. First Monday, 13(11), November 3, 2008.
YANG, J., MORRIS, M.R., TEEVAN, J., ADAMIC, L., AND ACKERMAN, M. Culture Matters: A Survey Study of
Social Q&A Behavior. In Proceedings of ICWSM 2011. ZHANG, J., ACKERMAN, M., ADAMIC, L., AND NAM, K. QuME: A Mechanism to Support Expertise Finding in
Online Help-Seeking Communities. In Proceedings of UIST 2007, 111-14.