BETO FY14 BC FOA Presentation for BETO 2015 Project Peer Review

23 March 2015
DOE BETO 2015 Project Peer Review: Conversion R&D Development and Standardization of Techniques for Bio-oil
Characterization
Jack Ferrell, NREL; Mariefel V. Olarte, Asanga Padmaperuma, PNNL
This presentation does not contain any proprietary, confidential, or otherwise restricted information

Problem Statement
2
Fast Pyrolysis Upgrading Hydrotreating Biomass Hydrocarbon Biofuels
Standard analytical methods needed
• Path to cost competitive biofuels requires innovation in each process step
• Integration with refinery infrastructure requires quality metrics – Reliable analytics needed

Goal Statement
• Standardize quantitative analytical methods for bio-oil characterization – Standard methods do not exist for bio-oil
• Adoption of methods by the community – Verified standard methods (< 10% inter-laboratory variability) will
be published as Laboratory Analytical Procedures (LAPs), which are free and publicly available
• Move towards more complete bio-oil analysis – Methods for crude oil may not be appropriate for bio-oil
• Enable commoditization of bio-oils
3

Quad Chart Overview
4
• Start: 10/1/2013 • End: 9/30/2017 • 35% Complete
Timeline
Budget
• BETO Barriers Addressed – Tt-F: Deconstruction of Biomass to Form Bio-
Oil Intermediates – Tt-H: Bio-Oil Intermediate Stabilization and
Vapor Cleanup – Tt-J: Catalytic Upgrading of Bio-Oil
Intermediates to Fuels and Chemicals – Tt-S: Petroleum Refinery Integration of Bio-Oil
Intermediates
Barriers
• Partners − NREL (50%), PNNL (50%) − ORNL (Round Robin)
• Leading Round Robin in FY15 − Universities: Washington University
St. Louis, University of Idaho, Washington State University
− Labs: NREL, PNNL, ORNL, VTT Technical Research Centre of Finland, Thunen Institute of Wood Research, CanmetENERGY
Partners
Total Costs FY10 – FY12
FY13 Costs
FY14 Costs
Total Planned Funding (FY15 – FY17)
DOE Funded $0k $0k $371k $3,327k

Project Overview
5
Goal: Provide the public with a set of best practices and enable meaningful, consistent and transferrable data between research laboratories and other stakeholders (including refiners) dealing with bio-oil

Technical Approach
6 6
Success Factors • Develop and validate reliable standard methods (< 10% Inter-
Laboratory variability) to share with bio-oil community • Adoption of methods by the bioenergy community
Approach
Develop standard methods
Validate Methods: Round Robin
Share: LAPs, publications
Data on bio-oil needs to be meaningful, consistent, and transferrable
Challenge

Technical Approach
7 7
Need to move towards complete bio-oil characterization
Challenge
Success Factors • Accelerate the approach to cost competitive biofuels
− Research in each processing step needs complete characterization of feed/products
• Create a framework for analysis that will be used by entire community − Spell out appropriate methods for desired measurements on raw and upgraded
oils
Approach
Develop suite of methods
C=O (carbonyls)
Acid Content
Hydroxyl Groups Compounds
Boiling Range
Chromatography
TGA
NMR
Titration

Management Approach
8 8
• NREL and PNNL – Determine analytical needs from bioenergy community – Develop standard methods in parallel – Cross-validate standard methods (prior to Round Robin) – Open and constant communication between NREL and PNNL
• Annual Operating Plan (AOP), Project Management Plan (PMP) – Milestones defined prior to fiscal year – Risk management / abatement of uncertainties – Go / No-Go decision (3/31/2016): Round Robin Reproducibility: <10%
variability in carbonyl quantification by titration • Significance: carbonyls are important markers in bio-oil

Standard Bio-oil for Method Development
9
• Produced in 2010 at NREL in Pilot Plant1 • Oak, 500 ⁰C • Not hot gas filtered • Have large quantity
• Aging Test
• 80 ⁰C, 24 hours • 2.1% viscosity change
• Very small change • Oil stabilized during
storage
9
1Baldwin, RM, Feik, CJ, 2013 Energy & Fuels 27: 3224-3238
Property C (wt%) 44.5 H (wt%) 6.8 N (wt%) 0.07 O (wt%) 48.6 S (wt%) <0.005 Water (wt%) 23.1 Insoluble solids (wt%) 0.84 K (ppm) 79 Na (ppm) 127
Current analysis methods do not fully describe the oil quality, nor fully inform downstream processing

Gas Chromatography – Mass Spectrometry (GC-MS): Quantification of Volatile Components
10
10
• Knowledge of specific compounds important for upgrading and refinery integration
• Literature survey1: variety of columns, dimensions, and instrument parameters
• Results highlight importance of using a quantitative method for GC-MS
– Trends in results based on % peak area not always valid
• Response factors unique to specific compound on MS detector
• Intra-laboratory variability: < 5% for each compound
Tentative ID % Area %
Levoglucosan 34.0 8.8
Acetic acid 12.2 4.3
Acetol 3.4 1.1
Hydroxyacetaldehyde 3.1 5.0
Furfural 1.5 0.34
Catechol 1.4 0.38
Syringol 1.3 0.14
3-Methyl-1,2-cyclopentanedione 1.2 0.22
5-Hydroxymethylfurfural 1.2 0.32
2(5H)-Furanone 0.8 0.26
Propanoic acid 0.7 0.39
4-Ethylguaiacol 0.7 0.04
Guaiacol 0.7 0.08
Creosol 0.6 0.07
2-Cyclopenten-1-one 0.5 0.08
1Sipila, K., et al. 1998 Biomass and Bioenergy 14: 103-113
• Method gives identity and concentrations of components in bio-oil
Minutes10 20 30 40 50 60
Abu
ndan
ce
0
2e+6
4e+6
6e+6
8e+6Acetic Acid
Hydroxyacetaldehyde
Acetol
Levoglucosan

Carboxylic Acid Titration: CAN/TAN Analysis
11 11
• Organic acids and phenolics are abundant in bio-oil – Knowledge of acid content vital for upgrading and refinery integration
• Acid content of petroleum commonly measured by titration (ASTM D664) and expressed as total acid number (TAN)
• Modified D664, allowing for increased precision of the carboxylic acid number (CAN), and detection of phenolics at the second endpoint1
– Changed the titrant from KOH to tetrabutyl ammonium hydroxide (TBAOH) – Changed pH electrode electrolyte from LiCl to tetraethyl ammonium bromide
(TEABr)
• Results with bio-oil: – 1st endpoint: CAN = 81 ± 1 mg KOH/g – 2nd endpoint: TAN = 187 ± 2 mg KOH/g – Phenolic content PhAN= TAN – CAN =
99 ± 1 mg KOH/g
1 Christensen, ED, et al. 2011 Energy and Fuels 25:5462-5471.
• Simple, reliable titration method • Gives concentrations of organic
acids and phenolics Volume (mL)
0 2 4 6 8 10
pH
4
6
8
10
12
14
16
18
ERC
0
20
40
60
80

Carbonyl Quantification by Titration
12 12
• Carbonyls in bio oil: – Stability during storage – Coke formation during upgrading – Aldehydes and ketones
• Quantitative analysis via titration • Conversion of C=O to oxime • Titrate the liberated HCl using a base
1Nicolaides, GM. 1984. MASc Thesis, University of Waterloo
Results1 3.33 ± 0.11 mmol C=O/g
• Modified Nicolaides method1 • Intra-laboratory variability < 3% • Inter-laboratory variability < 3%
• Simple, reliable titration method • Gives concentration of carbonyls
[aldehyde + ketone]

31P NMR: Quantification and Classification of Hydroxyl Groups
13
13
• Importance: hydroxyl groups present in functionalities relevant to stabilization and upgrading of bio-oils
• Use 31P NMR method – 31P 100% abundant • Application to coals, carbohydrates and lignins1,2 • Can quantitatively determine:
• Phenols • Aliphatic alcohol • Carboxylic acids
1Wroblewski, AE, et al. 1988. Energy and Fuels 2: 765-774 2Argyropoulos, DS. 1995. Res. Chem. Intermed. 21: 373-395
Functional group
Chemical shift, ppm O - Wt., %
Aliphatic -OH 152 - 145 16.2 ± 0.4% Phenolic -OH 138 – 145 8.1 ± 0.2% Carboxylic -OH 134.6 - 136 7.6 ± 0.3%
• Method gives concentration of three hydroxyl groups: phenolic, aliphatic, carboxylic

Extension of Standard Methods to Other Bio-oils
14
• Fast pyrolysis oils • Stabilized Pine
• 34.5% O • Medium O upgraded oil
• 8.6% O (Oak) • Low O hydrotreated oil
• 1.3% O (Pine) • Hydrothermal liquefaction
(HTL) oils • Wood (Pine, 14.1% O) • Algae (5.3% O, 4.8% N)
14
Standard Methods
• Functional Group methods • Carbonyls, hydroxyl groups,
carboxylic acids (CAN) and phenolics (PhAN) quantified
• GC-MS • Standard method applicable to
Stabilized pine sample • Upgraded, hydrotreated, and
HTL oils need new methods
Fast Pyrolysis HTL Upgrading Hydrotreating Biomass Hydrocarbon
Biofuels
• Functional group methods apply well to new bio-oils
• New methods needed for GC

Simulated Distillation using Thermogravimetric Analysis (TGA)
15 15
• Boiling range regulated for gas, diesel, and jet fuels • Batch distillation (ASTM D86) requires 100mL sample • GC-based simulated distillation works well for hydrocarbons
o Oxygenated polar compounds in bio-oil bias results
% Mass Loss0 10 20 30 40 50 60 70 80 90 100
Tem
pera
ture
, °C
100
150
200
250
300
350 D86 Standard100 °C/min50 °C/min25 °C/min10 °C/min5 °C/min
• With TGA, measure weight loss by evaporation as sample is heated – gives similar data to distillation curve
• D86 diesel standard used for method validation
• Different temperature ramps tested with D86 standard
– 50 ⁰C/min best fit to actual distillation
TGA can accurately simulate distillation

Simulated Distillation using Thermogravimetric Analysis (TGA)
16 16
• Results with bio-oil • All ramp rates converge at
~65% mass loss1 • Results indicate mass loss
above ~325°C is due to thermal degradation
– ~35% bio-oil not volatile
• GC methods typically inject <300°C
• Batch distillation with bio-oil2
generated 35-50% residue % Mass Loss
0 10 20 30 40 50 60 70 80 90 100
Tem
pera
ture
, °C
100
200
300
400
500
600 100 °C/min50 °C/min25 °C/min10 °C/min5 °C/min
2Czernik, S, et al., 2004 Energy and Fuels 18: 590-598
• Quick way to determine volatile fraction of bio-oil • Needs to be expanded to other bio-oils and upgraded oils
1Christensen, ED, et al., 2015. Energy and Fuels, in preparation
65 wt% volatile
35 wt% unidentified

Relevance
17 17
• Addresses BETO Barriers – Tt-F: Deconstruction of Biomass to Form Bio-Oil Intermediates – Tt-H: Bio-Oil Intermediate Stabilization and Vapor Cleanup – Tt-J: Catalytic Upgrading of Bio-Oil Intermediates to Fuels and Chemicals – Tt-S: Petroleum Refinery Integration of Bio-Oil Intermediates
• Need to move away from methods used for crude oil
– Methods developed for raw, upgraded, and hydrotreated bio-oils will be more accurate, precise, and appropriate
• Accelerate research for each processing step – Move towards more complete bio-oil analysis – Support development of commercially viable biofuel technologies
Fast Pyrolysis Upgrading Hydrotreating Biomass Hydrocarbon Biofuels

Relevance
18 18
• Enable accurate communication across the bioenergy industry – Bio-oil producers and refiners have different priorities – Researchers, policy makers, and the bioenergy industry need to speak
the same language • Started with methods for raw bio-oil • Transition to methods for upgraded and hydrotreated oils
• Key output: – Laboratory Analytical Procedures (LAPs)
• Development and adoption of methods by community • Suite of LAPs will create a framework for analysis that will be used
by entire community – Spell out appropriate methods for measurements on raw,
upgraded, and hydrotreated oils
Fast Pyrolysis Upgrading Hydrotreating Biomass Hydrocarbon
Biofuels

Future Work
19 19
Develop suite of methods
Carbon Functional Groups
Esters
13C NMR
Carbonyl species
Acid species
HPLC
Colorimetry 300 400 500 600 700
0.0
0.1
0.2
0.3
0.4
0.5
0.6
0.7
Abs
orba
nce
Wavelength (nm)
Out years: Transition to upgraded bio-oils
Round Robin
SEC, distillation
Suite of methods
Unknown wt%

Summary
20
• Overview • Standardized quantitative analytical methods needed for bio-oils
• Approach • Joint task between NREL and PNNL (started FY14) • Develop standard methods (LAPs) for bio-oils
• Engage community to validate LAPs via Round Robin
• Technical accomplishments • Standardized existing methods for raw bio-oil
• GC-MS, CAN/TAN, carbonyl titration, 31P NMR • Development of new methods for bio-oil
• TGA simulated distillation
20

Summary
21
• Relevance • Enable accurate communication across bioenergy industry • Accelerate research and development of commercially viable
biofuel technologies • Technology transfer to stakeholders: LAP methods, peer-
reviewed publications
• Future work • Standardize methods
• 13C NMR • HPLC for carboxylic acids and carbonyls
• Development of new methods • Esters by colorimetry • SEC as separation technique
• Unknown wt%: separation → suite of techniques
• Out Years: Method development and standardization for upgraded bio-oils
21

Acknowledgements
NREL Earl Christensen
Stuart Black
Haoxi Ben
Steve Deutch
Gina Chupka
Lisa Fouts
Robert McCormick
Dan Ruddy
Fred Baddour
Kristiina Iisa
Whitney Jablonski
Adam Bratis
Mark Davis
22
PNNL Sarah D. Burton
Teresa Lemmon
Marie Swita
Heather Job
Evgueni Polikarpov
Deanna Auberry
Gary Neuenschwander
Leslie Rotness
Alan Zacher
Suh-Jane Lee
Corinne Drennan
Doug C. Elliott
DOE BETO for funding this work
Round Robin Partners Marcus Foston
(Washington University St. Louis) Armando McDonald
(University of Idaho) Manuel Garcia-Perez
(Washington State University) Jim Keiser
(ORNL) Anja Oasmaa
(VTT Technical Research Centre of Finland)
Dietrich Meier
(Thunen Institute of Wood Research)
Jinwen Chen
(CanmetENERGY)

Questions
23 23

Additional Slides
24 24

Definitions / Abbreviations
25
• Round Robin: an inter-laboratory test, where each method is tested multiple times by independent scientists. Each scientist follows the same set of instructions, which are the LAPs.
• NMR = Nuclear Magnetic Resonance • ERC = endpoint recognition criteria (1st derivative of titration curve) • CAN = carboxylic acid number • TAN = total acid number • PhAN = phenolic acid number (TAN – CAN) • GC-MS = gas chromatography – mass spectrometry • TGA = thermogravimetric analysis • HPLC = high performance liquid chromatography • TEA = techno-economic analysis • LCA = life cycle assessment • ASTM = American Society of Testing and Materials • LAP = laboratory analytical procedure • SEC = size exclusion chromatography
25

Presentations
26
• “Oil Derived from Biomass: Qualitative and Quantitative Analysis of Oxygenates” (oral presentation), Padmaperuma AB, Olarte MV, Burton SD, Lee SJ, Lemmon TL, Drennan C, Ferrell JR, Christensen ED, Deutch S and Fouts L. AIChE Annual Meeting Atlanta GA, Nov 16-21 2014
• “Simulated Distillation of Pyrolysis Bio-Oil using Thermogravimetric Analysis” (poster presentation), Christensen ED, Deutch S, and Ferrell JR. TCS2014: Symposium on
Thermal and Catalytic Sciences for Biofuels and Biobased Products, Denver, CO, September 2-5, 2014
• “Standardization and Development of Bio-oil Analytical Techniques” (poster presentation), Olarte MV, AB Padmaperuma, SD Burton, TL Lemmon, SJ Lee, C Drennan, J Ferrell, ED Christensen, S Deutch and L Fouts. Biomass 2014, Washington, DC, July 29, 2014
• “Crude oil derived from biomass: what is in it and implications on catalytic upgrading” (poster presentation) Padmaperuma AB, MV Olarte, SD Burton, SJ Lee, TL Lemmon, DL Auberry, DC Elliott, AH Zacher, C Drennan, GG Neuenschwander, and LJ Rotness, Jr. 2014. 248th ACS National Meeting and Exposition, San Francisco, CA, Aug 10, 2014.
• “Development and Standardization of Techniques for Bio-oil Characterization” (oral presentation), Olarte MV, and AB Padmaperuma. Invited seminar at NREL, Golden, CO, June 27, 2014
• “Development and Standardization of Techniques for Bio-oil Characterization” (oral presentation), Christensen ED, and Ferrell JR. Invited seminar at PNNL, Golden, CO, April 10, 2014
26

27
Related Projects
Related NREL tasks (and associated WBS numbers): • Thermochemical Feedstock Interface (WBS: 2.2.1.304)
• Computational Pyrolysis Consortium (WBS: 2.5.1.302)
• Integration and Scale Up (WBS: 2.4.1.301)
• Liquid Fuels via Upgrading of Syngas Intermediates (WBS: 2.3.1.305)
• Catalytic Pyrolysis Science (WBS: 2.3.1.313)
• Catalytic Upgrading of Pyrolysis Products (WBS: 2.3.1.314)
• Catalyst Development and Testing (WBS: 2.3.1.315)
Related PNNL tasks (and associated WBS numbers): • Bio-oil Quality Improvement and Catalytic Hydrotreating of Bio-oils (WBS: 2.3.1.302)
• Electrochemical Methods for Upgrading Pyrolysis Oils (WBS: 2.12.1.5)
• Hydrothermal Processing of Biomass (WBS: 2.2.2.301)
• Computational Pyrolysis Consortium (WBS: 2.5.1.303)

Technical Approach – Challenges and Abatements
28 28
Challenge Abatement
Identifying critical sources of deviation/variation between current individual laboratory practices and equipment
Detailed methods (LAP) and spreadsheets will be made available
Addition of a validation mixture not originally proposed
Bio-oil changes during shipment and handling
Consistent shipping and storage methods
Availability of reagents Synthesis method for TMDP identified and implemented

FY14 Milestones
29 29
NREL FY14 Milestones Q1 12/31/2013 Regular Determination of the bio-oil boiling fraction: Determine the amount of a pyrolysis oil sample that is analyzable by gas chromatography methods.
Q2 3/31/2014 Regular Development of best practices for carboxylic acid titrations: Development of standard sample preparation and analytical methodology for carboxylic
Q3 6/30/2014 Regular Development of best practices for GC/MS: Development of standard sample preparation and analytical methodology for GC/MS analysis of a pyrolysis oil sample.
Q4 9/30/2014 Regular Inter-laboratory transfer of developed best practices and validation between NREL and PNNL: Transfer of best practice methods from PNNL for validating their developed methods. Successful application of methodologies using NREL equipment with comparable results to PNNL. (Joint with PNNL)
PNNL FY14 Milestones Q1 12/31/2013 Regular Analyses of pyrolysis oil from NREL using conventional methods
Q2 3/31/2014 Regular Development of best practices for 31P NMR
Q3 6/30/2014 Regular Development of best practices for carbonyl titration
Q4 9/30/2014 Regular Inter-laboratory transfer of developed best practices and validation between PNNL and NREL: Transfer of best practice methods from NREL for validating their developed methods. Successful application of methodologies using PNNL equipment with comparable results to NREL. (Joint with NREL)

FY15 Milestones
30 30
NREL FY15 Milestones Q1 12/31/2014 Regular Expand methods developed in FY14 (using a standard bio oil) to other bio oil types by implementing them on five new bio oil sample types, including low (e.g. upgraded) and high oxygen contents, and HTL oils from algae and wood.
Q2 3/31/2015 Regular Development of a standard method for 13C NMR: Development of standard sample preparation and analytical methodology of a bio-oil sample using 13C nuclear magnetic resonance (NMR) for functional group analysis.
Q3 6/30/2015 Regular Development of standard HPLC methods: Report on the development of standard sample preparation and analytical methodology using HPLC for the determination of both carboxylic acid and carbonyl content of a bio-oil sample.
Q4 9/30/2015 Regular (1) Complete preparation of a manuscript summarizing the results of the round-robin for submission to a high impact peer-reviewed journal. Standard methods are needed to compare results from different laboratories, and the round robin will demonstrate the robustness of each standardized method. (2) Reproduce Christensen effort (landmark paper) to determine fate of heteroatoms in mid-to-fully upgraded bio oil fractions (e.g. gasoline, diesel, jet), with specific focus on heavy fractions. At least three (3) fractions will be tested, using conventional analytical techniques as well as at least three (3) standardized analytical techniques developed under this collaboration.
PNNL FY14 Milestones Q1 12/31/2014 Regular Same as NREL (above)
Q2 3/31/2015 Regular PNNL will develop colorimetric techniques to analyze for ester functionalities in bio-oils. In the current FY14, we have standardized methods to analyze acids, alcohols, phenols and carbonyls.
Q3 6/30/2015 Regular Literature survey for determining analytical technique correlation. PNNL will conduct a survey of existing data on bio-oils to determine possible correlation between viscosity, density, O content and KF values. Findings will be summarized in a report.
Q4 9/30/2015 Regular Same as NREL (above)

Data Comparisons: FY14 Standard Methods
31
• Carboxylic acids • PNNL
• CAN: 1.52 mmol/g • Carboxylic-OH: 1.81 mmol/g
• 19% difference • NREL
• CAN: 1.44 mmol/g • Carboxylic-OH: 1.28 mmol/g
• 11% difference • Phenolics
• PNNL • PhAN (TAN-CAN): 2.37 mmol/g • Phenolic-OH: 3.9 mmol/g
• 39% difference • NREL
• PhAN (TAN-CAN): 1.89 mmol/g • Phenolic-OH: 2.67 mmol/g
• 29% difference
31

Cross Validation of Standard Methods
32
• GC-MS • 8 of 31 calibrated compounds had > 20% difference between NREL
and PNNL • CAN/TAN
• CAN: PNNL (85.1 mg KOH/g); NREL (81 mg KOH/g) • 5% difference
• TAN: PNNL (218.5 mg KOH/g); NREL (187 mg KOH/g) • 14% difference
• 31P NMR • Aliphatic-OH: PNNL (7.79 mmol/g); NREL (5.45 mmol/g)
• 30% difference • Phenolic-OH: PNNL (3.9 mmol/g); NREL (2.67 mmol/g)
• 32% difference • Carboxylic-OH: PNNL (1.81 mmol/g); NREL (1.28 mmol/g)
• 29% difference • Carbonyl titration
• PNNL (3.333 mmol/g); NREL (3.301 mmol/g) • 1% difference 32

GC-MS Cross Validation
33 33
• Attention to detail in
instrument parameters/setup – MS transfer line
temperature – Inlet liner
type/orientation – Incorporated into
LAPs for Round Robin
• Differences in sample aging during transport and storage – Addition of validation
mixture for Round Robin
Target Compound Reported NREL
values, ppm
PNNL Average,
ppm % Difference between
NREL and PNNL values Glycolaldehyde 50420 35515 -29.6
Acetic Acid 43410 42551 -2.0 Acetol 11490 12974 12.9
3-Hydroxy-2-butanone 380 338 -11.0 Propanoic acid 3890 3567 -8.3 Butanoic acid 1470 1231 -16.3
2-Cyclopenten-1-one 750 748 -0.3 Furfural 3430 3563 3.9
5-methylfurfural 630 563 -10.7 2(5)-Furanone 2580 2431 -5.8
3-Methyl-1,2-cyclopentanedione 2170 2176 0.3
3-Methyl-2(5)-furanone 500 487 -2.6 Phenol 580 532 -8.3
Guaiacol 800 778 -2.8 o-Cresol 580 353 -39.2
Maltol 970 664 -31.5 Creosol 670 685 2.3 p-Cresol 520 240 -53.8 m-cresol 280 198 -29.2
2,4-Xylenol 430 385 -10.5 4-ethylguaiacol 420 340 -19.1
Eugenol 390 342 -12.3
5-Hydroxymethylfurfural 3180 3058 -3.8 Catechol 3800 4649 22.3 Syringol 1380 1572 13.9 Vanillin 560 604 7.9
Hydroquinone 590 464 -21.3 Apocynin 460 524 13.9
Levoglucosan 88000 78751 -10.5 Syringaldehyde 1200 1054 -12.1 Acetosyringone 910 675 -25.9

Gas Chromatography – Mass Spectrometry (GC-MS) Method
34
34
Compound
Average Concentration
(µg/mL)
Standard Deviation
Uncertainty
Levoglucosan 88,000 1,100 3,000 Glycolaldehyde 50,420 1,100 3,100 Acetic acid 43,410 445 1,240 Acetol 11,490 139 385 Propanoic acid 3,890 110 310 Furfural 3,430 20 60 5-Hydroxymethylfurfural 3,180 50 150 2(5H)-Furanone 2,580 25 70 3-Methyl-1,2-cyclopententanedione
2,170 50 50
Butanoic acid 1,470 40 110 Syringol 1,380 20 60 Syringylaldehyde 1,200 15 40 Maltol 970 15 40 Acetosyringone 910 10 30 Guaiacol 800 8 20 2-Cyclopenten-1-one 750 8 20 Creosol 670 5 15 5-Methylfurfural 630 3 9 Hydroquinone 590 5 15 o-Cresol 580 4 12 Phenol 580 6 18 Vanillin 560 7 20 p-Cresol 520 5 13 3-Methyl-2(5H)-furanone 500 8 20 Apocynin 460 5 15 2,4-Xylenol 430 2 6 4-Ethylguaiacol 420 2 5 Eugenol 390 3 10 3-Hydroxy-2-butanone 380 4 12 Catechol 290 3 7 m-Cresol 280 3 7
• Internal standards: isoamyl ether, 1-octanol, methyl laurate
• Acetonitrile used as solvent • 8 calibration standards, each containing
31 compounds. R2 > 0.995 required for calibration curve
• The GC/MS instrument parameters are as follows:
– Carrier gas: Helium; Carrier gas flow rate: 1 mL/min (constant flow); Injection volume: 1 µL; Injection port temperature: 250 °C; Split injection ratio: 30:1; Initial oven temperature: 45 °C, 10 min hold time; Oven ramp rate: 3 °C/min; Final oven temperature: 250 °C, 5 min hold time; MSD transfer line temperature: 280 °C; Source temperature: 230 °C; Quad temperature: 150 °C; MSD scan range: m/z 29-600

Carboxylic Acid Titration Method
35 35
Model Compounds in Diesel, TBAOH
prop
ionic
acid
hexa
noic
acid
low
hexa
noic
acid
mid
hexa
noic
acid
high
benz
oic a
cidph
enol
vanil
lin lo
wva
nillin
mid
vanil
lin h
ighgu
aiaco
l
2,4-
dimet
hylph
enol
4-pr
opylg
uaiac
ol low
4-pr
opylg
uaiac
ol m
id
4-pr
opylg
uaiac
ol hig
h
mixe
d std
tota
l acid
mixe
d std
carb
oxyli
c
mixe
d std
phe
nolic
mg
KOH/
g
0
10
20
30
40
50MeasuredActual
Model Compounds in Diesel, KOH
prop
ioni
c ac
id
hexa
noic
acid
low
hexa
noic
acid
mid
hexa
noic
acid
hig
hbe
nzoi
c ac
idph
enol
vani
llin lo
wva
nillin
mid
vani
llin h
igh
guai
acol
2,4-
dim
ethy
lphe
nol
4-pr
opylg
uaia
col lo
w
4-pr
opylg
uaia
col m
id
4-pr
opylg
uaia
col h
igh
mixe
d st
d to
tal a
cid
mixe
d st
d ca
rbox
ylic
mixe
d st
d ph
enol
ic
mg
KO
H/g
0
10
20
30
40
50MeasuredActual
KOH Titrant • Hindered phenol not detected • When phenolics mixed with carboxylics,
do not detect both • Only CAN detected in bio-oil • CAN = 83 ± 3 mg KOH/g
TBAOH titrant • Hindered phenol accurately measured • Can detect both carboxylics and phenols
in mixture • Better CAN and TAN precision with bio-oil • CAN = 81 ± 1, TAN = 187 ± 2 mg KOH/g

• Pulse angle – Improved sensitivity – Literature values: 45° and 90°
• At different number of scans, std. deviation ranged from ±0.2 wt% to ±1.6 wt% – 90° is better
• Relaxation delay
– Allow sufficient time for nuclei spins to return to equilibrium after excitation – Important for quantification – Literature values: 12 and 25 s
• At different number of scans, std. deviation ranged from ±0.2 wt% to ±0.4 wt%, with the 25s giving higher values
– 25 s is better
• Number of scans – Number of scans affect signal to noise ratio (resolution) S/N α (number of scans)0.5 – Literature values: 128, 256 and 512 scans
• A difference of between 1 to 5 h total analysis time • With same pulse angle, std. deviation ranged from ±0.2 wt% to ±0.4 wt%
– Between 128 and 512 scans
36
31P NMR Parameter Considerations

• Magnet strength – Required slight refitting of shift ranges – Comparing 300 MHz and 500 MHz, std deviation was
from ±0.03 wt% to ±0.1 wt%
• Acquisition time – Increasing acquisition from 0.6 s to 1.2 s allowed for
easier phasing and background subtraction
• MestreNova Analysis – Background subtraction: Polynomial fit (filter 400,
polynomial order 6) or Bernstein polynomial fit (order = 6)
37
31P NMR Parameter Considerations

31P NMR spectrum of bio-oil
carboxylic
phenolic
aliphatic dimer
Excess TMDP
Functional group
Shift, ppm
Percentage by weight based on dry bio-oil (% g O/g dry bio-oil)
1 Aliphatic -OH 152 – 145 16.2 ± 0.4% 2 Phenolic -OH 138 – 145 8.1 ± 0.2%
3 Carboxylic -OH 134.6 – 136 7.6 ± 0.3%

Carbonyl Titration: Method validation - 2-pentanone
• Several 50 mL aliquots titrated – Ave: 3.23 mmol (STD Dev 0.0088) – Error 0.7% (measured vs added)
• Aged the sample for 2 weeks – 3.26 mmol (0.2% error)
• Added ethyl acetate and acetic acid prior to titration – No change
• Oximation reaction done in the presence of ethyl acetate – No change
3.25 mmol in 50 mL
Instrument: Metrohm Titrando 836
39

GC-Based Simulated Distillation
40 40
Retention Time20181614121086420
BP ( C)
-20
101
153
196
238
280
321
363
417
463
490
525
554
583
611
% O
ff C
olum
n
100
90
80
70
60
50
40
30
20
10
0
Detector R
esponse
40
36
32
28
24
20
16
12
8
4
0
• Polar compounds bias results due to differing retention times related to boiling points and response factors – Ethanol (boiling point = 78 °C)
co-elutes with isopentane (boiling point = 28 °C)
• Provides boiling range data with small sample size • Gas chromatography used to calibrate boiling points of hydrocarbons
with retention time • Correlation with physical distillation applied to fit data to standard
method

Simulated Distillation using Thermogravimetric Analysis (TGA)
41 41
• TGA simulated distillation can estimate amount of bio-oil that will distill into specific fuel products
% Mass Loss0 20 40 60 80 100
Tem
pera
ture
, °C
0
100
200
300
400
Gasoline, T10
Gasoline, FBP
Jet Fuel, T10
Jet Fuel, FBP
Diesel, T90
• Boiling range regulated for gas, diesel, and jet fuels
% Distilled0 10 20 30 40 50 60 70 80 90 100
Tem
pera
ture
, °C
0
50
100
150
200
250
300
350GasolineJetDiesel

Fractionation by Size Exclusion
42
• Liquid chromatography technique: no need to increase temperature
• Use size exclusion to fractionate bio-oil – Complete mass balance – Analyze each fraction
• Challenge – Minimize bio-oil entrainment in column
• Able to recover about 98% using a short column with series of solvents
• Scale-up in process

13C NMR Standard Method
43
• Sample prep • 250 µl bio-oil dissolved in DMSO (250 µl) • 5 mg/ml chromium (III) acetylacetonate (Cr(acac)3)
• Instrument: Bruker 400 MHz NMR spectrometer – Inverse gated decoupling pulse sequence (zgig), and
90° pulse angle – T1 was measured using Inversion-Recovery method
and calculated with Bruker’s TopSpin software • Pulse delay should be set to five times T1
– Need to add relaxant for decrease NMR time • 5 mg/ml Cr(acac)3, T1 = 0.46s
– 3s pulse delay, 1k scans, run time = 1.5 hours

44 44
Type of carbons Range (ppm) Structure
Carbonyl 215.0 – 166.5
Aromatic C-O 166.5 – 142.0
Aromatic C-C 142.0 – 125.0
Aromatic C-H 125.0 – 95.8
Levoglucosan
C1 102.3, C2 72.0
C3 73.7, C4 71.7
C5 76.5, C6 64.9
Aliphatic C-O 95.8 – 60.8
Methoxyl 60.8 – 55.2
Aliphatic C-C 55.2 – 0.0
Methyl – Aromatic 21.6 – 19.1
Methyl – Aromatic’ 16.1 – 15.4
13C NMR Standard Method • Chemical shift assignment
ranges

13C NMR Quantitative Standard Method – Results with Standards #1 and #2
45
Functional groups (carbon mol%) Aliphatic carbons Aromatic carbons Double bonds
Based on the concentrations in Standard #1
72.42 27.08 0.51
Based on NMR data
70.74 28.70 0.55
Different types of carbons (carbon mol%) C CH CH2 CH3
Based on the concentrations in Standard #1
10.77 22.88 40.87 25.48
Based on NMR data
10.22 21.58 41.34 26.84
Calculation methods Different types of carbons (carbon mol%)
C CH CH2 CH3
Based on the concentrations in Standard #2
0 0 19.49 80.51
Based on NMR data 0 0 19.05 80.95
This 13C NMR method gives quantitative results

Ester Determination using Colorimetry
46
46
• 13C NMR method does not separate acids and esters
• Esters form a colored complex – Absorbance measured at
540nm – Quantified using standard
ester solutions • Will report [ester] in bio-oils
as mmol/g • Selectivity to ester groups
in bio-oils needs to be established
Reaction scheme
Colored
300 400 500 600 700
0.0
0.1
0.2
0.3
0.4
0.5
0.6
0.7
Abs
orba
nce
Wavelength (nm)
Bio-oil
Ester Standard

Extension of Standard Methods: Five new bio-oils
47 47
• 2.12.4.7-2 – High oxygen content catalytically upgraded bio-oil (Stabilized Pine) This bio-oil was the product of the stabilization process using reduced Ru/C. Pine-wood derived pyrolysis oil was processed at 140 °C under 1200 psig H2. This oil was produced under the Core Pyrolysis and Catalytic Upgrading project at PNNL. • 2.12.4.7-3 – Medium oxygen content catalytically upgraded bio-oil (Med Ox HDO oil (oak)) This bio-oil was derived from the catalytic upgrading of oak pyrolysis oil using noble metal catalysts (Pd/C and Ru/C) at a dual temperature setting of 140°C/350-380°C under 1500 psig H2. This oil was produced under the Home Heating Oil project at PNNL. • 2.12.4.7-4 – Low oxygen content catalytically upgraded bio-oil (Low Ox HDO oil (pine)) This bio-oil was the product of the dual temperature processing of pine-derived bio-oil with sulfided catalysts (RuS/C followed by commercially-supplied sulfided catalyst) at 170-200°C/350-400°C under 2000 psig H2. This oil was produced under the Core Pyrolysis and Catalytic Upgrading project at PNNL. • 2.12.4.7-5 – Hydrothermal liquefaction (HTL) biocrude derived from wood (HTL wood) Pine was hydrothermally liquefied under 3000 psig of inert atmosphere (N2) at 350°C. The oil analyzed was a composite product and was further treated to remove impurities such as inorganic elements. This oil was produced under the Hydrothermal Liquefaction project at PNNL. • 2.12.4.7-6 – Hydrothermal liquefaction (HTL) biocrude derived from algae (HTL algae) Tetraselmis spp. alga was hydrothermally liquefied under 3000 psig of inert atmosphere (N2) at 350°C. Further treatment to remove impurities such as inorganic elements was done to the oil. This oil was produced under the National Alliance for Advanced Biofuels and Bioproducts (NAABB) consortium project.

Five new bio-oils: Elemental analysis, water content, TAN
48 48
Elemental analysis, water and acid content of five new bio-oils
ASTM Method FP oil (oak) Stabilized
(pine)
Med Ox HDO oil
(oak)
Low Ox HDO oil (pine)
HTL wood HTL algae
Sample# 2.12.4.7-1 2.12.4.7-2 2.12.4.7-3 2.12.4.7-4 2.12.4.7-5 2.12.4.7-6
Carbon wt % D 5291
57.7 43.45 79.72 85.34 78.02 78.57 Hydrogen wt % 5.76 8.02 11.57 13.3 7.66 9.99 Nitrogen wt % 0.24 0.04 0.05 0.05 0.15 4.78 Oxygen wt % D 5373 36.28 34.49 8.62 1.27 14.13 5.27 Sulfur wt % D 1552 0.02 0.04 0.04 0.04 0.02 1.4
O-as is (by dif) wt % 48.64 49.55 9.72 1.31 18.93 10.81
Water content by KF
wt % D 6869 29.01 27.72 1.37 0.00 6.43 6.63
TAN
mmol-
KOH/g
D 3339 136.46 124.34 55.78 0.00 42.1 54.14

Five new bio-oils: Carbonyl titration, 13C NMR, 31P NMR
49 49
Results of carbonyl and hydroxyl group determination
FP oil (oak)
Stabilized (pine)
Med Ox HDO oil
(oak)
Low Ox HDO oil (pine)
HTL wood HTL algae
Sample# 2.12.4.7-1 2.12.4.7-2 2.12.4.7-3 2.12.4.7-4 2.12.4.7-5 2.12.4.7-6 Carbonyl titration
mmol/g 3.3 2.53 1.05 0.00 1.06 1.68
from 13C NMR
mmol/g 1.34 1.97 0.08 0.00 2.07 0.58
31P - Acids mmol/g 1.82 1.69 0.97 0.00 0.41 0.67 31P - Phenols
mmol/g 3.90 1.72 0.92 0.00 4.44 0.29
31P - Alcohols
mmol/g 7.79 4.05 0.51 0.00 0.12 0.01

Qualitative GC-MS – Upgraded Pyrolysis Oils
50 50
0
5
10
15
20
25
30
35
40
45
% T
ota
l Are
a
High Oxygen
Medium Oxygen
Low Oxygen
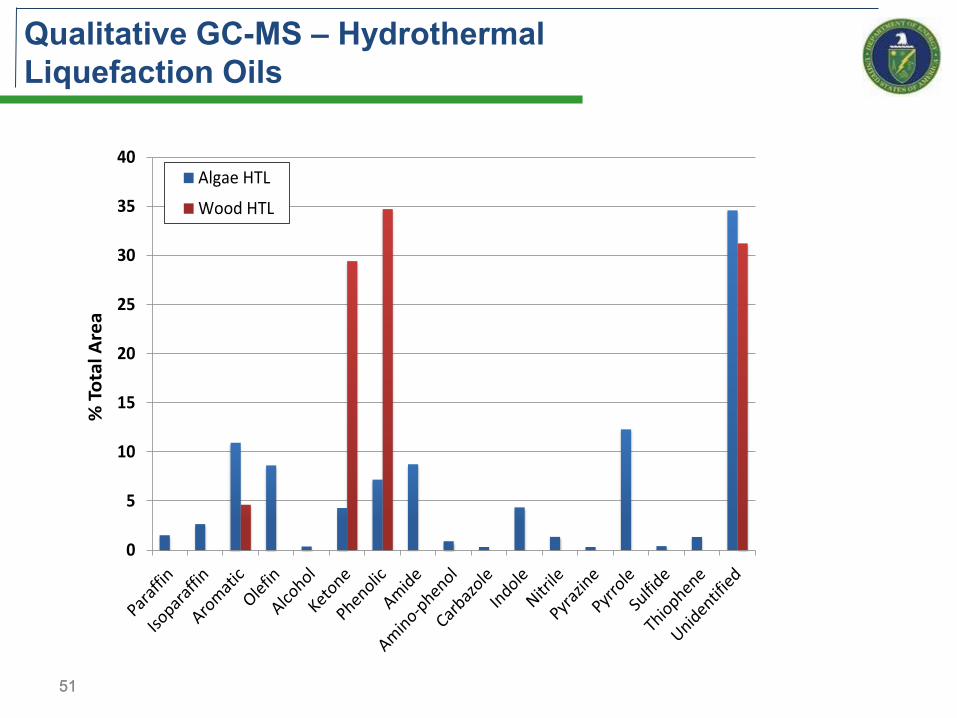
Qualitative GC-MS – Hydrothermal Liquefaction Oils
51 51
0
5
10
15
20
25
30
35
40
% T
ota
l Are
a
Algae HTL
Wood HTL

Five new bio-oils – Quantitative GC-MS
52 52
High Oxygen
Medium
Oxygen
Low Oxyge
n
Algae HTL
Wood HTL
Glycolaldehyde 14191 <3000 <3000 <3000 <3000 Acetic acid 38505 <5000 <5000 <5000 <5000 Acetol 20013 <500 <500 <500 <500 3-Hydroxy-2-butanone 1473 <350 <350 <350 <350 Propanoic acid 1266 <500 <500 <500 <500 Butanoic acid <400 5412 <400 <400 <400 2-Cyclopenten-1-one <650 <650 <650 <650 <650 Furfural 1273 <650 <650 <650 <650 5-Methylfurfural <650 <650 <650 <650 <650 2(5H)-Furanone 1381 <600 <600 <600 <600 3-Methyl-1,2-cyclopentanedione
996 <700 <700 <700 <700
3-Methyl-2(5H)-furanone <500 <500 <500 <500 <500 Phenol <650 <650 <650 1081 971 Guaiacol 841 <600 <600 <600 2174 o-Cresol <850 <850 <850 <850 <850 Maltol <650 <650 <650 <650 <650 p-Cresol <950 <950 <950 971 <950 m-Cresol <400 422 <400 <400 <400 Creosol 697 <400 <400 <400 1192 2,4-Xylenol <500 1153 <500 <500 <500 4-Ethylguaiacol <500 <500 <500 <500 2301 Eugenol <500 <500 <500 <500 <500 5-Hydroxymethylfurfural 458 <400 <400 <400 <400 Catechol <700 <700 <700 <700 <700 Syringol 1670 <400 <400 <400 <400 Vanillin 357 <300 <300 <300 <300 Hydroquinone <500 <500 <500 <500 <500 Apocynin <350 <350 <350 <350 <350 Levoglucosan 15926 <5000 <5000 <5000 <5000 Syringylaldehyde 625 <400 <400 <400 <400 Acetosyringone <500 <500 <500 <500 <500
• All concentrations listed in µg/mL
• Limits in quantitation determined from the lowest calibration point o New calibration standards
needed for all oils beyond the high oxygen stabilized pine
• New methods would need to be developed for best analytics o Low oxygen HDO oil o Algae HTL oil o Wood HTL oil

Five new bio-oils – Carboxylic acid titration (CAN/TAN)
53 53
High Oxygen
Medium Oxygen
Low Oxygen
Algae HTL
Wood HTL
CAN, mg KOH/g
103.02 46.87 ND 47.70 27.61
TAN mg KOH/g 151.40 65.62 ND 65.98 156.89
• Method applied well to new bio-oils • Low O HDO oil did not contain sufficient acidic components to be
detected by titration • All other oils showed the presence of acidic components that
can be associated with both carboxylic acids and phenolic compounds

HPLC: Carboxylic Acids
54 54
• Method to be developed for extraction, speciation and quantification of carboxylic acids in bio-oils
• High-performance liquid chromatography (HPLC) used to identify and quantify carboxylic acids ranging from formic (C1) to heptanoic (C7)
• Acids speciated with HPLC column formulated for rapid analysis of organic acids and detected with UV/Vis detector • Phenomenex fast acids column, sulfonated styrene divinyl
benzene. • Extraction methods using either liquid-liquid partitioning or solid
phase extraction (SPE) will be optimized for isolating carboxylic acids from bio-oil • Potential for SPE using ion exchange resins to preferentially
isolate organic acids • Detailed composition of acidic compounds measured

HPLC: Carbonyls (Aldehydes and Ketones)
55 55
• Carbonyls measured using HPLC after derivatization with 2,4-dinitrophenylhydrazine (DNPH)
• Methodology commonly employed for analysis of carbonyls in air, automotive exhaust, and water • Standard methods published by EPA, OSHA, ASTM
• Methodology to be adapted and optimized for analysis of bio-oils • Compounds speciated with HPLC column formulated for separation
of derivatized carbonyls and detected with UV/Vis • Restek Allure AK, proprietary stationary phase
• Detailed characterization of carbonyls measured