
DOCUMENTO_PCS7
639
-
Upload
chezhiyan143 -
Category
Documents
-
view
105 -
download
3
Transcript of DOCUMENTO_PCS7


Agenda Page 2
Preface (Use of the Manual) Page 3
Disclaimer of Liability and Statement of Copy right Page 4
System Overview Chapter 1
SIMATIC Manager and Objects Chapter 2
PCS 7 Stations and Communication
Chapter 3
Creating PCS 7 Project - Getting Started Chapter 4
Automation Station Chapter 5
Continuous Control – CFC Chapter 6
Creating Function Blocks - SCL Chapter 7
Sequential Control – SFC Chapter 8
Process Tag Type, Model, andMaster Data Library Chapter 9
OS and Graphics Design Chapter 10
Archiving System Chapter 11
Reporting, Printing, andOS User Administration Chapter 12
OS Server, Client, Redundancy,and Project Download Chapter 13
Multi-user Project Engineering Chapter 14
Workshop PCS 7 on Tour
Siemens A&D AS CS2 PA August 2003 Edition

Page 2
Agenda of the Workshop
Days Topics Exercises
Day 1
Introduction to the workshop System overview SIMATIC Manger and objects PC stations and communication Creating PCS 7 projects – Getting started
- Creating and handling multiprojectst - Establising communication between SIMATIC stations - Creating your first project
Day 2
Automation station Continuous control - CFC Sequential control – SFC Creating function blocks – SCL
- Configuring I/Os - Module Driver blocks - CiR - Using SCL - Chart-in-Block
Day 3
Process tag type, model, and master data library OS and Graphics design
- A Valve tag type - Including Status display - Including Group display - Making a valve UDO
Day 4
OS and Graphics design Archiving System
- Making a block icon - Making a Faceplate - Trend and Table control - Messages
Day 5
Reporting, Printing User Administration OS server, client, redundancy, and project download
- Creating reports - Managing users - Configuring OS servers and clients
Con formato: Numeración yviñetas

Page 3
Preface Siemens SIMATIC PCS 7 system is an example of a modern DCS (Distributed Control System), which employs current LAN (Local Area Network) technology, Siemens time-proven PLCs (Programming Logic Controller), and field-bus technology. The entire system comprises a large number of Siemens hardware components from instruments, actuators, analog and digital signal modules, to controllers, communication processors, engineering stations, and operator stations, etc. All the hardware components are supported and configured by means of the PCS 7 software tools. The software system is sophisticated to meet the requirements in designing, engineering and commissioning various automation tasks in industrial sectors such as chemicals, petrochemicals, pharmaceuticals, water treatment, and power generation, etc. Basic knowledge of the system is required to structure and plan a PCS 7 project. This manual thus intends to provide fundamental basics on the system functions and the approach to engineering and configuring automation tasks. The manual covers major components (hardware and software) of the system and intends to deliver a systematic approach right from the start when you begin to know or use the system. The manual uses a unique and concise visual format to explain the system functions, tools, and their applications. The aim of the format is to help the user to gain the necessary software skills effectively so that they can move quickly onto solving their control tasks. A designed lab project and a number of exercises are provided with solutions and guidelines. Most of them are taken from real PCS 7 projects. From these examples, users can not only master the skills in the system administration and in the software programming but can also learn the know-how that Siemens as a leading control systems vendor has gained through years of their experience. The documentation and exercises are valid for the “PCS7 Engineering Toolset V6.0”, and appropriate hardware and software components are assumed if you want to work on the exercises.
Siemens A&D AS CS2 PA
Karlsruhe, August 2003

Page 4
Disclaimer of Liability This document is created solely for training purposes. Siemens can not accept liability for any inaccuracies in the content. Suggestion for improvement are welcomed.
© Siemens AG 2003 Subject to change without prior notice
Copyright © Siemens AG 2003 All rights reserved The reproduction, transmission or use of this document or its contents is not permitted without express written authority. Offenders will be liable for damages. All rights, including rights created by patent grant or registration of a utility model or design, are reserved.
Siemens AG A&D AS CS2 PA Siemensallee 84 D-76181 Karlsruhe Germany

Chapter 1:
System Overview


Contents: CHAPTER 1 SYSTEM OVERVIEW...................................................................................................1
1. PCS 7 SYSTEM ARCHITECTURE...............................................................................................1
1.1 A TYPICAL SYSTEM CONFIGURATION ..............................................................................................1 1.2 ES: ENGINEERING STATION ............................................................................................................1 1.3 AS: AUTOMATION STATION ...........................................................................................................3 1.4 FIELD DEVICES................................................................................................................................4
1.4.1 Profibus DP and Profibus PA.................................................................................................5 1.4.2 PCS 7 Engineering tools for field devices (PDM) ..................................................................5
1.5 OS: OPERATOR STATION ................................................................................................................7 1.6 THE SYSTEM BUS ............................................................................................................................9 1.6 FROM ENGINEERING TO RUNTIME..................................................................................................11
2. PCS 7 SOFTWARE SYSTEM....................................................................................................12
2.1 BASIC DATA ..................................................................................................................................12 2.2 SOFTWARE LICENSING ..................................................................................................................12
3. TOTALLY INTEGRATED AUTOMATION...........................................................................13
APPENDICES ......................................................................................................................................17
APPENDIX 1: INSTALLATION OF PCS 7 V6 .........................................................................................17 1.1 Install Windows 2000 Professional or Server?........................................................................17 1.2 PCS 7 and Domains.................................................................................................................17 1.3 PC station specification (recommended) .................................................................................18 1.4 Installation of a Workstation for PCS 7...................................................................................18 1.5 Prior to PCS 7 installation ......................................................................................................19 1.6 PCS 7 installation CDs ............................................................................................................19 1.7 PCS 7 installation procedure...................................................................................................20
APPENDIX 2: ESSENTIAL DOCUMENTS OF PCS 7.................................................................................21 APPENDIX 3: PCS 7 SUPPORT .............................................................................................................21 APPENDIX 4: SOFTWARE AND HARDWARE FOR THE POT EXERCISES ..................................................22


PCS 7 PoT Chapter 1 System Overview
Chapter 1 System Overview Siemens SIMATIC PCS 7 systems provide a wide range of hardware, software, engineering, configuring, and diagnostic tools for industrial automation and control. This chapter provides an overview on the system architecture and functions. Abbreviations used in the system are explained. 1. PCS 7 system architecture 1.1 A typical system configuration A principal PCS7 system is illustrated in Picture 1.1 where ES stands for Engineering Station, OS for Operator Station, and AS for Automation Station.
OS server
RedundantOS server
System bus
AS AS
ES
Terminal bus
OS client OS client OS client
Picture 1.1: PCS7 system architecture 1.2 ES: Engineering Station PCS 7 projects are designed at the engineering workstations that are installed with PCS 7 engineering tools and have communication access to automation stations and operator stations. PCS 7 PoT V6.0 | Edition V1.0 | August 2003 Copyright 2003 Siemens AG by A&D AS CS2 PA. All rights reserved.
Page 1 - 1

PCS 7 PoT Chapter 1 System Overview
PCS 7 ES provides powerful engineering tools, for examples: • SIMATIC Manager: project creation, library creation, project management and
diagnostics, etc. • PH: Plant Hierarchy. Used for design of hierarchical levels of plants. • HW Config: Hardware Configuration Environment. Used for configuration of
CPUs, communication processors, peripherals, and field buses, etc. • CFC: Continuous Function Chart. Used for design of libraries, automation logic,
interlocks, algorithms, and controls, etc. • SFC: Sequential Function Chart. Used for design of sequential controls, logic,
and interlocks, etc. • SCL: Structured Control Language. Used for programming of algorithms and
creation of function blocks, etc. • IEA: Import Export Assistant. Used for generation of control models, process tag
types, and replicas. • WinCC: Windows Control Centre. PCS 7 operator interfaces and visualisation. • Graphics Designer editor: Design of pictures, graphic objects, and animations. • Commissioning Wizard: The Commissioning Wizard automatically detects
newly installed SIMATIC modules when a PC is restarted (Plug&Play) and guides the user step-by-step through the installation and configuration of the PC station.
• Configuration Console: With the Configuration Console, you can change the settings after the Commissioning Wizard has been run. The access points are always configured using it.
• Station Configurator: It displays the actual PC configuration found and set up for PCS 7 systems.
• Multiproject: In the SIMATIC Manager, you can create projects (single projects) or multiprojects. A multiproject could contain several projects and a master data library.
• Master data library: A master data library is associated with a multiproject. Different from other system or application specific libraries, a master data library is within a multiproject and collects all function types used in the multiproject.
• Process Object View: During engineering, you create many objects. The Process object view contains all the engineering aspects of a project. You display these objects and edit them in the view.
• SIMATIC NET: The Commissioning wizard, Configuration Console, and Station Configurator are interfaces of the SIMATIC NET. SIMATIC NET is a platform to configure network and bus systems used in a SIMATIC project.
Engineering of PCS 7 projects on ES can be divided into two phases namely AS engineering and OS engineering. AS engineering covers the design of the plant hierarchy, function blocks, CFCs, SFCs, and configuration of hardware and communication components. The project data are automatically available for OS engineering using the function, Compiling OS. OS engineering is to design operating functions and graphics.
PCS 7 PoT V6.0 | Edition V1.0 | August 2003 Copyright 2003 Siemens AG by A&D AS CS2 PA. All rights reserved.
Page 1 - 2

PCS 7 PoT Chapter 1 System Overview
1.3 AS: Automation Station An automation station may comprise of a Power Supply (PS), Central Processing Unit (CPU), Communication Processor (CP), and input and output modules. The CPU processes operating system and programs. PCS 7 CPUs are selected from the Siemens SIMATIC S7 400 CPU series. They communicate with ES and/or OS server via the System/Plant bus. The AS also have a communication port to communicate with the field devices via Profibus DP. A typical example of automation systems with a link to Distributed I/Os is shown in Picture 1.2.
Picture 1.2: An automation station
Every CPU has an operating system, which is supported by the System Functions (denoted as SFC or SFB). Note The abbreviation SFC is for the Sequential Function Chart (editor or charts). The System Function Call will not use the abbreviation. However, you will see objects such as SFC4, SFC265, SFB35, etc. in the PCS 7 system and they mean the system Functions. Between the operating system and the user programs there are the so-called Organisation Blocks (OBs). “Block” is an important concept in PCS 7. A summary of the blocks used in the system is listed in Table 1.1.
PCS 7 PoT V6.0 | Edition V1.0 | August 2003 Copyright 2003 Siemens AG by A&D AS CS2 PA. All rights reserved.
Page 1 - 3

PCS 7 PoT Chapter 1 System Overview
Block
Brief Description of Function
Organisation blocks (OB) OBs determine the structure of the user program.
System function block (SFB) and system function Call (SFC)
SFBs and SFCs are integrated in the S7 CPU and allow you to access some system functions.
Function block (FB) FBs are blocks with a "memory" to store static variables. You can design your own FBs.
Function Call (FC) FCs contain program routines for frequently used functions. FCs have no memoery.
Instance data block (instance DB)
Instance DBs are associated with blocks when an FB/SFB is called. They are created automatically during compilation.
Data block (DB)
DBs are data areas for storing user data. In addition to the data that are assigned to a function block, shared data can also be defined and used globaly by any blocks.
Table 1.1: Blocks of PCS 7
1.4 Field devices A big advantage of PCS 7 systems is the seamless integration of various field devices and instruments into their central control systems using field bus technology. Siemens itself and various device-vendors provide ranges of drives, transmitters, sensors, and instruments, which are compliant to the Profibus protocols. Profibus supports Intrinsically safe instrumentation and has interfaces to the HART and AS modules. Picture 1.3 shows an overview of the devices level of the PCS 7 systems.
Picture 1.3: PCS 7 device level
PCS 7 PoT V6.0 | Edition V1.0 | August 2003 Copyright 2003 Siemens AG by A&D AS CS2 PA. All rights reserved.
Page 1 - 4

PCS 7 PoT Chapter 1 System Overview
1.4.1 Profibus DP and Profibus PA Profibus DP is designed to replace the traditional parallel signal transmission with 24 volts in manufacturing automation and also for analog signal transmission with 4 – 20 mA or Hart in processing automation. The Profibus PA profile defines the parameters and behaviour of typical field devices such as measuring transducers or positioners. The PA profile is suitable for analog transmission with 4 – 20 mA and Hart. Benefits are obvious when comparing the Profibus technology to conventional cabling technology. Separation, terminal, and distribution devices are replaced by one Profibus system. It is efficient to install the bus systems because of availability of the graphic interfaces and comprehensive diagnostic tools. With fibre optic wiring, long distance communication, e.g. between buildings, becomes feasible. The simplicity of Profibus significantly reduces commissioning and servicing efforts. Picture 1.4 shows the simplicity of using Profibus technology.
Picture 1.4: Simplicity with Profibus DP and PA 1.4.2 PCS 7 Engineering tools for field devices (PDM) PDM (Process Device Manager) can be integrated into the PCS 7 engineering systems or used as a stand-alone console. SIMATIC PDM is a tool for commissioning, maintenance, diagnostics and display of field devices and automation components. Picture 1.5 shows the software environment, where you can calibrate a device, set devices addresses on the bus, and communicate online with a device.
PCS 7 PoT V6.0 | Edition V1.0 | August 2003 Copyright 2003 Siemens AG by A&D AS CS2 PA. All rights reserved.
Page 1 - 5

PCS 7 PoT Chapter 1 System Overview
Picture 1.5: Parameterising and communicating with devices using PDM
PCS 7 PoT V6.0 | Edition V1.0 | August 2003 Copyright 2003 Siemens AG by A&D AS CS2 PA. All rights reserved.
Page 1 - 6

PCS 7 PoT Chapter 1 System Overview
PCS 7 systems also provide library functions to integrate devices into automation design. Picture 1.6 shows that the reading of a pressure transmitter is read into the CFC via the function block PA_AI and the value is displayed at OS.
Picture 1.6: Field devices integrated with the PCS 7 engineering tools 1.5 OS: Operator Station OS can mean OS server, OS client, OS project. “Server” normally means a physical machine. An OS project can be the Single-user project, Multi-user project, or Client project. “Single-user or Multi-user system” means the type of an OS project. (1) OS engineering OS engineering is conducted at an ES. It covers the following functions: • Design of graphic objects (buttons, slides, trends, faceplates etc.). • SFV: Sequential Function chart Visualisation. Used for visualising SFCs in the
OS runtime system. • Design of data archives (variables and messages) and long-term data storage. • Design of reports. Printing-out of system and process data.
PCS 7 PoT V6.0 | Edition V1.0 | August 2003 Copyright 2003 Siemens AG by A&D AS CS2 PA. All rights reserved.
Page 1 - 7
PCS 7 PoT Chapter 1 System Overview
• User administration. Allocation and control of authorisation accesses of users for
different operational roles. • Redundancy. Configuration of a second OS server that is coupled with the
primary server. If one of the two server computers fails, the second server assumes control of the entire system. After the server which failed is brought back into service, the contents of all message and process archives are copied and synchronised.
• Time Synchronisation. One OS acts in run-time as a time master and controls the time synchronisation of all other OS and AS connected to the system bus and terminal bus with the current time.
• Lifebeat Monitoring. Lifebeat Monitoring is used to constantly monitor the individual systems (OS and AS) and visualises the results as screen displays in the runtime system.
• Connection to other applications. PCS 7 OS provides open interfaces for user solutions. This makes it possible to integrate PCS 7 OS into complex, company-wide automation solutions.
(2) Single-user project A single-user project is for a stand-alone operating station. It is for small systems where server and client functions are carried out on one PC. (3) Multi-user project A multi-user project is used in the Server/Client environment where project database is located on the servers and clients can access the database. (4) OS server OS servers communicate with ASs and OS clients. One sever can be accessed by up to 32 clients. One server can access approximately 256K variables (≈ 85,000 process objects), which are supplied and generated by ASs. Operators on OS clients can also generate commands and input them to ASs. Project data such as pictures and data archives are stored on the server and are made available to clients. If a project needs several OS servers, servers are arranged according to plant hierarchies. One or more hierarchies are assigned to a server. This is fundamentally different from SCADA systems where servers are arranged according to archives, for example, message (alarms) server, process - trend (process variables) server, and picture (graphic objects) server. Picture 1.7 shows the distribution of PCS 7 OS servers according to the plant areas.
PCS 7 PoT V6.0 | Edition V1.0 | August 2003 Copyright 2003 Siemens AG by A&D AS CS2 PA. All rights reserved.
Page 1 - 8

PCS 7 PoT Chapter 1 System Overview
OS server 1 OS server 2 OS server 3
Reaction unitRaw material unit Cleaning unit
PlantHierarchyBranch 1
PlantHierarchyBranch 2
PlantHierarchyBranch 3
Picture 1.7: PCS 7 OS servers (5) Redundant server Here, the redundancy is at the OS level. PCS 7 provides redundancy at other levels, for example, at the AS level, system bus level, and peripheral level, etc. A redundant server is functionally identical to the server and is running in parallel to the server. During normal operation, the process data servers are running completely in parallel. Each server has its own process connections and data archives. The ASs send the process data and messages to both redundant servers. If one server fails, the clients will automatically switch from the failed server to the active server. After the failed server comes back online, the Redundancy will perform archive synchronisation for the down time. The archive gap caused by the failure will be filled by transferring the missing data to the server which was failed. This action equalises the servers. (6) OS client OS clients have a network connection to an OS server based on Windows client/server techniques. Clients have no direct access to the system bus and ASs. They access project data via OS servers. 1.6 The System bus The PCS 7 System bus is of the Industrial Ethernet, which is based on IEEE Standard 802.3 with a data transmission rate of 10 or 100 Mbps. Up to 1024 stations can be connected to the Industrial Ethernet. Transmission media could be:
• Triaxial cable (shielded coaxial cable) • ITP (Industrial Twisted Pair) • Fiber-optic cable (FOC)
PCS 7 PoT V6.0 | Edition V1.0 | August 2003 Copyright 2003 Siemens AG by A&D AS CS2 PA. All rights reserved.
Page 1 - 9

PCS 7 PoT Chapter 1 System Overview
The network could use the Optical Link Modules (OLMs). An example of OLM has three industrial twisted pair (ITP) ports and two optical ports as shown in Picture 1.8. Using ITP, you can connect up to three terminals or other ITP segments. Using optical cable you can build the redundant ring network. In a ring, maximum 11 OLMs can be connected. Picture 1.8 shows that an ES/OS and AS is connected to an OLM port via a TP (Twisted Pair) cord. The bus backbone is a fiber optic cable ring.
Picture 1.8: Industrial Ethernet and OLM For medium-sized to very large systems with the highest performance requirements, Fast Industrial Ethernet (referred to only as Fast Ethernet hereafter) is used as the system bus. Fast Ethernet is a further development of the Standard Ethernet and its essential features are similar to the familiar Ethernet Standard. The data format, the CSMA/CD (Carrier Sense Multiple Access/Collision Detection) access procedure, and the glass fiber-optic cable and twisted pair cables (no triaxial cable) used are identical. The configuration of Fast Ethernet-network structures is based mainly on optical data transmission. The Industrial Ethernet OSMs (Optical Switch Modules) enable you to configure Industrial Ethernet networks in switching technology with industrial twisted pair (transmission speed of 10/100 Mbps) and a Fast Ethernet backbone with glass fiber-optic cables (transmission speed of 100 Mbps). An example of the Industrial Ethernet OSM has six industrial twisted pair interfaces (ITP ports) and two optical interfaces. Because of this, you can connect up to six ITP terminals or additional ITP networks to the ITP ports. You can configure the Industrial Ethernet bus as a redundant network. The redundancy concepts used are as follows: PCS 7 PoT V6.0 | Edition V1.0 | August 2003 Copyright 2003 Siemens AG by A&D AS CS2 PA. All rights reserved.
Page 1 - 10
PCS 7 PoT Chapter 1 System Overview
• Redundant optical ring • Media redundancy with REDCONNECT
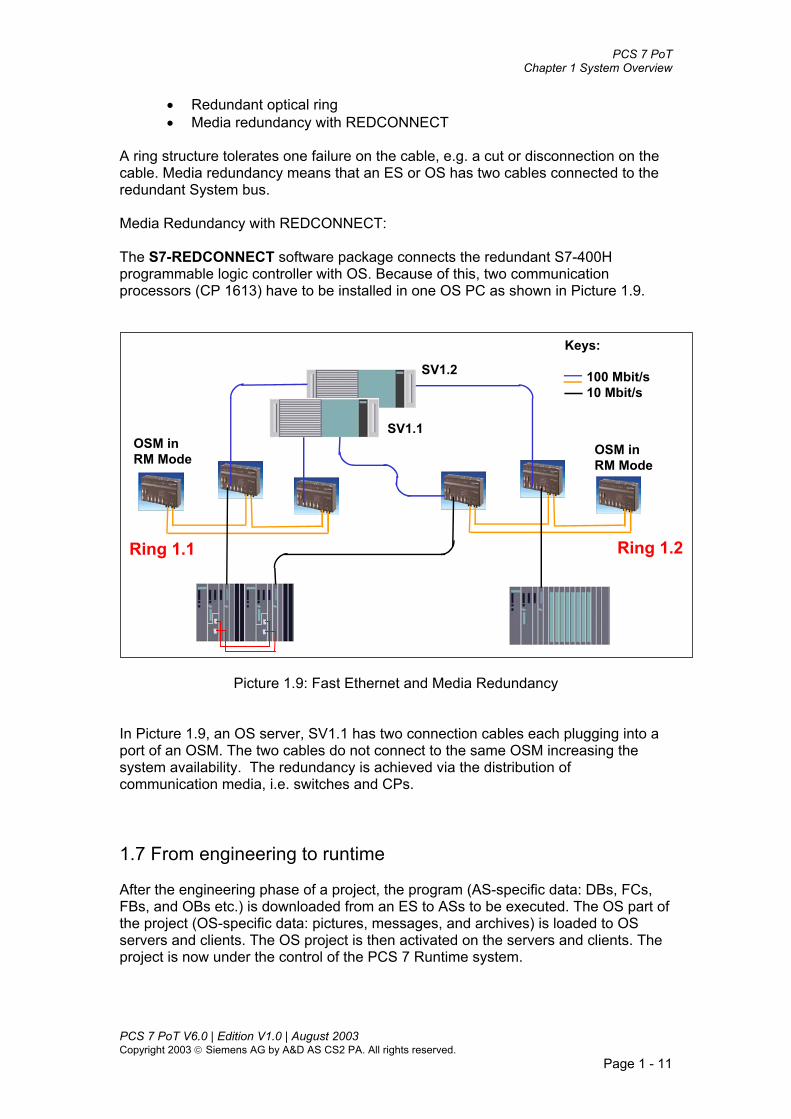
A ring structure tolerates one failure on the cable, e.g. a cut or disconnection on the cable. Media redundancy means that an ES or OS has two cables connected to the redundant System bus. Media Redundancy with REDCONNECT: The S7-REDCONNECT software package connects the redundant S7-400H programmable logic controller with OS. Because of this, two communication processors (CP 1613) have to be installed in one OS PC as shown in Picture 1.9.
SV1.1
SV1.2
OSM inRM Mode
OSM inRM Mode
Keys:
100 Mbit/s 10 Mbit/s
Ring 1.1 Ring 1.2
Picture 1.9: Fast Ethernet and Media Redundancy
In Picture 1.9, an OS server, SV1.1 has two connection cables each plugging into a port of an OSM. The two cables do not connect to the same OSM increasing the system availability. The redundancy is achieved via the distribution of communication media, i.e. switches and CPs. 1.7 From engineering to runtime After the engineering phase of a project, the program (AS-specific data: DBs, FCs, FBs, and OBs etc.) is downloaded from an ES to ASs to be executed. The OS part of the project (OS-specific data: pictures, messages, and archives) is loaded to OS servers and clients. The OS project is then activated on the servers and clients. The project is now under the control of the PCS 7 Runtime system.
PCS 7 PoT V6.0 | Edition V1.0 | August 2003 Copyright 2003 Siemens AG by A&D AS CS2 PA. All rights reserved.
Page 1 - 11

PCS 7 PoT Chapter 1 System Overview
2. PCS 7 software system 2.1 Basic data PCS 7 system capability is related to handling of process objects, variables, and data archives. One process object (PO) means one function block (FB) and its faceplate. The following formulas are assumed in the PCS 7 system providing an approximation of project data volume.
1 Process Object (e.g. motor, valve, and control loop) ≈ 1 function blocks + faceplate ≈ 50 OS variables
No. of notes on the System bus 1024 No. of clients accessing one OS server 32 No. of OS servers 12 No. of PO in an AS app. 500 depending on the scan cycle No. of PO in a project 60,000 Archiving on OS server 800 values/s, 10 messages/s Archiving on a central archive server 5,000/s values
Table 1.2: PCS 7 system capability data
2.2 Software licensing Engineering (AS + OS) systems is scaled according to the number of process objects while OS runtime is based on the number of variables. The tier of the software packages is listed in Table 1.3 where each of the licenses includes an archiving license for 512 variables.
ES license OS runtime license 250 PO 8K Var.
2,000 PO 64K Var. 3,000 PO 100K Var. 5,000 PO 150K Var. 8,500 PO 256K Var.
Table 1.3: PCS 7 engineering and OS runtime licenses
PCS 7 PoT V6.0 | Edition V1.0 | August 2003 Copyright 2003 Siemens AG by A&D AS CS2 PA. All rights reserved.
Page 1 - 12
PCS 7 PoT Chapter 1 System Overview
The basic archiving license of 512 variables can be expanded. See Table 1.4.
Archiving license 512 – 1,500 Var.
1,500 – 5,000 Var. 5,000 – 30,000 Var.
30,000 – 80,000 Var.
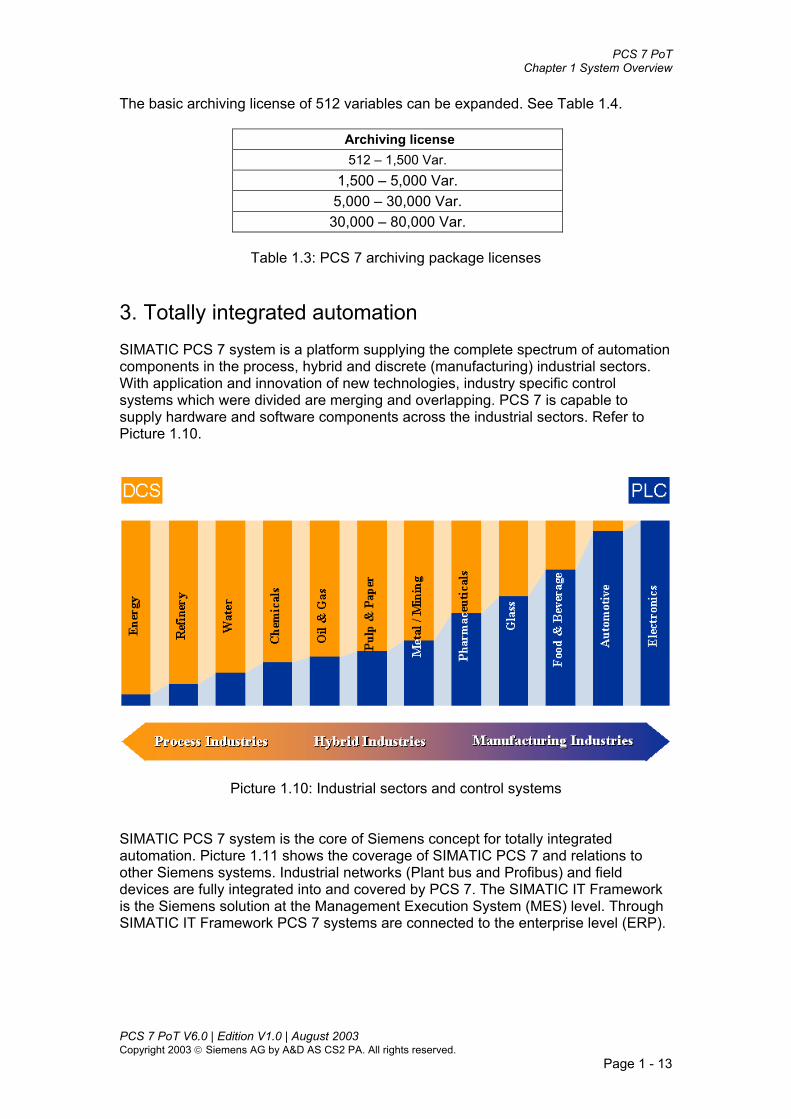
Table 1.3: PCS 7 archiving package licenses 3. Totally integrated automation SIMATIC PCS 7 system is a platform supplying the complete spectrum of automation components in the process, hybrid and discrete (manufacturing) industrial sectors. With application and innovation of new technologies, industry specific control systems which were divided are merging and overlapping. PCS 7 is capable to supply hardware and software components across the industrial sectors. Refer to Picture 1.10.
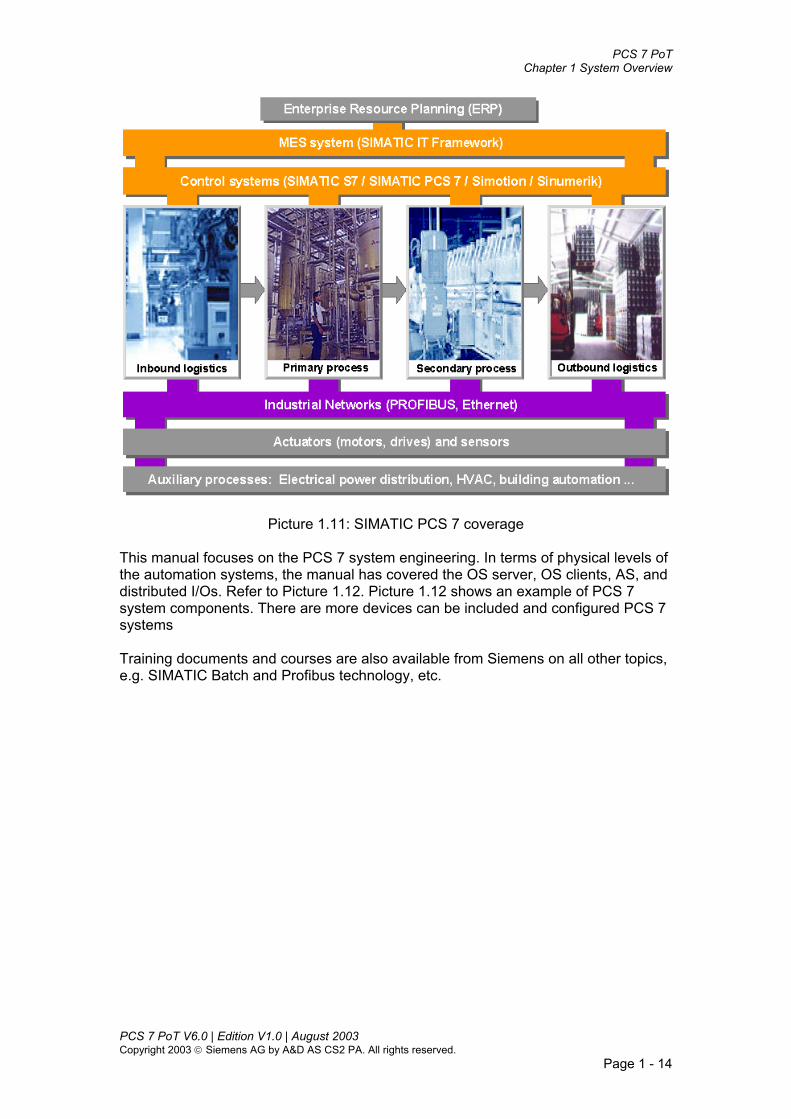
Picture 1.10: Industrial sectors and control systems SIMATIC PCS 7 system is the core of Siemens concept for totally integrated automation. Picture 1.11 shows the coverage of SIMATIC PCS 7 and relations to other Siemens systems. Industrial networks (Plant bus and Profibus) and field devices are fully integrated into and covered by PCS 7. The SIMATIC IT Framework is the Siemens solution at the Management Execution System (MES) level. Through SIMATIC IT Framework PCS 7 systems are connected to the enterprise level (ERP).
PCS 7 PoT V6.0 | Edition V1.0 | August 2003 Copyright 2003 Siemens AG by A&D AS CS2 PA. All rights reserved.
Page 1 - 13
PCS 7 PoT Chapter 1 System Overview
Picture 1.11: SIMATIC PCS 7 coverage This manual focuses on the PCS 7 system engineering. In terms of physical levels of the automation systems, the manual has covered the OS server, OS clients, AS, and distributed I/Os. Refer to Picture 1.12. Picture 1.12 shows an example of PCS 7 system components. There are more devices can be included and configured PCS 7 systems Training documents and courses are also available from Siemens on all other topics, e.g. SIMATIC Batch and Profibus technology, etc.
PCS 7 PoT V6.0 | Edition V1.0 | August 2003 Copyright 2003 Siemens AG by A&D AS CS2 PA. All rights reserved.
Page 1 - 14

PCS 7 PoT Chapter 1 System Overview
Picture 1.12: PCS 7 system architecture
PCS 7 PoT V6.0 | Edition V1.0 | August 2003 Copyright 2003 Siemens AG by A&D AS CS2 PA. All rights reserved.
Page 1 - 15

PCS 7 PoT Chapter 1 System Overview
PCS 7 PoT V6.0 | Edition V1.0 | August 2003 Copyright 2003 Siemens AG by A&D AS CS2 PA. All rights reserved.
Page 1 - 16

PCS 7 PoT Chapter 1 System Overview
Appendices Appendix 1: Installation of PCS 7 V6 Note Refer to the PCS 7 V6 Readme file for latest information on PCS 7 V6 installation. 1.1 Install Windows 2000 Professional or Server?
ES Windows 2000 Professional Windows 2000 Server (for multi-user project engineering)
OS single user Windows 2000 Professional
OS server, Batch server Windows 2000 Server
Batch server as cluster Windows 2000 Advanced Server
OS terminal Windows 2000 Professional
Table 1.5: Windows 2000 installation
1.2 PCS 7 and Domains A PCS 7 server (OS, ES, and Batch) must not be used as a domain controller. It must also not be used for other domain administration purposes (DHCP and DNS, etc.).
PCS 7 PoT V6.0 | Edition V1.0 | August 2003 Copyright 2003 Siemens AG by A&D AS CS2 PA. All rights reserved.
Page 1 - 17

PCS 7 PoT Chapter 1 System Overview
1.3 PC station specification (recommended)
Station Requirement ES Station CPU Pentium IIII; 2GHZ Physical memory 768 Mbyte RAM Capacity of the hard drive 30 Gbyte OS Client CPU Pentium IIII; 2GHZ Physical memory 512 Mbyte RAM Capacity of the hard drive 30 Gbyte OS Server CPU Pentium IIII; 2GHZ Physical memory 1Gbyte RAM Capacity of the hard drive 30 Gbyte
Table 1.6: PC station specification (recommended)
1.4 Installation of a Workstation for PCS 7 1. Partition and format the hard disk.
It is recommended to create a separate partition to hold disk images. Programs: e.g. Powerquest Volume Manager
2. Start Windows 2000 Setup by booting from the Windows 2000 CD. Follow the instructions given by the Setup program. Enter the relevant information as and when requested.
3. As to specifying whether the computer is in a network, initially choose the default setting. This will make setting up the network subsequently in the Windows 2000 environment much easier.
4. Following successful installation the device drivers must be installed. They are located on the CD shipped with the PC.
5. Set up the network: Assign an IP address, include it in a workgroup or domain.
6. Install Internet Explorer 6.0 SP1.
7. Install Service Pack 3 for Windows 2000.
Choose Tools Folder Options View tab and make the following settings:
PCS 7 PoT V6.0 | Edition V1.0 | August 2003 Copyright 2003 Siemens AG by A&D AS CS2 PA. All rights reserved.
Page 1 - 18

PCS 7 PoT Chapter 1 System Overview
8. Uninstall games and the index service and install the Message Queuing services.
Procedure:
- Choose Search "By file and folder" to search for the sysoc.inf file – Remove all "hide“ entries from it (but do not remove the commas) – Save the file
– Choose Settings Control Panel Add/Remove Programs Add/Remove Windows Components to make the desired settings
9. Create a disk image (e.g. using Powerquest Deploy Center) 1.5 Prior to PCS 7 installation The following preparations have to be made before installing a PCS 7 system.
• Install Windows 2000 Professional or Server • Install Windows 2000 SP3 • Install Internet Explorer 6.0 SP1 • Install SQL Server 2000 incl. SP3 (delivered with the PCS 7 installation CDs) • Install Message Queuing services (Windows CD) • Deactivate index service
Hard disk occupation: The Win2000 installation needs about 1.66 Gb. A PCS7 ES installation needs about 1.42 Gb. 1.6 PCS 7 installation CDs PCS 7 software packages are on 3 CDs (the installation CDs). CD No. 3 contains manuals and documents. The following packages can be installed from CD No.1.
PCS7 Engineering • • PCS7 Single Station
PCS 7 PoT V6.0 | Edition V1.0 | August 2003 Copyright 2003 Siemens AG by A&D AS CS2 PA. All rights reserved.
Page 1 - 19

PCS 7 PoT Chapter 1 System Overview
• • • •
• • • • • •
Process Device Manager Batch Engineering Batch Single Station Custom Installation
The following packs are available on CD No.2.
OS Single Station OS Client OS Server Batch Single Station Batch Server Custom Installation
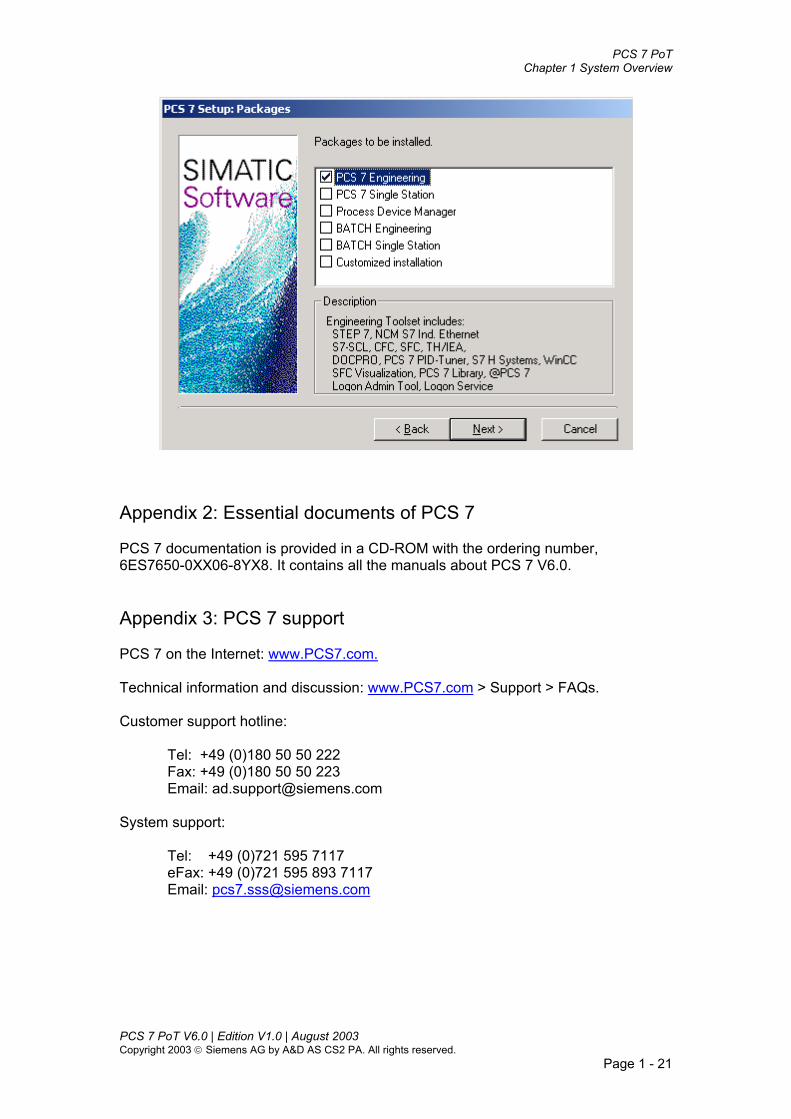
1.7 PCS 7 installation procedure If the CD drive's Autorun feature is active, Setup will launch automatically when the first PCS7 CD-ROM is inserted. Some selected screenshots are given here. You might need to consider installing more than one language.
PCS 7 PoT V6.0 | Edition V1.0 | August 2003 Copyright 2003 Siemens AG by A&D AS CS2 PA. All rights reserved.
Page 1 - 20
PCS 7 PoT Chapter 1 System Overview
Appendix 2: Essential documents of PCS 7 PCS 7 documentation is provided in a CD-ROM with the ordering number, 6ES7650-0XX06-8YX8. It contains all the manuals about PCS 7 V6.0. Appendix 3: PCS 7 support PCS 7 on the Internet: www.PCS7.com. Technical information and discussion: www.PCS7.com > Support > FAQs. Customer support hotline:
Tel: +49 (0)180 50 50 222 Fax: +49 (0)180 50 50 223 Email: [email protected]
System support: Tel: +49 (0)721 595 7117 eFax: +49 (0)721 595 893 7117 Email: [email protected]
PCS 7 PoT V6.0 | Edition V1.0 | August 2003 Copyright 2003 Siemens AG by A&D AS CS2 PA. All rights reserved.
Page 1 - 21

PCS 7 PoT Chapter 1 System Overview
Appendix 4: Software and hardware for the PoT exercises This manual is for hands-on training. If you want to follow the examples, exercises, and projects included in the manual. You need software and hardware components listed in the following table. Note that the Industrial Ethernet cards with basic communication (BCE) are included in the ES, OS and AS PCs.
Component Part No/ Version / Firmware Note
Software V6.0
PCS 7 Engineering system 6ES7658-2AA06-0YA0 (PO250/RT8K) Basic engineering system
SFC-Visualisation 6ES7652-0XD06-2YB0 Basic engineering system
ES Import Export Assistant 6ES7658-1DX06-2YB0 Basic engineering system
OS Server 6ES7658-2BA06-0YA0 (250PO/RT8K) For exercise on server and client communication in Chapter 13.
OS Redundancy 6ES7652-3XA06-2YA0 (PO250/RT8K) For exercise on OS redundancy in Chapter 13.
PCS 7 documentation CD ROM 6ES7650-0XX06-8YX8 Reference manual
Hardware
AS414-3-768AC1E (18Slots), 6ES7654-2BA32-0XX0
MAIN MEM. 2X384KB 18 slots UR1 Rack, VAC 10A Industrial Ethernet connection
AS414-3-768AC1E (9Slots) 6ES7654-2BB32-0XX0
MAIN MEM. 2X384KB 9 slots UR2 Rack, VAC 10A Industrial Ethernet connection
PCS7 AS416-2-1600AC1E (18Slots), 6ES7654-2DA32-0XX0
MAIN MEM. 2X800KB 18 slots UR1 Rack, VAC 10A Industrial Ethernet connection
PCS7 AS416-2-1600AC1E (9Slots), 6ES7654-2DB32-0XX0
MAIN MEM. 2X800KB 9 slots UR2 Rack, VAC 10A Industrial Ethernet connection
AS416-3-3200AC1E (18Slots), 6ES7654-2EA32-0XX0
MAIN MEM. 2X1.6MB 18 slots UR1 Rack, VAC 10A Industrial Ethernet connection
Any of (Firmware 3.1 or higher)
AS416-3-3200AC1E (9Slots), 6ES7654-2EB32-0XX0
MAIN MEM. 2X1.6MB 18 slots UR1 Rack Industrial Ethernet connection
Profibus DP CP 443-5 Extended 6GK7 443-5DX03-0XE0, V5.0 or higher Used for CiR (Chapter 5)
ET200M with active bus module and IM 153 6ES7 153-2BB00-0XB0 Distributed I/O station
Table 1.7: Software and hardware components required for the PoT exercises
PCS 7 PoT V6.0 | Edition V1.0 | August 2003 Copyright 2003 Siemens AG by A&D AS CS2 PA. All rights reserved.
Page 1 - 22

Chapter 2:
SIMATIC Manager and Objects


Contents: CHAPTER 2 SIMATIC MANAGER AND OBJECTS ............................................................................... 1
1. GLOBAL SETTINGS OF SIMATIC MANAGER .................................................................................. 1
1.1 MNEMONICS ............................................................................................................................................ 1 1.2 USER PROJECT AND LIBRARY LOCATION .................................................................................................. 2 1.3 PROJECT BACKUP..................................................................................................................................... 2 1.4 MAINTENANCE OF PROJECTS.................................................................................................................... 5 1.5 RANG OF MASSAGE NUMBERS .................................................................................................................. 6
2. PROJECT VIEWS AND OBJECTS ......................................................................................................... 6
2.1 PLANT VIEW............................................................................................................................................. 7 2.2 COMPONENT VIEW ................................................................................................................................... 8 2.3 PROCESS OBJECT VIEW............................................................................................................................. 9
3. MULTIPROJECTS................................................................................................................................... 10
3.1 CREATING PROJECTS.............................................................................................................................. 11 3.2 CREATING A MULTIPROJECT................................................................................................................... 13
4. PROJECT LANGUAGE .......................................................................................................................... 17
EXERCISE .................................................................................................................................................... 19
EXERCISE 2.1 CREATING AND HANDLING MULTIPROJECTS .......................................................................... 19 1. The Task.............................................................................................................................................. 19 2. Guideline ............................................................................................................................................ 19

PCS 7 PoT Chapter 2 SIMATIC Manager and Objects
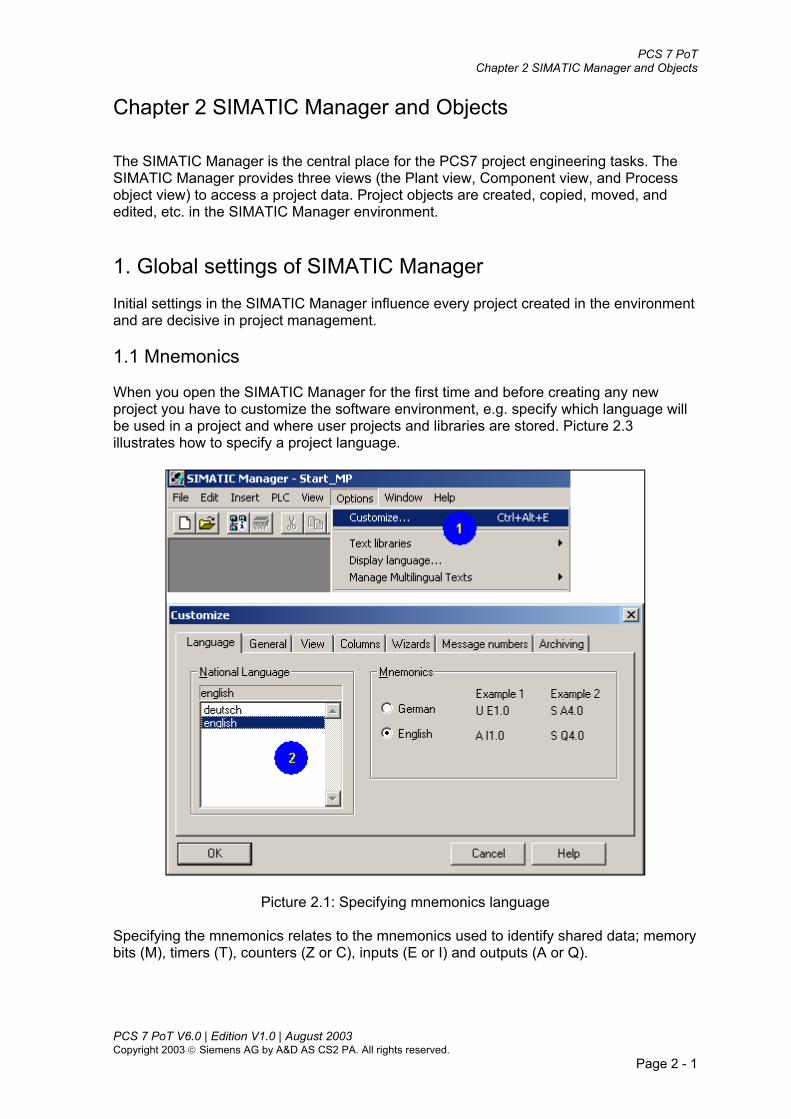
Chapter 2 SIMATIC Manager and Objects The SIMATIC Manager is the central place for the PCS7 project engineering tasks. The SIMATIC Manager provides three views (the Plant view, Component view, and Process object view) to access a project data. Project objects are created, copied, moved, and edited, etc. in the SIMATIC Manager environment. 1. Global settings of SIMATIC Manager Initial settings in the SIMATIC Manager influence every project created in the environment and are decisive in project management. 1.1 Mnemonics When you open the SIMATIC Manager for the first time and before creating any new project you have to customize the software environment, e.g. specify which language will be used in a project and where user projects and libraries are stored. Picture 2.3 illustrates how to specify a project language.
Picture 2.1: Specifying mnemonics language Specifying the mnemonics relates to the mnemonics used to identify shared data; memory bits (M), timers (T), counters (Z or C), inputs (E or I) and outputs (A or Q).
PCS 7 PoT V6.0 | Edition V1.0 | August 2003 Copyright 2003 Siemens AG by A&D AS CS2 PA. All rights reserved.
Page 2 - 1

PCS 7 PoT Chapter 2 SIMATIC Manager and Objects
1.2 User project and library location The location of user projects should be specified to be different from the default location, the location where the PCS 7 system files have been installed (C:\Siemens\Step7\S7proj). If user project location is different from the system file location, user could protect its projects being changed accidentally when the system is going through updates. User-defined libraries should also be located in a different directory than the default PCS7 system libraries. Refer to Picture 2.4.
Picture 2.2: Specifying storage paths for user projects and libraries 1.3 Project backup Before backing up a project, specifying which archiving program to use and where archived data to be located. Refer to Picture 2.3. To archive and retrieve a project, use the functions provided in SIMATIC Manager, which are illustrated in Picture 2.4.
PCS 7 PoT V6.0 | Edition V1.0 | August 2003 Copyright 2003 Siemens AG by A&D AS CS2 PA. All rights reserved.
Page 2 - 2

PCS 7 PoT Chapter 2 SIMATIC Manager and Objects
Picture 2.3: Selecting archive program and specifying archive data location
PCS 7 PoT V6.0 | Edition V1.0 | August 2003 Copyright 2003 Siemens AG by A&D AS CS2 PA. All rights reserved.
Page 2 - 3

PCS 7 PoT Chapter 2 SIMATIC Manager and Objects
Picture 2.4: Project backup To back up a project, Save As function is also frequently used. The function menu path is SIMATIC Manager > File > Save As. See Picture 2.5. Compared to backing up project using Archiving function, the Save As stores a project or multiple project in an uncompressed format.
PCS 7 PoT V6.0 | Edition V1.0 | August 2003 Copyright 2003 Siemens AG by A&D AS CS2 PA. All rights reserved.
Page 2 - 4

PCS 7 PoT Chapter 2 SIMATIC Manager and Objects
Picture 2.5: Backing up project using the Save As function 1.4 Maintenance of projects At regular intervals, you should back up your work by either archiving the project or saving the project with the Reorganization function. With reorganization (slow) If you select this check box, all projects and libraries belonging to the multiproject are also checked and reorganized. Under certain conditions this will reduce the amount of memory needed to store the projects and libraries belonging to the multiproject. Note If a project of a multiproject contains a SIMATIC PC station, the "With reorganization" check box must be selected. If unexplained problems occur when working with the SIMATIC Manager, it is often helpful to reorganize the data management of the project or the library. During the reorganization, gaps resulting from deleting are eliminated; in other words, the memory requirements of the project/library data are reduced. The function optimizes the data storage for the project or the library in much the same way, for example, as a program that defragments your hard disk.
PCS 7 PoT V6.0 | Edition V1.0 | August 2003 Copyright 2003 Siemens AG by A&D AS CS2 PA. All rights reserved.
Page 2 - 5

PCS 7 PoT Chapter 2 SIMATIC Manager and Objects
1.5 Rang of massage numbers When a project is created, the message number range has to be specified. By default, the settings are to Unique message numbers CPU-wide. You may not need to concern much about the message ranges as a beginner. However, it is useful to know where message characteristic is formed. You have the following options to specify message range as shown in Picture 2.6. In PCS 7, the CPU-wide message numbering is used.
Picture 2.6: Options for the range of message numbers
Always assign unique message numbers CPU-wide Select this check box if you want the unique message numbers to be assigned for the entire CPU in all future projects.
•
•
•
• • •
Always assign unique message numbers project-related Select this check box if you want the unique message numbers to be assigned for the entire project in all future projects.
No default settings: If you select this option, you will have to specify how message numbers are assigned each time you create a new project.
Assign message numbers uniquely per CPU (as from PCS 7 V6.0). This allows programs to be copied 1:1 without changes in the message numbers. Assign message numbers uniquely within a project (in all PCS 7 versions incl.V6.0). Setting of the range of message numbers is project-specific, meaning that they apply for the PLCs within a project. 2. Project views and objects There are 3 views for a project in the SIMATIC Manager. Refer to Picture 2.7.
Plant View Component View Process Object View
PCS 7 PoT V6.0 | Edition V1.0 | August 2003 Copyright 2003 Siemens AG by A&D AS CS2 PA. All rights reserved.
Page 2 - 6

PCS 7 PoT Chapter 2 SIMATIC Manager and Objects
Picture 2.7: Plant view, Component view, and Process object view of a project 2.1 Plant view Plant view shows a project with hierarchical levels, which is a logic representation of real plant hierarchy. A project can have up to 5 levels of plant. In the Plant view, you can insert the following objects. These objects are also shown in Picture 2.8.
Hierarchy folder • • • • • •
CFC SFC Picture Report Additional document (Text, Write, Word, and Excel documents)
PCS 7 PoT V6.0 | Edition V1.0 | August 2003 Copyright 2003 Siemens AG by A&D AS CS2 PA. All rights reserved.
Page 2 - 7

PCS 7 PoT Chapter 2 SIMATIC Manager and Objects
Picture 2.8: SIMATIC objects which are inserted in the Plant view Note If you insert the charts in the Plant view, they will be also inserted in the Component view. Actually, these objects should be only inserted in the Plant view but not in Component view. 2.2 Component view Component view contains hardware parts, bus systems, automation stations, and PC stations. In the Component view, you can insert hardware components. These objects are shown in Picture 2.10. Not all the objects illustrated in Picture 2.10 are used for PCS7 projects. The following objects are used in PCS7 projects.
SIMATIC S7 400 Station • • • • • •
SIMATIC H Station SIMATIC PC Station S7 Program OS (Operation server project) OS (client project)
PCS 7 PoT V6.0 | Edition V1.0 | August 2003 Copyright 2003 Siemens AG by A&D AS CS2 PA. All rights reserved.
Page 2 - 8

PCS 7 PoT Chapter 2 SIMATIC Manager and Objects
Picture 2.9: SIMATIC objects which are inserted in the Component view Note It is recommended not to insert OS object directly in a project but include it inside a PC station. 2.3 Process object view Process object view contains all the engineering aspects of a project, e.g. parameters, signals, messages, texts, graphic images, measured value archives. It provides a central place to edit, add, and mend data of a project. Refer to Picture 2.11. In the process object view you can also insert Plant hierarchy, CFC, SFC, pictures, etc. The same as you can do in the plant view. In the process object view, you have powerful filtering functions to facile finding a group of data or a specific datum.
PCS 7 PoT V6.0 | Edition V1.0 | August 2003 Copyright 2003 Siemens AG by A&D AS CS2 PA. All rights reserved.
Page 2 - 9

PCS 7 PoT Chapter 2 SIMATIC Manager and Objects
Picture 2.11: Process object view Note Once you build up more objects in your project, you will use the process objects view more to edit, add, and mend project data. Find out more information about Process objects view in the later Chapters. 3. Multiprojects Multiproject is a new type of projects in the SIMATIC Manager. In the SIMATIC Manager, you can create projects (single projects), libraries, and multiprojects. A multiproject contains at least one single project and one library. The library is called master data library. Refer to Picture 2.12.
PCS 7 PoT V6.0 | Edition V1.0 | August 2003 Copyright 2003 Siemens AG by A&D AS CS2 PA. All rights reserved.
Page 2 - 10

PCS 7 PoT Chapter 2 SIMATIC Manager and Objects
Picture 2.12: Multiproject structure When creating a new project with the “New Project” wizard, a multiproject type is created automatically. This multiproject always contains the master data library with the hierarchy folders for process tag types and models. If the project was not created with the New project wizard, you can add a library into the multiproject and then the library becomes the master data library. 3.1 Creating projects When using New function to create projects, you have some options. Refer to Picture 2.13.
PCS 7 PoT V6.0 | Edition V1.0 | August 2003 Copyright 2003 Siemens AG by A&D AS CS2 PA. All rights reserved.
Page 2 - 11

PCS 7 PoT Chapter 2 SIMATIC Manager and Objects
Picture 2.13: The New function – creating projects
When creating a (single) project, you also have the option to add the project to the current project. The same applies to creating libraries. See Picture 2.13.
PCS 7 PoT V6.0 | Edition V1.0 | August 2003 Copyright 2003 Siemens AG by A&D AS CS2 PA. All rights reserved.
Page 2 - 12

PCS 7 PoT Chapter 2 SIMATIC Manager and Objects
Picture 2.14: The New function - creating libraries
3.2 Creating a multiproject After New a multiproject (SIMATIC Manager > File > New (multiproject), you have an empty multiproject in the SIMATIC Manager Component view. Call up the Plant view using menu path, SIMATIC Manager > View > Plant view. See Picture 2.15. In a new empty multiproject, you have the option to add an existing project into the multiproject. If you do not add existing projects in the multiproject, you can create a project in the multiproject. Refer to Picture 2.15.
PCS 7 PoT V6.0 | Edition V1.0 | August 2003 Copyright 2003 Siemens AG by A&D AS CS2 PA. All rights reserved.
Page 2 - 13

PCS 7 PoT Chapter 2 SIMATIC Manager and Objects
Picture 2.15: A new empty multiproject
PCS 7 PoT V6.0 | Edition V1.0 | August 2003 Copyright 2003 Siemens AG by A&D AS CS2 PA. All rights reserved.
Page 2 - 14

PCS 7 PoT Chapter 2 SIMATIC Manager and Objects
You need a library in the multiproject, which cannot be created in the current multiproject. Therefore, a library has to be firstly created and then add into the multiproject. Refer to Picture 2.16.
Picture 2.16: Adding a library to a multiproject
PCS 7 PoT V6.0 | Edition V1.0 | August 2003 Copyright 2003 Siemens AG by A&D AS CS2 PA. All rights reserved.
Page 2 - 15

PCS 7 PoT Chapter 2 SIMATIC Manager and Objects
The library in the multiproject has to be declared as a master data library following the illustration in Picture 2.17.
Picture 2.17: Declaring master data library In the Plant view, a master data library should have the Models folder and Process tag types folder. These folders will not be automatically created after you declare a library as the master data library. However, the two folders will be generated when you create models and Process tag types. Picture 2.18 shows how to create Tag Type to have the Process tag types folder. A similar procedure can be applied to have the Model folder.
PCS 7 PoT V6.0 | Edition V1.0 | August 2003 Copyright 2003 Siemens AG by A&D AS CS2 PA. All rights reserved.
Page 2 - 16

PCS 7 PoT Chapter 2 SIMATIC Manager and Objects
Picture 2.18: Creating Process tag type to have the Process tag types folder Note You can use the New project wizard to create a new project instead of the New function. The master data library with the Models and Process tag types folders will be automatically created when using the New project wizard. The use of the New project wizard is explianed in details in Chapter 4. 4. Project language All the texts of a project are in the defined project language. Project language has to be declared before any engineering work could start as texts will not be displayed correctly if the language issue is not clear. System-used texts, e.g. system messages, system library block messages, and block variable engineering units are available in 3 languages (German, English, and French) if the SIMATIC Manager is installed with the multiple languages. One of the languages has to be set as the project default. To proceed the setting, follow the menu path, SIMATIC Manager > Options > Display language. See Picture 2.19.
PCS 7 PoT V6.0 | Edition V1.0 | August 2003 Copyright 2003 Siemens AG by A&D AS CS2 PA. All rights reserved.
Page 2 - 17

PCS 7 PoT Chapter 2 SIMATIC Manager and Objects
Picture 2.19: Setting project language If you write your own texts into a project, e.g. your own blocks with its texts, those texts are in the defined project language. If you want the texts available in another language, you need to type the texts again in another language.
PCS 7 PoT V6.0 | Edition V1.0 | August 2003 Copyright 2003 Siemens AG by A&D AS CS2 PA. All rights reserved.
Page 2 - 18

PCS 7 PoT Chapter 2 SIMATIC Manager and Objects
Exercise Exercise 2.1 Creating and handling multiprojects 1. The Task Create a new multiproject using the New function. By the end of the exercise, you should have a project like the one in Picture 2.18, which contains a project and a master data library. Those global settings were discussed in the Chapter should be noted and applied when creating new projects. Note By the end of the exercise, you will have a multiproject which is almost empty but with the proper structure of a multiproject. You will work on the project and build up more objects in it later on through this manual. Thus, this project servers a start-point to later Chapters and exercises. 2. Guideline 1. Open the SIMATIC Manager and complete the relevant global settings for your
SIMATIC Manager environment. 2. Create a new project using the New function. Make sure that the project the Plant view
and Component view are open. Check the View function. 3. Create in a project in the multiproject. Refer to Picture 2.15. 4. Create a library using the New function. Refer to Picture 2.16. 5. Set the library as the master data library. See Picture 2.17. 6. You can have the Models folder and Tag types folder by following the illustration on
Picture 2.18. However, this action is optional as you will have the folders when you learn more about Tag types and Models.
7. Archive the project in the SIMATIC Manager. 8. Save the project to another Windows directory using the Save As function.
PCS 7 PoT V6.0 | Edition V1.0 | August 2003 Copyright 2003 Siemens AG by A&D AS CS2 PA. All rights reserved.
Page 2 - 19

Chapter 3:
PC Stations and Communication


Contents: CHAPTER 3 PC STATIONS AND COMMUNICATION.......................................................................... 1
1. SOFTWARE TOOLS FOR PC STATION CONFIGURATION ........................................................... 1
2. CONFIGURATION OF PC STATIONS .................................................................................................. 2
2.1 THE SETUP ............................................................................................................................................... 2 2.2 INSERTING PC AND AS STATIONS IN SIMATIC MANAGER..................................................................... 3 2.3 INSERTING PC STATION COMPONENTS IN HW-CONFIG............................................................................ 3 2.4 DATA EXCHANGE BETWEEN AS AND OS ................................................................................................. 4 2.5 CONFIGURATION CONSOLE AND COMMISSIONING WIZARD..................................................................... 5
2.5.1 Commissioning Wizard.................................................................................................................... 6 2.5.2 Configuration Console................................................................................................................... 14
2.6 STATION CONFIGURATION EDITOR ........................................................................................................ 17 2.7 PC STATION IN PROJECT, INDEXING, AND NAMING ................................................................................ 18 2.8 ACTIVATING S7 RUNTIME STATION MANAGER ..................................................................................... 19 2.9 DOWNLOADING STATIONS ..................................................................................................................... 19
3. THE COMMUNICATION ISSUE IN A TRAINING SETUP .............................................................. 20
3.1 AN EXAMPLE OF AUTOMATION STATION ................................................................................................ 21 3.2 INDUSTRIAL ETHERNET COMMUNICATION WITH CP443-1 ..................................................................... 22 3.3 COMMUNICATION WITH MPI ................................................................................................................. 24 3.4 SIMATIC S7 PLCSIM.......................................................................................................................... 26
EXERCISE .................................................................................................................................................... 29
EXERCISE 3.1 YOUR FIRST COMMUNICATION PROJECT ................................................................................ 29 1. The task............................................................................................................................................... 29 2. Guideline ............................................................................................................................................ 29


PCS 7 PoT Chapter 3 PC Stations and Communication
• • • • •
Chapter 3 PC Stations and Communication The SIMATIC PC station (referred to here simply as "PC station") is a PC with SIMATIC components installed. In the scope of PCS 7 systems, a PC station represents the physical side of an OS server or ES. Communication between PC stations means: • Transferring configuration data from ES to OS so that OS can be ready for runtime
communication • Configuring and communicating between ES/OS and AS The topic of the PC stations and communication is to deal with configuration of all PC stations involved in a PCS7 project in a central place of the SIMATIC Manager. 1. Software tools for PC station configuration
SIMATIC Manager HW-Config NetPro Configuration Console and Commissioning Wizard Station Configuration Editor
In the SIMATIC Manager, a PC station is inserted into a project. You need to consider which communication card (e.g. CP1613 or 3Com Etherlink) is physically present in the PC as it will be configured for the project to use. A PC station, either an ES or OS, has a WinCC application to use the communication channel. A communication card and WinCC application are inserted and configured in HW-Config. The other end of an ES/OS is the automation stations, ASs. Logic connections have to be established between WinCC Application and AS CPUs. The connections are set in the NetPro. The Configuration Console provides a snapshot of SIMATIC hardware devices of a PC and is used for configuration, commissioning, and diagnostics of the communication system of a SIMATIC PC. Properties of a communication means including parameters, addresses, and accessing protocols are set with the tool. The hardware devices of a SIMATIC PC listed in the Configuration Console are firstly recognized by using the Commissioning Wizard. The Wizard runs once [1] for each PC station and further settings can be done in the Configuration Console. The devices recognized by the Commissioning Wizard are indexed during the wizard run and the indices can be adjusted later in the Configuration Console. The Station Configuration Editor shows the active cards and applications. It is also used for diagnostic purposes. [1] Any change in the SIMATIC hardware components will be recognized by the Commissioning Wizard.
PCS 7 PoT V6.0 | Edition V1.0 | August 2003 Copyright 2003 Siemens AG by A&D AS CS2 PA. All rights reserved.
Page 3 - 1

PCS 7 PoT Chapter 3 PC Stations and Communication
2. Configuration of PC stations Given PCS7 software tools and an AS, a very first step is to gain some ideas on how the tools can be used and how the stations are related. This section illustrates how to configure a SIMATIC station in a PCS7 project. 2.1 The setup In PCS7 systems, Industrial Ethernet is used as Plant Bus. A SIMATIC PC supplied is equipped with an onboard Ethernet card for the Terminal Bus connection and/or network card (either a CP1613 card or another network card, e.g. 3Com Etherlink card) for the Plant Bus connection. An AS uses CP443-1 card to communicate with ES/OS. A typical setup of ES/OS and AS is illustrated in Picture 3.1.
Picture 3.1: A typical setup of PCS7 ES/OS and AS. The use of other network cards (e.g. 3Com cards) rather than CP1613 cards is an entry level for the Plant Bus communication. The CP1613 cards are used in any substantial projects. Note The rest of the Chapter will use 3Com card communication as an example as the use of CP1613 is explained in great details in the manual “Process Control System PCS7 PC Configuration – practical application, Edition 03/2003”, which is delivered with the PCS7 V6.0 software. PCS 7 PoT V6.0 | Edition V1.0 | August 2003 Copyright 2003 Siemens AG by A&D AS CS2 PA. All rights reserved.
Page 3 - 2

PCS 7 PoT Chapter 3 PC Stations and Communication
2.2 Inserting PC and AS stations in SIMATIC Manager A project in the SIMATIC Manager contains PC and/or AS stations. After creating a new project in SIMATIC Manager, you could insert a PC station and an AS station for the example of Picture 3.1. Alternatively, you may use the New Project wizard to have a new project in SIMATIC Manager. The New Project wizard could automatically insert an AS and/or a PC station in a project. Picture 3.2 shows a project with an AS station and a PC station.
Picture 3.2: A project with an AS station and a PC station After inserting AS and PC stations, they have to be configured. Configuration of AS is mainly carried out in the HW-Config tool. Section 3 of the Chapter contains an example of AS configuration. Configuration of a PC station requires several tools and it is described in this section. Note Refer to “Chapter 5, Hardware Configuration to know more about configuration of components such as IOs and other devices. 2.3 Inserting PC station components in HW-Config In SIMATIC Manager Component View, select a PC Station, e.g. the CARDIFF machine in Picture 3.2, and then double-click Configuration in the right pane to open the station in the HW-Config. Refer to Picture 3.3. PC station components such as HMI applications and CP Industrial Ethernet cards are listed in the Hardware Catalog for selection. You pick up a PC component and drop it onto the PC’s virtual rack in a slot. The sequences of the components are not important but note that the slots are indexed. Once a card or application is placed, its index will be used as the identity of the component. The index numbers are used in other software tools to identify the components.
PCS 7 PoT V6.0 | Edition V1.0 | August 2003 Copyright 2003 Siemens AG by A&D AS CS2 PA. All rights reserved.
Page 3 - 3

PCS 7 PoT Chapter 3 PC Stations and Communication
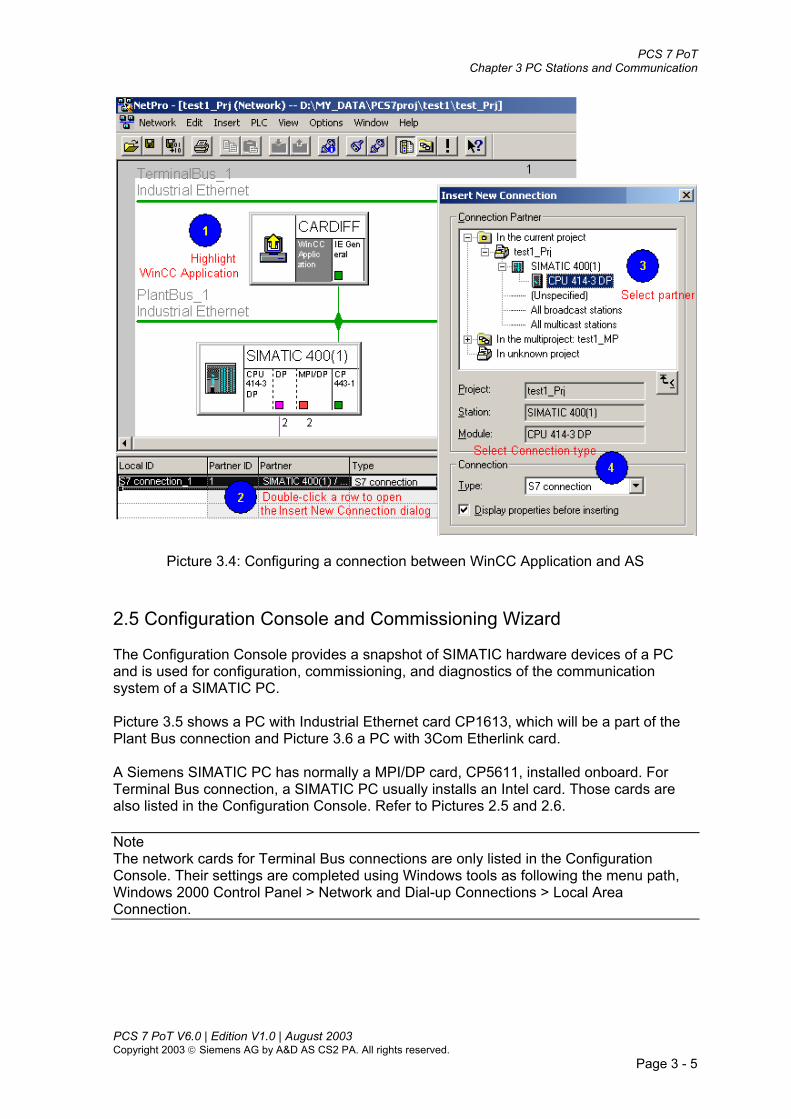
Picture 3.3: Inserting PC station components 2.4 Data exchange between AS and OS An ES/OS PC station is to exchange data with AS. The connections between them are set in the NetPro Interface. Refer to Picture 3.4.
PCS 7 PoT V6.0 | Edition V1.0 | August 2003 Copyright 2003 Siemens AG by A&D AS CS2 PA. All rights reserved.
Page 3 - 4
PCS 7 PoT Chapter 3 PC Stations and Communication
Picture 3.4: Configuring a connection between WinCC Application and AS 2.5 Configuration Console and Commissioning Wizard The Configuration Console provides a snapshot of SIMATIC hardware devices of a PC and is used for configuration, commissioning, and diagnostics of the communication system of a SIMATIC PC. Picture 3.5 shows a PC with Industrial Ethernet card CP1613, which will be a part of the Plant Bus connection and Picture 3.6 a PC with 3Com Etherlink card. A Siemens SIMATIC PC has normally a MPI/DP card, CP5611, installed onboard. For Terminal Bus connection, a SIMATIC PC usually installs an Intel card. Those cards are also listed in the Configuration Console. Refer to Pictures 2.5 and 2.6. Note The network cards for Terminal Bus connections are only listed in the Configuration Console. Their settings are completed using Windows tools as following the menu path, Windows 2000 Control Panel > Network and Dial-up Connections > Local Area Connection.
PCS 7 PoT V6.0 | Edition V1.0 | August 2003 Copyright 2003 Siemens AG by A&D AS CS2 PA. All rights reserved.
Page 3 - 5

PCS 7 PoT Chapter 3 PC Stations and Communication
Picture 3.5: A SIMATIC PC station – CP1613
Picture 3.6: A SIMATIC PC station – 3Com Etherlink Note The primary use of Configuration Console and Commissioning Wizard is for the SIMATIC Plant Bus communication that involves ES, OS, and AS. All PC stations (ES, OS) and automation systems are configured in a PCS7 project so that all stations can be loaded centrally from an engineering station. The hardware devices of a SIMATIC PC listed in the Configuration Console are firstly recognized by using the Commissioning Wizard. The Wizard runs once for each PC station and settings can be altered and mended further in the Configuration Console. 2.5.1 Commissioning Wizard The Commissioning Wizard automatically detects the connected modules when a PC is restarted (Plug & Play) and installs them according to the dialog guidance of the wizard. There are a number of pages of the dialog menu and the number varies depending on the PC cards installed.
PCS 7 PoT V6.0 | Edition V1.0 | August 2003 Copyright 2003 Siemens AG by A&D AS CS2 PA. All rights reserved.
Page 3 - 6

PCS 7 PoT Chapter 3 PC Stations and Communication
•
•
• •
To detect the cards, the cards are installed as follows:
Physical installation of a general network card, e.g. an Intel card, and interconnect it with the Terminal Bus. The network card is also termed Softnet card or General IE. Physical installation of a CP1613 or network card, e.g. 3Com Etherlink, and interconnect it with the Plant Bus. Initial boot of the PC station. With additional PC stations the same procedure is applied following installation and interconnection of one or multiple network cards.
Step 1:
Picture 3.7: Commissioning Wizard launching This wait box is displayed during booting and verification of the network components connected to the PC station. Step 2:
Picture 3.8: Commissioning Wizard welcome page The Commissioning Wizard started with the first of nine dialog boxes. If it starts with the first of four dialog boxes, no new network cards have been detected.
PCS 7 PoT V6.0 | Edition V1.0 | August 2003 Copyright 2003 Siemens AG by A&D AS CS2 PA. All rights reserved.
Page 3 - 7

PCS 7 PoT Chapter 3 PC Stations and Communication
Step 3:
Picture 2:9: Commissioning Wizard detects the first network module Note The Commissioning Wizard sets any card to PG operation mode by default. In the Commissioning Wizard dialogs, you are asked to decide which operation mode that a module will use. There are three modes namely configured mode, PG operation, and Not yet specified for each network module. Refer to Picture 3.10.
Mode Typical Use Description
Configured mode
• •
ES Runtime PC
In this mode, all parameters of the module are specified in a project (PCS7 or STEP7) and transferred to the module. If you use this mode, you can use all the protocols available with SIMATIC NET as well as with the OPC Server.
PG operation
Programming Device, PG/PC
In this mode, the network-related parameters of the module such as the station address and transmission rate are set using the “Configuration Console” or "Set PG/PC Interface" configuration tool. This configuration is possible only locally on the computer itself. If you select this mode, PG functions (for example, SIMATIC STEP 7) can be used with the module. Communication functions requiring a configuration as defined in a project or OPC operation are then not possible.
Not yet specified
If you select this setting, the mode is indicated as "not specified". This is the original setting after you have installed the module. The next time you start the Commissioning Wizard, the module will be treated like a newly detected module and the module can be initialized again.
PCS 7 PoT V6.0 | Edition V1.0 | August 2003 Copyright 2003 Siemens AG by A&D AS CS2 PA. All rights reserved.
Page 3 - 8

PCS 7 PoT Chapter 3 PC Stations and Communication
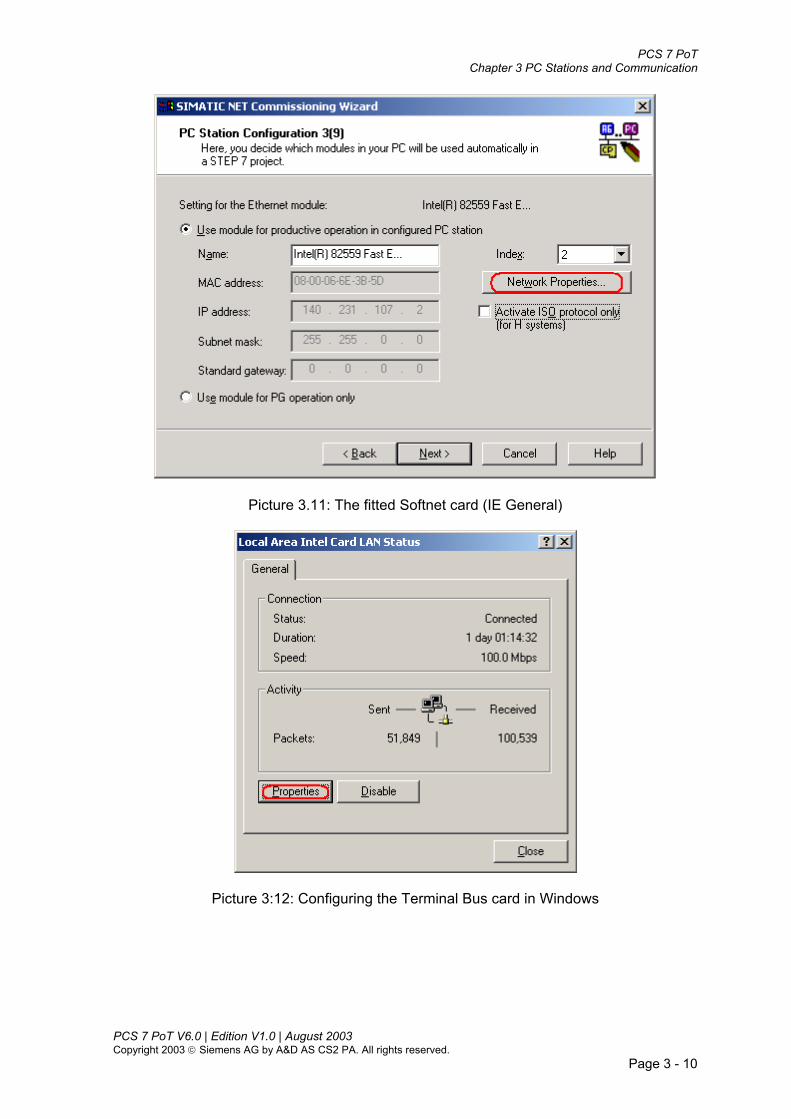
Picture 3.10: Operation modes of a network module Step 3: The fitted Softnet card (IE General) is set by default to PG operation mode, which is actually irrelevant. If you select the Configured mode, the Network Properties button becomes active (see Picture 3.11) which leads to set the card in Windows environment (see Picture 3.12).
PCS 7 PoT V6.0 | Edition V1.0 | August 2003 Copyright 2003 Siemens AG by A&D AS CS2 PA. All rights reserved.
Page 3 - 9
PCS 7 PoT Chapter 3 PC Stations and Communication
Picture 3.11: The fitted Softnet card (IE General)
Picture 3:12: Configuring the Terminal Bus card in Windows PCS 7 PoT V6.0 | Edition V1.0 | August 2003 Copyright 2003 Siemens AG by A&D AS CS2 PA. All rights reserved.
Page 3 - 10

PCS 7 PoT Chapter 3 PC Stations and Communication
Step 4:
Picture 3.13: Commissioning Wizard detecting Plant Bus module Productive operation or the Configured mode means that the address of the module is managed inside a PCS7 project and the module can be used for downloading data to other PC stations. After detecting network modules installed on a PC, the Commissioning Wizard goes ahead to configure applications, e.g. OPC server, intended to run on the PC.
PCS 7 PoT V6.0 | Edition V1.0 | August 2003 Copyright 2003 Siemens AG by A&D AS CS2 PA. All rights reserved.
Page 3 - 11

PCS 7 PoT Chapter 3 PC Stations and Communication
Step 5:
Picture 3.14: Configuring for OPC communication Step 6:
Picture 3.16: Commissioning Wizard – Save the configuration page
PCS 7 PoT V6.0 | Edition V1.0 | August 2003 Copyright 2003 Siemens AG by A&D AS CS2 PA. All rights reserved.
Page 3 - 12

PCS 7 PoT Chapter 3 PC Stations and Communication
Step 7: After running the Commissioning Wizard, the PC Station Wizard starts automatically. Refer to Picture 3.17.
Picture 3.17: The PC Station Wizard starts Step 8:
Picture 3.18: Commissioning Wizard – Symbol file for OPC communication PCS 7 PoT V6.0 | Edition V1.0 | August 2003 Copyright 2003 Siemens AG by A&D AS CS2 PA. All rights reserved.
Page 3 - 13

PCS 7 PoT Chapter 3 PC Stations and Communication
Step 9:
Picture 3.19: Commissioning Wizard – finish page The Commissioning Wizard has reached its last dialog box. After clicking button Finish (see Picture 3.19), the Configuration Console will launch immediately. The configuration that has gone through the above procedure steps is listed in the Configuration Console as shown in Picture 3.6. The Commissioning Wizard is only launched again if the network modules on the PC station change. To make changes to the modules while a PC station is running use the Configuration Console. You can call up the Configuration Console at any time by following the menu path: Windows Start > Simatic > SIMATIC NET > Settings > Configuration Console. 2.5.2 Configuration Console The Configuration Console not only provides a snapshot of SIMATIC hardware devices of a PC but also is used for configuration, commissioning, and diagnostics of the communication system of a SIMATIC PC. Picture 3.20 shows active notes on a PROFIBUS connection.
PCS 7 PoT V6.0 | Edition V1.0 | August 2003 Copyright 2003 Siemens AG by A&D AS CS2 PA. All rights reserved.
Page 3 - 14

PCS 7 PoT Chapter 3 PC Stations and Communication
Picture 3.20: Diagnostic function of Configuration Console In the configuration of Picture 3.20, the PC can access an AS via CP5611 module or 3Com card depending on which module has the Access points right. To use Industrial Ethernet, set the relevant network module (in the case, a 3Com card) as the Configured mode and Access points as S7ONLINE PC internal (local). Refer to Picture 3.21.
PCS 7 PoT V6.0 | Edition V1.0 | August 2003 Copyright 2003 Siemens AG by A&D AS CS2 PA. All rights reserved.
Page 3 - 15

PCS 7 PoT Chapter 3 PC Stations and Communication
Picture 3.21: Settings of 3Com card for Plant Bus communication The Configured mode with the Access points set as PC internal (local) is essential for an ES PC to be able to load data to any ASs and OSs centrally. If you have more than one Plant Bus network modules on a PC, e.g. CP1613 (or 3Com Etherlink) and CP5611, you can have the so-called mixed operation over the PC. That is to say CP5611 in PG operation mode and CP1613/3Com Etherlink in Configured mode if there are two cabling systems. PG operation mode is in this case for diagnosis. If a PC has a CP 1613 module and an Intel module, they can all be set as Configured mode. However, the CP1613 is used for Plant Bus and the General network card is for the Terminal Bus and managed mainly in Windows.
PCS 7 PoT V6.0 | Edition V1.0 | August 2003 Copyright 2003 Siemens AG by A&D AS CS2 PA. All rights reserved.
Page 3 - 16

PCS 7 PoT Chapter 3 PC Stations and Communication
If a PC has a Softnet card, e.g. 3Com Etherlink, and an Intel module, only one card can be set as the Configured mode. In this case, the Plant Bus module, 3Com Etherlink card, should be set with the Configured mode. 2.6 Station Configuration Editor The Station Configuration Editor allows you to network modules and applications of a PC station centrally. The Station Configuration Editor is also used for diagnostic purposes. Network modules in the Configured mode are recognized by the Station Configuration Editor. Applications such as OPC communication and WinCC applications are also listed in the Editor if they are configured during the Commissioning Wizard run. Nevertheless, OPC server and WinCC applications can be entered in the Editor manually. The Station Configuration Editor can be called up by double-clicking the icon on the Windows task bar. Refer to Picture 3.22.
Picture 3.22: Station Configuration Editor PCS 7 PoT V6.0 | Edition V1.0 | August 2003 Copyright 2003 Siemens AG by A&D AS CS2 PA. All rights reserved.
Page 3 - 17

PCS 7 PoT Chapter 3 PC Stations and Communication
2.7 PC station in project, indexing, and naming To configure a PC station, several software tools are used. The tools have been described at the beginning of the Chapter. Here, a summary of the configuring steps is illustrated in Picture 3.23. The sequences of the steps are not important but logic for understanding. The importance regarding configuring a PC station is to index communication applications and network modules and name the station the same in the SIMATIC Manager and Station Configuration Editor.
Picture 3.23: Configuring a PC station in a PCS7 project
PCS 7 PoT V6.0 | Edition V1.0 | August 2003 Copyright 2003 Siemens AG by A&D AS CS2 PA. All rights reserved.
Page 3 - 18

PCS 7 PoT Chapter 3 PC Stations and Communication
2.8 Activating S7 Runtime Station Manager The S7 Runtime Station Manager (S7RTM) function has to be activated for all the PC stations in a project. It is activated by default when a PC station is inserted. Nevertheless, you can check the function as shown in Picture 3.24.
Picture 3.24: S7RTM function In the Station Configuration editor, the S7RTM is placed at the bottom of the table with the default index number of 124. 2.9 Downloading stations After configuring stations, you can test if the configuration is correct by downloading a station to the physical machine. PC stations and automation stations are downloaded in NetPro where you can select which one to be downloaded. Picture 3.24 shows how to download the local PC (usually an engineering station). Note that the access point is set to S7ONLINE internal (local).
PCS 7 PoT V6.0 | Edition V1.0 | August 2003 Copyright 2003 Siemens AG by A&D AS CS2 PA. All rights reserved.
Page 3 - 19

PCS 7 PoT Chapter 3 PC Stations and Communication
Picture 3.24: Downloading stations in NetPro To be able to download other PC stations from the local machine, Station Configuration Editor on every PC station has to be in the online mode. Stations (PC and AS) can also be downloaded in the HW-Config where one station is downloaded at each time after opening an individual station one by one. 3. The communication issue in a training setup In Picture 3.1, a setup has been assumed where an ES is either installed with a CP1613 or 3Com Etherlink card for the Plant Bus communication using the industrial Ethernet protocol. Although the basic principle regarding a SIMATIC PC configuration is the same for the different network cards used, practical steps when conducting the settings may differ. You should be aware of the difference and possible alternative way when following the illustrations of the document. As a SIMATIC PC ES also comes with an onboard MPI interface (CP5611 and refer to Picture 3.20), it is also possible to use MPI communication between AS and ES and between AS and OS for the purpose of learning. Particularly, the manual is to teach engineering aspects of PCS7 systems rather than goes to details of runtime performances. In this section, we will first show how to configure a basic AS. If you have a real AS with industrial communication, as the one shown in Picture 3.1, this part will be a completion of the setup and you shall have a working system (ES + AS) to carry on working with PCS7 system tools. Then, the section goes on to introduce the SIMATIC simulated AS, called PLCSIM. With the simulation AS, you do not need a real AS to practice many aspects (not all!) of PCS7
PCS 7 PoT V6.0 | Edition V1.0 | August 2003 Copyright 2003 Siemens AG by A&D AS CS2 PA. All rights reserved.
Page 3 - 20

PCS 7 PoT Chapter 3 PC Stations and Communication
systems engineering. Communication between PLCSIM and OS is through MPI connection. Settings of MPI connection will be discussed.
ES PC AS Which communication
with network card: CP1613 or 3Com Etherlink with CP443-1 •
• Industrial Ethernet Real AS
with or without network card PLCSIM
• • •
PC internal communication Use of MPI connection for OS Simulated AS
Table 3.1: Options of your training equipment
3.1 An example of automation station The example AS is AS1 with details of components as listed in Table 3.2. Carrying on working on the project, test1_MP, which was introduced in Section2, here the automation station is configured. Refer to Picture 3.25 and 3.26.
Picture 3.25: Automation station in Component View
PCS 7 PoT V6.0 | Edition V1.0 | August 2003 Copyright 2003 Siemens AG by A&D AS CS2 PA. All rights reserved.
Page 3 - 21

PCS 7 PoT Chapter 3 PC Stations and Communication
Picture 3.26: Configuring a basic AS 3.2 Industrial Ethernet communication with CP443-1 If using the CP443-1 card of Picture 3.26, follow the instruction on Picture 3.27 and 3.28.
PCS 7 PoT V6.0 | Edition V1.0 | August 2003 Copyright 2003 Siemens AG by A&D AS CS2 PA. All rights reserved.
Page 3 - 22
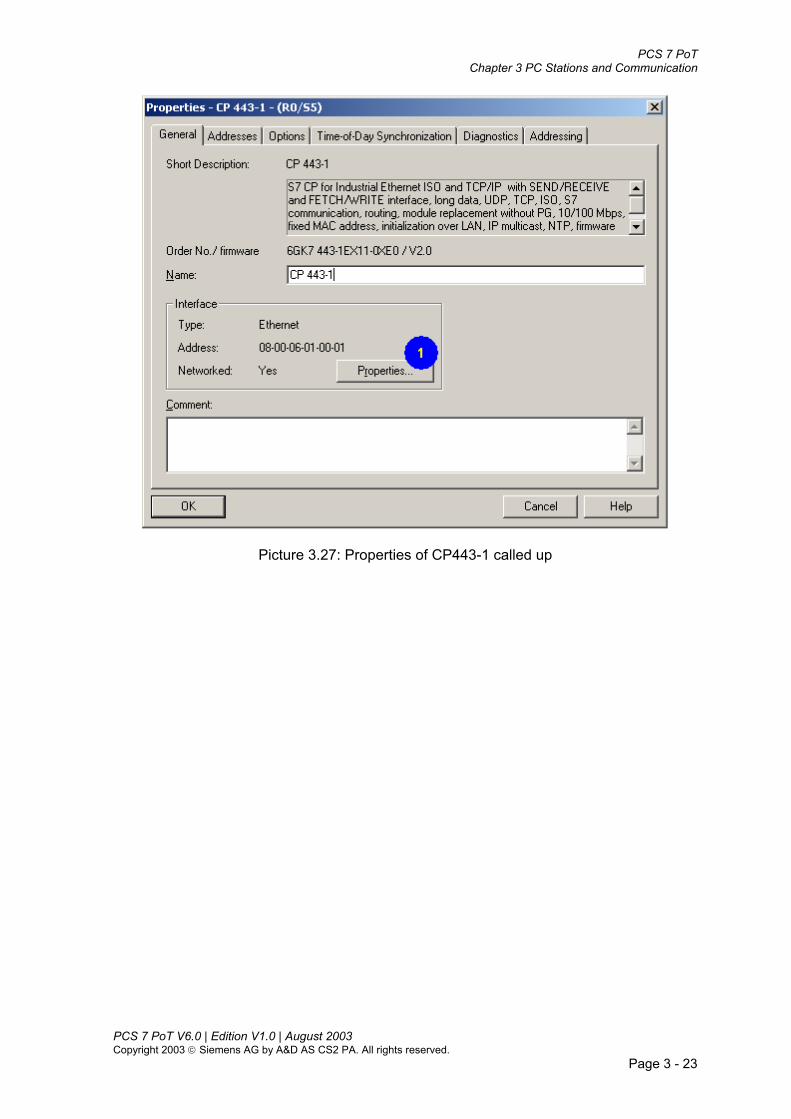
PCS 7 PoT Chapter 3 PC Stations and Communication
Picture 3.27: Properties of CP443-1 called up
PCS 7 PoT V6.0 | Edition V1.0 | August 2003 Copyright 2003 Siemens AG by A&D AS CS2 PA. All rights reserved.
Page 3 - 23

PCS 7 PoT Chapter 3 PC Stations and Communication
Picture 3.28: Addressing CP443-1
3.3 Communication with MPI If using PLCSIM as AS, an MPI connection is required for connection between OS and AS. Refer to Picture 3.29.
PCS 7 PoT V6.0 | Edition V1.0 | August 2003 Copyright 2003 Siemens AG by A&D AS CS2 PA. All rights reserved.
Page 3 - 24

PCS 7 PoT Chapter 3 PC Stations and Communication
Picture 3.29: MPI connection Note It is recommended to use MPI address at 2 for PLCSIM. To be able to use MPI connection, OS project cannot be inserted in a PC station in Component View. Instead, an OS project has to be placed directly in a project. To be able to use MPI connection to communicate between OS and PLCSIM, an OS project has not to be placed inside a PC but directly under the PCS7 project. See Picture 3.30.
PCS 7 PoT V6.0 | Edition V1.0 | August 2003 Copyright 2003 Siemens AG by A&D AS CS2 PA. All rights reserved.
Page 3 - 25

PCS 7 PoT Chapter 3 PC Stations and Communication
Picture 3.30: Inserting OS(2) directly in test1_Prj After the settings shown in Picture 3.29 and 3.30, the MPI connection is available to link between OS and AS. See Picture 3.31.
Picture 3.31: Connection between OS and AS (S7 program) 3.4 SIMATIC S7 PLCSIM PLCSIM is an optional package of PCS7 systems. It is not included in an installation PCS7 engineering system. You need to additionally install PLCSIM after installing PCS7. As CPU simulation is realized completely by the PCS7 software, you do not require any S7 hardware (CPU or signal modules). Using PLCSIM you can test and troubleshoot programs for S7-300 and S7-400 CPUs. Note To learn more about PLCSIM, refer to the PLCSIM User Manual.
PCS 7 PoT V6.0 | Edition V1.0 | August 2003 Copyright 2003 Siemens AG by A&D AS CS2 PA. All rights reserved.
Page 3 - 26

PCS 7 PoT Chapter 3 PC Stations and Communication
After PLCSIM is installed, you can turn on the simulation. See Picture 3.32.
Picture 3.32: Use of PLCSIM Hardware configuration and S7 program are downloaded as usual (which is to PLCSIM). After downloading, you can switch the CPU mode from STOP to RUN or RUN-P as shown in Picture 3.32.
PCS 7 PoT V6.0 | Edition V1.0 | August 2003 Copyright 2003 Siemens AG by A&D AS CS2 PA. All rights reserved.
Page 3 - 27

PCS 7 PoT Chapter 3 PC Stations and Communication
PCS 7 PoT V6.0 | Edition V1.0 | August 2003 Copyright 2003 Siemens AG by A&D AS CS2 PA. All rights reserved.
Page 3 - 28

PCS 7 PoT Chapter 3 PC Stations and Communication
Exercise Exercise 3.1 Your first communication project 1. The task Given a PCS7 system, create a project to test the communication between stations of the system. Fill out the following table to list your equipment. Some example components have been entered here. Note Your components and network addresses may not be the same as those listed in the table. Find out your setup information data and write them down.
Name of Station MAC address Index/Slot Module/Application/
/Part NUMBER Note
ES_PC 1 WinCC Application 00.80.C7.45.69.52 2 IE general Terminal Bus 08.00.06.01.00.23 3 CP1613 Plant Bus AS1 6ES7 400-1JA01-0AA0 9 slot rack 1 & 2 407-0KA01-0AA0 PS 3 & 4 414-3XJ00-0AB0 CPU 08.00.06.01.00.01 5 443-1EX11-0XE0 CP
Table 3.2: Listing components for station configuration
Note By the end of the exercise, you should have a working project that makes your stations talk to each other. A successful communication in your setup will allow you to follow the exercises and lab projects arranged in the later Chapters and hence to make full use of this hands-on style of the manual. 2. Guideline 1. List your system components by following the Table 3.2. 2. Create a project in SIMATIC Manager. If your AS can be found in the list of ASs
registered with the New Project Wizard, you can use the wizard to create the new project. Often your AS(s) are different from those listed in the New Project wizard and you have to create a project from blank. Refer to Chapter 2.
3. Insert PC station(s) and automation station(s) in the project referring to Picture 3.2. 4. Configure a PC station in HW-Config following the illustration in Picture 3.3. 5. Configure an AS in HW-Config. Refer to Picture 3.26, 3.27, and 3.28. 6. Assign communication connections between WinCC applications and AS in NetPro.
See Picture 3.4. 7. Launch the Commissioning Wizard paying attention to index network modules and
applications. PCS 7 PoT V6.0 | Edition V1.0 | August 2003 Copyright 2003 Siemens AG by A&D AS CS2 PA. All rights reserved.
Page 3 - 29

PCS 7 PoT Chapter 3 PC Stations and Communication
8. Adjust parameters and addresses, etc. in the Configuration Console. Especially match
the index number(s) of network module(s) to that entered in HW-Config. Set the access point to S7ONLINE PC internal (local). See Picture 3.21.
9. Launch the Station Configuration Editor where enter a WinCC application if it was not entered during the Commissioning Wizard run. Match the station name to its name in SIMATIC Manager (HW-Config & NetPro). Refer to Picture 3.22.
10. Refer to Picture 3.23 to check if all the settings are completed. 11. Download your configurations to the PC station(s) and AS(s) of the project in NetPro.
Refer to Picture 3.24.
PCS 7 PoT V6.0 | Edition V1.0 | August 2003 Copyright 2003 Siemens AG by A&D AS CS2 PA. All rights reserved.
Page 3 - 30

Chapter 4:
Creating PCS 7 Projects – Getting Started


Contents:
CHAPTER 4 CREATING PCS 7 PROJECTS - GETTING STARTED ........................2
1. INTRODUCTION......................................................................................................2
2. CREATING A NEW PCS 7 PROJECT ....................................................................2 2.1 GLOBAL SETTINGS ................................................................................................3 2.2 NEW PROJECT WIZARD..........................................................................................4 2.3 HARDWARE CONFIGURATION.................................................................................9
2.3.1 Configuration of automation stations ............................................................9 2.3.2 Configuration of PC stations.......................................................................10
2.4 PLANT HIERARCHY..............................................................................................10 2.4.1 Plant hierarchical folders ............................................................................10 2.4.2 Assignment of the Plant hierarchy..............................................................12 2.4.3 Relationship between the Plant view and Component view .......................13 2.4.4 What are tags and what are variables? ......................................................13 2.4.5 Customising Plant Hierarchy ......................................................................14
2.5 PROGRAMMING WITH CFC ..................................................................................16 2.5.1 The design task – valve control ..................................................................16 2.5.2 Naming block instances..............................................................................17 2.5.3 The valve control chart and basic handling in the CFC ..............................18 2.5.4 Run sequence ............................................................................................20 2.5.5 Compiling and downloading programs .......................................................21 2.5.6 Testing in CFC............................................................................................23
2.6 PROGRAMMING WITH SFC ..................................................................................24 2.6.1 The task – automatic control of the valve ...................................................24 2.6.2 Designing the SFC chart ............................................................................24 2.6.3 Runtime sequence of SFC charts...............................................................27 2.6.4 Testing in SFC............................................................................................27
2.7 BLOCK ICONS AND FACEPLATES ..........................................................................29 2.8 COMPILING OS...................................................................................................30 2.9 OS ENGINEERING ...............................................................................................35
2.9.1 The OS project ...........................................................................................35 2.9.2 Graphics Designer......................................................................................36
2.10 OS RUNTIME ....................................................................................................37
EXERCISE.................................................................................................................39 EXERCISE 4.1 CREATING YOUR FIRST PCS 7 PROJECT..............................................39
1. The tasks .........................................................................................................39 2. Guideline .........................................................................................................39


PCS 7 PoT
Chapter 4 Creating PCS 7 Projects - Getting Started
Chapter 4 Creating PCS 7 Projects - Getting Started 1. Introduction In this chapter, we will use an example to introduce the basics and approach of PCS 7 engineering systems. The example as illustrated in Picture 4.1 is to control a simple valve, i.e. to open or close the valve. The valve controller drives the valve to open or close via a control signal of the Open or the Close. The position of the valve is signaled by limit switches and used as feedback signals for monitoring.
Picture 4.1 Valve control The valve and limit switches are physical devices and the valve controller is a piece of software that issues the command signal (Open/Close) and takes the feedback signals (Open and Close). In this Chapter, we will create a PCS 7 project which contains the design of the valve controller. 2. Creating a new PCS 7 project The procedures in creating a PCS 7 project to realise the valve control are summarised in the following picture, Picture 4.2.
PCS 7 PoT V6.0 | Edition V1.0 | August 2003 Copyright 2003 Siemens AG by A&D AS CS2 PA. All rights reserved.
Page 4 - 2

PCS 7 PoT
Chapter 4 Creating PCS 7 Projects - Getting Started
Global settings of SIMATIC Manager
New function or New project wizard
Configuring Hardware
Block icons and faceplates
Customising Plant hierarchy
Programming with CFC
Programming with SFC
Compiling OS
OS engineering
Download to AS, to OS
AS, OS runtime
Picture 4.2: Key procedures in creating a PCS 7 project
The sequence of the steps illustrated in Picture 4.2 is also important in terms of minimising engineering effort. 2.1 Global settings The SIMATIC Manager is the central place for the PCS7 project engineering tasks. SIMATIC Manager provides three views (the Plant view, Component view, and Process object view) to access project data. Project objects are created, copied, moved, and edited, etc. in the SIMATIC Manager environment.
PCS 7 PoT V6.0 | Edition V1.0 | August 2003 Copyright 2003 Siemens AG by A&D AS CS2 PA. All rights reserved.
Page 4 - 3

PCS 7 PoT
Chapter 4 Creating PCS 7 Projects - Getting Started
After opening the SIMATIC Manager, the very first step in creating a project is to complete global settings for the environment. Those settings are discussed in “Chapter 3, Global settings of SIMATIC Manager”.
2.2 New project wizard You can create a new project using the New function as we did in Chapter 3. In this chapter we will use the ‘New project’ wizard to create our project. The wizard is called up via the menu path, SIMATIC Manager > File > ‘New project’ wizard. To proceed with the wizard you will be required to make necessary selections. See Picture 4.3.
Picture 4.3: A single or multiproject You can select to create a single project or multiproject. A multiproject contains one or more single project(s). You can include (or add) single projects into a multiproject after a multiproject has been created. You can also remove single projects from a multiproject.
PCS 7 PoT V6.0 | Edition V1.0 | August 2003 Copyright 2003 Siemens AG by A&D AS CS2 PA. All rights reserved.
Page 4 - 4

PCS 7 PoT
Chapter 4 Creating PCS 7 Projects - Getting Started
Picture 4.4: Inserting automation station Note By default, the New Project wizard uses the UR2 rack (9 slots) and provides a collection of limited CPUs. If your hardware components are different from those provided by the Wizard, you could pick up a nearest CPU from the list and change it later in the Hardware configuration. Proceeding with the wizard, you arrive at the dialog page where you will include project objects into a project. Refer to Picture 4.5.
Picture 4.5: Inserting objects PCS 7 PoT V6.0 | Edition V1.0 | August 2003 Copyright 2003 Siemens AG by A&D AS CS2 PA. All rights reserved.
Page 4 - 5

PCS 7 PoT
Chapter 4 Creating PCS 7 Projects - Getting Started
In Picture 4.5 you can see three types of objects. • Plant hierarchy. A real plant comprises of various parts. They are classified into 5
categories namely Plant, Unit, Function, Device, and Element in PCS 7. These are also the 5 levels of PCS7 hierarchy. By representing and arranging a plant in hierarchical levels you have a hierarchical view of the plant. Maximum 5 levels of the Plant hierarchy can be specified.
• AS objects. Charts (CFC, SFC) and blocks are the objects of an AS. • OS objects. A PCS7 OS project can be a Single-user system, Multi-user system,
or Multi-user system redundant. Normally, the selection is made between Single-user and Multi-user systems. For a Single-user system, the OS project database cannot be shared by other machine. Only one PC station (where the OS project is running) can operate the data. For a multi-user system, Windows Client/Server architecture is used. The OS system provides data for other machines (client operation stations) to share.
In the last page of the New Project wizard, you are required to give a name to the project and specify the location of the new project. Refer to Picture 4.6
Picture 4.6: Project name and location When naming a project, the New project wizard automatically add some suffix. Refer to Picture 4.6 where START_MP is the multiproject, START_Prj a project inserted in the multiproject, and START_Lib a library in the project, which is also called the master data library to distinguishing itself from normal PCS7 project libraries.
After clicking Make, you have the project, START_MP, opening in the Plant and Component views of SIMATIC Manager as shown in Picture 4.7.
PCS 7 PoT V6.0 | Edition V1.0 | August 2003 Copyright 2003 Siemens AG by A&D AS CS2 PA. All rights reserved.
Page 4 - 6

PCS 7 PoT
Chapter 4 Creating PCS 7 Projects - Getting Started
Picture 4.7: A newly created project The objects inserted by the wizard have their default names. It is a good practice to re-name objects meaningfully. Compared to Picture 4.7, note the changes of object names in Picture 4.8. Note When creating a new project, you have to option to set the message range. When the Set Message Range window pops up, select Always assign unique message numbers for CPU.
PCS 7 PoT V6.0 | Edition V1.0 | August 2003 Copyright 2003 Siemens AG by A&D AS CS2 PA. All rights reserved.
Page 4 - 7

PCS 7 PoT
Chapter 4 Creating PCS 7 Projects - Getting Started
Picture 4.8: Names of objects For some objects, their names have to be specific. For example, a SIMATIC PC station should have the exact name of the PC, the identification name used in the local area network. It is recommended to at least name the following object meaningfully.
SIMATIC PC Station(1) -> (match the PC’s identification name) CARDIFF • • • • • • • • • • •
SIMATIC 400(1) -> AS1 S7 Program(1) -> Prog1 Process cell(1) -> Plant1 Unit(1) -> Unit1 Function(1) -> Valve1 CFC(1) -> val (picture under the Valve1 folder) -> Valve1 (picture under the Unit1 folder) -> Unit1 (picture under the Plant1 folder) -> Plant1 OS(?) -> OS(1)
PCS 7 PoT V6.0 | Edition V1.0 | August 2003 Copyright 2003 Siemens AG by A&D AS CS2 PA. All rights reserved.
Page 4 - 8

PCS 7 PoT
Chapter 4 Creating PCS 7 Projects - Getting Started
2.3 Hardware configuration 2.3.1 Configuration of automation stations Automation stations are configured in the HW-Config editor. Note Details about hardware configuration are given in Chapter 3. Using the New project wizard, some hardware components have already been inserted as shown in Picture 4.9. Arriving in the HW-Config interface, you can edit components according to your physical setup. An Industrial Ethernet card, CP443-1 is added to the station, AS1.
Picture 4.9: Arriving at the HW-Config and editing components
PCS 7 PoT V6.0 | Edition V1.0 | August 2003 Copyright 2003 Siemens AG by A&D AS CS2 PA. All rights reserved.
Page 4 - 9

PCS 7 PoT
Chapter 4 Creating PCS 7 Projects - Getting Started
Note For details of automation station configuration, refer to Chapter 3, Configuration of automation stations. The chapter also includes the details of your setup, e.g. network addresses and part numbers, etc. Save and compile your automation station, Download the configuration to the physical AS1. 2.3.2 Configuration of PC stations Here you need to configure the PC station, CARDIFF in your project. In Chapter 2, you have used the same machine as a SIMATIC PC station. Therefore, follow the instructions shown in Picture 4.23 to configure the machine. 2.4 Plant hierarchy 2.4.1 Plant hierarchical folders To insert hierarchy folders in the Plant View, right click by a project or a hierarchical folder on the left-part window of the Plant view and then follow the illustration on Picture 4.10.
PCS 7 PoT V6.0 | Edition V1.0 | August 2003 Copyright 2003 Siemens AG by A&D AS CS2 PA. All rights reserved.
Page 4 - 10

PCS 7 PoT
Chapter 4 Creating PCS 7 Projects - Getting Started
Picture 4.10: Inserting hierarchical folders
In the START_Prj project, three levels of hierarchical folders have been inserted by the New project wizard. You could rename the folders to reflect your application. For the valve control (Picture 4.1) the folders’ names, charts’ names, and a picture name are given as in Picture 4.11.
Picture 4.11: Names of the folders, charts, and picture Note
PCS 7 PoT V6.0 | Edition V1.0 | August 2003 Copyright 2003 Siemens AG by A&D AS CS2 PA. All rights reserved.
Page 4 - 11

PCS 7 PoT
Chapter 4 Creating PCS 7 Projects - Getting Started
When naming folders and charts, be sure that they are accepted by plant users and they are not changed very often. Refer to Section 2.4.4 to know the importance of the naming convention used throughout a project. 2.4.2 Assignment of the Plant hierarchy Plant hierarchies of a project in the Plant view are a logical representation of the project. They have to be assigned to particular controllers and/or operator stations so that the objects they contain can be executed. Normally, one top hierarchical folder (the Plant) with all the sub-folders is assigned to one AS and an OS as shown in Picture 4.12.
Picture 4.12: Assignment of the plant hierarchy to PLC and OS
PCS 7 PoT V6.0 | Edition V1.0 | August 2003 Copyright 2003 Siemens AG by A&D AS CS2 PA. All rights reserved.
Page 4 - 12
PCS 7 PoT
Chapter 4 Creating PCS 7 Projects - Getting Started
The menu path to call up the Hierarchy folder properties window is: Right click on a top folder > Object properties… > AS and OS Assignment tab.
Note Picture 4.12 shows that the top level Plant1 with all its lower-level objects is assigned to one CPU and one OS. 2.4.3 Relationship between the Plant view and Component view CFC and SFC charts inserted in the Plant view will be automatically available in the Components view but not vice verse. It is recommended to insert charts only in the Plant view but not in the Component view. Pictures inserted in the Plant view will be available in the PCS 7 OS for further graphics design. While, pictures created in the PCS 7 OS will not be available in the SIMATIC Manager. You can also insert charts and pictures in the Process object view. You should include empty pictures (one picture per hierarchical level) in your project so that you could use them later in the Graphics Designer. 2.4.4 What are tags and what are variables? In control engineering, piping and Instrumentation (P & I) diagrams are widely used where notations are defined. In Picture 4.13, the level controller is called LIC1005 and the tank called B190. LIC1005 and B190 are referred to as tags. The controller, LIC1005, has variables, e.g. the setpoint (34.0%) and the measured process value (36.7%). The setpoint (SP) and the process value (PV) are variables. If we want to indicate that SP and PV belong to the controller LIC1005 and LIC1005 is allocated to B190, we could name them as “B190/LIC1005.SP” and “B190/LIC1005.PV”.
PCS 7 PoT V6.0 | Edition V1.0 | August 2003 Copyright 2003 Siemens AG by A&D AS CS2 PA. All rights reserved.
Page 4 - 13

PCS 7 PoT
Chapter 4 Creating PCS 7 Projects - Getting Started
Screen or P & I diagram
a level controller called LIC1005a tank called B190
Picture 4.13: Tags and variables
The tag name B190 could be used as one hierarchy folder’s name if the folder name is taken into account as a path indication of a variable. In the next section, we show how to use folders’ names to indicate a variable. 2.4.5 Customising Plant Hierarchy The hierarchical folders’ names could be inherited by a tag and/or by a picture if configured so. It is important to define how tags and variables are identified and how pictures are displayed in a PCS 7 project. This is done by customising the Plant Hierarchy. To open the Customise Plant Hierarchy dialog as the one shown in Picture 4.14, proceed as: (in the Plant View) right click on the top hierarchic level > Plant Hierarchy > Settings…
PCS 7 PoT V6.0 | Edition V1.0 | August 2003 Copyright 2003 Siemens AG by A&D AS CS2 PA. All rights reserved.
Page 4 - 14

PCS 7 PoT
Chapter 4 Creating PCS 7 Projects - Getting Started
Picture 4.14: Customising Plant Hierarchy In Picture 4.14: • Include in destination: the folder name will be part of a tag name if you tick the
box. As selected in Picture 4.13, a tag will be Plant1/Unit1/Valve1/… because all three levels have been used for tag designation.
• Maximum number of characters: maximum number of characters allowed in a folder name. The length of a PCS7-tag name is limited to 32 characters including separators. (A tag name is further limited to 26 if a trend window is to be inserted in a faceplate.) So, the number of characters allowed for each level is limited. If the number is reached then SIMATIC Manager displays a warning message.
• OS area: There are 16 areas (up to 64 areas can be configured on the PCS 7 OS) on a default PCS 7 OS screen. PCS 7 screens/pictures are arranged in a tree structure, which are all rooted from the areas. The OS area is where the picture hierarchy starts. You could build the picture trees in the PCS 7 OS with the Picture Tree Manager. Alternatively, the picture hierarchy of a project is formed according to the project plant hierarchy if you tick “Base picture hierarchy on the plant hierarchy. Compare Picture 4.14 and Picture 4.15.
PCS 7 PoT V6.0 | Edition V1.0 | August 2003 Copyright 2003 Siemens AG by A&D AS CS2 PA. All rights reserved.
Page 4 - 15

PCS 7 PoT
Chapter 4 Creating PCS 7 Projects - Getting Started
Picture 4.15: Screen/picture hierarchy and Plant hierarchy 2.5 Programming with CFC 2.5.1 The design task – valve control The valve control described in Picture 4.1 is to be designed with CFC. In SIMATIC Manger, double-click the empty chart, val, to open the CFC editor where you start to design the chart.
PCS 7 PoT V6.0 | Edition V1.0 | August 2003 Copyright 2003 Siemens AG by A&D AS CS2 PA. All rights reserved.
Page 4 - 16

PCS 7 PoT
Chapter 4 Creating PCS 7 Projects - Getting Started
Picture 4.16: Using available library function blocks
2.5.2 Naming block instances After placing the valve controller FB73 onto the val chart, you should change the default block instance’ name from number (e.g. 1, 2, or 3, …) to more meaningful name such as VALVE. See Picture 4.17.
PCS 7 PoT V6.0 | Edition V1.0 | August 2003 Copyright 2003 Siemens AG by A&D AS CS2 PA. All rights reserved.
Page 4 - 17
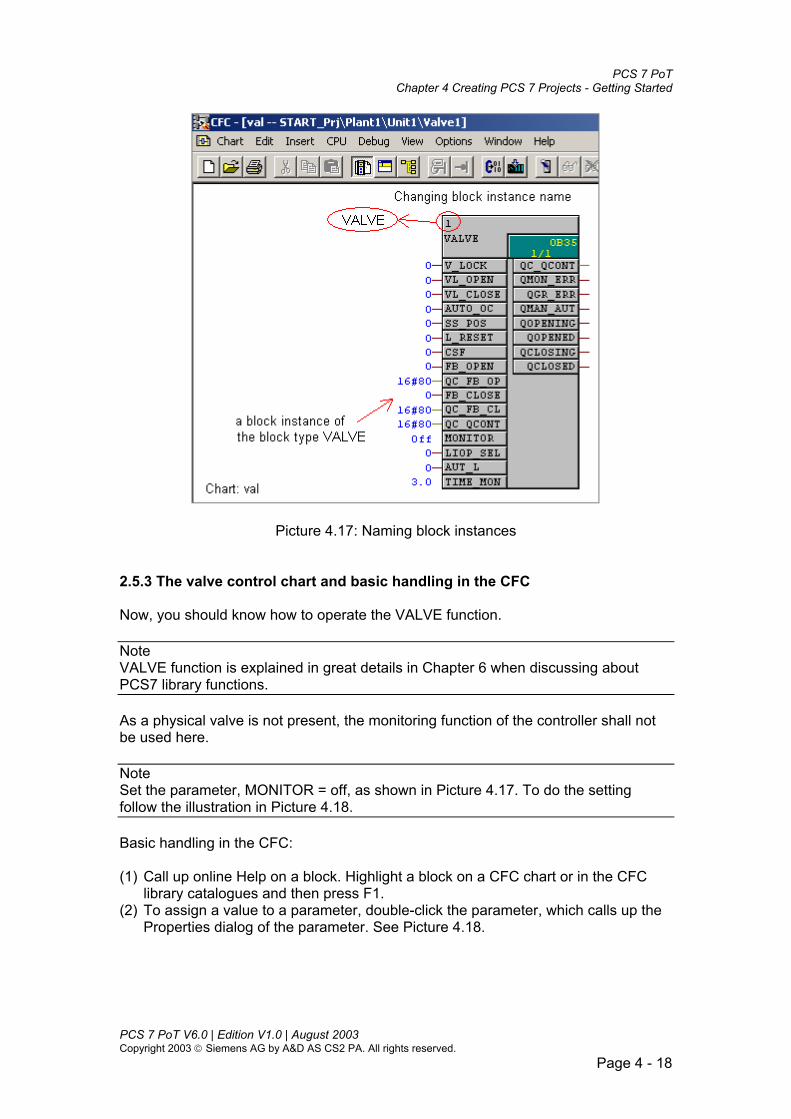
PCS 7 PoT
Chapter 4 Creating PCS 7 Projects - Getting Started
Picture 4.17: Naming block instances 2.5.3 The valve control chart and basic handling in the CFC Now, you should know how to operate the VALVE function. Note VALVE function is explained in great details in Chapter 6 when discussing about PCS7 library functions. As a physical valve is not present, the monitoring function of the controller shall not be used here. Note Set the parameter, MONITOR = off, as shown in Picture 4.17. To do the setting follow the illustration in Picture 4.18. Basic handling in the CFC: (1) Call up online Help on a block. Highlight a block on a CFC chart or in the CFC
library catalogues and then press F1. (2) To assign a value to a parameter, double-click the parameter, which calls up the
Properties dialog of the parameter. See Picture 4.18.
PCS 7 PoT V6.0 | Edition V1.0 | August 2003 Copyright 2003 Siemens AG by A&D AS CS2 PA. All rights reserved.
Page 4 - 18

PCS 7 PoT
Chapter 4 Creating PCS 7 Projects - Getting Started
Picture 4.18: Value of parameter (3) Some parameters are not displayed by default but you can find all the parameters
of a block by calling up the Properties dialog of the block. See Picture 4.19. The inputs, MAN_OC and AUT_ON_OP are checked under “Invisible”. So, the two inputs cannot be seen on CFC. To make them displayed, un-check the boxes.
Picture 4.19: All inputs/outputs of a block
PCS 7 PoT V6.0 | Edition V1.0 | August 2003 Copyright 2003 Siemens AG by A&D AS CS2 PA. All rights reserved.
Page 4 - 19
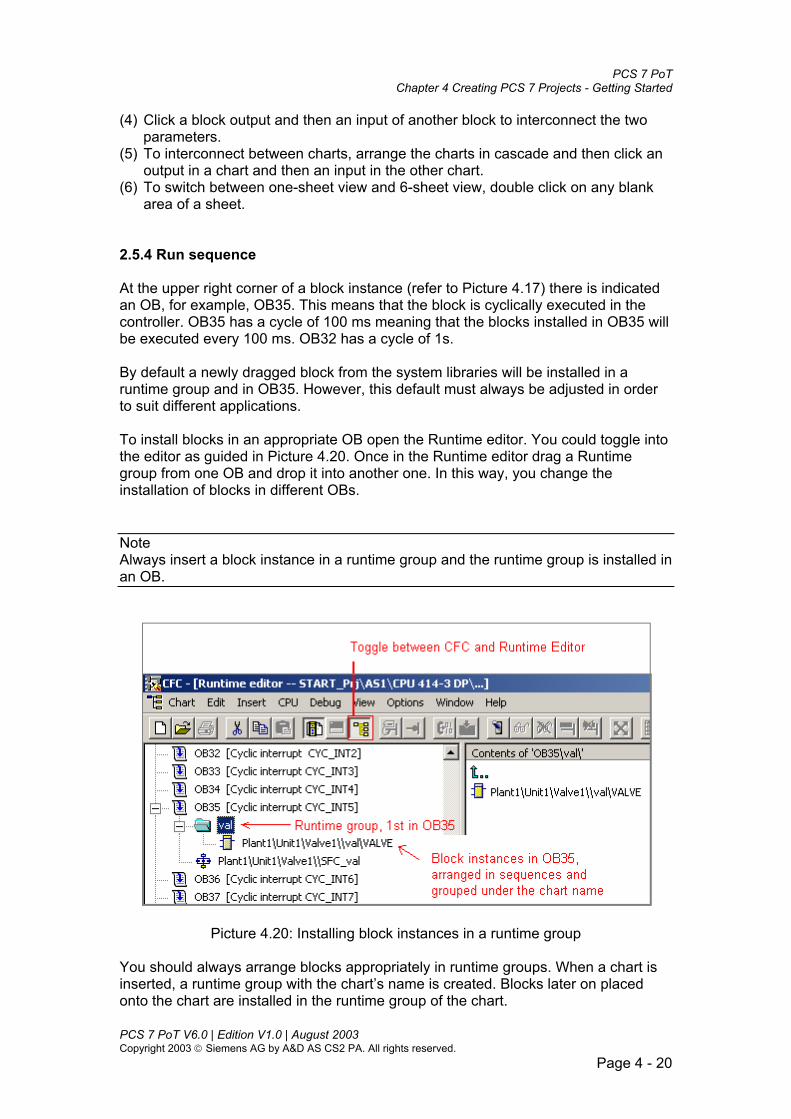
PCS 7 PoT
Chapter 4 Creating PCS 7 Projects - Getting Started
(4) Click a block output and then an input of another block to interconnect the two parameters.
(5) To interconnect between charts, arrange the charts in cascade and then click an output in a chart and then an input in the other chart.
(6) To switch between one-sheet view and 6-sheet view, double click on any blank area of a sheet.
2.5.4 Run sequence At the upper right corner of a block instance (refer to Picture 4.17) there is indicated an OB, for example, OB35. This means that the block is cyclically executed in the controller. OB35 has a cycle of 100 ms meaning that the blocks installed in OB35 will be executed every 100 ms. OB32 has a cycle of 1s. By default a newly dragged block from the system libraries will be installed in a runtime group and in OB35. However, this default must always be adjusted in order to suit different applications. To install blocks in an appropriate OB open the Runtime editor. You could toggle into the editor as guided in Picture 4.20. Once in the Runtime editor drag a Runtime group from one OB and drop it into another one. In this way, you change the installation of blocks in different OBs. Note Always insert a block instance in a runtime group and the runtime group is installed in an OB.
Picture 4.20: Installing block instances in a runtime group You should always arrange blocks appropriately in runtime groups. When a chart is inserted, a runtime group with the chart’s name is created. Blocks later on placed onto the chart are installed in the runtime group of the chart.
PCS 7 PoT V6.0 | Edition V1.0 | August 2003 Copyright 2003 Siemens AG by A&D AS CS2 PA. All rights reserved.
Page 4 - 20

PCS 7 PoT
Chapter 4 Creating PCS 7 Projects - Getting Started
The runtime properties are indicated clearly on a block in CFC. Refer to Picture 4.21 and compared it with Picture 4.20.
Picture 4.21: Runtime properties of a block instance 2.5.5 Compiling and downloading programs To compile programs, follow the menu path: Chart > Compile > Charts as Program. Entire program compiling is normally required. Refer to Picture 4.22.
Picture 4.22: Compiling CFC charts (1) Update sampling time Some blocks are time-dependent. They have a parameter called sampling time denoted by SAMPLE_T. The value of sampling time should be set equal to the cycle
PCS 7 PoT V6.0 | Edition V1.0 | August 2003 Copyright 2003 Siemens AG by A&D AS CS2 PA. All rights reserved.
Page 4 - 21

PCS 7 PoT
Chapter 4 Creating PCS 7 Projects - Getting Started
time (the corresponding OB scan) of the OB where the block is installed. The option “Update sampling time” automatically adjust sampling time to OB time as a block with sampling time could be moved to a different OB. (2) Delete empty runtime groups During design, blocks on a CFC chart could be deleted leaving the chart runtime group empty. You can delete these empty groups during compilation by ticking the box. (3) Make textual connections When this option is set, all textual interconnections for which the referenced interconnection partner exists will be closed prior to compilation, i.e. they are converted into real interconnections. Substitute values will be generated if this option is not set or if textual interconnections cannot be closed, i.e. the default parameter value of the block type will be used. Note To know more about textual interconnections refer to Chapter 6, textual interconnections. To download programs to a CPU, follow the menu path in CFC: CPU > Download. You may be asked to select the Entire program downloading or Changes only downloading. Refer to Picture 4.23.
PCS 7 PoT V6.0 | Edition V1.0 | August 2003 Copyright 2003 Siemens AG by A&D AS CS2 PA. All rights reserved.
Page 4 - 22

PCS 7 PoT
Chapter 4 Creating PCS 7 Projects - Getting Started
Picture 4.23: Downloading program to PLC Use Entire program download when it is a first download or the program has gone through substantial changes. Entire program download will stop CPU, which is not allowed in some circumstances. Note You will learn more about CPU robustness regarding Entire program download or Changes only download in Chapter 7. 2.5.6 Testing in CFC To test your program, follow the menu path: Debug > Test Mode. You can monitor I/O values by adding them into Watch List. Then, the values are highlighted in yellow. Right click on an I/O and then “add I/O to Watch List. To change a value online, double click an input, e.g. AUTO_OC. The I/O Properties dialog will open and you can set a new value for the variable. See Picture 4.24. Note To operate the valve in the CFC Test Mode you set and reset AUTO_OC. To be able to operate the valve, you need to enable the use of AUTO_OC by setting LIOP_SEL and AUT_L both to be “True”. The library function VALVE is explained in details in Chapter 6.
PCS 7 PoT V6.0 | Edition V1.0 | August 2003 Copyright 2003 Siemens AG by A&D AS CS2 PA. All rights reserved.
Page 4 - 23

PCS 7 PoT
Chapter 4 Creating PCS 7 Projects - Getting Started
Picture 4.24: Testing of program in CFC 2.6 Programming with SFC 2.6.1 The task – automatic control of the valve Design a SFC program to automatically open the valve if there is no fault and close it afterwards. 2.6.2 Designing the SFC chart Open the SFC editor by double-clicking a SFC chart. Then, you could use various chart topologies to build a SFC program by adding Steps and Transitions. Refer to Picture 4.25.
PCS 7 PoT V6.0 | Edition V1.0 | August 2003 Copyright 2003 Siemens AG by A&D AS CS2 PA. All rights reserved.
Page 4 - 24

PCS 7 PoT
Chapter 4 Creating PCS 7 Projects - Getting Started
Picture 4.25: Designing a chart in SFC To open the valve, you have to open the Properties dialog of a step and set AUTO_OC = 1 there. Follow the illustration as shown in Picture 4.26.
PCS 7 PoT V6.0 | Edition V1.0 | August 2003 Copyright 2003 Siemens AG by A&D AS CS2 PA. All rights reserved.
Page 4 - 25

PCS 7 PoT
Chapter 4 Creating PCS 7 Projects - Getting Started
Picture 4.26: Browsing of variables of the program in SFC To set a condition in a transition, for example when there is no CSF fault, double click the transition, No CSF Error (Picture 4.26), to open its Properties dialog. Then, browse to find the variable, CSF, and set it to 0, which means when there is no CSF fault the valve is going to Open step. To complete the SFC design, Steps and Transitions in Picture 4.26 should be set as the followings.
Step or transition Variable value
START (initialisation) LIOP_SEL =1 and AUT_L =1
No CSF Error CSF = 0
Open (Processing) AUT_OC =1, Set the Step minimum run time as 5s.
Opened QOPENED = 1
Close (Processing) AUTO_OC = 0
Closed QCLOSED =1
END (Processing) AUTO_OC = 0 and LIOP_SEL =0 and AUT_L =1
Table 2.1: Formulating Steps and Transitions for the valve control
PCS 7 PoT V6.0 | Edition V1.0 | August 2003 Copyright 2003 Siemens AG by A&D AS CS2 PA. All rights reserved.
Page 4 - 26

PCS 7 PoT
Chapter 4 Creating PCS 7 Projects - Getting Started
2.6.3 Runtime sequence of SFC charts You can check where a SFC chart is installed in an OB in the runtime editor. If not appropriate, you can move the chart to where the scan rate is right. By default, a SFC is installed in OB35. After arranging runtime sequences, compile and download the program in SFC Editor. 2.6.4 Testing in SFC To execute a SFC chart, follow the menu path: Debug > Test Mode and the chart is in runtime as shown in Picture 4.28.
Picture 4.27: Testing in SFC You can check a Transition in runtime by double-click the Transition. See Picture 4.28.
PCS 7 PoT V6.0 | Edition V1.0 | August 2003 Copyright 2003 Siemens AG by A&D AS CS2 PA. All rights reserved.
Page 4 - 27

PCS 7 PoT
Chapter 4 Creating PCS 7 Projects - Getting Started
Picture 4.28: Transitions in runtime The current process value is listed in the first column, which can be set manually. The condition value is listed in the far-right column, which can also be changed in runtime providing a good tool to debug programs. For the Steps, an online debug interface is also available as illustrated in Picture 4.29 and 2.30 where, e.g. you can set running time and change Process value or Forced value.
PCS 7 PoT V6.0 | Edition V1.0 | August 2003 Copyright 2003 Siemens AG by A&D AS CS2 PA. All rights reserved.
Page 4 - 28

PCS 7 PoT
Chapter 4 Creating PCS 7 Projects - Getting Started
Picture 4.29: Setting running time for a step in runtime
Picture 4.30: Runtime values in a Step 2.7 Block icons and faceplates The VALVE block has a graphic interface where operating statuses are displayed and manipulated. The block can be firstly linked with its icon (or referred as block symbol) and then to its faceplate by double-clicking the icon in runtime. The block PCS 7 PoT V6.0 | Edition V1.0 | August 2003 Copyright 2003 Siemens AG by A&D AS CS2 PA. All rights reserved.
Page 4 - 29

PCS 7 PoT
Chapter 4 Creating PCS 7 Projects - Getting Started
icon and faceplate can be seen in Picture 4.33. Links between a block in CFC and its icon in a picture can be automatically generated by using the system functions. Refer to the instruction shown in Picture 4.31.
Picture 4.31: Deriving Block icons from the plant hierarchy 2.8 Compiling OS Project data created in the SIMATIC Manager are available for PCS 7 OS. The Compiling OS function makes the relevant data accessible from in PCS7 OS. An OS project is further handled in the PCS 7 OS interface after engineering in CFC and SFC. To call up the OS compiling function, follow the menu path: SIMATIC Manager > Options > OS > Compile.
PCS 7 PoT V6.0 | Edition V1.0 | August 2003 Copyright 2003 Siemens AG by A&D AS CS2 PA. All rights reserved.
Page 4 - 30

PCS 7 PoT
Chapter 4 Creating PCS 7 Projects - Getting Started
After the first introduction page of the OS compile wizard, the page where you need to specify which S7 programs are assigned to which OS projects is followed. See Picture 4.32 where one S7 program. Prog1 is associated with one OS project, OS(1).
Picture 4.32: Selecting S7 programs and operator stations Communication connection between S7 program and OS project has also to be specified, which is illustrated in Picture 4.33.
PCS 7 PoT V6.0 | Edition V1.0 | August 2003 Copyright 2003 Siemens AG by A&D AS CS2 PA. All rights reserved.
Page 4 - 31

PCS 7 PoT
Chapter 4 Creating PCS 7 Projects - Getting Started
Picture 4.33: Communication between S7 program and OS project
From Picture 4.33, it can be observed that possible connections between a S7 program and an OS are configured in the NETPRO. In the last page of the Compile wizard the data sets and compilation scope are specified. See Picture 4.34.
PCS 7 PoT V6.0 | Edition V1.0 | August 2003 Copyright 2003 Siemens AG by A&D AS CS2 PA. All rights reserved.
Page 4 - 32

PCS 7 PoT
Chapter 4 Creating PCS 7 Projects - Getting Started
Picture 4.34: Compiling OS data If the Picture Tree is selected, pictures on OS will be overwritten by the pictures inserted in the Plant View. The appearance of the pictures will be based on the Plant hierarchy. If the Create/update block icons is selected, the pictures defined as in Picture 4.31 will be automatically inserted/updated with the block icons. Continue with OS compile wizard. See Picture 4.37.
PCS 7 PoT V6.0 | Edition V1.0 | August 2003 Copyright 2003 Siemens AG by A&D AS CS2 PA. All rights reserved.
Page 4 - 33

PCS 7 PoT
Chapter 4 Creating PCS 7 Projects - Getting Started
Picture 4.35: Continuing OS compiling
Picture 4.36: Compiling OS
PCS 7 PoT V6.0 | Edition V1.0 | August 2003 Copyright 2003 Siemens AG by A&D AS CS2 PA. All rights reserved.
Page 4 - 34

PCS 7 PoT
Chapter 4 Creating PCS 7 Projects - Getting Started
2.9 OS engineering 2.9.1 The OS project To open the OS part of the START project, follow the menu path: right-click the OS object in the Component View > Open Object. The OS project will be opened in PCS 7 OS. Refer to Picture 4.39.
Picture 4.37: OS editors and system pictures At the left part of the window, OS editors are listed, e.g. the Graphic Designer editor, Tag Logging editor, etc. At the right part of the window, pictures that are created for the project are listed. The systems pictures begin with symbol, @ and are created by compiling OS. Plant pictures (Plant1.Pdl, Unit1.Pdl, and Valve1.Pdl) are those inserted in the SIMATIC Manager Plant View. Variables that are to be monitored or manipulated and designed so in CFC are available in PCS 7 OS Tag Management. See to Picture 4.38.
PCS 7 PoT V6.0 | Edition V1.0 | August 2003 Copyright 2003 Siemens AG by A&D AS CS2 PA. All rights reserved.
Page 4 - 35

PCS 7 PoT
Chapter 4 Creating PCS 7 Projects - Getting Started
Picture 4.38: The Tag Management of PCS 7 OS 2.9.2 Graphics Designer To open the picture, Valve1, double-click it. The picture then opens in Graphic Designer as shown in Picture 4.41. Some design work (two block icons, one is the VALVE icon and the other SFC_val icon) has already been done in the picture by “Create/update block icons” function.
PCS 7 PoT V6.0 | Edition V1.0 | August 2003 Copyright 2003 Siemens AG by A&D AS CS2 PA. All rights reserved.
Page 4 - 36
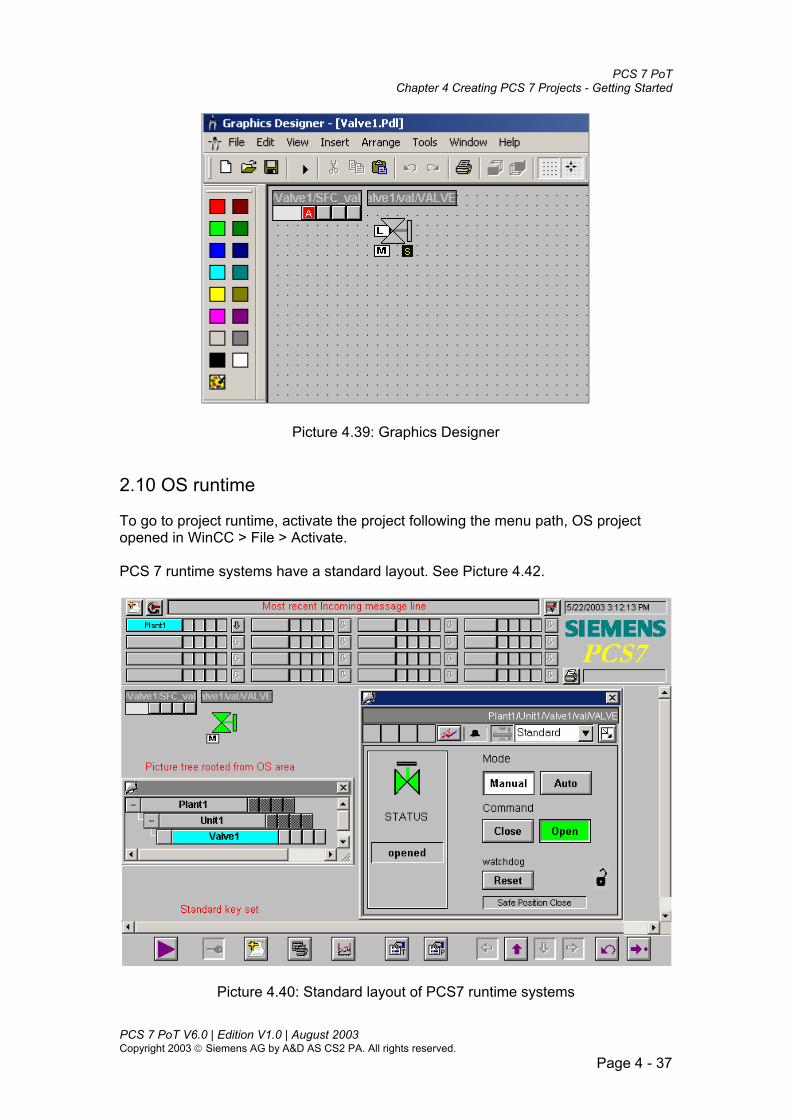
PCS 7 PoT
Chapter 4 Creating PCS 7 Projects - Getting Started
Picture 4.39: Graphics Designer 2.10 OS runtime To go to project runtime, activate the project following the menu path, OS project opened in WinCC > File > Activate. PCS 7 runtime systems have a standard layout. See Picture 4.42.
Picture 4.40: Standard layout of PCS7 runtime systems
PCS 7 PoT V6.0 | Edition V1.0 | August 2003 Copyright 2003 Siemens AG by A&D AS CS2 PA. All rights reserved.
Page 4 - 37

PCS 7 PoT
Chapter 4 Creating PCS 7 Projects - Getting Started
The most recent incoming message with higher priority is displayed at the top line. Double-clicking the VALVE icon opens the VALVE faceplate where the valve is operated. If you double-click the SFC icon, the SFC faceplate will be called up where operating details are displayed and action can take place. There are 16 overview areas derived from the Plant hierarchy where these areas are defined. The Picture hierarchy (a little window displayed on the Working space) is also derived from the Plant hierarchy. The use of the Plant hierarchy requires that operator interfaces or screens be planned and designed when designing programming functions. At the bottom of the OS runtime system, the standard keys for navigation action are located.
PCS 7 PoT V6.0 | Edition V1.0 | August 2003 Copyright 2003 Siemens AG by A&D AS CS2 PA. All rights reserved.
Page 4 - 38

PCS 7 PoT
Chapter 4 Creating PCS 7 Projects - Getting Started
Exercise Exercise 4.1 Creating your first PCS 7 project 1. The tasks Design a valve control chart in CFC to include the VALVE block. Refer to Picture 4.23. Design a SFC chart to automatically open and close the valve. Refer to Picture 4.31. Design a picture with the VALVE block icon and SFC icon. Refer to Picture 4.49. 2. Guideline 1. Create a project using the New Project wizard. 2. Determine the runtime sequences of the blocks. 3. Compile the project in CFC or SFC. 4. Download the project. 5. Test the program in CFC and SFC. 6. Transfer the project from the SIMATIC Manager to PCS 7 OS. 7. Design a picture. 8. Test the project in the OS runtime system. Use the faceplate to operate the valve.
PCS 7 PoT V6.0 | Edition V1.0 | August 2003 Copyright 2003 Siemens AG by A&D AS CS2 PA. All rights reserved.
Page 4 - 39

Chapter 5:
Automation Station


Contents: CHAPTER 5 AUTOMATION STATION ...........................................................................................5
1. HARDWARE CONFIGURATION – FIRST STEPS .....................................................................5
1.1 BASIC PROCEDURE IN CONFIGURING HARDWARE COMPONENTS ......................................................5 1.2 INSTRUCTION STEPS.........................................................................................................................6
2. AUTOMATION SYSTEMS S7-400..................................................................................................8
2.1 S7-400 CPU DESIGN .......................................................................................................................9 2.1.1 Mode selector switch ...............................................................................................................9 2.1.2 Restart mode switch...............................................................................................................10 2.1.3 CPU startup characteristics ..................................................................................................10 2.1.4 External battery .....................................................................................................................14 2.1.5 MPI interface.........................................................................................................................14 2.1.6 PROFIBUS-DP interface.......................................................................................................14 2.1.7 Memory cards ........................................................................................................................14
2.2 CPU MEMORIES ............................................................................................................................15 2.2.1 Memory areas ........................................................................................................................15 2.2.2 Retentive memory of S7 – 400 CPUs .....................................................................................16
2.3 CPU COMMUNICATIONS................................................................................................................17 2.4 CPU SOFTWARE STRUCTURE.........................................................................................................18 2.5 ORGANISATION BLOCKS ................................................................................................................19 2.6 SYSTEM DIAGNOSTICS ...................................................................................................................20 2.7 SETTINGS OF CPU PROPERTIES .....................................................................................................22
3. PROFIBUS........................................................................................................................................23
3.1 BRIEF INTRODUCTION....................................................................................................................23 3.2 PROFIBUS BASICS.......................................................................................................................24
3.2.1 PROFIBUS-DP Transmission Technology............................................................................24 3.2.2 Installation Instructions for PROFIBUS-DP.........................................................................25 3.2.3 PROFIBUS-PA Transmission Technology ............................................................................27 3.2.4 Installation Instructions for PROFIBUS-PA .........................................................................27
3.3 PROFIBUS MEDIUM ACCESS PROTOCOL.....................................................................................28 3.4 PROFIBUS-DP COMMUNICATION PROFILE .................................................................................29
3.4.1 Speed......................................................................................................................................29 3.4.2 Diagnostic functions ..............................................................................................................30 3.4.3 System Configuration and Types of Devices..........................................................................30 3.4.4 Sync and Freeze Mode...........................................................................................................31
3.5 DEVICE ENGINEERING, GSE, DD FILES.........................................................................................31 3.5.1 GSE files ................................................................................................................................32 3.5.2 Identification number ............................................................................................................33 3.5.3 Electronic Device Description (EDD)...................................................................................33
3.6 CONFIGURING PROFIBUS DP IN THE HARDWARE CONFIG..........................................................34
4. DISTRIBUTED I/OS........................................................................................................................37
4.1 STRUCTURE AND COMPONENTS OF ET200M.................................................................................38 4.2 IM 153: VARIANTS AND FEATURES ...............................................................................................38 4.3 TIME STAMPING WITH THE IM153-2 .............................................................................................39 4.4 REDUNDANCY WITH THE IM 153-2 ...............................................................................................39 4.5 SIGNAL MODULES..........................................................................................................................40 4.6 CONFIGURING THE DISTRIBUTED I/OS IN PCS 7 ............................................................................40
4.6.1 Configuring............................................................................................................................40 4.6.2 Properties of a signal module................................................................................................43
4.7 PROCESS IMAGE ............................................................................................................................46 4.7.1 What are the process images? ...............................................................................................46 4.7.2 Advantages of the Process Image ..........................................................................................47 4.7.3 Part Process Images (Process-Image Partitions)..................................................................47
4.7.4 Updating partial process images with the system function calls ...........................................48 4.7.5 Updating partial process images with OBs ...........................................................................48 4.7.6 Size of process image.............................................................................................................48 4.7.7 Grouping inputs and outputs .................................................................................................49
4.8 SYMBOLIC NAMES .........................................................................................................................49 4.8.1 Symbolic names in the HW Config and the Symbols table ....................................................49 4.8.2 How to define I/Os in a PCS 7 project...................................................................................50
5. DRIVERS..........................................................................................................................................51
5.1 CHANNEL DRIVER BLOCKS ............................................................................................................52 5.1.1 Use of the channel blocks ......................................................................................................52 5.1.2 Functions of the channel blocks.............................................................................................53 5.1.3 Linking of a driver block to a physical signal........................................................................54
5.2 MODULE DRIVER BLOCKS..............................................................................................................55
6. CPU ROBUSTNESS ........................................................................................................................57
7. CONFIGURATION CHANGES IN RUN MODE (CIR) .............................................................58
7.1 CIR CONCEPT ................................................................................................................................58 7.2 HARDWARE CONFIGURATION WHEN USING CIR ............................................................................59
7.2.1 An example ............................................................................................................................59 7.2.2 Procedure in hardware configuration using CiR ..................................................................65
7.3 PROPERTIES OF CIR OBJECT AND ELEMENT...................................................................................66 7.4 CIR RULES.....................................................................................................................................68
EXERCISE............................................................................................................................................71
EXERCISE 5.1 CONFIGURING I/OS .......................................................................................................71 1. The task.......................................................................................................................................71 2. Guideline ....................................................................................................................................72
EXERCISE 5.2 USING THE HARDWARE DIAGNOSTICS TOOL..................................................................72 EXERCISE 5.3 MESSAGES OF MODULE DRIVER BLOCKS .......................................................................72 EXERCISE 5.4 CONFIGURING HARDWARE USING CIR ..........................................................................72
APPENDICES ......................................................................................................................................73
APPENDIX 1: CPU MEMORY RESET .....................................................................................................73 APPENDIX 2: HARDWARE DIAGNOSIS FROM OS..................................................................................73

PCS 7 PoT Chapter 5 Automation Station
Chapter 5 Automation Station This chapter starts with an introduction to the hardware configuration for a PCS 7 project and then carries on to elaborate many aspects of the hardware configuration using the Hardware Config Tool. Explanation on the principles of S7 CPUs and I/O drivers are also included. 1. Hardware configuration – first steps 1.1 Basic procedure in configuring hardware components An automation station (AS) at least comprises of a rack, power supply and a CPU. Picture 5.1 illustrates an AS. Functions of the components are given in Table 5.1.
Picture 5.1: An S7-400 AS
Components Functions Racks Provide the mechanical and electrical
connections between the S7-400 modules Power Supply Modules (PS = Power Supply)
Convert the line voltage (120/230 VAC or 24 VDC) to the 5VDC and 24 VDC operating voltage required for powering the S7-400.
CPUs Central Processing Units (CPUs)
Execute the user program; communicate with other CPUs, programming devices (PGs), operator panels (OPs), and PROFIBUS-DP field devices.
Table 5.1 Components of S7-400 and their functions
After creating a new project in the SIMATIC Manager, the next step is to configure an automation station. The main steps are outlined in Picture 5.2.
PCS 7 PoT V6.0 | Edition V1.0 | August 2003 Copyright 2003 Siemens AG by A&D AS CS2 PA. All rights reserved.
Page 5 - 5

PCS 7 PoT Chapter 5 Automation Station
Picture 5.2: Basic procedure in configuring hardware
1.2 Instruction steps Step1: In a project Component view, right-click over a project to insert a station following the illustration of Picture 5.3.
Picture 5.3: Inserting SIMATIC 400 Stations Step2: Call up Hardware Config by double clicking on the hardware as shown in Picture 5.4.
PCS 7 PoT V6.0 | Edition V1.0 | August 2003 Copyright 2003 Siemens AG by A&D AS CS2 PA. All rights reserved.
Page 5 - 6

PCS 7 PoT Chapter 5 Automation Station
Picture 5.4: Calling up the Hardware Config Step3: Drag components from Hardware Catalog and drop them in a configuration plan. See Picture 5.5.
Picture 5.5: Configuring hardware by dragging and dropping The hardware catalog is a collection of SIMATIC components. Components are arranged in categories or profiles. The categories of PCS 7_V60 seen in Picture 5.5 covers the main products used for PCS 7 systems. When highlighting a component in the catalogue, a description about the part is displayed at the bottom of the Catalog window.
PCS 7 PoT V6.0 | Edition V1.0 | August 2003 Copyright 2003 Siemens AG by A&D AS CS2 PA. All rights reserved.
Page 5 - 7

PCS 7 PoT Chapter 5 Automation Station
2. Automation Systems S7-400 The automation systems of PCS 7 are selected S7-400 components. S7-400 controllers are modular, fan-free, robust, and capable of a high degree of expansion. S7-400 controllers have comprehensive communication facilities, integral system functions, and connections to the central or distributed I/Os. Almost any automation task can be implemented with a suitable choice of S7-400 automation systems. Table 5.2 shows a part of the components that are used in the PCS 7 systems. A complete range of the components and detailed information can be simply found by exploring the Hardware Catalog under the PCS 7_V60 profile. Note For the latest release of hardware modules used for the PCS 7 systems, refer to the PCS 7 V60 Released Modules Manual.
SIMATIC 400 Modules Parts
Industrial Ethernet CP 443-1 6GK7 443-1EX11-0XE0, V2.0 or higher
CP – 400 PROFIBUS CP 443-5 Extended
6GK7 443-5DX03-0XE0, V5.0 or higher
CPU 414-4H 6ES7 414-4HJ00-0AB0, V3.1 or higher
CPU 417-4H 6ES7 417-4HL01-0AB0, V3.1 or higher CPU 414-3 DP 6ES7 414-3XJ00-0AB0, V3.1 or higher CPU 416-2 DP 6ES7 416-2XK02-0AB0, V3.1 or higher CPU 416-3 DP 6ES7 416-3XL00-0AB0, V3.1 or higher
CPU - 400
CPU 417-4 6ES7 417-4XL00-0AB0, V3.1 or higher
PS 405 10A, 6ES7 405-KR00-0AA0 Redundant PS-400
PS 407 10A, 6ES7 407-KR00-0AA0
PS 405 10A, 6ES7 405-KA01-0AA0
PS 405 20A, 6ES7 405-RA01-0AA0 PS 407 10A, 6ES7 407-KA01-0AA0
PS-400
Standard PS-400
PS 407 20A, 6ES7 407-RA01-0AA0
9 slots, UR2 6ES7 400-1JA00-0AA0 6ES7 400-1JA01-0AA0
18 slots, UR1 6ES7 400-1TA00-0AA0 6ES7 400-1TA01-0AA0
RACK - 400
H system, UR2-H 6ES7 400-2JA00-0AA0
Table 5.2: S7 – 400 modules selected for PCS 7 systems
Note With S7-400 a variety of possible configurations can be chosen for automation tasks. Refer to the Configuring Hardware with STEP 7 manual for the various configurations while bearing in mind that PCS 7 systems use only selected components that are mainly collected in the Hardware Catalog under the profile “PCS 7_V60”.
PCS 7 PoT V6.0 | Edition V1.0 | August 2003 Copyright 2003 Siemens AG by A&D AS CS2 PA. All rights reserved.
Page 5 - 8

PCS 7 PoT Chapter 5 Automation Station
2.1 S7-400 CPU design Picture 5.6 shows the front of a S7-400 CPU.
Picture 5.6: CPUs 41x-2 series 2.1.1 Mode selector switch Using the mode selector switch you can switch a CPU to RUN, RUN-P, or STOP mode or carry out a memory reset. Functions of the positions are listed in Table 5.3.
PCS 7 PoT V6.0 | Edition V1.0 | August 2003 Copyright 2003 Siemens AG by A&D AS CS2 PA. All rights reserved.
Page 5 - 9

PCS 7 PoT Chapter 5 Automation Station
Position Function RUN-P If there is no error and no restriction to startup and the CPU can be switched to
RUN-P mode, the CPU processes the user program or stays idling. I/O accesses are possible. The key cannot be removed in this position. Programs can be • Read out of the CPU with the programming device (CPU -> PG), • Downloaded to the CPU (PG -> CPU).
RUN If there is no error and no restriction to startup and the CPU can be switched to RUN mode, the CPU processes the user program or stays idling. I/O accesses are possible. The key can be removed in this position to prevent unauthorised persons from changing the operating mode. Programs in the CPU can be displayed on the programming device (CPU -> PG).
STOP The CPU does not execute the user program. The outputs are disabled. The key can be removed in this position to prevent unauthorised persons from changing the operating mode. Programs can be • Read out of the CPU with the programming device (CPU -> PG), • Downloaded to the CPU (PG -> CPU).
MRES (Memory reset)
Key position for carrying out a memory reset on the CPU and for a cold restart (Restart is discussed in the next section.).
Table 5.3: Functions of the Mode selector switch
2.1.2 Restart mode switch CRST: When you start the CPU with the mode switch (STOP -> RUN), a complete (“cold”) restart is performed. WRST: When you start the CPU with the mode switch (STOP -> RUN), a warm restart is performed. The CPU requesting the restart type has a status LED and is selectable with the CRST/WRST switch. 2.1.3 CPU startup characteristics A CPU is capable of the following types of startup or restart:
• Hot restart • Warm restart • Cold restart
Note In PCS 7, only Warm restart is supported. The CPU executes a startup after the following events:
After power up • • • • •
After you switch the mode selector from STOP to RUN/RUN-P After a request from a communication function After synchronising in multicomputing mode In an H system after link-up (only on the standby CPU)
You can specify the conditions for starting up your CPU (initialisation values for RUN, startup values for I/O modules) by writing your program for the startup in the
PCS 7 PoT V6.0 | Edition V1.0 | August 2003 Copyright 2003 Siemens AG by A&D AS CS2 PA. All rights reserved.
Page 5 - 10

PCS 7 PoT Chapter 5 Automation Station
organisation blocks (OB100, OB101, or OB102). However, the starting up conditions are set automatically in the PCS 7 systems. On S7-400 CPUs, you can restart manually using the mode selector and the startup type switch (CRST/WRST) if this is permitted by the parameter assignment you made with HW Config as shown in Picture 5.7. A manual restart (warm restart) is by default without specifically assigning parameters.
Picture 5.7: Setting Startup type in HW Config There are no restrictions to the length of the startup program and no time limit since the cycle monitoring is not active. Time-driven or interrupt-driven execution is not possible in the startup program. When a S7-400 CPU is restarted, the remaining cycle is executed, and as default, the process image output table is cleared. You can prevent the process image being cleared if you want the user program to continue with the old values following a restart.
PCS 7 PoT V6.0 | Edition V1.0 | August 2003 Copyright 2003 Siemens AG by A&D AS CS2 PA. All rights reserved.
Page 5 - 11

PCS 7 PoT Chapter 5 Automation Station
In the parameters, you can decide whether the modules in the configuration table are checked to make sure they exist and that the module type matches before the startup. If the module check is activated as it is in Picture 5.7, the CPU will start up if a discrepancy is found between the configuration table and the actual configuration. To make sure that the programmable controller starts up without errors, you can select the following monitoring times in the Startup dialog page. See Picture 5.1.
The maximum permitted time for transferring parameters to the modules • •
•
• • • •
•
• •
• • • •
• •
The maximum permitted time for the modules to signal (Finish message) that they are ready for operation after power up On S7-400 CPUs, the maximum time of an interruption during which a hot restart is permitted. The last option of “Monitoring time for” will become active. Refer to picture 5.7.
(1) Warm restart (OB100) A warm restart is always permitted unless the system has requested a memory reset. A warm restart is the only possible option after:
Memory reset Downloading the user program with the CPU in STOP mode I stack/B stack overflow Warm restart aborted (due to a power outage or changing the mode selector setting) When the interruption before a hot restart exceeds the selected time limit.
A manual warm restart can be triggered by the following:
The mode selector (the CRST/WRST switch - if available - must be set to CRST) The corresponding command on the programming device or by communication functions (if the mode selector is set to RUN or RUN-P)
An automatic warm restart can be triggered following power up in the following situations:
The CPU was not in STOP mode when the power outage occurred. The mode selector is set to RUN or RUN-P. No automatic hot restart is programmed following power up. The CPU was interrupted by a power outage during a warm restart (regardless of the programmed type of restart).
The CRST/WRST switch has no effect on an automatic warm restart. If you operate your CPU without a backup battery, the CPU memory is automatically reset and a warm restart executed after the power is turned on or when power returns following a power outage. The user program must be located on a flash EPROM (memory card). Assuming that the CPU is battery backed, a warm restart means the following:
All data blocks and their contents are retained Retentive timers, counters, and bit memory are retained; non-retentive data
PCS 7 PoT V6.0 | Edition V1.0 | August 2003 Copyright 2003 Siemens AG by A&D AS CS2 PA. All rights reserved.
Page 5 - 12

PCS 7 PoT Chapter 5 Automation Station
are reset.
During a warm restart, the process-image-input table is read in and the STEP 7-user program processed starting with the first statement in OB1. (2) Hot restart (OB101) Following a power outage in RUN mode followed by a return of power, S7-400 CPUs run through an initialisation routine and then automatically execute a hot restart. During a hot restart, the user program is resumed at the point at which its execution was interrupted. The section of user program that had not been executed before the power outage is known as the remaining cycle. The remaining cycle can also contain time-driven and interrupt driven program sections. A hot restart is only permitted when the user program was not modified in STOP mode (for example, by reloading a modified block) and when there are no other reasons for a warm restart. Both a manual and automatic hot restart are possible. A manual hot restart is only possible with the appropriate parameter settings in the parameter set of the CPU and when the STOP resulted from the following causes:
The mode selector was changed from RUN to STOP. • • •
• •
• • •
User-programmed STOPs, STOPs after calling OBs that are not loaded. The STOP mode was the result of a command from the programming device or a communication function.
A manual hot restart can be triggered by the following:
The CRST/WRST must be set to WRST. When a manual hot restart is set in the Properties of the CPU. Refer to Picture 5.7.
An automatic hot restart can be triggered following power up in the following situations:
The CPU was not in STOP or HOLD mode when the power outage occurred. The mode selector is set to RUN or RUN-P. Automatic hot restart following power up is set in the Properties of the CPU.
The CRST/WRST switch has no effect on an automatic hot restart. All data areas (timers, counters, bit memory, data blocks) and their contents are retained provided that the CPU is backed up. In a restart the process-image input table is read in and the STEP 7 user program processing is restarted at the point where it was interrupted by the last stop (STOP, power off). (3) Cold restart (OB102) A cold restart first processes the organisation block OB102. The following applies to the “cold restart” startup mode:
PCS 7 PoT V6.0 | Edition V1.0 | August 2003 Copyright 2003 Siemens AG by A&D AS CS2 PA. All rights reserved.
Page 5 - 13

PCS 7 PoT Chapter 5 Automation Station
Data blocks generated by system functions are deleted in the work memory and the remaining data blocks have the preset value from the load memory The process image and all timers, counters, and bit memory are reset – regardless of whether they have been configured as retentive. 2.1.4 External battery Additional external battery voltage supply (DC 5 to 15 V) to back up the RAM, e.g. when the power supply is being replaced. 2.1.5 MPI interface You can connect the following nodes to the multipoint interface: • Programming devices (PGs/PCs) • Operator interface devices (OSs, OPs and TDs) • Other SIMATIC S7 programmable controllers You can also configure the MPI interface as a DP interface. In this way, you can configure a DP chain with slaves. Note As PCS 7 systems use the Industrial Ethernet as the plant bus, the use of the MPI interface as listed above is not the mainstream application. The information here is to show the capability of S7 400 series controllers. 2.1.6 PROFIBUS-DP interface You can connect the following nodes to the PROFIBUS-DP interface: • ET 200M (distributed station with S7-300 I/O) • S7-300 as an intelligent slave (for example, CPU 315-2 or 318-2 with
PROFIBUS-DP connection) • Other standard PROFIBUS-DP slaves Note In PCS 7 systems, ET200M distributed stations are used. The use of the PROFIBUS-DP interface as listed above (except ET200M) is not the mainstream application. The information here is to show the capability of S7 400 series controllers. 2.1.7 Memory cards The memory card and an integrated memory area on the CPU together form the load memory of the CPU. In operation, the load memory contains the complete user program including comments, symbols, special additional information that permits de-compiling of the user program, and all the module parameters.
PCS 7 PoT V6.0 | Edition V1.0 | August 2003 Copyright 2003 Siemens AG by A&D AS CS2 PA. All rights reserved.
Page 5 - 14

PCS 7 PoT Chapter 5 Automation Station
The following data can be stored in the memory card: • User program, that is, blocks (OBs, FBs, FCs, DBs) and system data • Parameters that determine the behaviour of the CPU • Parameters that determine the behaviour of the I/O modules. 2.2 CPU memories 2.2.1 Memory areas The memory of a S7 CPU can be divided into three areas as illustrated in Picture 5.8.
The load memory is used for user programs without symbolic address assignments or comments (these remain in the memory of the programming device, ES). The load memory can be either RAM or EPROM.
•
•
•
•
Blocks that are not marked as required for startup will be stored only in the load memory. The work memory (integrated RAM) contains the parts of the S7 program relevant for running your program. The program is executed only in the work memory and system memory areas. The system memory (RAM) contains the memory elements provided by every CPU for the user program, such as the process-image input and output tables, bit memory, timers, and counters. The system memory also contains the block stack and interrupt stack.
In S7-400 CPUs, it is essential that you use a memory card (RAM or EPROM) to expand the load memory. The integrated load memory is a RAM memory and is mainly used to reload and correct blocks. With some S7-400 CPUs, additional work memory can also be added.
PCS 7 PoT V6.0 | Edition V1.0 | August 2003 Copyright 2003 Siemens AG by A&D AS CS2 PA. All rights reserved.
Page 5 - 15

PCS 7 PoT Chapter 5 Automation Station
Picture 5.8: S7 – 400 CPU memory concept 2.2.2 Retentive memory of S7 – 400 CPUs (1) Operation without battery backup If you operate your system without battery backup, when a power outage occurs or when you reset the CPU memory (MRES), the memory of the S7-400 CPU (load memory (RAM), work memory, and system memory) is reset and all the data contained in these areas is lost. Without battery backup, only a restart (warm restart) is possible and there are no retentive memory areas. Following a power outage, only the MPI parameters (for example, the MPI address of the CPU) are retained. This means that the CPU remains capable of communication following a power outage or memory reset.
PCS 7 PoT V6.0 | Edition V1.0 | August 2003 Copyright 2003 Siemens AG by A&D AS CS2 PA. All rights reserved.
Page 5 - 16

PCS 7 PoT Chapter 5 Automation Station
(2) Operation with battery backup If you use a battery to back up your memory the entire content of all RAM areas is retained when the CPU restarts following a power outage. During a restart (warm restart), the address areas for bit memory, timers, and counters is cleared. The contents of the RAM work memory are also retained apart from bit memory, timers, and counters that were designed as non-retentive. (3) Configuring retentive memory You can declare a certain number of memory bits, timers, and counters as retentive (the number depends on your CPU). Refer to Picture 5.9. During a restart (warm restart) when you are using a backup battery, this data is also retained.
Picture 5.9: Retentive memory 2.3 CPU communications A Communication bus is integrated in the backplane as illustrated in Picture 5.10. The I/O bus connector and communication bus connector can be seen on each slot. When the rack is delivered, these connectors are protected by a cover.
PCS 7 PoT V6.0 | Edition V1.0 | August 2003 Copyright 2003 Siemens AG by A&D AS CS2 PA. All rights reserved.
Page 5 - 17

PCS 7 PoT Chapter 5 Automation Station
Picture 5.10: Communication connectors in the backplane The communication is divided into I/O (or process) part and communication parts, which are physically seen as I/O bus connectors and C bus connectors as in Picture 5.9. Communication between a CPU and other devices is illustrated in Picture 5.11.
Picture 5.11: CPU communications 2.4 CPU software structure The operating system of a CPU organises all CPU functions and sequences including: • CPU warm restart • Process image processing • Calling cyclic and event-driven OBs • Error recognition • Communication e.g. with PG, ES, OS and process I/O
PCS 7 PoT V6.0 | Edition V1.0 | August 2003 Copyright 2003 Siemens AG by A&D AS CS2 PA. All rights reserved.
Page 5 - 18

PCS 7 PoT Chapter 5 Automation Station
The performance of the CPU operating system can be influenced by parameter assignment (e.g. cycle time monitoring, priorities of event-driven OBs, etc.). The organisation blocks (OBs) are called by the operating system with the occurrence of a corresponding event. All other blocks must be called by the user within OBs, function blocks (FBs) or functions (FCs). Refer to Picture 5.12. There are three types of OBs, i.e. startup OBs, cyclic OBs, and event-driven OBs.
Picture 5.12: CPU software structure
2.5 Organisation blocks Organisation blocks (OBs) are the interface between the CPU operating system and the user program. They are called by the operating system. They specify how the CPU starts up. They also handle the response to errors in the event-driven OBs. The number and types of OBs vary for different CPUs. To know what exactly OBs a CPU contains check the Properties of a CPU in the HW Config. However, an outline of S7-400 OBs and their functions is shown in Picture 5.13. Note To learn more about OBs, refer to the online Help of the SIMATIC Manager under the index “Organisation Blocks”.
PCS 7 PoT V6.0 | Edition V1.0 | August 2003 Copyright 2003 Siemens AG by A&D AS CS2 PA. All rights reserved.
Page 5 - 19

PCS 7 PoT Chapter 5 Automation Station
Picture 5.13: An outline of OBs and their functions 2.6 System diagnostics Diagnostics are the integrated error detection and recording functions of a CPU. The area in which the error information is recorded is called the diagnostic buffer. The capacity of the buffer depends on the CPU (e.g. CPU 416 = 120 messages). Picture 5.14 shows how to call up the diagnostic buffer.
Picture 5.14: Calling up the Diagnostic buffer (Module Information)
PCS 7 PoT V6.0 | Edition V1.0 | August 2003 Copyright 2003 Siemens AG by A&D AS CS2 PA. All rights reserved.
Page 5 - 20

PCS 7 PoT Chapter 5 Automation Station
Picture 5.15: The Diagnostic Buffer When an error or an event, e.g. a change of operating mode, occurs the following takes place.
• A message with the date and time is entered in the diagnostic buffer (see Picture 5.14). The most recent message is stored at the beginning of the buffer. When the buffer is full, earlier entries are deleted.
• A description of the diagnostic event is recorded in the buffer. • If applicable, the event activates the relevant error OB.
The CPU diagnostics enable you to detect the following types of error:
• System errors in the CPU • Module errors, e.g. CPs. I/Os. • Program errors in the CPU
The detection of the above three sources of errors is illustrated in Picture 5.16. The picture also shows how the system responds to the errors. For example, I/O modules with diagnostics capability could detect an error. The error is recorded in the diagnostic buffer, and could call up other error OBs, and could also trigger a message displaying on OS.
PCS 7 PoT V6.0 | Edition V1.0 | August 2003 Copyright 2003 Siemens AG by A&D AS CS2 PA. All rights reserved.
Page 5 - 21

PCS 7 PoT Chapter 5 Automation Station
Picture 5.16: System diagnostics 2.7 Settings of CPU properties In the Hardware Config, if you double-click a CPU that has been placed on a rack, the CPU Properties window pops up where CPU property values are to be assigned. Picture 5.17 shows the CPU Cycle/Clock Memory tab of the Properties window. Note CPU properties of the S7 controllers and modules are preset with default values such that in many cases you may not need to configure them. Configuration is necessary in the following cases:
• If you want to change the default parameters of a module (for example, enable a hardware interrupt for a module)
• If you want to configure communication connections, and CP addresses • For stations with a distributed I/O (PROFIBUS-DP) • For S7-400 stations with a number of CPUs (multi-computing) or expansion
racks • For fault-tolerant (H) programmable control systems
PCS 7 PoT V6.0 | Edition V1.0 | August 2003 Copyright 2003 Siemens AG by A&D AS CS2 PA. All rights reserved.
Page 5 - 22

PCS 7 PoT Chapter 5 Automation Station
Picture 5.17: CPU Properties 3. PROFIBUS 3.1 Brief introduction PROFIBUS is currently the field bus system in most widespread use. The system exists in the three variants PROFIBUS -DP, -PA, and –FMS. The FMS variant is primarily deployed at the cell level, and will play a less significant role in the future than the use of TCP/IP at cell levels. PROFIBUS-DP is the most frequently used communication profile. It is optimised for speed, efficiency and low connection costs and is designed especially for communication between automation systems and distributed peripherals. DP is suitable as a replacement for conventional, parallel signal transmission with 24 volts in manufacturing automation and as well as for analog signal transmission with 4 – 20 mA or Hart in process automation. The use of PROFIBUS in typical devices and applications in process automation is defined by the PA profile. The PA profile defines the parameters and behaviour of typical field devices such as measuring transducers or positioners independent of manufacturers. The definitions and options of the PA application profile make PROFIBUS suitable as a substitute for analog signal transmission with 4 – 20 mA or Hart. Couplers or links are available for the transition between the various transmission technologies as shown in Picture 5.18. While couplers transparently implement the
PCS 7 PoT V6.0 | Edition V1.0 | August 2003 Copyright 2003 Siemens AG by A&D AS CS2 PA. All rights reserved.
Page 5 - 23

PCS 7 PoT Chapter 5 Automation Station
protocol taking account of physical circumstances, links are intrinsically intelligent and thus offer extended options for the configuration of PROFIBUS networks.
Picture 5.18: PROFIBUS system In Picture 5.18, a Profibus line is routed from the integrated DP port of a S7-400 CPU. An S7-400 CPU could support up to 5 DP subnets using the interface module CP443-5 ext. 3.2 PROFIBUS basics PROFIBUS distinguishes between Master and Slave devices. Master devices determine the data communication on the bus. A master can send messages without an external request when it holds the bus access rights (the token). Masters are also called active stations. Slave devices are peripherals such as I/O devices, valves, drives and measuring transducers. They do not have bus access rights and they can only acknowledge of receiving messages or sending of messages to the master when requested to do so. Slaves are called passive stations. 3.2.1 PROFIBUS-DP Transmission Technology RS 485 is the transmission technology most frequently used by PROFIBUS. The application area includes all areas in which high transmission speed and simple, inexpensive installations are required. Twisted pair shielded copper cable with one conductor pair is used. The RS 485 transmission technology is easy to handle. Installation of the twisted pair cable does not require expert knowledge. The bus structure permits addition and removal of stations or step-by- step commissioning of the system without influencing
PCS 7 PoT V6.0 | Edition V1.0 | August 2003 Copyright 2003 Siemens AG by A&D AS CS2 PA. All rights reserved.
Page 5 - 24

PCS 7 PoT Chapter 5 Automation Station
the other stations. Later expansions have no effect on stations that are already in operation. Transmission speeds between 9.6 kbit/sec and 12 Mbit/sec are available. One unique transmission speed is selected for all devices on the bus when the system is commissioned. 3.2.2 Installation Instructions for PROFIBUS-DP All devices are connected in a bus structure (i.e. line). Up to 32 stations (master or slaves) can be connected in one segment. The bus is terminated by an active bus terminator at the beginning and end of each segment. To ensure error-free operation, both bus terminators must always be powered. The bus terminator can usually be switched in the devices or in the bus terminator connectors. See Pictures 5.19 and 5.20.
Picture 5.19: A PROFIBUS resistor and terminator
PCS 7 PoT V6.0 | Edition V1.0 | August 2003 Copyright 2003 Siemens AG by A&D AS CS2 PA. All rights reserved.
Page 5 - 25

PCS 7 PoT Chapter 5 Automation Station
Picture 5.20: Terminating PROFIBUS
In the case of more than 32 users, or to enlarge the area of the network, repeaters (line amplifiers) must be used to link up the individual bus segments. The maximum cable length depends on the transmission speed, see Table 5.4.
Baud rate (kbit/s) Segment length 9.6 1,200 m
19.2 1,200 m 93.75 1,200 m 187.5 1,000 m 500 400 m
1,500 200 m 12,000 100 m
Table 5.4: Segment length based on transmission speed
PCS 7 PoT V6.0 | Edition V1.0 | August 2003 Copyright 2003 Siemens AG by A&D AS CS2 PA. All rights reserved.
Page 5 - 26

PCS 7 PoT Chapter 5 Automation Station
3.2.3 PROFIBUS-PA Transmission Technology Synchronous transmission of PROFIBUS-PA in accordance with IEC 1158-2 with a defined baud rate of 31.25 kbit/s is used in process automation. It satisfies important requirements in the chemical and petrochemical industries: intrinsic safety and powering over the bus using two-wire technology. Thus PROFIBUS can be used in hazardous areas. The options and limits of PROFIBUS with IEC 1158-2 transmission technology for use in potentially explosive areas are defined by the FISCO model (Fieldbus Intrinsically Safe Concept). The FISCO model was developed in Germany and is today internationally recognised as the basic model for field buses in hazardous areas. Transmission in accordance with IEC 1158-2 and FISCO model is based on the following principles: • Each segment has only one source of power, the power supply unit. • No power is fed to the bus when a station is sending. • Every field device consumes a constant basic current at steady state. • The field devices function as a passive current sink. • The passive line termination is performed at both ends of the main bus line. • Linear, tree and star topologies are allowed. In steady state, each station consumes a basic current of at least 10 mA. With bus powering, this current serves to supply energy to the field device. Communication signals are generated by the sending device. 3.2.4 Installation Instructions for PROFIBUS-PA In the field, a segment coupler or a link forms the transition from the PROFIBUS-DP segment to the PROFIBUS-PA segment. At the same time, the coupler or link is the supply unit for the bus powered field devices. Segment couplers are signal converters that adapt the PROFIBUS-DP signals to the PROFIBUS-PA signal level. From the point of view of the bus protocol, they are transparent. If segment couplers are used, the baud rate in the PROFIBUS-DP segment is restricted to a maximum of 93.75 kbit/s. Links, on the other hand, have their own intrinsic intelligence. They represent all field devices connected in the PROFIBUS-PA segment as a single slave in the PROFIBUS-DP segment. There is no limit to the baud rate in the PROFIBUS-DP segment when using links. Tree or line structures are possible network topologies for PROFIBUS with PROFIBUS-PA transmission, as well as any combinations of the two, see Picture 5.21.
PCS 7 PoT V6.0 | Edition V1.0 | August 2003 Copyright 2003 Siemens AG by A&D AS CS2 PA. All rights reserved.
Page 5 - 27
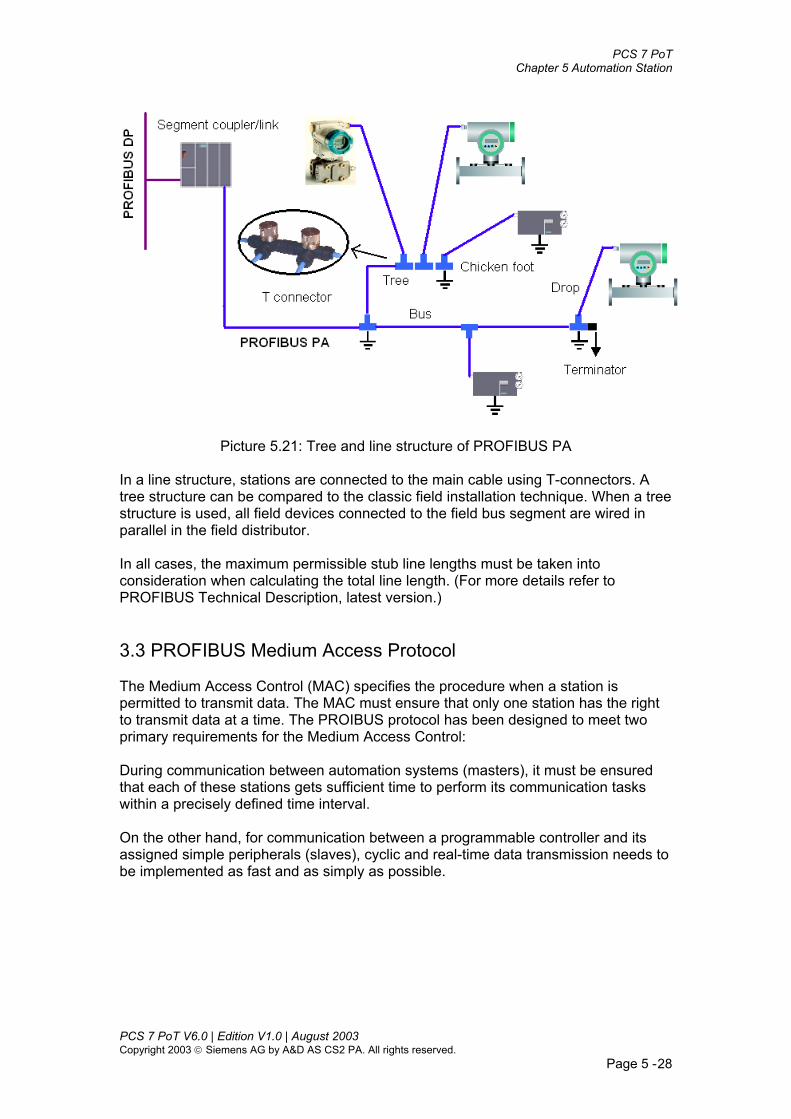
PCS 7 PoT Chapter 5 Automation Station
Picture 5.21: Tree and line structure of PROFIBUS PA In a line structure, stations are connected to the main cable using T-connectors. A tree structure can be compared to the classic field installation technique. When a tree structure is used, all field devices connected to the field bus segment are wired in parallel in the field distributor. In all cases, the maximum permissible stub line lengths must be taken into consideration when calculating the total line length. (For more details refer to PROFIBUS Technical Description, latest version.) 3.3 PROFIBUS Medium Access Protocol The Medium Access Control (MAC) specifies the procedure when a station is permitted to transmit data. The MAC must ensure that only one station has the right to transmit data at a time. The PROIBUS protocol has been designed to meet two primary requirements for the Medium Access Control: During communication between automation systems (masters), it must be ensured that each of these stations gets sufficient time to perform its communication tasks within a precisely defined time interval. On the other hand, for communication between a programmable controller and its assigned simple peripherals (slaves), cyclic and real-time data transmission needs to be implemented as fast and as simply as possible.
PCS 7 PoT V6.0 | Edition V1.0 | August 2003 Copyright 2003 Siemens AG by A&D AS CS2 PA. All rights reserved.
Page 5 - 28

PCS 7 PoT Chapter 5 Automation Station
Master Devices
Passive stations (Field equipment)
PLCPC
PROFIBUS
Picture 5.22:Two master stations and 6 slaves 3.4 PROFIBUS-DP Communication Profile The central controller (master) cyclically reads the input information from the slaves and cyclically writes the output information to the slaves. The bus cycle time should be shorter than the program cycle time of the central automation system, which for many applications is approximately 10 msec. In addition to cyclic user data transmission, DP provides powerful functions for diagnostics and commissioning. Data communication is monitored by monitoring functions on both the master and slave side. High data throughput alone is not the sole criteria for successful use of a bus system. Simple handling, good diagnostic capabilities and interference proof transmission technology are also important to the user. DP represents the optimum combination of these characteristics. 3.4.1 Speed DP requires only about 1 msec at 12 Mbit/sec for the transmission of 512 bits of input data and 512 bits of output data distributed over 32 stations. Picture 5.23 shows the typical DP transmission time, depending on number of stations and transmission speed.
PCS 7 PoT V6.0 | Edition V1.0 | August 2003 Copyright 2003 Siemens AG by A&D AS CS2 PA. All rights reserved.
Page 5 - 29

PCS 7 PoT Chapter 5 Automation Station
Picture 5.23: Bus cycle time and number of stations on the bus 3.4.2 Diagnostic functions The extensive diagnostic functions of DP enable fast location of faults. The diagnostic messages are transmitted over the bus and collected at the master. These messages are divided into three levels:
• Station-related diagnostics These messages concern the general operational status of a station (i.e. over-temperature or low voltage).
• Module-related diagnostics These messages indicate that within a certain I/O range (e.g. 8-bit output module) of a station, diagnostics are pending.
• Channel-related diagnostics In this case, the cause of the fault is specified in relation to an individual input/output bit (channel); e.g. short circuit at output 7.
3.4.3 System Configuration and Types of Devices DP permits mono-master or multi-master systems. This provides a high degree of flexibility during system configuration. A maximum of 126 devices (master or slaves) can be connected to one bus. The system configuration specifications define the number of stations, assignment of station addresses to the I/O addresses, data consistency of the I/O data, format of the diagnostic messages and the bus parameters used. Each DP system consists of different types of devices. A distinction is made between three types of devices:
• DP Master Class 1 (DPM1) This is a central controller that cyclically exchanges information with the distributed stations (slaves) in a defined message cycle. Typical devices are, for example, programmable logic controllers (PLC) or PC.
• DP Master Class 2 (DPM2)
PCS 7 PoT V6.0 | Edition V1.0 | August 2003 Copyright 2003 Siemens AG by A&D AS CS2 PA. All rights reserved.
Page 5 - 30

PCS 7 PoT Chapter 5 Automation Station
Devices of this type are engineering, configuration or operating devices. They are used for commissioning and for maintenance and diagnostics, in order to configure the connected devices, evaluate measured values and parameters, and request the device status.
• Slave
A slave is a peripheral device (I/O devices, drives, HMI, valves, measuring transducers) that collects input information and sends output information to the peripherals. There are also devices that supply only input or only output information.
The amount of input and output information depends on the device type. A maximum of 244 bytes of input data and 244 bytes of output data is permitted for one slave.
In mono-master systems only one master is active on the bus during operation of the bus system. The programmable controller is the central control component. The slaves are de-centrally linked to the PLC via the transmission medium. Mono-master systems attain the shortest bus cycle time. In multi-master configurations several masters are connected to one bus. These masters represent either independent subsystems, each consisting of one DPM1 master and its assigned slaves, or additional configuration and diagnostic devices. The input and output images of the slaves can be read by all DP masters. However, only one DP master (i.e., the DPM1 assigned during configuration) may have the write-access to the outputs. 3.4.4 Sync and Freeze Mode In addition to station-related user data transfer, which is executed automatically by the DPM1, the master can send control commands to a single slave, a group of slaves or all slaves simultaneously. These control commands are transmitted as multicast commands. They permit use of sync and freeze modes for event-controlled synchronisation of the slaves. The slaves begin sync mode when they receive a sync command from their assigned master. The outputs of all addressed slaves are then frozen in their current state. During subsequent user data transmissions, the output data are stored at the slaves, but the output states remain unchanged. The stored output data are not sent to the outputs until the next sync command is received. Sync mode is concluded with the unsync command. Similarly, a freeze control command causes the addressed slaves to assume freeze mode. In this operating mode, the states of the inputs are frozen at the current value. Input data are not updated again until the master sends the next freeze command. Freeze mode is concluded with the unfreeze command. 3.5 Device engineering, GSE, DD files PROFIBUS devices have different performance characteristics. Features differ in regard to available functionality (i.e., number of I/O signals and diagnostic messages) or possible bus parameters such as baud rate and time monitoring. These parameters vary individually for each device type and vendor and are usually
PCS 7 PoT V6.0 | Edition V1.0 | August 2003 Copyright 2003 Siemens AG by A&D AS CS2 PA. All rights reserved.
Page 5 - 31

PCS 7 PoT Chapter 5 Automation Station
documented in the technical manual. In order to achieve a simple Plug and Play configuration for PROFIBUS, electronic device data sheets (GSE files) were defined for the communication features of the devices. Configuration tools are available for the configuration of a PROFIBUS network. Based on the GSE files, these allow easy configuration of PROFIBUS networks with devices from different manufacturers. 3.5.1 GSE files The characteristic communication features of a PROFIBUS device are defined in the form of an electronic device data sheet (GSE). GSE files must be provided by the manufacturer for all PROFIBUS devices. GSE files expand open communication up to operator control level. GSE files can be loaded during configuration using any modern configuration tool. This means that integration of devices from different manufacturers into the PROFIBUS system is simple and user-friendly. The defined file format permits the configuration system to simply read in the GSE files of any PROFIBUS device and automatically use this information when configuring the bus system. The GSE file is divided into three sections:
• General specifications This section contains information on vendor and device names, hardware and software release states, baud rates supported, possible time intervals for monitoring times and the signal assignment on the bus connector.
• Master-related specifications
This section contains all master-related parameters, such as: the maximum number of slaves that can be connected, or upload and download options. This section does not exist for slave devices.
• Slave-related specifications
This section contains all slave-related specifications, such as the number and type of I/O channels, specification of diagnostic texts and information on the available modules with modular devices.
In the individual sections, the parameters are separated by key words. A distinction is made between mandatory parameters (i.e., Vendor_Name) and optional parameters (i.e., Sync_Mode_supported). The definition of parameter groups allows selection of options. In addition, bit map files with the symbols of the devices can be integrated. GSE files for PROFIBUS devices, conforming to the PROFIBUS standard, can be downloaded free of charge from the GSE library on the PROFIBUS homepage (http://www.profibus.com).
PCS 7 PoT V6.0 | Edition V1.0 | August 2003 Copyright 2003 Siemens AG by A&D AS CS2 PA. All rights reserved.
Page 5 - 32

PCS 7 PoT Chapter 5 Automation Station
3.5.2 Identification number Every PROFIBUS slave and every Class 1-type master must have an ID number. Masters require this number to be able to identify the types of devices connected without significant protocol overheads. The master compares the ID number of the connected devices with the ID number specified by the configuring tool in the configuration data. Transfer of user data is not started until the correct device types with the correct station addresses have been connected on the bus. This provides a high degree of security against configuration errors. Device manufacturers must apply to the PROFIBUS User Organisation for an ID number for each device type; the organisation also handles administration of the ID numbers. Application forms can be obtained from all regional associations or on the PROFIBUS website. A special range of ID numbers (generic ID numbers) has been reserved for PA field devices: 9700H – 977FH. All PA field devices corresponding exactly to the definitions of the PA profile version 3.0 or higher may use ID numbers from this special ID number range. The definition of these generic ID numbers increases the interchangeability of PA field devices. The conventions are described in detail in the profile for PA field devices.
Picture 5.24: GSE files permit open configuration 3.5.3 Electronic Device Description (EDD) The Electronic Device Description (EDD) outlines the device properties of PROFIBUS field devices. The language can be used universally and allows vendor-independent descriptions for simple field devices (sensors and actuators) as well as for complex automation systems. The device descriptions are provided in electronic form by the device manufacturer for the respective devices. The EDD files are read in by the engineering tools, e.g. PDM and simplify the configuration, commissioning and maintenance of PROFIBUS systems.
PCS 7 PoT V6.0 | Edition V1.0 | August 2003 Copyright 2003 Siemens AG by A&D AS CS2 PA. All rights reserved.
Page 5 - 33

PCS 7 PoT Chapter 5 Automation Station
Integration of new field devices is via EDD in the Hardware Config, while EDD-Library of the HART Communication Foundation and various DP/PA devices are integrated as standard. See Picture 5.25.
PROFIBUS DP
ET 200 Mwith HARTAI or AO
OperatorStation
System bus
HHT
4 to 20 mA DP/PA-Link
PROFIBUS PA
Process variables plus status
Standardised parameters
Vendor-specific parameters
DeviceDescription
Engineering Stationwith SIMATIC PDM
Industrial Ethernet / Fast Ethernet
Routing
Picture 5.25: Integrating EDD files
3.6 Configuring PROFIBUS DP in the Hardware Config If you right click on the slot where a DP interface can be installed, you could follow Picture 5.26 to insert a DP line.
PCS 7 PoT V6.0 | Edition V1.0 | August 2003 Copyright 2003 Siemens AG by A&D AS CS2 PA. All rights reserved.
Page 5 - 34

PCS 7 PoT Chapter 5 Automation Station
Picture 5.26: Inserting DP Master System for a S7-400 controller In the Hardware Catalog under the Profibus DP, available DP devices are listed. To connect a device onto a DP line, drag and drop a device onto the line. See Picture 5.27.
Picture 5.27: Placing devices dragged from the Hardware Catalog There are a number of parameters or properties to be specified depending on a specific device. However, an important property is the address on a bus. The address assignment dialog or slave Properties dialog pops up automatically when a slave device is being placed on the bus. See Picture 5.27.
PCS 7 PoT V6.0 | Edition V1.0 | August 2003 Copyright 2003 Siemens AG by A&D AS CS2 PA. All rights reserved.
Page 5 - 35

PCS 7 PoT Chapter 5 Automation Station
The interface module IM153-2 in Picture 5.27 is assigned Address of 13 on PROFIBUS_Line_1. The bus baud rate is assigned at 1.5 Mbits/s. To change the baud rate, you have to click the Properties button on Picture 5.28.
Picture 5.28: Addressing slave devices After configuring addresses of the devices, you could have an overview of all the devices on the subnets by calling the GO TO PROFIBUS Station window as illustrated in the following two pictures 5.29 and 5.30.
Picture 5.29: Calling up the Go To PROFIBUS Station window –1
PCS 7 PoT V6.0 | Edition V1.0 | August 2003 Copyright 2003 Siemens AG by A&D AS CS2 PA. All rights reserved.
Page 5 - 36
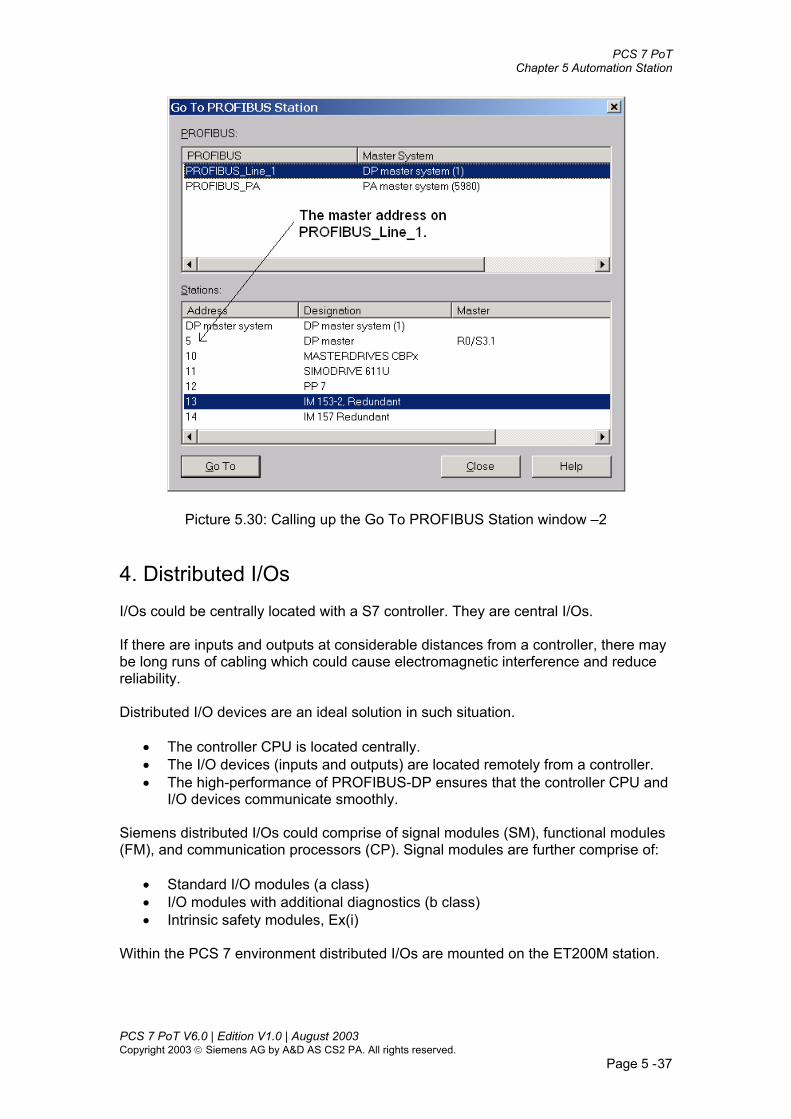
PCS 7 PoT Chapter 5 Automation Station
Picture 5.30: Calling up the Go To PROFIBUS Station window –2 4. Distributed I/Os I/Os could be centrally located with a S7 controller. They are central I/Os. If there are inputs and outputs at considerable distances from a controller, there may be long runs of cabling which could cause electromagnetic interference and reduce reliability. Distributed I/O devices are an ideal solution in such situation.
• The controller CPU is located centrally. • The I/O devices (inputs and outputs) are located remotely from a controller. • The high-performance of PROFIBUS-DP ensures that the controller CPU and
I/O devices communicate smoothly. Siemens distributed I/Os could comprise of signal modules (SM), functional modules (FM), and communication processors (CP). Signal modules are further comprise of:
• Standard I/O modules (a class) • I/O modules with additional diagnostics (b class) • Intrinsic safety modules, Ex(i)
Within the PCS 7 environment distributed I/Os are mounted on the ET200M station.
PCS 7 PoT V6.0 | Edition V1.0 | August 2003 Copyright 2003 Siemens AG by A&D AS CS2 PA. All rights reserved.
Page 5 - 37

PCS 7 PoT Chapter 5 Automation Station
4.1 Structure and components of ET200M An ET 200M station is based on a 19 - inch profile rail as shown in Picture 5.31. The interface module is of IM153 series, which communicates with a DP master. Up to 8 I/O modules can be mounted on one ET200M station.
Picture 5.31: ET200M structure 4.2 IM 153: variants and features Available IM153 modules and their features are summarised in Table 5.5.
IM and Order Number: 6ES7 ____-0XB0 513-1 153-2 153-2 FO AA__ AA__ BA__ AB__ BB__ 02 03 82 83 01 02 00 01 00 RS 485 x x x x x x - - Fiber-optic cable interface - - - - - - - x x Module change during operation x x - - x x x x x
SYNC/FREEZE x x x x - - x x x Forwarding of parameterisation data from PG/PC - - - - x x x
Parameterisation on ET200M - - - - x x x Time synchronisation on PROFIBUS, time stamping of input signals
- - - - - x X x x
Redundancy - - - - - x X x x Enhanced diagnostics - x - x - x X x x Extended range of environmental conditions (outdoors)
- - x x - - - - -
Table 5.5: Variants and features of IM153
PCS 7 PoT V6.0 | Edition V1.0 | August 2003 Copyright 2003 Siemens AG by A&D AS CS2 PA. All rights reserved.
Page 5 - 38

PCS 7 PoT Chapter 5 Automation Station
4.3 Time Stamping with the IM153-2 The time stamping of signal changes is supported throughout the PCS 7 system by all the hardware and software components: from the IM 153-2 via a S7-400 to the OS. Refer to Picture 5.32. By carrying out configuration in the Hardware Config you can monitor digital inputs for signal changes in a system. The “coming/going signal” (rising or falling edge) is monitored. The IM 153-2 records these altered input signals with the current time (time stamp) and stores them as message lists. The IM 153-2 can store up to 15 message records. After a certain time has elapsed and if there are messages or if a record is full, the IM 153-2 triggers a process interrupt in the DP master (S7-400). The CPU then reads the record and forwards the message lists to OS using the FB 90 “IM_DRV” driver block. Note Configuration of 10 ms time stamping is explained in great details in the manual “PCS 7-function manual 10 ms time stamps”.
Picture 5.32: Time stamping of signal changes 4.4 Redundancy with the IM 153-2 Picture 5.33 shows an example of IM153-2 with redundant controllers, the S7-400H. For the S7-400H, the ET 200M is a single-channel switched (distributed) I/O module.
PCS 7 PoT V6.0 | Edition V1.0 | August 2003 Copyright 2003 Siemens AG by A&D AS CS2 PA. All rights reserved.
Page 5 - 39

PCS 7 PoT Chapter 5 Automation Station
I/O module
AS 414 HAS 417 H
PRO
FIBU
S D
P
redundantI/O module
Picture 5.33: Redundancy with 2 IM153-2 in H systems 4.5 Signal modules The ET200M distributed I/O device is a modular DP slave. For each ET200M station, 244 bytes of addresses can be assigned and a maximum 8 modules can be installed, which could break down to the following details:
• 61 analog inputs (b class), 7x8 channels + 1x5 channels, or • 32 analog outputs (b class), 8x4 channels, or • 128 digital inputs (b class and a class), 8x16 channels, or • 128 digital output (a class), 8x16 channels, or • 64 digital outputs (b class), 8x8 channels.
Class B modules offer the following diagnostics:
• channel specific errors • diagnostics and alarm parameterisable • internal module check • message at failure of support voltages • behaviour of output modules on CPU error: hold last value or substitute
value 4.6 Configuring the distributed I/Os in PCS 7 4.6.1 Configuring In Section 1.2 of the chapter there are detailed steps in configuring a rack, a power supply, and a S7 CPU. From there, we can continue to configure an ET200M station. Drag-and-drop an IM153-2 onto a DP master system and then specify the IM153-2 address on the DP line. The IM153-2 address is assigned as 3 as in Picture 5.34, which is according to the dip-switch on the physical device. PCS 7 PoT V6.0 | Edition V1.0 | August 2003 Copyright 2003 Siemens AG by A&D AS CS2 PA. All rights reserved.
Page 5 - 40

PCS 7 PoT Chapter 5 Automation Station
Picture 5.34: Dragging-and-dropping an IM153-2 onto a DP master system When highlighting the IM153-2 there appears a lower part window in the HW Config where individual modules, e.g. digital inputs, digital output, analog input, and analog output modules are configured. See Picture 5.35. Right-click on a slot, e.g. on the slot 4 of the digital input module, and a selective menu appears (see Picture 5.35) where you need to define symbolic names for every channel of Slot 4.
PCS 7 PoT V6.0 | Edition V1.0 | August 2003 Copyright 2003 Siemens AG by A&D AS CS2 PA. All rights reserved.
Page 5 - 41

PCS 7 PoT Chapter 5 Automation Station
Picture 5.35: Dragging-and-dropping a digital input module In Picture 5.36, 16-channels of the module are listed. Every channel has an address. For example, Channel 1 is addressed as I0.0, Channel 2 as I0.1, etc. Every channel could also have a symbolic name, e.g. Valve_Opened for Channel 1 and Valve_Closed for channel 2, etc.
PCS 7 PoT V6.0 | Edition V1.0 | August 2003 Copyright 2003 Siemens AG by A&D AS CS2 PA. All rights reserved.
Page 5 - 42

PCS 7 PoT Chapter 5 Automation Station
Picture 5.36: Defining symbolic names for I/O channels 4.6.2 Properties of a signal module Open the Properties dialog of a signal module by double-clicking on the module. A digital input module is shown as in Picture 5.37.
Picture 5.37: Properties of a digital input module In the address tab, you have to assign the process image participation. Refer to Picture 5.38.
PCS 7 PoT V6.0 | Edition V1.0 | August 2003 Copyright 2003 Siemens AG by A&D AS CS2 PA. All rights reserved.
Page 5 - 43

PCS 7 PoT Chapter 5 Automation Station
The number of Process Image Partition for a signal module corresponds to the number assigned to a cyclic OB in the Properties of the CPU. The example of Picture 5.38 shows that Process Image Partition No. 1 is associated to OB32. This means the image is updated every second as OB32 runs every second. By using the process image partition for an I/O module and assigning the partition to an OB, you have a deterministic behaviour for the user program that uses the I/O.
Picture 5.38: Assigning Process Image Partition to a signal module In the Inputs tab, you could enable the Diagnostic Interrupt and Hardware Interrupt as shown in Picture 5.39.
PCS 7 PoT V6.0 | Edition V1.0 | August 2003 Copyright 2003 Siemens AG by A&D AS CS2 PA. All rights reserved.
Page 5 - 44

PCS 7 PoT Chapter 5 Automation Station
Diagnostic Interrupt When you activate this check box, you enable the diagnostic interrupt for the digital module. A diagnostic interrupt is triggered by various error events that the module can determine by means of its diagnostic function. The module provides the CPU with the error events that occurred. Hardware Interrupt When you activate this check box, you enable the hardware interrupt for the digital module. For a hardware interrupt, the operating system of a S7 CPU calls a hardware interrupt OB (such as OB40). Input Delay You can specify the input delay for the entire module. Select a high input delay, for example, for simple switches (danger of bounce). See Picture 5.38.
Picture 5.39: Enabling diagnostics In the Time-of-the-Day Stamp tab, you could specify if the module sends the time stamping message. Refer to Picture 5.40. Presetting of All the Inputs Here you can activate the "Time Stamp" function and set which edge should be reported as "incoming event" for the entire module or whether the edge evaluation should be set separately for each input. Individual Settings of the Inputs Here you can activate the "Time Stamp" function separately for each input and set the edge that should be reported as "incoming event."
PCS 7 PoT V6.0 | Edition V1.0 | August 2003 Copyright 2003 Siemens AG by A&D AS CS2 PA. All rights reserved.
Page 5 - 45

PCS 7 PoT Chapter 5 Automation Station
Picture 5.40: Time stamping Note Section 4.6 explains how to configure signal modules in general but with a digital input module in particular. For configuring other signal module check the Help in the Properties dialog of the module to learn more details. 4.7 Process Image 4.7.1 What are the process images? If the input (I) and output (Q) address areas are accessed in the user program, the program does not scan the signal states on the digital signal modules but accesses a memory area in the system memory of the CPU and distributed I/Os. This memory area is known as the process image. The process image area for outputs is referred to as PIQ and for Inputs as PII. The process images (inputs and outputs) updated with OB1 are shown in Picture 5-41. One of the internal tasks of the CPU operating system is to write the process image output table (PIQ) to the outputs for the modules and to read in the status of inputs into the process image input table (PII). Once this step is complete, the user program is executed with all blocks that are called in OB1.
PCS 7 PoT V6.0 | Edition V1.0 | August 2003 Copyright 2003 Siemens AG by A&D AS CS2 PA. All rights reserved.
Page 5 - 46

PCS 7 PoT Chapter 5 Automation Station
Picture 5.41: Process images – PII and PIQ 4.7.2 Advantages of the Process Image Compared with direct access to the input/output modules, the main advantage of accessing the process image is that the CPU has a consistent image of the process signals for the duration of one program cycle. If a signal state on an input module changes while the program is being executed, the signal state in the process image is retained until the process image is updated again in the next cycle. The process of repeatedly scanning an input signal within a user program ensures that consistent input information is always available. Access to the process image also requires far less time than direct access to the signal modules since the process image is located in the internal memory of the CPU. 4.7.3 Part Process Images (Process-Image Partitions) In addition to having the process image (process-image input table, PII, and process-image output table, PIQ) automatically updated by the CPU operating system, you can assign parameters to a maximum of 16 partial process images for a S7-400 CPU. Refer to Picture 5.38. The number of partial process images is CPU specific, e.g. each CPU 414 or CPU 416 has 8 partial image areas while CPU 417 has 16 areas. With partial process image, you can update sections (areas) of the process-image table, when necessary, independently of the cyclic updating of the process image table. Each input/output address that you assign with HW Config to a process-image partition number as illustrated in Picture 5.38 is no longer belongs to the OB1 process-image input/output tables but to the OBs that they are assigned. The process-image partition is updated either by the user with the system function calls or automatically by the OBs that they are assigned.
PCS 7 PoT V6.0 | Edition V1.0 | August 2003 Copyright 2003 Siemens AG by A&D AS CS2 PA. All rights reserved.
Page 5 - 47

PCS 7 PoT Chapter 5 Automation Station
4.7.4 Updating partial process images with the system function calls In some special cases, you can use the system library functions to update the entire process image or a process-image partition from your user program. Requirement: The process image is not updated by the system (the OBs).
SFC26 UPDAT_PI: Update process-image input table • • SFC27 UPDAT_PO: Update process-image output table.
4.7.5 Updating partial process images with OBs The process image partitions updated with the cyclic OB with which the partitions are assigned are illustrated in Table 5.6.
← Start of the current ← cyclic interrupt the OB execution
← Start of the next ← cyclic interrupt the OB execution
← Current cycle time of the OB → Updating of the PII partition
Execution of the cyclic interrupt OB
Updating of the PIQ partition
Updating of the PII partition
Execution of the cyclic interrupt OB
Updating of the PIQ partition
Table 5.6: Updating of process image partitions when linked to an OB
4.7.6 Size of process image For PCS 7, the size of the process image must be set equal to or greater than the number of inputs and outputs used. As the first analog output or input module has the base address 512 in the process image the following data are set by default in CPUs of PCS 7 projects. See Table 5.7 and Picture 5.42.
CPUs Process image Size Process-image input area 786 CPU 414 Process-image input area 786 Process-image input area 2048 CPU 416 Process-image input area 2048 Process-image input area 3072 CPU 417 Process-image input area 3072
Table 5.7: Process image size (default) for PCS 7 CPUs
PCS 7 PoT V6.0 | Edition V1.0 | August 2003 Copyright 2003 Siemens AG by A&D AS CS2 PA. All rights reserved.
Page 5 - 48

PCS 7 PoT Chapter 5 Automation Station
Picture 5.42: Size of the process image
If you have a large number of I/Os, you might need to increase the size of the process images. 4.7.7 Grouping inputs and outputs Process image partition is assigned to an input or output module, which may have a number of channels. Signals with similar characteristics (faster responses) are recommended to group into one module so that they can be allocated in one process image partition. 4.8 Symbolic names 4.8.1 Symbolic names in the HW Config and the Symbols table After assigning signal channels with symbolic names using the Edit Symbolic Names in the HW Config (refer to Picture 5.36), the symbolic names are also entered in the Symbols table of your project. See Picture 5.43. To open the Symbols table, double click on the symbols icon that displays when S7 program is highlighted. Refer to the upper part of the Picture 5.43. Symbols can also be entered and edited in the Symbols table or Symbols Editor. Entering symbols in the Symbols table is the same as assigning symbolic names in the HW Config. Both procedures result in that Valve1_Opened is associated with the address I 0.0.
PCS 7 PoT V6.0 | Edition V1.0 | August 2003 Copyright 2003 Siemens AG by A&D AS CS2 PA. All rights reserved.
Page 5 - 49

PCS 7 PoT Chapter 5 Automation Station
Symbols are global resources in a project and they can be used and referred more easily than absolute addresses.
Picture 5.43: Symbols of a project 4.8.2 How to define I/Os in a PCS 7 project There are three ways you could define I/Os. Refer to Picture 5.44.
(1) Defining I/Os in the HW Config, which is as illustrated in Pictures 3.34 and 3.35.
(2) Defining I/Os in the Symbols table. You could directly key in symbolic names for input and output addresses.
(3) Defining I/Os in an Excel file. The extension name of the Excel file has to be dif. There have to be 4 columns in the file. Thus, I/Os defined in the Excel file can be imported to the Symbols table. You can also export data from the Symbols table to a textual file.
PCS 7 PoT V6.0 | Edition V1.0 | August 2003 Copyright 2003 Siemens AG by A&D AS CS2 PA. All rights reserved.
Page 5 - 50

PCS 7 PoT Chapter 5 Automation Station
Picture 5.44: Defining I/Os in various ways 5. Drivers Driver blocks provide the interface between user programs and hardware input and output components as illustrated in Picture 5.45.
PCS 7 PoT V6.0 | Edition V1.0 | August 2003 Copyright 2003 Siemens AG by A&D AS CS2 PA. All rights reserved.
Page 5 - 51

PCS 7 PoT Chapter 5 Automation Station
Picture 5.45: Input and output drivers 5.1 Channel driver blocks I/O driver blocks are part of PCS 7 library functions. There are two types of driver blocks namely:
• Signal processing blocks or channel blocks. They are used directly by the programmer in CFC by dragging from the library and dropping onto a CFC chart.
• Module driver blocks. They provide diagnostic information about hardware. They are inserted into CFC programs by the Generate Module Driver wizard automatically and interconnected to the channel blocks.
5.1.1 Use of the channel blocks The channel blocks are:
• CH_DI, CH_DO, CH_AI, and CH_AO. These are called the standard channel block. They are used exclusively for signal processing of S7-300/400 modules. The blocks are optimized in terms of both memory space and run-time saving. The blocks are used for ET200M distributed I/Os.
• PA_DI, PA_DO, PA_AI, PA_AO, and PA_TOT. These blocks are designed especially for use with PA field devices. They are used mainly where the special features of these devices should be used. In contrary to the Channel blocks, the PA channel blocks process not only the signal
PCS 7 PoT V6.0 | Edition V1.0 | August 2003 Copyright 2003 Siemens AG by A&D AS CS2 PA. All rights reserved.
Page 5 - 52

PCS 7 PoT Chapter 5 Automation Station
itself, but also all variables according to the desired configuration of the hardware of the device.
5.1.2 Functions of the channel blocks The CH_DI block and its functions are illustrated in Picture 5.46. To know the other standard channel blocks refer to the online Help on the blocks.
Picture 5.46: Function of CH_DI
The CH_AI block with its variables is illustrated in Picture 5.47. The block processes all the channel-specific signal functions of an analog input module in cyclic intervals. For detailed description about the block function, refer to the online Help.
PCS 7 PoT V6.0 | Edition V1.0 | August 2003 Copyright 2003 Siemens AG by A&D AS CS2 PA. All rights reserved.
Page 5 - 53

PCS 7 PoT Chapter 5 Automation Station
Picture 5.47: Interface of CH_AI 5.1.3 Linking of a driver block to a physical signal After placing a channel block onto a CFC chart, you may need to link the channel block to the physical channel where a signal is wired. Normally, you could name the channel block after the signal name, e.g. the channel block instance could be called Valve1_Opened. Picture 5.48 shows how to link a channel instance block to its signal.
PCS 7 PoT V6.0 | Edition V1.0 | August 2003 Copyright 2003 Siemens AG by A&D AS CS2 PA. All rights reserved.
Page 5 - 54

PCS 7 PoT Chapter 5 Automation Station
Picture 5.48: Linking a driver block with a physical signal 5.2 Module driver blocks After a channel block is connected to a physical value, you have to run the Generate Module Driver wizard to insert other necessary driver blocks. The menu path to locate the wizard is: In the SIMATIC Manager, the Component View > (right-click) Charts > Charts > Generate Module Driver. This path is also illustrated in Picture 5.49.
PCS 7 PoT V6.0 | Edition V1.0 | August 2003 Copyright 2003 Siemens AG by A&D AS CS2 PA. All rights reserved.
Page 5 - 55

PCS 7 PoT Chapter 5 Automation Station
Picture 5.49: Generating Module Drivers After running the wizard, there are charts automatically inserted by the wizard into the S7 Program as shown in Picture 5.50.
Picture 5.50: Charts inserted by the Driver wizard
Each of the @ charts contains a module driver block. You can open the charts to know what driver blocks are required and inserted after you place channel driver blocks and run the driver wizard. Note To know more about the module driver blocks, refer to the online Help by pressing F1 when highlighting a driver block in the CFC.
PCS 7 PoT V6.0 | Edition V1.0 | August 2003 Copyright 2003 Siemens AG by A&D AS CS2 PA. All rights reserved.
Page 5 - 56

PCS 7 PoT Chapter 5 Automation Station
As the Generate Module Driver wizard inserts blocks into CFC charts, you have to compile the program after running the Wizard. In practice, hardware may not be yet set up during the project design phase. Then, it is not useful to run the wizard. Once the hardware is set up and the project is going to runtime, you could use the wizard. You use the wizard when you finally compile your program before downloading. Refer to Picture 5.51.
Picture 5.51: Generating module drivers when compiling Note The module drivers are generated in the same way from Picture 5.49 and Picture 5.51. 6. CPU robustness To be robust, CPUs (with firmware version 3.0 or higher) have been designed with enhanced diagnostic functions to avoid the stop status. These diagnostics are related to responding to error interrupts. For example, new driver blocks, OB_BEGIN and OB_END have improved diagnostic functions with calling the new system functions SFB54 and SFC87, etc. The new system functions are available in the appropriate version of CPUs. Generating the module drivers inserts all necessary error OBs in the CFC. Then, the CFC transfers all the OBs to the CPU by download. If an OB is then called (for example due to a rack or DP slave failure), the PLC does not change to "STOP" and OB_BEIGN sends a corresponding message to the relevant OS.
PCS 7 PoT V6.0 | Edition V1.0 | August 2003 Copyright 2003 Siemens AG by A&D AS CS2 PA. All rights reserved.
Page 5 - 57

PCS 7 PoT Chapter 5 Automation Station
CPU robustness is also related to how to download programs, which will be discussed in Chapter 5, Section 5. 7. Configuration changes in Run mode (CiR) 7.1 CiR concept When downloading configuration settings in HW-Config, the target automation systems (CPUs) normally stop in order to accept the changes. Minor changes and adding further few stations or modules should be possible without terminating the control systems as such termination is costive and in some cases impossible due to complexity of systems. System configuration changes in Run mode are based on making a master system with provisions so that subsequent hardware stations and modules are possible to be added in runtime. You define suitable provisional elements (called CiR elements) in your initial configuration and then gradually replace the CiR elements with real objects (slave stations and/or modules) later in the Run mode. There are two phases when considering possible expansions or changes to an initial configuration as listed in Table 5.8. Project phase Operating step CPU status Frequency
Initial configuration Configuration with CiR capability enabled. Loading the configuration.
STOP Once
During operation in CPU Run mode
Replacing CiR elements with real components.
RUN As many times as required
Table 5.8: Project phases when using CiR
Within S7 – 400 ASs, the following CiR elements are provided as listed in Table 5.9.
CiR element Corresponding hardware component
DP master system CiR object: Contains a number of additional DP slaves that can be added or edited.
PA master system CiR object: Contains a number of additional PA slaves that can be added or edited.
ET 200M, a DP slave type CiR module: Contains a number of additional I/O modules that can be added or edited.
Table 5.9: Types of CiR elements and corresponding components
If a station is added in Run mode or an ET200M station has preserved CiR modules, these stations are marked in orange in the HW Config as illustrated in Picture 5.54.
PCS 7 PoT V6.0 | Edition V1.0 | August 2003 Copyright 2003 Siemens AG by A&D AS CS2 PA. All rights reserved.
Page 5 - 58

PCS 7 PoT Chapter 5 Automation Station
Picture 5.54: Stations added or with modules added in runtime marked in orange In Picture 5.54, SIMCODE at address 6 was added in runtime. ET200M stations at address 3 and 4 had preserved modules in the initial configurations while the whole station at address 6 was added in Run mode. Station, DP/PA Link, at address 5 had previsions for PA devices. The following section shows step by step how to configure hardware with previsions using the CiR concept. 7.2 Hardware configuration when using CiR 7.2.1 An example Step1: When considering CiR, components that supported CiR are used. In Picture 5.55, a particular distributed I/O station 6ES7 153-2BA00-0XB0 has to be used to be able to add I/O modules in Run mode. For an external DP bus system, the communication processor that supports CiR is CP443-5 Extended with part number 6GK7 443-5DX03-0XE0 and Firmware version 5.0 or higher.
PCS 7 PoT V6.0 | Edition V1.0 | August 2003 Copyright 2003 Siemens AG by A&D AS CS2 PA. All rights reserved.
Page 5 - 59

PCS 7 PoT Chapter 5 Automation Station
Picture 5.55: Using CiR supported components To take care about these particular CiR supported components, refer to Table 5.10.
Component Version / Firmware Use
PCS 7 system 6.0 or higher Configuration S7 – 400 CPUs: CPU 412, CPU 413, CPU 416, CPU 417, CPU 414-4H, and CPU 417-4H
3.1 or higher Controller
CP 443-5 Extended 6GK7 443-5DX03-0XE0, V5.0 or higher
External DP lines, link to DP slaves
ET200M with active bus module and IM 153
6ES7 153-2BA00-0XB0 FO or 6ES7 153-2BB00-0XB0
Distributed I/O station
DP/PA Link IM 157 6ES7 157-0AA82-0XA0 Link to PA slaves
Table 5.10: Required components for CiR
PCS 7 PoT V6.0 | Edition V1.0 | August 2003 Copyright 2003 Siemens AG by A&D AS CS2 PA. All rights reserved.
Page 5 - 60

PCS 7 PoT Chapter 5 Automation Station
Step2: To enable the CiR capability follow the illustration on Picture 5.56.
Picture 5.56: Enabling CiR capability When enabling CiR capability for a PROFIBUS system, a CiR object is automatically inserted for the master system and a CiR module is also automatically inserted if there is any ET200M station (with CiR capability). Refer to Picture 5.57.
PCS 7 PoT V6.0 | Edition V1.0 | August 2003 Copyright 2003 Siemens AG by A&D AS CS2 PA. All rights reserved.
Page 5 - 61

PCS 7 PoT Chapter 5 Automation Station
Picture 5.57: Inserting CiR Object and CiR Module Step 3: Carrying on in the HW Config, configure your normal hardware components and consider provisions for further expansions and later changes. Step 4 and 5: Save and compile your configuration and prepare for the first downloading. The target CPU shall be in Stop mode. Refer to Picture 5.58.
PCS 7 PoT V6.0 | Edition V1.0 | August 2003 Copyright 2003 Siemens AG by A&D AS CS2 PA. All rights reserved.
Page 5 - 62

PCS 7 PoT Chapter 5 Automation Station
Picture 5.58: Downloading CiR objects in the STOP mode
Step 6: In Run mode, drag and drop DP slaves onto the CiR object and then these slaves will become orange meaning that they could be download without stopping CPU.
Picture 5.59: Adding DP slaves in Run mode It is similar to add I/O modules in runtime. Refer to Picture 5.60. When adding an I/O module, add it to the highest slot. The CiR module is then automatically move to the next higher slot.
PCS 7 PoT V6.0 | Edition V1.0 | August 2003 Copyright 2003 Siemens AG by A&D AS CS2 PA. All rights reserved.
Page 5 - 63

PCS 7 PoT Chapter 5 Automation Station
Picture 5.60: Adding I/O modules in runtime Step 7 & 8: Now, it is ready to download changes in Run mode. Refer to Picture 5.61. Note Do not save and compile the changes before downloading them. Use the function, Ctrl+Alt+F, to check if the configuration is downloadable. If so, download the configuration and then save & compile the configuration to keep a backup of the configuration.
Picture 5.61: Downloading in Rum mode
PCS 7 PoT V6.0 | Edition V1.0 | August 2003 Copyright 2003 Siemens AG by A&D AS CS2 PA. All rights reserved.
Page 5 - 64
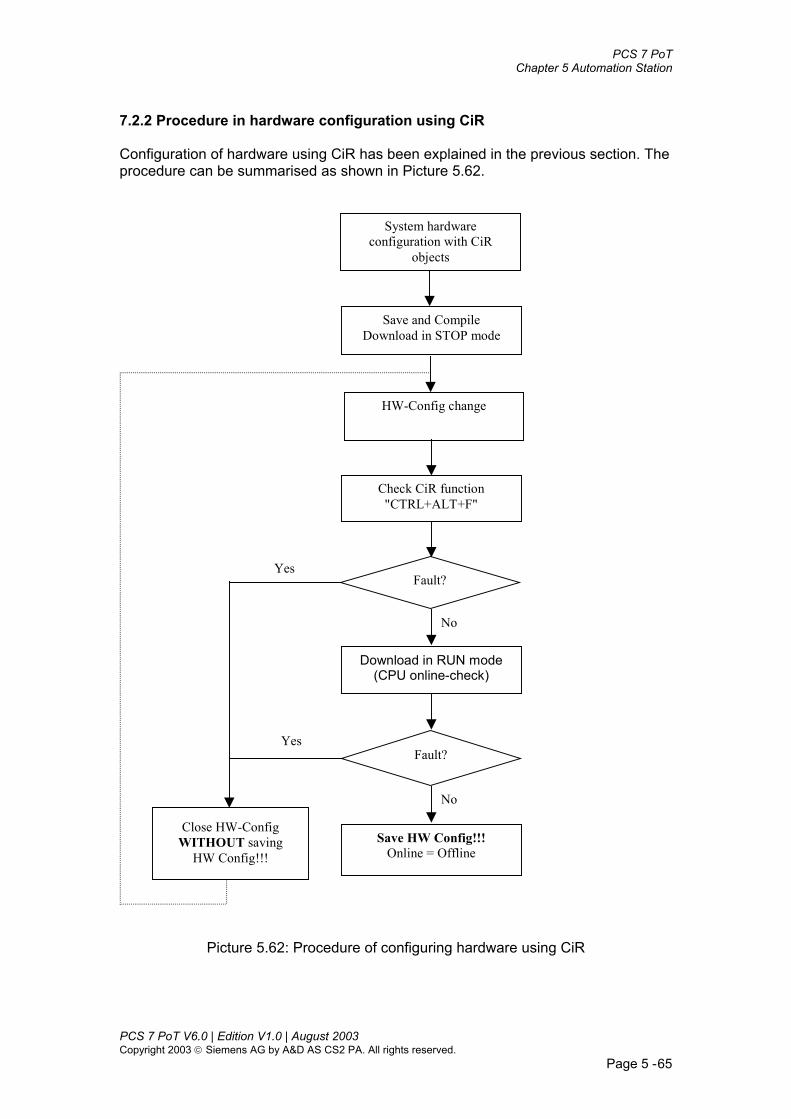
PCS 7 PoT Chapter 5 Automation Station
7.2.2 Procedure in hardware configuration using CiR Configuration of hardware using CiR has been explained in the previous section. The procedure can be summarised as shown in Picture 5.62.
HW-Config change
Check CiR function"CTRL+ALT+F"
Download in RUN mode(CPU online-check)
Close HW-ConfigWITHOUT saving
HW Config!!!Save HW Config!!!
Online = Offline
Fault?Yes
Fault?Yes
No
No
System hardwareconfiguration with CiR
objects
Save and CompileDownload in STOP mode
Picture 5.62: Procedure of configuring hardware using CiR PCS 7 PoT V6.0 | Edition V1.0 | August 2003 Copyright 2003 Siemens AG by A&D AS CS2 PA. All rights reserved.
Page 5 - 65

PCS 7 PoT Chapter 5 Automation Station
7.3 Properties of CiR object and element If you double-click a CiR object, a Properties dialog is called up as shown in Picture 5.63.
Picture 5.63: Properties of CiR object In the dialog, you specify the properties (referring to future expansions) of the DP or DP master system that contains the CiR object. (1) Guaranteed number of additional slaves Specify the number of slaves you probably want to add in Run mode (default value: 14). SIAMTIC Manager provides a maximum I/O volume to each guaranteed slave:
For the DP master system: 244 input bytes and 244 output bytes • • For the PA master system: 244 input and output bytes in total including
existing PA devices (2) Maximum number of additional slaves The I/O volume of slaves you insert via CiR is usually less than the volume SIMATIC Manger provides for guaranteed slaves. Some of the slaves use only few bytes. This means that you can insert more slaves in the system than the guaranteed number of
PCS 7 PoT V6.0 | Edition V1.0 | August 2003 Copyright 2003 Siemens AG by A&D AS CS2 PA. All rights reserved.
Page 5 - 66

PCS 7 PoT Chapter 5 Automation Station
slaves. The upper limit of additional slaves is displayed in the "Maximum" box. (3) CiR synchronisation time SIMATIC Manager determines the portion of the CiR synchronisation time caused by the master system where the CiR object belongs to and then displays this value. (4) Extra settings If you want to change the number of default input and output bytes, select the "Extra Settings" checkbox and then enter your values. Changing these settings has no effect on the bus parameters. However, the CiR synchronisation time directly depends on the I/O volume. (5) Sum of address ranges For a DP master system, STEP 7 provides 244 input bytes and 244 output bytes for future use to each one of the guaranteed slaves. For a PA master system, STEP 7 provides I/O bytes for future applications (244 - number of bytes of already existing PA slaves). Note The default value for the guaranteed number of additional slaves, the maximum number of additional slaves and the total address ranges will be reduced if the master system no longer provides sufficient resources. A change in the total address ranges also changes the CiR synchronisation time. Based on these values, SIMATIC Manager determines the bus parameters and displays the result. A change in the default volume of I/O bytes does not influence bus parameter. (6) Bus parameters The value for the Target Rotation Time (Ttr) and the watchdog are determined based on the configuration physical DP slaves (without CiR object) and the guaranteed DP slaves. The total of the input and output bytes is indirectly determined according to the guaranteed slaves. The value for the typical Target Rotation Time (Ttr typical) is independent of the CiR object. 7.3. 2 Properties of CiR element Inside an ET200M station, if you double-click the CiR element, the properties dialog of the CiR element is called up. See Picture 5.64.
PCS 7 PoT V6.0 | Edition V1.0 | August 2003 Copyright 2003 Siemens AG by A&D AS CS2 PA. All rights reserved.
Page 5 - 67

PCS 7 PoT Chapter 5 Automation Station
Picture 5.64: Properties of CiR element (1) Sum of address ranges Enter the sum of input and output bytes available for future expansions in the "Input bytes" and "Output bytes" input box. SIMATIC Manager assigns default values in these fields to make an appropriate number of input and output bytes for subsequent use. Example: For an ET200M station, 16 input and 16 output bytes per free slot are provided. Note The maximum number of bytes you can enter is determined by the processing capacity of the corresponding DP slave. For example, 128 input bytes and 128 output bytes are allowed in one ET200M station. 7.4 CiR rules (1) Adding a new ET200M module The module must be configured on the next available, highest-order slot.
In HW Config, drag the module from the Catalog onto the CiR module. • • • • •
Check the loadability in RUN offline using “Ctrl+Alt+F”. Load the new configuration in RUN mode. Connect new real module. Save the configuration if correct.
PCS 7 PoT V6.0 | Edition V1.0 | August 2003 Copyright 2003 Siemens AG by A&D AS CS2 PA. All rights reserved.
Page 5 - 68

PCS 7 PoT Chapter 5 Automation Station
(2) Re-parameterising a connected ET200M module
Carry out reparameterisation in HW Config. • • • •
• • • • •
Check the loadability in RUN offline using “Ctrl+Alt+F”. Load the new configuration in RUN mode. Save the configuration if no error.
(3) Adding a new slave The slave must be added to the master system as the last in the address range (<126).
In HW Config, drag the slave from the list onto the CiR object. Check the loadability in RUN offline using “Ctrl+Alt+F”. Load the new configuration in RUN mode. Connect new real slave. Save the configuration.
(4) “Undo” a completed action If the loadability is denied, close the HW Config editor without saving the configuration. (5) Replacing hardware Note No direct replacement! First phase:
Remove hardware in HW Config. • • • •
• • • • •
•
• •
Check the loadability in RUN offline using “Ctrl+Alt+F”. Load the new configuration in RUN mode. Remove the real hardware.
Second phase:
Insert hardware in HW Config. Check the loadability in RUN offline using “Ctrl+Alt+F”. Load the new configuration in RUN mode. Connect new real hardware. Save the configuration.
(6) Tips
It is recommended that you only make changes to one DP master system at each reconfiguration stage. Choose the right size of the process-image in the CPU-Properties. After each reconfiguration, create a backup copy of your current system configuration. This version of the backup is the only way to enable continued processing of the project without losing CiR capability.
PCS 7 PoT V6.0 | Edition V1.0 | August 2003 Copyright 2003 Siemens AG by A&D AS CS2 PA. All rights reserved.
Page 5 - 69

PCS 7 PoT Chapter 5 Automation Station
If possible, carry out reconfiguration in several stages and only make a few changes at each stage. This will enable you to keep an overview at all times.
•
•
• •
Ensure that you have appropriate bus connectors, repeaters etc. as this allows additional modules to be easily connected to the bus system. The general use of active terminating resistors is recommended. Ensure that the active backplane bus modules are present in the rack. The key combination Ctrl+Alt+F can be used to quickly check the loadability during configuration in HW Config.
PCS 7 PoT V6.0 | Edition V1.0 | August 2003 Copyright 2003 Siemens AG by A&D AS CS2 PA. All rights reserved.
Page 5 - 70

PCS 7 PoT Chapter 5 Automation Station
Exercise Exercise 5.1 Configuring I/Os 1. The task
• Configure and use I/Os in user program • Observe messages on OS if a module is removed from its slot • Use the diagnostic buffer to look for information
Following I/O signals are presumed.
Channel 0 Valve1_Opened Digital inputs Channel 1 Valve1_Closed Channel 0 Open_Valve1 Digital outputs Channel 1 Close_Valve1 Channel 0 Tank_Temp Analog inputs Channel 1 Tank_Level Channel 0 Pump_Volts Analog outputs Channel 1 Mot_Speed
Table 5.11: List of I/Os
Each automation station of the workshop is set up as shown in Picture 5.57 with DP master address at 2 and IM153 slave at 3. If your hardware is set differently you have to adapt your DP line and slave addresses accordingly.
Picture 5.65: The hardware used for Exercise 3.1
PCS 7 PoT V6.0 | Edition V1.0 | August 2003 Copyright 2003 Siemens AG by A&D AS CS2 PA. All rights reserved.
Page 5 - 71

PCS 7 PoT Chapter 5 Automation Station
2. Guideline (1) Create a new project using the New Project Wizard. Specify CPU Properties as
in Picture 2.9 and as in the lower part of Picture 5.37 where Process Image Partition No.1 is assigned with OB32.
(2) Configure a digital input module. Follow the whole sections of 4.6.1 and 4.6.2 but do not enable the Hardware Interrupt as it is done in Picture 5.38 (You may get many error signals in the workshop as the signals are not wired.) and do not necessarily set the Time-of-the-Day Stamp as it is set in Picture 5.39.
(3) Repeat the step (2) to configure the other 3 modules (a DO, AI, and AO module). Check the Properties of each module as they may look different from the Properties of a digital input module.
(4) Edit symbolic names using Table 5.8. (5) Drag-and-drop a channel block for each of the 8 signals. Refer to Picture 5.46. (6) Interconnect the channel blocks with the signals. Refer to Picture 5.45. (7) Generate module drivers. See Picture 5.51. (8) Compile the CFC program. (9) Download the program. (10) Transfer program from the SIMATIC Manager to OS. (11) Open the OS and activate the project. Look for the incoming message page in
the OS runtime. (12) Remove or plug-in a module to test what messages are reported on the OS. (13) Discuss your results. Exercise 5.2 Using the hardware diagnostics tool CPU related messages are found in the Diagnostic buffer. To diagnose other components, e.g. IM153, I/O modules, and CPs, etc. you could use the Diagnose Hardware function in the SIMATIC Manager. The menu path to locate the function is illustrated in Picture 5.13. Use the diagnostics tool to check if an I/O module has fault (e.g. by removing the module). Exercise 5.3 Messages of module driver blocks Module driver blocks are pre-configured with messages. To know what messages can be reported you have to check with the messages configuration dialog. To open the message dialog of a block, double-click on the block in the CFC and then select the Messages tab. Finds out what messages are configured with OB_BEGIN and MODE_D1. Exercise 5.4 Configuring hardware using CiR Based on your hardware components, configure some of them in HW Config and leave rest of them to be added later in runtime.
PCS 7 PoT V6.0 | Edition V1.0 | August 2003 Copyright 2003 Siemens AG by A&D AS CS2 PA. All rights reserved.
Page 5 - 72

PCS 7 PoT Chapter 5 Automation Station
Appendices Appendix 1: CPU memory reset
Step Action Results 1 Set the key, mode selector, to
the STOP position. The CPU goes into STOP mode.
2 Turn the key towards MRES. Hold it in this position until the yellow STOP LED lights for the 2nd time. Then release the key.
The yellow STOP LED goes out and then starts to flash slowly. Switch returns to the STOP position.
3 As soon as the STOP LED lights up, turn the key quickly to the MRES position and release it again.
The yellow STOP LED flashes for about 3 seconds and then remains lit. The memory of the CPU has been reset and it is in STOP mode.
Appendix 2: Hardware Diagnosis from OS In a picture insert a button. Right mouse button click on the button to open the hardware diagnosis tool from OS runtime.
Picture 5.66: Hardware diagnosis from OS – configuration 1
PCS 7 PoT V6.0 | Edition V1.0 | August 2003 Copyright 2003 Siemens AG by A&D AS CS2 PA. All rights reserved.
Page 5 - 73

PCS 7 PoT Chapter 5 Automation Station
Picture 5.67: Hardware diagnosis from OS – configuration 2
PCS 7 PoT V6.0 | Edition V1.0 | August 2003 Copyright 2003 Siemens AG by A&D AS CS2 PA. All rights reserved.
Page 5 - 74

Chapter 6:
Continuous Control - CFC


Contents: CHAPTER 6 CONTINUOUS CONTROL – CFC ..............................................................................1
1. BLOCK CONCEPT ...........................................................................................................................1
1.1 BLOCK TYPE....................................................................................................................................1 1.2 BLOCK INSTANCE............................................................................................................................4 1.3 CENTRAL TYPE CHANGES (BLOCK TYPE CHANGES) .........................................................................6 1.4 MASTER DATA LIBRARY AND PROJECT LIBRARY .............................................................................8 1.5 “CLEAN UP” FUNCTION ...................................................................................................................9 1.6 MULTI-INSTANCE BLOCK ..............................................................................................................10 1.7 ORGANISATION BLOCK .................................................................................................................11 1.8 FUNCTION BLOCKS – FB, FC, BOP...............................................................................................12 1.9 RUNTIME PROPERTIES OF BLOCKS.................................................................................................13
1.9.1 Optimising run sequence.......................................................................................................13 1.9.2 Optimising runtime group.....................................................................................................16 1.9.3 De-activating an OB in debugging .......................................................................................17 1.9.4 Sampling time .......................................................................................................................18
2. CFC CHARTS ..................................................................................................................................20
2.1 CHART I/OS (CHART IN CHART) ...................................................................................................20 2.2 COMPILING CFC CHART AS BLOCK TYPE (CHART-IN-BLOCK) ......................................................22 2.4 DYNAMIC DISPLAY........................................................................................................................22 2.5 TEST MODES..................................................................................................................................23 2.6 TEXTUAL INTERCONNECTION........................................................................................................23 2.7 ENGINEERING UNIT .......................................................................................................................25 2.8 CROSS-REFERENCE .......................................................................................................................27
3. PCS 7 LIBRARY FUNCTIONS......................................................................................................29
3.1 OPERATOR CONTROL BLOCKS .......................................................................................................29 3.1.1 OP_D, FB48 .........................................................................................................................29 3.1.2 OP_D3, FB49 .......................................................................................................................31 3.1.3 OP_A_LIM, FB46.................................................................................................................33
3.2 MOTOR AND VALVE CONTROL......................................................................................................35 3.2.1 Motor control, FB66 .............................................................................................................35 3.2.2 Valve Control, FB73 .............................................................................................................37
3.3 PID AND DOSING CONTROL...........................................................................................................42 3.3.1 PID Controller, FB61 ...........................................................................................................42 3.3.2 Dosing control with DOSE block, FB63...............................................................................46
3.4 MESSAGE BLOCKS.........................................................................................................................49 3.4.1 Block, ALARM_8P (SFB35)..................................................................................................50 3.4.2 MESSAGE, FB43 ..................................................................................................................54 3.4.3 MEAS_MON, FB65 ..............................................................................................................55 3.4.4 DIG_MON, FB62..................................................................................................................57
3.5 INTERLOCK CONTROL, BLOCK INTERLOK..................................................................................58
4. CONTROL OF A RAW MATERIAL TANK UNIT.....................................................................61
4.1 THE RAW MATERIAL TANK UNIT .................................................................................................61 4.1.1 Function description .............................................................................................................61 4.1.2 Operational procedure .........................................................................................................61 4.1.3 Operating modes...................................................................................................................62
4.2 SIMULATION OF THE RAW MATERIAL TANK UNIT ..........................................................................63 4.2.1 Design of SIM_mot ...............................................................................................................64 4.2.2 Design of SIM_val ................................................................................................................65 4.2.3 Design of SIM_lel .................................................................................................................65
LAB PROJECT RMT1 (PART1): DESIGNING CONTROLS FOR THE RMT1 UNIT .............67
1. THE TASK .......................................................................................................................................67

2. GUIDELINE......................................................................................................................................67 2.1 The starting point.....................................................................................................................67 2.2 Project functional objects ........................................................................................................67 2.3 Plant hierarchy and tag naming ..............................................................................................68 2.4 CFC charts and pictures..........................................................................................................69 2.5 Deriving block icons ................................................................................................................70 2.6 The simulation charts...............................................................................................................70 2.7 Designing Valve Controller, NK111 chart ..............................................................................70 2.8 Designing Motor Controller, NP111 .......................................................................................71 2.9 Measuring the tank level, L111................................................................................................72 2.10 Flow-rate and dosing control, FC111 ...................................................................................73 2.11 Block instances’ names..........................................................................................................75 2.12 Runtime sequence ..................................................................................................................75 2.13 Compiling Program ...............................................................................................................76 2.14 Compiling OS.........................................................................................................................76 2.15 Testing ...................................................................................................................................77
APPENDIX VALVE AND MOTOR CONTROL TEMPLATES....................................................79

PCS 7 PoT Chapter 6 Continuous Control - CFC
Chapter 6 Continuous Control – CFC CFC (Continuous Function Chart) deals with automation and control functions. Functions are represented in the CFC editor in the form of graphical blocks. In the CFC editor, you work with ready-made blocks that have a specific function. You place these function blocks in a chart, interconnect them, and assign parameters to them. 1. Block concept 1.1 Block type Block types are ready-made program sections that can be inserted in a CFC chart. When a block type is inserted, a block instance is created. You can create any number of block instances from a block type. For the SIMATIC S7 CPUs, the block types are created, edited, and compiled in the Ladder Logic editor (LAD), Statement List (STL) editor or Structured Control Language (SCL) editor. For PCS 7 projects, function blocks are created in the SCL or by compiling charts as blocks. Block types of a project are located in the Blocks folder as shown in Picture 6.1. Blocks folder also contains other blocks, e.g. system function blocks (SFB), data blocks (DB), and organisation blocks (OB).
Picture 6.1: Block types and the Blocks folder
PCS 7 PoT V6.0 | Edition V1.0 | August 2003 Copyright 2003 Siemens AG by A&D AS CS2 PA. All rights reserved.
Page 6 - 1

PCS 7 PoT Chapter 6 Continuous Control - CFC
The block type determines the characteristics (algorithm) for all implementations of this type. The name of the block is usually entered in the Symbols table or Symbols editor. In Picture 6.1, a block type, FB73, has a symbolic name VALVE, which is defined in the Symbols table as shown in Picture 6.2.
Picture 6.2: Symbols of a S7 program Block types are identified by their numbers and symbolic names while symbolic names are optional. When the system blocks are used, their symbolic names are automatically entered in the Symbols table. The block types of Blocks folder are also shown in the CFC library catalogue so that they can be accessed in the CFC editor. In Picture 6.3, block type of the S7 program, Prog1, are shown. Block types are obtained from three sources, which are from the system libraries, from user-designed libraries, or created in the project. The three sources of block types are shown in Picture 6.3.
PCS 7 PoT V6.0 | Edition V1.0 | August 2003 Copyright 2003 Siemens AG by A&D AS CS2 PA. All rights reserved.
Page 6 - 2

PCS 7 PoT Chapter 6 Continuous Control - CFC
Picture 6.3 Block types from three sources Block types are also stored in the CFC Chart folder. The CFC Chart folder contains blocks indicated by the blue boxes as shown in Picture 6.4.
PCS 7 PoT V6.0 | Edition V1.0 | August 2003 Copyright 2003 Siemens AG by A&D AS CS2 PA. All rights reserved.
Page 6 - 3
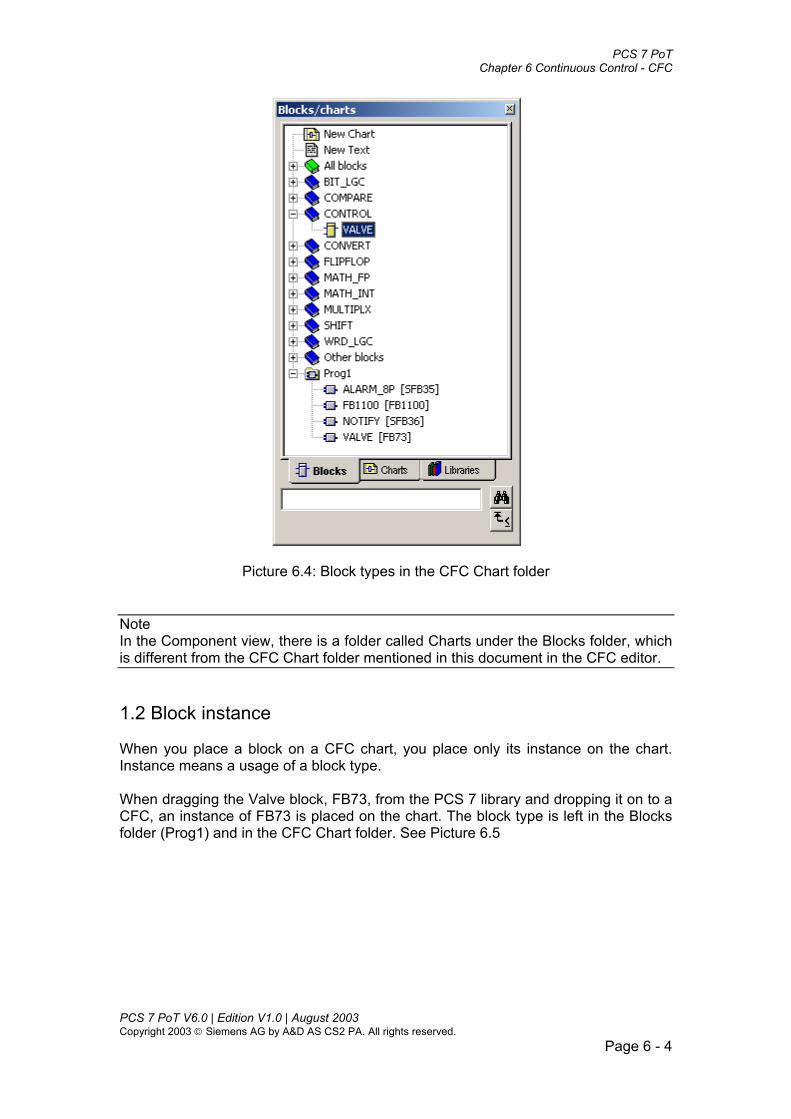
PCS 7 PoT Chapter 6 Continuous Control - CFC
Picture 6.4: Block types in the CFC Chart folder Note In the Component view, there is a folder called Charts under the Blocks folder, which is different from the CFC Chart folder mentioned in this document in the CFC editor. 1.2 Block instance When you place a block on a CFC chart, you place only its instance on the chart. Instance means a usage of a block type. When dragging the Valve block, FB73, from the PCS 7 library and dropping it on to a CFC, an instance of FB73 is placed on the chart. The block type is left in the Blocks folder (Prog1) and in the CFC Chart folder. See Picture 6.5
PCS 7 PoT V6.0 | Edition V1.0 | August 2003 Copyright 2003 Siemens AG by A&D AS CS2 PA. All rights reserved.
Page 6 - 4

PCS 7 PoT Chapter 6 Continuous Control - CFC
Picture 6.5: Block instances and types Further Instance blocks can be dragged from a type in the CFC Chart folder rather than from libraries or from the Blocks folder. The former is faster as no checks for discrepancy between a block type in the CFC Chart folder and Blocks folder are performed. Note In a real project, the master data library is used throughout a project engineering cycle. Block types are created in or copied into the master data library. The master data library is the only source for a particular project. You can create any number of block instances from a block type. You can assign names to these block instances (Refer to Picture 6.6), interconnect them, and assign parameters to them without changing the functionality of the type.
PCS 7 PoT V6.0 | Edition V1.0 | August 2003 Copyright 2003 Siemens AG by A&D AS CS2 PA. All rights reserved.
Page 6 - 5

PCS 7 PoT Chapter 6 Continuous Control - CFC
Picture 6.6: A block instance and its name 1.3 Central type changes (block type changes) Central type changes mean that all instances of a block type already included in CFC charts are automatically updated if the block type is changed. For example, a user block is modified later after its instances have been used in CFC charts. You can update all the instances by importing the new type to the CFC Chart Folder. The function, “Importing block type”, can be found following the menu path: Options > Block Types. See Picture 6.7.
PCS 7 PoT V6.0 | Edition V1.0 | August 2003 Copyright 2003 Siemens AG by A&D AS CS2 PA. All rights reserved.
Page 6 - 6

PCS 7 PoT Chapter 6 Continuous Control - CFC
Picture 6.7: Importing and updating block types Alternatively, you can use the New Version function to update block types used in a project. See Picture 6.8.
Picture 6.8: A new version overwrites all instances of the old version The Block Types dialog is where block types are compared between the Blocks folder and the CFC Chart folder. Block types in these two folders have to be the same. The function of the central type change is useful and powerful. If the PCS 7 library blocks have been changed by Siemens due to a newer release of the system. You have to decide if the newer version of the blocks is to be used in your project. It is recommended that the blocks used in a project (user-defined or the system libraries’) are collected into the project master library. See Picture 6.9.
PCS 7 PoT V6.0 | Edition V1.0 | August 2003 Copyright 2003 Siemens AG by A&D AS CS2 PA. All rights reserved.
Page 6 - 7

PCS 7 PoT Chapter 6 Continuous Control - CFC
Picture 6.9: The master data library collects the block types used in the project 1.4 Master data library and project library Block types used in a particular project, no matter they are PCS 7 library blocks or created by user, they have to be available in the master data library. After you are sure that all blocks required are in the master data library or located in a project library, it is recommended to hide all other libraries including the PCS 7 standard libraries as they have been adapted into the project library. From time to time, you have to be sure that blocks used in a project are in the master data library. It is particularly important that there is no conflict in block numbers and symbolic names within the master data library. To hide a library, use the Manage function of the SIMATIC Manager, the menu path, File > Manage. See Picture 6.9a.
PCS 7 PoT V6.0 | Edition V1.0 | August 2003 Copyright 2003 Siemens AG by A&D AS CS2 PA. All rights reserved.
Page 6 - 8

PCS 7 PoT Chapter 6 Continuous Control - CFC
Picture 6.9a: Hiding or displaying libraries 1.5 “Clean up” function If block instances are deleted from a chart or deleted because of deleting charts, their types will not be deleted either from the CFC Chart folder or from the Blocks folder though the block types are not used in the project. Block types that are not used in a project can be removed from the project by using the Clean up function as shown in Picture 6.10.
PCS 7 PoT V6.0 | Edition V1.0 | August 2003 Copyright 2003 Siemens AG by A&D AS CS2 PA. All rights reserved.
Page 6 - 9
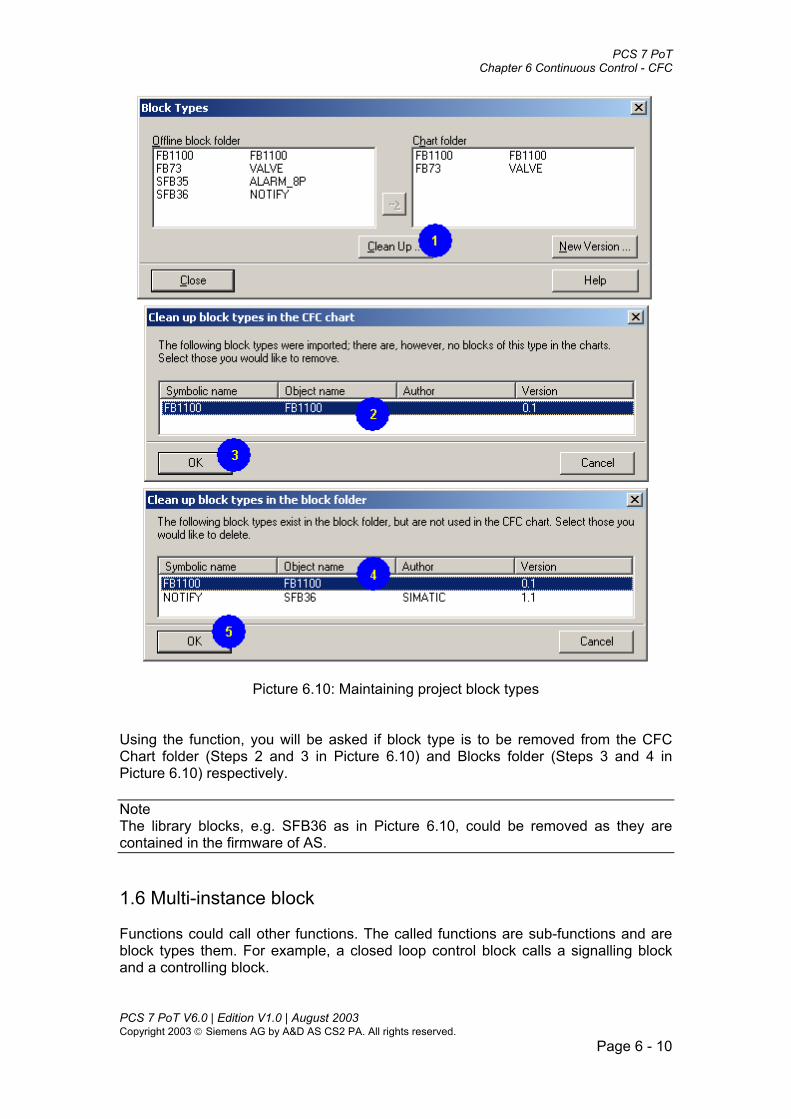
PCS 7 PoT Chapter 6 Continuous Control - CFC
Picture 6.10: Maintaining project block types Using the function, you will be asked if block type is to be removed from the CFC Chart folder (Steps 2 and 3 in Picture 6.10) and Blocks folder (Steps 3 and 4 in Picture 6.10) respectively. Note The library blocks, e.g. SFB36 as in Picture 6.10, could be removed as they are contained in the firmware of AS. 1.6 Multi-instance block Functions could call other functions. The called functions are sub-functions and are block types them. For example, a closed loop control block calls a signalling block and a controlling block.
PCS 7 PoT V6.0 | Edition V1.0 | August 2003 Copyright 2003 Siemens AG by A&D AS CS2 PA. All rights reserved.
Page 6 - 10

PCS 7 PoT Chapter 6 Continuous Control - CFC
When copying a multi-instance block to a project (to the Blocks folder) all sub-blocks have to be copied into the block folder as well. Note Called SFBs and SFCs, such as SFC6 (RD_SINFO) or SFB0 (CTU) are located firstly in the PCS 7 libraries and copied into your S7 program when you compile the calling block. Called FBs are copied to the block folder when you insert the calling block in a CFC chart if they are located in the same library as the calling block. Otherwise, the called blocks have to be copied into the S7 program Blocks folder manually. 1.7 Organisation block The interface between the operating system of a CPU and the user program are the tasks known in S7 as organisation blocks (OB). Using these OBs, specific program sections can be executed at certain times and in certain situations. There are OBs for CPU startup (Refer to Chapter 5 CPU startup characteristics), for process interrupts, and for cyclic interrupts (with different time bases) etc. For example, OB32 has cyclic interrupts every 1 second. Function blocks inserted in OB32 are called every second. When a block is inserted in a chart, by default it is automatically installed in OB35. The cycle time of OB35 is 0.1 seconds. OBs cannot be inserted nor edited in CFC. In CFC, the OBs are displayed in the Runtime editor. OBs with different time cycles are set in the HW Config as illustrated in Picture 6.11. Note The default cycles are set as in Picture 6.11. It is recommended not to change the default settings.
PCS 7 PoT V6.0 | Edition V1.0 | August 2003 Copyright 2003 Siemens AG by A&D AS CS2 PA. All rights reserved.
Page 6 - 11

PCS 7 PoT Chapter 6 Continuous Control - CFC
Picture 6.11: Cyclic OBs 1.8 Function blocks – FB, FC, BOP When a block is created, it must be "declared" as a function block (FB), a function call (FC), or a basic operation, (BOP). A FB is a block with memory; in other words the data exist during processing from one cycle to another and can be accessed. To make the data accessible, a data block (DB) is created for each block instance. In a multi-instance block, the calling FB contains subsidiary FBs but only one common DB is created. A FC is a block without memory; in other words the values generated by the block are processed immediately. No data block is required for a FC. A FC does not have default values at the outputs. A BOP is also a block without memory. They are used for simple functions such as AND, OR, etc. Basic operations are program components in CFC and are entered as the SCL statements during compilation. BOPs are located in the CFC Chart folder. Refer to Picture 6.5 where BOPs are indicated by the book icons.
PCS 7 PoT V6.0 | Edition V1.0 | August 2003 Copyright 2003 Siemens AG by A&D AS CS2 PA. All rights reserved.
Page 6 - 12
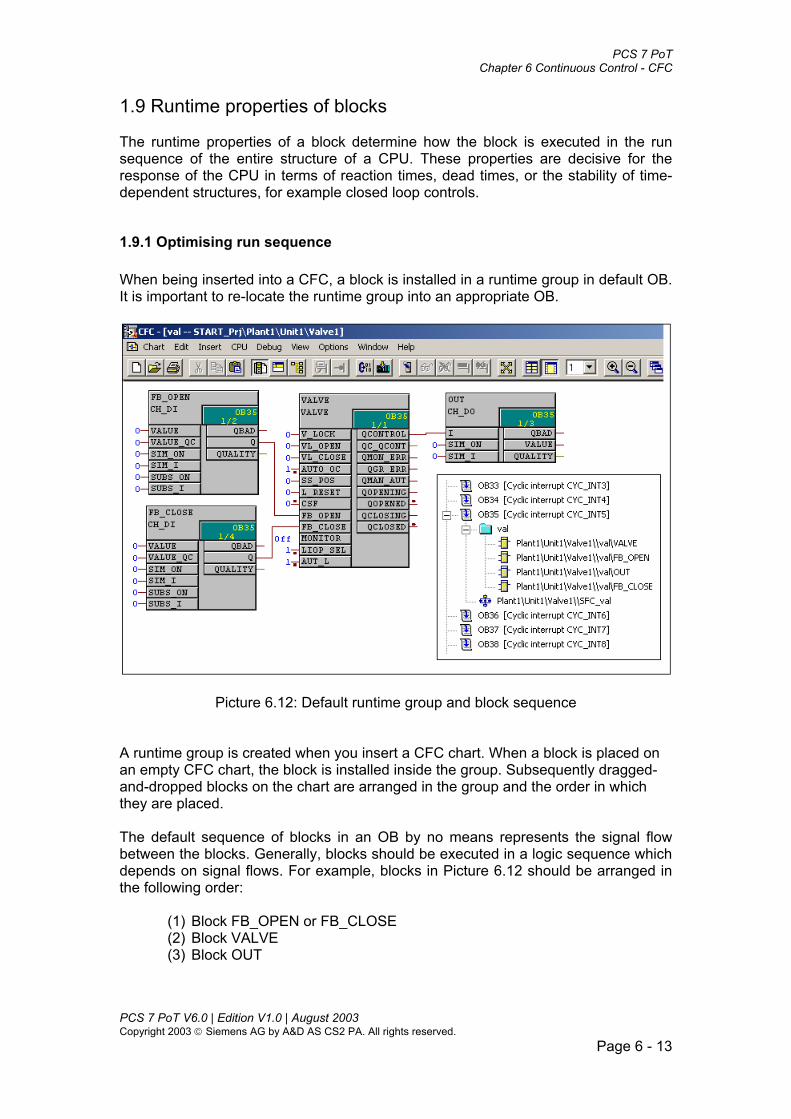
PCS 7 PoT Chapter 6 Continuous Control - CFC
1.9 Runtime properties of blocks The runtime properties of a block determine how the block is executed in the run sequence of the entire structure of a CPU. These properties are decisive for the response of the CPU in terms of reaction times, dead times, or the stability of time-dependent structures, for example closed loop controls.
1.9.1 Optimising run sequence When being inserted into a CFC, a block is installed in a runtime group in default OB. It is important to re-locate the runtime group into an appropriate OB.
Picture 6.12: Default runtime group and block sequence A runtime group is created when you insert a CFC chart. When a block is placed on an empty CFC chart, the block is installed inside the group. Subsequently dragged-and-dropped blocks on the chart are arranged in the group and the order in which they are placed. The default sequence of blocks in an OB by no means represents the signal flow between the blocks. Generally, blocks should be executed in a logic sequence which depends on signal flows. For example, blocks in Picture 6.12 should be arranged in the following order:
(1) Block FB_OPEN or FB_CLOSE (2) Block VALVE (3) Block OUT
PCS 7 PoT V6.0 | Edition V1.0 | August 2003 Copyright 2003 Siemens AG by A&D AS CS2 PA. All rights reserved.
Page 6 - 13

PCS 7 PoT Chapter 6 Continuous Control - CFC
To arrange blocks in a logic order, the function “Optimize Run Sequence” is used. The menu path to call up the function is illustrated in Picture 6.13 and settings of the function are shown in Picture 6.14.
Picture 6.13: Settings for optimising run-sequence
Picture 6.14: Activating Optimize run sequence If “Optimize run sequence” is performed, the blocks of the group will be arranged according to the signal flow sequence between the blocks.
PCS 7 PoT V6.0 | Edition V1.0 | August 2003 Copyright 2003 Siemens AG by A&D AS CS2 PA. All rights reserved.
Page 6 - 14
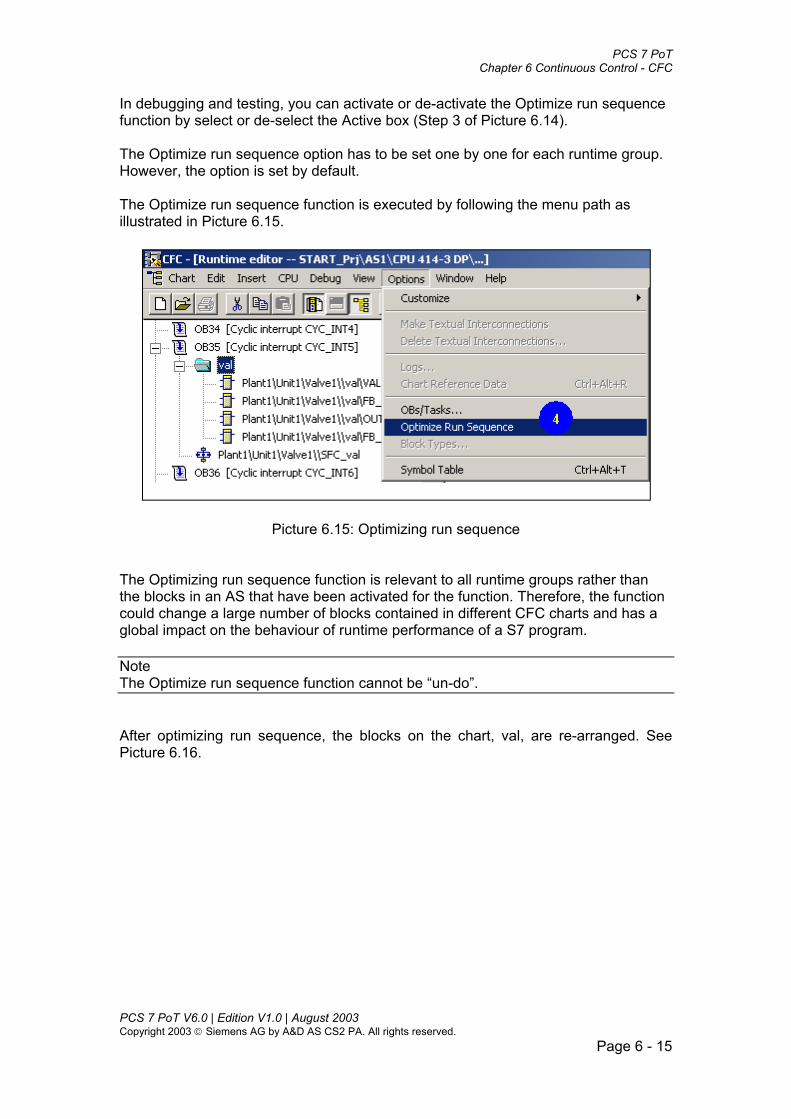
PCS 7 PoT Chapter 6 Continuous Control - CFC
In debugging and testing, you can activate or de-activate the Optimize run sequence function by select or de-select the Active box (Step 3 of Picture 6.14). The Optimize run sequence option has to be set one by one for each runtime group. However, the option is set by default. The Optimize run sequence function is executed by following the menu path as illustrated in Picture 6.15.
Picture 6.15: Optimizing run sequence
The Optimizing run sequence function is relevant to all runtime groups rather than the blocks in an AS that have been activated for the function. Therefore, the function could change a large number of blocks contained in different CFC charts and has a global impact on the behaviour of runtime performance of a S7 program. Note The Optimize run sequence function cannot be “un-do”. After optimizing run sequence, the blocks on the chart, val, are re-arranged. See Picture 6.16.
PCS 7 PoT V6.0 | Edition V1.0 | August 2003 Copyright 2003 Siemens AG by A&D AS CS2 PA. All rights reserved.
Page 6 - 15

PCS 7 PoT Chapter 6 Continuous Control - CFC
Picture 6.16: Optimised run sequence
1.9.2 Optimising runtime group If there is signal flows between charts or between runtime groups, the order of the runtime groups in an OB can also be re-arranged according to signal flows. Two charts, val and IN-OUT, are shown in Picture 6.17 and the signal flow between those blocks are the same as those in Picture 6.16 while the sequence shown in Picture 6.17 is not optimised.
Picture 6.17: Signal flow between runtime groups
PCS 7 PoT V6.0 | Edition V1.0 | August 2003 Copyright 2003 Siemens AG by A&D AS CS2 PA. All rights reserved.
Page 6 - 16

PCS 7 PoT Chapter 6 Continuous Control - CFC
To optimise runtime groups, follow the instruction shown in Picture 6.18. Details of the options on the Properties – OB/Task are explained below.
(1) “OB/task and runtime groups”: The groups and sequences within a group will be optimised (including all optimisation-enabled groups). This is the default setting.
(2) “Runtime groups only”:
All enabled runtime sequences will be optimised inside the groups. Optimisation does not apply to signal connection between groups.
(3) “None”:
The runtime groups and block sequences within the OB will be excluded from the Optimize Run Sequence function.
Picture 6.18: Setting for optimising runtime groups
1.9.3 De-activating an OB in debugging Runtime groups can be activated or deactivated individually (for example by a block output of the "BOOL" data type). Refer to Picture 6.19. If a runtime group is
PCS 7 PoT V6.0 | Edition V1.0 | August 2003 Copyright 2003 Siemens AG by A&D AS CS2 PA. All rights reserved.
Page 6 - 17

PCS 7 PoT Chapter 6 Continuous Control - CFC
deactivated, the blocks it contains will not be executed when the program is executed.
Picture 6.19: Linking a Boolean output to a runtime group You can also de-activate an OB in runtime. Refer to Picture 6.14.
1.9.4 Sampling time Function blocks with a sampling interval as a parameter have dynamics meaning that they have to be executed cyclically and their sampling time has to be the same as their cycle time. In Picture 6.20 you can see sampling time, SAMPLE_T, is set to 0.1 seconds, which is equal to the scan rate of OB35.
PCS 7 PoT V6.0 | Edition V1.0 | August 2003 Copyright 2003 Siemens AG by A&D AS CS2 PA. All rights reserved.
Page 6 - 18

PCS 7 PoT Chapter 6 Continuous Control - CFC
Picture 6.20: Sampling time SAMPLE_T can be automatically adapted to an OB cycle time using the “Update sampling time” option when compiling programs. This ensures that the sampling time is always equal to the OB cycle time. See Picture 6.21.
Picture 6.21: Updating sampling time
If the option is selected, the system checks in which cyclic OB the relevant block is installed and then writes the cycle time of the OB to the SAMPLE_T.
PCS 7 PoT V6.0 | Edition V1.0 | August 2003 Copyright 2003 Siemens AG by A&D AS CS2 PA. All rights reserved.
Page 6 - 19

PCS 7 PoT Chapter 6 Continuous Control - CFC
Note It is a good practice to update the sampling time every time when you pace a block on a CFC chart which has SAMPL_T. 2. CFC Charts 2.1 Chart I/Os (Chart in Chart) A CFC chart can have I/Os. You have to define which block I/Os are the chart I/Os. A chart with I/Os could hide details of the chart. A chart with I/Os are used in the following ways: • Inserting it in a different chart and interconnecting it with other charts or blocks • Compiling it as a block type Picture 6.22 shows how to define I/Os for a chart. You could toggle into the Chart I/Os interface by pressing the toggle button.
PCS 7 PoT V6.0 | Edition V1.0 | August 2003 Copyright 2003 Siemens AG by A&D AS CS2 PA. All rights reserved.
Page 6 - 20

PCS 7 PoT Chapter 6 Continuous Control - CFC
Picture 6.22: defining chart I/Os
You could place a chart onto another chart. As shown in Picture 6.23, the chart, CFC_val, is placed onto CFC_2. The chart nesting structure is displayed in the Blocks/charts catalogue as shown in Picture 6.23 where Chart CFC_2 contains CFC_val.
PCS 7 PoT V6.0 | Edition V1.0 | August 2003 Copyright 2003 Siemens AG by A&D AS CS2 PA. All rights reserved.
Page 6 - 21
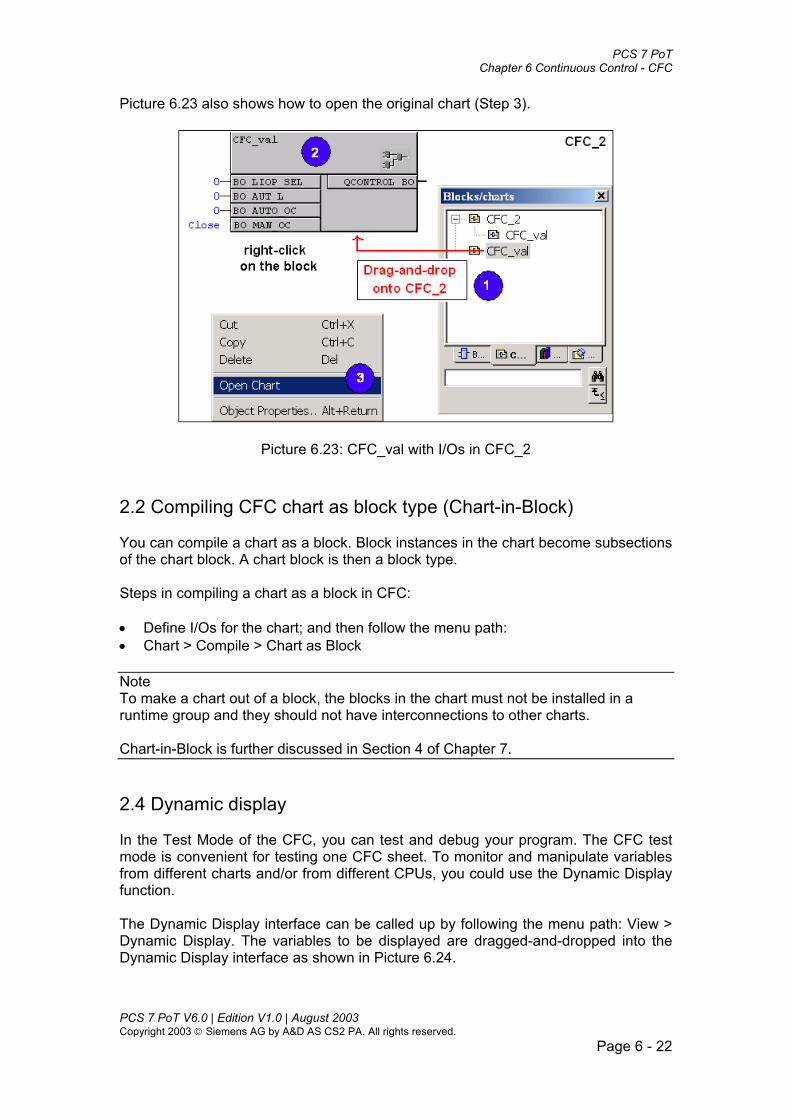
PCS 7 PoT Chapter 6 Continuous Control - CFC
Picture 6.23 also shows how to open the original chart (Step 3).
Picture 6.23: CFC_val with I/Os in CFC_2 2.2 Compiling CFC chart as block type (Chart-in-Block) You can compile a chart as a block. Block instances in the chart become subsections of the chart block. A chart block is then a block type. Steps in compiling a chart as a block in CFC: • Define I/Os for the chart; and then follow the menu path: • Chart > Compile > Chart as Block Note To make a chart out of a block, the blocks in the chart must not be installed in a runtime group and they should not have interconnections to other charts. Chart-in-Block is further discussed in Section 4 of Chapter 7. 2.4 Dynamic display In the Test Mode of the CFC, you can test and debug your program. The CFC test mode is convenient for testing one CFC sheet. To monitor and manipulate variables from different charts and/or from different CPUs, you could use the Dynamic Display function. The Dynamic Display interface can be called up by following the menu path: View > Dynamic Display. The variables to be displayed are dragged-and-dropped into the Dynamic Display interface as shown in Picture 6.24.
PCS 7 PoT V6.0 | Edition V1.0 | August 2003 Copyright 2003 Siemens AG by A&D AS CS2 PA. All rights reserved.
Page 6 - 22

PCS 7 PoT Chapter 6 Continuous Control - CFC
Picture 6.24: Dynamic display 2.5 Test modes There are two Test Modes namely Process Mode and Laboratory Mode. You can choose one of them before testing. To switch between the two modes, follow the menu path: Debug > Process Mode (or Laboratory Mode).
In process mode, communication for the online dynamic update of blocks is restricted and thus causes moderate load on the CP and bus. When the test mode is activated, all blocks are assigned the "watch off" attribute.
•
•
The laboratory mode allows convenient and efficient testing and commissioning. In contrast to process mode, the laboratory mode does not restrict communication for online dynamic update of blocks. So, use the laboratory mode with caution. When the test mode is activated, all blocks are assigned the "watch on" attribute.
2.6 Textual interconnection Textual interconnection is a virtual connection arising when a partner chart is moved to another S7 program or when it is created deliberately. Textual interconnection is indicated by a yellow triangle as shown in Picture 2.25.
PCS 7 PoT V6.0 | Edition V1.0 | August 2003 Copyright 2003 Siemens AG by A&D AS CS2 PA. All rights reserved.
Page 6 - 23

PCS 7 PoT Chapter 6 Continuous Control - CFC
Picture 6.25: Textual interconnection To create textual interconnections, follow the illustration shown in Picture 6.26.
Picture 6.26: Creating textual interconnections
If the connected partner is moved back or a purposely-created textual interconnection is fulfilled, the textual interconnection will be closed by using the
PCS 7 PoT V6.0 | Edition V1.0 | August 2003 Copyright 2003 Siemens AG by A&D AS CS2 PA. All rights reserved.
Page 6 - 24

PCS 7 PoT Chapter 6 Continuous Control - CFC
“Make Textual Interconnection” function and the yellow triangle disappeared. See Picture 6.27.
Picture 6.27: Make Textual Interconnections The “Make Textual Interconnections” function can also be performed when compiling program. Note Copying or moving charts in the Plant view within a CPU will retain all the interconnections between charts while adapt the interconnections automatically to new paths. When copying or moving a plant hierarchical folder containing chart(s) and picture(s), interconnections between the charts and between blocks and their graphic objects (icons) are retained and adapted. Therefore, textual interconnections will not occur in the two cases above. 2.7 Engineering unit For analog variables, engineering units are provided at block instances. See Picture 6.28. In the system, the engineering units are stored in several language-specific text files under the directory of Siemens > STEP7 > S7cfc. The English-language file is units_b.txt as shown in Picture 6.29. You can edit and add units in the file and they become available system-wide. When upgrading the PCS 7 system installation, you should remember to back up the files.
PCS 7 PoT V6.0 | Edition V1.0 | August 2003 Copyright 2003 Siemens AG by A&D AS CS2 PA. All rights reserved.
Page 6 - 25

PCS 7 PoT Chapter 6 Continuous Control - CFC
Picture 6.28: Engineering units
Picture 6.29: Storing of the engineering units
PCS 7 PoT V6.0 | Edition V1.0 | August 2003 Copyright 2003 Siemens AG by A&D AS CS2 PA. All rights reserved.
Page 6 - 26

PCS 7 PoT Chapter 6 Continuous Control - CFC
2.8 Cross-reference Using the menu path Options > Chart Reference Data in CFC, you can display and print project data in useful formats. See Picture 6.30. Detailed information on different views of the Cross-reference is listed in Table 6.1.
Picture 6.30: Displaying Chart Reference Data
PCS 7 PoT V6.0 | Edition V1.0 | August 2003 Copyright 2003 Siemens AG by A&D AS CS2 PA. All rights reserved.
Page 6 - 27

PCS 7 PoT Chapter 6 Continuous Control - CFC
Views Display Chart Reference Data Run sequence Graphic display of the entire run sequence of a CPU. Cross-references of addresses
The list shows all of the shared addresses used in the project along with the elements that access them.
Cross-references of CFC I/Os
The list shows the points at which SFC charts reference the CFC I/Os.
Cross-references of run-time groups
The list shows the points at which CFC and SFC charts reference run-time groups.
Cross-references of block types
The list shows the block types used and the points (CFC chart) at which they are used.
S7 resource allocation
The list displays the assignment between CFC configuration objects and S7 resources.
Local data Calculate local data stack size for OBs Block call hierarchy Graphical display of the call hierarchy of all of all blocks of the
current program. Textual interconnections
List all the (virtual) textual connections
Statistics Displays the numbers of all objects used by CFC, SFC, and the S7 resources as well as the time stamp of the current program.
Table 6.1 Cross-reference Views
Note The "reference data" function also exists in the SIMATIC Manager. You should, however, always call up the reference data for charts in CFC using the "Chart Reference Data" menu command. Starting the function in the SIMATIC Manager means that the SCL compiler recompiles the program and changes the time stamp. The "Chart Reference Data" function in CFC does not change the time stamp. (1) Different Stages The Cross-reference lists are not updated by the system automatically after they have been created. A list contains information about the state of projects at the time when it was generated. Several lists created at different stages can be opened at the same time, which is helpful if you need to compare data in different lists. If required, you can update a reference list with the menu function, View > Update or with the F5 key. (2) Different Projects Cross-reference lists do not need to be restricted to the currently active project but can access all other CFC/SFC projects. This allows you to compare several projects in one interface. (3) Documentation Along with the printed charts, the chart reference data provides you with complete documentation of your user program structure. PCS 7 PoT V6.0 | Edition V1.0 | August 2003 Copyright 2003 Siemens AG by A&D AS CS2 PA. All rights reserved.
Page 6 - 28

PCS 7 PoT Chapter 6 Continuous Control - CFC
3. PCS 7 library functions Note To understand the PCS 7 library function blocks, refer to the online Help. To call up the online Help on a block, highlight the block by a click and then press F1. 3.1 Operator control blocks An operator control block serves as the operating interface between blocks in CFC and in OS. It offers a standard solution to switching operation between in the CFC test mode and at the OS faceplate. The operator blocks are useful when debugging programs.
3.1.1 OP_D, FB48 The operator control block OP_D is used to operate a digital value of a block by means of two-pushbutton operation. If the operated value is valid, it is outputted to the output Q0. Refer to Picture 6.31.
Picture 6.31: The OP_D block
The variable, I0 is written by the OS operator control and is referred to as an Internal value. Two separate inputs are used for enabling operation of "0"and "1". They are OP_EN0 and OP_EN1. When OP_EN0 = 1, operator could enter 0. When OP_EN1 = 1, operator could enter 1. LINK_I is supplied with a value configured or interconnected in CFC. This value is referred to as External value. LINK_ON switches the external and internal values:
• LINK_ON=1: LINK_I is passed to Q0, • LINK_ON=0: Operated I0 value is passed to Q0.
BTRACK enables tracking, i.e. input I0 = LINK_I (only when LINK_ON = 1). “BTRACK = 1” ensures that a bump does not occur at output Q0 during the changeover to LINK_ON = 0. “BTRACK = 0” means that I0 remains unchanged with the last (operated) value. After the changeover to LINK_ON = 0 it is passed to the output Q0.
PCS 7 PoT V6.0 | Edition V1.0 | August 2003 Copyright 2003 Siemens AG by A&D AS CS2 PA. All rights reserved.
Page 6 - 29

PCS 7 PoT Chapter 6 Continuous Control - CFC
Variables used at the OP_D faceplate are illustrated in Picture 6.32.
Picture 6.32: Variable links at the OP_D faceplate
Note Block faceplates are parts of process pictures and operated on PCS 7 OS. They are located in the picture folder of OS. An application of the block is shown in Picture 6.33 where there are variables to be reset. You might need to reset errors occurred at function blocks. As the number of function blocks increases it is not efficient to reset the function blocks individually, for example, at each L_RESET when testing programs in CFC. All L_RESET variables can be linked to one variable, e.g. Q0. So, by resetting Q0, all the L_RESET variables can be reset. The Q0 value should be also able to be reset from OS, for example, by pressing a button. Refer to Picture 6.33. The OP_D block has the function of supplying two sources of values to one variable, which is to pass I0 to Q0 or to pass LINK_I to Q0. The variable LINK_ON is used to toggle between the two sources.
PCS 7 PoT V6.0 | Edition V1.0 | August 2003 Copyright 2003 Siemens AG by A&D AS CS2 PA. All rights reserved.
Page 6 - 30

PCS 7 PoT Chapter 6 Continuous Control - CFC
Picture 6.33: Resetting digital value with the OP_D block
3.1.2 OP_D3, FB49 The block OP_D3 is used to carry out a one-of-three digital value operation. When one of the three operating inputs I1, I2 or I3 is set, the corresponding output is set to 1 and the other two outputs are reset to 0.
Picture 6.34: Block OP_D3
PCS 7 PoT V6.0 | Edition V1.0 | August 2003 Copyright 2003 Siemens AG by A&D AS CS2 PA. All rights reserved.
Page 6 - 31

PCS 7 PoT Chapter 6 Continuous Control - CFC
I1, I2 and I3 have values assigned simultaneously to them at OS ("1" to the input to be activated and "0" to the other two). Three separate inputs are used for enabling or disabling:
• OP_EN_Ix = 1, Enabling of the operator control for input Ix, (x = 1, 2, 3.). • OP_EN_Ix = 0, Disabling of the operator control for input Ix, (x = 1, 2, 3.).
LINK_I1, LINK_I2, and LINK_I3 are supplied with one external value each (configured or interconnected). LINK_ON switches between external and internal values:
• LINK_ON = 1, LINK_Ix are processed and passed on to Qx. • LINK_ON = 0, Operator-controllable Ix inputs are processed and passed
on to Qx. BTRACK allows tracking of the operator-controllable inputs Ix (only at LINK_ON=1). The selection logic takes over the three input values (Ix or LINK_Ix) in their sequence x=1,2,3 and memorises the highest index "x" of the input which has a "1". The output Qx corresponding to this index is set ("1") and the other two outputs Qx are reset ("0"). If all three inputs I1 = I2 = I3 = 0, the outputs are not changed. Variables used by the faceplate are illustrated in Picture 6.35.
Picture 6.35: Variable links of the OP_D3 faceplate
An application of the block is to select between operating modes of Manual, Automatic, and Maintenance as shown in Picture 6.36.
PCS 7 PoT V6.0 | Edition V1.0 | August 2003 Copyright 2003 Siemens AG by A&D AS CS2 PA. All rights reserved.
Page 6 - 32
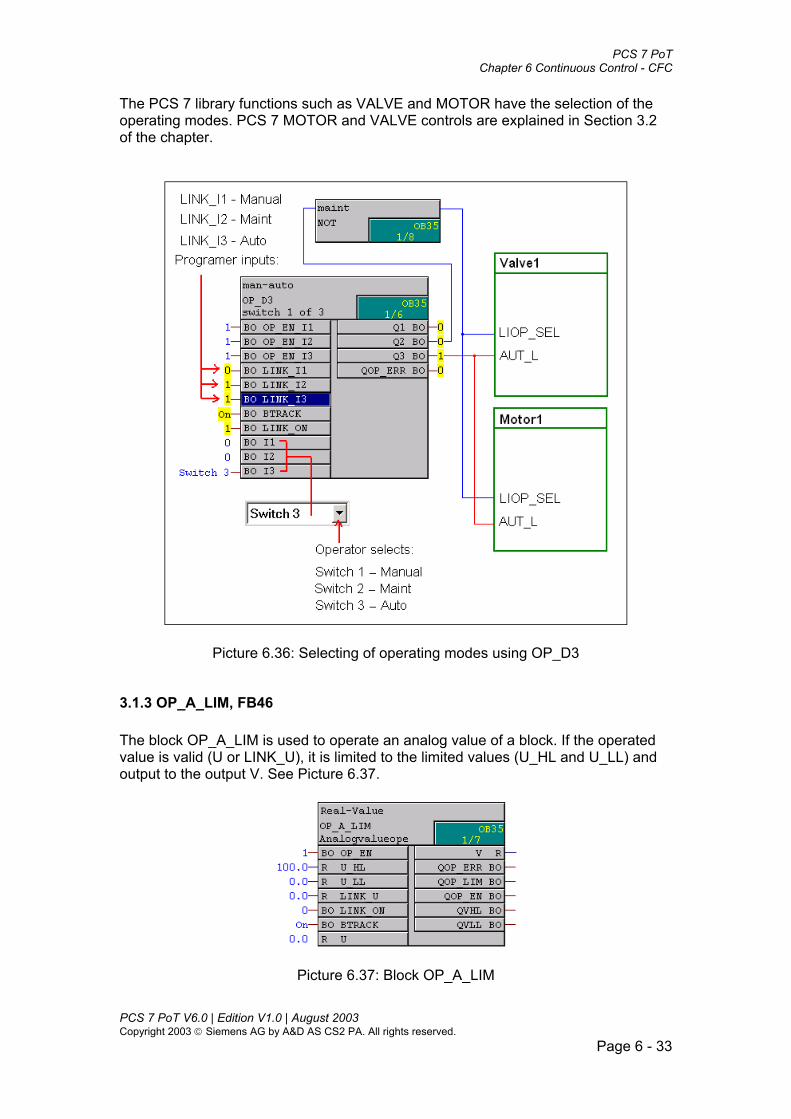
PCS 7 PoT Chapter 6 Continuous Control - CFC
The PCS 7 library functions such as VALVE and MOTOR have the selection of the operating modes. PCS 7 MOTOR and VALVE controls are explained in Section 3.2 of the chapter.
Picture 6.36: Selecting of operating modes using OP_D3
3.1.3 OP_A_LIM, FB46 The block OP_A_LIM is used to operate an analog value of a block. If the operated value is valid (U or LINK_U), it is limited to the limited values (U_HL and U_LL) and output to the output V. See Picture 6.37.
Picture 6.37: Block OP_A_LIM
PCS 7 PoT V6.0 | Edition V1.0 | August 2003 Copyright 2003 Siemens AG by A&D AS CS2 PA. All rights reserved.
Page 6 - 33

PCS 7 PoT Chapter 6 Continuous Control - CFC
U is written by the OS operator control. The operator control is enabled with OP_EN = 1 and disabled with OP_EN = 0. LINK_U is supplied with an external value (configured or interconnected). Note In the PCS 7 library functions, the terms, “external” and “Internal” are used. “Internal” means a value or setpoint is set at the faceplate, e.g. the variable, U of OP_A_LIM, is the Internal value. “External means that a value or setpoint is set in CFC by interconnecting or directly assigning value. LINK_ON switches between the external and internal value after it is limited to U_LL and U_HL.
• LINK_ON = 1, limited LINK_U is passed on to V. • LINK_ON = 0, limited U is passed on to V and written back to input U.
This means that the input U can be changed without operator control but by changing the operating limits.
BTRACK enables tracking, i.e. input U = LINK_U (only when LINK_ON = 1). “BTRACK = 1” ensures that a bump does not occur at output V during the changeover to LINK_ON = 0. “BTRACK = 0” means that U remains unchanged with the last (operated) value. After the changeover to LINK_ON = 0 it is passed to the output V. Variables used by the block faceplate are shown in Picture 6.38.
Picture 6.38: Variable links of the OP_A_LIM faceplate An application of OP_A_LIM is illustrated in Picture 6.39 where you want to test a simulation tank. For example, the tank is expected to supply a flow at rate of 45 l/s.
PCS 7 PoT V6.0 | Edition V1.0 | August 2003 Copyright 2003 Siemens AG by A&D AS CS2 PA. All rights reserved.
Page 6 - 34

PCS 7 PoT Chapter 6 Continuous Control - CFC
Programmer could key in the value at LINK_U in CFC and operator could key in the value at the faceplate.
Picture 6.39: Adjusting real values in CFC and OS 3.2 Motor and Valve control
3.2.1 Motor control, FB66 The block is used to drive motors with a control signal (on/off). A motor running feedback (on/off) can be monitored optionally. The monitoring feedback signal is supplied by an auxiliary contactor. In the standard view of the MOTOR faceplate, the operator could select one of the operating modes (Manual or Automatic) if the variable AUT_ON_OP = 1. If the operating mode, AUTO, is selected from program (by setting LIOP_SEL = 1 and AUT_L = 1) mode selection at the faceplate is disabled. On/off command can be issued at the faceplate (using MAN_ON) or by program (using AUT_ON). In the AUTO mode, the command can only be issued by program. Note Refer to the online Help on MOTOR block.
PCS 7 PoT V6.0 | Edition V1.0 | August 2003 Copyright 2003 Siemens AG by A&D AS CS2 PA. All rights reserved.
Page 6 - 35

PCS 7 PoT Chapter 6 Continuous Control - CFC
Picture 6.40: Variable links of the Motor faceplate
In the Maintenance view of the MOTOR faceplate, you can set the monitoring time. Refer to Picture 6.41. If the monitoring time, TIME_MON, is less than the time between QSTART being set and the FB_ON being seen, then QMON_ERR is set..
Picture 6.41: Monitoring of motors Note Monitoring Time, TIME_MON, is set in CFC though it can be done at the faceplate in the Maintenance view. It is common that the monitoring time is set in CFC and not changed at the faceplate. PCS 7 PoT V6.0 | Edition V1.0 | August 2003 Copyright 2003 Siemens AG by A&D AS CS2 PA. All rights reserved.
Page 6 - 36

PCS 7 PoT Chapter 6 Continuous Control - CFC
In the Alarm View of the faceplate, messages configured with the block are displayed if they are triggered. Three types of the messages are pre-configured in the block as shown in Picture 6.42.
Picture 6.42: Messages of the Motor block
3.2.2 Valve Control, FB73 The block is used to drive control valves (open/close) with a control signal (open/close). Optionally the two position feedback signals (opened/closed) are monitored. The position feedback signals are generated by limit switches. Picture 6.43 shows how the valve controller works.
PCS 7 PoT V6.0 | Edition V1.0 | August 2003 Copyright 2003 Siemens AG by A&D AS CS2 PA. All rights reserved.
Page 6 - 37

PCS 7 PoT Chapter 6 Continuous Control - CFC
Interlock: The interlock function takes priority over all other control signals and errors. If V_LOCK is set, the valve is brought to its position of reset (QCONTROL = 0). Monitoring: The monitoring logic checks the agreement between the output control command QCONTROL and the feedback of the process variable of the valve (FB_OPEN, FB_CLOSE). If the limit has not been reached after the monitoring time TIME_MON has expired, the output QMON_ERR is set. Error handling: The monitoring error (QMON_ERR = 1) can be reset either by operating RESET or automatically by interconnection to a rising edge of L_RESET. Message characteristics: The monitoring error and control system fault CSF will trigger the two messages. Message suppression will be active if the RUNUPCYC cycles have not expired yet since a restart.
Manual mode: The input MAN_OC is operated at the faceplate. Automatic mode: The input AUT_OC is used in the CFC. Note: Switching between the two modes is explained later in the section.
Picture 6.43: Valve control
You could operate the valve controller at the faceplate or in CFC via interconnections. Picture 6.44 illustrates the variable links of the faceplate.
Picture 6.44: Variable links of Valve faceplate
PCS 7 PoT V6.0 | Edition V1.0 | August 2003 Copyright 2003 Siemens AG by A&D AS CS2 PA. All rights reserved.
Page 6 - 38

PCS 7 PoT Chapter 6 Continuous Control - CFC
Messages are texted with the function block. You can view the messages in the Properties of the block. Double-click a block to pop up its Properties dialog as shown in Picture 6.45.
Picture 6.45: Messages embedded in the Valve block
Then, click on the Message button to open the message configuration dialog as shown in Picture 6.46 where two messages are pre-defined.
PCS 7 PoT V6.0 | Edition V1.0 | August 2003 Copyright 2003 Siemens AG by A&D AS CS2 PA. All rights reserved.
Page 6 - 39

PCS 7 PoT Chapter 6 Continuous Control - CFC
Picture 6.46: Messages of the Valve block Those messages are reported at the faceplate in the OS runtime. Refer to Picture 6.47.
Picture 6.47: Messages of the Valve block at the faceplate
PCS 7 PoT V6.0 | Edition V1.0 | August 2003 Copyright 2003 Siemens AG by A&D AS CS2 PA. All rights reserved.
Page 6 - 40

PCS 7 PoT Chapter 6 Continuous Control - CFC
Monitoring time is set in the Maintenance View as shown in Picture 6.48.
Picture 6.48: Monitoring time and enabling The batch view of the Valve faceplate is shown in Picture 6.49.
Picture 6.49: Variable links in the Batch View
PCS 7 PoT V6.0 | Edition V1.0 | August 2003 Copyright 2003 Siemens AG by A&D AS CS2 PA. All rights reserved.
Page 6 - 41

PCS 7 PoT Chapter 6 Continuous Control - CFC
The operating modes of the Valve control are illustrated in Picture 6.50.
Picture 6.50: Switching between operating modes 3.3 PID and dosing control
3.3.1 PID Controller, FB61 The CTRL_PID (FB61) block is a continuous PID controller used for fixed setpoint control, cascade control (single / multiple cascades), and ratio control. Features of the control functions
• Operating modes: Manual, automatic or tracking. • Limit monitoring of the process variable and control error signal and
message generation via the ALARM_8P block. • Feedforward control. • Setpoint tracking (setpoint, SP = feedback process variable, PV_IN). • Setting the range of values for the setpoint and process variable (physical
normalising). • Setting the range of values for the manipulated variable (physical
normalising). • Dead band (on threshold) in the error signal and its associated values. • Proportional, integral and derivative action which can be activated and de-
activated individually. • Proportional and derivative action in the feedback path. • Operating point setting for P or PD controller mode. • Disturbance variable input.
PCS 7 PoT V6.0 | Edition V1.0 | August 2003 Copyright 2003 Siemens AG by A&D AS CS2 PA. All rights reserved.
Page 6 - 42

PCS 7 PoT Chapter 6 Continuous Control - CFC
Picture 6.51 shows the variables related to selecting of the operating modes (Manual and AUTO) of the PID control. Operator uses AUT_ON_OP to select Manual or Auto provided that the two actions are enabled by MANOP_EN and AUTOP_EN respectively. When LIOP_MAN_SEL is set, the mode selection depends on AUT_L in program. Results of mode selection is indicated at the block outputs, QMAN_AUT, QMANOP, and QAUTOP.
Picture 6.51: Selecting operating modes Picture 6.52 shows the selection of setpoint sources, i.e. the External setpoint (set from the program) or the Internal setpoint (set at the faceplate). Internal setpoint variable, SP_OP, is used in the Internal mode. External setpoint variable, SP_EXT, is used in the External mode. The setpoint modes are selected either at faceplate via variable, SPEXTSEL_OP, which is enabled by a pair of variables, SPEXT_EN and SPINT_EN, or in program via variable, SPEXTON_L, which is enabled by LIOP_INT_SEL. Indication of the setpoint mode selection includes variables, QSPEXTON, QSPEXTEN, and QSPINTEN. SP_OP_ON enables (from program) operator to input setpoint.
PCS 7 PoT V6.0 | Edition V1.0 | August 2003 Copyright 2003 Siemens AG by A&D AS CS2 PA. All rights reserved.
Page 6 - 43

PCS 7 PoT Chapter 6 Continuous Control - CFC
Picture 6.52: Selecting of setpoint sources at the faceplate on OS and in the CFC
Process variable, PV_IN, and related variables are shown in Picture 6.53. The value is alarmed if it hits the limits, PVH_ALM, PVH_WRN, PVL_WRN, and PVL_ALM with hysteresis, HYS. Messages can be suppressed individually via the corresponding M_SUP_xx inputs. The bar range is set by MO_PVHR and MO_PVLR. Process value is normalised by NM_PVHR and NM_PVLR.
Picture 6.53: Process values and variables at the faceplate on OS and in the CFC
PCS 7 PoT V6.0 | Edition V1.0 | August 2003 Copyright 2003 Siemens AG by A&D AS CS2 PA. All rights reserved.
Page 6 - 44

PCS 7 PoT Chapter 6 Continuous Control - CFC
Error between setpoint and process value, ER, and related variables are given in Picture 6.54.
Picture 6.54: Error related variables Manipulated variable, LMN, and related variables are given in Table 6.2.
Variable name Meaning
LMN Manipulated value
LMNR_IN Feedback of LMN
NM_LMNHR NM_LMNLR Normalised range limits for the manipulated value
LMN_HLM LMN_LLM LMN high limit or low limit
MAN_HLM MAN_LLM Manual value for LMN high or low limit
MAN_OP LMNOP_ON
Manual input of manipulated value Enable to input manipulated value at MAN_OP
LMN_TRK LMN_SEL
Tracking of external manipulated value Enable to track external value
QLMN_HLM QLMN_LLM Indicate alarms
QLMNOP Indicate LMNOP_ON
Table 6.2: LMN related variables
PCS 7 PoT V6.0 | Edition V1.0 | August 2003 Copyright 2003 Siemens AG by A&D AS CS2 PA. All rights reserved.
Page 6 - 45

PCS 7 PoT Chapter 6 Continuous Control - CFC
Some of the LMN variables are also shown in Picture 6.55.
Picture 6.55: Manipulated variables
3.3.2 Dosing control with DOSE block, FB63 The DOSE block is used for upsizing or downsizing batches in single-component dosing with weighing devices and also for dosing using volumetric measuring devices. When flow-rate is used the flow should be made available after integration at input PV_IN. At the end of dosing an automatic correction for dribbling can be made which will become active at the next dosing. The original dribbling is specified at the input DRIBB. Picture 6.56 shows how setpoint values are used in the dose control. The internal/external operating modes can be set, either via the input SPEXTSEL_OP or the interconnected input SPEXON_L. The result toggles between "internal setpoint" and "external setpoint".
Internal. The setpoint is input by the operation of SP_OP and limited to SP_LLM / SP_HLM. “Internal” means that operator is able to adjust the setpoint value.
•
• External. The setpoint (SP) is obtained from SP_EXT and limited as described above. “External” means that SP_EXT is valid setpoint and you can assign it with a value or interconnected.
PCS 7 PoT V6.0 | Edition V1.0 | August 2003 Copyright 2003 Siemens AG by A&D AS CS2 PA. All rights reserved.
Page 6 - 46

PCS 7 PoT Chapter 6 Continuous Control - CFC
Picture 6.56: Setpoints for dosing control
Manual operation of a Dose block involves the following steps (refer to Picture 6.57):
STEP 1: Start. (Off -> dosing) STEP 2
a: dosing ends. (dosing -> Off) b: You may pause the dosing.
STEP 3 a: After Pause, you then Continue. Go to STEP 1. b: After Pause, you can Cancel.
STEP 4 a: If Cancel, you can Cancel the action. Go to STEP 3. b: If Cancel, confirm the action by pressing OK. Go to STEP 2a.
PCS 7 PoT V6.0 | Edition V1.0 | August 2003 Copyright 2003 Siemens AG by A&D AS CS2 PA. All rights reserved.
Page 6 - 47

PCS 7 PoT Chapter 6 Continuous Control - CFC
Picture 6.57: Operation of Dose block
Variables related to operating the dose block is shown in Picture 6.58.
Picture 6.58: Dosing control in CFC and at the faceplate on OS
PCS 7 PoT V6.0 | Edition V1.0 | August 2003 Copyright 2003 Siemens AG by A&D AS CS2 PA. All rights reserved.
Page 6 - 48

PCS 7 PoT Chapter 6 Continuous Control - CFC
Messages (6 events) configured in the DOSE block are shown in the lower part of Picture 6.59. The upper part of the picture shows that the messages triggered are displayed in the Alarm view of the faceplate.
Picture 6.59: Messages of the DOSE block 3.4 Message blocks Operator may require information on events involving changes of a digital value or status in an AS. Due to the message blocks implemented in AS, there is not need for the OS system to poll the AS in order to obtain this information. Message blocks monitor changes and report them to OS. OS system can visualise, log and archive those messages. You can generate a block-related message by calling one of the following message blocks, SFBs, in your program:
• SFB 36 "NOTIFY" • SFB 31 " NOTIFY_8P" • SFB 35 "ALARM_8P" • SFB 34 "ALARM_8"
Alarm_8P is used extensively in the PCS 7 system. Detailed description of the block is given in this section. A summary of the above system message blocks is provided in Table 6.3. PCS 7 PoT V6.0 | Edition V1.0 | August 2003 Copyright 2003 Siemens AG by A&D AS CS2 PA. All rights reserved.
Page 6 - 49

PCS 7 PoT Chapter 6 Continuous Control - CFC
Attribute:
S7_a_type
Message Block
Block No. Description
Alarm_8
ALARM_8
SFB34
8 channels, can be acknowledged, no associated values
Alarm_8P
ALARM_8P
SFB35
8 channels, can be acknowledged, up to 10 associated values per channel
Notify
NOTIFY
SFB36
One channel, cannot be acknowledged, up to 10 associated values
Notify_8P
NOTIFY_8P
SFB31
8 channels, cannot be acknowledged, up to 10 associated values
Table 6.3: The block-related system message blocks
Note In most cases of a PCS 7 project, message blocks, e.g. Alarm_8P, are called by other blocks (embedded into other blocks) and are not used on their own. The PCS 7 library functions also provides functional-specific message blocks for applications, which are:
• MESSAGE, FB43, used to generate configurable messages. It forms the interface between the block outputs whose changes are to be signalled and the ALARM_8P block.
• MEAS_MON, FB65, used to monitor if a measured value (analog signal) is violated to the limits.
• DIG_MON, FB64, used to observe a digital measuring point with chatter suppression.
3.4.1 Block, ALARM_8P (SFB35) Alarm_8P generates messages with associated values for 8 signals. A message is generated when an edge change is detected at one or more signals (exception: a message is always sent at the first block call). You can acknowledge each individual message separately or all eight individual messages at once. You can use the ACK_STATE output parameter to incorporate the acknowledgement states of the individual messages in your program. Alarm_8P can temporarily store two messages. Any further signal changes are then ignored. This loss of messages is indicated by the ERROR and STATUS output parameters (ERROR = 0, STATUS = 11); the logged-on display devices are also informed of the loss.
PCS 7 PoT V6.0 | Edition V1.0 | August 2003 Copyright 2003 Siemens AG by A&D AS CS2 PA. All rights reserved.
Page 6 - 50

PCS 7 PoT Chapter 6 Continuous Control - CFC
Picture 6.60: Alarm_8P
After the first block call, all the bits of the ACK_STATE output are set and it is assumed that the previous values of inputs SIG_I, 1 < I < 8 were 0. Supposed that there are two-message signals and two associated values are concerned as shown in Picture 6.61.
PCS 7 PoT V6.0 | Edition V1.0 | August 2003 Copyright 2003 Siemens AG by A&D AS CS2 PA. All rights reserved.
Page 6 - 51
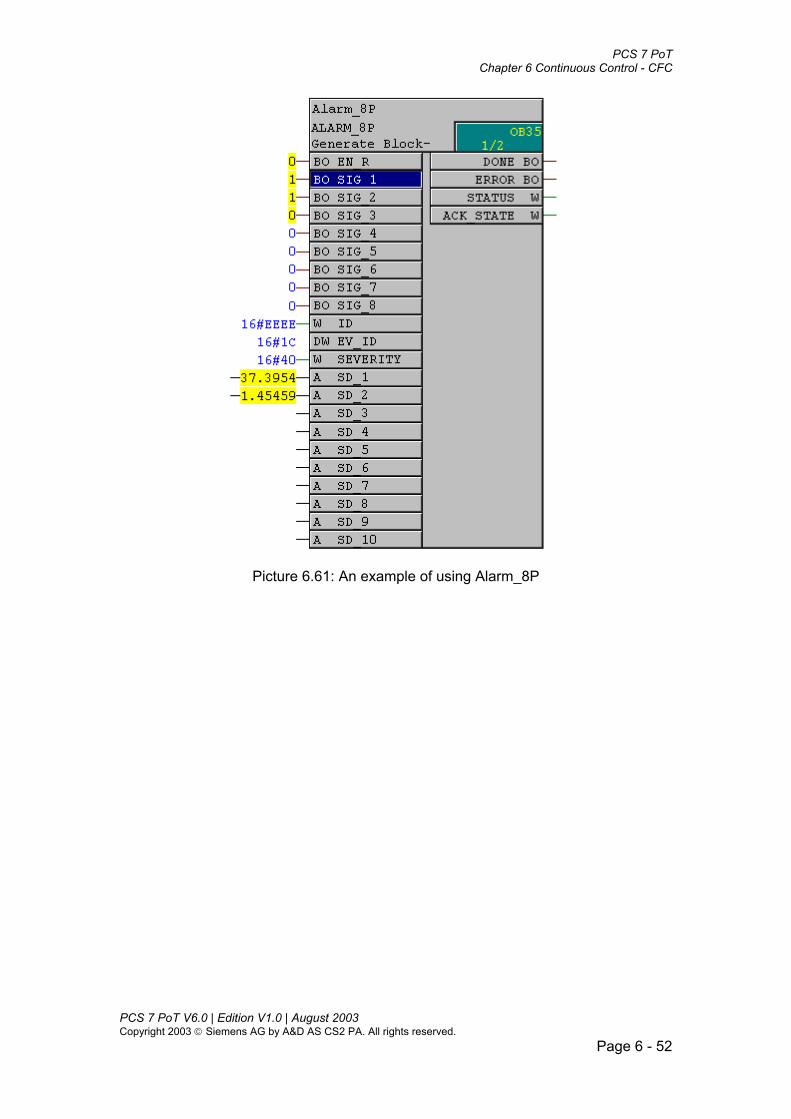
PCS 7 PoT Chapter 6 Continuous Control - CFC
Picture 6.61: An example of using Alarm_8P
PCS 7 PoT V6.0 | Edition V1.0 | August 2003 Copyright 2003 Siemens AG by A&D AS CS2 PA. All rights reserved.
Page 6 - 52

PCS 7 PoT Chapter 6 Continuous Control - CFC
Configuration of Alarm_8P is shown in Picture 6.62.
Picture 6.62: Configuration dialog of Alarm_8P
In the Default texts tab (Picture 6.61), you define the event texts possibly including associated values. You can also define the info texts. Event and info texts are specific for each of the 8 signals. Then in the Additional text tab (Picture 6.62a), you define texts which are common for the block. The first 4 text fields are reserved for the PCS 7 system to use. The first text field picks up the plant hierarchy and tells the source of the trigger. The second text field picks up the OS area. The third text field will be filled with the batch name. And, the forth text field will display operation information. The other 5 text fields are free.
PCS 7 PoT V6.0 | Edition V1.0 | August 2003 Copyright 2003 Siemens AG by A&D AS CS2 PA. All rights reserved.
Page 6 - 53

PCS 7 PoT Chapter 6 Continuous Control - CFC
Picture 6.62a: Message configuration of Alarm_8P
After configuration, the example reports the messages when the signals are triggered. See Picture 6.62b.
Picture 6.62b: Messages with associated values at OS
3.4.2 MESSAGE, FB43 MESSAGE is a direct use of Alarm_8p while hiding some system information. See Picture 6.63. Configuration of the messages is illustrated in Picture 6.64.
PCS 7 PoT V6.0 | Edition V1.0 | August 2003 Copyright 2003 Siemens AG by A&D AS CS2 PA. All rights reserved.
Page 6 - 54

PCS 7 PoT Chapter 6 Continuous Control - CFC
Picture 6.63: The Message block
Picture 6.64: Configuration of Message
3.4.3 MEAS_MON, FB65 Analog signal is supplied at the block input, U, and then the block algorithm checks if the analog value violates with the limits. Two pairs of the limits are checked. The warning limits are U_WL and U_WH and the alarm limits U_AL and U_AH. An external fault (regarding automation systems) can also be monitored. Refer to Pictures 6.65 and 6.66.
PCS 7 PoT V6.0 | Edition V1.0 | August 2003 Copyright 2003 Siemens AG by A&D AS CS2 PA. All rights reserved.
Page 6 - 55

PCS 7 PoT Chapter 6 Continuous Control - CFC
Picture 6.65: Block MEAS_MON By default, message texts of the block are copied with the block comment texts using system value $$BlockComment$$. You could write meaningful block comment texts so that the messages are meaningful. See Picture 6.66.
Picture 6.66: Message texts of MEAS_MON
PCS 7 PoT V6.0 | Edition V1.0 | August 2003 Copyright 2003 Siemens AG by A&D AS CS2 PA. All rights reserved.
Page 6 - 56

PCS 7 PoT Chapter 6 Continuous Control - CFC
3.4.4 DIG_MON, FB62 The block is used to observe a digital measuring point with chatter suppression. Both the signal state and the state of the control system (external control system faults, channel faults) are monitored. See Picture 6.67.
Picture 6.67: Block DIG_MON The parameter MSG_CLAS can be used to determine with which message class the measuring point is signalled. See Picture 6.68.
Picture 6.68: Message configuration of DIG_MON The digital value at input, I, is monitored for changes. A timer is started from zero timing each edge of the input signal. Once the waiting time configured under SUPPTIME has elapsed, input value, I, is passed on to output Q. This ensures that only those signals which are present for at least the time specified by SUPPTIME will be passed on to the output. Signals which change more frequently than SUPPTIME will not be passed on. When SUPPTIME < SAMPLE_T, input value I is directly passed on to output, Q. DIG_MON could be applied to monitor digital signals in a process. An application of the block is to monitor an emergency stop signal. An emergency stop could be triggered as in Picture 6.69 by a device (via CH_DI) or forced by an operator (via OP_D). Hence, monitoring an emergency stop could be combined with considering where the emergency stop signal is from. See Picture 6.69. The message text could be “EMERGENCY STOP” for all MSG_CLAS = 1,…,6. PCS 7 PoT V6.0 | Edition V1.0 | August 2003 Copyright 2003 Siemens AG by A&D AS CS2 PA. All rights reserved.
Page 6 - 57

PCS 7 PoT Chapter 6 Continuous Control - CFC
Picture 6.69: Emergency Stop with DIG_MON 3.5 Interlock control, Block INTERLOK The first 5 inputs of the interlock block, I1_1 to I1_5, form a group. Every signal can be interconnected directly or inverted by setting the corresponding inputs NEG1_1, …, NEG1_5. See Picture 6.70.
PCS 7 PoT V6.0 | Edition V1.0 | August 2003 Copyright 2003 Siemens AG by A&D AS CS2 PA. All rights reserved.
Page 6 - 58

PCS 7 PoT Chapter 6 Continuous Control - CFC
Picture 6.70: Block INTERLOK
The logic of the first group is set by means of AND_OR1. The result can be inverted using variable, NEGRES_1. The same applies for the second group of 5 inputs as for the first group. The two group results can be ANDed or ORed. The input, OVERWRITE=1 can be used to set the output Q to 0 when an interlock is active (Q=1). This is only possible if OVERW_EN=1. The input is reset, OVERWRITE=0, if OVERW_EN=0 or if no interlock condition is fulfilled. Q_OVERWR=1 is displayed at the output to show that the output Q was overwritten. The output parameter FIRST_I contains the number (1 to 10) of the Input Ix that was first TRUE or inverted FALSE. If several conditions are set simultaneously, the lowest number is entered in FIRST_I. If the edge of the input RESET is positive, FIRST_I is set equal to zero, if none of the above conditions is fulfilled. The block has a faceplate on OS. Status of the conditions is displayed at the faceplate. Texts of interlock signals are written in Text_0 and Text_1. See Picture 6.71.
PCS 7 PoT V6.0 | Edition V1.0 | August 2003 Copyright 2003 Siemens AG by A&D AS CS2 PA. All rights reserved.
Page 6 - 59

PCS 7 PoT Chapter 6 Continuous Control - CFC
Picture 6.71: Faceplate of INTERLOK
PCS 7 PoT V6.0 | Edition V1.0 | August 2003 Copyright 2003 Siemens AG by A&D AS CS2 PA. All rights reserved.
Page 6 - 60

PCS 7 PoT Chapter 6 Continuous Control - CFC
4. Control of a raw material tank unit 4.1 The Raw Material Tank Unit
4.1.1 Function description Control and automation tasks are described using piping and instrumentation convention flow diagram, known as P & I diagram. The P & I diagram of a raw material (liquid) tank unit is shown in Picture 6.72.
Picture 6.72: The raw materials tank 1 (RMT1) unit The unit is the first raw material tank in a production line and will be referred to as RMT1 in the manual. The main operating task related the tank unit is to dose a certain amount of materials to one of the two reactors.
4.1.2 Operational procedure The operation starts with the selection of a reactor, for example, Reactor 1. Then, the route to Reactor 1 should be clear by opening the valves on the route, which is opening NK113, NK112, and NK111. After a route is clear, flow-rate control of the liquid is released, the pump, NP111, is then switched on and delivering of the liquid starts. The dosing function starts when the pump starts to run. The operational procedure of the RMT1 unit is depicted in Picture 6.73.
PCS 7 PoT V6.0 | Edition V1.0 | August 2003 Copyright 2003 Siemens AG by A&D AS CS2 PA. All rights reserved.
Page 6 - 61

PCS 7 PoT Chapter 6 Continuous Control - CFC
Select Reactor 1 or Reactor 2 ?
How much to be dosed?
Open NK113 or NK114
Open NK112
Open NK111
Release Controller, FC111
Switch on pump, NP111
Start dosing
Dosing completed?
Close NK111Stop FC111
Switch off NP111Close NK112
Close NK113 or NK114
Start, Initialising procedure
End, Terminating procedure
Picture 6.73: Control procedure of RMT1
4.1.3 Operating modes There are three operating modes in which the unit is controlled namely Manual, Automatic, and Maintenance. • Manual
In Manual mode, operator has full access to individual functions and all the PCS7 PCS 7 PoT V6.0 | Edition V1.0 | August 2003 Copyright 2003 Siemens AG by A&D AS CS2 PA. All rights reserved.
Page 6 - 62

PCS 7 PoT Chapter 6 Continuous Control - CFC
blocks concerned are forced into Manual mode.
• Automatic In AUTOMATIC, program takes control of the production and all functions are sequenced and forced into Automatic mode. It is not possible to change and interrupt individual devices and functions.
• Maintenance (MAINT)
In Maintenance mode, operator has access to set individual functions to Manual or Automatic mode. If a device or function is in Manual mode, you also have full access to change settings.
4.2 Simulation of the raw material tank unit To facilitate designing control functions of the tank unit, simulation of the unit is developed first, which includes a CFC chart, SIM_val, simulating the valves, NK111 to NK114, a chart, SIM_mot, simulating the pump (NP111), and a chart, SIM_lel, simulating the level of the raw material tank. The simulation charts will be used later in the Lab project, RMT1. Functions provided by the simulation charts are listed below.
CFC chart Simulation SIM_mot Motor & Pump SIM_val Valve SIM_lel Tank level
Table 6.25: Simulation devices of RMT1
PCS 7 PoT V6.0 | Edition V1.0 | August 2003 Copyright 2003 Siemens AG by A&D AS CS2 PA. All rights reserved.
Page 6 - 63

PCS 7 PoT Chapter 6 Continuous Control - CFC
4.2.1 Design of SIM_mot An example design of a simulated motor is illustrated in Picture 6.74.
Picture 6.74: Simulation of motors The blocks, INT_P, SEL_R, and XOR, are standard library functions. After interconnecting them as shown in Picture 6.74, default parameter values, e.g. the limits (V_HL = 100.0, V_LL = 0.0, and Er1.IN0 = 10.0, etc.), have to be adapted and they are a part of the design. Chart I/Os are defined for the chart so that it can be called from other charts. The chart has 3 inputs namely START, Er1, and Er2. The START signal is the command to the motor, which switches on or off the motor. Signal, Er1, simulates the motor monitoring error and Er2 simulates a motor fault. The chart output, FBON, is from the output of the block, XOR. See Table 6.5.
Chart I/Os Meaning START Command, Switch on or off motor
Er1 Simulation of the monitoring error Input
Er2 Simulation of a device fault
Output FBON Output, motor on or off
Table 6.5: Chart I/Os of the simulated motor
PCS 7 PoT V6.0 | Edition V1.0 | August 2003 Copyright 2003 Siemens AG by A&D AS CS2 PA. All rights reserved.
Page 6 - 64

PCS 7 PoT Chapter 6 Continuous Control - CFC
4.2.2 Design of SIM_val A simulated valve is designed similarly to the SIM_mot. See Picture 6.75.
Picture 6.75: Simulation of valves The charts IOs are listed in Table 6.6.
Chart I/Os Meaning Control Command, open or close valve
Er1 Simulation of the monitoring error Input
Er2 Simulation of a device fault
FBOPEN Output, valve opened Output
FBCLOSE Output, valve closed
Table 6.6: Chart I/Os of the simulated valve
4.2.3 Design of SIM_lel Tank level is simulated by using a negatively integrating function. See Picture 6.76. When releasing flow from a tank by setting LOUT =1, the value, Flow.IN0 = -1.0, is selected. So, the value, V, will reduce over time. When the low limit of the integration is reached, QVLL is set and the tracking function is thus activated making V = VTRACK. As the value, VTRACK is larger than V_LL, QVLL will reset and the tracking function deactivated. Thus, the value, V, is reducing again from VTRACK. The simulation provides a continuously reducing level when requiring the material flow (i.e. LOUT = 1). When the level reaches the low limit, the tank automatically fills itself by using the tracking function if there is not an error (Er1 =0). PCS 7 PoT V6.0 | Edition V1.0 | August 2003 Copyright 2003 Siemens AG by A&D AS CS2 PA. All rights reserved.
Page 6 - 65

PCS 7 PoT Chapter 6 Continuous Control - CFC
Picture 6.76: Simulation of tanks level
The charts IOs are listed in Table 6.7.
Chart I/Os Meaning LOUT Command, require for flow
Input Er1 Simulation of an error
Output SIMlevel Output, tank level
Table 6.7: Chart IOs of the simulated tank level
PCS 7 PoT V6.0 | Edition V1.0 | August 2003 Copyright 2003 Siemens AG by A&D AS CS2 PA. All rights reserved.
Page 6 - 66

PCS 7 PoT Chapter 6 Continuous Control - CFC
Lab Project RMT1 (Part1): Designing controls for the RMT1 unit 1. The Task In this laboratory project, students will use the techniques and knowledge gained so far during the workshop, especially the knowledge gained from the PCS 7 library function blocks in this chapter, to design a complete solution to the RMT1 unit. Functions of the RMT1, operating procedure, and operating modes have been discussed in Section 4.1. Simulation devices, which will be used in the project, have been developed in Section 4.2. 2. Guideline
2.1 The starting point To start working on the project, create a new multiproject using the New Project wizard. If you use an existing project as a starting point or use the New function to create a new project, be sure that the project is configured as much as a newly created multiproject using the New Project wizard, meaning that a master library, plant hierarchy, S7 program, and OS station have been inserted and configured in the project. Make sure that the communication between ES and AS and communication between ES and OS are established.
2.2 Project functional objects Refer to the P & I diagram of the RMT1 unit (Picture 6.72), control functions are made of functional modules of basic process objects. For example, a control valve, a pump, and a flow-rate loop controller are basic process objects; application functional modules are defined and structured according to the process objects. The RMT1 unit could be functionally structured comprising of the functional modules, the valve controls (NK111, NK112, NK113, and NK114), the pump control (NP111), the level measurement (LI111), and dosing control which includes a flow-rate control (FC111). Working with the PCS 7 system, a CFC chart normally corresponds to a process object or a functional module. The RMT1 unit would have the following function charts as listed in Table 6.8. PCS 7 PoT V6.0 | Edition V1.0 | August 2003 Copyright 2003 Siemens AG by A&D AS CS2 PA. All rights reserved.
Page 6 - 67

PCS 7 PoT Chapter 6 Continuous Control - CFC
Process unit
Process object (P & I diagram)
Main Functional Module CFC chart
NK111 Valve control NK111 NK112 // NK112 NK113 // NK113 NK114 // NK114 NP111 Motor Control NP111 FC111 Dosing and flow Control FC111
RMT1
L111 Level measurement
Table 6.8 Control functions of the RMT1 unit
2.3 Plant hierarchy and tag naming From Chapter 4, we know the name of a variable in a PCS 7 project is a combination of the plant hierarchy folder name, the CFC chart name, and the block instance name. Refer to Picture 6.77.
Picture 6.77: Naming convention You should decide if your variables’ names include your plant hierarchy folders’ names according to the application notation and convention standard. While, a CFC chart’s name and block instance name are always part of a variable’s name. Plant hierarchy also affects the picture hierarchy and thus it is important to decide a plant hierarchy structure at the very beginning when the project engineering starts. It is important to have a consistent plant hierarchy throughout the plant hierarchy folders and projects of a multiproject. For the RMT1 project, the plant hierarchy is designed and customised as shown in Picture 6.78. It is a good practice to have each of the top plant hierarchy folders (with all its lower levels) assigned to each of the ASs. In Picture 6.78, the top level, Plant1, with all its lower levels is assigned to AS1 and OS(1). You could have alternatives to the design as shown in Picture 6.78 but you have to keep consistency in where the OS area roots and whether a plant hierarchy folder’s name is included in the designation.
PCS 7 PoT V6.0 | Edition V1.0 | August 2003 Copyright 2003 Siemens AG by A&D AS CS2 PA. All rights reserved.
Page 6 - 68

PCS 7 PoT Chapter 6 Continuous Control - CFC
In this example, the OS picture tree will be derived from the plant hierarchy. See Picture 6.78.
Picture 6.78: Plant hierarchy of RMT1
2.4 CFC charts and pictures It is recommended that each hierarchy folder contain only one picture so that block icons can be automatically placed onto the picture if they are derived from the plant hierarchy. See Picture 6.78. The required functional modules are realised in CFC charts. It is decisive that how CFC charts are arranged in a project. Picture 6.79 shows that all the functional modules are inserted under the RMT1 folder.
Picture 6.79: Arranging charts and pictures
PCS 7 PoT V6.0 | Edition V1.0 | August 2003 Copyright 2003 Siemens AG by A&D AS CS2 PA. All rights reserved.
Page 6 - 69

PCS 7 PoT Chapter 6 Continuous Control - CFC
Note It is recommended that the Lab project RMT1 be structured as in Picture 6.79 where all the CFC charts are assigned to the plant hierarchy, RMT1, and the plant hierarchy folder, Plant1 assigned to a S7 program, and OS. The following descriptions are based on the structure of Picture 6.79.
2.5 Deriving block icons You can design how to derive block icons. If the lower hierarchy levels are not included (selecting value 0), blocks in the same level as the picture are included in the picture. In the case of Picture 6.79, as all the blocks are at the level of RMT1, no lower hierarchy levels should be included.
Picture 6.81: Deriving block icons However, in the case of Picture 6.80, block icons should be brought up to the picture, Pic_RMT1. Therefore, the “Lower hierarchy levels included” should be set as 1. The object name TAG (see Picture 6.81) should be specified as the same as for the tags of the project. See Picture 7.76.
2.6 The simulation charts The empty charts, SIM_mot, SIM_val, and SIM_lel, have been inserted in the project as in Picture 6.79. Following Section 4.2, fill the charts with the design.
2.7 Designing Valve Controller, NK111 chart
PCS 7 PoT V6.0 | Edition V1.0 | August 2003 Copyright 2003 Siemens AG by A&D AS CS2 PA. All rights reserved.
Page 6 - 70

PCS 7 PoT Chapter 6 Continuous Control - CFC
The empty chart, NK111, is inserted in the project. An example design of the valve control is shown in Picture 6.82 where the standard library functions, VALVE (FB73) and INTERLOK (FB75), and the simulated valve chart, SIM_val, are used.
Picture 6.82: Valve Controller, NK111 Note The design in Picture 6.82 is only for exercise. In a real project, feedback signals, FB_OPEN and FB_CLOSE will be wired using the driver block, CH_DI. Similarly, the command signal, QCONTROL, will be wired out using CH_DO. You can find a valve control template in the PCS 7 library under the Templates. Refer to Appendix of the chapter. Other designs in the following sections are also for simulation and simplicity where driver blocks are omitted.
2.8 Designing Motor Controller, NP111 Similarly to Chart NK111, Chart NP111 is designed as shown in Picture 6.83.
PCS 7 PoT V6.0 | Edition V1.0 | August 2003 Copyright 2003 Siemens AG by A&D AS CS2 PA. All rights reserved.
Page 6 - 71
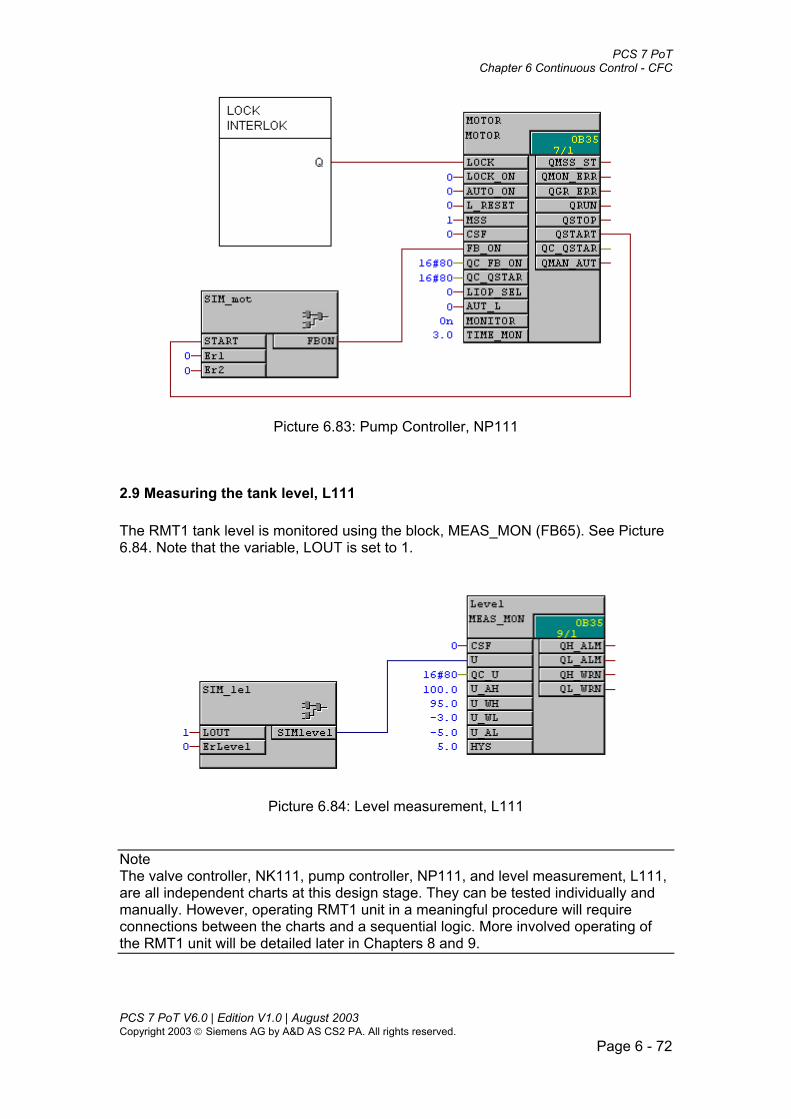
PCS 7 PoT Chapter 6 Continuous Control - CFC
Picture 6.83: Pump Controller, NP111
2.9 Measuring the tank level, L111 The RMT1 tank level is monitored using the block, MEAS_MON (FB65). See Picture 6.84. Note that the variable, LOUT is set to 1.
Picture 6.84: Level measurement, L111 Note The valve controller, NK111, pump controller, NP111, and level measurement, L111, are all independent charts at this design stage. They can be tested individually and manually. However, operating RMT1 unit in a meaningful procedure will require connections between the charts and a sequential logic. More involved operating of the RMT1 unit will be detailed later in Chapters 8 and 9.
PCS 7 PoT V6.0 | Edition V1.0 | August 2003 Copyright 2003 Siemens AG by A&D AS CS2 PA. All rights reserved.
Page 6 - 72

PCS 7 PoT Chapter 6 Continuous Control - CFC
2.10 Flow-rate and dosing control, FC111 The flow-rate control is part of the dosing task making it possible to restrict flow-rate to low when a dosing task is near to complete and to allow large flow-rate when a dosing procedure starts. Setpoint of the flow-rate controller depends on the dosing error. When the error is large, the flow-rate should be large to allow fast delivery of material. When the error is small, the flow-rate should be small to allow accurate dosing. There must be an optimal profile between the dosing error and setpoint. An example of such profile is illustrated in Picture 6.85.
Picture 6.85: Relation between the dosing error and setpoint In the RMT1 project you could design the profile using the library function block POLYG_P (FC271). Note To learn more about POLYG_P, refer to the online Help. Picture 6.86 shows a design of FC111 where settings of POLYG_P function can be noted that a maximum of 2000 volume in the dosing error corresponding to 100% in setpoint for the flow-rate.
PCS 7 PoT V6.0 | Edition V1.0 | August 2003 Copyright 2003 Siemens AG by A&D AS CS2 PA. All rights reserved.
Page 6 - 73
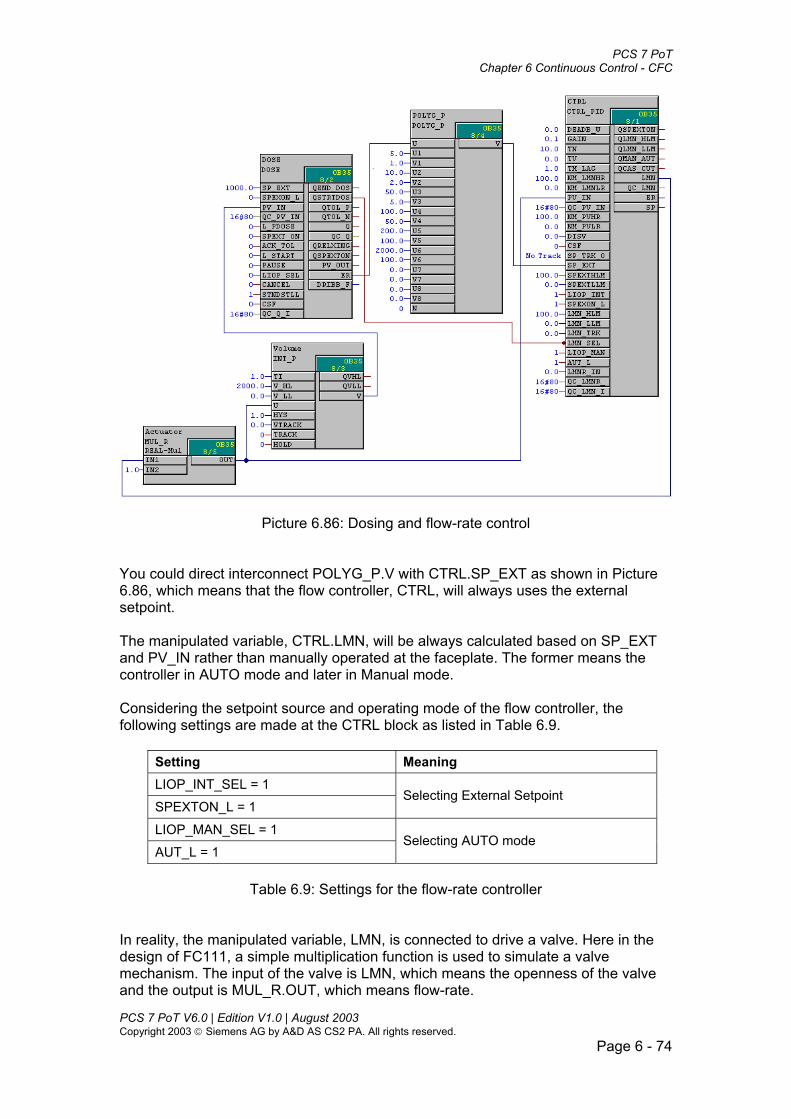
PCS 7 PoT Chapter 6 Continuous Control - CFC
Picture 6.86: Dosing and flow-rate control You could direct interconnect POLYG_P.V with CTRL.SP_EXT as shown in Picture 6.86, which means that the flow controller, CTRL, will always uses the external setpoint. The manipulated variable, CTRL.LMN, will be always calculated based on SP_EXT and PV_IN rather than manually operated at the faceplate. The former means the controller in AUTO mode and later in Manual mode. Considering the setpoint source and operating mode of the flow controller, the following settings are made at the CTRL block as listed in Table 6.9.
Setting Meaning LIOP_INT_SEL = 1 SPEXTON_L = 1
Selecting External Setpoint
LIOP_MAN_SEL = 1 AUT_L = 1
Selecting AUTO mode
Table 6.9: Settings for the flow-rate controller
In reality, the manipulated variable, LMN, is connected to drive a valve. Here in the design of FC111, a simple multiplication function is used to simulate a valve mechanism. The input of the valve is LMN, which means the openness of the valve and the output is MUL_R.OUT, which means flow-rate.
PCS 7 PoT V6.0 | Edition V1.0 | August 2003 Copyright 2003 Siemens AG by A&D AS CS2 PA. All rights reserved.
Page 6 - 74

PCS 7 PoT Chapter 6 Continuous Control - CFC
To simulate a volume device used in dosing control, an integral function, the library block, INT_P, is used, which calculates the volume of the flow-rate. The volume high limit is set as 2000 litres. DOSE block in FC111 is set as the default, which means that the block is in the Manual mode and in the Internal setpoint mode. Before DOSE could start, the value of DOSE. PV_IN has to be 0.0. This is done by setting VTRACK = 0.0 and TRACK = TRUE. To operate the CTRL_PID properly, when the dosing starts, the manipulated variable, LMN, is calculated according to dosing error and PID algorithm. In other words, LMN should not be set to track the value given at LMN_TRK. When dosing ends, the controller should be set into the tracking mode, which is LMN_SEL = 1 and LMN_TRK = 0.0. Note that the GAIN of CTRL_PID is set as 0.1.
2.11 Block instances’ names As discussed in this guideline, block instance’s name will be part of a variable’s name. This is particularly important when the variable will be used in OS. For the blocks used in the RMT1 project and relevant to OS, the following instances’ names are recommended as the description of the manual is based on the naming convention.
Block type name Instance Name VALVE VALVE MOTOR MOTOR CTRL_PID CTRL DOSE DOSE INTERLOK LOCK MEAS_MON Level
Table 6.10: Block instance name
2.12 Runtime sequence When a CFC chart is inserted, a runtime group of the chart is created as well. Time sequence of each block of the chart (or the whole program) can be optimised using the system function, Optimize Run Sequence. See Picture 6.87.
PCS 7 PoT V6.0 | Edition V1.0 | August 2003 Copyright 2003 Siemens AG by A&D AS CS2 PA. All rights reserved.
Page 6 - 75

PCS 7 PoT Chapter 6 Continuous Control - CFC
Picture 6.87: Optimising Run sequence
2.13 Compiling Program Compile the program in the CFC editor.
2.14 Compiling OS In the SIMATIC Manager, compile OS according to the connection configured. The block icons are inserted into the picture, Pic_RMT1, in the background while compiling the OS. The block icons will be used to call the corresponding faceplates so that you can test your project.
PCS 7 PoT V6.0 | Edition V1.0 | August 2003 Copyright 2003 Siemens AG by A&D AS CS2 PA. All rights reserved.
Page 6 - 76

PCS 7 PoT Chapter 6 Continuous Control - CFC
2.15 Testing Download the program to AS, run the program, and activate the OS. You can test the following tasks as listed in Table 6.11. Test task Using faceplate or Action
Valve controlling, NK111 Valve monitoring error
VALVE, manually open/close the valve. Set Er1 =1.
Pump controlling, NP111 Motor monitoring error
MOTOR, manually switch on/off the motor. Set Er1 =1.
Level measurement, L111 Set LOUT = 1, and then monitor the level at the faceplate of Level.
Dosing & Flow-rate controlling, FC111 DOSE, give an amount to be dosed (selecting the internal setpoint) and then click Start. CTRL, monitor the flow control.
Table 6.11: Testing tasks of the RMT1 project
PCS 7 PoT V6.0 | Edition V1.0 | August 2003 Copyright 2003 Siemens AG by A&D AS CS2 PA. All rights reserved.
Page 6 - 77

PCS 7 PoT Chapter 6 Continuous Control - CFC
PCS 7 PoT V6.0 | Edition V1.0 | August 2003 Copyright 2003 Siemens AG by A&D AS CS2 PA. All rights reserved.
Page 6 - 78

PCS 7 PoT Chapter 6 Continuous Control - CFC
Appendix Valve and motor control templates
Picture 6.88: Motor control template
Picture 6.89: Valve control template
PCS 7 PoT V6.0 | Edition V1.0 | August 2003 Copyright 2003 Siemens AG by A&D AS CS2 PA. All rights reserved.
Page 6 - 79

Chapter 7:
Creating Function Blocks - SCL


Contents: CHAPTER 7 CREATING FUNCTION BLOCKS - SCL ..................................................................1
1. BLOCKS IN SCL ...............................................................................................................................1
1.1 STRUCTURE OF A BLOCK .................................................................................................................1 1.2 BLOCK HEADER...............................................................................................................................2
1.2.7 KNOW_HOW_PROTECT.......................................................................................................5 1.3 BLOCK ATTRIBUTES ........................................................................................................................5
1.3.1 System attributes .....................................................................................................................5 1.3.2 List of block attributes ............................................................................................................6 1.3.3 Defining block attributes ........................................................................................................6
1.4 DECLARATION SECTION ..................................................................................................................7 1.4.1 Block parameters (Block I/Os)................................................................................................7 1.4.2 List of system attributes for parameters..................................................................................9 1.4.3 Local variables .....................................................................................................................11
1.5 CODE SECTION ..............................................................................................................................13
2. ADAPTING SYSTEM ATTRIBUTES...........................................................................................14
3. THE SCL EDITOR ..........................................................................................................................15
3.1 INSERTING BLOCK TEMPLATE.......................................................................................................16 3.2 INSERTING BLOCK CALL IN THE SCL SOURCE ..............................................................................16 3.3 SCL CONTROL STATEMENTS........................................................................................................17
3.3.1 IF Statements ........................................................................................................................17 3.3.2 CASE Statement ....................................................................................................................18 3.3.3 FOR Statement......................................................................................................................18 3.3.4 WHILE Statement .................................................................................................................18
4. CHART-IN-BLOCK ........................................................................................................................19
5. CPU ROBUSTNESS AND MEASURES........................................................................................21
5.1 ENTIRE PROGRAM DOWNLOAD OR CHANGES ONLY DOWNLOAD? .................................................21 5.2 LOCAL DATA.................................................................................................................................23
5.2.1 Definition of local data .........................................................................................................23 5.2.2 Preset local data in CPU ......................................................................................................23 5.2.3 Calculation of local data ......................................................................................................25
5.3 CPU MEMORY...............................................................................................................................26 5.4 SYSTEM SUPPORT FOR CPU LOAD AND MEMORY..........................................................................29
5.4.1 The Warning limits................................................................................................................29 5.4.2 The Logs page.......................................................................................................................32 5.4.3 Measures during compiling ..................................................................................................32 5.4.4 Measures during downloading .............................................................................................33 5.4.5 Further measures..................................................................................................................34
EXERCISE............................................................................................................................................37
EXERCISE 7.1 CREATING FUNCTION BLOCK, ROTATION, IN SCL........................................................37 1. The task......................................................................................................................................37 2. Guideline ...................................................................................................................................38
EXERCISE 7.2 CREATING FUNCTION BLOCKS USING CHART-IN-BLOCK ..............................................38 1. The task......................................................................................................................................38 2. Guideline ...................................................................................................................................39
ANSWERS ............................................................................................................................................41
1. CODES OF THE ROTATION FUNCTION...............................................................................................41 2. CHART, CTRL_P WITH I/OS...........................................................................................................42

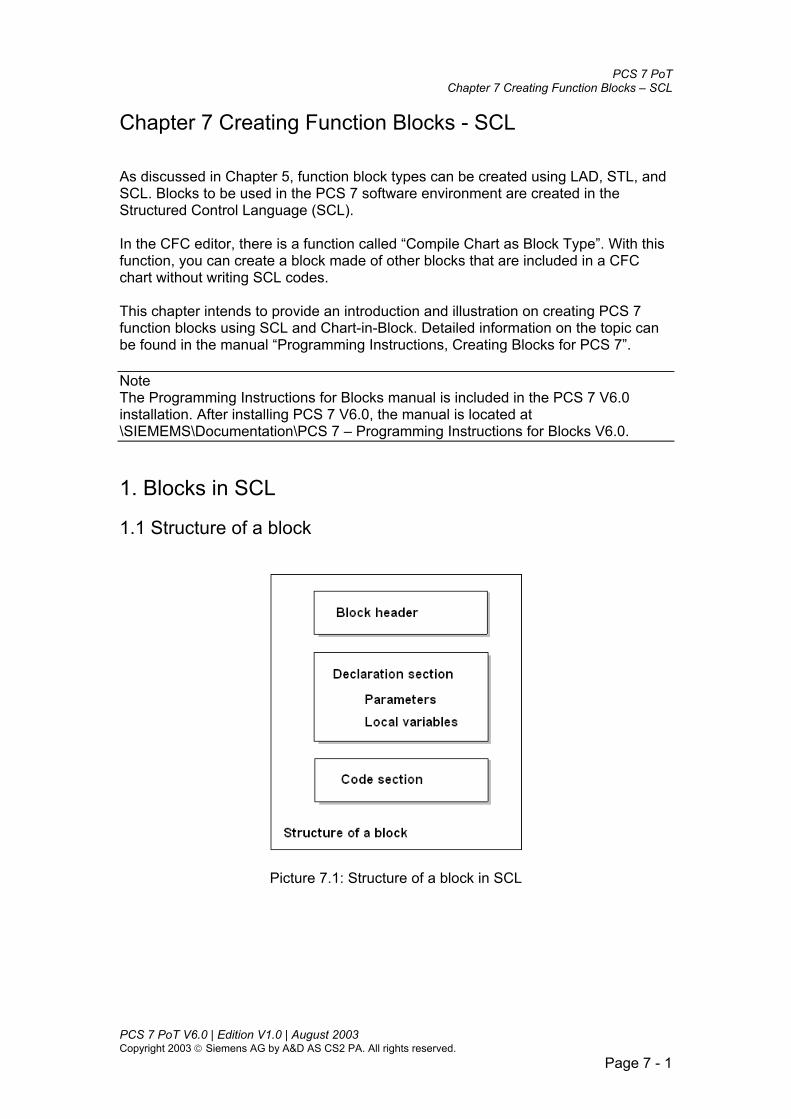
PCS 7 PoT
Chapter 7 Creating Function Blocks – SCL
Chapter 7 Creating Function Blocks - SCL As discussed in Chapter 5, function block types can be created using LAD, STL, and SCL. Blocks to be used in the PCS 7 software environment are created in the Structured Control Language (SCL). In the CFC editor, there is a function called “Compile Chart as Block Type”. With this function, you can create a block made of other blocks that are included in a CFC chart without writing SCL codes. This chapter intends to provide an introduction and illustration on creating PCS 7 function blocks using SCL and Chart-in-Block. Detailed information on the topic can be found in the manual “Programming Instructions, Creating Blocks for PCS 7”. Note The Programming Instructions for Blocks manual is included in the PCS 7 V6.0 installation. After installing PCS 7 V6.0, the manual is located at \SIEMEMS\Documentation\PCS 7 – Programming Instructions for Blocks V6.0. 1. Blocks in SCL 1.1 Structure of a block
Picture 7.1: Structure of a block in SCL
PCS 7 PoT V6.0 | Edition V1.0 | August 2003 Copyright 2003 Siemens AG by A&D AS CS2 PA. All rights reserved.
Page 7 - 1

PCS 7 PoT
Chapter 7 Creating Function Blocks – SCL
1.2 Block header
Block header includes the following list as shown in Picture 7.2.
Picture 7.2: Block Header Picture 7.3 shows the header of a simulated valve in SCL.
Picture 7.3: Block header of FB1100 1.2.1 FUNCTION_BLOCK FUNCTION_BLOCK defines a block number or a symbolic name. If it is a symbol, e.g. SIM_VAL, the name has to be assigned with a number (e.g. FB1100) in the Symbols table before the block in SCL codes are compiled. The symbolic name will
PCS 7 PoT V6.0 | Edition V1.0 | August 2003 Copyright 2003 Siemens AG by A&D AS CS2 PA. All rights reserved.
Page 7 - 2

PCS 7 PoT
Chapter 7 Creating Function Blocks – SCL
appear on any instance of the block when the instance is dragged on to a CFC plan. Refer to Picture 7.4.
Picture 7.4: Block type name
1.2.2 TITLE This information is not evaluated in PCS 7, however, it is displayed in the SIMATIC Manager in the object properties of the block in the comment field. It is advisable to enter the same name as for FUNCTION_BLOCK. See Picture 7.5. The Properties window of a block as in Picture 7.5 is called up when double clicking on the block under the Block Folder.
Picture 7.5: Block title
PCS 7 PoT V6.0 | Edition V1.0 | August 2003 Copyright 2003 Siemens AG by A&D AS CS2 PA. All rights reserved.
Page 7 - 3
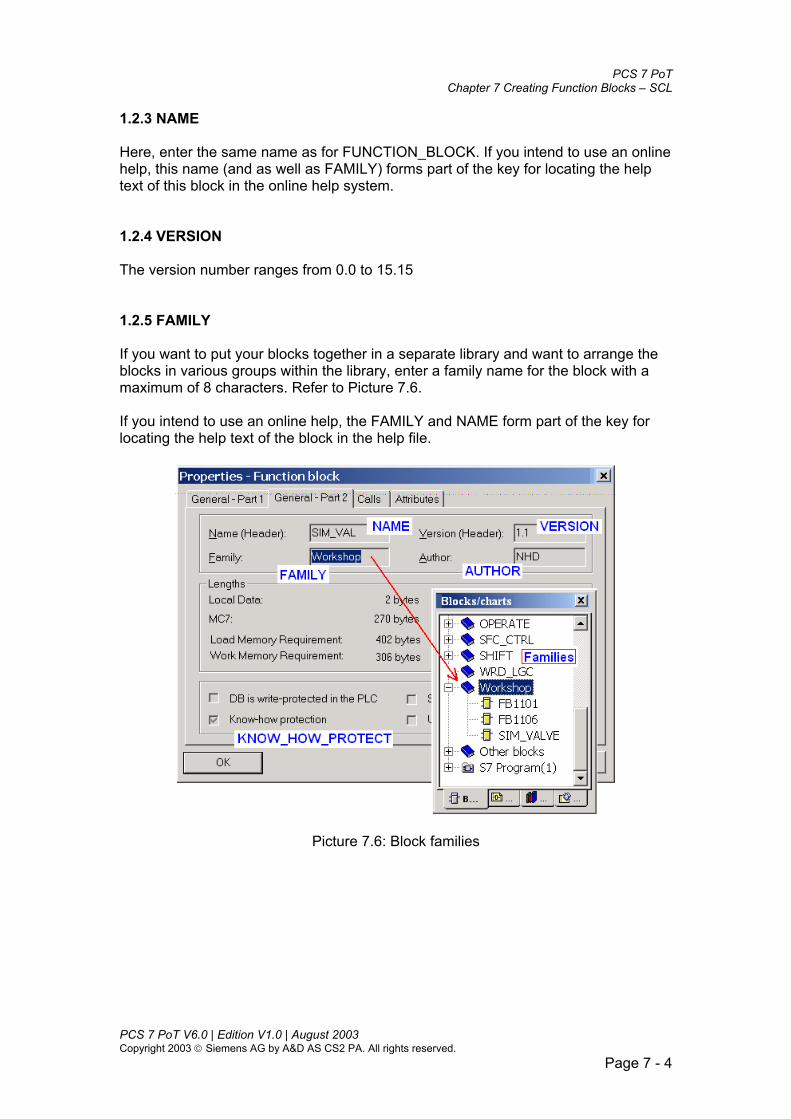
PCS 7 PoT
Chapter 7 Creating Function Blocks – SCL
1.2.3 NAME Here, enter the same name as for FUNCTION_BLOCK. If you intend to use an online help, this name (and as well as FAMILY) forms part of the key for locating the help text of this block in the online help system. 1.2.4 VERSION The version number ranges from 0.0 to 15.15 1.2.5 FAMILY If you want to put your blocks together in a separate library and want to arrange the blocks in various groups within the library, enter a family name for the block with a maximum of 8 characters. Refer to Picture 7.6. If you intend to use an online help, the FAMILY and NAME form part of the key for locating the help text of the block in the help file.
Picture 7.6: Block families
PCS 7 PoT V6.0 | Edition V1.0 | August 2003 Copyright 2003 Siemens AG by A&D AS CS2 PA. All rights reserved.
Page 7 - 4

PCS 7 PoT
Chapter 7 Creating Function Blocks – SCL
1.2.6 AUTHOR
This attribute normally contains the name or department of the author of the block. In PCS 7-compliant blocks, this is also used for two further purposes: - If you want to put your blocks together to form a library, enter a common name for
all blocks of the library with a maximum of 8 characters. - If you use an online help, the relevant help file is located using this name. 1.2.7 KNOW_HOW_PROTECT With this attribute, if it is entered, only the attributes of the block are displayed in the object properties of the block in the SIMATIC Manager but they cannot be modified. Outside your project, the block itself can only be opened without the corresponding source file using the Block editor and can no longer be opened with SCL. 1.3 Block attributes 1.3.1 System attributes System attributes are divided into system attributes for blocks and system attributes for parameters. System attributes for blocks apply to the whole block. System attributes for parameters apply to each individual block parameter. System attributes are inter-application attributes in the software packages and control and coordinate functions between individual applications. For example, messages only need to be configured once in the blocks and used elsewhere such as in the OS system. System attributes are used in the message configuration, communication configuration, and operator interfaces.
PCS 7 PoT V6.0 | Edition V1.0 | August 2003 Copyright 2003 Siemens AG by A&D AS CS2 PA. All rights reserved.
Page 7 - 5

PCS 7 PoT
Chapter 7 Creating Function Blocks – SCL
1.3.2 List of block attributes
SYSTEM ATTRIBUTE Meaning DEFAULT
VALUE
S7_m_c Specifies whether the block can be controlled or monitored from an OS. False
S7_tasklist Contains a list of the OBs (for example error or startup OBs) in which the block will be installed by CFC.
Not installed more than once
S7_alarm_ui Identifier for message server: S7_alarm_ui :=’0’ standard message dialog; S7_alarm_ui: =’1’ PCS 7 message dialog.
S7_alarm_ui :=’0’
S7_tag
If this system attribute has the value ’false’, the block is not entered in the tag list of the OS. This is useful for blocks that only send messages but do not have a faceplate. If the system attribute does not exist, the block is entered in the process tag list if it also has the system attribute S7_m_c.
False
S7_driver
It is for the signal preprocessing driver block, which is automatically interconnected with the corresponding block by means of the CFC function “Generate module drivers“ in SIMATIC Manager.
False or “chn”
S7_hardware
It is for the signal preprocessing driver block, which is automatically interconnected with the corresponding block by means of the CFC function “Generate module drivers“ in SIMATIC Manager.
Values: 'subnet', 'rack', 'sm', 'im', 'fm'
S7_read_bach
Defines whether the block instance is to be allocated to the "Chart > Readback" function in the CFC. The instance block parameters cannot be read back when the value of this system attribute is 'false'.
True
Table 7.1: List of block attributes
1.3.3 Defining block attributes In SCL you could define block attributes before the Header section. Refer to Picture 7.7.
Picture 7.7: Defining block attributes
PCS 7 PoT V6.0 | Edition V1.0 | August 2003 Copyright 2003 Siemens AG by A&D AS CS2 PA. All rights reserved.
Page 7 - 6

PCS 7 PoT
Chapter 7 Creating Function Blocks – SCL
The system attributes are displayed in the object properties of the block in the "Attributes" tab in the SIMATIC Manager where they can also be modified if the block is not write-protected. See Picture 7.8. The example shown in Picture 7.7 has no KNOW_HOW_PROTECT included. So, modification is possible in Picture 7.8.
Picture 7.8: Displaying and editing block attributes 1.4 Declaration section 1.4.1 Block parameters (Block I/Os) The block parameters define the interface of a block and some of them are also used in OS pictures. There are Input parameters, Output parameters, and In_out parameters. In_Out parameters can be both read and written back by the block algorithm. Input variables are defined in the VAR_INPUT … END_VAR section as the following:
VAR_INPUT SAMPLE_T {S7_sampletime:=’true’; // Para. Of block sampling time S7_visible := ‘false’; S7_link := ‘false’; } : REAL :=1; // sample time (default 1 sec) IN1 {S7_m_c := ‘true’} : BOOL := ‘false’; // an input IN2 {S7_m_c := ‘true’} : BOOL := ‘false’; // an input VAR_END
Output variables are defined in the VAR_OUTPUT … END_VAR section as the following:
PCS 7 PoT V6.0 | Edition V1.0 | August 2003 Copyright 2003 Siemens AG by A&D AS CS2 PA. All rights reserved.
Page 7 - 7

PCS 7 PoT
Chapter 7 Creating Function Blocks – SCL
VAR_OUTPUT LMN {S7_shortcut := ‘pressure’; S7_unit := ‘mbar’; S7_m_c := ‘true’ } : REAL; //Manipulated value OU1 {S7_m_c := ‘true’} : BOOL; // an output
OU2 {S7_m_c := ‘true’} : BOOL; // an output END_VAR In_Out variables are defined in the VAR_IN_OUT … END_VAR section as the following:
VAR_IN_OUT PV_IN {S7_dynamic := ‘true’; S7_unit := ‘%’; S7_m_c := ‘true’ } : REAL; //Process value SP_OP {S7_visible := ‘false’; S7_link := ‘false’;
S7_m_c := ‘true’; S7_shortcut := ‘Setpoint; S7_unit := ‘mbar’} :REAL; // Setpoint
END_VAR
PCS 7 PoT V6.0 | Edition V1.0 | August 2003 Copyright 2003 Siemens AG by A&D AS CS2 PA. All rights reserved.
Page 7 - 8

PCS 7 PoT
Chapter 7 Creating Function Blocks – SCL
1.4.2 List of system attributes for parameters
System attribute
Effect Meaning Default value
S7_sample_time
Time response
If a parameter has this system attribute it is automatically assigned the cycle time of the calling cyclic OB. When you compile the CFC chart, the "Update sampling time" check box has to be selected.
False
S7_dynamic
CFC
If a parameter has this system attribute, it is automatically registered for testing in the test mode of CFC (Watch).
False
S7_edit
CFC
This decides whether or not the parameter can be edited in the SIMATIC Manager in the Process Object View.
False
S7_link CFC This decides whether or not the parameter can be interconnected in the CFC chart.
True
S7_param CFC This decides whether or not the parameter value can be set in the CFC chart.
True
S7_visible CFC If this system attribute is set to ’false’ for a parameter, it is not displayed at the block in the CFC chart (Displayed).
True
S7_qc The parameter has a quality code. False S7_contact The attribute defines parameters specifically
associated with SFC types False
S7_m_c OCM This decides whether or not the parameter can be controlled or monitored from OS.
False
S7_shortcut OCM This contains a maximum 16 character long identifier for the parameter. This name (for example "Setpoint"), can also be displayed in a faceplate on the OS.
-
S7_string_0 OCM This system attribute is only relevant for input parameters (or in/out parameters) of the data type BOOL. It contains a text with a maximum of 16 characters that can be displayed in a faceplate as an operator text (for example "Open Valve"). When the operator selects this function, the parameter is given the value 0.
-
S7_string_1 OCM This system attribute is only relevant for input parameters (or in/out parameters) of the data type BOOL. It contains a text with a maximum of 16 characters that can be displayed in a faceplate as an operator text (for example "Close Valve"). When the operator selects this function, the parameter is given the value 1.
S7_unit OCM This contains the unit of the parameter and can have a maximum of 16 characters. The unit (for example "mbar") can be displayed in CFC at the block I/O.
S7_server Server The interface parameter is assigned to a server. Message server: S7_server: =’alarm_archiv’.
No server call
S7_a_type Server The interface parameter is the message number input of message type x or archive number input.
No server call
Table 7.2: List of parameter attributes
PCS 7 PoT V6.0 | Edition V1.0 | August 2003 Copyright 2003 Siemens AG by A&D AS CS2 PA. All rights reserved.
Page 7 - 9

PCS 7 PoT
Chapter 7 Creating Function Blocks – SCL
The attribute S7_m_c is important, as it is required if a variable is to be transferred to OS. An example of a BOOL data type with the parameter attributes is shown in Picture 7.9.
Picture 7.9: Properties of Parameters of the BOOL Data Type In SCL, a BOOL variable, M_SUP_AH, is declared with system attributes. After the SCL code is compiled, the variable is a parameter of the block. Then, in the Properties dialog of the block, you could find how the attributes such as S7_string_0, S7_string_1, S7_visible, and S7_dynamic are used. An example of a REAL data type with the parameter attributes is shown in Picture 7.10.
PCS 7 PoT V6.0 | Edition V1.0 | August 2003 Copyright 2003 Siemens AG by A&D AS CS2 PA. All rights reserved.
Page 7 - 10

PCS 7 PoT
Chapter 7 Creating Function Blocks – SCL
Picture 7.10: Properties of REAL Data Type 1.4.3 Local variables (1) Temporary variables Temporary variables are valid only during one block call; in other words, they must be recalculated at each block call. Temporary variables are defined in section VAR_TEMP … END_VAR as the following:
VAR_TEMP X: BYTE;
Y: WORD; Z: DWORD; END_VAR
(2) Static variables Static variables, in contrast to temporary variables, retain their value over multiple block calls until you change the value in the block algorithm.
PCS 7 PoT V6.0 | Edition V1.0 | August 2003 Copyright 2003 Siemens AG by A&D AS CS2 PA. All rights reserved.
Page 7 - 11

PCS 7 PoT
Chapter 7 Creating Function Blocks – SCL
In PCS 7-compliant blocks, these variables are particularly important if you want to call existing blocks, either your own or standard blocks, within your block. In this case, you must implement a multiple instance block. This is done by defining an instance of the called block as a static variable. Before the calling block can be compiled free of errors, the called blocks must exist in the block folder of the S7 program. If you want to make parameters of the called block visible to the outside world and interconnectable, you must copy the parameters of the called block to the calling block. Static variables are defined in the VAR … END_VAR section. An example of using static variables is to call an existing blocks as shown in Picture 7.11 where ALARM_8P is defined as ALARMER.
Picture 7.11: Calling existing blocks
PCS 7 PoT V6.0 | Edition V1.0 | August 2003 Copyright 2003 Siemens AG by A&D AS CS2 PA. All rights reserved.
Page 7 - 12

PCS 7 PoT
Chapter 7 Creating Function Blocks – SCL
In Picture 7.11, variable MSG_DONE, MSG_ERR, and MSG_ACK_STATE are the calling blocks’ outputs. Note how the called instance block’s variables DONE, ERROR, and ACK_STATE are passed to the calling block’s parameters. Also note how the calling block’s inputs (MSG_EVID, ERROR, OFF_CLOSED, ON_OPEN, and MAINT) are passed to the called block so that the outputs of the called block are calculated. Refer to Picture 7.12 to know the calling block parameters.
Picture 7.12: Block parameter declaration Note To call Alarm_8P, you have to define a parameter which has the attributes, S7_server := ‘alarm_archiv’ and S7_a_type := ‘alarm_8p’. This parameter is referred to as the Message ID. In Picture 7.13, the variable, MSG_EVID is defined as the Message ID. 1.5 Code section SCL codes are written in the section BEGIN … END_FUNCTION_BLOCK (for function blocks), BEGIN … END_FUNCTION (for functions), or BEGIN … END_ORGANIZATION_BLOCK (for organisation blocks), etc.
PCS 7 PoT V6.0 | Edition V1.0 | August 2003 Copyright 2003 Siemens AG by A&D AS CS2 PA. All rights reserved.
Page 7 - 13

PCS 7 PoT
Chapter 7 Creating Function Blocks – SCL
2. Adapting System attributes The adapting of blocks includes adjusting of the system attributes according to applications. You can modify the following system attributes of the block I/Os, such as: • Visibility of parameters (S7_visible), • Dynamic view of parameters (S7_dynamic) • The texts for binary values (S7_string_0, S7_string_1), • The texts for analog values (S7_unit, S7_shortcut), • Interconnectability of parameters (S7_link, e.g. for GAIN, TN, TV in the controller)
etc. You cannot change the attributes for message attributes (S7_server, S7_a_type). The attribute, S7_m_c, is required if the parameter is to be transferred to OS. So, if you change the S7_m_c attribute, the functionality of the corresponding faceplate will be effected (links lost due to variable no longer in OS). To adapt a system attribute of a block, you change it in the Block editor, which can be called up when double-click on the block. If the block is protected a warning message will be displayed. You could ignore the message as certain attributes can still be changed. When arriving at the Block editor environment, proceed as guided in Picture 7.13 to change attributes.
PCS 7 PoT V6.0 | Edition V1.0 | August 2003 Copyright 2003 Siemens AG by A&D AS CS2 PA. All rights reserved.
Page 7 - 14

PCS 7 PoT
Chapter 7 Creating Function Blocks – SCL
Picture 7.13: Adapting system attributes After adapting of the existing blocks and libraries for a project, you can use them as a base to build more functions, blocks, and charts. It is recommended that new blocks stored in the master data library. Note The master data library should contain all block types used for the multiproject including those copied and adapted from the PCS 7 standard libraries and those created by users. To use a block type, you always drag one from the master data library rather than from PCS 7 libraries as the later will overwrite the former! 3. The SCL Editor You can insert a new SCL file in the Sources folder of S7 Program and then double click on it to open the SCL editor.
PCS 7 PoT V6.0 | Edition V1.0 | August 2003 Copyright 2003 Siemens AG by A&D AS CS2 PA. All rights reserved.
Page 7 - 15

PCS 7 PoT
Chapter 7 Creating Function Blocks – SCL
3.1 Inserting Block Template You can start working with SCL by inserting the block template such as functions (OB, FB, or FC), block Header (Comment), and data declarations (parameters), etc as shown in Picture 7.13. The block template guides you through the SCL syntax. Refer to Picture 7.13.
Picture 7.13: Inserting basic SCL syntax 3.2 Inserting Block Call in the SCL source Calls of functions and function blocks from the SCL source can be implemented conveniently via the menu command Insert > Block Call. The SCL automatically copies the called block to the S7 program and enters the block in the source. See Picture 7.14.
PCS 7 PoT V6.0 | Edition V1.0 | August 2003 Copyright 2003 Siemens AG by A&D AS CS2 PA. All rights reserved.
Page 7 - 16

PCS 7 PoT
Chapter 7 Creating Function Blocks – SCL
Picture 7.14: Calling blocks in SCL 3.3 SCL Control Statements Note For detailed information on SCL functions, refer to the online Help of SCL. 3.3.1 IF Statements
An example of IF … THEN statement is shown below. IF I1.1 THEN N := 0 ; SUM := 0 ; OK := FALSE ; // Set OK flag to FALSE ELSIF START = TRUE THEN N := N + 1 ; SUM := SUM + N ; ELSE OK := FALSE ; END_IF ;
PCS 7 PoT V6.0 | Edition V1.0 | August 2003 Copyright 2003 Siemens AG by A&D AS CS2 PA. All rights reserved.
Page 7 - 17

PCS 7 PoT
Chapter 7 Creating Function Blocks – SCL
3.3.2 CASE Statement An example of CASE statement is shown below.
CASE TW OF 1 : DISPLAY:= OVEN_TEMP; 2 : DISPLAY:= MOTOR_SPEED; 3 : DISPLAY:= GROSS_TARE; QW4:= 16#0003; 4..10: DISPLAY:= INT_TO_DINT (TW); QW4:= 16#0004; 11,13,19: DISPLAY:= 99; QW4:= 16#0005; ELSE: DISPLAY:= 0; TW_ERROR:= 1; END_CASE ;
3.3.3 FOR Statement An example of FOR statement is shown below.
FUNCTION_BLOCK FOR_EXA VAR INDEX: INT ; IDWORD: ARRAY [1..50] OF STRING; END_VAR BEGIN FOR INDEX := 1 TO 50 BY 2 DO IF IDWORD [INDEX] = 'KEY' THEN EXIT; END_IF; END_FOR; END_FUNCTION_BLOCK
3.3.4 WHILE Statement An example of WHILE statement is shown below.
FUNCTION_BLOCK WHILE_EXA VAR INDEX: INT ; IDWORD: ARRAY [1..50] OF STRING ; END_VAR BEGIN INDEX := 1 ; WHILE INDEX <= 50 AND IDWORD[INDEX] <> 'KEY' DO INDEX := INDEX + 2; END_WHILE ; END_FUNCTION_BLOCK
PCS 7 PoT V6.0 | Edition V1.0 | August 2003 Copyright 2003 Siemens AG by A&D AS CS2 PA. All rights reserved.
Page 7 - 18

PCS 7 PoT
Chapter 7 Creating Function Blocks – SCL
4. Chart-in-Block In Chapter 6, Section 2.1, we have discussed Chart I/Os. After defining I/Os for a chart, you can compile the chart into a block, which is discussed in this chapter. You need to specify attributes for the chart I/Os (which become the block parameters) and for the block as in SCL. Picture 7.16 illustrates how to open the Variable Properties dialog provided that there is a chart I/O defined (refer to Chapter 6, Section 2.1) to specify system attributes for a variable. After opening the dialog the parameter attributes are listed for selection as shown in Picture 7.17.
Picture 7.16: Opening the Variable Properties dialog
PCS 7 PoT V6.0 | Edition V1.0 | August 2003 Copyright 2003 Siemens AG by A&D AS CS2 PA. All rights reserved.
Page 7 - 19

PCS 7 PoT
Chapter 7 Creating Function Blocks – SCL
Picture 7.17: Specifying parameter attributes in the Variable Properties dialog
After selecting the chart I/Os and specifying the parameter attributes for each chart I/O, follow the menu function: Compile > Chart as Block. Then, the Compile chart as block dialog opens where you need to define the block header and block attributes. Refer to Pictures 5.18 and 5.19.
Picture 7.18: Defining block header
PCS 7 PoT V6.0 | Edition V1.0 | August 2003 Copyright 2003 Siemens AG by A&D AS CS2 PA. All rights reserved.
Page 7 - 20

PCS 7 PoT
Chapter 7 Creating Function Blocks – SCL
Picture 7.19: Specifying block attributes Once a chart becomes a block, it is an independent block. You could insert it into CFCs, use it for other projects, etc. 5. CPU robustness and measures 5.1 Entire program download or Changes only download? When you download the program from CFC to CPU, you can select the types of download:
• Entire program. The entire contents of the "Blocks" folder is downloaded and (following a query) the CPU is set to STOP.
• Changes only. The CPU is in the "RUN-P" mode. The modified blocks are downloaded as smoothly as possible to avoid the CPU changing to the "STOP" mode.
To avoid CPU STOP, you should avoid the Entire program download and choose Change only download. When changes are downloaded, "asynchronous compression of the CPU" is triggered implicitly. Compiling the entire program does not necessarily mean a complete download. If the program was already loaded in the CPU prior to compiling, it is possible to download the changes only. You can compile a program as often as you wish (entire program or changes only) without losing the option of downloading changes only.
PCS 7 PoT V6.0 | Edition V1.0 | August 2003 Copyright 2003 Siemens AG by A&D AS CS2 PA. All rights reserved.
Page 7 - 21

PCS 7 PoT
Chapter 7 Creating Function Blocks – SCL
If a download of changes was aborted, you can repeat the download so that the parts that were not downloaded the first time are downloaded the second time. If the download was aborted when downloading the entire program, it is no longer possible to download changes until the download of the entire program has been completed successfully. The reason for this is that the blocks on the CPU were deleted prior to the download. If a block type that is already being used is replaced by a new version in which the structure was modified, for example by changing block interface (block I/Os) and/or messages, it is no longer possible to download changes. Remedy for this is to reserve several variables for each parameter type of the data type “DWORD” so that you can declare new I/Os with the corresponding data type which already use the reserved memory. Since the actual interface is not altered, loading the changes is possible. Note Compressing the number ranges has different effects on downloading compared with compressing the CPU memory. In the latter case, a download of changes remains possible. If you want to test a modified program on a different CPU before you download the changes, you should use a copy of the program to do so and then incorporate the test results into the original program. In this way, the time-stamp of the program is not changed and hence you can download changes. If the program was archived, and you want to download the archived program to the CPU instead of the current program, this is only possible if the archived version is the original of the last download (time stamp comparison). Download Option: Include user data blocks As default, this option is set and is only relevant for downloading changes; in other words, if you download the entire program, all the blocks are downloaded including the user data blocks. If this option is set when you download changes, the data blocks that are not in the CFC area are handled as follows:
• They are included in the download if the time stamp is different or data blocks have been added.
• They are deleted on the CPU if they do not exist in the S7 program. Logic check: You should test your blocks thoroughly in laboratory before using them in projects. Eliminate programming error, algorithm errors, division by zero, value overflow, and data type incompatibilities, etc.
PCS 7 PoT V6.0 | Edition V1.0 | August 2003 Copyright 2003 Siemens AG by A&D AS CS2 PA. All rights reserved.
Page 7 - 22

PCS 7 PoT
Chapter 7 Creating Function Blocks – SCL
Error OBs: The reaction of the CPU to certain events is to call error OBs. The error OBs are installed by running the Generate Module Driver wizard. Nesting Depth of MCR instructions: The nesting depth of MCR instructions (Master Control Relay) is restricted to 8 operations. Cycle time: The typical run time of blocks has to be taken into account. If too many blocks are included in a cyclic interrupt OB, blocks in another interruptible OB cannot be executed. 5.2 Local data 5.2.1 Definition of local data Local data are declared in a block (FC, FB, OB) and belonged to that block. More details are explained in Table 7.3.
Local data or Local variables Explanation Static Variables
Static variables are local variables whose value is retained both during and after execution of the block (block memory). They are used for storing values for a function block.
Temporary Variables
Temporary variables belong to a logic block locally and do not occupy any static memory area. Their values are only retained while the block concerned is running. Temporary variables cannot be accessed from outside the block in which they are declared.
Block Parameters
Block parameters are formal parameters of a function block or a function. They are local variables that are used to pass the actual parameters specified when a block is called.
Table 7.3: Local data
5.2.2 Preset local data in CPU Local data for a CPU and each of the interrupt OBs are preset in the CPU Properties. See Picture 7.20.
PCS 7 PoT V6.0 | Edition V1.0 | August 2003 Copyright 2003 Siemens AG by A&D AS CS2 PA. All rights reserved.
Page 7 - 23

PCS 7 PoT
Chapter 7 Creating Function Blocks – SCL
Picture 7.20: Local data preset in a CPU 416 – 2 The maximum preset local data in the popular CPUs are listed in Table 7.4.
CPU Maximum local data preset (in Kbytes) 414 – 3 8 416 – 2 and 416 – 3 16 417 – 4 32
Table 7.4: Maximum local data assigned in CPUs
For CPU 416-2, the local data pre-assigned for each priority class are listed in Table 7.5. For other CPUs you could obtain the figures by checking the CPU Properties as illustrated in Picture 7.20. PCS 7 PoT V6.0 | Edition V1.0 | August 2003 Copyright 2003 Siemens AG by A&D AS CS2 PA. All rights reserved.
Page 7 - 24

PCS 7 PoT
Chapter 7 Creating Function Blocks – SCL
Priority Class
Assigned Obs
Local Data (Bytes)
Priority Class
Assigned Obs
Local Data (Bytes)
1 OB1 1024 15 OB38 256 2 OB10-17,
OB55-57 1024 16 OB40 256
3 OB20 256 17 OB41 256 4 OB21 256 18 OB42 256 5 OB22 256 19 OB43 256 6 OB23 256 20 OB44 256 7 OB30 256 21 OB45 256 8 OB31 256 22 OB46 256 9 OB32 1024 23 OB47 256
10 OB33 1024 24 256 11 OB34 1024 25 OB61-64
OB81-87 1024
12 OB35 1024 26 1024 13 OB36 256 27 OB100/101 1024 14 OB37 256 28 1024
29 OB90 256 Block OB121 and OB122 occupy the same priority class as the block interrupted by a programming error or I/O access error. Default assignment to a specific priority class is thus not possible.
Table 7.5: Local data preset for each priority class
The preset local data for each priority class has to be adjusted to suit the user’s program. The OBs with less data should be allocated with less local data space while OBs having more data should be assigned with more local data space. Note The local data requirement for each priority class have to be calculated so that the space is optimised. 5.2.3 Calculation of local data Size of local data for a S7 program can be checked in the Chart Reference Data interface. The reference data can be called up by following the menu path: (in the CFC) Options > Chart Reference Data. Then, the Chart reference data is displayed as shown in Picture 7.21. The local data requirement and offline-configured data (comparing Picture 7.21 and Picture 7.20) are clearly listed. The list provides a base to re-distribute the offline data, especially the Priority classes which are not listed in the View can be assigned an empty space.
PCS 7 PoT V6.0 | Edition V1.0 | August 2003 Copyright 2003 Siemens AG by A&D AS CS2 PA. All rights reserved.
Page 7 - 25

PCS 7 PoT
Chapter 7 Creating Function Blocks – SCL
Picture 7.21: Chart reference data – the Local data view 5.3 CPU memory In Chapter 5, S7 – 400 CPU memories are illustrated in Picture 5.9. You have to check if the load memory and work (or main) memory are sufficient before downloading of your programs. Proceed as illustrated in Picture 7.22 and Picture 7.23.
PCS 7 PoT V6.0 | Edition V1.0 | August 2003 Copyright 2003 Siemens AG by A&D AS CS2 PA. All rights reserved.
Page 7 - 26

PCS 7 PoT
Chapter 7 Creating Function Blocks – SCL
Picture 7.22: Displaying the requirement for the load and work memory -1
Picture 7.23: Displaying the requirement for the load and work memory -2
PCS 7 PoT V6.0 | Edition V1.0 | August 2003 Copyright 2003 Siemens AG by A&D AS CS2 PA. All rights reserved.
Page 7 - 27

PCS 7 PoT
Chapter 7 Creating Function Blocks – SCL
For the S7 program shown in Picture 7.23, the load memory is required of 296,280 bytes and the work memory is required of 228,098 bytes as shown in Picture 7.23, which does not include the system data. The specification on memories of S7 – 400 CPUs is given in Table 7.6.
CPU Load Memory Work (Main) Memory
414-3 (1) Integrated 256 Kbytes RAM; (2) Expandable with RAM memory
card up to 16 Mbytes.
(1) Integrated 384 Kbytes for code and 384 Kbytes for data;
(2) Non-expandable.
416-2 (1) Integrated 256 Kbytes RAM; (2) Expandable with RAM memory
card up to 16 Mbytes.
(1) Integrated 0.8 Mbytes for code and 0.8 Mbytes for data;
(2) Non-expandable.
416-3 (1) Integrated 256 Kbytes RAM; (2) Expandable with RAM memory
card up to 16 Mbytes.
(1) Integrated 1.6 Mbytes for code and 1.6 Mbytes for data;
(2) Non-expandable.
417-4 (1) Integrated 256 Kbytes RAM; (2) Expandable with RAM memory
card up to 16 Mbytes.
(1) Integrated 2 Mbytes for code and 2 Mbytes for data;
(2) Expandable, up to 2 Mbytes for code and up to 2 Mbytes for data.
Table 7.6: Memory specification of CPUs
You can check if the memories are sufficient for the program before downloading the program to the CPU. In the CPU runtime, the diagnostic tool “Module Information” is used to check the memory occupation of online blocks. Refer to Picture 7.27.
PCS 7 PoT V6.0 | Edition V1.0 | August 2003 Copyright 2003 Siemens AG by A&D AS CS2 PA. All rights reserved.
Page 7 - 28

PCS 7 PoT
Chapter 7 Creating Function Blocks – SCL
Picture 7.24: Load memory and Work memory in the CPU runtime 5.4 System support for CPU load and memory 5.4.1 The Warning limits The purpose of the warning limits is to inform you during compilation or at the latest when you download if the load limits of the local stack, load/work memory, and communication blocks will be exceeded. You can set the limit values as percentages that apply both for compilation and downloading. These are warning limits for
• the local data, • the number of communication block instances, and • the load memory / work memory (checked only when downloading).
The Warning limits are set in the CFC editor with the menu path: Options > Customize > Compilation. Then the dialog opens as shown in Picture 7.25.
PCS 7 PoT V6.0 | Edition V1.0 | August 2003 Copyright 2003 Siemens AG by A&D AS CS2 PA. All rights reserved.
Page 7 - 29

PCS 7 PoT
Chapter 7 Creating Function Blocks – SCL
Picture 7.25: Warning limits in the CFC compilation The Local data, Load memory, and Work memory are set to a warning limit of 90% of the configured resources. The communication block instances are set to a warning limit of 90% of the configured communication resources, which can be seen as 1800 in Picture 7.20. “Areas Reserved for Other Applications” In this part of the dialog, you can specify the DB and FC number ranges that are not for the CFC resources and they are ignored when the charts are compiled. If the "Compress" option is selected, any existing gaps in the range of numbers used is removed. Note You need to compile the entire program and download it to the CPU (in the STOP mode) if you have changed and compressed the number ranges. “DB numbers” Here, you specify which DBs CFC/SFC should leave unused during compilation. Within this number range, you must include the DBs of the program that do not originate from CFC/SFC. “FC numbers” Here, you specify which FCs CFC/SFC should leave unused during compilation. This range must include the block types implemented as FCs.
PCS 7 PoT V6.0 | Edition V1.0 | August 2003 Copyright 2003 Siemens AG by A&D AS CS2 PA. All rights reserved.
Page 7 - 30

PCS 7 PoT
Chapter 7 Creating Function Blocks – SCL
If you change the range of DB and/or FC numbers later so that existing user DBs/FCs are no longer included, a message is displayed when you click the "Test" or "OK" buttons and the numbers are displayed in red. In this case, you must correct the entries or restore the original situation with "Cancel". "Test" button This button starts a check to find out whether changes to the reserved ranges mean that existing DBs or FCs are still located in the legal range and whether compressing is necessary. If the check is positive (they are all in the permitted range) no message is displayed. Otherwise, a message is displayed, the "Compress" option is set and cannot be reset directly. The check box only becomes active again after you have set the old range again and clicked the "Test" button after which, you can reset the option as required. “Compress” With this option, you can compress the CPU resources used by CFC. The DB and FC numbers are arranged as far as possible without gaps. DBs and FCs receive new numbers. If you set this option, a message will inform you of the consequences. These are as follows:
• Only an entire download to the PLC in the STOP mode is possible. • It may be necessary to transfer the PLC-OS connection data again. • The "read back chart" function can no longer be executed since the blocks
on the PLC no longer match the configuration in CFC. Note If you want to "read back a chart", do this before compressing. If you have extended the range of DB or FC numbers, you automatically receive a message that compressing is in progress. If you have reduced or shifted the range so that existing FCs are no longer in this range, you receive a message when you click the "Test" or "OK" buttons. In this case, the resources are not compressed and the settings for the range must be corrected. Note Compressing always starts immediately after you close the dialog box with "OK"! “Statistics” In the "Maximum number" column, you can see the maximum number of DBs and FCs possible on the current CPU. In the "Available" column, you can see the number of DBs and FCs available to CFC when compiling the charts of the chart folder. This number is the difference between the maximum possible number and the DBs or FCs specified as illegal for CFC. The "In use" column displays the resources already in use for compilation of the charts.
PCS 7 PoT V6.0 | Edition V1.0 | August 2003 Copyright 2003 Siemens AG by A&D AS CS2 PA. All rights reserved.
Page 7 - 31

PCS 7 PoT
Chapter 7 Creating Function Blocks – SCL
The "Highest number" column shows the highest number of the DBs and FCs that were automatically generated by CFC. With this information, you can, for example, check whether the numbers of blocks possible on smaller CPUs has been exceeded although numbers are still free. If the current program is not yet assigned to a CPU, it is impossible to determine the maximum numbers and numbers of available resources, these depend on the type of CPU. In this case, the entries in the columns are "--". 5.4.2 The Logs page During compiling and downloading, warnings are reported. The Logs page can be found following the menu path: (in CFC) Options > Logs. Some of the warning messages are shown in Picture 7.26.
Picture 7.26: The Logs page 5.4.3 Measures during compiling During the consistency check, the complete call hierarchy of the blocks and their time stamps are checked. As a result, for example, the system can recognise when two blocks call the same block but each called block has a different version. The maximum local data requirements are calculated and compared with the resources of the configured CPU. If the absolute value (100 %) or the set warning limit (Options > Customize > Compilation) is exceeded, a warning is generated but the code is generated nevertheless. This allows the local data stack to be adapted later without requiring recompilation.
PCS 7 PoT V6.0 | Edition V1.0 | August 2003 Copyright 2003 Siemens AG by A&D AS CS2 PA. All rights reserved.
Page 7 - 32

PCS 7 PoT
Chapter 7 Creating Function Blocks – SCL
The nesting depth of the blocks in the program structure is checked and compared with the maximum possible nesting depth of the configured CPU. If this is exceeded, compilation is supported and an error message entered in the log that contains the entire call hierarchy of the OB involved. The maximum nesting depth of an OB is <= 24 including depth of OB121 and OB122. The OBs are checked to make sure that they call the blocks generated by the FC tasks. If the correct FC is not called, an error message is generated (entry in the Logs). After compilation, the instance DBs relevant for communication are counted and compared with the configured maximum number of communication resources. This includes a check for violations of the set warning limit or the absolute limit (100 %). If one of these limits is exceeded, a warning is entered in the Logs. All error messages prevent subsequent downloading. 5.4.4 Measures during downloading The maximum local data requirements calculated during compilation are compared with the resources of the online CPU (by reading out the system status list). If the warning limit is exceeded, a warning is output but the download is not prevented. If the absolute limit is exceeded, an error message is entered in the log and the download is prevented. The memory requirements for the blocks being downloaded is calculated and compared with the free memory of the CPU. The set warning limit and/or the absolute limit (100 %) are checked for violations. If one of the limits is exceeded, a dialog is opened and a message displayed. In this dialog box, you have the following options:
• You can compress the CPU memory • You can skip compression and continue to download (responsibility of the
user) • You can abort the download.
After compressing with the CPU in RUN mode, the available memory is checked. If the memory requirements are now under the set warning limit, the download takes place. If compressing does not free up enough memory, the dialog and message appear again. The only option now is to download or abort. If you download despite the warning, the download is aborted if the absolute limit is exceeded (the CPU does not change to STOP) and the error message is entered in the Logs. The number of communication instance DBs calculated during compilation is compared with the number configured for the online CPU. If the set warning limit is exceeded a warning is entered in the log but the download is not prevented. If the absolute limit is exceeded, an error message is entered in the log and the download is prevented. PCS 7 PoT V6.0 | Edition V1.0 | August 2003 Copyright 2003 Siemens AG by A&D AS CS2 PA. All rights reserved.
Page 7 - 33

PCS 7 PoT
Chapter 7 Creating Function Blocks – SCL
5.4.5 Further measures Type import: During the type import of multiple instance blocks, the reference lists of the blocks to be imported are also used to detect the called blocks. This allows FCs to be copied to the destination program during import. If the time stamp evaluation shows that a block is called by blocks of a different version, a dialog box is displayed showing the call hierarchy of the block. The blocks that are updated during import are shown here. If a called block is also updated implicitly by the import function, another block that calls the same block may no longer be executable. An example is shown in Picture 7.27. The diagram shows that FB 61 includes a call for FB 46. Both are updated during import. FB 46 is, however, also called by FB202 that is not updated and may also access parameters that have been modified.
Picture 7.27: Block calls Now, the user must do the following. After reading the chart reference data (menu path: Options > Chart Reference Data), you can look for the relevant called block until you have found all the calling blocks in the "Block Call Hierarchy" view as illustrated in Picture 7.28. Then, you have to import all these blocks.
PCS 7 PoT V6.0 | Edition V1.0 | August 2003 Copyright 2003 Siemens AG by A&D AS CS2 PA. All rights reserved.
Page 7 - 34

PCS 7 PoT
Chapter 7 Creating Function Blocks – SCL
Picture 7.28: Block Call hierarchy Copying/moving: By evaluating the block reference lists the blocks called are also copied (just as in type import) when you copy or move multiple instance blocks. Necessary error OBs are generated in CFC and downloaded to the AS if using the Generate Module Drivers. These OBs recognise the faults or errors and prevent a CPU STOP. The error blocks are inserted automatically into S7 Program when the module drivers are generated (SIMATIC Manager: Options > Charts > Generate Module Drivers).
PCS 7 PoT V6.0 | Edition V1.0 | August 2003 Copyright 2003 Siemens AG by A&D AS CS2 PA. All rights reserved.
Page 7 - 35

PCS 7 PoT
Chapter 7 Creating Function Blocks – SCL
PCS 7 PoT V6.0 | Edition V1.0 | August 2003 Copyright 2003 Siemens AG by A&D AS CS2 PA. All rights reserved.
Page 7 - 36

PCS 7 PoT
Chapter 7 Creating Function Blocks – SCL
Exercise Exercise 7.1 Creating Function block, Rotation, in SCL 1. The task To simulate a rotating stir, you can use the technique of cartoon pictures. For example, draw a number of the stir pictures and show one at one time in a certain time interval. Refer to Picture 7.29.
Picture 7.29: Cartoon pictures for simulating a stir The task requires that if the motor is on, the cartoon pictures show off automatically one by one from Picture 0, Picture 1, to, e.g. Picture 15, and then from Picture 0 start again. The task is divided into two parts. The first part is to design a function to supply the values and the second part is to link the values with the pictures. In this exercise, we do the first part of the task. The second part will be carried out in Chapter 10. Note To display the rotation of a stir, you could use a graphic function called the Status Display in OS. The status display needs the periodic value and pictures. You will complete the exercise in Chapter 10.
PCS 7 PoT V6.0 | Edition V1.0 | August 2003 Copyright 2003 Siemens AG by A&D AS CS2 PA. All rights reserved.
Page 7 - 37

PCS 7 PoT
Chapter 7 Creating Function Blocks – SCL
2. Guideline The function block could have an input to detect if the motor is running and an output to provide 16 values (0, …, 15) one by one at the interval of the block cycle. See Picture 7.30.
Picture 7.30: A design of the rotation block The two variables of the Rotation block have to be specified with appropriate attributes. Particularly, the S7_m_c has to be included, as the variable STIR will be used in the status display and the variable QRUN_Mot can be set/reset from OS. Test your program in CFC to verify that your block generates a series of periodic values. Hint: Codes of the rotation function are given in the answer page of the chapter. Exercise 7.2 Creating function blocks using Chart-in-Block 1. The task Design a user-defined function block to meet the requirements of your automation task. For example, instead of using PID control, only P control is required. The control scheme is shown in Picture 7.31 with notations indicated.
P controller actuator
control action(limits to be monitored)
output(valve position,heater switch)setpoint
feedback, FBK
SP ER LMN PV
error+
-
Picture 7.31: Control scheme of a user-defined controller You could use the PCS 7 library functions to build up your control algorithms. An example of the solution to the above task is shown in the following Picture 7.33 where the PCS 7 library functions ADD4_P, MUL4_P, MEAS_MON, and NEG_R are used. The blocks within the dotted line in Picture 7.32 will be compiled as a function block, which will become the controller with a proportional gain. PCS 7 PoT V6.0 | Edition V1.0 | August 2003 Copyright 2003 Siemens AG by A&D AS CS2 PA. All rights reserved.
Page 7 - 38

PCS 7 PoT
Chapter 7 Creating Function Blocks – SCL
ActuatorPT1_P
MultiplierMUL4_P
AddADD4_P
NegativeNEG_R
LMN
ER
PV
SP
MessageMEAS_MON
AHWH
ALWL
P controllerGain
FBK
User-defined controller
Picture 7.32: A user-defined controller using CFC library function blocks
On a CFC chart you place the blocks (ADD4_P, MUL4_P, MEAS_MON, and NEG_R) from the CFC library and then compile the CFC chart as a function block. For example, the block will be referred as CTRL_P (FB1215). Test your design in CFC. 2. Guideline To work with chart-in-block, it is recommended to work between the master data library and a project of a multiproject. You start to develop the chart in the master data library, store the original chart, CTRL_P, in the library, compile the chart as a block in the library, and then copy the block to the project. Design of CTRL_P: In your master data library add a new CFC chart and place the necessary function blocks from the PCS 7 library onto the chart. Interconnect the blocks and finish the design. Refer to Picture 7.32. Defining chart I/Os: Select inputs and outputs for the chart (e.g. select inputs: SP, Gain, FBK, and alarm limits. Select outputs: LMN, ER, and alarms). Set necessary system attributes to the I/Os; e.g. S7_m_c := ‘true’ is required if a variable is to be seen at OS. Please note if the message EV_ID is specified correctly. Refer to Picture 7.12. PCS 7 PoT V6.0 | Edition V1.0 | August 2003 Copyright 2003 Siemens AG by A&D AS CS2 PA. All rights reserved.
Page 7 - 39

PCS 7 PoT
Chapter 7 Creating Function Blocks – SCL
Compiling chart as block. Menu path: Chart > Compile chart as block. Define the block header and attributes for the block. Copying the block from the master data library to the project Testing you design: Use your controller, CTRL_P to control an actuator, e.g. PT1_P (FB51), in a CFC chart and test your design. Refer to Picture 7.33 below.
Picture 7.33: Testing CTRL_P Hint: You can find a design for the CTRL_P chart on the answer page.
PCS 7 PoT V6.0 | Edition V1.0 | August 2003 Copyright 2003 Siemens AG by A&D AS CS2 PA. All rights reserved.
Page 7 - 40

PCS 7 PoT
Chapter 7 Creating Function Blocks – SCL
Answers 1. Codes of the rotation function
Picture 7.34: The rotation function
PCS 7 PoT V6.0 | Edition V1.0 | August 2003 Copyright 2003 Siemens AG by A&D AS CS2 PA. All rights reserved.
Page 7 - 41

PCS 7 PoT
Chapter 7 Creating Function Blocks – SCL
2. Chart, CTRL_P with I/Os
Picture 7.35: Chart CTRL_P
PCS 7 PoT V6.0 | Edition V1.0 | August 2003 Copyright 2003 Siemens AG by A&D AS CS2 PA. All rights reserved.
Page 7 - 42

Chapter 8:
Sequential Control - SFC


Contents: CHAPTER 8 SEQUENTIAL CONTROL - SFC .......................................................................................... 1
1. PRINCIPLES OF SFC ..................................................................................................................................... 1
1.1 OPERATING STATES........................................................................................................................................1 1.3 SEQUENCE PATHS OF A SFC CHART.............................................................................................................3 1.4 PHASES OF A STEP...........................................................................................................................................6 1.5 EXECUTING STEPS AND TRANSITIONS OF A SEQUENCE .............................................................................7 1.6 EXECUTION OF A PARALLEL (SIMULTANEOUS) SEQUENCE.......................................................................9 1.7 EXECUTION OF AN ALTERNATIVE SEQUENCE .............................................................................................9 1.8 EXECUTION OF A LOOP.................................................................................................................................10 1.9 EXECUTION OF A JUMP.................................................................................................................................11
2. SFC CHART .....................................................................................................................................................11
2.1 SFC BASIC HANDLING..................................................................................................................................11 2.1.1 Formulating a Step.............................................................................................................................11 2.1.2 OS Comment for an Statement..........................................................................................................12 2.1.3 Transition.............................................................................................................................................13 2.1.3 Test modes............................................................................................................................................14 2.1.4 Selecting a target step........................................................................................................................14 2.1.5 SFC in Runtime sequence..................................................................................................................15 2.1.6 Operating modes.................................................................................................................................16 2.1.7 External view of SFC chart...............................................................................................................16 2.1.8 List of Step control modes.................................................................................................................17 2.1.11 Consistency check.............................................................................................................................18 1.10 Compiling and downloading in the SFC editor..............................................................................18
2.2. SFC CHART FACEPLATE.............................................................................................................................18
3. SFC TYPE..........................................................................................................................................................21
3.1 SFC TYPE HANDLING...................................................................................................................................22 3.1 A SFC type and path..............................................................................................................................22 3.1.2 I/Os of a SFC type...............................................................................................................................23 3.1.3 Interfacing a SFC type.......................................................................................................................25
3.2 CHARACTERISTICS OF A SFC TYPE............................................................................................................26 3.2.1 Setpoint.................................................................................................................................................26 3.2.2 Control Strategies...............................................................................................................................28 3.2.3 Process values.....................................................................................................................................30 3.2.4 Control values.....................................................................................................................................31 3.2.5 Parameters...........................................................................................................................................32 3.2.6 Bit memory ...........................................................................................................................................32 3.2.7 Timers ...................................................................................................................................................32 3.2.8 Note texts..............................................................................................................................................33 3.2.9 Block contacts......................................................................................................................................34 3.2.10 Position texts .....................................................................................................................................36
3.3 SFC TYPE FACEPLATE..................................................................................................................................36 3.3.1 SFC type icon......................................................................................................................................36 3.3.2 SFC type faceplate..............................................................................................................................38
LAB PROJECT RMT1 (PART 2) ...................................................................................................................41
- AUTOMATIC CONTROL OF THE RMT1 UNIT .................................................................................41
1. TASK DESCRIPTION.........................................................................................................................................41 2. GUIDELINE.......................................................................................................................................................41
2.1 Design NK112, NK113, and NK114 ...................................................................................................41 2.2 Selection of reactors..............................................................................................................................42 2.3 Using a SFC chart to control the RMT1 unit ....................................................................................43 2.4 Using a SFC type to control the RMT1 unit ......................................................................................47


PCS 7 PoT Chapter 8 Sequential Control - SFC
PCS 7 PoT V6.0 | Edition V1.0 |August 2003 Copyright 2003 Siemens AG by A&D AS CS2 PA. All rights reserved.
Page 8 - 1
Chapter 8 Sequential Control - SFC
Typical applications of sequential control system involve processes and plants with discontinuous characteristics. Sequential control can also be used for continuous processes and plants, for example, for approaching and withdrawing movements, operating point changes, and state changes due to faults. Sequential controls are implemented at various levels: • Device control level (opening valve, starting motor) • Group control level (proportioning, stirring, heating, filling) • Unit level (tank, mixer, scale, reactor) • Plant level (synchronisation of units and common resources, routing) Note SFC stands for Sequential Function Chart. While, there are other terms related. SFC chart means a chart editable in the SFC editor and SFC type a chart created as a type in the SIMATIC Manger and edited in the SFC editor. 1. Principles of SFC 1.1 Operating states The operating state of the sequential control system indicates the current state and, for example, whether operator intervention is necessary for continuing operation or which command is possible to change to a different operating state. The operating state is influenced as below:
• In the Manual mode with the commands; see Picture 8.1 • In the Auto mode via the external view of the chart; refer to Section 2.1.7
of the chapter. All commends or actions of a SFC chart are listed in the lower part of Picture 8.1, which are Start, Abort, Restart, Hold, Complete, Reset, Resume, Stop, and Error. Actions will cause SFC into different states, namely, Idle, Starting, Run (Active), Completing, Holding, Error, Held, Held-Error, Resuming, Aborting, Aborted, Stopping, and Stopped. The actions and states are illustrated in Picture 8.2.

PCS 7 PoT Chapter 8 Sequential Control - SFC
PCS 7 PoT V6.0 | Edition V1.0 |August 2003 Copyright 2003 Siemens AG by A&D AS CS2 PA. All rights reserved.
Page 8 - 2
Picture 8.1 SFC Editor and SFC online test mode

PCS 7 PoT Chapter 8 Sequential Control - SFC
PCS 7 PoT V6.0 | Edition V1.0 |August 2003 Copyright 2003 Siemens AG by A&D AS CS2 PA. All rights reserved.
Page 8 - 3
Picture 8.2 Actions and States of a SFC All possible transitions for state to state are illustrated in Picture 8.2 providing a good picture in understanding how a SFC chart is executed and intervened.
1.3 Sequence paths of a SFC chart A SFC can contain several sequence paths which can be used for different applications. Different start conditions can be used to ensure that the respective sequence path is executed when certain events occur. You can thus, for example configure a separate sequence path for each operating state (ready, active, error, etc.) or for each operating characteristic (heating, cooling, temperature equalisation, etc.).

PCS 7 PoT Chapter 8 Sequential Control - SFC
PCS 7 PoT V6.0 | Edition V1.0 |August 2003 Copyright 2003 Siemens AG by A&D AS CS2 PA. All rights reserved.
Page 8 - 4
You can insert up to 8 sequence paths in a SFC chart. In Picture 8.3, there are 6 paths. Functions to handle sequence paths are included in the context menu shown in Picture 8.3 where you can insert, move, and delete a sequence path, etc.
Picture 8.3: Functions to handle sequence paths of a SFC The first sequence path of a chart has the condition "SFC.RUN=1" where SFC is the chart name and RUN a variable of the chart (Refer to the external view of a SFC chart). The start condition of each newly added sequence path is empty and is thus not fulfilled, meaning that the path will not be executed. You have to define the start condition for a new sequence path. Picture 8.4 shows that the start condition is defined in the Sequence Properties window.

PCS 7 PoT Chapter 8 Sequential Control - SFC
PCS 7 PoT V6.0 | Edition V1.0 |August 2003 Copyright 2003 Siemens AG by A&D AS CS2 PA. All rights reserved.
Page 8 - 5
Picture 8.4: Start condition of a sequence path It is possible that several start conditions are fulfilled simultaneously. You can assign different priorities to the individual sequence paths. See Picture 8.5.
Picture 8.5: Priority of a sequence path A path with higher priority is executed earlier than a path with lower priority if they have same start conditions. You can assign a priority of 1 to 32 to a sequence path with 1 being the highest priority. If several start conditions are fulfilled at the same time, the most-far-left sequence path will be activated and it will be the only one executed. Note There can be only one sequence path active at any time.

PCS 7 PoT Chapter 8 Sequential Control - SFC
PCS 7 PoT V6.0 | Edition V1.0 |August 2003 Copyright 2003 Siemens AG by A&D AS CS2 PA. All rights reserved.
Page 8 - 6
A cyclic action can be configured for each sequence path. The cyclic action consists of a section called Preprocessing, which is executed before the cyclic sequence path processing and a section called Postprocessing, which is executed after the cyclic sequence path. Both sections are configured in the Sequence Properties dialog window. Refer to Picture 8.4 or Picture 8.5.
1.4 Phases of a step Each step is divided into three phases of actions. See Picture 8.6. • Initialisation is the action for the first execution of a step • Processing is the action for cyclic execution of a step • Termination is the action for last execution of step
Picture 8.6: Three phases of a Step Picture 8.7 shows the phases of a step in conjunction with a successor transition: on the left, the elements in the chart topology, on the right, the corresponding phases.

PCS 7 PoT Chapter 8 Sequential Control - SFC
PCS 7 PoT V6.0 | Edition V1.0 |August 2003 Copyright 2003 Siemens AG by A&D AS CS2 PA. All rights reserved.
Page 8 - 7
Picture 8.7 Execution of a step and transition
1.5 Executing steps and transitions of a sequence The Start step is activated when the chart is started without querying conditions and its actions are executed. A Step can have the states "active" and "inactive". A Step becomes active after the preceding transition passes control to it. The actions are then triggered and executed. A Step becomes inactive after the successor transition is satisfied. A transition has the states "FALSE" and "TRUE". The state of the successor transition of the active step is queried. If the successor transition is true (the condition is true), the previous step is deactivated and the next step activated. If a minimum run time is configured, the transition is queried (depending on the step control mode) only after this time has elapsed. The actions of the END step are executed once only.

PCS 7 PoT Chapter 8 Sequential Control - SFC
PCS 7 PoT V6.0 | Edition V1.0 |August 2003 Copyright 2003 Siemens AG by A&D AS CS2 PA. All rights reserved.
Page 8 - 8
Picture 8.8: Time response in two consecutive steps When the chart progresses from one step to the next, the predecessor step is terminated in the same cycle as the first action (initialisation or execution) of the next step. This satisfies the "non-latching behaviour" specified in IEC 1131 - 3. Example: In Step S4 (as in Picture 8.8), the execution opens a valve and in the termination, the valve is closed. If the same valve is opened again in the first action of the next step (S5), the overlapping of the two actions (both in one cycle) means that the valve is not closed. Special Situations Picture 8.8 shows the response when all three phases of a step are configured. Other combinations are also possible. If no "initialization" is configured, the execution begins immediately when the step is activated. If no "termination" is configured, the step is deactivated immediately when the transition is true. The minimum time for which a step is active depends on the number of configured actions (1 to 3 processing cycles). If a minimum run time is set for a step, the step remains active for at least this time even if the transition condition is true earlier. Note The function "Check Step Processing" in the "Options" menu of the SFC editor is important as it searches and logs the overlapped actions. See Picture 8.9.

PCS 7 PoT Chapter 8 Sequential Control - SFC
PCS 7 PoT V6.0 | Edition V1.0 |August 2003 Copyright 2003 Siemens AG by A&D AS CS2 PA. All rights reserved.
Page 8 - 9
Picture 8.9: Check Step Processing 1.6 Execution of a parallel (simultaneous) sequence The parallel sequences are executed simultaneously in one cycle and executed independently of each other.
Picture 8.10 Parallel Sequence The transition after the parallel sequence is executed when all the steps at the end of the sequence paths are active and the transition conditions are satisfied. 1.7 Execution of an alternative sequence The path of an alternative sequence to be executed is the sequence with the transition whose condition is satisfied first.

PCS 7 PoT Chapter 8 Sequential Control - SFC
PCS 7 PoT V6.0 | Edition V1.0 |August 2003 Copyright 2003 Siemens AG by A&D AS CS2 PA. All rights reserved.
Page 8 - 10
Picture 8.11 Alternative Sequence If several transitions are satisfied at the same time, the transition furthest left in the chart topology is activated. Note In an alternative sequence, every transition should have parameters defined at the start of a step. Transitions without parameters are always true and are therefore automatically satisfied. This means that they are always true before a transition with parameters. 1.8 Execution of a loop Picture 8.12 illustrates the phases of a loop. To the left, are the elements in the chart topology and to the right the corresponding phases.
Picture 8.12: A loop

PCS 7 PoT Chapter 8 Sequential Control - SFC
PCS 7 PoT V6.0 | Edition V1.0 |August 2003 Copyright 2003 Siemens AG by A&D AS CS2 PA. All rights reserved.
Page 8 - 11
1.9 Execution of a Jump Depending on a transition condition, jumps can be used to continue the execution of the SFC chart at any step within the same chart.
Picture 8.13: Jumps A jump always leads immediately out of the sequence following a step (origin of the jump). The use of several jumps is also possible. See Picture 8.13. A jump consists of an initiating transition and an arrow specifying the jump target. The jump is executed when the transition of the jump is satisfied. If there is more than one jump following the origin of a jump (S4), then (just as in alternative sequences), the jump whose transition is satisfied first is executed. If several transitions are true at the same time, the transition furthest left is activated.
2. SFC chart 2.1 SFC basic handling 2.1.1 Formulating a Step You can browse existing variables to formulate statements and conditions.

PCS 7 PoT Chapter 8 Sequential Control - SFC
PCS 7 PoT V6.0 | Edition V1.0 |August 2003 Copyright 2003 Siemens AG by A&D AS CS2 PA. All rights reserved.
Page 8 - 12
Picture 8.14: Formulating a statement 2.1.2 OS Comment for an Statement The statements are adopted as OS comments if the option is selected in the relevant line. See Picture 8.15.

PCS 7 PoT Chapter 8 Sequential Control - SFC
PCS 7 PoT V6.0 | Edition V1.0 |August 2003 Copyright 2003 Siemens AG by A&D AS CS2 PA. All rights reserved.
Page 8 - 13
Picture 8.15: Processing statements in a step You can enter up to 50 statements per phase. In the Properties dialog, 10 of the statements can be seen and other 6 statements can be viewed using the scroll bar. See Picture 8.16. 2.1.3 Transition The number of conditions to be linked for each transition is 16. You can use the scroll bar to see more of the conditions.

PCS 7 PoT Chapter 8 Sequential Control - SFC
PCS 7 PoT V6.0 | Edition V1.0 |August 2003 Copyright 2003 Siemens AG by A&D AS CS2 PA. All rights reserved.
Page 8 - 14
Picture 8.16: Conditions in a transition You can toggle the logic buttons to change between AND and OR. 2.1.3 Test modes The Test modes, Process mode and Laboratory mode, are the same as they are in the CFC editor. Refer to Chapter 6. 2.1.4 Selecting a target step In the test mode (in the SFC editor or the SFC visualisation on OS), a step can be selected as the target step from which the chart is started meaning:
• the stopped SFC chart starts at the selected target step instead of at the START step with the next “Start” command.
• the held SFC chart resumes at the target step after interrupted steps when the “Continue” command is issued.
A target step is set in the Properties dialog of the step. See Picture 8.17.

PCS 7 PoT Chapter 8 Sequential Control - SFC
PCS 7 PoT V6.0 | Edition V1.0 |August 2003 Copyright 2003 Siemens AG by A&D AS CS2 PA. All rights reserved.
Page 8 - 15
Picture 8.17 Starting from a target step The target step marker is valid only for the next “Start” command. If the CPU is restarted and if there is a change from “Manual” to “Auto”, the target step marker will be deleted. Note It is also possible to select multiple steps as target steps (e.g. in parallel branches). The user is responsible for selecting the target steps so that the processing is feasible, which is to mean no blockages or endless loops. 2.1.5 SFC in Runtime sequence SFC charts are installed in the default OB (OB35) when they are newly inserted. The scan rate for the charts are therefore determinated. Normally, you should check if a SFC chart is installed in an approperiate OB taking into account of the time response.
Picture 8.18: SFC charts in the Runtime sequence

PCS 7 PoT Chapter 8 Sequential Control - SFC
PCS 7 PoT V6.0 | Edition V1.0 |August 2003 Copyright 2003 Siemens AG by A&D AS CS2 PA. All rights reserved.
Page 8 - 16
2.1.6 Operating modes The operating mode decides how the chart executes. The following modes are possible for a SFC chart:
Auto (program mode): controlled by a control block or another SFC chart. Manual (operator mode): controlled by an operator (in the test mode or at the faceplate on OS). Execution of the chart is controlled manually by an operator (for example during commissioning). 2.1.7 External view of SFC chart Each SFC chart has an external view and the view is a block in the CFC. Picture 8.19 shows the external view of Chart, SFC_val. External view of a chart is called up by following the menu path, (in the SFC editor) View > External view or (in the SIMATIC Manager) Right-click a chart > Open External view.
Picture 8.19: External view of a SFC chart
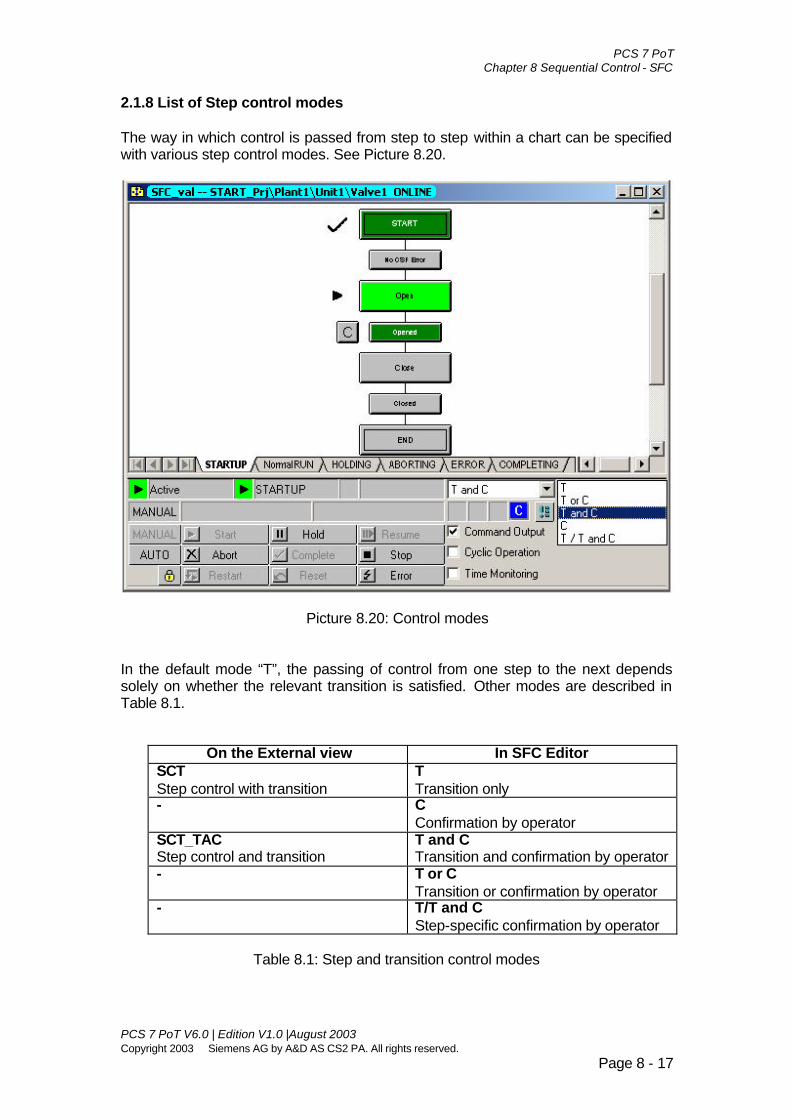
PCS 7 PoT Chapter 8 Sequential Control - SFC
PCS 7 PoT V6.0 | Edition V1.0 |August 2003 Copyright 2003 Siemens AG by A&D AS CS2 PA. All rights reserved.
Page 8 - 17
2.1.8 List of Step control modes The way in which control is passed from step to step within a chart can be specified with various step control modes. See Picture 8.20.
Picture 8.20: Control modes In the default mode “T”, the passing of control from one step to the next depends solely on whether the relevant transition is satisfied. Other modes are described in Table 8.1.
On the External view In SFC Editor SCT Step control with transition
T Transition only
- C Confirmation by operator
SCT_TAC Step control and transition
T and C Transition and confirmation by operator
- T or C Transition or confirmation by operator
- T/T and C Step-specific confirmation by operator
Table 8.1: Step and transition control modes

PCS 7 PoT Chapter 8 Sequential Control - SFC
PCS 7 PoT V6.0 | Edition V1.0 |August 2003 Copyright 2003 Siemens AG by A&D AS CS2 PA. All rights reserved.
Page 8 - 18
In the step control modes “C” and “T or C”, the minimum execution time of a step can be overridden by operator confirmation. 2.1.11 Consistency check Blocks could be deleted while SFC charts may still access the blocks’ variables. These accesses are virtual addresses and coloured in yellow in the Properties of steps or Transitions. In Picture 8.21, a virtual address is highlighted.
Picture 8.21: Virtual accesses Virtual accesses can be found by using the consistency check function, menu path, Chart > Consistency Check. 1.10 Compiling and downloading in the SFC editor In the SFC editor on an ES, you can compile SFC charts and download them to AS. As the function of compiling or downloading is relevant to the whole S7 program, there is no difference if the program is compiled/downloaded in the CFC editor or SFC editor. 2.2. SFC chart faceplate SFC charts are available in OS after compiling OS. By default, all SFC charts will be transferred to OS. See Picture 8.22.

PCS 7 PoT Chapter 8 Sequential Control - SFC
PCS 7 PoT V6.0 | Edition V1.0 |August 2003 Copyright 2003 Siemens AG by A&D AS CS2 PA. All rights reserved.
Page 8 - 19
Picture 8.22: Compiling SFC charts for visualisation If a SFC chart is in the same plant hierarchy where a picture is set to have block icon derived from the plant hierarchy, a SFC icon will be automatically inserted into the picture when compiling OS. Picture 8.23 shows a SFC icon.
Picture 8.23: SFC chart icon

PCS 7 PoT Chapter 8 Sequential Control - SFC
PCS 7 PoT V6.0 | Edition V1.0 |August 2003 Copyright 2003 Siemens AG by A&D AS CS2 PA. All rights reserved.
Page 8 - 20
A double clicking on the icon opens the SFC faceplate as shown in Picture 8.24.
Picture 8.24: SFC chart faceplate A further clicking on the Section button opens the chart view as shown in Picture 8.25.
Picture 8.25: SFC chart faceplate – Section view A double clicking on any Step or Transition opens detailed view of the Step or Transition. Refer to Picture 8.26.

PCS 7 PoT Chapter 8 Sequential Control - SFC
PCS 7 PoT V6.0 | Edition V1.0 |August 2003 Copyright 2003 Siemens AG by A&D AS CS2 PA. All rights reserved.
Page 8 - 21
Picture 8.26: SFC steps in runtime
3. SFC Type In process automation, some sequential controls are almost identical with few variations. For example, level control of a tank could involve a measurement and a control valve. The control logic (sequential procedure) is normally the same while the valve involved could be of various types. For these cases, a SFC type representing the control procedure can be created and instances of the type are then derived to cope with variations. Therefore, compared to a SFC chart, a SFC type is to be used many times as instance charts rather than once. If sequential procedures are distinguishable each other, you could create different SFC charts for them. However, if some sequential procedures have similarities, you could create a SFC type for the similarities while with possibilities for adjustments. One instance of the type will be one usage or adaptation of the type.

PCS 7 PoT Chapter 8 Sequential Control - SFC
PCS 7 PoT V6.0 | Edition V1.0 |August 2003 Copyright 2003 Siemens AG by A&D AS CS2 PA. All rights reserved.
Page 8 - 22
3.1 SFC type handling 3.1 A SFC type and path In the SIMATIC Manager, a new SFC type is inserted in the Component view and belongs to a S7 program. Picture 8.27 shows how to insert a SFC type.
Picture 8.27: Inserting a new SFC type Note that a SFC type and SFC chart are indicated by different icons. A double-click on a SFC type opens the type in the SFC editor. See Picture 8.28 A SFC type could contain up to 32 paths (compared to 8 of a SFC chart) and there are 3 paths (i.e. Starting, heating, and cooling) in the TEST1 type as shown in Picture 8.28.

PCS 7 PoT Chapter 8 Sequential Control - SFC
PCS 7 PoT V6.0 | Edition V1.0 |August 2003 Copyright 2003 Siemens AG by A&D AS CS2 PA. All rights reserved.
Page 8 - 23
Picture 8.28: A SFC type 3.1.2 I/Os of a SFC type You can find I/Os of a SFC type in two ways.
• Place a SFC type onto a CFC chart and the block’s I/Os are the I/Os of the SFC type. See Picture 8.29.
• Toggle into the Chart I/Os in the SFC editor. The type’s I/Os are listed as shown in Picture 8.30.

PCS 7 PoT Chapter 8 Sequential Control - SFC
PCS 7 PoT V6.0 | Edition V1.0 |August 2003 Copyright 2003 Siemens AG by A&D AS CS2 PA. All rights reserved.
Page 8 - 24
Picture 8.29: Using SFC type

PCS 7 PoT Chapter 8 Sequential Control - SFC
PCS 7 PoT V6.0 | Edition V1.0 |August 2003 Copyright 2003 Siemens AG by A&D AS CS2 PA. All rights reserved.
Page 8 - 25
Picture 8.30: Interface of SFC type 3.1.3 Interfacing a SFC type To queue the states of a SFC type (e.g. if the chart is in RUN or STARTING) or to intervene the execution of the type (e.g. to hold or about the SFC), you use the I/Os of the SFC type in the transitions and steps of the chart. Picture 8.31 shows how to form a Transition in SFC types.

PCS 7 PoT Chapter 8 Sequential Control - SFC
PCS 7 PoT V6.0 | Edition V1.0 |August 2003 Copyright 2003 Siemens AG by A&D AS CS2 PA. All rights reserved.
Page 8 - 26
Picture 8.31: Interfacing a SFC type 3.2 Characteristics of a SFC type Variables of a SFC type can be seen in Pictures 8.29 and 8.30, which are the standard I/Os. Apart from the standard I/Os, a SFC type could have additional I/Os and parameters. 3.2.1 Setpoint Assigning values to a SFC type’s variables or adding I/Os and parameters to a SFC type are done in the Characteristics window. See Picture 8.32 where two setpoint variables, SPdose and SPflow are defined for the SFC type. You can also edit the lower or upper limits of a setpoint. Note As a SFC type instance could contain a large amount of I/Os, some parts of the instance are used in the illustrations of the section.

PCS 7 PoT Chapter 8 Sequential Control - SFC
PCS 7 PoT V6.0 | Edition V1.0 |August 2003 Copyright 2003 Siemens AG by A&D AS CS2 PA. All rights reserved.
Page 8 - 27
Picture 8.32: SFC type characteristics A SFC type automatically generates necessary information or parameters according to its characteristics upon adding variables. For example, each setpoint defined in the Characteristics will be added with a high limit and low limit, etc.
Picture 8.33: Adding setpoints

PCS 7 PoT Chapter 8 Sequential Control - SFC
PCS 7 PoT V6.0 | Edition V1.0 |August 2003 Copyright 2003 Siemens AG by A&D AS CS2 PA. All rights reserved.
Page 8 - 28
For the setpoint category, all the variables for a setpoint are listed in Table 8.2.
Setpoint Meaning
SPdose_HL Upper limit of a setpoint
SPdose_LL Lower limit of a setpoint
SPdose Automatic process value, entered from Batch CFC Input
SPdose_AI Actual process value input, entered in CFC
SPdose_CS Enable control strategies
SPdose_ENOP Enable operator input setpoint
SPdose_ENPOP Enable operator input initial setpoint
SPdose_OP Operator input setpoint
Input & Output
SPdose_OPP Operator input initial setpoint
SPdose_AO Actual process value output, from CFC
SPdose_Q Valid setpoint (from Operator or Batch)
SPdose_QP Initial setpoint value Output
SPdose_ERROP Error in operator input setpoint
Table 8.2: Setpoints with SPdose as an example
3.2.2 Control Strategies Control Strategies of a SFC type can be used to determine which path of the type is to be executed. Control strategies are defined by using an integer variable, CS. Values of CS are defined in the Characteristics as shown in Picture 8.34.

PCS 7 PoT Chapter 8 Sequential Control - SFC
PCS 7 PoT V6.0 | Edition V1.0 |August 2003 Copyright 2003 Siemens AG by A&D AS CS2 PA. All rights reserved.
Page 8 - 29
Picture 8.34: Control Strategies There are variables associated with a CS and they are listed in Table 8.3.
Control Strategy Meaning
ENCSP Enable operator input initial control strategy
CS Control strategy input
CS_HL CS higher limit, maximum = 32
CS_LL CS lower limit, minimum = 0
Input
SELCS Status double-word variable, selection of control strategies
Input & Output
CSP_OP Control strategy input by operator
QCS Control strategy output
QCSP Initial control strategy output Output
CSSPACCEPT Control strategy input accept
Table 8.3: Control Strategies
After defining the values of CS, you can use them to queue or intervene the paths of a SFC type. Picture 8.35 shows that the Route 1 path is executed if QCS = 1.

PCS 7 PoT Chapter 8 Sequential Control - SFC
PCS 7 PoT V6.0 | Edition V1.0 |August 2003 Copyright 2003 Siemens AG by A&D AS CS2 PA. All rights reserved.
Page 8 - 30
Picture 8.35: Queuing Control Strategy in a Start condition 3.2.3 Process values Process values handle control of a SFC type based on the process signals, e.g. the value for filling level. They are directly defined as inputs of the SFC type. See Picture 8.36 where a part of the SFC type instance is shown with defined process values, pv1 and pv2. You can enter engineering unit, data type, and initial value for a process value defined.

PCS 7 PoT Chapter 8 Sequential Control - SFC
PCS 7 PoT V6.0 | Edition V1.0 |August 2003 Copyright 2003 Siemens AG by A&D AS CS2 PA. All rights reserved.
Page 8 - 31
Picture 3.36: Process values 3.2.4 Control values Control values handle external logic through a SFC type. They are directly defined as outputs of the SFC type. See Picture 8.37 where a part of the SFC type instance is shown with defined control values, cn1 and cn2.
Picture 8.37: Control values
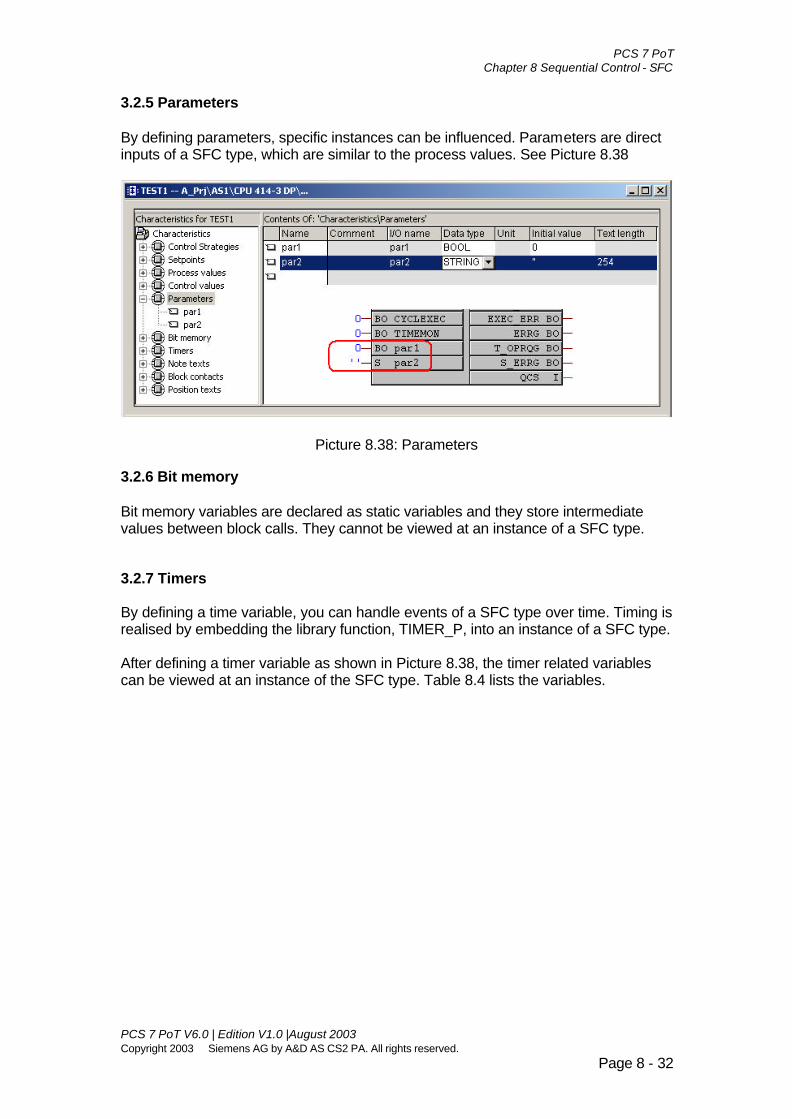
PCS 7 PoT Chapter 8 Sequential Control - SFC
PCS 7 PoT V6.0 | Edition V1.0 |August 2003 Copyright 2003 Siemens AG by A&D AS CS2 PA. All rights reserved.
Page 8 - 32
3.2.5 Parameters By defining parameters, specific instances can be influenced. Parameters are direct inputs of a SFC type, which are similar to the process values. See Picture 8.38
Picture 8.38: Parameters 3.2.6 Bit memory Bit memory variables are declared as static variables and they store intermediate values between block calls. They cannot be viewed at an instance of a SFC type. 3.2.7 Timers By defining a time variable, you can handle events of a SFC type over time. Timing is realised by embedding the library function, TIMER_P, into an instance of a SFC type. After defining a timer variable as shown in Picture 8.38, the timer related variables can be viewed at an instance of the SFC type. Table 8.4 lists the variables.

PCS 7 PoT Chapter 8 Sequential Control - SFC
PCS 7 PoT V6.0 | Edition V1.0 |August 2003 Copyright 2003 Siemens AG by A&D AS CS2 PA. All rights reserved.
Page 8 - 33
Picture 8.38: Timers
Timer Meaning
Input time1_MODE Input pulse mode
time1_TIME0 Time to go, (s)
time1_RESET Reset the timer Input & Output
time1_I0 Input pulse
time1_QRR Error
time1_Q0 Output pulse Output
time1_PTIME Time passed, (s)
Table 8.4: Timer variables
3.2.8 Note texts Note texts are additional texts for display in the SFC block. Each piece of the information is numbered and pre-texted in the Characteristics interface. A piece of note is called to display when its corresponding number is given to the output of a SFC block at, OPTIPNO (meaning Operator Tip Number). Operator can acknowledge the note texts at the faceplate of the SFC type. Compared to the messages configured with a SFC type or other PCS 7 library blocks, note texts are not handled by Alarm_8P or Notify mechanism. Picture 8.39 shows how to define note texts and the numbers assigned are used in the integer variable, OPTIPNO, to trigger the corresponding notes.
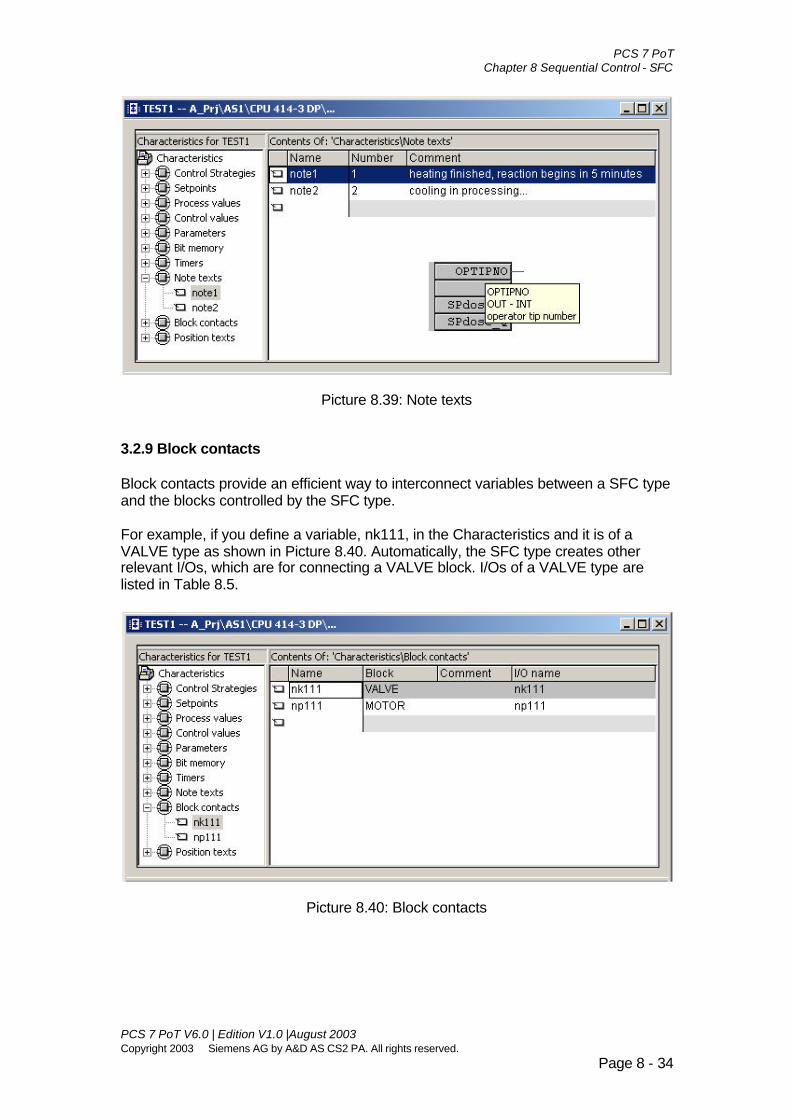
PCS 7 PoT Chapter 8 Sequential Control - SFC
PCS 7 PoT V6.0 | Edition V1.0 |August 2003 Copyright 2003 Siemens AG by A&D AS CS2 PA. All rights reserved.
Page 8 - 34
Picture 8.39: Note texts 3.2.9 Block contacts Block contacts provide an efficient way to interconnect variables between a SFC type and the blocks controlled by the SFC type. For example, if you define a variable, nk111, in the Characteristics and it is of a VALVE type as shown in Picture 8.40. Automatically, the SFC type creates other relevant I/Os, which are for connecting a VALVE block. I/Os of a VALVE type are listed in Table 8.5.
Picture 8.40: Block contacts

PCS 7 PoT Chapter 8 Sequential Control - SFC
PCS 7 PoT V6.0 | Edition V1.0 |August 2003 Copyright 2003 Siemens AG by A&D AS CS2 PA. All rights reserved.
Page 8 - 35
Block contacts Meaning
nk111_QER_ERR Group error of VALVE
nk111_QMAN_AUT Manual or AUTO mode
nk111_QOPENED Valve is OPENED Input
nk111_QCLOSED Valve is CLOSED
nk111_AUTO_OC Command to Open/Close in AUTO mode
nk111_ L_RESET Linkable reset
nk111_LIOP_SEL Linking or operator active? Output
nk111_AUT_L Linkable output for Manual or AUTO mode
Table 8.5: Block contacts of VALVE type
When you interconnect one of the block contacts between a SFC instance and a block instance of the defined block type, all the rest of the other block contacts are automatically interconnected. See Picture 8.41. Picture 8.41 shows the block contacts with the valve type defined in the Characteristics. Other block contacts defined are omitted purposely making illustration simple.

PCS 7 PoT Chapter 8 Sequential Control - SFC
PCS 7 PoT V6.0 | Edition V1.0 |August 2003 Copyright 2003 Siemens AG by A&D AS CS2 PA. All rights reserved.
Page 8 - 36
Picture 8.41: Block contacts of VALVE The blocks listed for the Block contacts are those with the S7_contact attributes in the Blocks folder of the Component view. If a user-created block is to be controlled by a SFC type, the block has to be defined with at least one parameter with the attribute, S7_contact = TRUE. This will be practised in the lab project detailed at the end of the chapter. 3.2.10 Position texts Similar to the Note texts, Position texts generated are displayed by setting variable, OPTIPNO. However, the text of a Position text is from the current step. You configure a Position number for individual steps and the step text will be displayed when the Position number is set at the step in runtime. Various steps can be combined using the same number. 3.3 SFC type faceplate 3.3.1 SFC type icon To work with SFC type faceplates, follow the steps below. Step 1, create a SFC type and use it in a CFC chart.

PCS 7 PoT Chapter 8 Sequential Control - SFC
PCS 7 PoT V6.0 | Edition V1.0 |August 2003 Copyright 2003 Siemens AG by A&D AS CS2 PA. All rights reserved.
Page 8 - 37
Picture 8:42: SFC type and instance Step 2, Copy the standard SFC type icon. You copy the original SFC type icon from the system picture, @@PCS7Typicals.pdl, and paste it into the project file, @PCS7Typicals.pdl.
Picture 8.43: @@PCS7Typicals and @PCS7Typicals Step 3, Adapt a SFC type icon. It is important to make a SFC type icon match a SFC type used in a CFC chart.

PCS 7 PoT Chapter 8 Sequential Control - SFC
PCS 7 PoT V6.0 | Edition V1.0 |August 2003 Copyright 2003 Siemens AG by A&D AS CS2 PA. All rights reserved.
Page 8 - 38
Picture 8.44: Adapting a SFC type icon If you derive block icon based on the plant hierarchy, a SFC type icon will be inserted according to its CFC chart. 3.3.2 SFC type faceplate A click on a SFC type icon on OS in runtime opens a faceplate as shown in Picture 8.45. In the prepared values view, you can change setpoints and control strategies.
Picture 8.45: SFC type faceplate – prepared values view

PCS 7 PoT Chapter 8 Sequential Control - SFC
PCS 7 PoT V6.0 | Edition V1.0 |August 2003 Copyright 2003 Siemens AG by A&D AS CS2 PA. All rights reserved.
Page 8 - 39
In the actual values view, the prepared setpoints and control strategies are executed. See Picture 8.46.
Picture 8.46: SFC type faceplate The section faceplate is called up after clicking the Section button. See Picture 8.46.

PCS 7 PoT Chapter 8 Sequential Control - SFC
PCS 7 PoT V6.0 | Edition V1.0 |August 2003 Copyright 2003 Siemens AG by A&D AS CS2 PA. All rights reserved.
Page 8 - 40
Picture 8.47: Section view of a SFC type chart

PCS 7 PoT Chapter 8 Sequential Control - SFC
PCS 7 PoT V6.0 | Edition V1.0 |August 2003 Copyright 2003 Siemens AG by A&D AS CS2 PA. All rights reserved.
Page 8 - 41
Lab Project RMT1 (Part 2) - Automatic control of the RMT1 unit
1. Task description Continue to work on the RMT1 project started in Chapter 6. Design automatic control procedures using SFC for the RMT1 unit. The automation procedure has been depicted in Picture 6.71. Use two approaches, SFC chart and SFC type to realise the task. Your RMT1 project was operated in a manual manner at the stage when learning Chapter 6. You may need to add a few more functions before sequential controls can be applied. 2. Guideline 2.1 Design NK112, NK113, and NK114 In Chapter 6, NK111 is designed. You can copy NK111 to make NK112, NK113, and NK114 as they have the same function. Default names will be given when copying charts, you should re-name them to NK112, NK113, and NK114 respectively. As block icons will be derived automatically when compiling OS, you should consider whether horizontal or vertical valves would be used on display. For horizontal valves (NK112, NK113, and NK114), see Picture 8.48.
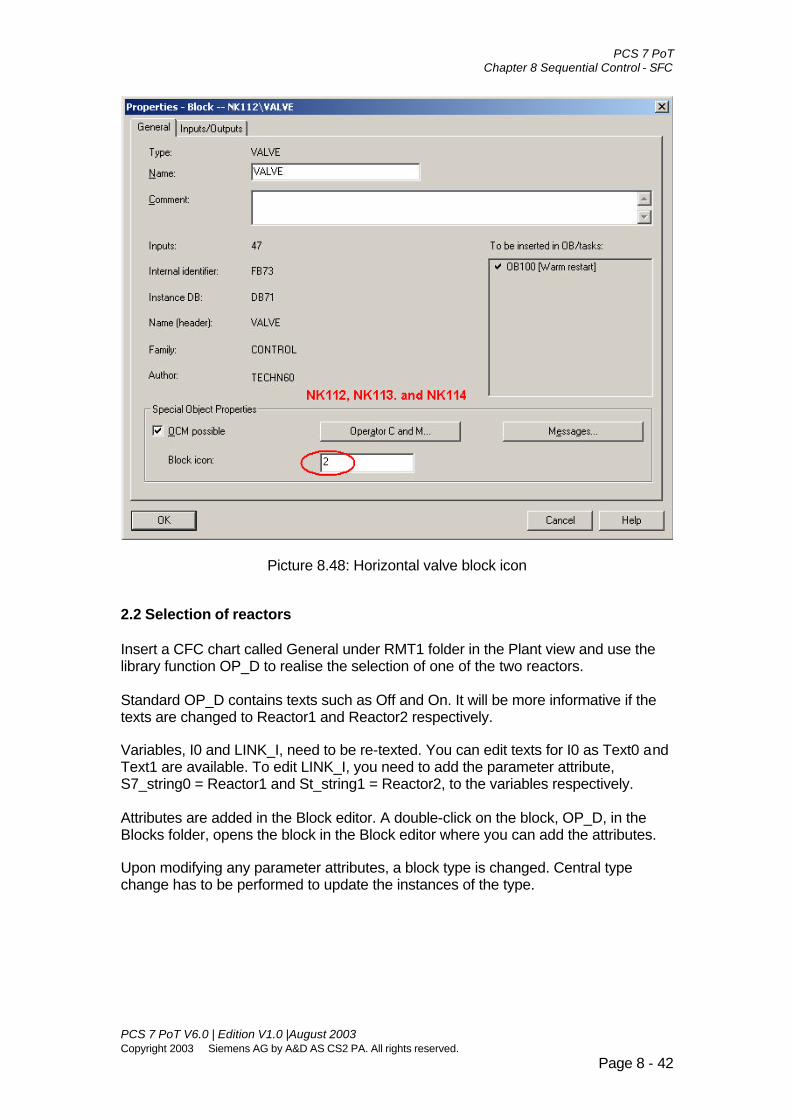
PCS 7 PoT Chapter 8 Sequential Control - SFC
PCS 7 PoT V6.0 | Edition V1.0 |August 2003 Copyright 2003 Siemens AG by A&D AS CS2 PA. All rights reserved.
Page 8 - 42
Picture 8.48: Horizontal valve block icon 2.2 Selection of reactors Insert a CFC chart called General under RMT1 folder in the Plant view and use the library function OP_D to realise the selection of one of the two reactors. Standard OP_D contains texts such as Off and On. It will be more informative if the texts are changed to Reactor1 and Reactor2 respectively. Variables, I0 and LINK_I, need to be re-texted. You can edit texts for I0 as Text0 and Text1 are available. To edit LINK_I, you need to add the parameter attribute, S7_string0 = Reactor1 and St_string1 = Reactor2, to the variables respectively. Attributes are added in the Block editor. A double-click on the block, OP_D, in the Blocks folder, opens the block in the Block editor where you can add the attributes. Upon modifying any parameter attributes, a block type is changed. Central type change has to be performed to update the instances of the type.

PCS 7 PoT Chapter 8 Sequential Control - SFC
PCS 7 PoT V6.0 | Edition V1.0 |August 2003 Copyright 2003 Siemens AG by A&D AS CS2 PA. All rights reserved.
Page 8 - 43
Picture 8.49: Configuring Text0 and Text1 of OP_D 2.3 Using a SFC chart to control the RMT1 unit The operational procedure depicted in Picture 6.71 is the basis for designing a sequential control for the RMT1 unit. There would be more than one solution to the task and an example of such design is illustrated in Picture 8.44 and 8.45. The sequence has two paths. The RUN path handles normal operation and Handling situations when Aborting, Error, and Stopping. (1) The RUN path The Start condition is RUN = True, meaning that the path is executed simply when the chart is started.
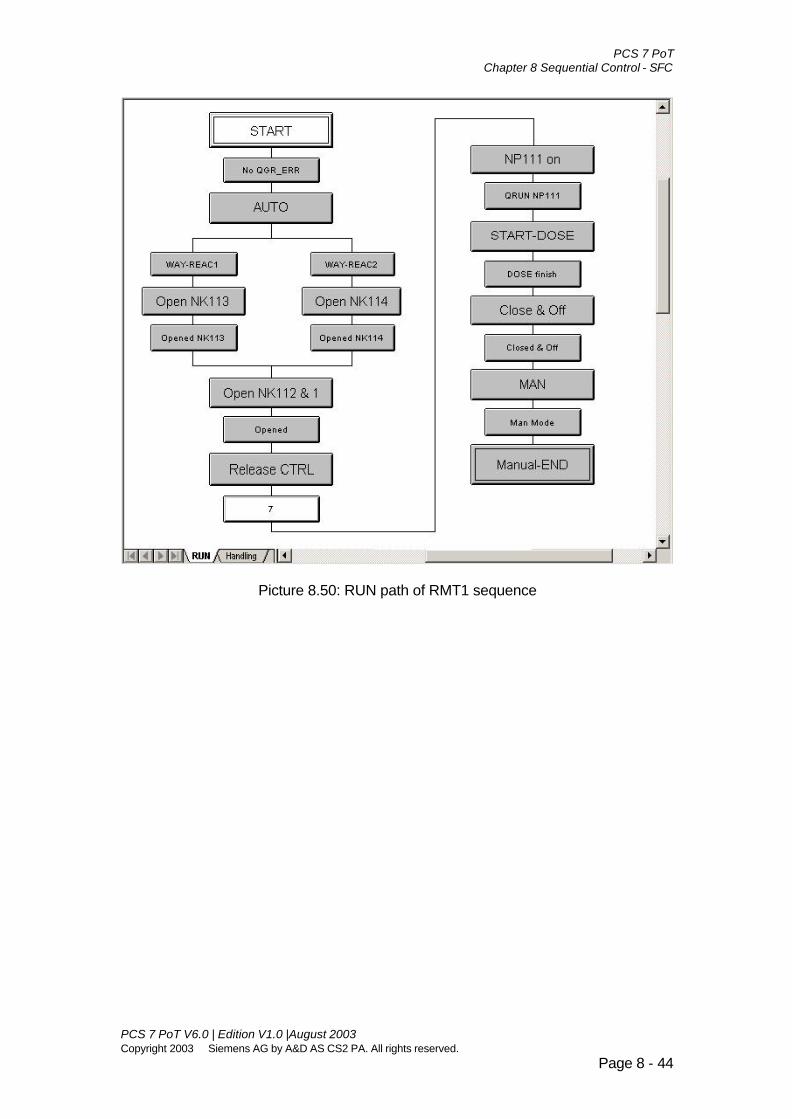
PCS 7 PoT Chapter 8 Sequential Control - SFC
PCS 7 PoT V6.0 | Edition V1.0 |August 2003 Copyright 2003 Siemens AG by A&D AS CS2 PA. All rights reserved.
Page 8 - 44
Picture 8.50: RUN path of RMT1 sequence

PCS 7 PoT Chapter 8 Sequential Control - SFC
PCS 7 PoT V6.0 | Edition V1.0 |August 2003 Copyright 2003 Siemens AG by A&D AS CS2 PA. All rights reserved.
Page 8 - 45
To form the steps and transitions as shown in Picture 8.50, follow the details given in Table 8.6.
Transition or Step Condition or Processing Meaning START None
No GR_ERR
NK111\VALVE.QGR_ERR = FALSE and NK112\VALVE.QGR_ERR = FALSE and NK113\VALVE.QGR_ERR = FALSE and NK114\VALVE.QGR_ERR = FALSE and NP111\MOTOR.QGR_ERR = FALSE
No group error (including monitoring error) in all the 4 valves and the motor.
AUTO For each valve or motor: LIOP_SEL = TRUE AUT_L = TRUE
Put all the 4 valves and the motor into AUTO mode
WAY-REAC1 General\WAY.Q0 = Reactor1 Select Reactor 1
WAY-REAC2 General\WAY.Q0 = Reactor2 Select Reactor 2
Open NK113 AUTO_OC = TRUE Open Valve NK113
Opened NK113 QOPENED = TRUE NK113 opened
Open NK114 AUTO_OC = TRUE Open Valve NK114
Opened NK114 QOPENED = TRUE NK113 opened
Open NK112 & 1 For each valve: AUTO_OC = TRUE
Open NK112 and NK111
Opened For each valve: QOPENED = TRUE
NK112 and 1 opened
FC111\Volume.TRACK = TRUE FC111\ Volume.VTRACK = 0.0 Dosing volume tracks 0.0
LIOP_MAN_SEL = TRUE and AUT_L = TRUE
Controller AUTO mode Release CTRL
LIOP_INT_SEL = TRUE and SPEXON_L = TRUE Select external setpoint
NP111 on NP111\MOTOR.AUTO_ON = TRUE Switch on the motor
QRUN NP111 NP111\MOTOR.QRUN = TRUE The motor is on
START-DOSE FC111\DOSE.LIOP_SEL = TRUE FC111\DOSE.L_START = TRUE FC111\Volume.TRACK = FALSE
Start dosing Do not track zero
DOSE finish FC111\DOSE.QEND_DOS = TRUE Dosing finished
Close & Off
Stop dosing: L-START = FALSE Close valves: AUTO_OC = FALSE Switch off motor: AUTO_ON = FALSE
Closed & Off
Valve closed: QCLOSED = TRUE and Motor off: QSTOP = TRUE
MAN
Valve & Motor: AUT_L = FALSE and DOSE: LIOP_SEL = FALSE
Request for manual mode from program
Man mode Valve & Motor: QMAN_AUT = FALSE Manual mode reached
Manual-END Valve & Motor: LIOP_SEL = FALSE Manual mode
Table 8.6: Design of the RUN path

PCS 7 PoT Chapter 8 Sequential Control - SFC
PCS 7 PoT V6.0 | Edition V1.0 |August 2003 Copyright 2003 Siemens AG by A&D AS CS2 PA. All rights reserved.
Page 8 - 46
(2) The Handling path The handling path has the Stating condition as ABORTING = TRUE, or STOPPING = TRUE, or ERROR = TRUE meaning that the handling path will be executed when Aborting or stopping the chart or there is an error with the chart.
Picture 8.51: Handling path of RMT1

PCS 7 PoT Chapter 8 Sequential Control - SFC
PCS 7 PoT V6.0 | Edition V1.0 |August 2003 Copyright 2003 Siemens AG by A&D AS CS2 PA. All rights reserved.
Page 8 - 47
To form the steps and transitions, follow the details given in Table 8.7. Step or Transition Condition or Processing Meaning
START
VALVE.LIOP_SEL = TRUE and VALVE.AUT_L = TRUE and MOTOR. LIOP_SEL = TRUE and MOTOR. AUT_L = TRUE and DOSE.LIOP_SEL = TRUE
Valve, Motor, and DOSE in AUTO mode
Close & Off
VALVE.AUTO_OC = FALSE MOTOR.AUTO_ON = FALSE DOSE.L_START = FALSE CTRL.LMN_SEL = TRUE
Close valves, switch off motor, and stop dosing and controlling
Closed & Stop VALVE.QCLOSED = TRUE and MOTOR.QSTOP = TRUE
Valves closed and motor stopped
Manual Mode VALVE.AUT_L = FALSE MOTOR.AUT_L = FALSE DOSE.LIOP_SEL = FALSE
Request Manual mode from program
Man mode Valve & Motor: QMAN_AUT = FALSE Manual mode reached
END Valve and Motor: LIOP_SEL = FALSE Manual mode
Table 8.7: Design of the Handling path
After compiling the OS, the chart will be connected with a block icon/faceplate on OS from where you can test the chart using the graphics. 2.4 Using a SFC type to control the RMT1 unit (1) Starting point If you have already have a SFC chart in your RMT1 project to control the unit and want to have an exercise on SFC types, you need to make a copy of the RMT1 unit and try a SFC type on the copied unit. In the Plant view, copy and paste the whole unit, RMT1, and you will have a unit called RMT1(1) by default. It is not necessary to change the default name for the exercise. The rest of the explanation is based on the unit RMT1(1) as illustrated in Picture 8.52 where copied charts and two more newly (in red) inserted charts can be seen. The SFC type is called RMT1 and will be used on the CFC chart, CFC_RMT1.
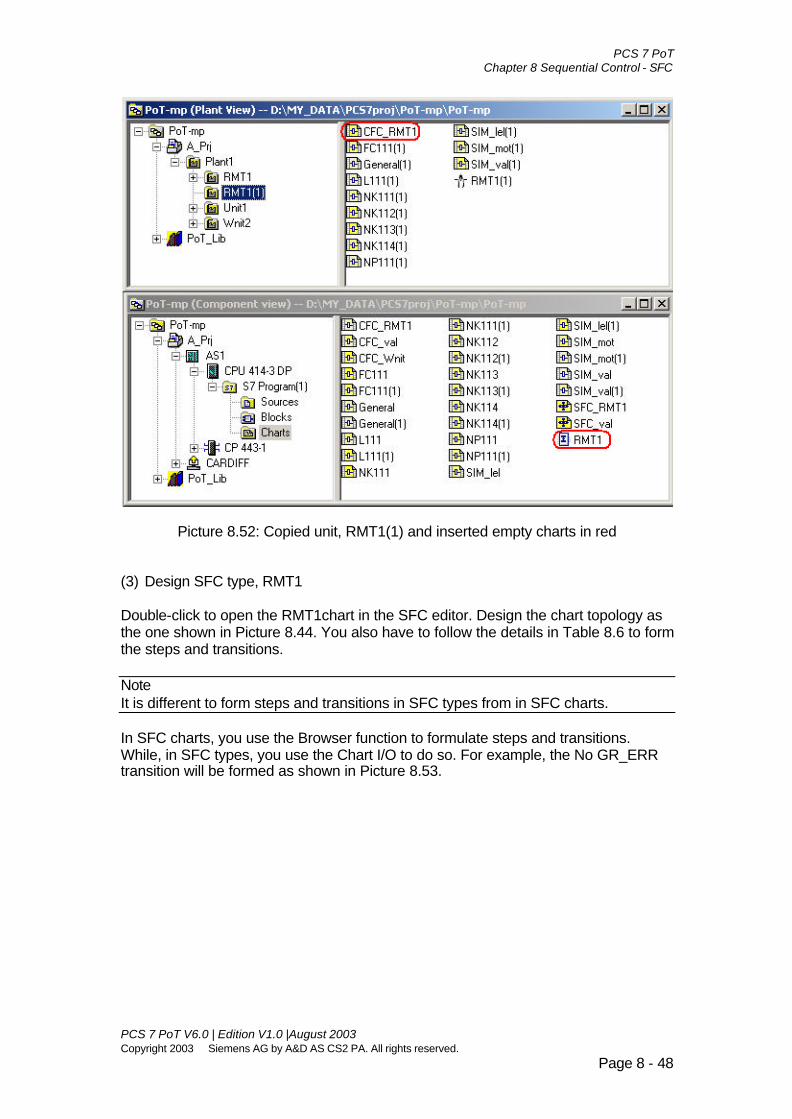
PCS 7 PoT Chapter 8 Sequential Control - SFC
PCS 7 PoT V6.0 | Edition V1.0 |August 2003 Copyright 2003 Siemens AG by A&D AS CS2 PA. All rights reserved.
Page 8 - 48
Picture 8.52: Copied unit, RMT1(1) and inserted empty charts in red (3) Design SFC type, RMT1 Double-click to open the RMT1chart in the SFC editor. Design the chart topology as the one shown in Picture 8.44. You also have to follow the details in Table 8.6 to form the steps and transitions. Note It is different to form steps and transitions in SFC types from in SFC charts. In SFC charts, you use the Browser function to formulate steps and transitions. While, in SFC types, you use the Chart I/O to do so. For example, the No GR_ERR transition will be formed as shown in Picture 8.53.

PCS 7 PoT Chapter 8 Sequential Control - SFC
PCS 7 PoT V6.0 | Edition V1.0 |August 2003 Copyright 2003 Siemens AG by A&D AS CS2 PA. All rights reserved.
Page 8 - 49
Picture 8.53: The No GR_ERR transition of the SFC Similarly, follow the chart topology as shown in Picture 8.52 and details listed in Table 8.7 to finish the Handling path of RMT1 type. (2) Start condition You have more ways to influence execution of a chart in SFC types than in SFC charts. Compared to the chart, SFC_RMT1, the Start condition for the RUN path and Handling path of RMT1 are given in Pictures 8.53 and 8.54.

PCS 7 PoT Chapter 8 Sequential Control - SFC
PCS 7 PoT V6.0 | Edition V1.0 |August 2003 Copyright 2003 Siemens AG by A&D AS CS2 PA. All rights reserved.
Page 8 - 50
Picture 8.54: Start condition of the RUN path in the RMT1 type To test Control strategies, the Handling path can be executed by manually setting the value, QCS = 2 at the faceplate. The start conditions are hence set as shown in Picture 8.55.
Picture 8.55: Start condition of the Handling path in the RMT1 type

PCS 7 PoT Chapter 8 Sequential Control - SFC
PCS 7 PoT V6.0 | Edition V1.0 |August 2003 Copyright 2003 Siemens AG by A&D AS CS2 PA. All rights reserved.
Page 8 - 51
(3) Characteristics of the RMT1 type For the RMT1 type, the characteristics are defined as shown in Picture 8.56.
Picture 8.56: Characteristics of the RMT1 type Blocks with the attribute, S7_contact = TRUE, are available in the Characteristics editor. Blocks without the attribute will not displayed in the editor. You can make a block appear in the Characteristics editor by defining any I/Os (the ones used by the RMT1 type) of the block with S7_contact = TRUE. To add an attribute, refer to how you did so for the OP_D block with the Text0 and Text1 Section 2.2 of the guideline.
(4) Use of the RMT1 type
Double-click CFC_RMT1 to open the chart in the CFC editor. Locate where the RMT1 type is (under Other blocks) and place it onto the chart. Rename the instance as CFC-RMT1. Interconnect the instance, CFC-RMT1, with NK111(1)\VALVE, NK112(1)\VALVE, NK113(1)\VALVE, NK114(1)\VALVE, NP111(1)\MOTOR, General(1)WAY, FC111(1)\CTRL, FC111(1)\DOSE, and, FC111(1)\Volume.
(5) Make a SFC type icon for the RMT1 type
In the file, @PCS7Typicals.pdl, create a SFC type icon for the RMT1 type by following the instruction given in Section 3.3.1 of the chapter.

PCS 7 PoT Chapter 8 Sequential Control - SFC
PCS 7 PoT V6.0 | Edition V1.0 |August 2003 Copyright 2003 Siemens AG by A&D AS CS2 PA. All rights reserved.
Page 8 - 52
(6) Test the RMT1 type
Compile the OS and you will find the SFC type icon is automatically inserted in the picture, RMT1(1).pdl, which is shown in Picture 8.57.
Picture 8.57: OS of the RMT1 unit

Chapter 9:
Process Tag Type, Model, and Master Data Library


Contents: CHAPTER 9 PROCESS TAG TYPE, MODEL, AND MASTER DATA LIBRARY......................... 1
1. INTRODUCTION ............................................................................................................................................. 1
2. A TAG TYPE OR MODEL ............................................................................................................................ 1
3. TAG TYPE AND TAGS .................................................................................................................................. 2
3.1 THE MOTOR TYPE CHART ...............................................................................................................................2 3.2 CREATING TAG TYPE......................................................................................................................................3 3.3 A SSIGNING TAG TYPE DATA FILE..................................................................................................................7 3.4 TAG DATA FILES IN THE IEA EDITOR...........................................................................................................9 3.5 A SSIGNING IMPORT FILE..............................................................................................................................12 3.6 IMPORTING TAGS ..........................................................................................................................................13 3.7 EXPORTING TAGS..........................................................................................................................................15
4. MODEL AND REPLICAS ............................................................................................................................15
4.1 CREATING MODEL.........................................................................................................................................15 4.2 REPLICAS .......................................................................................................................................................18
5. THE MASTER DATA LIBRARY..............................................................................................................19
5.1 HANDLING OF PCS 7 LIBRARIES ................................................................................................................19 5.2 BLOCKS OF PROJECTS...................................................................................................................................19 5.3 OTHER LIBRARIES.........................................................................................................................................19 5.4 HANDLING OF LIBRARIES.............................................................................................................................19
6. PROCESS OBJECT VIEW ..........................................................................................................................20
6.1 GENERAL TAB OF THE PROCESS OBJECT VIEW..........................................................................................21 6.2 PARAMETERS TAB.........................................................................................................................................21 6.3 SIGNALS TAB.................................................................................................................................................22 6.4 MESSAGE TAB ...............................................................................................................................................24 6.5 PICTURE OBJECTS TAB .................................................................................................................................25 6.6 MEASURED VALUE ARCHIVES.....................................................................................................................25 6.7 HANDLING IN THE PROCESS OBJECT VIEW................................................................................................26
6.71 Split window view................................................................................................................................26 6.7.2 Filters....................................................................................................................................................27 6.7.3 Find/Replace........................................................................................................................................27 6.7.4 Defining columns................................................................................................................................28 6.7.5 Undo......................................................................................................................................................29
EXERCISE.............................................................................................................................................................31
EXERCISE 9.1 A VALVE CONTROL TAG TYPE ..................................................................................................31 1. The task ......................................................................................................................................................31 2. Guideline....................................................................................................................................................31


PCS 7 PoT Chapter 9 Process Tag Type, Model, and Master Data Library
PCS 7 PoT V6.0 | Edition V1.0 | August 2003 Copyright 2003 Siemens AG by A&D AS CS2 PA. All rights reserved.
Page 9 - 1
Chapter 9 Process Tag Type, Model, and Master Data Library
1. Introduction If you use a particular type of motor control in your application and it is regularly used in the processes with variants, you could make a type or model for the motor controls and use it with variants efficiently in applications. A type or model is like a prototype with which you can easily create copies with variants. In practice, it is often the case that the motor controls are identical but are interlocked differently. For example, a motor must not be started when a temperature is too high or when the power supply is too low. To realise such interlocks, the PCS 7 motor block has several inputs available (LOCK, LOCK_ON, MSS etc. Refer to the MOTOR block, FB66.). You could interconnect the various interlock connections to these inputs using the INTERLOK block (Refer to the INTERLOK block, FB75). The inputs of the interlock block are in groups. For example, the first five inputs form a group whose inputs can be logically “ANDed” or “ORed” depending on the conditions. The inputs can also be used directly or after being inverted. The result of a group can also be inverted depending on the conditions. Using the interlock block, you can create a motor control type/model with flexible interlocks. The flexibility lies in that the inputs of the interlock block and their logic can be decided as a particular case arises. The selected inputs and the logic are defined as parameters (not fixed) and the parameters can be fixed when the variant of the model is known.
2. A tag type or model A process tag is a central object for the planning, engineering, commissioning, documenting, operating and maintaining of a process control system. In PCS 7, a tag is designed in a CFC chart and is represented by the chart. A control model is a branch of process hierarchical folders, which contains CFCs and SFCs. A type and model differ in name and in scale but are the same in the sense that they are made to be able to produce variants easily.
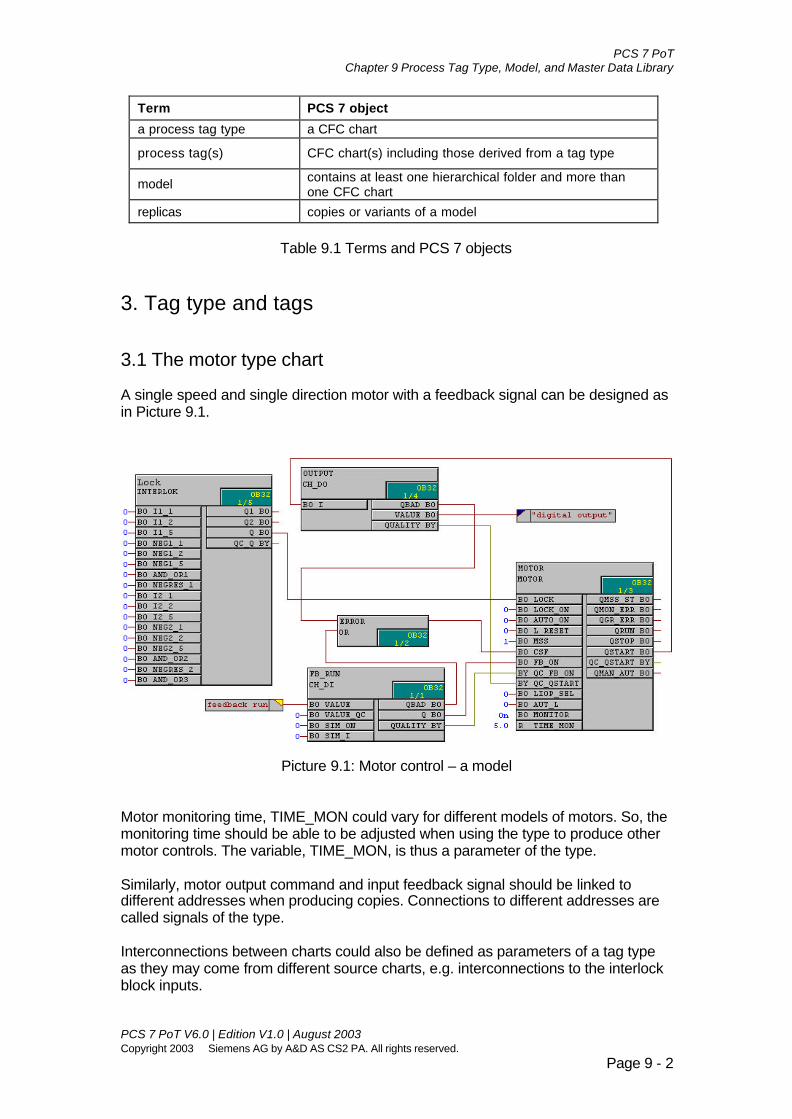
PCS 7 PoT Chapter 9 Process Tag Type, Model, and Master Data Library
PCS 7 PoT V6.0 | Edition V1.0 | August 2003 Copyright 2003 Siemens AG by A&D AS CS2 PA. All rights reserved.
Page 9 - 2
Term PCS 7 object
a process tag type a CFC chart
process tag(s) CFC chart(s) including those derived from a tag type
model contains at least one hierarchical folder and more than one CFC chart
replicas copies or variants of a model
Table 9.1 Terms and PCS 7 objects
3. Tag type and tags 3.1 The motor type chart A single speed and single direction motor with a feedback signal can be designed as in Picture 9.1.
Picture 9.1: Motor control – a model Motor monitoring time, TIME_MON could vary for different models of motors. So, the monitoring time should be able to be adjusted when using the type to produce other motor controls. The variable, TIME_MON, is thus a parameter of the type. Similarly, motor output command and input feedback signal should be linked to different addresses when producing copies. Connections to different addresses are called signals of the type. Interconnections between charts could also be defined as parameters of a tag type as they may come from different source charts, e.g. interconnections to the interlock block inputs.

PCS 7 PoT Chapter 9 Process Tag Type, Model, and Master Data Library
PCS 7 PoT V6.0 | Edition V1.0 | August 2003 Copyright 2003 Siemens AG by A&D AS CS2 PA. All rights reserved.
Page 9 - 3
Important term (in Type or Model) Meaning
Parameter (1) a value to be adjusted (2) an interconnection between charts
Signal To be interconnected with I/O addresses defined in the Symbols table
Table 9.2 Parameter and Signal
3.2 Creating tag type Note A tag type will be used to produce a large number of copies and has to be tested thoroughly to ensure no errors and no bugs. Select the chart that you want to make a type. See Picture 9.2.
Picture 9.2: Creating process tag type You can select the chart either in the Plant view or the Component view and the context-menu will pop up. After running the Create/Change Process Tag Type function, the Mot1 type will be created in the Process tag types folder under the master data library. The system automatically suggests that types (and models as well) should be kept in the master data library. The first page of the Create/change Process Tag Type wizard has useful information on the functionality. Refer to picture 9.3. Note The screenshot in Picture 9.2 shows creating a process tag type from the Plant hierarchy. However, in a real project, process tag types are created from the Process

PCS 7 PoT Chapter 9 Process Tag Type, Model, and Master Data Library
PCS 7 PoT V6.0 | Edition V1.0 | August 2003 Copyright 2003 Siemens AG by A&D AS CS2 PA. All rights reserved.
Page 9 - 4
tag type folder in the master data library where your motor type is located. The advantage of creating a process tag type from the master data library is that a type is in the master data library and not in the plant hierarchy. Process tags generated from a tag type are in the plant hierarchy. If you create a process tag type from the plant hierarchy, you will have the type and the tags (copies of the type) together in the plant hierarchy. Process tag types and tags are different objects and indicated in different icons in the SIMATIC Manager. It may cause confusion if they are all present in the plant hierarchy.
Picture 9.3: Process tag type wizard Proceeding with the wizard, you have to assign parameters and/or signals (I/Os) to the type. Refer to Picture 9.4. The type name will inherit the chart name if you do not change the name. Blocks of the chart are listed in the left part along with their variables.
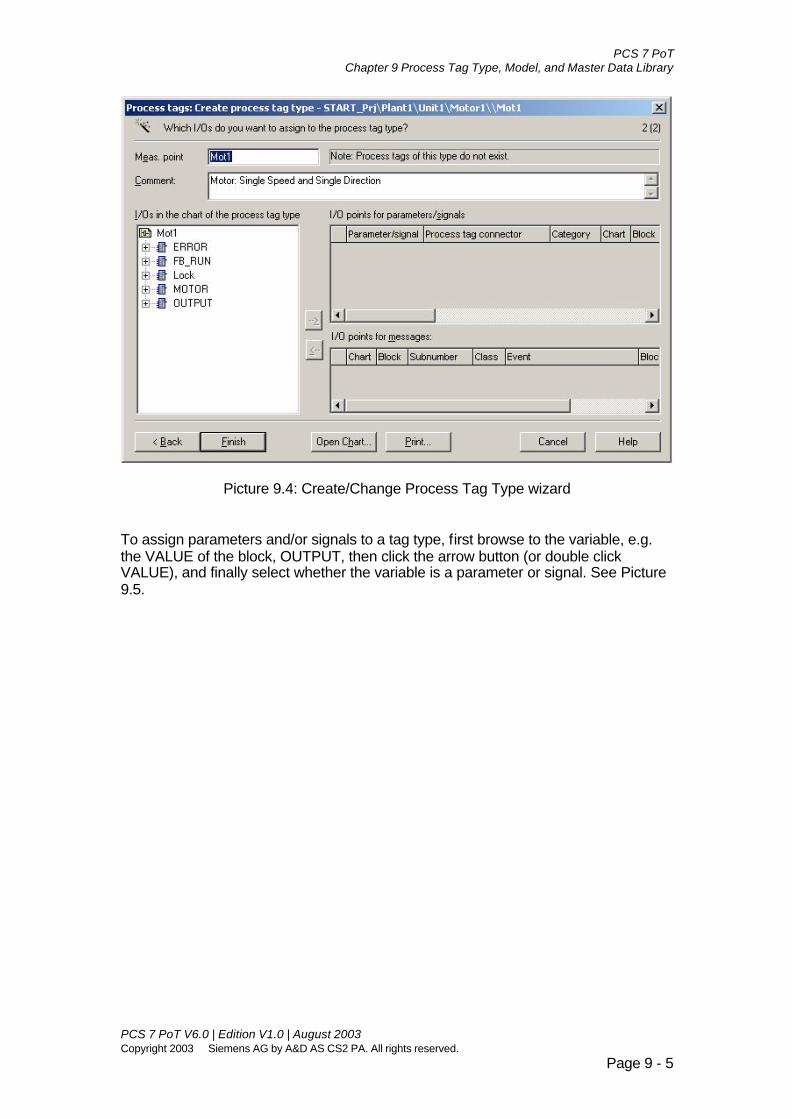
PCS 7 PoT Chapter 9 Process Tag Type, Model, and Master Data Library
PCS 7 PoT V6.0 | Edition V1.0 | August 2003 Copyright 2003 Siemens AG by A&D AS CS2 PA. All rights reserved.
Page 9 - 5
Picture 9.4: Create/Change Process Tag Type wizard To assign parameters and/or signals to a tag type, first browse to the variable, e.g. the VALUE of the block, OUTPUT, then click the arrow button (or double click VALUE), and finally select whether the variable is a parameter or signal. See Picture 9.5.

PCS 7 PoT Chapter 9 Process Tag Type, Model, and Master Data Library
PCS 7 PoT V6.0 | Edition V1.0 | August 2003 Copyright 2003 Siemens AG by A&D AS CS2 PA. All rights reserved.
Page 9 - 6
Picture 9.5: Assigning parameter or signal to tag type

PCS 7 PoT Chapter 9 Process Tag Type, Model, and Master Data Library
PCS 7 PoT V6.0 | Edition V1.0 | August 2003 Copyright 2003 Siemens AG by A&D AS CS2 PA. All rights reserved.
Page 9 - 7
Picture 9.6 shows all parameters/signals assigned to the motor type.
Picture 9.6: Motor type parameter and signals
After running the Create/Change Process Tag Type wizard for the motor chart, Mot1, a motor type is created as shown in Picture 9.7.
Picture 9.7: A newly created motor type 3.3 Assigning tag type data file Tag types are assigned (or associated) with a data file, called Import File. The import files are textual files and can be handled in many text editors (though Excel is recommended), which is a primary advantage of creating tag types. In the context-menu as shown in Picture 9.2, call the “Assign/Create Import File” wizard up. The introduction page of the wizard is shown in Picture 9.8.

PCS 7 PoT Chapter 9 Process Tag Type, Model, and Master Data Library
PCS 7 PoT V6.0 | Edition V1.0 | August 2003 Copyright 2003 Siemens AG by A&D AS CS2 PA. All rights reserved.
Page 9 - 8
Picture 9.8: Assign/Create Import File wizard
Picture 9.9: Assigning/Crating Import File After clicking “Create File Template” button, you are provided with the options (See Picture 9.10) to select which data will display in the Import File. Of course, you can add or remove display later when editing the file.
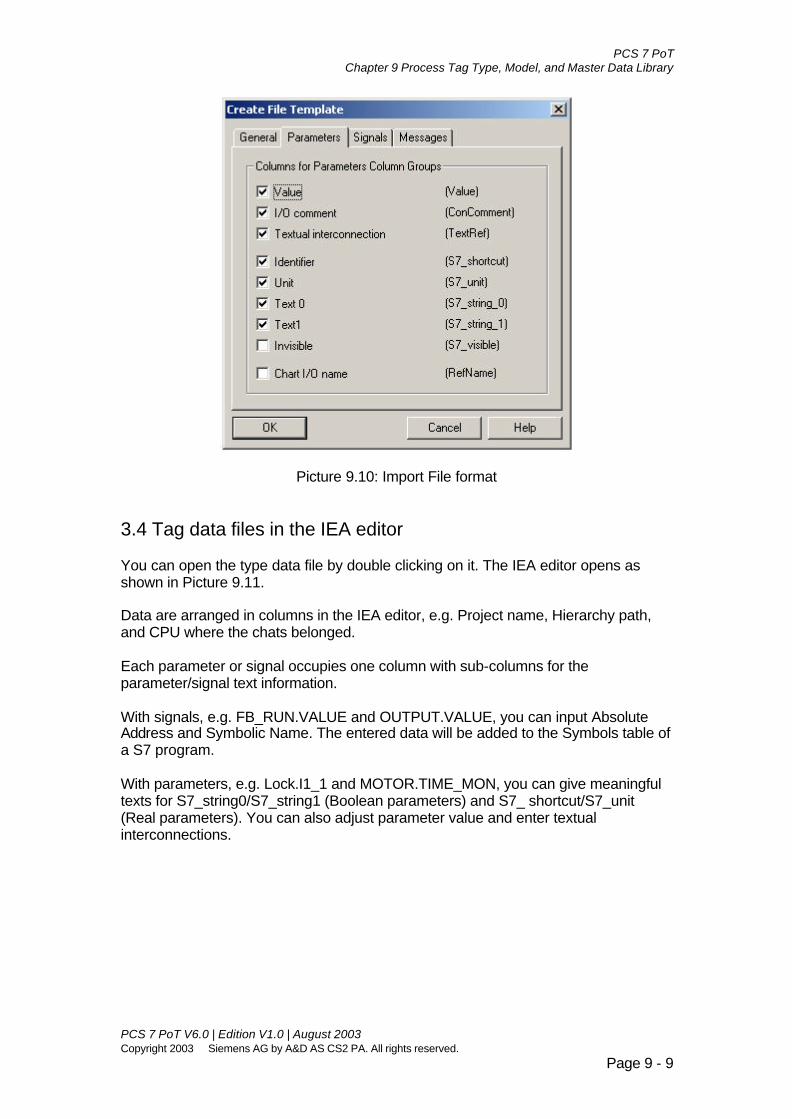
PCS 7 PoT Chapter 9 Process Tag Type, Model, and Master Data Library
PCS 7 PoT V6.0 | Edition V1.0 | August 2003 Copyright 2003 Siemens AG by A&D AS CS2 PA. All rights reserved.
Page 9 - 9
Picture 9.10: Import File format
3.4 Tag data files in the IEA editor You can open the type data file by double clicking on it. The IEA editor opens as shown in Picture 9.11. Data are arranged in columns in the IEA editor, e.g. Project name, Hierarchy path, and CPU where the chats belonged. Each parameter or signal occupies one column with sub-columns for the parameter/signal text information. With signals, e.g. FB_RUN.VALUE and OUTPUT.VALUE, you can input Absolute Address and Symbolic Name. The entered data will be added to the Symbols table of a S7 program. With parameters, e.g. Lock.I1_1 and MOTOR.TIME_MON, you can give meaningful texts for S7_string0/S7_string1 (Boolean parameters) and S7_ shortcut/S7_unit (Real parameters). You can also adjust parameter value and enter textual interconnections.

PCS 7 PoT Chapter 9 Process Tag Type, Model, and Master Data Library
PCS 7 PoT V6.0 | Edition V1.0 | August 2003 Copyright 2003 Siemens AG by A&D AS CS2 PA. All rights reserved.
Page 9 - 10
Picture 9.11: The IEA editor Before you make any changes to a Tag Type data file, make a copy of the original type file by saving it as another name. The save file becomes the Import file where changes are made and data are created for a project rather than library. Each row in an IEA file is corresponding to a chart. To produce copies (tags) of a type, you could firstly to duplicate the type row in the IEA. Each duplicated row will be a copy of the type when you import an IEA file. Picture 9.12 shows a data file that will be used to produce 3 motor tags of the motor type.

PCS 7 PoT Chapter 9 Process Tag Type, Model, and Master Data Library
PCS 7 PoT V6.0 | Edition V1.0 | August 2003 Copyright 2003 Siemens AG by A&D AS CS2 PA. All rights reserved.
Page 9 - 11
Picture 9.12: Import file As shown in Picture 9.12, the 3 copies will be created under the plant hierarchy of Plant1\Unit1\Motor1. The tags’ names are Mot2, Mot3, and Mot4. Motor feedback signals are connected to the shared addresses at I0.2, I0.3, and I0.4 which have the symbolic names of MOT_FB_2, MOT_ FB _3, and MOT_ FB _4, respectively. The motors’ command signals are at Q0.2, Q0.3, and Q0.4 and their symbolic names are MOT_COM2, MOT_COM3, and MOT_COM4. Monitoring time of motor is also entered for each motor. Textual interconnection at the first signal of the interlock block is given the hint of LOCK MOT. If the text exists in project, the interconnection will be built when the motors are imported. If the text does not exist, the interconnection is virtual waiting to be connected. With Import files, you actually plan and design your project in a text editor, the IEA, by modifying a type file.

PCS 7 PoT Chapter 9 Process Tag Type, Model, and Master Data Library
PCS 7 PoT V6.0 | Edition V1.0 | August 2003 Copyright 2003 Siemens AG by A&D AS CS2 PA. All rights reserved.
Page 9 - 12
3.5 Assigning Import file After preparing the Import file, you can import the tag type to produce tags. See Picture 9.13.
Picture 9.13: Importing tags You have to select which Import file will be used to produce the tags. To browse to the file, click the “Other File” button as shown in Picture 9.14.

PCS 7 PoT Chapter 9 Process Tag Type, Model, and Master Data Library
PCS 7 PoT V6.0 | Edition V1.0 | August 2003 Copyright 2003 Siemens AG by A&D AS CS2 PA. All rights reserved.
Page 9 - 13
Picture 9.14: Which Import file 3.6 Importing tags After preparing an Import file and assigning it to a type, you can import the file. See Picture 9.15.
Picture 9.15: Importing tags Importing finishes as existing from the last page of the Importing wizard. The imported tags are now in the project. See Picture 9.16.

PCS 7 PoT Chapter 9 Process Tag Type, Model, and Master Data Library
PCS 7 PoT V6.0 | Edition V1.0 | August 2003 Copyright 2003 Siemens AG by A&D AS CS2 PA. All rights reserved.
Page 9 - 14
Picture 9.16: Generated charts after the Import You could open one of the tags to review if the chart is designed as it is in the import file.
Picture 9.17: Process tag type and tags
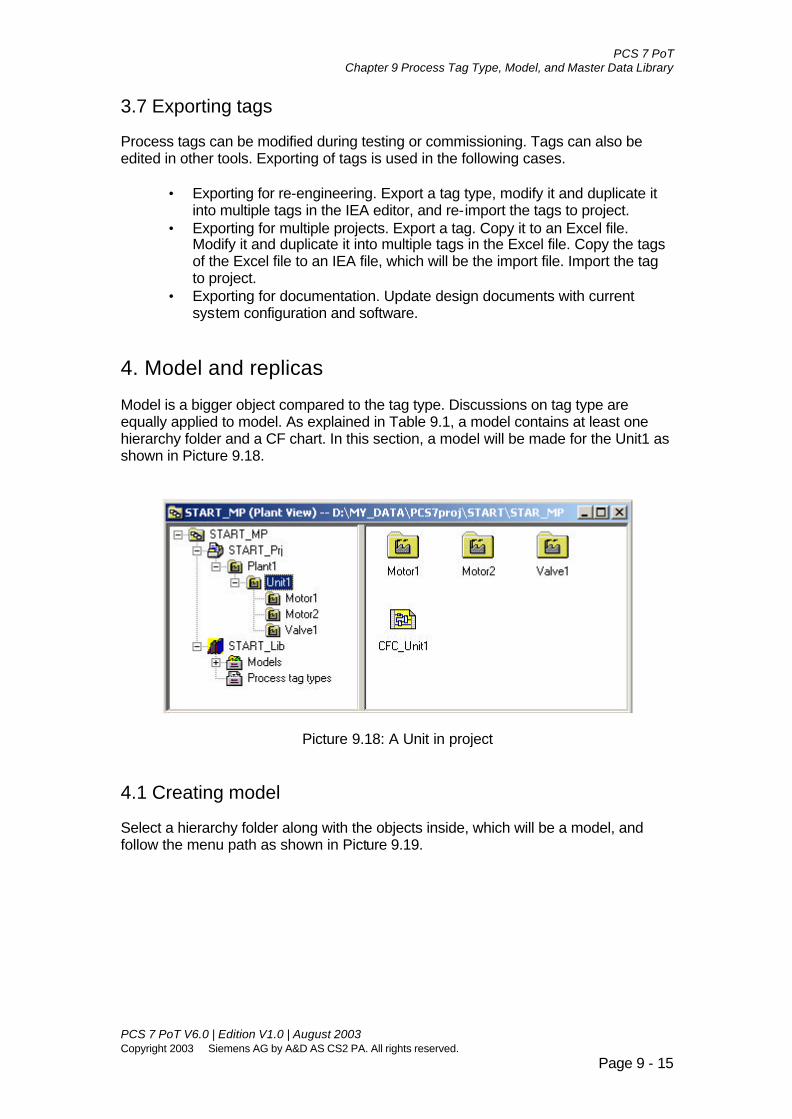
PCS 7 PoT Chapter 9 Process Tag Type, Model, and Master Data Library
PCS 7 PoT V6.0 | Edition V1.0 | August 2003 Copyright 2003 Siemens AG by A&D AS CS2 PA. All rights reserved.
Page 9 - 15
3.7 Exporting tags Process tags can be modified during testing or commissioning. Tags can also be edited in other tools. Exporting of tags is used in the following cases.
• Exporting for re-engineering. Export a tag type, modify it and duplicate it into multiple tags in the IEA editor, and re-import the tags to project.
• Exporting for multiple projects. Export a tag. Copy it to an Excel file. Modify it and duplicate it into multiple tags in the Excel file. Copy the tags of the Excel file to an IEA file, which will be the import file. Import the tag to project.
• Exporting for documentation. Update design documents with current system configuration and software.
4. Model and replicas Model is a bigger object compared to the tag type. Discussions on tag type are equally applied to model. As explained in Table 9.1, a model contains at least one hierarchy folder and a CF chart. In this section, a model will be made for the Unit1 as shown in Picture 9.18.
Picture 9.18: A Unit in project 4.1 Creating model Select a hierarchy folder along with the objects inside, which will be a model, and follow the menu path as shown in Picture 9.19.

PCS 7 PoT Chapter 9 Process Tag Type, Model, and Master Data Library
PCS 7 PoT V6.0 | Edition V1.0 | August 2003 Copyright 2003 Siemens AG by A&D AS CS2 PA. All rights reserved.
Page 9 - 16
Picture 9.19: Creating model Models are stored under the Models folder in the project master data library. If the hierarchy folder selected to be a model is not in the library, it will be firstly copied to the library and created from there. Refer to Picture 9.120.
Picture 9.20: Message for copying hierarchy folder to master data library Note The screenshot in Picture 9.19 shows creating a model from the Plant hierarchy. However, in a real project, models are created from the Process tag type folder in the master data library where your motor type is located. The advantage of creating a model from the master data library is that a model is in the master data library and not in the plant hierarchy. Replicas generated from a model are in the plant hierarchy. If you create a model from the plant hierarchy, you will have the model and the replicas together in the plant hierarchy. Models and replicas are different objects and indicated in different icons in the SIMATIC Manager. It may cause confusion if they are all present in the plant hierarchy.

PCS 7 PoT Chapter 9 Process Tag Type, Model, and Master Data Library
PCS 7 PoT V6.0 | Edition V1.0 | August 2003 Copyright 2003 Siemens AG by A&D AS CS2 PA. All rights reserved.
Page 9 - 17
Following the Creating/Modifying Model wizard, you have to define the parameters or signals for the model. The same parameters and signals defined for the motor tag type are defined for the model here. Refer to Picture 9.21.
Picture 9.21: Defining parameters and signals for model If you want to make message texts instance specific, you can define message event texts as model messages. See Picture 9.22.
Picture 9.22: Model messages As in tag type, you need to create a data file to associate with model. See Picture 9.23.

PCS 7 PoT Chapter 9 Process Tag Type, Model, and Master Data Library
PCS 7 PoT V6.0 | Edition V1.0 | August 2003 Copyright 2003 Siemens AG by A&D AS CS2 PA. All rights reserved.
Page 9 - 18
Picture 9.23: Creating model file 4.2 Replicas After having a model file, Import file is then created by modifying the line if necessary in the model file. Replicas are duplicated of the model line in the Import file with each row being one replica of the model. By importing from the Import file, replicas are imported into project. Note A model has a plant hierarchy with possible lower plant hierarchies and normally more than one chart. Every replica is a copy of the model with the model top plant hierarchy renamed. Models or tag types are normally created in the master data library. Replicas or tags are generated from the master data library to a project Note PCS 7 Library V6 contains tag types in charts called “Templates”. You can copy them into the master data library, the Charts folder. Then, you can make them tag types of the project. Copies of the type can be efficiently produced by the importing tag type function.

PCS 7 PoT Chapter 9 Process Tag Type, Model, and Master Data Library
PCS 7 PoT V6.0 | Edition V1.0 | August 2003 Copyright 2003 Siemens AG by A&D AS CS2 PA. All rights reserved.
Page 9 - 19
5. The master data library Tag types and models of a project are stored in the master data library. It is a good practice to use the project master data library to store all block types and charts in the library. It is important that the following aspects are noted during engineering. 5.1 Handling of PCS 7 libraries Before you start a project in which you want to use PCS 7 blocks, you should consider copying the library blocks into your project library. This would protect the blocks used in your projects from being overwritten by the PCS 7 system installation or upgrade.
• Copy the PCS 7 library functions using operating system resources to another location.
• Change the system attributes of the blocks, e.g. S7_visible, S7_string_0, and S7_unit, etc., according to your requirements.
After adapting the blocks of the standard libraries, you should use them in your projects rather than drag-and-drop from the standard libraries. You could also copy the standard library blocks into project master data library so that all resources of blocks and charts are located centrally in the master data library. 5.2 Blocks of projects Blocks developed for a project should be stored in the master data library and used in the library. 5.3 Other libraries Blocks developed in other projects or collected in other libraries should also be copied into the master data library. All three sources of blocks (PCS 7 libraries, blocks/charts of a current project, and blocks/charts of other collections) should have unique numbers and symbolic names. Overlapped numbers or names should be re-numbered or re-named before they are copied into master data library. 5.4 Handling of libraries You can hide the libraries from the CFC library category. See Picture 9.24. If a library is hidden from the CFC editor, you can avoid wrongly dragging a block from it and dropping it onto a CFC chart, which may cause to overwrite a block with same number and symbolic name. The menu path to call up the Manager dialog is File > Manage in the SIMATIC Manager.

PCS 7 PoT Chapter 9 Process Tag Type, Model, and Master Data Library
PCS 7 PoT V6.0 | Edition V1.0 | August 2003 Copyright 2003 Siemens AG by A&D AS CS2 PA. All rights reserved.
Page 9 - 20
Picture 9.24: Hiding the libraries To display a library in the CFC editor, open the library once in the SIMATIC Manager. 6. Process object view With the concept of the process tag type and model, you can deal with project data in textual files, which is efficient and in a way edits data in a large number and in a central place. With the Process object view, you can also handle project data in a central place. The process object view has a structure which is similar to the plant view and the same objects are displayed as in the plant view (hierarchy folders, models, replicas, process tag types, tags, CFC, SFC). The left-hand section of the window displays the plant hierarchy (tree structure). The right-hand section displays a table of the subordinate objects with their attributes. The table displays the attributes of the objects, structured in accordance with different aspects. All the objects which are required for the automation and for operator control and monitoring of a plant are displayed in the process object view. These include:
• CFC/SFC charts • Tags (specific form of CFC charts) • Pictures • Additional documents (Word, Excel) • Reports • Block I/Os for parameters and interconnections • Messages • Block icons • Archive variables

PCS 7 PoT Chapter 9 Process Tag Type, Model, and Master Data Library
PCS 7 PoT V6.0 | Edition V1.0 | August 2003 Copyright 2003 Siemens AG by A&D AS CS2 PA. All rights reserved.
Page 9 - 21
The process object view has the advantage that all the modifiable attributes of an object (white background) can be edited centrally in the view. When the process tags and CFCs are edited, all the aspects (automation, I/O connection, message, operator control and monitoring) are displayed and documented consistently. Jumps to CFC, SFC, HW Config, OS also allow aspects which cannot be edited in the table to be edited as well (for example, model parameter definition, display contents, etc.). 6.1 General tab of the process object view This tab includes the name and comment of the object as well as plant identifier and local identifiers for some objects for documentation purposes, assignment to a CPU or OS, author, creation date, etc. See Picture 9.25. The selected objects can be opened by means of the pop-up menu.
Picture 9.25: Process object view – General tab 6.2 Parameters tab Parameters defined as the parameters of the Process object view are listed in the tab. If you want to a specific variable of a CFC block to be displayed in the process object view, you have to go to the CFC chart and define the parameter in the Properties dialog of Inputs/Outputs. Refer to Picture 9.26. On the block, attribute, S7_edit = para makes a variable displayed in the process object view. This parameter is the one used in the context of model or tag type in the IEA editor. If you select parameters at the block which is located in the master data library, any instance of the block will bear the selection and you will not need to specify parameters one instance by instance.

PCS 7 PoT Chapter 9 Process Tag Type, Model, and Master Data Library
PCS 7 PoT V6.0 | Edition V1.0 | August 2003 Copyright 2003 Siemens AG by A&D AS CS2 PA. All rights reserved.
Page 9 - 22
Picture 9.26: Process object view parameter/signal definition 6.3 Signals tab The tab displays the variables classified as signals, which are connected to shared addresses in the Symbols table. In the CFC, a variable can be declared as a signal as shown in Picture 9.26 and on a block type is the attribute, S7_edit = signal, makes a variable a signal. Similar to parameter, the signal is in the context of model and tag type. You should define signals at a block type in the master data library. Instances of the block will inherit the signals.
Picture 9.27: Process object view – Signal tab To make variables parameters or signals, you can use the system function “Select I/Os”. The menu path to call up the function is: (in SIMATIC Manager) Options > Process Objects > Select I/Os. See Picture 9.27.

PCS 7 PoT Chapter 9 Process Tag Type, Model, and Master Data Library
PCS 7 PoT V6.0 | Edition V1.0 | August 2003 Copyright 2003 Siemens AG by A&D AS CS2 PA. All rights reserved.
Page 9 - 23
Picture 9.27: Process Objects You can connect a signal to an address using the Insert Signal function. The function is called up in the context menu of a signal. When the dialog opened, double click on an address make the connection between the signal and address. You can also perform drag-and-drop. Refer to Picture 9.28.
Picture 9.28: Inserting signals

PCS 7 PoT Chapter 9 Process Tag Type, Model, and Master Data Library
PCS 7 PoT V6.0 | Edition V1.0 | August 2003 Copyright 2003 Siemens AG by A&D AS CS2 PA. All rights reserved.
Page 9 - 24
6.4 Message tab You can change the message texts if you wish. In addition, you can also define the priorities for the individual messages here.
Picture 9.28: Process object view – Message tab You can also export message texts for editing in other textual editors, e.g. Excel, Access, and Notepad, etc. You can re-import message texts back. See the functions under the Process Objects as shown in Picture 9.29.
Picture 9.29: Importing and exporting message texts

PCS 7 PoT Chapter 9 Process Tag Type, Model, and Master Data Library
PCS 7 PoT V6.0 | Edition V1.0 | August 2003 Copyright 2003 Siemens AG by A&D AS CS2 PA. All rights reserved.
Page 9 - 25
6.5 Picture objects tab The tab displays the operable (OCM) CFC blocks and their picture interconnections. In addition, you can see all SFC plans and their picture interconnections. For each potentially-operable (OCM) CFC block and SFC, at least one row is displayed, regardless of whether or not an OS interconnection already exists for it. Refer to Picture 9.30.
Picture 9.30: Process object view – Picture tab There is not data editable in the Tab. It is mainly a cross-reference function and serves to provide a quick overview of the existing and/or missing picture interconnections and assignments of one or several tags. That is, here you can view to which pictures the individual tag is connected. If something in the picture should be changed, you can use the context-sensitive menu of OS Graphics Designer to open the selected picture. 6.6 Measured value archives The tab displays all measured variables archived in the Tag Logging of OS. See Picture 9.31.

PCS 7 PoT Chapter 9 Process Tag Type, Model, and Master Data Library
PCS 7 PoT V6.0 | Edition V1.0 | August 2003 Copyright 2003 Siemens AG by A&D AS CS2 PA. All rights reserved.
Page 9 - 26
Picture 9.30: Process object view – Measured value archives 6.7 Handling in the Process object view 6.71 Split window view You can split the window into two parts by holding and moving the split window boarder as shown in Picture 9.31. The two windows of the right pane are shown in Picture 9.32.
Picture 9.31: Splitting window

PCS 7 PoT Chapter 9 Process Tag Type, Model, and Master Data Library
PCS 7 PoT V6.0 | Edition V1.0 | August 2003 Copyright 2003 Siemens AG by A&D AS CS2 PA. All rights reserved.
Page 9 - 27
Picture 9.32: Split window view 6.7.2 Filters The filter is implemented in two-tiered fashion for the process object view, whereby the first tier on the "General" tab affects all other tabs. That is, only objects which are displayed on the "General" tab are further displayed on other tabs. With the second tier of the filter (in the other five tabs), you can restrict the display according to Filter by Column. Then, filtering, e.g. using wild cards, of the column contents, is used in the Display field. See Picture 9.33.
Picture 9.33: Using filters 6.7.3 Find/Replace You can search for and replace text on the tabs in the Process object view. Searching begins in the cell which is marked or in which the pointer is positioned. Depending on the selected search area, the entire table will be searched (all) or the search will run from left to right (row) or from top to bottom (column). Searching occurs in circular fashion; that is, from the row or column end, it jumps to the beginning and searches further until the last row has been reached once again.

PCS 7 PoT Chapter 9 Process Tag Type, Model, and Master Data Library
PCS 7 PoT V6.0 | Edition V1.0 | August 2003 Copyright 2003 Siemens AG by A&D AS CS2 PA. All rights reserved.
Page 9 - 28
Picture 9.34: Find and Replace function A search stops where the first occurrence is found. If you click "Find," the search will continue without replacing the text. If you click “Replace,” only the text in this cell is replaced. Use “Replace all” to search further and replace all occurrences. It is not necessary to specify the complete text of a text you are searching for. Instead, a partial entry will pick up those match the entry make as long as the text you are searching for exist. If you use the “Replace or Replace All” buttons without entering text in the “Replace” field, the occurrences found will be deleted. 6.7.4 Defining columns On the "General," "Parameters" and "Signals" tabs of the process object view, you can define your own columns in addition to the existing ones. Thus you have the opportunity to add information which is important to you (e.g. company, maintenance interval, etc.) for process tags, CFC/SFC charts, parameters, and signals.

PCS 7 PoT Chapter 9 Process Tag Type, Model, and Master Data Library
PCS 7 PoT V6.0 | Edition V1.0 | August 2003 Copyright 2003 Siemens AG by A&D AS CS2 PA. All rights reserved.
Page 9 - 29
Picture 9.35: Defining data fields A freely defined columns may be connected to the freely defined attributes in the STEP 7/PCS 7. The attribute name should be the same as the column’s name. The specific prefix for the freely defined attributes is “POU_”. For example, you can define an attribute, POU_Maintenanceinterval, for a block and it will appear under Column “Maintenanceinterval” in the Process object view. 6.7.5 Undo When you changed data in the Process object view, the “Undo” button is active so that you can undo the change. See Picture 9.36. After pressing Undo, the “Redo” button is available.
Picture 9.36: Undo and Redo

PCS 7 PoT Chapter 9 Process Tag Type, Model, and Master Data Library
PCS 7 PoT V6.0 | Edition V1.0 | August 2003 Copyright 2003 Siemens AG by A&D AS CS2 PA. All rights reserved.
Page 9 - 30

PCS 7 PoT Chapter 9 Process Tag Type, Model, and Master Data Library
PCS 7 PoT V6.0 | Edition V1.0 | August 2003 Copyright 2003 Siemens AG by A&D AS CS2 PA. All rights reserved.
Page 9 - 31
Exercise Exercise 9.1 A valve control tag type 1. The task In the RMT1 project, Chart NK111 is used to control Valve NK111. The chart can be duplicated for controlling Valves NK112, NK113, and NK114. Make a valve control type based on NK111 using Process tag type then generate Valve controls NK112, NK113, and NK114 for the RMT1 project. 2. Guideline The plant hierarchy path for NK111 chart is as the following.
Plant1\RMT1\ Make the chart NK111 as a valve control tag type either in the RMT1 project or in the master data library. Generate Charts NK112, NK113, and NK114 in the following folders as tags of the type NK111.
Plant1\RMT1\\NK112, NK113, NK114.

Chapter 10:
OS and Graphics Design

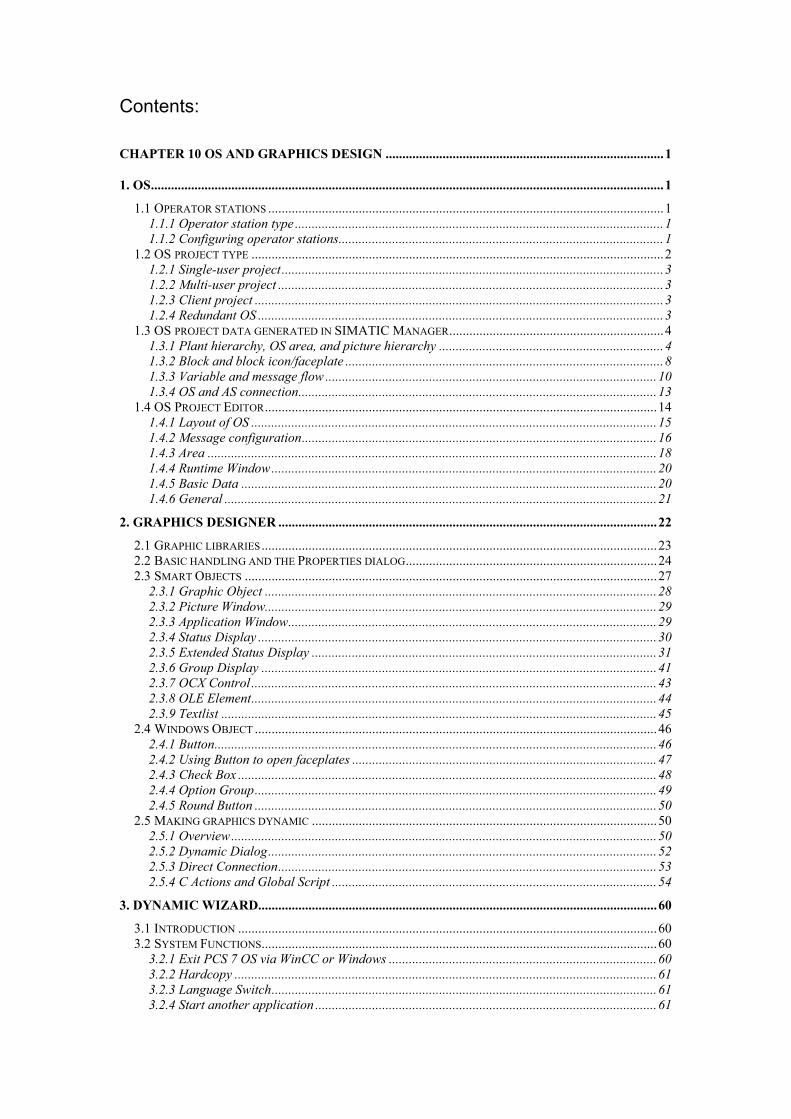
Contents: CHAPTER 10 OS AND GRAPHICS DESIGN ...................................................................................1
1. OS.........................................................................................................................................................1
1.1 OPERATOR STATIONS ......................................................................................................................1 1.1.1 Operator station type ..............................................................................................................1 1.1.2 Configuring operator stations.................................................................................................1
1.2 OS PROJECT TYPE ...........................................................................................................................2 1.2.1 Single-user project..................................................................................................................3 1.2.2 Multi-user project ...................................................................................................................3 1.2.3 Client project ..........................................................................................................................3 1.2.4 Redundant OS .........................................................................................................................3
1.3 OS PROJECT DATA GENERATED IN SIMATIC MANAGER................................................................4 1.3.1 Plant hierarchy, OS area, and picture hierarchy ...................................................................4 1.3.2 Block and block icon/faceplate ...............................................................................................8 1.3.3 Variable and message flow ...................................................................................................10 1.3.4 OS and AS connection...........................................................................................................13
1.4 OS PROJECT EDITOR.....................................................................................................................14 1.4.1 Layout of OS .........................................................................................................................15 1.4.2 Message configuration..........................................................................................................16 1.4.3 Area ......................................................................................................................................18 1.4.4 Runtime Window...................................................................................................................20 1.4.5 Basic Data ............................................................................................................................20 1.4.6 General .................................................................................................................................21
2. GRAPHICS DESIGNER .................................................................................................................22
2.1 GRAPHIC LIBRARIES......................................................................................................................23 2.2 BASIC HANDLING AND THE PROPERTIES DIALOG...........................................................................24 2.3 SMART OBJECTS ...........................................................................................................................27
2.3.1 Graphic Object .....................................................................................................................28 2.3.2 Picture Window.....................................................................................................................29 2.3.3 Application Window..............................................................................................................29 2.3.4 Status Display .......................................................................................................................30 2.3.5 Extended Status Display .......................................................................................................31 2.3.6 Group Display ......................................................................................................................41 2.3.7 OCX Control .........................................................................................................................43 2.3.8 OLE Element.........................................................................................................................44 2.3.9 Textlist ..................................................................................................................................45
2.4 WINDOWS OBJECT ........................................................................................................................46 2.4.1 Button....................................................................................................................................46 2.4.2 Using Button to open faceplates ...........................................................................................47 2.4.3 Check Box .............................................................................................................................48 2.4.4 Option Group........................................................................................................................49 2.4.5 Round Button ........................................................................................................................50
2.5 MAKING GRAPHICS DYNAMIC .......................................................................................................50 2.5.1 Overview...............................................................................................................................50 2.5.2 Dynamic Dialog....................................................................................................................52 2.5.3 Direct Connection.................................................................................................................53 2.5.4 C Actions and Global Script .................................................................................................54
3. DYNAMIC WIZARD.......................................................................................................................60
3.1 INTRODUCTION .............................................................................................................................60 3.2 SYSTEM FUNCTIONS......................................................................................................................60
3.2.1 Exit PCS 7 OS via WinCC or Windows ................................................................................60 3.2.2 Hardcopy ..............................................................................................................................61 3.2.3 Language Switch...................................................................................................................61 3.2.4 Start another application ......................................................................................................61

3.3 STANDARD DYNAMICS..................................................................................................................61 3.3.1 Connect picture block to tag structure..................................................................................62 3.3.2 Add dynamics to the prototype and Link a prototype to a structure .....................................64 3.3.3 Move Object..........................................................................................................................64 3.3.4 Operationable if authorised..................................................................................................64 3.3.5 Setting/Resetting a bit ...........................................................................................................65 3.3.6 Setting/Resetting bits.............................................................................................................65 3.3.7 Dynamic Wizards for SFC ....................................................................................................66
3.4 DYNAMIC WIZARDS - PICTURE FUNCTIONS ..................................................................................66 3.4.1 Open picture in process window...........................................................................................67 3.4.2 Picture exchange in workspace ............................................................................................67 3.4.3 Picture selection via measurement point ..............................................................................67
4. USER DEFINED OBJECTS (UDOS).............................................................................................67
4.1 KEY STEPS IN MAKING A UDO......................................................................................................67 4.2 MAKING A UDO ...........................................................................................................................68
4.2.1 Preparing objects and graphics for building an UDO .........................................................68 4.2.2 Starting to create an UDO....................................................................................................68 4.2.3 Configuration dialog of UDO...............................................................................................69 4.2.4 Adding dynamics to UDO .....................................................................................................70 4.2.5 Storing the prototype UDO into a library.............................................................................71 4.2.6 Link a prototype to a structure..............................................................................................72 4.2.7 Modifying a UDO .................................................................................................................72
5. CUSTOMISING OF BLOCK ICON AND FACEPLATE ...........................................................73
5.1 BLOCK ICONS AND THE @@PCS 7TYPICALS ...............................................................................73 5.2 BLOCK ICONS AND @PCS 7TYPICALS ..........................................................................................75 5.3 BLOCK ICONS AND @TEMPLATES .................................................................................................75 5.4 CALLING UP FACEPLATES..............................................................................................................76
6. DESIGNING FACEPLATES WITH FACEPLATE DESIGNER...............................................76
6.1 TOOLS OF FACEPLATE DESIGNER..................................................................................................76 6.2 AN EXAMPLE – CREATING FACEPLATE .........................................................................................77
6.2.1 A user block type...................................................................................................................77 6.2.2 Creating faceplate views.......................................................................................................78 6.2.3 Designing the views ..............................................................................................................79 6.2.4 Designing block icons...........................................................................................................81 6.2.5 Using a new block type .........................................................................................................82
EXERCISE............................................................................................................................................83
EXERCISE 10.1 INCLUDING STATUS DISPLAY .....................................................................................83 1. The task......................................................................................................................................83 2. Guideline ...................................................................................................................................83
EXERCISE 10.2 INCLUDING GROUP DISPLAY ......................................................................................83 1. The task......................................................................................................................................83 2. Guideline ...................................................................................................................................83
EXERCISE 10.3 MAKING A VALVE-CONTROL UDO.............................................................................85 1. The task......................................................................................................................................85 2. Guideline ...................................................................................................................................85

PCS 7 PoT Chapter 10 OS and Graphics Design
Chapter 10 OS and Graphics Design
1. OS The term of OS normally means operator stations and in some context OS projects. The former emphasises the physical side of PCs and runtime systems and the later implies the software side and configurations systems
1.1 Operator stations
1.1.1 Operator station type There are three types of operator stations in PCS 7. They are:
OS server, • • •
OS redundant (or standby) server, and OS client
An OS server and its redundant server form a pair which in many cases is treated as one identity. An OS server (and/or OS redundant server) is connected to the Plant bus communicating with automation systems. A server does not have displaying pictures which offer operator controlling and monitoring functions (except that OS client and server are on one PC in a small project). OS clients are used for operator controlling and monitoring. They communicate with OS servers by means of the Terminal bus. Multiple servers can be used, each corresponding to a branch of a plant. Data from different servers (more than one) can be displayed on one client. One server can be accessed by 32 OS clients. One client can access 12 OS servers (or 12 pairs of servers). One client PC could have up to 4 monitors connected provided that multiple VGA cards are installed, which then are counted as 4 clients.
1.1.2 Configuring operator stations Operator stations are inserted into a PCS 7 project in the Component view. First, a PC station is inserted and then an OS (server), OS (standby server), or OS client. See Picture 10.1. OS stations are configured with the HW-Config (see Picture 10.1), NetPro, Configuration Console (Commissioning wizard), and Station Configuration Editor. Note Chapter 3, Section 2 has detailed instructions on the configuration of PC stations including OS PCs. A good illustration is given in Picture 3.23.
PCS 7 PoT V6.0 | Edition V1.0 | August 2003 Copyright 2003 Siemens AG by A&D AS CS2 PA. All rights reserved.
Page 10 - 1

PCS 7 PoT Chapter 10 OS and Graphics Design
Picture 10.1: Operator stations
1.2 OS project type There are three types of OS projects in PCS 7 systems.
Single-user project • • •
Multi-user project Redundant project
When an OS server is inserted in the SIMATIC Manager, its project type is set as of multi-user by default. You can, however, change it in PCS 7 OS. Picture 10.2 shows how to specify an OS project type.
PCS 7 PoT V6.0 | Edition V1.0 | August 2003 Copyright 2003 Siemens AG by A&D AS CS2 PA. All rights reserved.
Page 10 - 2

PCS 7 PoT Chapter 10 OS and Graphics Design
Picture 10.2: OS project type
1.2.1 Single-user project The project database cannot be accessed by other OSs. There is only one OS in the project and has operating functions and displays.
1.2.2 Multi-user project The project database can be accessed by other OSs. In the project. there is at least one OS server and one OS client. The OS server does not have pictures and other graphic functions in runtime.
1.2.3 Client project An OS client project accesses an OS server’s data through packages generated on a server machine. Through packages, an OS client project share servers’ data. More information on packages is included in Chapter 13.
1.2.4 Redundant OS Redundant OS is configured in the Redundancy editor. Each OS client can access a maximum of 12 redundant server pairs. More information on Redundancy is included in Chapter 13.
PCS 7 PoT V6.0 | Edition V1.0 | August 2003 Copyright 2003 Siemens AG by A&D AS CS2 PA. All rights reserved.
Page 10 - 3

PCS 7 PoT Chapter 10 OS and Graphics Design
1.3 OS project data generated in SIMATIC Manager The use of PCS 7 OS offers a major advantage compared to WinCC in SCADA applications. That is, the integration of PCS 7 enables data generated in SIMATIC Manager (AS engineering) to be accessed in the PCS 7 OS. An overview of PCS 7 project engineering in different phases is illustrated in Picture 10.3.
Picture 10.3: Initial part of PCS 7 OS projects are transferred from AS
1.3.1 Plant hierarchy, OS area, and picture hierarchy In Chapter 4, Section 2.4, Plant hierarchy has been discussed in details. Particularly, Picture 2.14 shows the settings that you could make in the SIMATIC Manager. Normally you choose to base the picture hierarchy on the plant hierarchy and insert only one picture in one plant hierarchical folder. Note It is recommended to base the picture hierarchy on the plant hierarchy and insert one picture in one hierarchical folder. If you do not want to your OS area and picture hierarchy based on the plant hierarchy, you have to use the Picture Tree Manager in PCS 7 OS to edit them. See Picture 10.4 where you can insert picture folders (or containers) in a tree structure and then insert pictures.
PCS 7 PoT V6.0 | Edition V1.0 | August 2003 Copyright 2003 Siemens AG by A&D AS CS2 PA. All rights reserved.
Page 10 - 4

PCS 7 PoT Chapter 10 OS and Graphics Design
Picture 10.4: Picture Tree Manager editor Note Caution has to be taken to ensure that the pictures in the Picture Tree Manager are not overwritten as unexpected. Refer to Pictures 10.5 and 10.6. To design picture tree in the Picture Tree Manager editor, you should turn off the setting in the Customising Plant Hierarchy dialog as shown in Picture 10.5.
PCS 7 PoT V6.0 | Edition V1.0 | August 2003 Copyright 2003 Siemens AG by A&D AS CS2 PA. All rights reserved.
Page 10 - 5
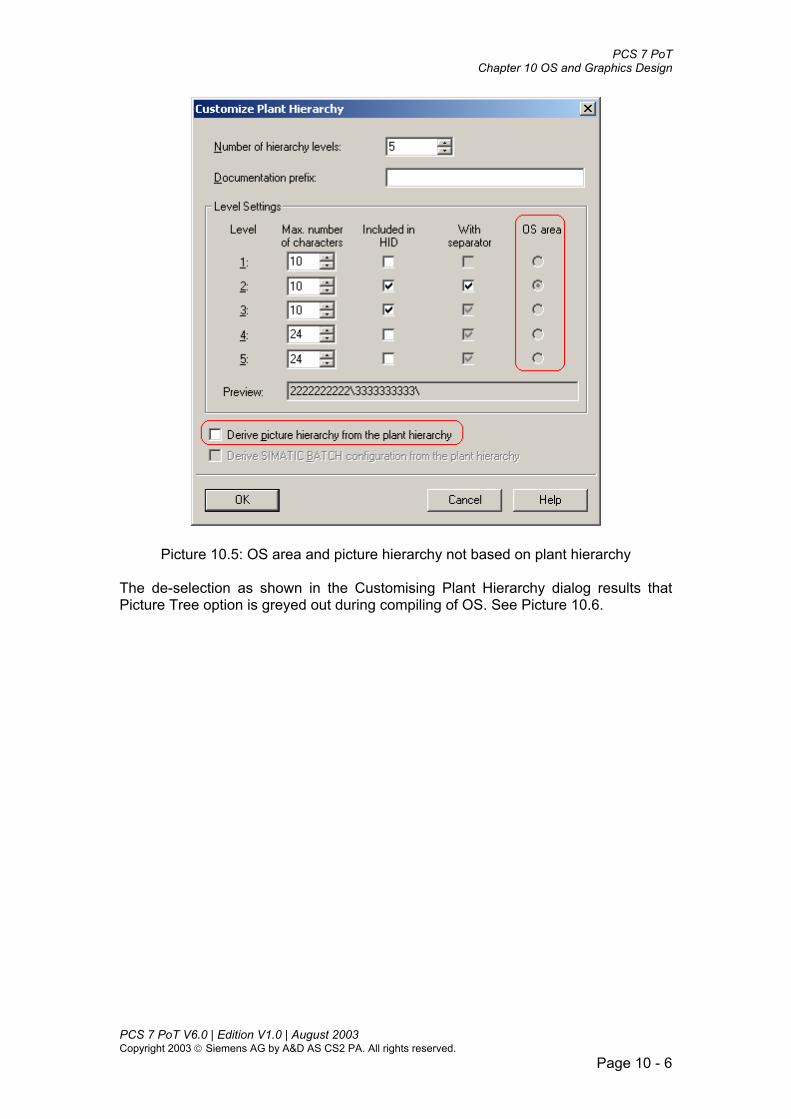
PCS 7 PoT Chapter 10 OS and Graphics Design
Picture 10.5: OS area and picture hierarchy not based on plant hierarchy The de-selection as shown in the Customising Plant Hierarchy dialog results that Picture Tree option is greyed out during compiling of OS. See Picture 10.6.
PCS 7 PoT V6.0 | Edition V1.0 | August 2003 Copyright 2003 Siemens AG by A&D AS CS2 PA. All rights reserved.
Page 10 - 6

PCS 7 PoT Chapter 10 OS and Graphics Design
Picture 10.6: Picture Tree in the Compiling OS dialog To protect a previous transferred picture hierarchy in the Picture Tree Manager editor (e.g. due to change of plant hierarchy but still want to keep the picture hierarchy unchanged), you have to ensure that Picture Tree will not be compiled during compiling of OS. See Picture 10.7.
Picture 10.7: Protecting an existing picture tree in the Picture Tree Manager editor
PCS 7 PoT V6.0 | Edition V1.0 | August 2003 Copyright 2003 Siemens AG by A&D AS CS2 PA. All rights reserved.
Page 10 - 7

PCS 7 PoT Chapter 10 OS and Graphics Design
1.3.2 Block and block icon/faceplate Blocks and variables with the attribute, S7_m_c = true, are transferred to OS during compiling of OS. If a block has an icon, it can be automatically inserted to a defined picture. In two of the system dialogs, you set how a block icon will be automatically inserted for OS. The first setting to be made is to set a picture with the option “Derive the block symbols from the plant hierarchy”, which is discussed in Chapter 4, Section 2.7 and illustrated in Picture 4.31. The second setting is to insert the block symbols into the specified picture. See Picture 10.8 and Picture 10.9. In the upper part of the Create/Update Block Icons dialog shown in Picture 10.9, note that all pictures with the setting of derive block symbols from plant hierarchy are listed. If the selection of “Lower hierarchy levels included” is set to 0, it means that a picture will only collect block icons that are in the same hierarchy folder as the picture. “0” means no block icons from lower levels will be included in the picture.
Picture 10.8: Calling up Create/Update Block Icons
PCS 7 PoT V6.0 | Edition V1.0 | August 2003 Copyright 2003 Siemens AG by A&D AS CS2 PA. All rights reserved.
Page 10 - 8

PCS 7 PoT Chapter 10 OS and Graphics Design
Picture 10.9: Create/Update Block Icons dialog If the selection of “Lower hierarchy levels included” is not 0, block icons from the lower levels will also be included in all the pictures at the upper levels. For example, lower hierarchy levels included = 1 means that block icons are inserted into a picture at their level and a level above. Note Default setting of 0 in the Create/update Block Icons dialog is recommended. Block icon objects included in a picture can be named after hierarchy name, chart name, block name, or their combinations. The lower part of the dialog in Picture 10.9 has the options to set the name. See Picture 10.9 where block icons will be named after hierarchy/chart. Dialogs in Pictures 10.8 and 10.9 are used in the design phase. Whenever a block is added, if you want to use its block icon, you could use the Create/Update Block Icons to quickly insert the icon into a picture and thus to design the picture. The Create/Update Block Icons function is also in the dialog of Compiling OS. See Picture 10.10.
PCS 7 PoT V6.0 | Edition V1.0 | August 2003 Copyright 2003 Siemens AG by A&D AS CS2 PA. All rights reserved.
Page 10 - 9

PCS 7 PoT Chapter 10 OS and Graphics Design
Picture 10.10: Create/Update Block Icons during compiling of OS
1.3.3 Variable and message flow Variables with S7_m_c = true are transferred to the Tag Management under the Named Connections as shown in Picture 10.11.
PCS 7 PoT V6.0 | Edition V1.0 | August 2003 Copyright 2003 Siemens AG by A&D AS CS2 PA. All rights reserved.
Page 10 - 10

PCS 7 PoT Chapter 10 OS and Graphics Design
Picture 10.11: Variables in PCS 7 OS Variables created in SIMATIC Manager are located under a channel of the SIMATIC S7 PROTOCOL SUITE. In the case of PCS 7 systems, they are under the Named Connections. OS read these variables from AS in runtime. Therefore, the variables located in the Named Connections are also referred as the runtime variables. Variables created in SIMATIC Manager are also accessible for OS engineering even when the OS has not been compiled (meaning not ready for project runtime). In the Graphics Designer, you can link to a variable via selecting the data source “ES Variables “ and browsing through the folders there. See Picture 10.12. If a tag is added in CFC, you can update the “ES Variables” by clicking the Update tags button as shown in Picture 10.12. Messages created in SIMATIC Manager are transferred to the Alarm Logging editor when compiling OS. See Picture 10.13.
PCS 7 PoT V6.0 | Edition V1.0 | August 2003 Copyright 2003 Siemens AG by A&D AS CS2 PA. All rights reserved.
Page 10 - 11

PCS 7 PoT Chapter 10 OS and Graphics Design
Picture 10.12: Tag connector
Picture 10.13: Messages from SIMATIC Manager PCS 7 PoT V6.0 | Edition V1.0 | August 2003 Copyright 2003 Siemens AG by A&D AS CS2 PA. All rights reserved.
Page 10 - 12

PCS 7 PoT Chapter 10 OS and Graphics Design
1.3.4 OS and AS connection An ES/OS PC has a communication processor (CP1613) or network card installed in its motherboard and the AS has a CP 443-1 inserted in one of its slots. The settings for communication between OS and AS have been discussed in Chapter 3. Note For more details about the components CP1613 and CP443-1, refer to SIMATIC PCS 7 Catalog. The communication between an OS and AS regarding data flows is illustrated in Picture 10.14 and Picture 10.15.
Picture 10.14: Connections of OS and AS
Picture 10.15: Data flows between OS and AS PCS 7 PoT V6.0 | Edition V1.0 | August 2003 Copyright 2003 Siemens AG by A&D AS CS2 PA. All rights reserved.
Page 10 - 13
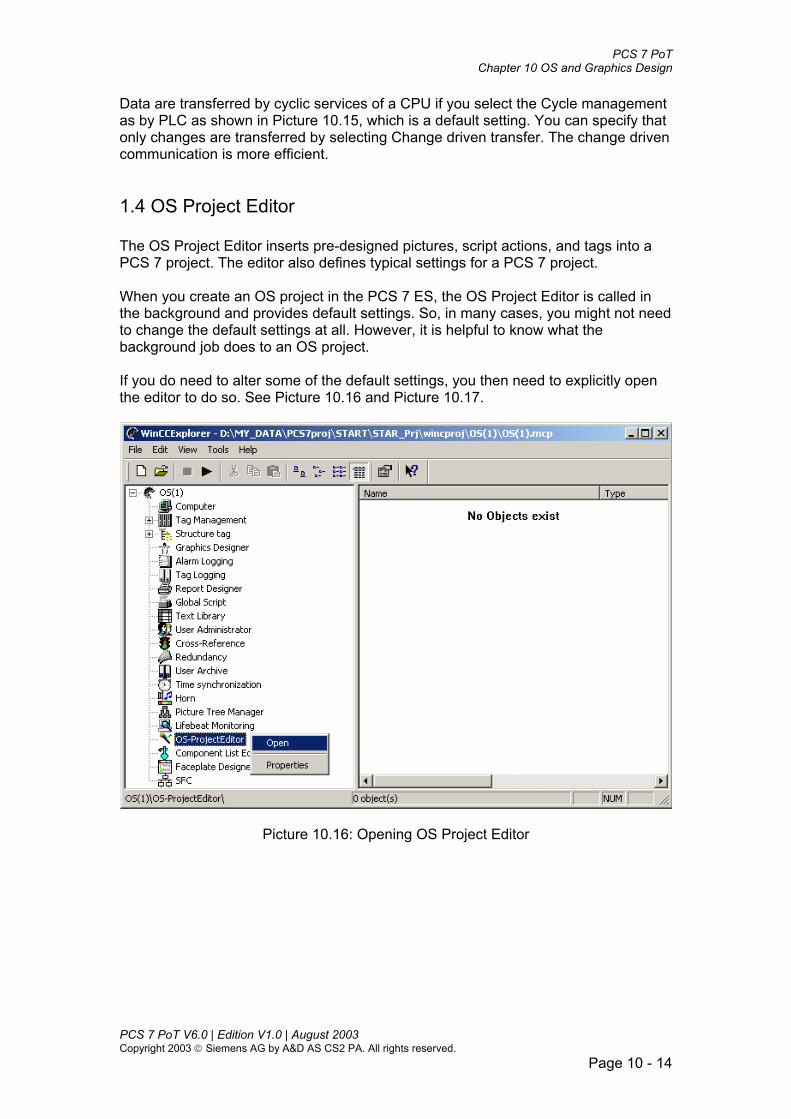
PCS 7 PoT Chapter 10 OS and Graphics Design
Data are transferred by cyclic services of a CPU if you select the Cycle management as by PLC as shown in Picture 10.15, which is a default setting. You can specify that only changes are transferred by selecting Change driven transfer. The change driven communication is more efficient.
1.4 OS Project Editor The OS Project Editor inserts pre-designed pictures, script actions, and tags into a PCS 7 project. The editor also defines typical settings for a PCS 7 project. When you create an OS project in the PCS 7 ES, the OS Project Editor is called in the background and provides default settings. So, in many cases, you might not need to change the default settings at all. However, it is helpful to know what the background job does to an OS project. If you do need to alter some of the default settings, you then need to explicitly open the editor to do so. See Picture 10.16 and Picture 10.17.
Picture 10.16: Opening OS Project Editor
PCS 7 PoT V6.0 | Edition V1.0 | August 2003 Copyright 2003 Siemens AG by A&D AS CS2 PA. All rights reserved.
Page 10 - 14

PCS 7 PoT Chapter 10 OS and Graphics Design
Picture 10.17: Layout of OS
1.4.1 Layout of OS In the Layout tab of OS Project Editor, you can set resolution of an OS’s monitor, number of monitors used, and arrangement of the monitors, e.g. horizontal or vertical. The number of OS areas is set as 16 by default. Nevertheless, you can change the number (pressing the Detail button) as shown in Picture 10.18. Up to 64 areas can be configured depending on the monitor resolution. Click the Suggestion button to call up a suggested layout based on the number of plant areas that have already been configured in the Simatic Manager in the plant hierarchy. Click the Detail button to view/change the layout.
PCS 7 PoT V6.0 | Edition V1.0 | August 2003 Copyright 2003 Siemens AG by A&D AS CS2 PA. All rights reserved.
Page 10 - 15

PCS 7 PoT Chapter 10 OS and Graphics Design
Picture 10.18: Adjusting the number of OS areas
1.4.2 Message configuration In the Message configuration tab of the OS Project Editor, the system messages could be assigned to an OS area or to no specific area. See the lower part of Picture 10.19. Other possible settings in Picture 10.19 are grayed out or changeable due to the setting for Delta Online Loading in the General tab. See Picture 10.20. If you set “ complete configuration” in the General tab you can set the system messages with priority. The default priority is 0 being the lowest priority and the highest priority is 16. See Picture 10.21 You can also change the maximum length of permitted text characters for data columns. As shown in Picture 10.21, the maximum length of text characters for the Event is 50.
PCS 7 PoT V6.0 | Edition V1.0 | August 2003 Copyright 2003 Siemens AG by A&D AS CS2 PA. All rights reserved.
Page 10 - 16
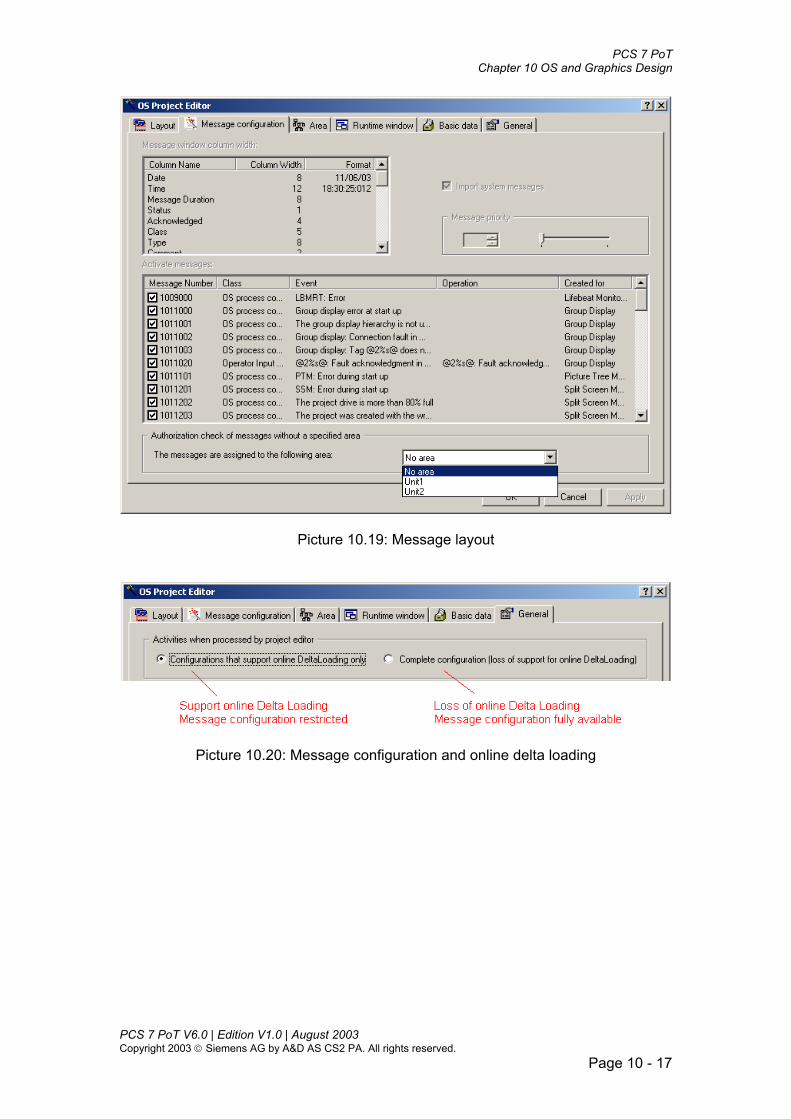
PCS 7 PoT Chapter 10 OS and Graphics Design
Picture 10.19: Message layout
Picture 10.20: Message configuration and online delta loading
PCS 7 PoT V6.0 | Edition V1.0 | August 2003 Copyright 2003 Siemens AG by A&D AS CS2 PA. All rights reserved.
Page 10 - 17
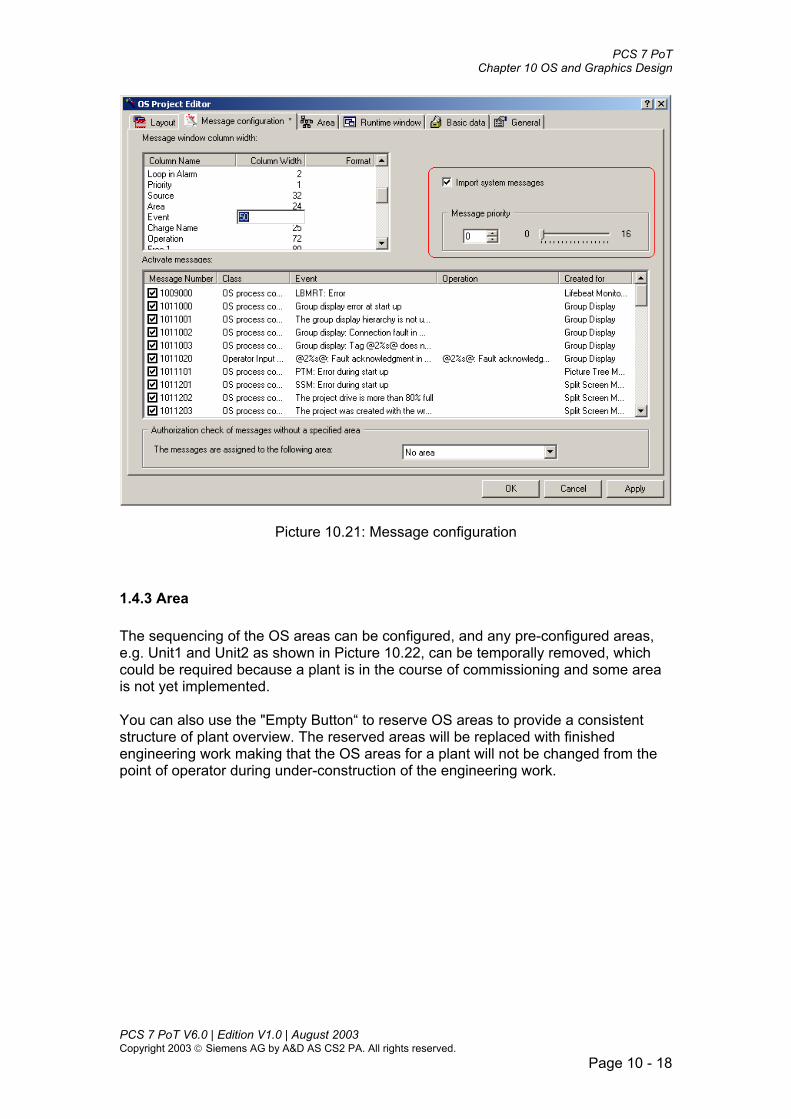
PCS 7 PoT Chapter 10 OS and Graphics Design
Picture 10.21: Message configuration
1.4.3 Area The sequencing of the OS areas can be configured, and any pre-configured areas, e.g. Unit1 and Unit2 as shown in Picture 10.22, can be temporally removed, which could be required because a plant is in the course of commissioning and some area is not yet implemented. You can also use the "Empty Button“ to reserve OS areas to provide a consistent structure of plant overview. The reserved areas will be replaced with finished engineering work making that the OS areas for a plant will not be changed from the point of operator during under-construction of the engineering work.
PCS 7 PoT V6.0 | Edition V1.0 | August 2003 Copyright 2003 Siemens AG by A&D AS CS2 PA. All rights reserved.
Page 10 - 18

PCS 7 PoT Chapter 10 OS and Graphics Design
Picture 10.22: Managing runtime OS areas
Picture 10.23: Settings for runtime performance
PCS 7 PoT V6.0 | Edition V1.0 | August 2003 Copyright 2003 Siemens AG by A&D AS CS2 PA. All rights reserved.
Page 10 - 19

PCS 7 PoT Chapter 10 OS and Graphics Design
1.4.4 Runtime Window This tab is used to configure runtime performance relevant to displaying of pictures and connecting of tags. These include positioning and sizing of picture objects called and controlling of the maximum number of graphic objects that can be called at one time. Note For more information on the Runtime window tab, refer to the WinCC Online Help under the index heading of the “Runtime window” tab.
1.4.5 Basic Data In the Basic Data window you can see which base data of the project have been changed compared to the system delivery status. The time stamp serves as a distinguishing factor. You can define which data are retained specific to the project when OS Project Editor is saved, and which data are overwritten by the system data. The upper left window shows base pictures. The date of that the PCS 7 system base pictures are released is listed under Product. The date when the base pictures generated for a project is listed under Project. You can select which of the modified project pictures shall be overwritten by pictures originally delivered. However, to ensure consistent runtime operation, It is compulsory for list entries highlighted in red to be overwritten. You cannot deactivate the checkboxes with red crosses. See Picture 10.26. The lower left window shows picture elements used in the system-delivered block faceplates. If they differ from those used in project, it is possible to select if they should be overwritten. Note For more information on the Basic Data tab, refer to the WinCC Online Help under the index heading of the “Basic data” tab.
PCS 7 PoT V6.0 | Edition V1.0 | August 2003 Copyright 2003 Siemens AG by A&D AS CS2 PA. All rights reserved.
Page 10 - 20

PCS 7 PoT Chapter 10 OS and Graphics Design
Picture 10.24: Basic data of a project
1.4.6 General On the General tab you configure whether online delta loading capability is to be retained for your project. See Picture 10.19. You can also define the log file, in text or HTML format. See Picture 10.25. The OS project configuration data can be documented and printed in the dialog.
PCS 7 PoT V6.0 | Edition V1.0 | August 2003 Copyright 2003 Siemens AG by A&D AS CS2 PA. All rights reserved.
Page 10 - 21

PCS 7 PoT Chapter 10 OS and Graphics Design
Picture 10.25: General tab of OS Project Editor
2. Graphics Designer Graphics Designer is an editor in PCS 7 OS providing various tools and objects for creating process graphics. Graphics Designer also provides its library with a large number of ready-made graphic elements such as pipes, valves, and tanks. You can modify the library objects and save them into your application project libraries. Graphics libraries are discussed in Section 2.1. Picture 10.26 shows the Graphics Designer environment with some basic design functions.
PCS 7 PoT V6.0 | Edition V1.0 | August 2003 Copyright 2003 Siemens AG by A&D AS CS2 PA. All rights reserved.
Page 10 - 22

PCS 7 PoT Chapter 10 OS and Graphics Design
Picture 10.26: Graphics Designer
2.1 Graphic libraries Pictures can be stored in either a global library or a project library. See Picture 10.27.
Picture 10.27: OS libraries – Global and Project libraries
PCS 7 PoT V6.0 | Edition V1.0 | August 2003 Copyright 2003 Siemens AG by A&D AS CS2 PA. All rights reserved.
Page 10 - 23

PCS 7 PoT Chapter 10 OS and Graphics Design
You can build up your graphic library by dragging-and-dropping a picture or graphic object to the library. Then, you can use the library to produce your project pictures by copying and pasting. The Siemens HMI Symbol Library has a good collection of pictures and process icons as shown in Picture 10.28.
Picture 10.28: The Siemens HMI Symbol Library
2.2 Basic handling and the Properties dialog Picture 10.29 shows the way to design graphics by using the Object Palette. For example, drag-and-drop the Bar, I/O Field, Static Text, Line, and Circle objects from the Object Palette.
PCS 7 PoT V6.0 | Edition V1.0 | August 2003 Copyright 2003 Siemens AG by A&D AS CS2 PA. All rights reserved.
Page 10 - 24

PCS 7 PoT Chapter 10 OS and Graphics Design
Picture 10.29: Basic handling of Graphics Designer
To change the objects to have different font, colour, and dynamic link, etc. you need to use the Object Properties dialog. In Pictures 10.30 and 10.31, a detailed instruction on how to configure an I/O Field with the Properties dialog is illustrated. Note For some objects there are more straightforward way to configure a dynamic link than using the Properties dialog. But, the Properties dialog is a general place where you can customise many object attributes.
PCS 7 PoT V6.0 | Edition V1.0 | August 2003 Copyright 2003 Siemens AG by A&D AS CS2 PA. All rights reserved.
Page 10 - 25

PCS 7 PoT Chapter 10 OS and Graphics Design
Picture 10.30: I/O Field Properties –1
PCS 7 PoT V6.0 | Edition V1.0 | August 2003 Copyright 2003 Siemens AG by A&D AS CS2 PA. All rights reserved.
Page 10 - 26

PCS 7 PoT Chapter 10 OS and Graphics Design
Picture 10.31: I/O Field Properties – 2
2.3 Smart Objects Smart Objects are located in the Object Palette and they normally have dynamic links to process variables. All the Smart Objects provided by PCS 7 OS are shown in Picture 10.32.
PCS 7 PoT V6.0 | Edition V1.0 | August 2003 Copyright 2003 Siemens AG by A&D AS CS2 PA. All rights reserved.
Page 10 - 27

PCS 7 PoT Chapter 10 OS and Graphics Design
Picture 10.32: Smart Objects
2.3.1 Graphic Object Using Graphic Objects, you can embed standard pictures (e.g. the bmp and emf pictures) into the Graphics Designer. In Picture 10.33, a plant landscape picture is to be included in a PCS 7 OS picture. After selecting a Graphic Object from the Object Palette,then drag-and-drop a picture frame (Step 1 on Picture 10.33), the Graphic object configuration dialog appears where you can select the picture you want to include in the PCS 7 OS picture (Step 2).
Picture 10.33: Graphic Object PCS 7 PoT V6.0 | Edition V1.0 | August 2003 Copyright 2003 Siemens AG by A&D AS CS2 PA. All rights reserved.
Page 10 - 28

PCS 7 PoT Chapter 10 OS and Graphics Design
2.3.2 Picture Window Picture windows are objects that accept pictures created with the Graphics Designer. One application of the object is to display different pictures in a Picture Window by linking the window with the various pictures. See Picture 10.34 where the picture name is pre-set to Detail_J002.PDL while it can be varied by referring it to different pictures.
Picture 10.34: Picture Window The picture window is used along with actions. For example, a picture window is normally hidden and a button click calls up the window display. Picture 10.34, Step 3 shows that after clicking a button, the window displays a set of pumps.
2.3.3 Application Window Application windows are objects that are managed by the PCS 7 print system to print out reports. Picture 10.35 shows the use of the Application window with detailed configuration instruction in planning and triggering a print job. System reporting and printing will be discussed in Chapter 12.
PCS 7 PoT V6.0 | Edition V1.0 | August 2003 Copyright 2003 Siemens AG by A&D AS CS2 PA. All rights reserved.
Page 10 - 29
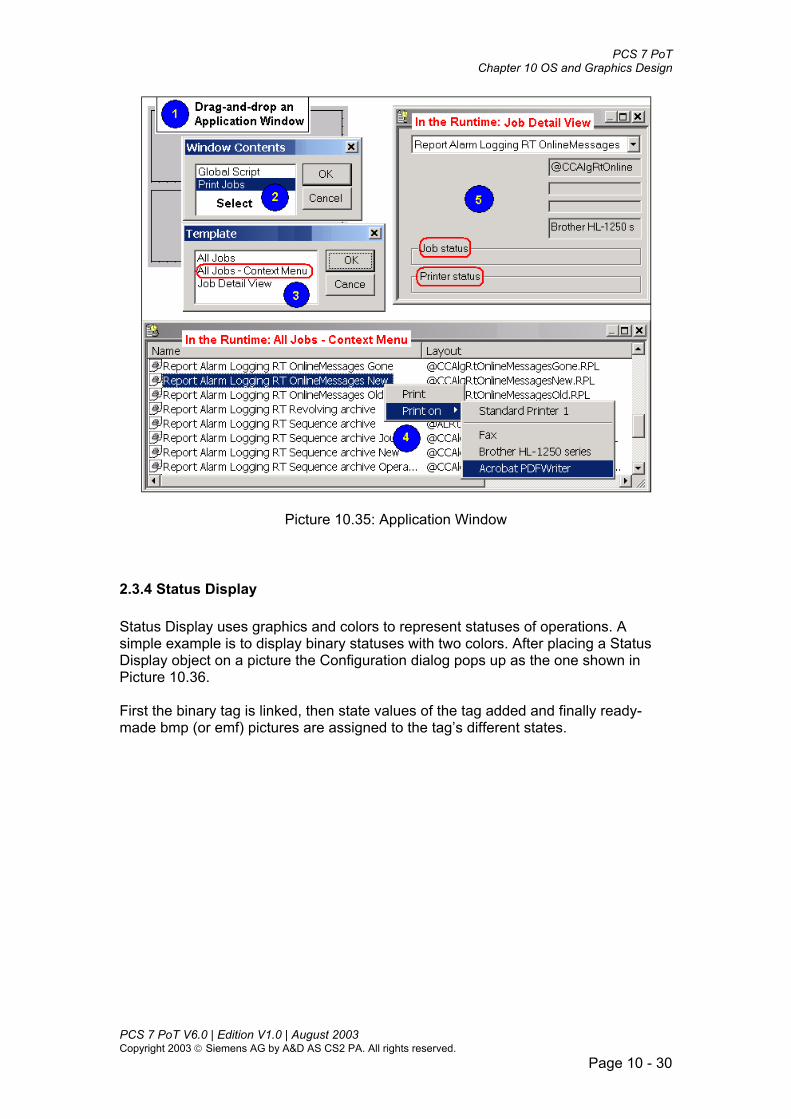
PCS 7 PoT Chapter 10 OS and Graphics Design
Picture 10.35: Application Window
2.3.4 Status Display Status Display uses graphics and colors to represent statuses of operations. A simple example is to display binary statuses with two colors. After placing a Status Display object on a picture the Configuration dialog pops up as the one shown in Picture 10.36. First the binary tag is linked, then state values of the tag added and finally ready-made bmp (or emf) pictures are assigned to the tag’s different states.
PCS 7 PoT V6.0 | Edition V1.0 | August 2003 Copyright 2003 Siemens AG by A&D AS CS2 PA. All rights reserved.
Page 10 - 30
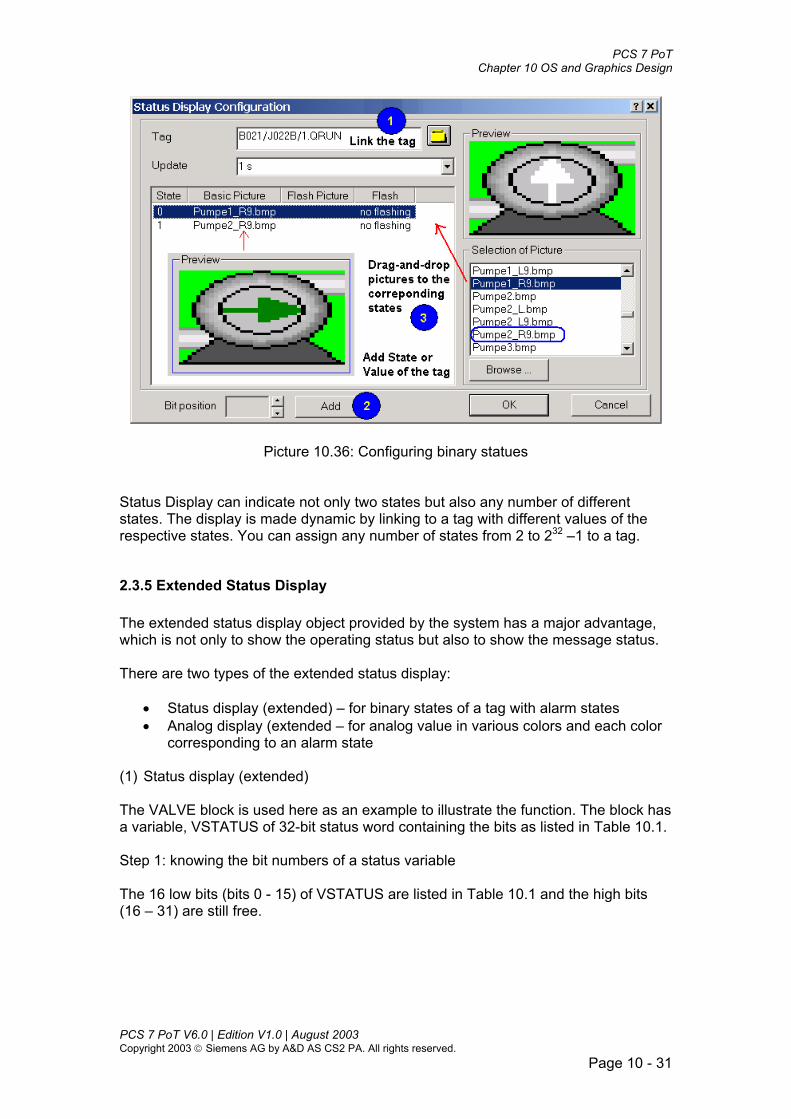
PCS 7 PoT Chapter 10 OS and Graphics Design
Picture 10.36: Configuring binary statues Status Display can indicate not only two states but also any number of different states. The display is made dynamic by linking to a tag with different values of the respective states. You can assign any number of states from 2 to 232 –1 to a tag.
2.3.5 Extended Status Display The extended status display object provided by the system has a major advantage, which is not only to show the operating status but also to show the message status. There are two types of the extended status display:
Status display (extended) – for binary states of a tag with alarm states • • Analog display (extended – for analog value in various colors and each color
corresponding to an alarm state (1) Status display (extended) The VALVE block is used here as an example to illustrate the function. The block has a variable, VSTATUS of 32-bit status word containing the bits as listed in Table 10.1. Step 1: knowing the bit numbers of a status variable The 16 low bits (bits 0 - 15) of VSTATUS are listed in Table 10.1 and the high bits (16 – 31) are still free.
PCS 7 PoT V6.0 | Edition V1.0 | August 2003 Copyright 2003 Siemens AG by A&D AS CS2 PA. All rights reserved.
Page 10 - 31
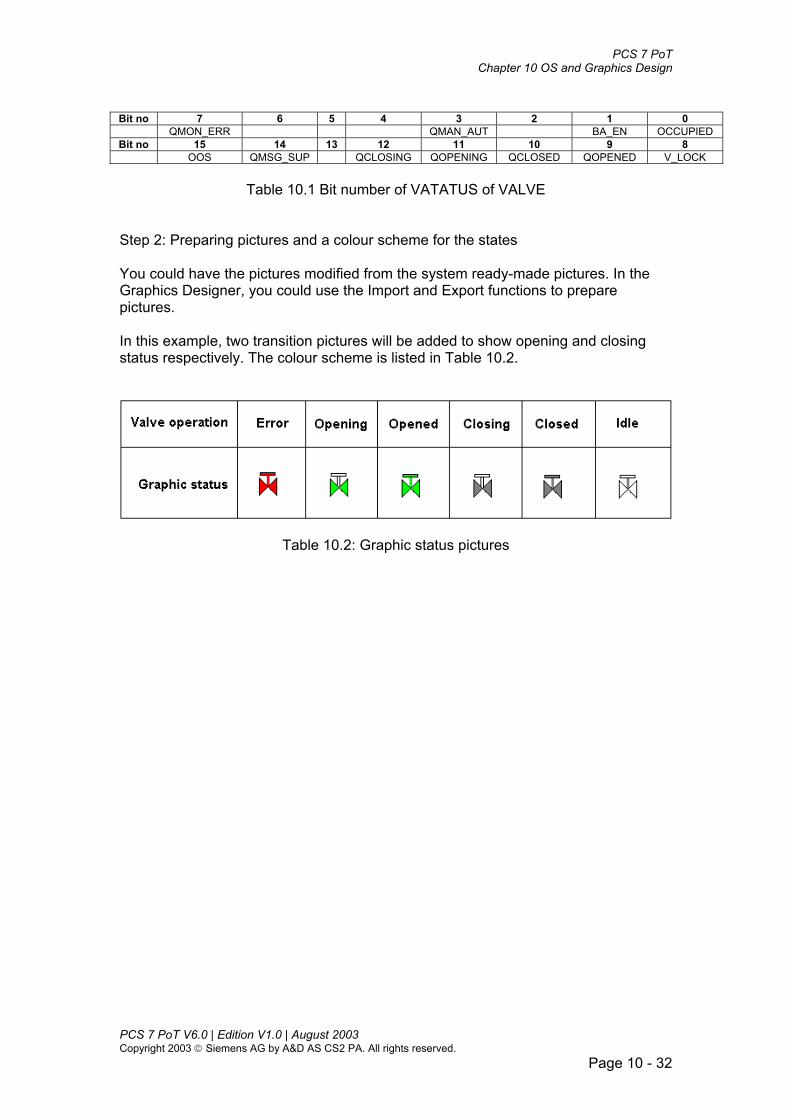
PCS 7 PoT Chapter 10 OS and Graphics Design
Bit no 7 6 5 4 3 2 1 0
QMON_ERR QMAN_AUT BA_EN OCCUPIED Bit no 15 14 13 12 11 10 9 8
OOS QMSG_SUP QCLOSING QOPENING QCLOSED QOPENED V_LOCK
Table 10.1 Bit number of VATATUS of VALVE Step 2: Preparing pictures and a colour scheme for the states You could have the pictures modified from the system ready-made pictures. In the Graphics Designer, you could use the Import and Export functions to prepare pictures. In this example, two transition pictures will be added to show opening and closing status respectively. The colour scheme is listed in Table 10.2.
Table 10.2: Graphic status pictures
PCS 7 PoT V6.0 | Edition V1.0 | August 2003 Copyright 2003 Siemens AG by A&D AS CS2 PA. All rights reserved.
Page 10 - 32

PCS 7 PoT Chapter 10 OS and Graphics Design
Picture 10.37 shows how to import an emf picture.
Picture 10.37: Importing emf picture
PCS 7 PoT V6.0 | Edition V1.0 | August 2003 Copyright 2003 Siemens AG by A&D AS CS2 PA. All rights reserved.
Page 10 - 33

PCS 7 PoT Chapter 10 OS and Graphics Design
Picture 10.38 shows how to export a picture.
Picture 10.38: Exporting a picture After proceeding with the instructions shown in Pictures 10.37 and 10.38, you could have the pictures or similar as listed in Table 10.2. Step 3: Working out the values of the status bits It is recommended to create a table to detail all possible states with the corresponding pictures. See Table 10.3.
PCS 7 PoT V6.0 | Edition V1.0 | August 2003 Copyright 2003 Siemens AG by A&D AS CS2 PA. All rights reserved.
Page 10 - 34

PCS 7 PoT Chapter 10 OS and Graphics Design
Bit 0 QOPENED
Bit1 QCLOSED
Bit2 QOPENNING
Bit3 QCLOSING Status Basic picture Flash picture
0 0 0 0 0 @vho_undef 1 0 0 0 1 @vho_opened 0 1 0 0 2 @vho_closed 1 1 0 0 3 @vho_error 0 0 1 0 4 @vho_opened @vho_opening 1 0 1 0 5 @vho_error 0 1 1 0 6 @vho_error 1 1 1 0 7 @vho_error 0 0 0 1 8 @vho_closed @vho_closing 1 0 0 1 9 @vho_error 0 1 0 1 10 @vho_error 1 1 0 1 11 @vho_error 0 0 1 1 12 @vho_error 1 0 1 1 13 @vho_error 0 1 1 1 14 @vho_error 1 1 1 1 15 @vho_error Table 10.3: Combination of status bits Step 4: Configuring the Status display (extended) Drag and drop a Status display object onto a picture in the Graphics Designer. Then, configure the object as shown in Picture 10.39.
Picture 10.39: Configuring an extended status display object Note De-selecting “Use group value for display” makes the alarm priority not concerned and thus the alarm status will not be displayed.
PCS 7 PoT V6.0 | Edition V1.0 | August 2003 Copyright 2003 Siemens AG by A&D AS CS2 PA. All rights reserved.
Page 10 - 35

PCS 7 PoT Chapter 10 OS and Graphics Design
In the Assign picture tab, you assign pictures to variable statuses. See Picture 10.40.
Picture 10.40: Assigning pictures Step 5: Making tag connection In this final step, you make the status variable(s) connected. See Picture 10.41. Note As the alarm status is not defined in Picture 10.39, it is not relevant to connect the Group value as shown in Picture 10.41. However, if the alarm status is included, the Group value is to connect with Valve EventState.
PCS 7 PoT V6.0 | Edition V1.0 | August 2003 Copyright 2003 Siemens AG by A&D AS CS2 PA. All rights reserved.
Page 10 - 36
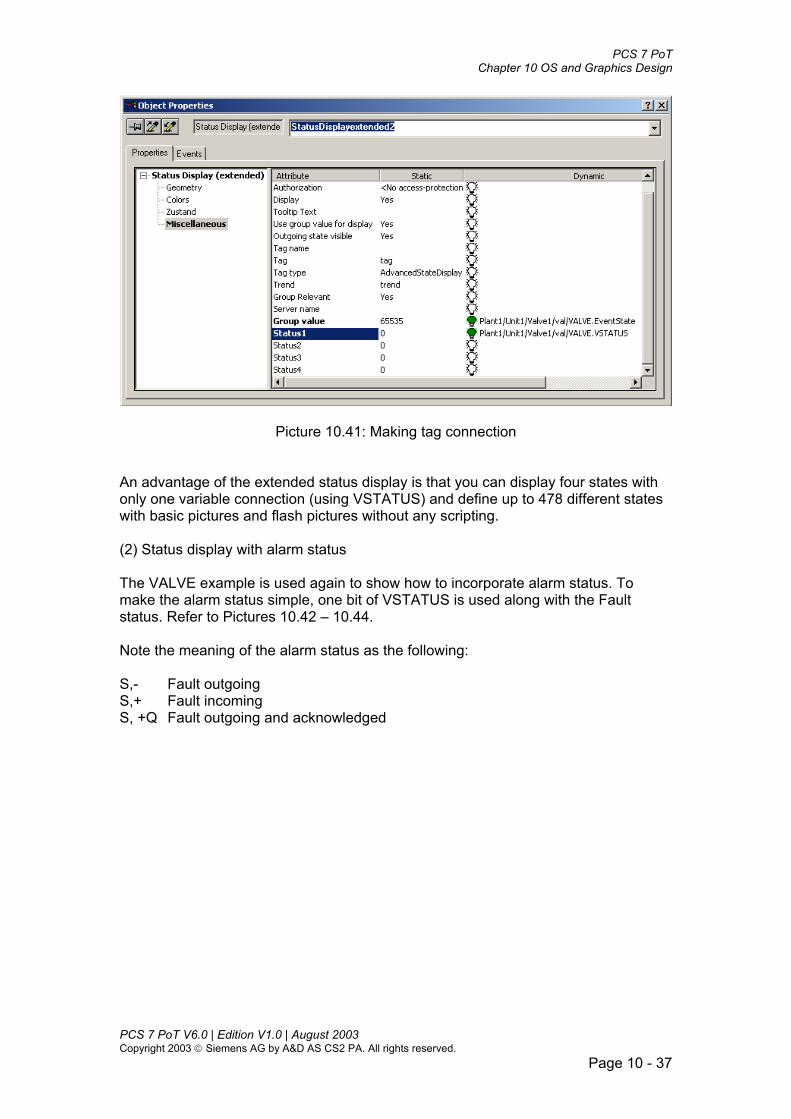
PCS 7 PoT Chapter 10 OS and Graphics Design
Picture 10.41: Making tag connection An advantage of the extended status display is that you can display four states with only one variable connection (using VSTATUS) and define up to 478 different states with basic pictures and flash pictures without any scripting. (2) Status display with alarm status The VALVE example is used again to show how to incorporate alarm status. To make the alarm status simple, one bit of VSTATUS is used along with the Fault status. Refer to Pictures 10.42 – 10.44. Note the meaning of the alarm status as the following: S,- Fault outgoing S,+ Fault incoming S, +Q Fault outgoing and acknowledged
PCS 7 PoT V6.0 | Edition V1.0 | August 2003 Copyright 2003 Siemens AG by A&D AS CS2 PA. All rights reserved.
Page 10 - 37

PCS 7 PoT Chapter 10 OS and Graphics Design
Picture 10.42: Configuring one bit with an alarm status
Picture 10.43: Configuring the alarm status PCS 7 PoT V6.0 | Edition V1.0 | August 2003 Copyright 2003 Siemens AG by A&D AS CS2 PA. All rights reserved.
Page 10 - 38

PCS 7 PoT Chapter 10 OS and Graphics Design
Picture 10.44: Linking the status and group value
Response of message priorities in runtime: When a pending event is acknowledged, the event and it’s associated picture is placed in the background, regardless of its priority. Low-priority events which have not yet been acknowledged are thus displayed before the higher priority events which have already been acknowledged. Low-priority events are not displayed as long as a higher-priority event is indicated as "Unacknowledged outgoing". You can customize the display properties of outgoing events. To do so, open the Object Properties in Extended Status Display and set the response you want on the "Properties" tab in the "Outgoing state visible" attribute. Application example: In the Valve block the status values QOPENED; QCLOSED,, QOPENING; QCLOSING can be used to provide custom displays for the "open", "closed", "opening" and "closing" states and can be combined with the "Fault" alarm state.
(3) Analog display (extended) Using the Analog display (extended), you can easily display a value with changing colours when it violates with its ranges. First, you define the background colour and font colour for the variable at its working (OK) value. Similarly, you define colours for other status, e.g. colours for the variable in the Alarm status. See Picture 10.45. In runtime, when the value reaches its alarm range, the display of the value is white font in red background. PCS 7 PoT V6.0 | Edition V1.0 | August 2003 Copyright 2003 Siemens AG by A&D AS CS2 PA. All rights reserved.
Page 10 - 39

PCS 7 PoT Chapter 10 OS and Graphics Design
Picture 10.45: Configuring an analog display (extended) -1 Picture 10.46 shows the variable connection.
Picture 10.46: Configuring an analog display (extended) -2
PCS 7 PoT V6.0 | Edition V1.0 | August 2003 Copyright 2003 Siemens AG by A&D AS CS2 PA. All rights reserved.
Page 10 - 40

PCS 7 PoT Chapter 10 OS and Graphics Design
2.3.6 Group Display A Group Display is a collection of events that are displayed on the OS in runtime. You could find that events are in two formats:
• as a tag named EventState, and • as collected states in a picture.
The EventState is displayed in the Runtime using a specifically designed graphic object, “Group Display”. You link the EventState with a Group Display object as illustrated in Picture 10.47.
Picture 10.47: Group Display The EventState is created when compiling of OS. It represents the message states defined in the PCS 7 technology function blocks, for example, CTRL_PID, VALVE, DOSE, RATIO, and MOTOR, etc. Picture 10.48 shows the configured messages within CTRL_PID block in CFC and the messages are collected into the tag, EventState in PCS 7 OS. The object Group Display de-codes and display the messages.
PCS 7 PoT V6.0 | Edition V1.0 | August 2003 Copyright 2003 Siemens AG by A&D AS CS2 PA. All rights reserved.
Page 10 - 41

PCS 7 PoT Chapter 10 OS and Graphics Design
Picture 10.48: Configured messages displayed over a Group Display object When a Group Display is placed in a picture, the picture has the “Event State”. Therefore, another Group Display could refer to this picture. For example the Group Display in the picture RMT is linked to the picture PID where the faceplate PID sits. Refer to Picture 10.49.
Picture 10.49: Tracing an alarm source When clicking the Group Display in the picture RMT, the picture PID will pop up. This function can be used to trace the origin of alarm messages. In the case of Picture 10.49, you trace from the picture RMT to PID. PCS 7 PoT V6.0 | Edition V1.0 | August 2003 Copyright 2003 Siemens AG by A&D AS CS2 PA. All rights reserved.
Page 10 - 42

PCS 7 PoT Chapter 10 OS and Graphics Design
The configuration of linking a Group Display with a picture is illustrated in Picture 10.50.
Picture 10.50: Configuring a Group Display with a picture
2.3.7 OCX Control OCX or ActiveX objects are picture modules that are available as loadable components. PCS 7 OS offers a number of them, e.g. the WinCC Digital/Analog Clock Control. See Picture 10.51. An OCX picture module is created using a separate development environment, for example, using the Microsoft Visual C++ or Microsoft Visual Basic. OCX modules created or purchased need to be registered with PCS 7 OS.
PCS 7 PoT V6.0 | Edition V1.0 | August 2003 Copyright 2003 Siemens AG by A&D AS CS2 PA. All rights reserved.
Page 10 - 43

PCS 7 PoT Chapter 10 OS and Graphics Design
Picture 10.51: WinCC and PCS 7 OCX control ActiveX modules can be easily incorporated into plant pictures. An example of the slide control is shown in Picture 10.52.
Picture 10.52: Slide control
2.3.8 OLE Element You can use the registered OLE elements to integrate existing Windows applications into OS pictures. In Picture 10.48, Microsoft Excel is connected to a plant picture as indicated by the application icon. Other registered applications can also be seen in Picture 10.53.
PCS 7 PoT V6.0 | Edition V1.0 | August 2003 Copyright 2003 Siemens AG by A&D AS CS2 PA. All rights reserved.
Page 10 - 44

PCS 7 PoT Chapter 10 OS and Graphics Design
Picture 10.53: OLE Element
2.3.9 Textlist In the Object Palette under Smart Objects, find the Text List. An example of the object is shown in Picture 10.54 where you can see how to use the Textlist object. The process variable is MODE_AKT, a BOOL with 3 bit positions OUT0, OUT1, and OUT2 representing MODE_MAINT, MODE_MAN, and MODE_AUTO respectively. Double-click on the attribute “Assignments” to define the links with the states of MODE_AKT. As a result, the textlist will have the following list terms: NN, MAINT, MANUAL, and AUTOMATIC.
Picture 10.54: Changing operating modes using text list
PCS 7 PoT V6.0 | Edition V1.0 | August 2003 Copyright 2003 Siemens AG by A&D AS CS2 PA. All rights reserved.
Page 10 - 45

PCS 7 PoT Chapter 10 OS and Graphics Design
2.4 Windows Object In Graphic Designer, 5 standard Windows Objects are available as shown in Picture 10.55.
Picture 10.55: Windows Objects
2.4.1 Button The Button is used to control process events such as acknowledging messages, activating printouts, setting values and displaying picture windows. It recognises two states, “Pressed” and “Not pressed”. Additionally, you may need to write in multiple lines of texts on a Button as illustrated in Picture 10.56.
Picture 10.56: Configuring texts in two lines on a Button
PCS 7 PoT V6.0 | Edition V1.0 | August 2003 Copyright 2003 Siemens AG by A&D AS CS2 PA. All rights reserved.
Page 10 - 46

PCS 7 PoT Chapter 10 OS and Graphics Design
2.4.2 Using Button to open faceplates PCS 7 provides a number of Dynamic Wizards to assist in configurations. The wizard to open any faceplate of PCS 7 technology blocks is called “Picture selection via measurement point”. You can find the wizard following the illustration of Picture 10.57.
Picture 10.57: The wizard opens faceplates
Following the wizard you can complete the configuration. After the configuration the mouse action is indicated by a green arrow as shown in Picture 10.58.
Picture 10.53: Mouse action configured with C actions
PCS 7 PoT V6.0 | Edition V1.0 | August 2003 Copyright 2003 Siemens AG by A&D AS CS2 PA. All rights reserved.
Page 10 - 47

PCS 7 PoT Chapter 10 OS and Graphics Design
The wizard produces C scripts as copied in Picture 10.59.
Picture 10.59: C actions calling up a faceplate
2.4.3 Check Box The check box is used wherever a multiple choice is required. The user can select one or more fields by selecting the boxes. Refer to Picture 10.60.
PCS 7 PoT V6.0 | Edition V1.0 | August 2003 Copyright 2003 Siemens AG by A&D AS CS2 PA. All rights reserved.
Page 10 - 48
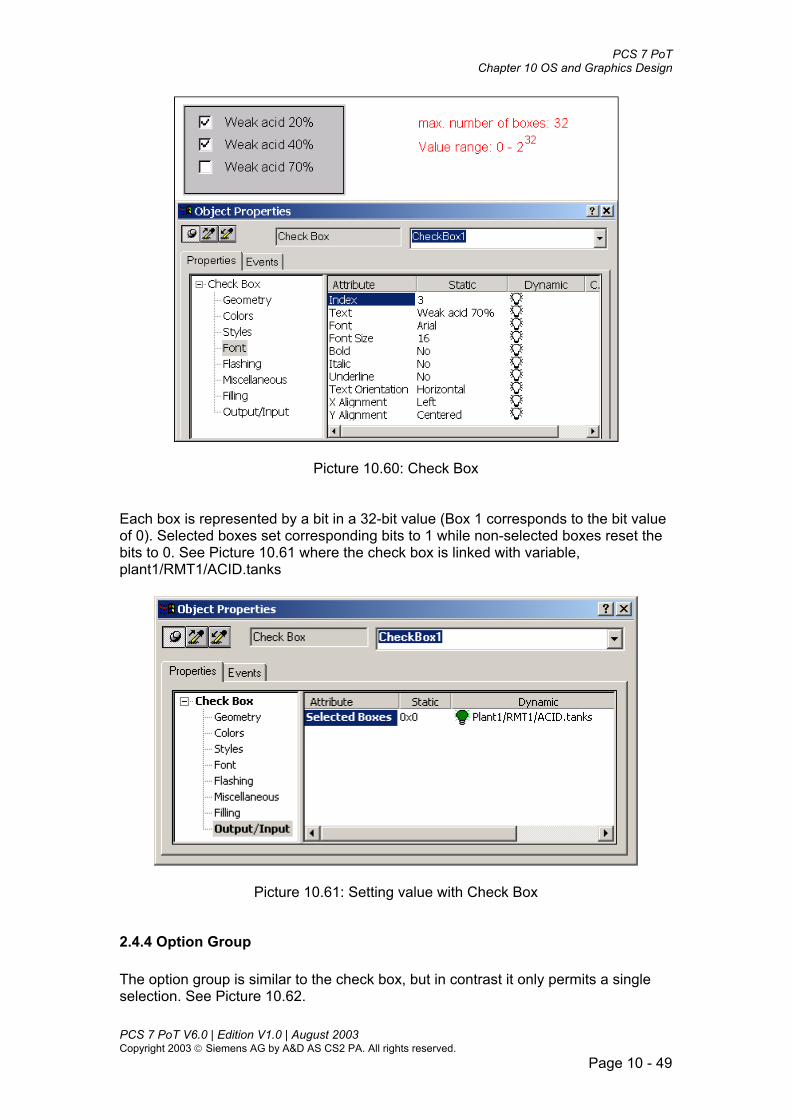
PCS 7 PoT Chapter 10 OS and Graphics Design
Picture 10.60: Check Box Each box is represented by a bit in a 32-bit value (Box 1 corresponds to the bit value of 0). Selected boxes set corresponding bits to 1 while non-selected boxes reset the bits to 0. See Picture 10.61 where the check box is linked with variable, plant1/RMT1/ACID.tanks
Picture 10.61: Setting value with Check Box
2.4.4 Option Group The option group is similar to the check box, but in contrast it only permits a single selection. See Picture 10.62. PCS 7 PoT V6.0 | Edition V1.0 | August 2003 Copyright 2003 Siemens AG by A&D AS CS2 PA. All rights reserved.
Page 10 - 49

PCS 7 PoT Chapter 10 OS and Graphics Design
Picture 10.62: Option Group
2.4.5 Round Button The Round Button is used like the Button for operating process events. However, in contrast to the Button, the Round Button also has a latch down setting for both the “Pressed” and Not pressed” states.
2.5 Making graphics dynamic
2.5.1 Overview There are a number of ways to make graphics dynamic. So far we have discussed tag connections (I/O fields) and mouse actions (e.g. opening a faceplate). Other dynamic links include the Dynamic Dialog, Direct Connection, and C-Action / VBS-Action as outlined in Picture 10.63.
PCS 7 PoT V6.0 | Edition V1.0 | August 2003 Copyright 2003 Siemens AG by A&D AS CS2 PA. All rights reserved.
Page 10 - 50

PCS 7 PoT Chapter 10 OS and Graphics Design
Picture 10.63: Possible dynamic links The WinCC Online Help provides a good explanation on making graphics dynamic. Refer to Picture 10.64.
PCS 7 PoT V6.0 | Edition V1.0 | August 2003 Copyright 2003 Siemens AG by A&D AS CS2 PA. All rights reserved.
Page 10 - 51

PCS 7 PoT Chapter 10 OS and Graphics Design
Picture 10.64: Online Help on configuring actions
2.5.2 Dynamic Dialog Dynamic Dialog provides a convenient way to make attributes dynamic. For example, it is very easy to configure colour changes when various limits are exceeded. See Picture 10.65.
PCS 7 PoT V6.0 | Edition V1.0 | August 2003 Copyright 2003 Siemens AG by A&D AS CS2 PA. All rights reserved.
Page 10 - 52

PCS 7 PoT Chapter 10 OS and Graphics Design
Picture 10.65: Colour changing with Dynamic Dialog
2.5.3 Direct Connection The consequence of configuring a direct link for an event is that when this event occurs during runtime, the value of a source element (Source) is passed to a target element (Target). Sources can be constants, tags, or attributes of picture objects. Targets can be dynamic attributes of objects, dialog boxes, and tags. One application of Direct Connection is to open a picture with a mouse-click as illustrated in Picture 10.66. After clicking the Button Reactor1, the picture Reactor1.pdl displays in the working space of the PCS 7 OS.
PCS 7 PoT V6.0 | Edition V1.0 | August 2003 Copyright 2003 Siemens AG by A&D AS CS2 PA. All rights reserved.
Page 10 - 53

PCS 7 PoT Chapter 10 OS and Graphics Design
Picture 10.66: Direct Connection
2.5.4 C Actions and Global Script Background activities, such as e.g. the daily printout of a report, the monitoring of tags or the execution of picture-independent calculations, are performed by actions in runtime. The start of an action is initiated by a trigger. Actions can call functions. PCS 7 OS has a number of functions some of which can be modified by the user. You can also develop your own functions. The editor "Global Script" is used to create and edit functions and actions. Note For more information on Global Script refer to WinCC online Help. Here we give an example to show how to the script functions. The example is to call up and hide a message window by clicking a button shown in Picture 10.67.
PCS 7 PoT V6.0 | Edition V1.0 | August 2003 Copyright 2003 Siemens AG by A&D AS CS2 PA. All rights reserved.
Page 10 - 54

PCS 7 PoT Chapter 10 OS and Graphics Design
Picture 10.67: An example for C-Action The configuration of the button is illustrated in Pictures 10.68 – 10.74.
Picture 10.68: Configuring the Press left
PCS 7 PoT V6.0 | Edition V1.0 | August 2003 Copyright 2003 Siemens AG by A&D AS CS2 PA. All rights reserved.
Page 10 - 55
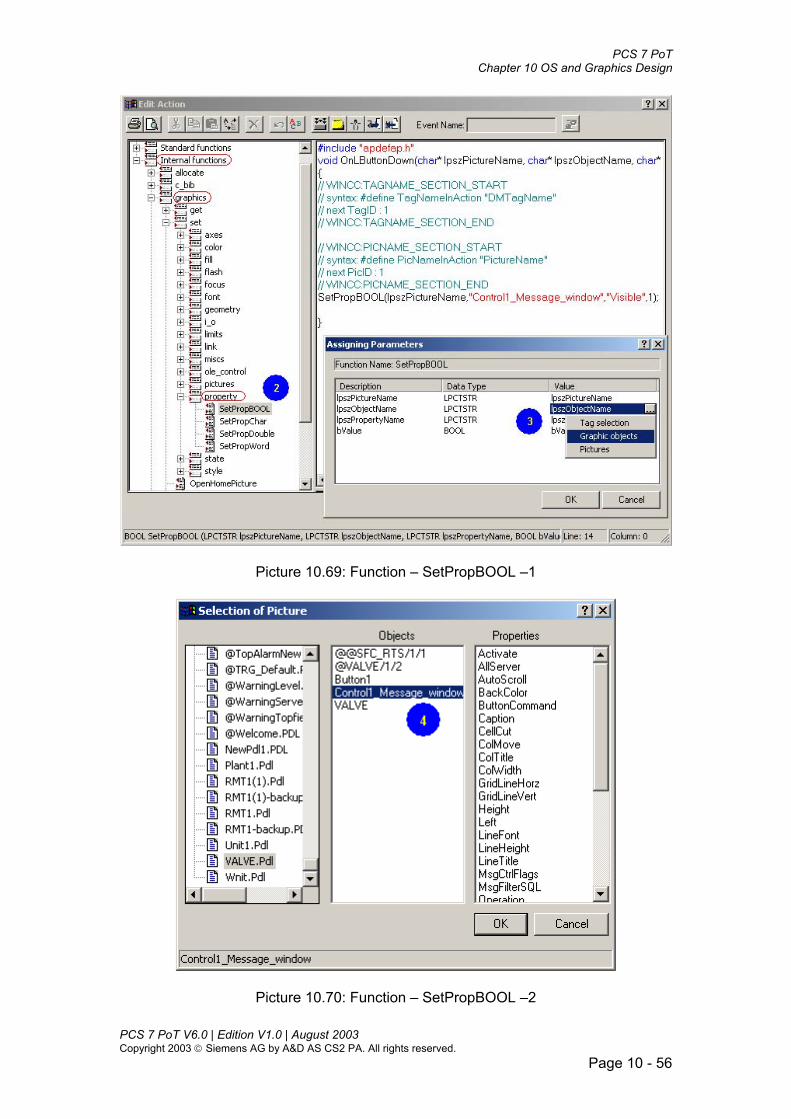
PCS 7 PoT Chapter 10 OS and Graphics Design
Picture 10.69: Function – SetPropBOOL –1
Picture 10.70: Function – SetPropBOOL –2
PCS 7 PoT V6.0 | Edition V1.0 | August 2003 Copyright 2003 Siemens AG by A&D AS CS2 PA. All rights reserved.
Page 10 - 56

PCS 7 PoT Chapter 10 OS and Graphics Design
Picture 10.71: Function – SetPropBOOL –3
PCS 7 PoT V6.0 | Edition V1.0 | August 2003 Copyright 2003 Siemens AG by A&D AS CS2 PA. All rights reserved.
Page 10 - 57

PCS 7 PoT Chapter 10 OS and Graphics Design
Picture 10.72: Function – SetPropBOOL –4
Picture 10.73: Function – SetPropBOOL –5 To hide the message window, you can follow the configuration for the Press left to configure another button action, e.g. the Release right. PCS 7 PoT V6.0 | Edition V1.0 | August 2003 Copyright 2003 Siemens AG by A&D AS CS2 PA. All rights reserved.
Page 10 - 58

PCS 7 PoT Chapter 10 OS and Graphics Design
Note The bvalue in the SetPropBOOL function should be 0 in the Release right. Actions configured in Property Attributes through Dynamic Dialog and C Action have triggers. Refer to Pictures 10.65 and 10.74. However, the triggers of actions configured in Object Events through Direct Connection and C Action are the triggering events themselves. Refer to picture 10.73 where the Event Name is greyed out.
Picture 10.74: Changing action trigger
PCS 7 PoT V6.0 | Edition V1.0 | August 2003 Copyright 2003 Siemens AG by A&D AS CS2 PA. All rights reserved.
Page 10 - 59

PCS 7 PoT Chapter 10 OS and Graphics Design
3. Dynamic Wizard
3.1 Introduction PCS 7 OS provides a number of dynamic wizards. You use them to produce C actions instead of directly programming the C scripts. The wizards are arranged in the following groups:
• System Functions • Standard Dynamics • Import Functions • SFC • Picture Functions
3.2 System Functions In the System Function category, there are mainly four wizards as shown in Picture 10.75.
Picture 10.75: Dynamic Wizard – System Functions
3.2.1 Exit PCS 7 OS via WinCC or Windows With the function, you can configure, for example, a button to exit WinCC or the operating system. With the wizard, you can determine how the operating system or PCS 7 OS is exited. See Picture 10.76.
PCS 7 PoT V6.0 | Edition V1.0 | August 2003 Copyright 2003 Siemens AG by A&D AS CS2 PA. All rights reserved.
Page 10 - 60

PCS 7 PoT Chapter 10 OS and Graphics Design
Picture 10.76: Options for exiting WinCC or Windows
3.2.2 Hardcopy You can configure an action for creating a hard copy of the current screen using the wizard.
3.2.3 Language Switch An action can be created that switches the application language using the wizard.
3.2.4 Start another application With this function, an action can be created that starts another application. During the course of the wizard, you need to indicate the path and name of the application to be started, e.g. C:\Program Files\Microsoft Office\Office\EXCEL.EXE.
3.3 Standard Dynamics In Picture 10.77 all the standard dynamics are listed.
PCS 7 PoT V6.0 | Edition V1.0 | August 2003 Copyright 2003 Siemens AG by A&D AS CS2 PA. All rights reserved.
Page 10 - 61

PCS 7 PoT Chapter 10 OS and Graphics Design
Picture 10.77: Standard Dynamics
3.3.1 Connect picture block to tag structure PCS 7 provides block icons to display the process state in the pictures and to open faceplates. The icons are collected in a system picture called @TEMPLATE as shown in Picture 10.78.
Picture 10.78: Some of PCS 7 block icons The block icons are pre-configured as prototypes as illustrated in Picture 10.79. Prototype objects mean that the member variables have been connected but the block instance or structure (which the variables belong) is not yet known.
PCS 7 PoT V6.0 | Edition V1.0 | August 2003 Copyright 2003 Siemens AG by A&D AS CS2 PA. All rights reserved.
Page 10 - 62

PCS 7 PoT Chapter 10 OS and Graphics Design
Picture 10.79: Prototype objects The wizard “Connect picture block to tag structure” is used to connect a block icon prototype to a specific structure as shown in Picture 10.80.
Picture 10.80: Connecting picture block icon to tag structure
PCS 7 PoT V6.0 | Edition V1.0 | August 2003 Copyright 2003 Siemens AG by A&D AS CS2 PA. All rights reserved.
Page 10 - 63

PCS 7 PoT Chapter 10 OS and Graphics Design
3.3.2 Add dynamics to the prototype and Link a prototype to a structure These two wizards are used for creating the User Defined Object (UDO), which will be discussed later in this chapter.
3.3.3 Move Object With this wizard, a graphic object can be made moving. Refer to Picture 10.81 to see how the wizard works.
Picture 10.81: Moving objects
3.3.4 Operationable if authorised This wizard turns off the message box if insufficient permission occurs. Refer to Picture 10.82.
PCS 7 PoT V6.0 | Edition V1.0 | August 2003 Copyright 2003 Siemens AG by A&D AS CS2 PA. All rights reserved.
Page 10 - 64

PCS 7 PoT Chapter 10 OS and Graphics Design
Picture 10.82: Wizard: Operational if authorised
3.3.5 Setting/Resetting a bit Using the wizard, you can set or reset a bit of a variable. Refer to Picture 10.83.
Picture 10.83: Setting/Resetting a bit of a variable
3.3.6 Setting/Resetting bits Compared to setting and resetting a bit you could set and/or reset multiple bits of a variable. See Picture 10.84. PCS 7 PoT V6.0 | Edition V1.0 | August 2003 Copyright 2003 Siemens AG by A&D AS CS2 PA. All rights reserved.
Page 10 - 65
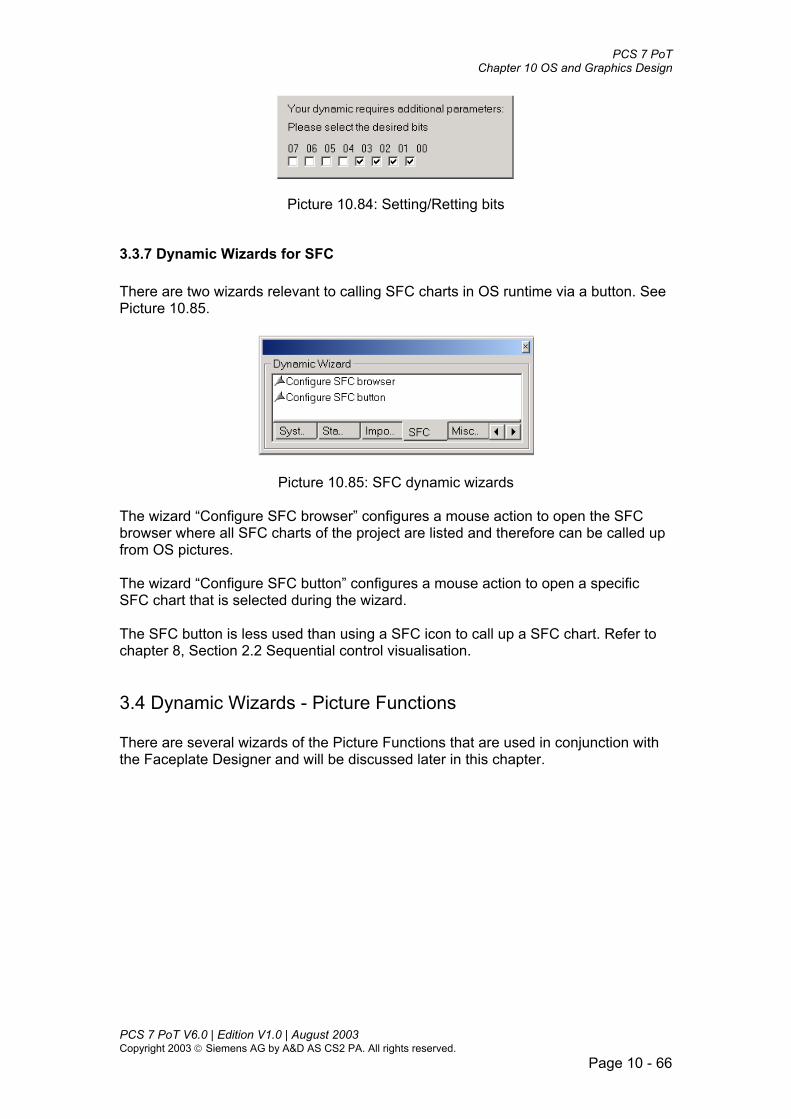
PCS 7 PoT Chapter 10 OS and Graphics Design
Picture 10.84: Setting/Retting bits
3.3.7 Dynamic Wizards for SFC There are two wizards relevant to calling SFC charts in OS runtime via a button. See Picture 10.85.
Picture 10.85: SFC dynamic wizards The wizard “Configure SFC browser” configures a mouse action to open the SFC browser where all SFC charts of the project are listed and therefore can be called up from OS pictures. The wizard “Configure SFC button” configures a mouse action to open a specific SFC chart that is selected during the wizard. The SFC button is less used than using a SFC icon to call up a SFC chart. Refer to chapter 8, Section 2.2 Sequential control visualisation.
3.4 Dynamic Wizards - Picture Functions There are several wizards of the Picture Functions that are used in conjunction with the Faceplate Designer and will be discussed later in this chapter.
PCS 7 PoT V6.0 | Edition V1.0 | August 2003 Copyright 2003 Siemens AG by A&D AS CS2 PA. All rights reserved.
Page 10 - 66
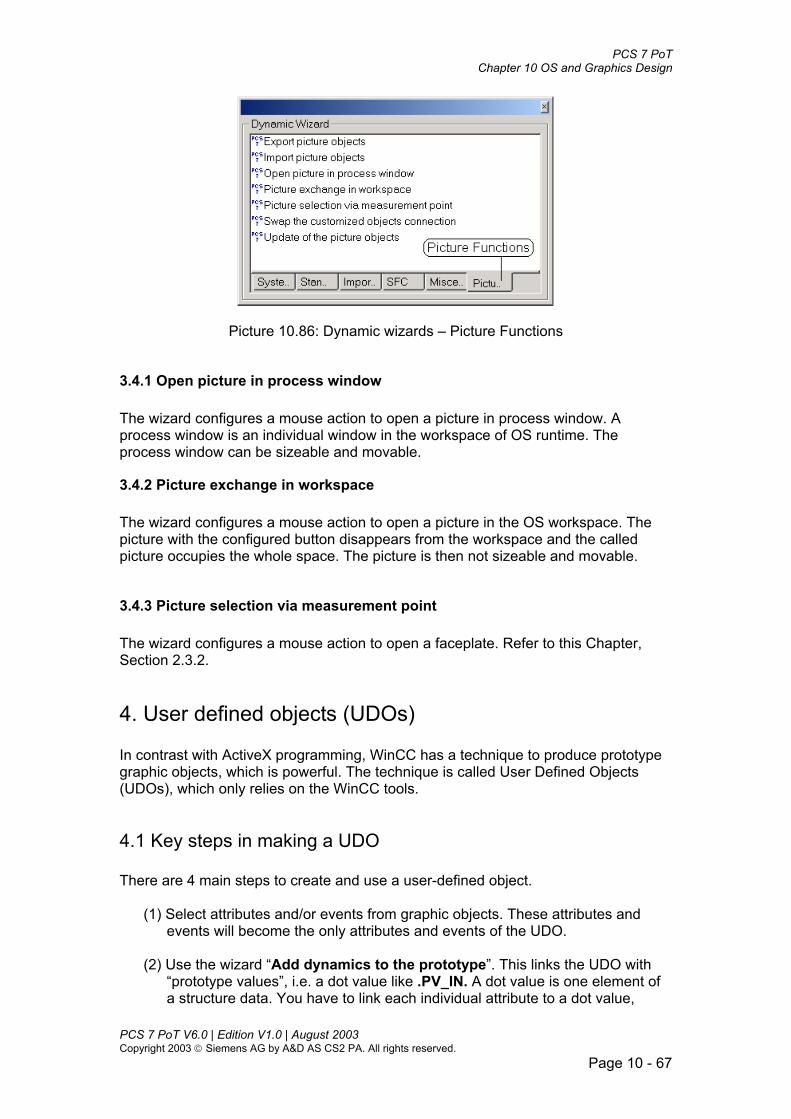
PCS 7 PoT Chapter 10 OS and Graphics Design
Picture 10.86: Dynamic wizards – Picture Functions
3.4.1 Open picture in process window The wizard configures a mouse action to open a picture in process window. A process window is an individual window in the workspace of OS runtime. The process window can be sizeable and movable.
3.4.2 Picture exchange in workspace The wizard configures a mouse action to open a picture in the OS workspace. The picture with the configured button disappears from the workspace and the called picture occupies the whole space. The picture is then not sizeable and movable.
3.4.3 Picture selection via measurement point The wizard configures a mouse action to open a faceplate. Refer to this Chapter, Section 2.3.2.
4. User defined objects (UDOs) In contrast with ActiveX programming, WinCC has a technique to produce prototype graphic objects, which is powerful. The technique is called User Defined Objects (UDOs), which only relies on the WinCC tools.
4.1 Key steps in making a UDO There are 4 main steps to create and use a user-defined object.
(1) Select attributes and/or events from graphic objects. These attributes and events will become the only attributes and events of the UDO.
(2) Use the wizard “Add dynamics to the prototype”. This links the UDO with
“prototype values”, i.e. a dot value like .PV_IN. A dot value is one element of a structure data. You have to link each individual attribute to a dot value,
PCS 7 PoT V6.0 | Edition V1.0 | August 2003 Copyright 2003 Siemens AG by A&D AS CS2 PA. All rights reserved.
Page 10 - 67

PCS 7 PoT Chapter 10 OS and Graphics Design
meaning, use the wizard a number of times to add all dot values required to the UDO.
(3) Store the UDO in a library. When use a UDO, drag it from the library and
placed it onto your pictures.
(4) Use the wizard “Link a prototype to a structure” to link the UDOs to corresponding structures. This links the dot values with the structure name as prefix. You need only to use the wizard once.
4.2 Making a UDO
4.2.1 Preparing objects and graphics for building an UDO In Picture 10.87, objects are placed to build a valve control panel. Pictures to be used for the status display are also shown at the bottom of the picture.
Picture 10.87: Preparing objects and graphics for building the UDO
4.2.2 Starting to create an UDO Select the group of the valve panel. Right click on the group and follow the menu path: Customised Object > Create as illustrated in Picture 10.88.
PCS 7 PoT V6.0 | Edition V1.0 | August 2003 Copyright 2003 Siemens AG by A&D AS CS2 PA. All rights reserved.
Page 10 - 68

PCS 7 PoT Chapter 10 OS and Graphics Design
Picture 10.88: Starting the Customised object
4.2.3 Configuration dialog of UDO After selecting Create in Picture 10.88 the Configuration Dialog Customized object appears. In the dialog, pick up the attributes from the selection and drop them into the UDO object to form the UDO’s attributes. Refer to Pictures 10.89 and 10.90 for more detailed instruction.
Picture 10.89: Forming UDO attributes
PCS 7 PoT V6.0 | Edition V1.0 | August 2003 Copyright 2003 Siemens AG by A&D AS CS2 PA. All rights reserved.
Page 10 - 69

PCS 7 PoT Chapter 10 OS and Graphics Design
Picture 10.90: Completing UDO attributes
4.2.4 Adding dynamics to UDO After leaving the Configuration dialog, the wizard can be started to add dynamics to the UDO. During the wizard, you specify which object property is to be linked to which variable as illustrated in Picture 10.91. You have to run the wizard each time when you want to link a property to a variable. You could directly add the dynamics as shown in Picture 10.91, lower part, which is more efficient if there are many links.
PCS 7 PoT V6.0 | Edition V1.0 | August 2003 Copyright 2003 Siemens AG by A&D AS CS2 PA. All rights reserved.
Page 10 - 70

PCS 7 PoT Chapter 10 OS and Graphics Design
Picture 10.91: Adding dynamics to an UDO 4.2.5 Storing the prototype UDO into a library After adding dynamics to an UDO, the UDO becomes a prototype and it is to be stored in the project library. See Picture 10.92.
Picture 10.92: Storing UDO prototypes
PCS 7 PoT V6.0 | Edition V1.0 | August 2003 Copyright 2003 Siemens AG by A&D AS CS2 PA. All rights reserved.
Page 10 - 71

PCS 7 PoT Chapter 10 OS and Graphics Design
4.2.6 Link a prototype to a structure To use an UDO, drag it out from the library into your process pictures and link it to a tag using the wizard “Link a prototype to a structure” as shown in Picture 10.93.
Picture 10.93: Linking a prototype to a structure
4.2.7 Modifying a UDO You can modify a UDO using the Edit and Configuration Dialog functions shown in Picture 10.94. Afterwards, it is necessary to apply the Finish editing function. Then, the new UDO should be put into the graphic object library to replace the old one.
PCS 7 PoT V6.0 | Edition V1.0 | August 2003 Copyright 2003 Siemens AG by A&D AS CS2 PA. All rights reserved.
Page 10 - 72
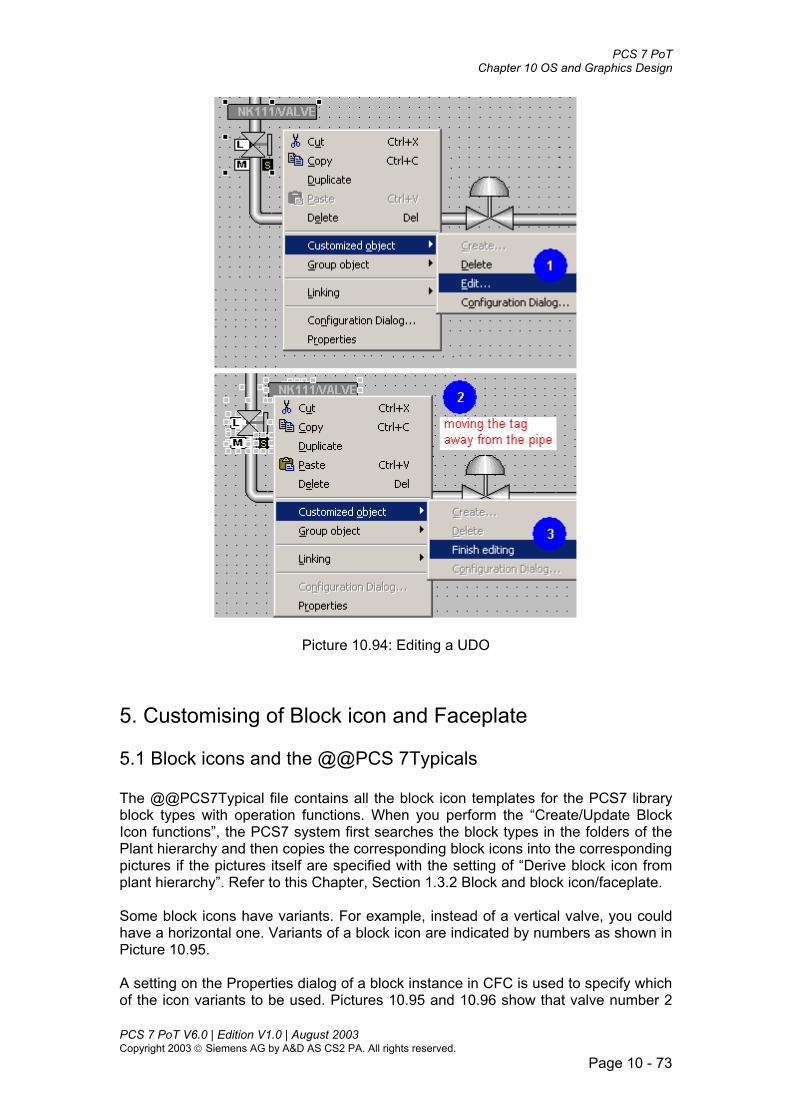
PCS 7 PoT Chapter 10 OS and Graphics Design
Picture 10.94: Editing a UDO
5. Customising of Block icon and Faceplate
5.1 Block icons and the @@PCS 7Typicals The @@PCS7Typical file contains all the block icon templates for the PCS7 library block types with operation functions. When you perform the “Create/Update Block Icon functions”, the PCS7 system first searches the block types in the folders of the Plant hierarchy and then copies the corresponding block icons into the corresponding pictures if the pictures itself are specified with the setting of “Derive block icon from plant hierarchy”. Refer to this Chapter, Section 1.3.2 Block and block icon/faceplate. Some block icons have variants. For example, instead of a vertical valve, you could have a horizontal one. Variants of a block icon are indicated by numbers as shown in Picture 10.95. A setting on the Properties dialog of a block instance in CFC is used to specify which of the icon variants to be used. Pictures 10.95 and 10.96 show that valve number 2
PCS 7 PoT V6.0 | Edition V1.0 | August 2003 Copyright 2003 Siemens AG by A&D AS CS2 PA. All rights reserved.
Page 10 - 73

PCS 7 PoT Chapter 10 OS and Graphics Design
will be used. If there is no specification at a block instance in CFC, the default block icon (variant number 1) for the block type is used.
Picture 10.95: Block icon variants
PCS 7 PoT V6.0 | Edition V1.0 | August 2003 Copyright 2003 Siemens AG by A&D AS CS2 PA. All rights reserved.
Page 10 - 74

PCS 7 PoT Chapter 10 OS and Graphics Design
Picture 10.96: Specifying a block icon variant
5.2 Block icons and @PCS 7Typicals If you want to have your own bock icons, you could have them based on modifying of the standard icons. You modify or create new block icons by starting with saving the @@PCS 7Typical.pdl file as @PCS 7Typicals.pdl. All modifications and customer icons should be made in @PCS 7Typicals.pdl. Note The PCS7 system will first search for the file, @PCS7Typicals.pdl and use the block icons in the file. Only if the file @PCS7Typicals.pdl does not exist PCS 7 will use the block icons from the file @@PCS7Typicals. @@PCS 7Typicals.pdl is used and maintained by the system and could be overwritten because of later system upgrading. @PCS 7Typicals.pdl is designed for use in projects and maintained by users.
5.3 Block icons and @Templates When you want to insert additional block icons manually into pictures, you should use the icons provided in the file, @Templates.
PCS 7 PoT V6.0 | Edition V1.0 | August 2003 Copyright 2003 Siemens AG by A&D AS CS2 PA. All rights reserved.
Page 10 - 75

PCS 7 PoT Chapter 10 OS and Graphics Design
After placing an icon onto a picture, a system dynamic wizard is applied to link the icon to the relevant block instance. Refer to this Chapter, Section 3.3.1 Connect picture block to tag structure. Note @Template.pdl is maintained by the PCS 7 system and could be overwritten because of system upgrading. It is recommended to make a copy of the file and use the copy as a working file.
5.4 Calling up faceplates The most usual way to call up faceplates is to use block icons. Sometimes, you use a button to call up a faceplate. Refer to this Chapter, Section 2.3.2.
6. Designing faceplates with Faceplate Designer
6.1 Tools of Faceplate Designer Faceplate Designer is installed upon installing of PCS 7 V6.0 or higher. Refer to Picture 10.83. When you perform the “Generate” function shown in Picture 10.83, several pictures, e.g. Messages and Standard (in the case of Picture 10.83) and the default pictures, Viewlist and Overview will be generated and connected. Newly generated pictures are empty but connected to each other as a set. You design those empty pictures by using the following tools provided by the Faceplate Designer. (1) Status pictures The pictures are available under the system directory, Siemens\WinCC\Options\pdl\FaceplateDesigner_V6. They are bmp and emf pictures and are mostly used as status display. (2) Template icons Creating block icons could be starting with copying and then modifying the standard block icons provided in @@PCS 7Typicals.pdl and @Template.pdl files. The two template files are also included in the FaceplateDesigner_V6 directory. (3) Object construction kit The WinCC picture, @PCS 7Elements.pdl contains a collection of ready-made objects for creating faceplates, e.g. I/O fields, texts, operating buttons with color changing scheme, combo boxes, and value inputting dialog boxes, etc.
PCS 7 PoT V6.0 | Edition V1.0 | August 2003 Copyright 2003 Siemens AG by A&D AS CS2 PA. All rights reserved.
Page 10 - 76

PCS 7 PoT Chapter 10 OS and Graphics Design
(4) Global scripts There are codes (C-actions and VBS) behind of the icons and construction objects provided by the Faceplate Designer. These codes and called functions are automatically installed upon installing of PCS 7 V6 and higher. When compiling an OS project or explicitly run the Basic Data in the OS Project Editor, the faceplates and the global scripts are copied from the system directory into projects and thus ready for the project to have project-specific faceplates to be created.
Picture 10.97: Faceplate Designer
6.2 An example – Creating faceplate
6.2.1 A user block type Assume that you have a block type and want a faceplate associated with it. Here, a block type called TEST1 will be created. To make it simple, TEST1 block will be modified from the MOTOR block. Step 1: In SIMATIC Manager, Component View, and the Blocks folder, copy the MOTOR block and paste it there. When pasting the MOTOR block, you are promoted
PCS 7 PoT V6.0 | Edition V1.0 | August 2003 Copyright 2003 Siemens AG by A&D AS CS2 PA. All rights reserved.
Page 10 - 77

PCS 7 PoT Chapter 10 OS and Graphics Design
to assign a number to the new block, e.g. FB1101, a number not overlapped with all other blocks in the Blocks folder. Step 2: Assign a symbolic name to FB1101 in the Symbols table. In this example, FB1101 is named as TEST1. Step 3: Open TEST1 in the Block editor by double-clicking it. Add the system attribute, S7_m_c = true, to the following three parameters, MSS, MSS_OFF, and FAULT_OFF. After the three steps, we have a new block type in one of the S7 program(s) of the project.
6.2.2 Creating faceplate views Picture 10.98 shows how to create a new faceplate, which includes naming the type (TEST1), selecting views (standard views are shown), adding new views by More function (e.g. Signals), arranging views in order, and then generate the views.
PCS 7 PoT V6.0 | Edition V1.0 | August 2003 Copyright 2003 Siemens AG by A&D AS CS2 PA. All rights reserved.
Page 10 - 78

PCS 7 PoT Chapter 10 OS and Graphics Design
Picture 10.98: Creating faceplate views
6.2.3 Designing the views The new faceplate, TEST1, will be designed based on MOTOR faceplate. Normally, you begin with copying the standard faceplate views and then modifying them to specification. See Table 10.5.
MOTOR (FB66) TEST1 (FB1101) Editing? @PG_MOTOR_STANDARD.pdl @PG_TEST1_STANDARD.pdl Yes
- @PG_TEST1_SIGNALS.pdl Yes @PG_MOTOR_MAINTAINENCE.pdl @PG_TEST1_MAINTAINENCE.pdl No @PCS 7_alarm.pdl (Messages) @PCS 7_alarm.pdl (Messages) No @PCS 7_batch.pdl - No @PG_motor.pdl @PG_test1.pdl No @PG_MOTOR_VIEWLIST.pdl @PG_TEST1_VIEWLIST.pdl By Generate @PG_MOTOR_OVERVIEW.pdl @PG_TEST1_OVERVIEW.pdl No
Table 10.5: Comparison of faceplates of the two motors
PCS 7 PoT V6.0 | Edition V1.0 | August 2003 Copyright 2003 Siemens AG by A&D AS CS2 PA. All rights reserved.
Page 10 - 79

PCS 7 PoT Chapter 10 OS and Graphics Design
In the standard view of the TEST1 faceplate, the motor status is linked with the VSTATUS variable rather than with individual bits of variables. The layout of the view has been rearranged. See Picture 10.99.
Picture 10.99: Motor and Test1 faceplates (Standard view) After copying a view from the standard faceplate, objects @Level5 and @Level6 will be re-named as Level5 and Level 6 respectively. It is important to name them back as @Level5 and @Level6. The two objects govern the authorisation of operating functions provided with the standard faceplate. Note The authorisation objects should be named as @Level5 and @Level6 respectively in all views of faceplates, especially after copying them. The Signals view is designed as illustrated in Picture 10.100. When linking with variables, use the prototype variables such as the one, “.MSS”. Note It is important to use the “dot” variables in a faceplate as it will be linked to different block instance.
PCS 7 PoT V6.0 | Edition V1.0 | August 2003 Copyright 2003 Siemens AG by A&D AS CS2 PA. All rights reserved.
Page 10 - 80

PCS 7 PoT Chapter 10 OS and Graphics Design
Picture 10.100: The Signals view
6.2.4 Designing block icons Block icons are firstly copied from file, @@PCS 7Typicals.pdl by copying the whole file or only individual block icons to file, @PCS 7Typicals, and modified from the later. To be able to call up Faceplate TEST1, you have to make the settings as shown in Picture 10.101.
PCS 7 PoT V6.0 | Edition V1.0 | August 2003 Copyright 2003 Siemens AG by A&D AS CS2 PA. All rights reserved.
Page 10 - 81

PCS 7 PoT Chapter 10 OS and Graphics Design
Picture 10.101: Type name of block icon
6.2.5 Using a new block type To use or test the block, TEST1, insert it in a CFC chart of a plant hierarchy. Compile the programs and download it to AS. Then, compile the OS with the option “Create/update block icons. Now, you are able to test the new block, TEST1, with its icon and faceplate.
PCS 7 PoT V6.0 | Edition V1.0 | August 2003 Copyright 2003 Siemens AG by A&D AS CS2 PA. All rights reserved.
Page 10 - 82

PCS 7 PoT Chapter 10 OS and Graphics Design
Exercise
Exercise 10.1 Including Status Display
1. The task Status display has been discussed in Section 2.2.4. Design a status display for the stir as discussed in Chapter 7, Exercise 7.1. The stir has 16 statuses. Cartoon pictures are provided for the exercise.
2. Guideline The status tag is FB1211.STIR. Refer to Picture 7.30.
Exercise 10.2 Including Group Display
1. The task There are 3 pictures arranged in hierarchical levels as shown in Picture 10.88.
Picture 10.102: Pictures in hierarchical levels If there is a Valve faceplate on Picture INLET_VALs, design a display scheme using Group Display to locate the valve from any of the other two pictures when the valve is reporting errors.
2. Guideline Insert a Valve block icon in picture INLET_VALs and link the icon to a valve in your project. Open the Picture Tree Manager in WinCC Explorer to arrange the three pictures (Pictures LOAD.pdl and TANK1.pdl could be empty pictures.) into the hierarchical containers.
PCS 7 PoT V6.0 | Edition V1.0 | August 2003 Copyright 2003 Siemens AG by A&D AS CS2 PA. All rights reserved.
Page 10 - 83

PCS 7 PoT Chapter 10 OS and Graphics Design
Picture 10.103: Opening the Picture Tree Manager After inserting the Containers, you could rename them. Pictures are dragged-and-dropped into their containers. Refer to Picture 10.104.
Picture 10.104: Arranging pictures into Containers
PCS 7 PoT V6.0 | Edition V1.0 | August 2003 Copyright 2003 Siemens AG by A&D AS CS2 PA. All rights reserved.
Page 10 - 84

PCS 7 PoT Chapter 10 OS and Graphics Design
Save the picture tree and test your work in OS runtime. Note Before leaving the Picture Tree Manager you have to save the environment. If you move the source of the messages (e.g. a block icon), the Picture Tree Manager has to be opened and saved again to update the links between the pictures.
Exercise 10.3 Making a valve-control UDO
1. The task In the chapter, details of making an UDO are given. Design a valve-displaying panel for NK111. Make the panel an UDO and then use it for the other valves (NK112, NK113, and NK114).
2. Guideline Design a valve panel. An example is shown in Picture 10.74. Refer to Section 4.2 to finish you exercise.
PCS 7 PoT V6.0 | Edition V1.0 | August 2003 Copyright 2003 Siemens AG by A&D AS CS2 PA. All rights reserved.
Page 10 - 85

Chapter 11:
Archiving System


Contents: CHAPTER 11 ARCHIVING SYSTEM................................................................................................1
1. TAG LOGGING.................................................................................................................................1
1.1 TAGS ............................................................................................................................................1 1.2 CYCLES...........................................................................................................................................2 1.3 ARCHIVING TYPE ............................................................................................................................3
1.3.1 Cyclic process value archiving ...............................................................................................3 1.3.2 Acyclic process value archiving..............................................................................................4 1.3.3 Upon change process value archiving ....................................................................................5 1.3.4 Cyclic-selective process value archiving ................................................................................5 1.3.5 Process-controlled process value archiving ...........................................................................6
1.4 FAST AND SLOW ARCHIVES .............................................................................................................6 1.5 CONFIGURING A PROCESS VALUE ARCHIVE .....................................................................................7
1.5.1 Timers .....................................................................................................................................7 1.5.2 Using the Archive Wizard .......................................................................................................8 1.5.3 Setting Tag Properties ..........................................................................................................10 1.5.4 Archive properties.................................................................................................................11
1.6 TREND CONTROL...........................................................................................................................13 1.6.1 Configuring online trend control ..........................................................................................13 1.6.2 Trends in runtime..................................................................................................................14 1.6.3 Online trending.....................................................................................................................15
1.7 FUNCTION TREND CONTROL..........................................................................................................16 1.8 TABLE CONTROL ...........................................................................................................................17
2. MESSAGES ......................................................................................................................................17
2.1 PCS 7 MESSAGES ..........................................................................................................................17 2.1.1 PCS 7 and the Alarm Logging editor....................................................................................17 2.1.2 Loop-in-alarm.......................................................................................................................21 2.1.3 Message settings in PCS 7 ....................................................................................................22
2.2 MESSAGE CONCEPTS .....................................................................................................................22 2.2.1 Single Message and Group Message ....................................................................................22 2.2.2 Message Classes and Message Types ...................................................................................23 2.2.3 Message Event and Message Status......................................................................................24 2.2.4 Acknowledgment Philosophy ................................................................................................24 2.2.5 Initial Value Message and New Value Message ...................................................................25 2.2.6 Acknowledgment Tag............................................................................................................25 2.2.7 Message Blocks.....................................................................................................................25 2.2.8 Message control....................................................................................................................26 2.2.9 Message Line ........................................................................................................................26 2.2.10 Message Archiving..............................................................................................................27
2.3 CONFIGURING MESSAGE DISPLAY .................................................................................................29 2.3.1 Alarm Control .......................................................................................................................29 2.3.2 Selection of message blocks and classes...............................................................................30 2.3.3 Configuring message line .....................................................................................................31 2.3.4 Message selection via texts ...................................................................................................32
2.4 CONFIGURING MESSAGES IN WINCC ............................................................................................32 2.5 CONFIGURING THE HORN..............................................................................................................37
3. DATA EXCHANGE USING WINCC STORAGEPLUS..............................................................39
4. CENTRAL ARCHIVING SERVER...............................................................................................39
4.1 ARCHITECTURE AND PRINCIPLES...................................................................................................39 4.2 CONFIGURING A CENTRAL ARCHIVE SERVER.................................................................................40
EXERCISE............................................................................................................................................41
EXERCISE 11.1 INCLUDING TRENDS AND TABLE IN PLANT PICTURES...................................................41

EXERCISE 11.2 SORTING MESSAGES BY TEXTS....................................................................................41

PCS 7 PoT Chapter 11 Archiving system
Chapter 11 Archiving System Process data of various types (values, limits, texts, and messages, etc.) are not only for display and being manipulated in runtime, but also to be stored and archived for long-term analysis and evaluation offline. The functions of Tag Logging and Alarm Logging are to acquire data from the AS and prepare them to be archived for data storage and analysis purposes. So far, we have process data located in an OS server visibly under the directory of the Tag Management of WinCC. Those data are directly communicating with ASs and thus referred to as runtime data. Messages configured in AS engineering (with CFC) are transferred into the Alarm Logging Editor and can be archived there. Process values have to be explicitly pulled into the Tag Logging editor to be archived.
1. Tag logging
1.1 Tags Tags are a useful concept. They are used in SIMATIC Manager and WinCC as a media distributed by database manager throughout the system. We also refer to a valve controller or PID controller as a tag. Tags can represent values, internal calculations, limits, link results or simply system events such as time, mouse or keyboard use, etc. Tags are divided into the following types: external tags and internal tags. Picture 11.1 shows the different tags. External tags are used for acquiring process data or process values. Internal tags are used for acquiring system values and states.
PCS 7 PoT V6.0 | Edition V1.0 | August 2003 Copyright 2003 Siemens AG by A&D AS CS2 PA. All rights reserved.
Page 11 - 1

PCS 7 PoT Chapter 11 Archiving system
Picture 11.1: Tags
1.2 Cycles Selected external tags (except the raw data type) can be logged or archived into the Tag Logging system cyclically. Tag Logging has two different timer systems, one for acquisition data and the other for the displaying/archiving data. Acquisition cycles or timers are time intervals in which values are acquired by the Tag Logging system from the process image. Archiving cycles or timers are the time intervals in which the data are loaded for applications, e.g. for display. The archiving cycle is always an integer multiple of the set acquisition cycle. Picture 11.2 shows the data flow from AS to OS and the cycles.
PCS 7 PoT V6.0 | Edition V1.0 | August 2003 Copyright 2003 Siemens AG by A&D AS CS2 PA. All rights reserved.
Page 11 - 2

PCS 7 PoT Chapter 11 Archiving system
Picture 11.2: Online data and logging data
1.3 Archiving type Archiving methods explain how to save the process data acquired for the OS and how to edit the data if it is further required. Data archiving is controlled through a combination of events and cycles. There are 5 archiving types. • Cyclic process value archiving, which is used for tag / measurement values. • Acyclic process value archiving, which is used to capture the current value when
the corresponding, configured event occurs. • Upon change process value archiving, which is used for binary process values. • Cyclic-selective process value archiving, which combines the event control with
cyclic continuous archiving. • Process-controlled archiving, which is used for message frames.
1.3.1 Cyclic process value archiving It is recommended to archive process data using the cyclic process value arching method. Cyclic process value archiving begins when runtime is started. The process values are acquired in constant time cycles and are stored in the archive database. Cyclic process value archiving ends when runtime is ended.
PCS 7 PoT V6.0 | Edition V1.0 | August 2003 Copyright 2003 Siemens AG by A&D AS CS2 PA. All rights reserved.
Page 11 - 3

PCS 7 PoT Chapter 11 Archiving system
Picture 11.3: Cyclic process value archiving The process tags in WinCC (B) correspond to a particular process value in the memory of one of the connected automation systems (A). The acquisition cycle (1) governs when the process value is read out from the memory of the connected automation system. The runtime component of the archive system (C) processes the process value:
• Whether the process value is archived at all depends on the way you have configured the system. For example, it may be the case that the process value has to change by a certain amount or percentage (2).
• The archiving function (3) determines how the acquired process values are to be processed (e.g. averaging).
The archiving cycle (4) determines when the processed process value is written to the archive database (D).
1.3.2 Acyclic process value archiving Acyclic process value archiving saves the current process value in the archive database in runtime on the occurrence of a Start event, or when there is a change in the value of the process tag. Acyclic process value archiving ends when runtime is ended.
Picture 11.4: Acyclic process value archiving
PCS 7 PoT V6.0 | Edition V1.0 | August 2003 Copyright 2003 Siemens AG by A&D AS CS2 PA. All rights reserved.
Page 11 - 4

PCS 7 PoT Chapter 11 Archiving system
The process tags in WinCC (B) correspond to a particular process value in the memory of one of the connected automation systems (A). When the Start event occurs (1) or when there is a change in the value of the process tag, the process value is read out from the memory of the connected automation system (2). The runtime component of the archive system (C) processes the process value:
• Whether the process value is archived at all depends on the way you have configured the system. For example, it may be the case that the process value has to change by a certain amount or percentage (3).
The actual value of the process value is then written to the archive database (D) (4).
1.3.3 Upon change process value archiving Upon change archiving is similar to the acyclic archiving expect that no Start event (the Step (1) in Picture 11.4) is required.
1.3.4 Cyclic-selective process value archiving Cyclic-selective process value archiving begins in runtime with the occurrence of a Start event. The process values are acquired in constant time cycles after the start and are stored in the archive database. Cyclic process value archiving ends either with the occurrence of a Stop event or when runtime is ended. When a Stop event occurs, the most recently acquired process value is also archived.
Picture 11.5: Cyclic-selective process value archiving
The process tags in WinCC (B) correspond to a particular process value in the memory of one of the connected automation systems (A). Process value archiving begins on the occurrence of the Start event (1). The acquisition cycle (2) governs when the process value is read out from the memory of the connected automation system. The runtime component of the archive system (C) processes the process value:
• Whether the process value is archived at all depends on the way you have configured the system. For example, it may be the case that the process value has to change by a certain amount or percentage (3).
PCS 7 PoT V6.0 | Edition V1.0 | August 2003 Copyright 2003 Siemens AG by A&D AS CS2 PA. All rights reserved.
Page 11 - 5
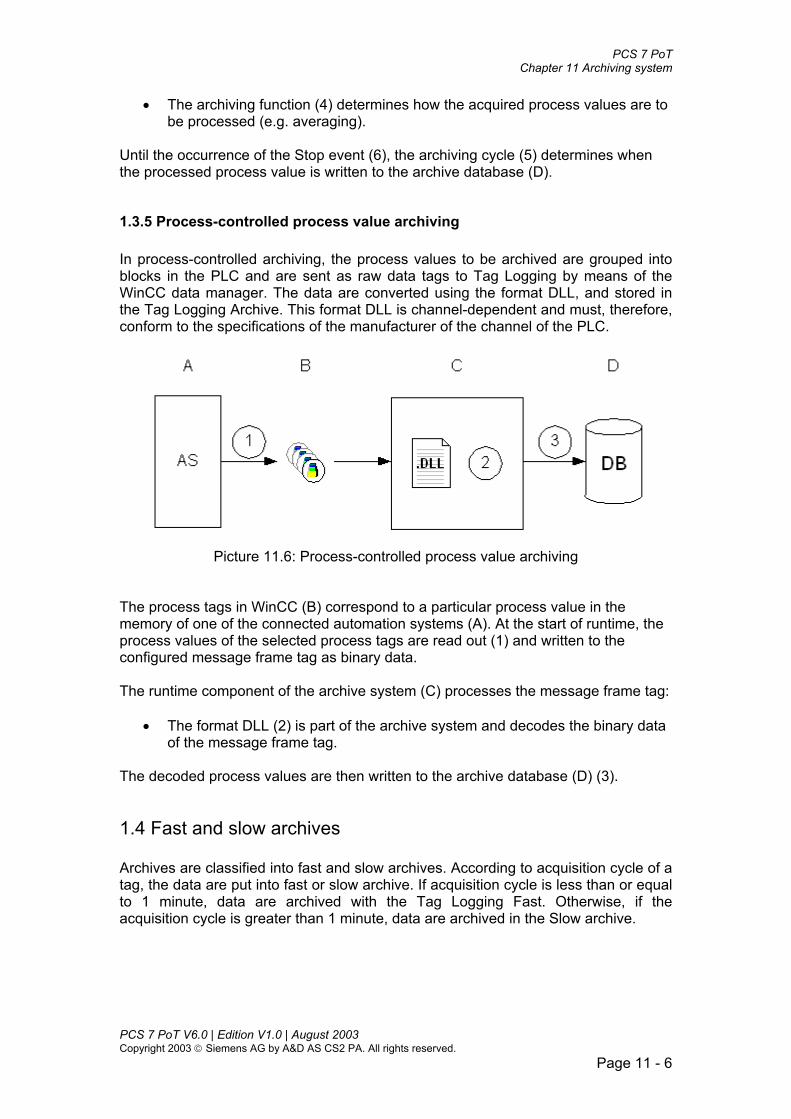
PCS 7 PoT Chapter 11 Archiving system
• The archiving function (4) determines how the acquired process values are to be processed (e.g. averaging).
Until the occurrence of the Stop event (6), the archiving cycle (5) determines when the processed process value is written to the archive database (D).
1.3.5 Process-controlled process value archiving In process-controlled archiving, the process values to be archived are grouped into blocks in the PLC and are sent as raw data tags to Tag Logging by means of the WinCC data manager. The data are converted using the format DLL, and stored in the Tag Logging Archive. This format DLL is channel-dependent and must, therefore, conform to the specifications of the manufacturer of the channel of the PLC.
Picture 11.6: Process-controlled process value archiving
The process tags in WinCC (B) correspond to a particular process value in the memory of one of the connected automation systems (A). At the start of runtime, the process values of the selected process tags are read out (1) and written to the configured message frame tag as binary data. The runtime component of the archive system (C) processes the message frame tag:
• The format DLL (2) is part of the archive system and decodes the binary data of the message frame tag.
The decoded process values are then written to the archive database (D) (3).
1.4 Fast and slow archives Archives are classified into fast and slow archives. According to acquisition cycle of a tag, the data are put into fast or slow archive. If acquisition cycle is less than or equal to 1 minute, data are archived with the Tag Logging Fast. Otherwise, if the acquisition cycle is greater than 1 minute, data are archived in the Slow archive.
PCS 7 PoT V6.0 | Edition V1.0 | August 2003 Copyright 2003 Siemens AG by A&D AS CS2 PA. All rights reserved.
Page 11 - 6

PCS 7 PoT Chapter 11 Archiving system
Picture 11.7: Configuring process value archive
1.5 Configuring a process value archive
1.5.1 Timers You can set different timers (cycles) for the Tag Logging archiving system. Follow the illustration on Picture 11.6 to set system timers.
PCS 7 PoT V6.0 | Edition V1.0 | August 2003 Copyright 2003 Siemens AG by A&D AS CS2 PA. All rights reserved.
Page 11 - 7

PCS 7 PoT Chapter 11 Archiving system
Picture 11.8: Setting timers for acquisition and archiving
1.5.2 Using the Archive Wizard The Archive Wizard is used to assist in the creation of process value archives. Following the wizard you can name the archive and select which tags are to be archived as shown in Pictures 11.9 and 11.10.
PCS 7 PoT V6.0 | Edition V1.0 | August 2003 Copyright 2003 Siemens AG by A&D AS CS2 PA. All rights reserved.
Page 11 - 8

PCS 7 PoT Chapter 11 Archiving system
Picture 11.9: The Archive Wizard
Picture 11.10: Getting the tags from the Data Manager
PCS 7 PoT V6.0 | Edition V1.0 | August 2003 Copyright 2003 Siemens AG by A&D AS CS2 PA. All rights reserved.
Page 11 - 9

PCS 7 PoT Chapter 11 Archiving system
1.5.3 Setting Tag Properties After selecting tags for archiving, you have to specify tag Properties such as acquisition type, acquisition cycle, archiving cycle, and processing method (store mean value or actual value, etc.). Some settings are demonstrated in Picture 11.9. In Picture 11.9, settings for analog values are illustrated. Similarly, you could specify properties for binary data.
Picture 11.11: Tag Properties There is another place where you could specify tag properties. Menu path: Right click on any row of a tag and select the Properties. Refer to Picture 11.10.
PCS 7 PoT V6.0 | Edition V1.0 | August 2003 Copyright 2003 Siemens AG by A&D AS CS2 PA. All rights reserved.
Page 11 - 10

PCS 7 PoT Chapter 11 Archiving system
Picture 11.12: Archive Tag tab of the Tag Properties dialog You could explore more functions by checking with the other tabs (Parameters, Display, and Events) of the Properties dialog.
1.5.4 Archive properties After creating archives using the archive wizard, you can further define the archive properties. The Properties dialog opens by right-clicking an archive, e.g. FC111 as in Picture 11.9, and then selecting Properties. The dialog window opens as in Picture 11.11.
PCS 7 PoT V6.0 | Edition V1.0 | August 2003 Copyright 2003 Siemens AG by A&D AS CS2 PA. All rights reserved.
Page 11 - 11

PCS 7 PoT Chapter 11 Archiving system
Picture 11.13: Properties of process value archive In the archive Properties dialog, we set the Memory location to “On the hard disk”. Refer to Picture 11.11.
Picture 11.14: Defining archive mode
PCS 7 PoT V6.0 | Edition V1.0 | August 2003 Copyright 2003 Siemens AG by A&D AS CS2 PA. All rights reserved.
Page 11 - 12

PCS 7 PoT Chapter 11 Archiving system
1.6 Trend control Archiving jobs are executed in the background of OS moving data between AS and OS database. Archived data can also be displayed on process pictures using trend control and table control. In the trend control, you could have Online Trend Control and Function Trend Control.
Online Trend Control – displaying of process values over time • • Function Trend Control – displaying of the relation between two process
values
1.6.1 Configuring online trend control The online trend control is an object in the Graphics Designer. A pictures 11.15 and 11.16 show how to configure trends.
Picture 11.15: Properties of Trend control
PCS 7 PoT V6.0 | Edition V1.0 | August 2003 Copyright 2003 Siemens AG by A&D AS CS2 PA. All rights reserved.
Page 11 - 13

PCS 7 PoT Chapter 11 Archiving system
Picture 11.16: Properties of Trend Control – linking curve with data
1.6.2 Trends in runtime Picture 11.17 shows an example of trend window in runtime. Instead of including a trend ActiveX in a plant picture, a button can be designed to open the trend window. In Picture 11.17 the button is configured with an icon picture, mouse action to call up the trend window, and ToolTip. The ToolTip is useful as it shows the archive name, acquisition cycle, archiving cycle, and the depth of the archive. There are also functions used in runtime. For example, you are able to display the variable name by right clicking on the variable, recede into historian data, and display value using the reading line, etc. All changes made in runtime can be stored within the runtime system or added to the configuration properties. See Picture 11.17.
PCS 7 PoT V6.0 | Edition V1.0 | August 2003 Copyright 2003 Siemens AG by A&D AS CS2 PA. All rights reserved.
Page 11 - 14

PCS 7 PoT Chapter 11 Archiving system
Picture 11.17 Trends in runtime
1.6.3 Online trending If you want to view trends which are not configured you can build a trend window in runtime or online. WinCC provides a Button in the Key Set with which you can call up the online trend window and then select which variables you want to display. See Picture 11.18.
PCS 7 PoT V6.0 | Edition V1.0 | August 2003 Copyright 2003 Siemens AG by A&D AS CS2 PA. All rights reserved.
Page 11 - 15

PCS 7 PoT Chapter 11 Archiving system
Picture 11.18: Online trend control
1.7 Function trend control For the graphical presentation of tags, the Function Trend Control feature of WinCC provides the option to display tag values as a function of another tag. For instance temperature trends can be displayed as a function of pressure. At the same time trends can be compared with an ideal trend. The following prerequisites apply to displaying trends in the Function Trend Control:
• A number of trends (about 80 trends) can be displayed in a WinCC Function Trend Control. However, we recommend configuring a maximum of 8 trends.
• Trends can be based on online tags, archive tags or data from user archives. • The online tags in a trend must have the same updating cycle. • The archive tags in a trend must originate from a process value archive on a
server, have the same updating cycle and be acquired in a continuous cycle. • Ideal trends can be based on data from user archives. • Tags can only be displayed as a function of time and of another value.
PCS 7 PoT V6.0 | Edition V1.0 | August 2003 Copyright 2003 Siemens AG by A&D AS CS2 PA. All rights reserved.
Page 11 - 16

PCS 7 PoT Chapter 11 Archiving system
Picture 11.19: Function trend control The number of trend values that can be displayed on the screen is limited by the screen resolution and selected size of the trend window. Therefore, when displaying trends, it is possible that there are fewer values displayed in the trend window than are actually archived.
1.8 Table control Similar to the ActiveX trend control, WinCC also provides an ActiveX for displaying process values in tables. However, only data of the archive source can be used in Table control. Online data cannot be displayed in the Table control. 2. Messages
2.1 PCS 7 messages
2.1.1 PCS 7 and the Alarm Logging editor In PCS 7 systems (compared to the WinCC used as SCADA systems), the alarms/messages are pre-defined in the CFC and imported into the Alarm Logging Editor when compiling OS. The following picture shows the Alarm Logging Editor and messages that have been imported. Messages transferred are those containing plant hierarchy.
PCS 7 PoT V6.0 | Edition V1.0 | August 2003 Copyright 2003 Siemens AG by A&D AS CS2 PA. All rights reserved.
Page 11 - 17

PCS 7 PoT Chapter 11 Archiving system
Picture 11.20: AS messages in Alarm Logging Message numbers between 1,000,000 and around 700,000,000 (depending on how many ASs are connected to the OS) are used by the system and are not configurable. If you need to configure messages in Alarm logging additionally to the messages compiled from SIMATIC Manager you can use the messages numbers between 1 and 1,000,000. See Picture 11.21.
PCS 7 PoT V6.0 | Edition V1.0 | August 2003 Copyright 2003 Siemens AG by A&D AS CS2 PA. All rights reserved.
Page 11 - 18

PCS 7 PoT Chapter 11 Archiving system
Picture 11.21: Possibility of creating messages in Alarm Logging editor The system records the messages from the automation system and enters them in chronological order into the message database. These messages can be displayed in various message lists in the message window of the OS runtime. Those message lists are described in Picture 11.20. Note Messages have to be further grouped into “smaller” displaying windows. The system message lists display all messages. For example, the incoming message window lists all incoming messages of a process. Sometimes the number of incoming messages is huge. You could filter the incoming messages with criteria. For example, messages of the same priority, messages of the same type, messages of certain origins, and messages of certain texts, etc. could be listed in separate windows. These are smaller windows and make the process screens more readable. Examples will be given later in the chapter to show how messages are sorted.
PCS 7 PoT V6.0 | Edition V1.0 | August 2003 Copyright 2003 Siemens AG by A&D AS CS2 PA. All rights reserved.
Page 11 - 19

PCS 7 PoT Chapter 11 Archiving system
Picture 11.22: Message list Functions within the message window include navigating messages and sorting messages, etc. These functions are described in Pictures 11.22 and 11.23.
PCS 7 PoT V6.0 | Edition V1.0 | August 2003 Copyright 2003 Siemens AG by A&D AS CS2 PA. All rights reserved.
Page 11 - 20

PCS 7 PoT Chapter 11 Archiving system
Picture 11.23: Function icons on the message window
2.1.2 Loop-in-alarm Using the “loop-in-alarm” function, you can quickly toggle from a message list to the picture or faceplate where the message is from. See Picture 11.24.
Picture 11.24: Loop-in-alarm Loop-in-alarm function is set in PCS 7 by default to open the picture where a block icon is located. The default setting can be viewed in the Component List Editor. If you want Loop-in-alarm function to link with another picture, you can do so in the Component List Editor. See Picture 11.25.
PCS 7 PoT V6.0 | Edition V1.0 | August 2003 Copyright 2003 Siemens AG by A&D AS CS2 PA. All rights reserved.
Page 11 - 21

PCS 7 PoT Chapter 11 Archiving system
Picture 11.25: Component List Editor and Loop-in-alarm
2.1.3 Message settings in PCS 7 Message settings in PCS 7 are determined in the following three places.
OS Project Editor – settings for general layout and format • • •
Alarm logging editor – for customization and creating new messages Component List Editor – for configuring loop-in-alarm pictures
The PCS 7 default settings for messages are normally kept without customization. However, the following section discusses how to create messages for the purpose of better understanding of the default messages.
2.2 Message concepts
2.2.1 Single Message and Group Message In Alarm Logging, a distinction is made between two message forms: single messages and group messages. With single messages, every event is assigned a message. Group messages are used to group multiple single messages. As a result, the events associated with the single messages only trigger the common group message. One group message can be set up for each message class and message type. In addition, group messages can also be created by combining single messages.
PCS 7 PoT V6.0 | Edition V1.0 | August 2003 Copyright 2003 Siemens AG by A&D AS CS2 PA. All rights reserved.
Page 11 - 22
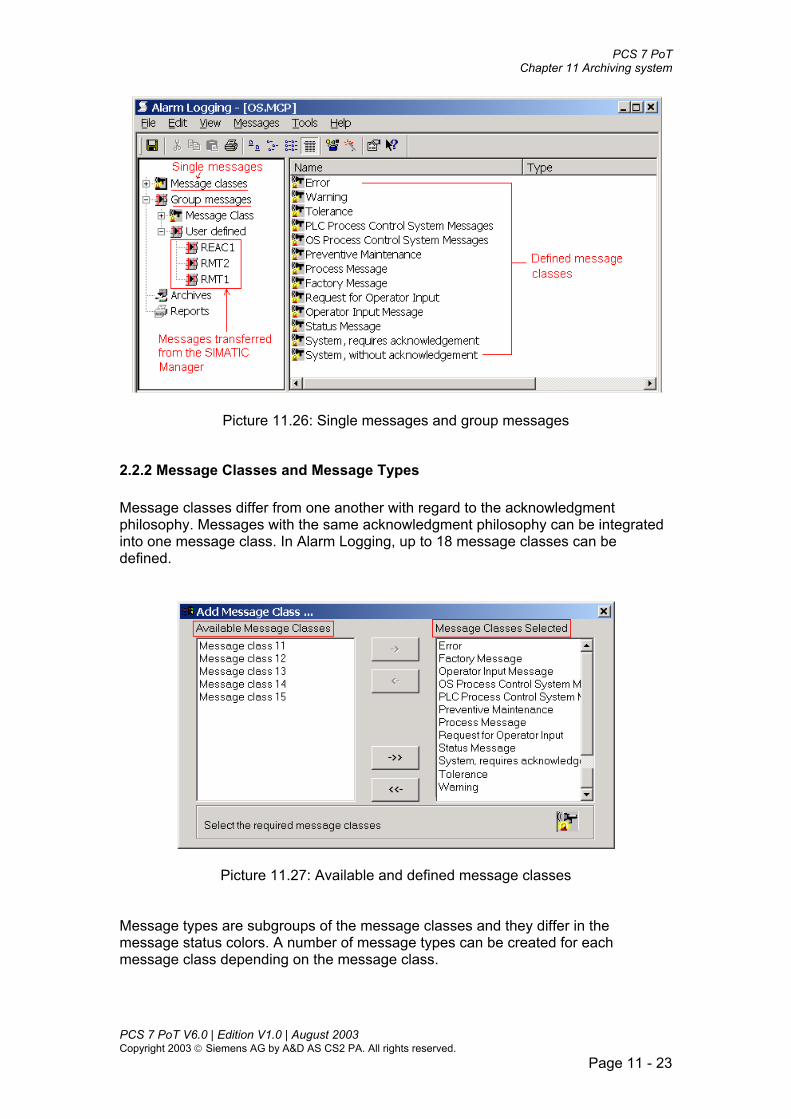
PCS 7 PoT Chapter 11 Archiving system
Picture 11.26: Single messages and group messages
2.2.2 Message Classes and Message Types Message classes differ from one another with regard to the acknowledgment philosophy. Messages with the same acknowledgment philosophy can be integrated into one message class. In Alarm Logging, up to 18 message classes can be defined.
Picture 11.27: Available and defined message classes
Message types are subgroups of the message classes and they differ in the message status colors. A number of message types can be created for each message class depending on the message class.
PCS 7 PoT V6.0 | Edition V1.0 | August 2003 Copyright 2003 Siemens AG by A&D AS CS2 PA. All rights reserved.
Page 11 - 23

PCS 7 PoT Chapter 11 Archiving system
Picture 11.28: Available and selected message types for the Warning class
2.2.3 Message Event and Message Status Message events mean the "Arrival", "Clearance" and "Acknowledgment". All message events are stored in the message archive. There are then corresponding message states, namely "came in", "Went out" and "Acknowledged".
2.2.4 Acknowledgment Philosophy Acknowledgment philosophy is the way in which a message is displayed and processed from the time it "comes in" until it "goes out". In Alarm Logging, the following acknowledgment philosophies can be implemented:
• Single message without acknowledgment • Single message with "Came in" acknowledgment • Single message with "Went out" acknowledgment • Initial value message with single acknowledgment • New value message with single acknowledgment • New value message with dual mode acknowledgment • Message without "Went out" status without acknowledgment • Message without "Went out" status with acknowledgment
The possibilities of the acknowledgment philosophy are also shown in Picture 11.29.
PCS 7 PoT V6.0 | Edition V1.0 | August 2003 Copyright 2003 Siemens AG by A&D AS CS2 PA. All rights reserved.
Page 11 - 24

PCS 7 PoT Chapter 11 Archiving system
Picture 11.29: Acknowledgment Philosophy
2.2.5 Initial Value Message and New Value Message The term "initial value message" is used to describe a form of message processing in which the first message - from a list of messages - undergoing a status change since the last acknowledgment is highlighted. Refer to the yellow-boarded texts in Picture 11.29. The term "new value message" is used to describe a form of message processing in which those messages - from a list of messages - undergoing a status change since the last acknowledgment is highlighted.
2.2.6 Acknowledgment Tag In the acknowledgment tags, the "acknowledgment status" of a message is stored. Via the acknowledgment tag it is also possible to control a central signaling device. Refer to the green-boarded texts in Picture 11.29.
2.2.7 Message Blocks In runtime, the status change of a message is displayed in a message line. The information to be displayed in the message line is defined via message blocks. There are three different message block types:
• System blocks (e.g. date, time, duration, comment, ...) indicate predefined information. With system blocks, the value of the message block (e.g. the time) is displayed in the message line.
• User text blocks allow the assignment of up to ten definable texts to one message. With user text blocks, the content of the block is displayed in the message line.
• Process value blocks, the values of tags can be displayed in the message line. The formatting used can be defined. With process value blocks, the tag value defined is displayed in the message line.
PCS 7 PoT V6.0 | Edition V1.0 | August 2003 Copyright 2003 Siemens AG by A&D AS CS2 PA. All rights reserved.
Page 11 - 25

PCS 7 PoT Chapter 11 Archiving system
2.2.8 Message control In runtime, the status changes of messages are output in a message window. The appearance and operating possibilities of the message window can be freely defined in the Graphics Designer using the Alarm control ActiveX. See Picture 11.30.
Picture 11.30: Alarm Control ActiveX Depending on the source of the messages displayed, a distinction is made between three types of message windows.
• Message Window, which is used for displaying currently pending messages.
• Short-Term Archive Window, which is used for displaying messages that are stored in short-term archives.
• Long-Term Archive Window, which is used for displaying messages that are stored in long-term archives.
• Lock List Window, not relevant to PCS 7 systems.
2.2.9 Message Line In a message window, each message is displayed in a separate message line. The content of the message line depends on the message blocks selected. Each selected message block forms a column in the message line. Picture 11.31 shows how to form a message line.
PCS 7 PoT V6.0 | Edition V1.0 | August 2003 Copyright 2003 Siemens AG by A&D AS CS2 PA. All rights reserved.
Page 11 - 26

PCS 7 PoT Chapter 11 Archiving system
Picture 11.31: Message line
2.2.10 Message Archiving For short-term archives, the archive size is determined by the number of messages to be archived. If the maximum number of messages that can be archived is reached, the oldest messages are overwritten. The message archives are located under the Archive folder in Alarm Logging as shown in Picture 11.32.
Picture 11.32: Message archive types
To configure a Short-Term archive, you specify the number of message entries in the archive. Refer to Picture 11.33.
PCS 7 PoT V6.0 | Edition V1.0 | August 2003 Copyright 2003 Siemens AG by A&D AS CS2 PA. All rights reserved.
Page 11 - 27

PCS 7 PoT Chapter 11 Archiving system
Picture 11.33: Short-term message archive For long-term archives, the archive size is determined by the time span over which the messages are to be archived or the maximum size specified. See Picture 11.34.
Picture 11.34: Archiving messages You also have the option to create copies of the messages archive as shown in Picture 11.35. PCS 7 PoT V6.0 | Edition V1.0 | August 2003 Copyright 2003 Siemens AG by A&D AS CS2 PA. All rights reserved.
Page 11 - 28

PCS 7 PoT Chapter 11 Archiving system
Picture 11.35: Backing-up the message archive
2.3 Configuring message display
2.3.1 Alarm Control WinCC provides an ActiveX for setting and displaying message windows. Refer to Picture 11.36 where basic handling of a message window is shown.
Picture 11.36: WinCC Alarm Control
PCS 7 PoT V6.0 | Edition V1.0 | August 2003 Copyright 2003 Siemens AG by A&D AS CS2 PA. All rights reserved.
Page 11 - 29

PCS 7 PoT Chapter 11 Archiving system
2.3.2 Selection of message blocks and classes A large number of messages happen while systems are running. It may not be convenient to view messages using the system message windows (These windows are called up from the OS keys. See Picture 11.22). You can arrange messages in different windows according to message classes, message types, message texts, process areas, and message origins, etc. In practice, these windows with selected messages are called up giving meaningful information in a relatively short list. Refer to the note in Section 3.1. Picture 11.35 shows the Specify Selection dialog, which is called up from Alarm Control Properties dialog. Actually the dialog could be called up from many places where messages are to be selected.
Picture 11.37: Message selection using the Specify Selection dialog In Picture 11.38, there is an alarm page on a plant picture. In the alarm page, 4 buttons are connected to 4 message windows. Messages are sorted according to 4 plant areas and displayed accordingly in the 4 windows. In runtime, you could press one button to view messages belonging to the area you want to monitor.
PCS 7 PoT V6.0 | Edition V1.0 | August 2003 Copyright 2003 Siemens AG by A&D AS CS2 PA. All rights reserved.
Page 11 - 30
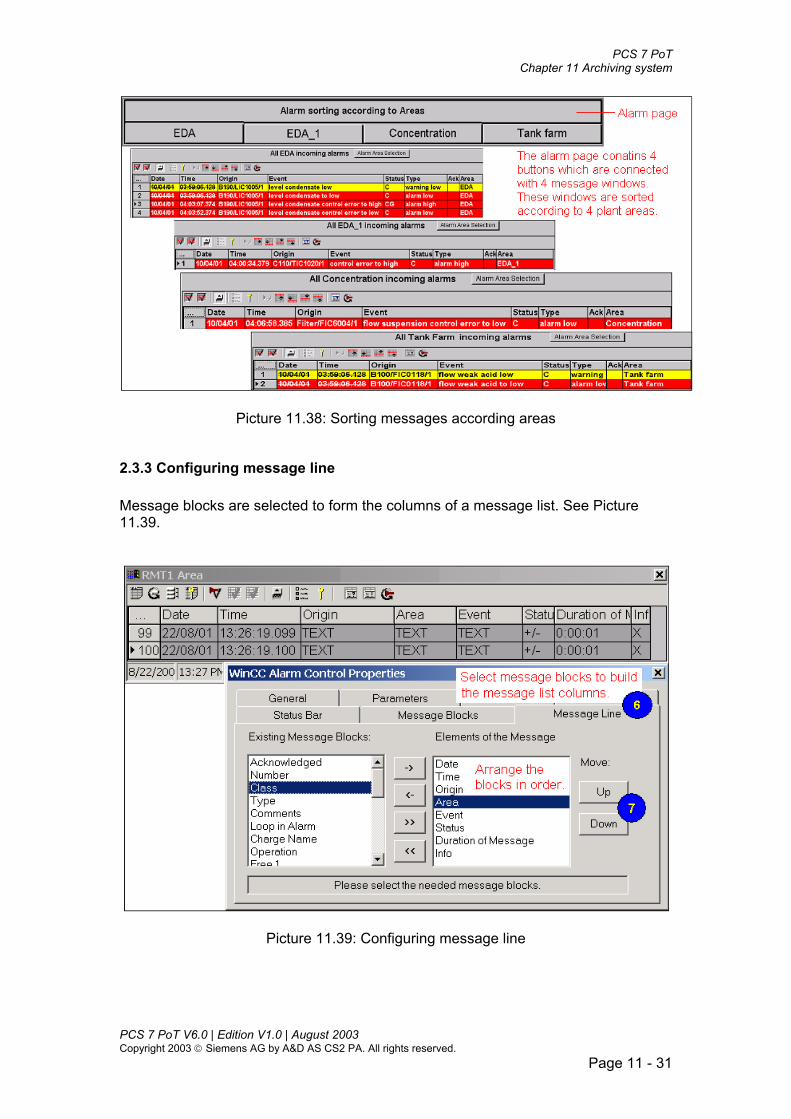
PCS 7 PoT Chapter 11 Archiving system
Picture 11.38: Sorting messages according areas
2.3.3 Configuring message line Message blocks are selected to form the columns of a message list. See Picture 11.39.
Picture 11.39: Configuring message line
PCS 7 PoT V6.0 | Edition V1.0 | August 2003 Copyright 2003 Siemens AG by A&D AS CS2 PA. All rights reserved.
Page 11 - 31
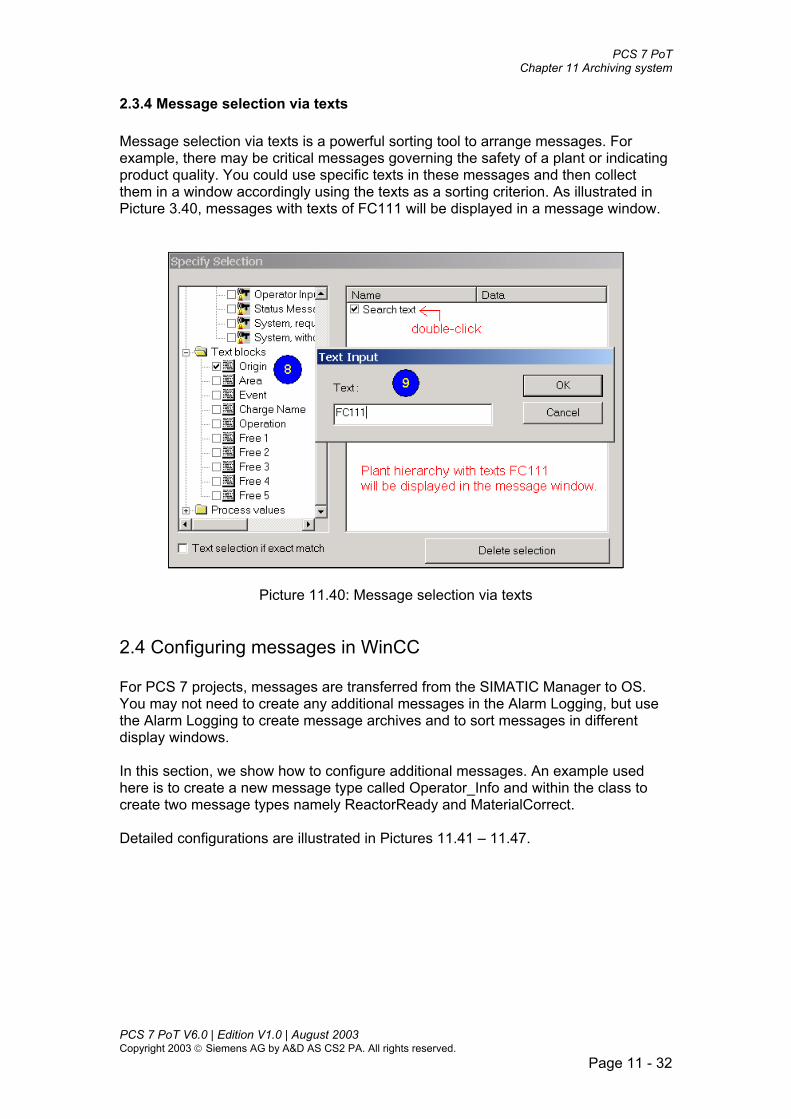
PCS 7 PoT Chapter 11 Archiving system
2.3.4 Message selection via texts Message selection via texts is a powerful sorting tool to arrange messages. For example, there may be critical messages governing the safety of a plant or indicating product quality. You could use specific texts in these messages and then collect them in a window accordingly using the texts as a sorting criterion. As illustrated in Picture 3.40, messages with texts of FC111 will be displayed in a message window.
Picture 11.40: Message selection via texts
2.4 Configuring messages in WinCC For PCS 7 projects, messages are transferred from the SIMATIC Manager to OS. You may not need to create any additional messages in the Alarm Logging, but use the Alarm Logging to create message archives and to sort messages in different display windows. In this section, we show how to configure additional messages. An example used here is to create a new message type called Operator_Info and within the class to create two message types namely ReactorReady and MaterialCorrect. Detailed configurations are illustrated in Pictures 11.41 – 11.47.
PCS 7 PoT V6.0 | Edition V1.0 | August 2003 Copyright 2003 Siemens AG by A&D AS CS2 PA. All rights reserved.
Page 11 - 32

PCS 7 PoT Chapter 11 Archiving system
Picture 11.41: Adding message class
PCS 7 PoT V6.0 | Edition V1.0 | August 2003 Copyright 2003 Siemens AG by A&D AS CS2 PA. All rights reserved.
Page 11 - 33

PCS 7 PoT Chapter 11 Archiving system
Picture 11.42: Changing message class name and adding message type
PCS 7 PoT V6.0 | Edition V1.0 | August 2003 Copyright 2003 Siemens AG by A&D AS CS2 PA. All rights reserved.
Page 11 - 34

PCS 7 PoT Chapter 11 Archiving system
Picture 11.43: Setting Acknowledgement and Status Texts
PCS 7 PoT V6.0 | Edition V1.0 | August 2003 Copyright 2003 Siemens AG by A&D AS CS2 PA. All rights reserved.
Page 11 - 35

PCS 7 PoT Chapter 11 Archiving system
Picture 11.44: Further settings of a new type
Picture 11.45: Appending messages
PCS 7 PoT V6.0 | Edition V1.0 | August 2003 Copyright 2003 Siemens AG by A&D AS CS2 PA. All rights reserved.
Page 11 - 36

PCS 7 PoT Chapter 11 Archiving system
Picture 11.46: Connecting Message Tag
Picture 11.47: Configuring for displaying Message Class “Operator_Info”
2.5 Configuring the Horn The horn is used to control optical or acoustic signaling devices (called Signal Modules in the context of Horn) or audio files when messages occur. Use the "Horn" editor to configure which signal modules to be triggered when particular message classes/types or message priorities occur.
A Signal module is connected to a PCI interface in an OS PC. Up to 3 signal modules can be connected.
•
PCS 7 PoT V6.0 | Edition V1.0 | August 2003 Copyright 2003 Siemens AG by A&D AS CS2 PA. All rights reserved.
Page 11 - 37

PCS 7 PoT Chapter 11 Archiving system
Using sound files. A sound file (in wav format) is played when the connected message is triggered. You need a sound card to hear the sound.
•
It is possible to have a hybrid operation of signal models and sound card on one OS PC. The Horn editor has two tabs where you can make relevant settings. Note For more detailed information on Horn, refer to the manual “Process Control System PCS 7 Operator Station. Example settings are shown in Pictures 11.48 and 49.
Picture 11.48: Assigning messages to horn signals
PCS 7 PoT V6.0 | Edition V1.0 | August 2003 Copyright 2003 Siemens AG by A&D AS CS2 PA. All rights reserved.
Page 11 - 38

PCS 7 PoT Chapter 11 Archiving system
Picture 11.49: Assigning horn signals to Signal modules 3. Data exchange using WinCC Storageplus Storageplus is an optional package of the PCS 7 software packages. If installed, it can access the data backed-up by the archive back-up function. 4. Central archiving server For large systems a central archive server can be created which is dedicated to the storage of process values for an entire plant or system. Including a central arching server (can be redundant), up to 12 (pairs of) servers can be configured in one project. A central archive server reads the process values from OS servers.
4.1 Architecture and principles A central archive server does not have a process connection but connects within the WinCC Client LAN. See Picture 11.50.
PCS 7 PoT V6.0 | Edition V1.0 | August 2003 Copyright 2003 Siemens AG by A&D AS CS2 PA. All rights reserved.
Page 11 - 39

PCS 7 PoT Chapter 11 Archiving system
Picture 11.50: A central archive server within PCS 7 systems A central archive server uses the Tag Logging to receive data from OS servers. The principles are:
OS server data existing - tags under the Tag Management and messages in the Alarm Logging have been existing by means of compiling OS.
•
•
•
•
•
OS server data transferred to the archive server by means of loading server packages on the archive server. Archives are configured on the archive server. Tags to be archived are pulled into Tag Logging of the archive server. In the Computer Startup of the archive server, activate the Tag Logging runtime and Alarm Logging runtime and deactivate other runtime applications. In the Startup of OS servers, deactivate Tag Logging and Graphics runtime applications.
4.2 Configuring a central archive server The topic is explained in detail in the manual “Process Control System PCS 7 Operator Station”, Edition 12/2003, Section 12 and related to the topic of Server-to-Server communication.
PCS 7 PoT V6.0 | Edition V1.0 | August 2003 Copyright 2003 Siemens AG by A&D AS CS2 PA. All rights reserved.
Page 11 - 40

PCS 7 PoT Chapter 11 Archiving system
Exercise
Exercise 11.1 including trends and table in plant pictures Design a PID controller using the library function, CTRL_PID. The setpoint (SP), process variable (PV_IN), and control error (ER) of the controller are to be archived. Design a valve controller using the library function, VALVE. The states (QOPENING and QCLOSING) of the valve controller are to be archived. Design an archive for an analog value of the controller and an archive for a binary value of the valve. Set the acquisition cycle different from the archiving cycle. Including a trend window: Configure a trend window to display the setpoint (SP) and process variable (PV_IN). The window is called up by a button-click. Configure the button with ToolTip to show the archive name, acquisition cycle, archiving cycle, and depth of the archive in time. Hint: Refer to Picture 11.17. Including a table: Configure a table to display the values of SP, PV_IN, and ER. Change Archiving cycle to a different value and observe the display time interval in the table.
Exercise 11.2 Sorting messages by texts Add 2 message windows in one of your process pictures. One message window is required to display all messages of the Alarm (or Error) class and the other to display all messages with texts of “High” or with your own texts which are to be picked up in the message window. Hint: Refer to Section 2.4 Configure message display of this chapter. Try to trigger some messages to test if your message windows display correctly.
PCS 7 PoT V6.0 | Edition V1.0 | August 2003 Copyright 2003 Siemens AG by A&D AS CS2 PA. All rights reserved.
Page 11 - 41

Chapter 12:
Reporting, Printing, and OS User Administration


Contents: CHAPTER 12 REPORTING, PRINTING, AND OS USER ADMINISTRATION .........................1
1.REPORTING AND PRINTING ........................................................................................................1
1.1 BASICS............................................................................................................................................1 1.1.1 Functions ................................................................................................................................1 1.1.2 Printers within PCS 7 system architecture .............................................................................1
1.2 CONFIGURING MESSAGE SEQUENCE REPORT ON CLIENT..................................................................2 1.2.1 Designing a layout ..................................................................................................................2 1.2.2 Planning a line-by-line-print job ............................................................................................5 1.2.3 Startup the line-by-line-print job ............................................................................................7
1.3 CONFIGURING TRENDING REPORTS .................................................................................................7 1.3.1 Designing a layout for printing trends....................................................................................8 1.3.2 Planning a print job for trending reports .............................................................................11 1.3.3 Activating of a trend report job ............................................................................................14
2. PCS7 OS USER ADMINISTRATION ...........................................................................................14
2.1 STANDARD PCS 7 AUTHORISATION LEVELS .................................................................................14 2.1.1 The administrator group.......................................................................................................15 2.1.2 Description of the authorisation levels .................................................................................15 2.1.3 Authorisation levels of PCS 7 system buttons .......................................................................16 2.1.4 Authorisation of graphic objects...........................................................................................16
2.2 CUSTOMISING AUTHORISATION LEVELS ........................................................................................17 2.3 LOGIN VIA CHIP CARDS .................................................................................................................18 2.4 VARIABLE LOGIN..........................................................................................................................18 2.5 SIMATIC LOGON AND PCS7 OS USER AUTHORISATION.............................................................19
EXERCISE............................................................................................................................................20
EXERCISE 12.1 MESSAGE SEQUENCE REPORT .....................................................................................20 The tasks and guideline..................................................................................................................20
EXERCISE 12.2 TRENDING REPORT .....................................................................................................20 The tasks and guideline..................................................................................................................20
EXERCISE 12.3 CURRENT VALUE REPORT ...........................................................................................20 The tasks and guideline..................................................................................................................20
EXERCISE 12.4 MANAGE USERS..........................................................................................................21 The tasks and guideline..................................................................................................................21


PCS 7 PoT Chapter 12 Reporting, Printing, and OS User Administration
Chapter 12 Reporting, Printing, and OS User Administration 1.Reporting and printing
1.1 Basics
1.1.1 Functions PCS 7 OS offers an integrated report system for printing the PCS 7 OS data on paper. Pre-designed report layouts are provided and can be adjusted. You can also create your own layouts with the Report Designer editor. Reporting covers a wide range of data including messages, tags, current data, archive data, and configuration data. Basically, you should create a layout with appropriate data connected as a report template, and then arrange print jobs to use the report layout templates. The following two editors are available for creating report layouts:
• Page Layout Editor, printing page by page • Line Layout Editor, printing line by line
Before directing reports to a printer you can store them as files or display them on the preview screen. You can also follow the progress and status of all printing jobs online. You can define cyclic printing every hour, day, week or month. A print job can also be started under time-control or by an operator action. One print job can have up to three printers assigned. If one printer fails, a specified substitute printer will be in operation. A total of three printers can be specified. The message sequence report can output incoming messages immediately on an assigned line printer (line-by-line printer). Such reports use the line layouts. All other reports use the page layouts.
1.1.2 Printers within PCS 7 system architecture Report printers can be installed on the network, on a client, or on a server depending on different configurations. Possible printer configurations within the PCS 7 architecture are illustrated in Picture 12.1.
PCS 7 PoT V6.0 | Edition V1.0 | August 2003 Copyright 2003 Siemens AG by A&D AS CS2 PA. All rights reserved.
Page 12 - 1

PCS 7 PoT Chapter 12 Reporting, Printing, and OS User Administration
Picture 12.1: Report printer configurations If a printer is installed on a client, it can print data from servers whose packages are loaded on the client. This means the printer of the client can centrally print data from different servers. A printer installed on a server can only print data belonging to the server database. For network printers, jobs are accepted from multiple stations on the network. The message sequence report is printed line by line on a matrix printer. Incoming messages are immediately printed on such a printer. If a message sequence report is to be printed on a network printer, the printer collects the messages until a page is filled up and then outputs the report page by page.
1.2 Configuring message sequence report on client As illustrated in Picture 12.1, message sequence reports can be printed from either a server or a client. The printer configurations are similar. This section will show the configuration using a client station as an example.
1.2.1 Designing a layout Add a new line-printing layout following the steps shown in Picture 12.2
PCS 7 PoT V6.0 | Edition V1.0 | August 2003 Copyright 2003 Siemens AG by A&D AS CS2 PA. All rights reserved.
Page 12 - 2

PCS 7 PoT Chapter 12 Reporting, Printing, and OS User Administration
Picture 12.2: Adding a new line printer layout Now, when you double-click on the newly added report the Report Editor opens as shown in Picture 12.3.
Picture 12.3: Line layout editor
PCS 7 PoT V6.0 | Edition V1.0 | August 2003 Copyright 2003 Siemens AG by A&D AS CS2 PA. All rights reserved.
Page 12 - 3

PCS 7 PoT Chapter 12 Reporting, Printing, and OS User Administration
Within the Editor you can specify Page size, Margins, Header, and Footer. See Picture 12.4.
Picture 12.4: Line Layout Editor In the Table section, you have to click on the Selection to specify which messages are to be reported. After clicking on the Selection the Alarm Logging Runtime Report Table Selection dialog opens as illustrated in Picture 12.5 where you specify which messages are to be reported.
PCS 7 PoT V6.0 | Edition V1.0 | August 2003 Copyright 2003 Siemens AG by A&D AS CS2 PA. All rights reserved.
Page 12 - 4
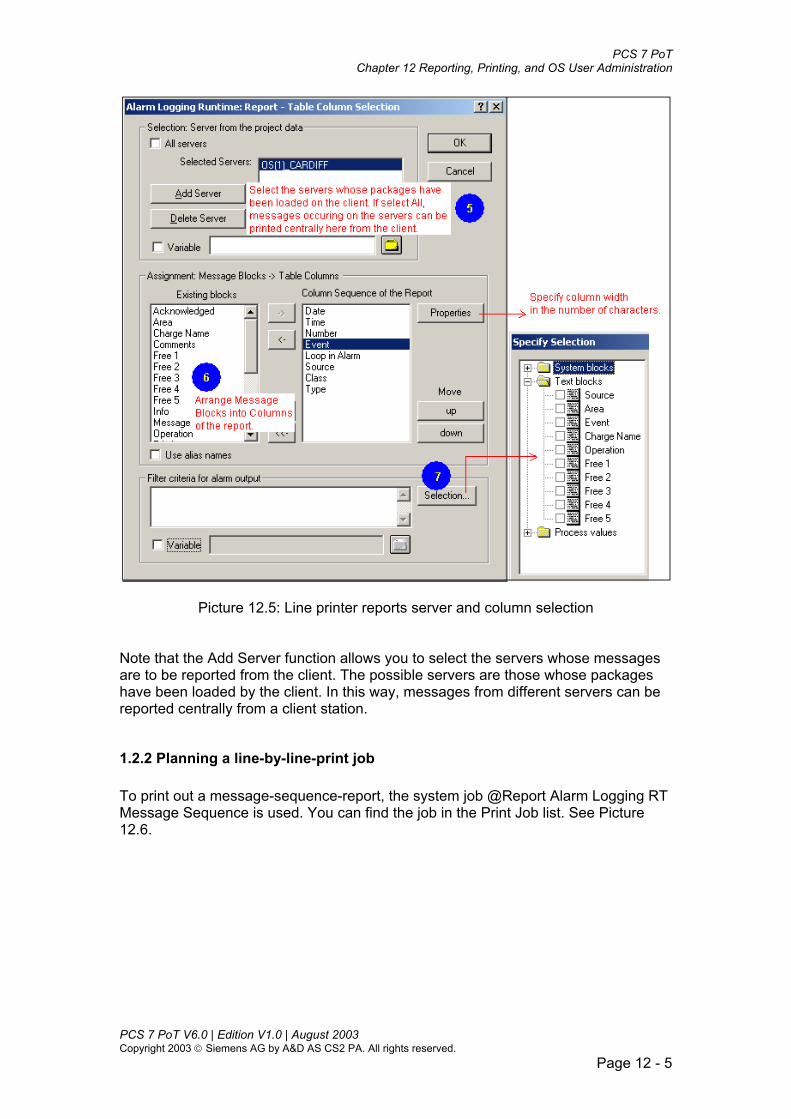
PCS 7 PoT Chapter 12 Reporting, Printing, and OS User Administration
Picture 12.5: Line printer reports server and column selection Note that the Add Server function allows you to select the servers whose messages are to be reported from the client. The possible servers are those whose packages have been loaded by the client. In this way, messages from different servers can be reported centrally from a client station.
1.2.2 Planning a line-by-line-print job To print out a message-sequence-report, the system job @Report Alarm Logging RT Message Sequence is used. You can find the job in the Print Job list. See Picture 12.6.
PCS 7 PoT V6.0 | Edition V1.0 | August 2003 Copyright 2003 Siemens AG by A&D AS CS2 PA. All rights reserved.
Page 12 - 5

PCS 7 PoT Chapter 12 Reporting, Printing, and OS User Administration
Picture 12.6: Message sequence report print job To assign the print job with a report layout, double click on the job to open the Print Job Properties dialog as shown in Picture 12.7 where you can specify the report layout and substitute printers.
Picture 12.7: Line-by-line-print job properties
PCS 7 PoT V6.0 | Edition V1.0 | August 2003 Copyright 2003 Siemens AG by A&D AS CS2 PA. All rights reserved.
Page 12 - 6

PCS 7 PoT Chapter 12 Reporting, Printing, and OS User Administration
1.2.3 Startup the line-by-line-print job The message sequence report is activated when the project is activated. The report runtime is added into the project startup list. See Picture 12.8.
Picture 12.8: Activation of Message Sequence Report You can configure message-sequence reporting from a server. The configuration steps are almost the same as those illustrated above for clients.
1.3 Configuring trending reports There is a rich collection of various pre-prepared layouts that you can directly use or adjust with changes. For trending reports, the layout @CCTlgRTCurves.RPL is used. For printing current values in tables, the layout @CCTlgTables.RPL is provided. See Picture 12.9.
PCS 7 PoT V6.0 | Edition V1.0 | August 2003 Copyright 2003 Siemens AG by A&D AS CS2 PA. All rights reserved.
Page 12 - 7

PCS 7 PoT Chapter 12 Reporting, Printing, and OS User Administration
Picture 12.9: Report layouts for trends and current values
1.3.1 Designing a layout for printing trends The following illustration will be based on reporting from a client. You need to customise a pre-prepared layout in Report Designer in order to connect a layout with process data. You can open Report Designer by double clicking on a layout. After opening a pre-prepared layout, it is recommended to save it as another name at your choice. This way the system pre-prepared layout is preserved. The Report Designer environment is shown in Picture 12.9. The report objects are also shown there. The dynamic objects are used, e.g. to display curves (Dynamic metafile) and tables (Dynamic table), etc. You can use the Objects and Styles to design customer layouts. Since, the system pre-prepared layouts have the necessary objects placed in position, you can simply concentrate on connecting a layout to your project data. See Picture 12.10.
PCS 7 PoT V6.0 | Edition V1.0 | August 2003 Copyright 2003 Siemens AG by A&D AS CS2 PA. All rights reserved.
Page 12 - 8

PCS 7 PoT Chapter 12 Reporting, Printing, and OS User Administration
Picture 12.10: Report Designer opening with Tag Logging Runtime Curves Layout After opening the Object Properties dialog, follow the illustration on Picture 12.11 to select tags. You have the opportunity to select tags from the archives configured with different servers whose packages have been loaded. In this way, it is possible to print out a report with data from several servers.
PCS 7 PoT V6.0 | Edition V1.0 | August 2003 Copyright 2003 Siemens AG by A&D AS CS2 PA. All rights reserved.
Page 12 - 9

PCS 7 PoT Chapter 12 Reporting, Printing, and OS User Administration
Picture 12.11: Connection a layout with data After the Tag Selection, you can specify the Time range and Format as shown in Picture 12.12.
PCS 7 PoT V6.0 | Edition V1.0 | August 2003 Copyright 2003 Siemens AG by A&D AS CS2 PA. All rights reserved.
Page 12 - 10

PCS 7 PoT Chapter 12 Reporting, Printing, and OS User Administration
Picture 12.12: Configuring the Time range and Format
1.3.2 Planning a print job for trending reports The pre-prepared job @Report Tag Logging RT Curves New is used for printing trend reports from clients while job @ Report Tag Logging RT Curves is used for printing trend reports from servers.
Picture 12.13: Pre-made print jobs
PCS 7 PoT V6.0 | Edition V1.0 | August 2003 Copyright 2003 Siemens AG by A&D AS CS2 PA. All rights reserved.
Page 12 - 11
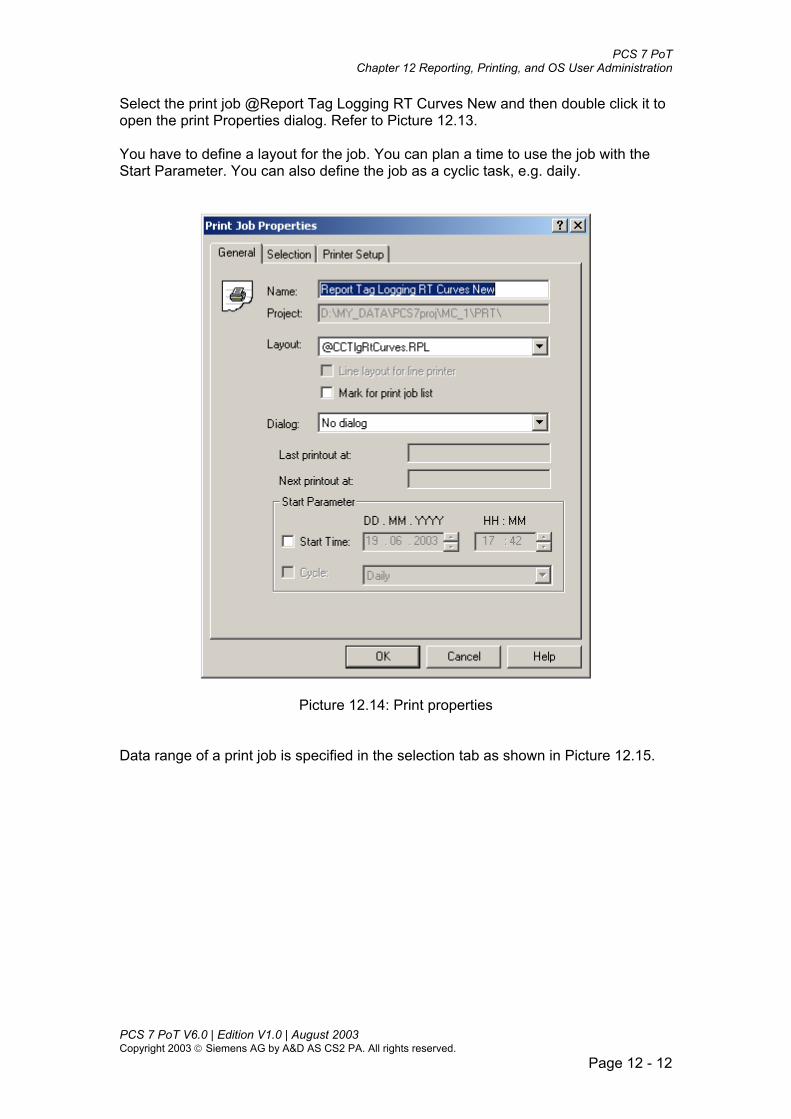
PCS 7 PoT Chapter 12 Reporting, Printing, and OS User Administration
Select the print job @Report Tag Logging RT Curves New and then double click it to open the print Properties dialog. Refer to Picture 12.13. You have to define a layout for the job. You can plan a time to use the job with the Start Parameter. You can also define the job as a cyclic task, e.g. daily.
Picture 12.14: Print properties Data range of a print job is specified in the selection tab as shown in Picture 12.15.
PCS 7 PoT V6.0 | Edition V1.0 | August 2003 Copyright 2003 Siemens AG by A&D AS CS2 PA. All rights reserved.
Page 12 - 12

PCS 7 PoT Chapter 12 Reporting, Printing, and OS User Administration
Picture 12.15: Data range of a print job In the Printer Setup tab of Picture 12.16, three printers can be specified. You can also print the report to a file.
Picture 12.16: Print properties
PCS 7 PoT V6.0 | Edition V1.0 | August 2003 Copyright 2003 Siemens AG by A&D AS CS2 PA. All rights reserved.
Page 12 - 13

PCS 7 PoT Chapter 12 Reporting, Printing, and OS User Administration
1.3.3 Activating of a trend report job To activate a print job by operator action, design an Application Window in a process picture and then trigger the print job from the context menu. Refer to Chapter 10 on the application window object. 2. PCS7 OS User administration
2.1 Standard PCS 7 authorisation levels After compiling of OS, the PCS7 system automatically sets up 11 levels of user rights in the User Administrator as shown in Picture 12.17. Areas such as Plant1, Cell2, etc. are defined when customising the plant hierarchy in the SIMATIC Manager. If an area was assigned to a user with a certain number of the levels (indicated by red buttons), the user will have the rights to access the area. If not, the user is not able to access the area and all its sub-branches.
Picture 12.17: PCS7 user administration
PCS 7 PoT V6.0 | Edition V1.0 | August 2003 Copyright 2003 Siemens AG by A&D AS CS2 PA. All rights reserved.
Page 12 - 14

PCS 7 PoT Chapter 12 Reporting, Printing, and OS User Administration
2.1.1 The administrator group The Administrator group has the default right for user administration and nothing else, meaning that the administration group has no rights for any operations in any areas. If no user is defined, OS runtime will not ask for login user name and password. You can access any area with all the rights. You add other groups and users with appropriate rights in the administration editor. For example, you could have the Operator group and user Andreas and Mark as shown in Picture 12.18.
Picture 12.18: Adding user groups and users
2.1.2 Description of the authorisation levels
• No.1 User administration: This authorisation grants the user access to the User Administration. If this authorisation is set, the user can call up the User Administrator and make changes.
• No.2 Authorisation for Area: If this authorisation is set, the user can select pictures from the specified system areas.
• No.3 System Change: If this authorisation is set, the user is granted the right to make status changes, e.g. to deactivate the runtime system.
• No.4 Monitoring: If this authorisation is set, the user can monitor - but not control - the process. One example of the Monitoring right is to select the batch visualisation.
• No.5 Processcontrolling: This authorisation enables the user to control the process, e.g. to activate a SFC chart.
• No.6 Higher Processcontrolling: In addition to authorisation No.5, this authorisation enables the user to control the process on a higher-level with a lasting effect on the process, e.g. changing the limit values of a controller, or changing the operation mode between Manual and Automatic.
• No.7 Reportsystem: If this authorisation is set, the user can trigger reports or edit the layout in the Report Designer runtime.
• No.8 Archive controlling: If this authorisation is set, the user can control the functions of the archive system.
• No.1000 –No.1002: reserved and not used in PCS 7 V6.0. PCS 7 PoT V6.0 | Edition V1.0 | August 2003 Copyright 2003 Siemens AG by A&D AS CS2 PA. All rights reserved.
Page 12 - 15

PCS 7 PoT Chapter 12 Reporting, Printing, and OS User Administration
2.1.3 Authorisation levels of PCS 7 system buttons In the standard PCS 7 key set, the buttons have pre-assigned authorization levels. Picture 12.19 shows the buttons with their access levels.
Picture 12.19: The PCS 7 standard buttons
2.1.4 Authorisation of graphic objects Each graphic object can be assigned with an access level. Picture 12.20 shows how to assign a right to an I/O Field.
Picture 12.20: Authorising a graphic object
PCS 7 PoT V6.0 | Edition V1.0 | August 2003 Copyright 2003 Siemens AG by A&D AS CS2 PA. All rights reserved.
Page 12 - 16

PCS 7 PoT Chapter 12 Reporting, Printing, and OS User Administration
2.2 Customising authorisation levels You can add more authorisation levels in the User Administrator. See Picture 12.21 where Level No.9 is added and specified as the Plant-specific authorisation. By selecting the Plant-specific authorisation it is possible to assign rights to individual areas. Level No.8, No.7, and No.3 are not Plant-specific since area-specific selections are not available.
Picture 12.21: Adding authorisation levels
Now, the new authorisation levels can be used in the design of process pictures. Refer to Picture 12.22.
PCS 7 PoT V6.0 | Edition V1.0 | August 2003 Copyright 2003 Siemens AG by A&D AS CS2 PA. All rights reserved.
Page 12 - 17

PCS 7 PoT Chapter 12 Reporting, Printing, and OS User Administration
Picture 12.22: A User-defined authorisation right
2.3 Login via chip cards The User Administrator provides functions to control a chip card reader/writer. You can write and check chip cards in the configuration system. For more information refer to the WinCC online Help. Only after installing the WinCC "Chip Card" option, can you have the chip-card functions.
2.4 Variable Login The "Variable Login" function is used to assign a value of a tag to a specific user. This enables a user to log on to a workstation during runtime by setting the tag value, e.g. by means of a key switch. The configurations include the following steps (see Picture 12.23):
• Assign an operator station to a configured tag (Computer assignment) • Specification of the minimal and maximal values of the value range that is
to be used for the "Variable Login" function (Configuration) • Assign a specific tag value to a specific user (User assignment)
By setting the tag value to logout value, the user is able to log out again after completing his work. As long as a user is logged on in the system by means of "Variable Login", it is not possible to log on to the same computer via the user dialog.
PCS 7 PoT V6.0 | Edition V1.0 | August 2003 Copyright 2003 Siemens AG by A&D AS CS2 PA. All rights reserved.
Page 12 - 18

PCS 7 PoT Chapter 12 Reporting, Printing, and OS User Administration
Picture 12:23: Variable Login
2.5 SIMATIC Logon and PCS7 OS User authorisation SIMATIC Logon is an optional package of PCS7 systems, which allows that users created in the Windows 2000 User Administration are known in the PCS7 OS. For more detailed information on SIMATIC Logon, refer to the manual on SIMATIC Logon.
PCS 7 PoT V6.0 | Edition V1.0 | August 2003 Copyright 2003 Siemens AG by A&D AS CS2 PA. All rights reserved.
Page 12 - 19

PCS 7 PoT Chapter 12 Reporting, Printing, and OS User Administration
Exercise
Exercise 12.1 Message sequence report
The tasks and guideline Design a message sequence report. Depending on your PCS 7 system and printer installation, configure the message sequence report print job either on a client or on a server. All messages of the Alarm and Warning classes have to be printed out. Refer to Section 1.2. Edit a new layout in the line printer layout editor by copying the system-provided layout. Plan your job in the Print Job Properties dialog. Here, you need to select the print job @Report Alarm Logging RT Message Sequence. Activate your job.
Exercise 12.2 Trending report
The tasks and guideline Design a report to print out the last 1-hour of the setpoint (SP) and process variable (PV_IN) of a CTRL_PID controller in curve. Refer to Section 1.3.
Exercise 12.3 Current value report
The tasks and guideline Design a report to print out the last 1-hour of the setpoint (SP) and process variable (PV_IN) of a CTRL_PID controller in tabular format. Based on the report @CCTlgRtTables.RPL, edit the report and connect it with your project data (SP and PV_IN). Plan a print job to use the newly created report layout. The print job can be based on @Report Tag Logging RT Tables New. Add an Application Window in one of process pictures. Refer to Chapter 10, Picture 10.35. Activate your table print job.
PCS 7 PoT V6.0 | Edition V1.0 | August 2003 Copyright 2003 Siemens AG by A&D AS CS2 PA. All rights reserved.
Page 12 - 20

PCS 7 PoT Chapter 12 Reporting, Printing, and OS User Administration
Exercise 12.4 Manage users
The tasks and guideline Add the following user groups in your project:
• Systems engineer • Supervisor • Operator
How will you assign access rights to the three groups? If a special permission is required, add it in the User Administration editor.
PCS 7 PoT V6.0 | Edition V1.0 | August 2003 Copyright 2003 Siemens AG by A&D AS CS2 PA. All rights reserved.
Page 12 - 21

Chapter 13:
OS Server, Client, Redundancy, and Project Download


Contents: CHAPTER 13 OS SERVER, CLIENT, REDUNDANCY, AND PROJECT DOWNLOAD ...........1
1. OS REDUNDANCY ...........................................................................................................................1
1.1 OS REDUNDANCY WITHIN PCS 7 OS .............................................................................................1 1.2 STARTUP OF OS SERVER .................................................................................................................2 1.3 REDUNDANCY PRINCIPLES ..............................................................................................................3 1.4 CONFIGURING REDUNDANT OS SERVERS........................................................................................4
1.4.1 Synchronise all data of the downtime .....................................................................................5 1.4.2 Synchronise the latest days of a failure ..................................................................................5 1.4.3 Synchronisation of Tag Logging after the partner server comes back online ........................5 1.4.4 Synchronisation of Alarm Logging after the partner server comes back online.....................5 1.4.5 Online synchronisation of Alarm Logging..............................................................................5 1.4.6 Synchronisation after process connection error .....................................................................5 1.4.7 PCS 7 OS client switchover ....................................................................................................6 1.4.8 Serial connection to the redundant partner ............................................................................6 1.4.9 Activate Redundancy...............................................................................................................6
2. CLIENT...............................................................................................................................................6
2.1 CLIENT ARCHITECTURE...................................................................................................................6 2.2 CLIENT SWITCH-OVER AND PERMANENT OPERABILITY ...................................................................7 2.3 CONFIGURING A CLIENT ..................................................................................................................8
2.3.1 Creating packages on server ..................................................................................................8 2.3.2 Creating a client project .........................................................................................................9 2.3.3 Package.................................................................................................................................10 2.3.4 Loading of server package....................................................................................................10 2.3.5 OS project editor...................................................................................................................11
2.4 CLIENT PICTURE NAVIGATION.......................................................................................................12 2.5 STANDARD SERVER AND DATA FROM DIFFERENT SERVERS ...........................................................13
2.5.1 Trending on a client..............................................................................................................13 2.5.2 User Administration..............................................................................................................13
3. PROJECT DOWNLOAD ................................................................................................................14
3.1 THE MAKE FUNCTION ...................................................................................................................14 2.1.1 Before calling up the Make function.................................................................................16 3.1.2 Make .....................................................................................................................................17
3.2 ANOTHER WAY OF OS PROJECT DOWNLOAD.................................................................................20 3.2.1 Preparation for OS project download ..................................................................................20 3.2.2 Downloading server projects ................................................................................................22
4. OS SIMULATION ON OS ..............................................................................................................23
EXERCISE............................................................................................................................................25
EXERCISE: CONFIGURING REDUNDANT OS SERVERS AND CLIENTS ....................................................25 1. The tasks ....................................................................................................................................25 2. Guideline ...................................................................................................................................25


PCS 7 PoT Chapter 13 OS Server, Client, Redundancy, and Project Download
Chapter 13 OS Server, Client, Redundancy, and project download
1. OS redundancy Two OS servers connected to each other and running in parallel form a pair of redundant servers. OS redundancy means that redundant servers monitor each other, synchronise the project archives if there is inconsistency, and manage client switchover if one server fails. This redundancy is at the OS level. The two servers are identical in terms of software installation, OS project, and physical communication parts. See Picture 13.1.
SV1.1
SV1.2RedundantOS servers
System bus
AS AS
ES
Terminal bus
OS client OS client OS client
Picture 13.1: Redundant servers
1.1 OS Redundancy within PCS 7 OS OS Redundancy is an optional package of the PCS 7 software system. After installing the Redundancy authorisation you can configure redundant functions using the Redundancy editor. See Picture 13.2.
PCS 7 PoT V6.0 | Edition V1.0 | August 2003 Copyright 2003 Siemens AG by A&D AS CS2 PA. All rights reserved.
Page 13 - 1

PCS 7 PoT Chapter 13 OS Server, Client, Redundancy, and Project Download
Picture 13.2: PCS 7 OS Redundancy package
1.2 Startup of OS server During startup of the server PCs, Redundancy determines if the partner server, SV1.2, is already active (Refer to Picture 13.1). If this is the case, the SV 1.1 will be set as the slave server. If the partner server, SV1.2, has not been activated, the SV1.1 will be set as the master server. You can influence which server will be activated as the master or slave by default by setting the "Default Master" check-box as shown in Picture 13.2. OS clients for whom no Preferred Server has been specified will connect to the server that is the master. In runtime, the redundancy master can be recognised by means of the redundancy tags "@RM_MASTER" or "@RM_MASTER_NAME", which are located in the Tag Management under "Internal Tags" in the "Redundancy" tag group. Refer to Picture 13.3.
PCS 7 PoT V6.0 | Edition V1.0 | August 2003 Copyright 2003 Siemens AG by A&D AS CS2 PA. All rights reserved.
Page 13 - 2

PCS 7 PoT Chapter 13 OS Server, Client, Redundancy, and Project Download
Picture 13.3: Redundancy tags The redundancy computer on which the tag "@RM_MASTER" is set to "1" is the master. The computer name of the corresponding redundancy master is written to the tag "@RM_MASTER_NAME". If the status of the "@RM_Master" tag changes, e.g. due to a computer failure, clients will switch to the former slave computer that now becomes the master. Clients with a preferred server (permanent operability) ignore the master/slave identification of the redundancy tag "@RM_Master" and "@RM_MASTER_NAME". Both servers can be hot standby and preferable servers for certain clients. Note Make sure that only one of the two redundancy servers is set as the "Default Master". The check-box must not be activated on both computers. Otherwise, problems may arise during the redundancy switch of the clients.
1.3 Redundancy principles During process operation, OS server pairs run completely in parallel and independent of one another. If one of the OS servers in a server pair fails, an equivalent redundant OS server is always available. The OS servers monitor each other during runtime. Each OS server has its own process connection and it own data archive. Process data and messages from the ASs are sent to both redundant OS servers and are processed and adjusted appropriately. Communication between the redundant OS servers takes place via a terminal bus and a null-modem cable between the two servers. In the event of an OS server failure, a control system message is reported, and the healthy one takes the control. The OS clients which are connected to the failed server automatically switch to the redundant peer server. After a brief switchover time, all operator stations are again available.
PCS 7 PoT V6.0 | Edition V1.0 | August 2003 Copyright 2003 Siemens AG by A&D AS CS2 PA. All rights reserved.
Page 13 - 3

PCS 7 PoT Chapter 13 OS Server, Client, Redundancy, and Project Download
After recovery of the failed server, the archive is adjusted for the failure time period. As s result, two equivalent servers are available again. The archive adjustment is implanted in the background and operates in parallel to process control and archiving of PCS 7 OS. Thus, operator control and monitoring of the plant is guaranteed at all times.
1.4 Configuring redundant OS servers Tags and/or alarms that are to be synchronised are set in the Redundancy configuration dialog. Activation of the redundant function is also set in the dialog. See Picture 13.4.
Picture 13.4: Configuring Redundancy functions
PCS 7 PoT V6.0 | Edition V1.0 | August 2003 Copyright 2003 Siemens AG by A&D AS CS2 PA. All rights reserved.
Page 13 - 4
PCS 7 PoT Chapter 13 OS Server, Client, Redundancy, and Project Download
1.4.1 Synchronise all data of the downtime The "Synchronise all data of the downtime" radio-button defines that all data of the entire downtime is to be synchronised.
1.4.2 Synchronise the latest days of a failure “Only synchronise the last days of a failure " option defines, for example, that only the last 10 days of data are to be synchronised after the failed server comes back.
1.4.3 Synchronisation of Tag Logging after the partner server comes back online This option defines whether a synchronisation of Tag Logging is to be performed after the partner server returns.
1.4.4 Synchronisation of Alarm Logging after the partner server comes back online The "Synchronisation of Alarm Logging after the partner server comes back online" option defines whether a synchronisation of Alarm Logging is to be performed after the partner server returns.
1.4.5 Online synchronisation of Alarm Logging The "Online synchronisation for Alarm Logging" option defines whether a synchronisation of the Alarm Logging operator messages and the messages of the reserved number range (system messages rather than those transferred from the SIMATIC Manager upon compiling of OS) is to be performed in runtime.
1.4.6 Synchronisation after process connection error The "Synchronisation after process connection error" option defines whether an archive synchronisation is to be performed following a network connection error between the servers and their configured connections (automation systems). If the process connection monitoring is activated, the respective server performs a lifebeat monitoring of all configured connections. A server diagnoses a process connection error to an AS if the addressed AS does not respond back. If a network error to one or multiple automation systems detected in this way, a synchronisation of all alarm message archives, process data archives and User Archives will be performed for all automation systems belonging to the project. This means that the archives of automation systems not failed will also be synchronised. If this option is deactivated, the runtime load on the servers can be reduced. However, since an error occurring in the network of the automation systems cannot be recognised if the monitoring of the network connections is deactivated, no archive synchronisation will take place. PCS 7 PoT V6.0 | Edition V1.0 | August 2003 Copyright 2003 Siemens AG by A&D AS CS2 PA. All rights reserved.
Page 13 - 5

PCS 7 PoT Chapter 13 OS Server, Client, Redundancy, and Project Download
1.4.7 PCS 7 OS client switchover The option "PCS 7 OS client switch in case of a process connection error" sets whether or not a client connected with a server should be switched over to the redundant partner server if an error in the network connection between a server and its configured connections (AS) occurs. If this option is activated, the number of erroneous logical connections of the master server and the redundant partner server is determined cyclically. If the master server possesses more erroneous logical connections than the redundant partner server, a client connected to the master server will be switched to the redundant partner server. Once the process connection error has been corrected, the client will switch back to the original server, provided it has been set up as the preferred server. The monitoring of the process connection can only be started, if both redundancy servers are in runtime.
1.4.8 Serial connection to the redundant partner To have the full capability of the OS redundancy, two OS servers are connected using the null modem cable.
1.4.9 Activate Redundancy The "Activate Redundancy" check-box indicates whether the Redundancy system is active. The Redundancy can be activated/deactivated by clicking on this box. The option is primarily used to temporarily deactivate the Redundancy system during configuring. If you de-activate Redundancy, a dialog will appear asking "Do you really want to deactivate the Redundancy". This gives you the option to stop the deactivation of the Redundancy if appropriate.
2. Client
2.1 Client architecture A maximum of 32 clients can access one server. One client can access up to 12 servers (or 12 pairs of servers), which makes it possible for a client to visualise process data from 12 servers. The client architecture is shown in Picture 13.5.
PCS 7 PoT V6.0 | Edition V1.0 | August 2003 Copyright 2003 Siemens AG by A&D AS CS2 PA. All rights reserved.
Page 13 - 6
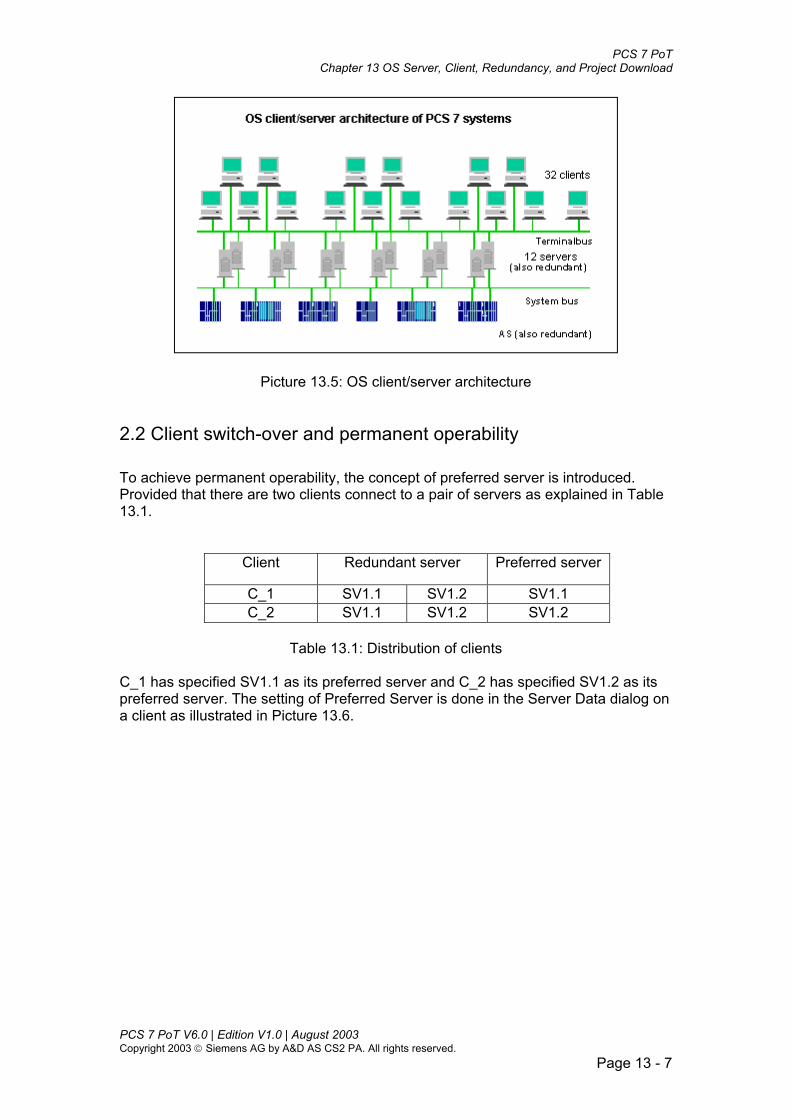
PCS 7 PoT Chapter 13 OS Server, Client, Redundancy, and Project Download
Picture 13.5: OS client/server architecture
2.2 Client switch-over and permanent operability To achieve permanent operability, the concept of preferred server is introduced. Provided that there are two clients connect to a pair of servers as explained in Table 13.1.
Client Redundant server Preferred server
C_1 SV1.1 SV1.2 SV1.1 C_2 SV1.1 SV1.2 SV1.2
Table 13.1: Distribution of clients
C_1 has specified SV1.1 as its preferred server and C_2 has specified SV1.2 as its preferred server. The setting of Preferred Server is done in the Server Data dialog on a client as illustrated in Picture 13.6.
PCS 7 PoT V6.0 | Edition V1.0 | August 2003 Copyright 2003 Siemens AG by A&D AS CS2 PA. All rights reserved.
Page 13 - 7

PCS 7 PoT Chapter 13 OS Server, Client, Redundancy, and Project Download
Picture 13.6: Setting of Preferred Server
If SV1.1 fails Client_1 will switch to SV1.2 after a short switchover time. From client 2 the system is constantly operabable. SV1.1 is available again. C_1 switches back to the returned SV1.1, as SV1.1 is its preferred server. The distribution of the two clients with different preferred servers among the redundant servers spreads out the load and results in improved performance of the entire system.
2.3 Configuring a client
2.3.1 Creating packages on server The steps of creating server package are illustrated in Picture 13.7. The package includes all necessary links (pictures, scripts, addresses, etc.) that a client needs to visualise and operate a plant.
PCS 7 PoT V6.0 | Edition V1.0 | August 2003 Copyright 2003 Siemens AG by A&D AS CS2 PA. All rights reserved.
Page 13 - 8

PCS 7 PoT Chapter 13 OS Server, Client, Redundancy, and Project Download
Picture 13.7: Creating a server package After creating a server package the package is located at the following Windows Explorer path. You need the path when you load the package on a client.
(PCS 7_Project_Name)/Wincproj/(OS_Server_Name) )/(computer name) /Packages
2.3.2 Creating a client project A client project is created in the SIMATIC Manager and configured futher in the PCS 7 OS engineering. The project is then loaded to a computer that will be the client machine in runtime. This is the way of the centralised engineering.
PCS 7 PoT V6.0 | Edition V1.0 | August 2003 Copyright 2003 Siemens AG by A&D AS CS2 PA. All rights reserved.
Page 13 - 9

PCS 7 PoT Chapter 13 OS Server, Client, Redundancy, and Project Download
Picture 13:8: Creating clients in the SIMATIC Manager
2.3.3 Package Packages are data packets containing all the current configuration data (tags, messages, archives etc.) which are made available to all the connected clients within a distributed system. The packages are generated from the server and loaded to the clients.
2.3.4 Loading of server package The server package is created and updated automatically when the server project is created. The first loading of server packages on a client is done manually. All further update of the packages in server and client can be executed automatically. If updating manually, after changing the configuration data of server projects, the packages must be generated again. Use the "Update" function to update the packages on a client. If updating automatically, you can adjust the updates. For instance, you transfer the packages during commissioning manually to the clients to distribute the configuration data for the first time to the clients. To keep data on the clients updated, you can then configure automatic package update on each modification of server data. Follow the illustration of Picture 13.10 to load server packages for a client.
PCS 7 PoT V6.0 | Edition V1.0 | August 2003 Copyright 2003 Siemens AG by A&D AS CS2 PA. All rights reserved.
Page 13 - 10

PCS 7 PoT Chapter 13 OS Server, Client, Redundancy, and Project Download
Picture 13.10: Loading packages for a client project
2.3.5 OS project editor After loading packages from all connected servers, open the OS project editor to set a picture layout for the OS client project. Refer to Picture 13.11.
PCS 7 PoT V6.0 | Edition V1.0 | August 2003 Copyright 2003 Siemens AG by A&D AS CS2 PA. All rights reserved.
Page 13 - 11

PCS 7 PoT Chapter 13 OS Server, Client, Redundancy, and Project Download
Picture 13:11: OS project data for clients
2.4 Client picture navigation For PCS 7 systems, the picture hierarchy of each server is known to a client after loading the corresponding server data. Therefore picture navigation on a client uses the picture hierarchical trees of the associated servers. If one of the servers is selected, the overview area of the client loads the overview of the selected server so that the server data are operable from the client. Refer to Picture 13.12 where server OS_XJ overview areas are loaded onto the client overview areas.
Picture 13.12: Client server view PCS 7 PoT V6.0 | Edition V1.0 | August 2003 Copyright 2003 Siemens AG by A&D AS CS2 PA. All rights reserved.
Page 13 - 12

PCS 7 PoT Chapter 13 OS Server, Client, Redundancy, and Project Download
The amount of areas can be configured from 4 to 56 in the server-view depending on the monitor resolution.
2.5 Standard server and data from different servers
2.5.1 Trending on a client If trend groups are configured on a client, there are two ways of saving these trend groups. If, on the client, a standard server has been configured for the SSM (Split Screen Manager) via the "Standard Server" dialog, the configuration data of the configured Trend groups are automatically stored on this standard server and its partner server. Other clients can also specify this server as the standard server for the Split Screen Manager. Thus, the configured trend groups will be made available to them as well. If no standard server for the Split Screen Manager has been configured on the client, the configured trends will be stored locally on the client. Other clients cannot display these trend groups. The connected server also cannot use the trend groups. Refer to Picture 13.13 to see how to configure the Standard server.
Picture 13.13: Specifying the Standard server
2.5.2 User Administration User logins must be re-created again on clients. Users defined on servers are not included in the packages. If an object in a server picture has been assigned a certain PCS 7 PoT V6.0 | Edition V1.0 | August 2003 Copyright 2003 Siemens AG by A&D AS CS2 PA. All rights reserved.
Page 13 - 13

PCS 7 PoT Chapter 13 OS Server, Client, Redundancy, and Project Download
access level while the level is not assigned on a client, the object will not be able to be accessed from the client.
3. Project download In Chapter 3, Section 2 Configuration of PC stations, we discussed downloading of PC stations within the NetPro where you can download OS (server, standby server, and client) PCs and as well as ASs. In CFC or SFC, you could download an S7 program to its AS. In this section, downloading with the Make function will introduced and other various ways of downloading summarised.
3.1 The Make function The function is called up from the SIMATIC Manager and relevant to a project, AS station, or OS station as illustrated in Picture 13.14.
PCS 7 PoT V6.0 | Edition V1.0 | August 2003 Copyright 2003 Siemens AG by A&D AS CS2 PA. All rights reserved.
Page 13 - 14

PCS 7 PoT Chapter 13 OS Server, Client, Redundancy, and Project Download
Picture 13.14: Calling up the Make function All AS and OS stations within a project (e.g. the test1_MP as shown in Picture 13.13) are collected into the Make interface as shown in Picture 13.15.
PCS 7 PoT V6.0 | Edition V1.0 | August 2003 Copyright 2003 Siemens AG by A&D AS CS2 PA. All rights reserved.
Page 13 - 15

PCS 7 PoT Chapter 13 OS Server, Client, Redundancy, and Project Download
Picture 13.15: The Make function – compiles and downloads objects
2.1.1 Before calling up the Make function Before you could download OS projects to their physical machines, the following settings and engineering work have been completed. (1) Create and download ASs in the hardware configuration, HW-Config. (2) Create and download S7 programs (e.g. CFC and SFC charts) in CFC or
SFC Editor. You can also download programs in the Make. (3) Insert and configure PC stations. Assign AS and OS. Download ES PC stations
with connection paths in NetPro. (4) Compile OS. Design OS (pictures, reports, and print jobs). Create OS server
data. After the 4 steps above, the project is usually ready to be in runtime. It is the time, you use the Make to download PC stations along with their OS projects to the physical machines.
PCS 7 PoT V6.0 | Edition V1.0 | August 2003 Copyright 2003 Siemens AG by A&D AS CS2 PA. All rights reserved.
Page 13 - 16

PCS 7 PoT Chapter 13 OS Server, Client, Redundancy, and Project Download
3.1.2 Make The display of objects in the Make interface corresponds to the Component view. It displays all automation and PC stations created in SIMATIC Manager. Here, you can make settings for compiling (entire program or change only) and downloading (complete downloading or change only downloading) in a central location. The following actions take place when downloading from the Make.
Server data are automatically generated for the associated OS clients • • Computer names for OS PCs are automatically changed to the names of
the target OSs. The Make is the only place where you can download changes to OS while the OS is in runtime. In the Make, you tick in the Compile and/or Download columns and then click the Start button to initiate Compiling and/or Downloading action(s). You may need to set how the compiling and/or downloading is to be done using the Edit function. Select a program in the Make interface and then click the Edit button. See Picture 13.16 where the interface of Compiling Charts as Program is the same as it could be called up in CFC editor.
Picture 13.16: Accessing Compiling Charts as Program from the Make PCS 7 PoT V6.0 | Edition V1.0 | August 2003 Copyright 2003 Siemens AG by A&D AS CS2 PA. All rights reserved.
Page 13 - 17

PCS 7 PoT Chapter 13 OS Server, Client, Redundancy, and Project Download
The download action initiated in the Make is the same as it could be initiated in CFC. See Picture 13.17.
Picture 13.17: Accessing S7 Download from the Make After Step 4 shown in Picture 13.17, click the Start button to perform downloading. For OS projects, the Edit function calls up the Compiling OS dialog as shown in Picture 13.18. In the Compiling OS, you can assign a S7 program to an OS project and transfer the SIMATIC data to OS data.
PCS 7 PoT V6.0 | Edition V1.0 | August 2003 Copyright 2003 Siemens AG by A&D AS CS2 PA. All rights reserved.
Page 13 - 18

PCS 7 PoT Chapter 13 OS Server, Client, Redundancy, and Project Download
Picture 13.18: Accessing OS compiling from the Make After setting options for compiling OS, you are promoted to specify the path to the target OS machine. See Picture 13.19.
Picture 13.19: Specifying path to OS machine from the Make After selections in the Make, compiling and downloading can be started. Refer to Picture 13.20.
PCS 7 PoT V6.0 | Edition V1.0 | August 2003 Copyright 2003 Siemens AG by A&D AS CS2 PA. All rights reserved.
Page 13 - 19

PCS 7 PoT Chapter 13 OS Server, Client, Redundancy, and Project Download
Picture 13.20: Initiating compiling and/or downloading action(s) Note To know other functions on the Make, refer to the online Help.
3.2 Another way of OS project download There is another approach related to OS project download rather than the Make. The difference is that you can load OS projects while the projects are running (without shutting down operation) using the Make. But, with the project download, you have to shut down the OS before loading it.
3.2.1 Preparation for OS project download PCS 7 OS stations, redundant servers, and client stations can be created in the SIMATIC Manager and the project data downloaded to the target physical machines. The OS run-time computers can therefore be configured and updated centrally at the engineering station via the network.
PCS 7 PoT V6.0 | Edition V1.0 | August 2003 Copyright 2003 Siemens AG by A&D AS CS2 PA. All rights reserved.
Page 13 - 20

PCS 7 PoT Chapter 13 OS Server, Client, Redundancy, and Project Download
The principles of downloading OS projects to their physical machines are based on the configuration of PC stations in the SIMATIC Manager. Refer to Chapter 3 to know how to include a PC station and its OS project (server, client, or standby server) into a PCS7 project. After OS projects have been developed, follow the illustration in Picture 13.21 to open the Properties dialog of an OS project.
Picture 13.21: Opening the Properties dialog of an OS project In the Properties dialog locate the path to the OS project physical machine as shown in Picture 13.22.
PCS 7 PoT V6.0 | Edition V1.0 | August 2003 Copyright 2003 Siemens AG by A&D AS CS2 PA. All rights reserved.
Page 13 - 21

PCS 7 PoT Chapter 13 OS Server, Client, Redundancy, and Project Download
Picture 13.22: Specifying the path to the target OS server computer In the Standby-OS Properties dialog the network path to the OS-Standby-Server has to be specified. Automatically, the assignment of this Standby-Server to the Master-OS is registered. Refer to Picture 13.23.
Picture 13.23: Specifying the path to the target OS standby computer
3.2.2 Downloading server projects To load an OS server project onto the server and the redundant standby-server, follow the following procedures and refer to Picture 13.24.
PCS 7 PoT V6.0 | Edition V1.0 | August 2003 Copyright 2003 Siemens AG by A&D AS CS2 PA. All rights reserved.
Page 13 - 22
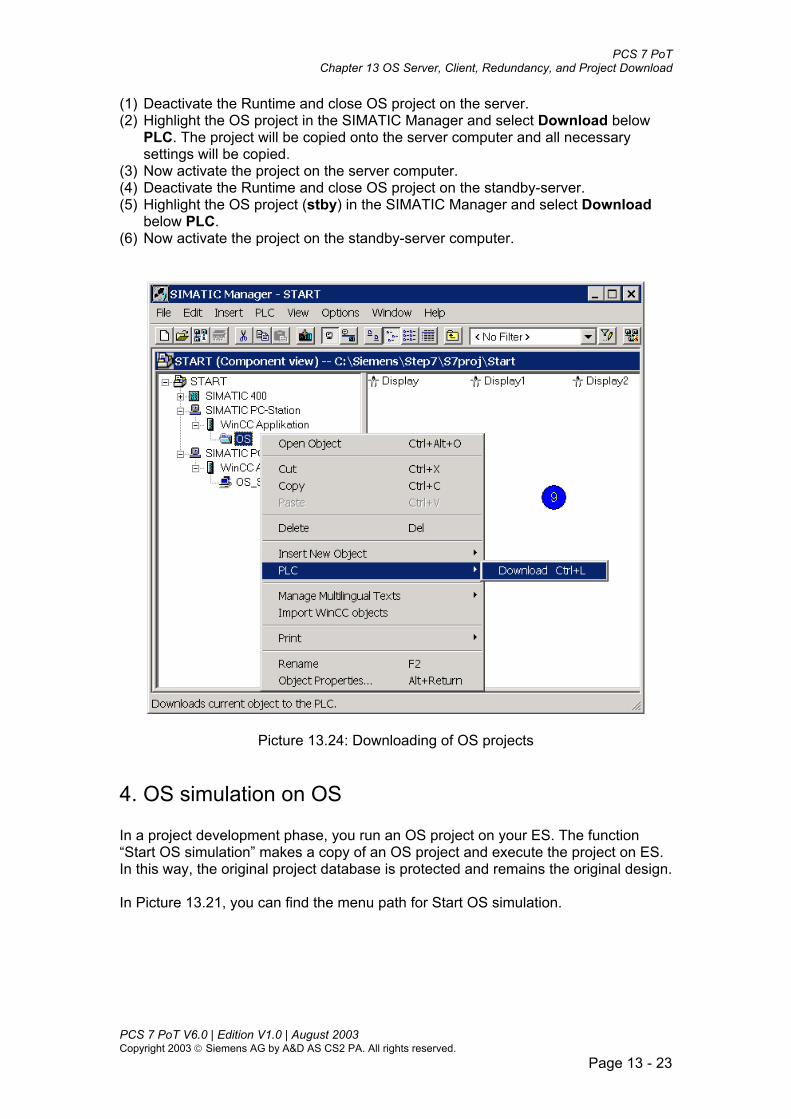
PCS 7 PoT Chapter 13 OS Server, Client, Redundancy, and Project Download
(1) Deactivate the Runtime and close OS project on the server. (2) Highlight the OS project in the SIMATIC Manager and select Download below
PLC. The project will be copied onto the server computer and all necessary settings will be copied.
(3) Now activate the project on the server computer. (4) Deactivate the Runtime and close OS project on the standby-server. (5) Highlight the OS project (stby) in the SIMATIC Manager and select Download
below PLC. (6) Now activate the project on the standby-server computer.
Picture 13.24: Downloading of OS projects
4. OS simulation on OS In a project development phase, you run an OS project on your ES. The function “Start OS simulation” makes a copy of an OS project and execute the project on ES. In this way, the original project database is protected and remains the original design. In Picture 13.21, you can find the menu path for Start OS simulation.
PCS 7 PoT V6.0 | Edition V1.0 | August 2003 Copyright 2003 Siemens AG by A&D AS CS2 PA. All rights reserved.
Page 13 - 23

PCS 7 PoT Chapter 13 OS Server, Client, Redundancy, and Project Download
PCS 7 PoT V6.0 | Edition V1.0 | August 2003 Copyright 2003 Siemens AG by A&D AS CS2 PA. All rights reserved.
Page 13 - 24

PCS 7 PoT Chapter 13 OS Server, Client, Redundancy, and Project Download
Exercise
Exercise: Configuring redundant OS servers and clients
1. The tasks Select two PCS 7 stations as OS servers and configure them as redundant servers. Select two PCS 7 stations and configure them as clients.
(1) Test some of the server failure scenarios. Observe the messages and switchover.
(2) Clients should be configured with a preferred server. Test the permanent operability.
(3) Configure a trend display on a client. Are you able to display the trend group on the other client? Make the trend group available for the servers by defining the Standard server.
Note that for PCS 7 redundant server and client architecture the PC stations are connected within the Windows 2000 client/server environment. Make sure that this Windows 2000 network is correctly set up.
2. Guideline Make your project a multi-user type. Configure redundancy and specify one of the servers as the default master. Refer to Picture 13.4. Create the server package on one of the servers. Download OS projects (server and redundant server) to the target computers. Download OS clients to the target computers. Load the package on the clients. Open the OS project editor and make appropriate settings on the clients. Configure a standard server for each of the clients. Download the project from the SIMATIC Manager to ASs and run the project on the controller. Activate the servers. Activate the clients.
PCS 7 PoT V6.0 | Edition V1.0 | August 2003 Copyright 2003 Siemens AG by A&D AS CS2 PA. All rights reserved.
Page 13 - 25

Chapter 14:
Multi-user Project Engineering


Contents: CHAPTER 14 MULTI-USER PROJECT ENGINEERING..............................................................1
1. MULTI-USER PROJECT ENGINEERING ...................................................................................1
2. MULTIPROJECTS............................................................................................................................1
2.1 INTRODUCTION ...............................................................................................................................1 2.2 MULTIPROJECT RULES.....................................................................................................................2
3. A CASE STUDY.................................................................................................................................3
3.1 NEW PROJECT..................................................................................................................................4 3.2 PROJECT STRUCTURE AND PLANT HIERARCHY ................................................................................5 3.3 AUTOMATION STATIONS .................................................................................................................8 3.4 OPERATION STATIONS...................................................................................................................10 3.5 ASSIGNMENT OF AS AND OS ........................................................................................................11 3.6 COMMUNICATION BETWEEN OS AND AS......................................................................................13 3.7 DISTRIBUTING PROJECTS...............................................................................................................16 3.8 INTEGRATING PROJECTS................................................................................................................18 3.9 WORKING OVER NETWORK ...........................................................................................................19
3.9.1 AS engineering......................................................................................................................19 3.9.2 OS engineering .....................................................................................................................20
3.10 ARCHIVING AND RETRIEVING PROJECTS......................................................................................21
EXERCISE............................................................................................................................................23
EXERCISE 14.1 MULTI-USER PROJECT ENGINEERING ..........................................................................23

PCS 7 PoT Chapter 14 Multi-user Project Engineering
Chapter 14 Multi-user Project Engineering
1. Multi-user project engineering Multi-user project engineering means that several engineers work on one project. They may work independently developing charts and pictures and need to integrate their results among the team from time to time. The separation and integration of a project involves extensive editing of the project, e.g. copying, cutting/pasting, and branching/merging, etc. Such editing tasks have to be carried out carefully and confidently. Separation and integration of a project also involves planning and structuring of the project.
2. Multiprojects
2.1 Introduction PCS 7 concept on multiproject is a good solution to separation and integration of project parts. A multiproject contains at least one project. In Chapter 2, we have learnt that you can add projects into a multiproject, create new projects within a multiproject, and remove projects from a multiproject. These functions were used to deal with projects files located in one ES. In this chapter, we will show the functions applied to project files located in different ES over a network. Automation stations and OS PC stations are known inside a project. For multiprojects, you need the NetPro function, Merge/Unmerge Subnetworks, to work over individual projects within a multiproject. It is important to structure a multiproject properly. To structure a multiproject is to decide the number of individual projects contained in the multiproject and the plant hierarchical folders in an individual project. The structure of a multiproject is decided at the beginning of project engineering and will affect the project engineering cycle considerably. It is important to get the structure right at beginning. In a multiple-engineering-station environment, we distinguish a central ES from other engineering stations. The roles of the engineering stations are shown in Picture 14.1.
PCS 7 PoT V6.0 | Edition V1.0 | August 2003 Copyright 2003 Siemens AG by A&D AS CS2 PA. All rights reserved.
Page 14 - 1

PCS 7 PoT Chapter 14 Multi-user Project Engineering
Picture 14.1: Central ES and ES
2.2 Multiproject rules Rule 1: Number of engineers => number of engineering stations If there are more than one engineer working on a project, you have the issue to share engineering load between engineers. Thus, you need create more than one individual project in a multiproject. Nevertheless, if there is one engineer working on the project, you need to create only one individual project in a multiproject regardless how many ASs and OSs will be used in the project. The number of engineers normally implies the number of the PCS 7 engineering stations, which is to say that one engineer works on one ES. Rule 2: Number of stations => Number of projects If there are more than one engineer involved in a project, the number of individual projects to be created is recommended to be equal to the number of automation stations (ASs) plus operator stations (OSs). Each AS or OS is one project in a multiproject. Rule 3: Plant hierarchy is the same for all the projects in a multiproject After projects are created in a multiproject, for each of the project, you design a plant hierarchy. The level of the hierarchical folders and the names of the folders are to be the same for all the projects. To be consistent, build the plant hierarchy in one project and copy it to all other projects.
PCS 7 PoT V6.0 | Edition V1.0 | August 2003 Copyright 2003 Siemens AG by A&D AS CS2 PA. All rights reserved.
Page 14 - 2

PCS 7 PoT Chapter 14 Multi-user Project Engineering
Rule 4: Number of ASs => Number of the top plant hierarchical folders In each of the individual project, the number of the top plant hierarchical folders should be equal to the number of automation stations. This rule ensures that the assignment between the plant hierarchy and AS/OS is simple and clear. Rule 5: Master data library Block types, process tag types, and models of the multiproject are stored in the master data library. All engineers and associated individual projects should use this one master data library. In a network environment, engineers browse to the master data library in the central ES and use the library functions there. Normally, engineering is carried out in two phases. In the first phase, the master data library is built by developing block types, process tag types, and models. Once the first phase is completed, the second phase is to use the library to populate the project. If you are in the second phase and want to add a block type, you should develop the block type in a trial project. After success you store the block back into the master data library and the new block type is available to use. Rule 6: Central ES Refer to Picture 14.1. The very first creation of a multiproject is on the central ES, which include creation of individual projects and plant hierarchy. Assignment and communication between the projects are also carried out on the central ES. Project implementation is carried out on each ES, which include adding charts and pictures. For AS engineering, you compile/download programs from an ES to test your design. For OS engineering, compilation and download have to be made on the central ES after all the projects of the multiproject have locally stored in the central ES. Note When compiling an OS, the OS package is created carrying the name of the OS and the computer on which the OS was compiled. The OS packages are important files for communication between OS servers and between OS servers and OS clients. It is recommended to compiling OS on a central ES to ensure the consistence of OS packages in a multi-ES environment. The OS packages also affect the capability of online loading of OS projects. With online OS loading, you can load OS projects without shutting-down plant operation. If an OS package is not consistent, the capability of online loading is damaged.
3. A case study Assume that there are 3 engineers in a project team using 3 engineering stations. The project contains 3 automation stations and 2 OS servers. Picture 14.1 shows the system. PCS 7 PoT V6.0 | Edition V1.0 | August 2003 Copyright 2003 Siemens AG by A&D AS CS2 PA. All rights reserved.
Page 14 - 3
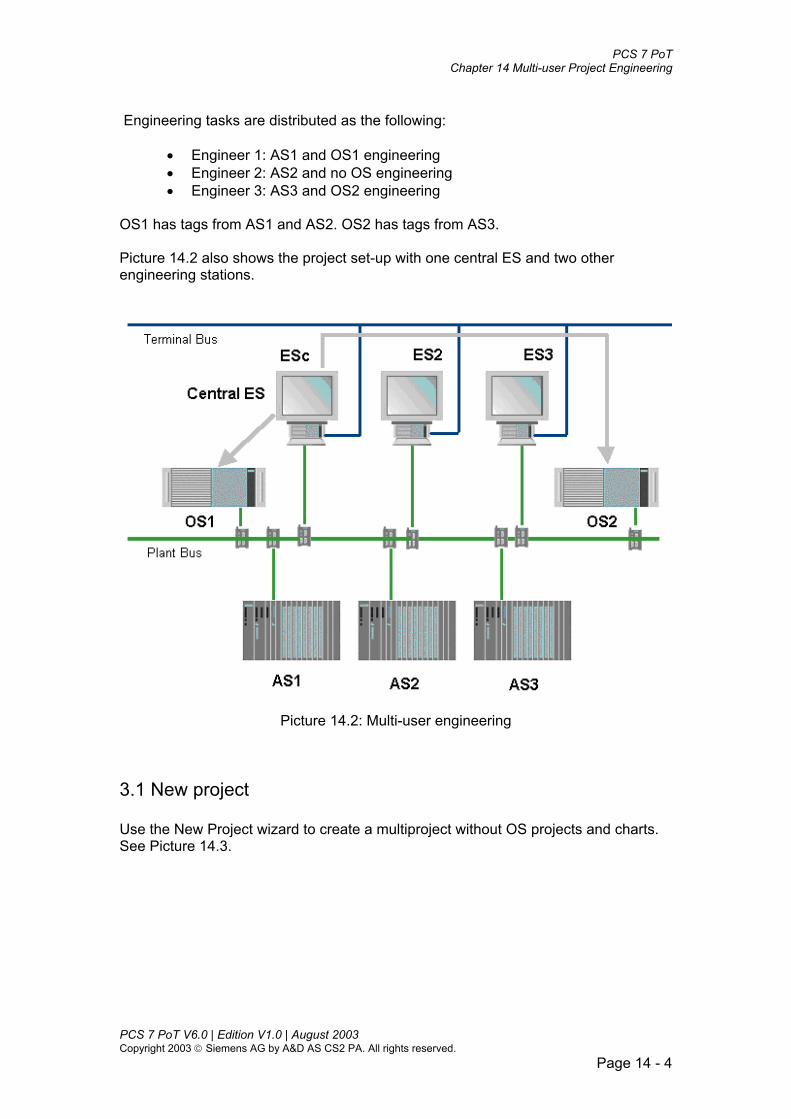
PCS 7 PoT Chapter 14 Multi-user Project Engineering
Engineering tasks are distributed as the following:
Engineer 1: AS1 and OS1 engineering • • •
Engineer 2: AS2 and no OS engineering Engineer 3: AS3 and OS2 engineering
OS1 has tags from AS1 and AS2. OS2 has tags from AS3. Picture 14.2 also shows the project set-up with one central ES and two other engineering stations.
Picture 14.2: Multi-user engineering
3.1 New project Use the New Project wizard to create a multiproject without OS projects and charts. See Picture 14.3.
PCS 7 PoT V6.0 | Edition V1.0 | August 2003 Copyright 2003 Siemens AG by A&D AS CS2 PA. All rights reserved.
Page 14 - 4
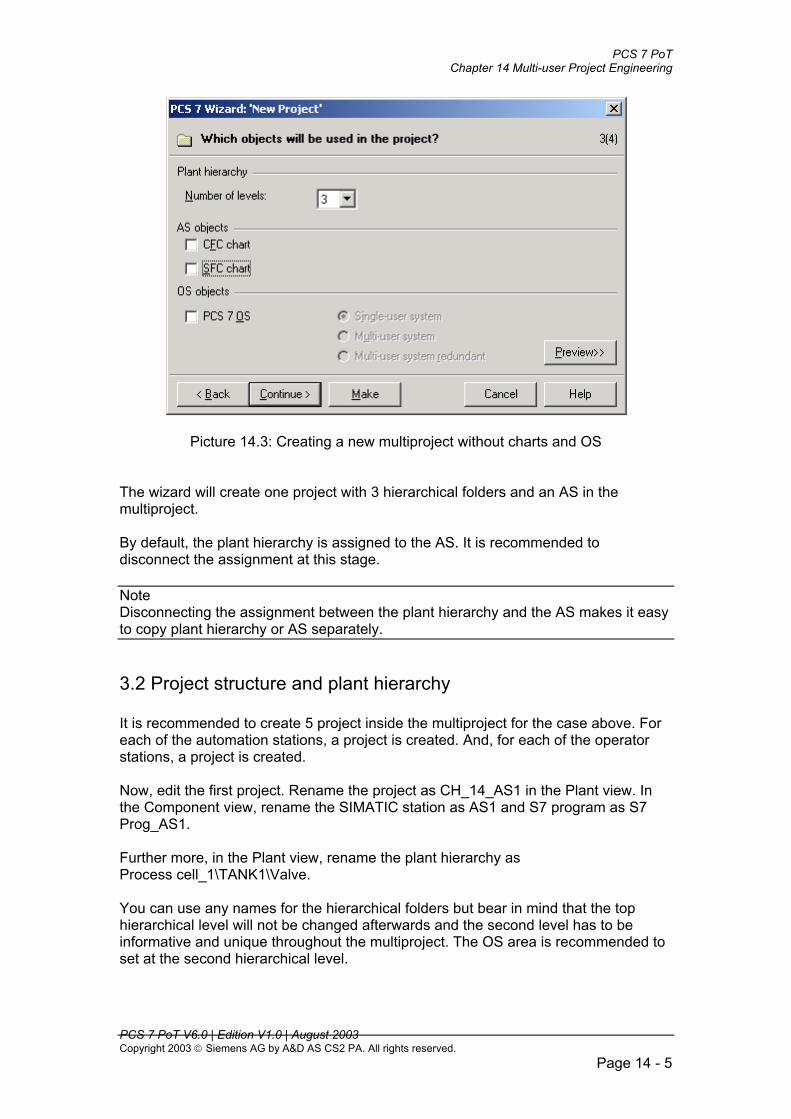
PCS 7 PoT Chapter 14 Multi-user Project Engineering
Picture 14.3: Creating a new multiproject without charts and OS The wizard will create one project with 3 hierarchical folders and an AS in the multiproject. By default, the plant hierarchy is assigned to the AS. It is recommended to disconnect the assignment at this stage. Note Disconnecting the assignment between the plant hierarchy and the AS makes it easy to copy plant hierarchy or AS separately.
3.2 Project structure and plant hierarchy It is recommended to create 5 project inside the multiproject for the case above. For each of the automation stations, a project is created. And, for each of the operator stations, a project is created. Now, edit the first project. Rename the project as CH_14_AS1 in the Plant view. In the Component view, rename the SIMATIC station as AS1 and S7 program as S7 Prog_AS1. Further more, in the Plant view, rename the plant hierarchy as Process cell_1\TANK1\Valve. You can use any names for the hierarchical folders but bear in mind that the top hierarchical level will not be changed afterwards and the second level has to be informative and unique throughout the multiproject. The OS area is recommended to set at the second hierarchical level.
PCS 7 PoT V6.0 | Edition V1.0 | August 2003 Copyright 2003 Siemens AG by A&D AS CS2 PA. All rights reserved.
Page 14 - 5

PCS 7 PoT Chapter 14 Multi-user Project Engineering
Note Renaming objects makes your project easy to read. You should pick up informative names for your objects and stay with them throughout the project engineering. Changing names means re-engineering. Set the OS area and tag naming as shown in Picture 14.4.
Picture 14.4: Plant hierarchy design After setting the plant hierarchy, insert an empty picture in the second level of the OS projects. Note Because the OS area is set at the second level, it is necessary to insert empty pictures in all the second levels of the OS projects. Under the level Process cell_1, you can further insert sub-folders while you can also insert them after distributing projects. Now create a number of the top plant hierarchical levels in the first project according to the number of the automation stations. For the CH_14_MP project, create 3 top levels. Refer to Picture 14.6. You can copy Process cell_1 to make the other two.
PCS 7 PoT V6.0 | Edition V1.0 | August 2003 Copyright 2003 Siemens AG by A&D AS CS2 PA. All rights reserved.
Page 14 - 6
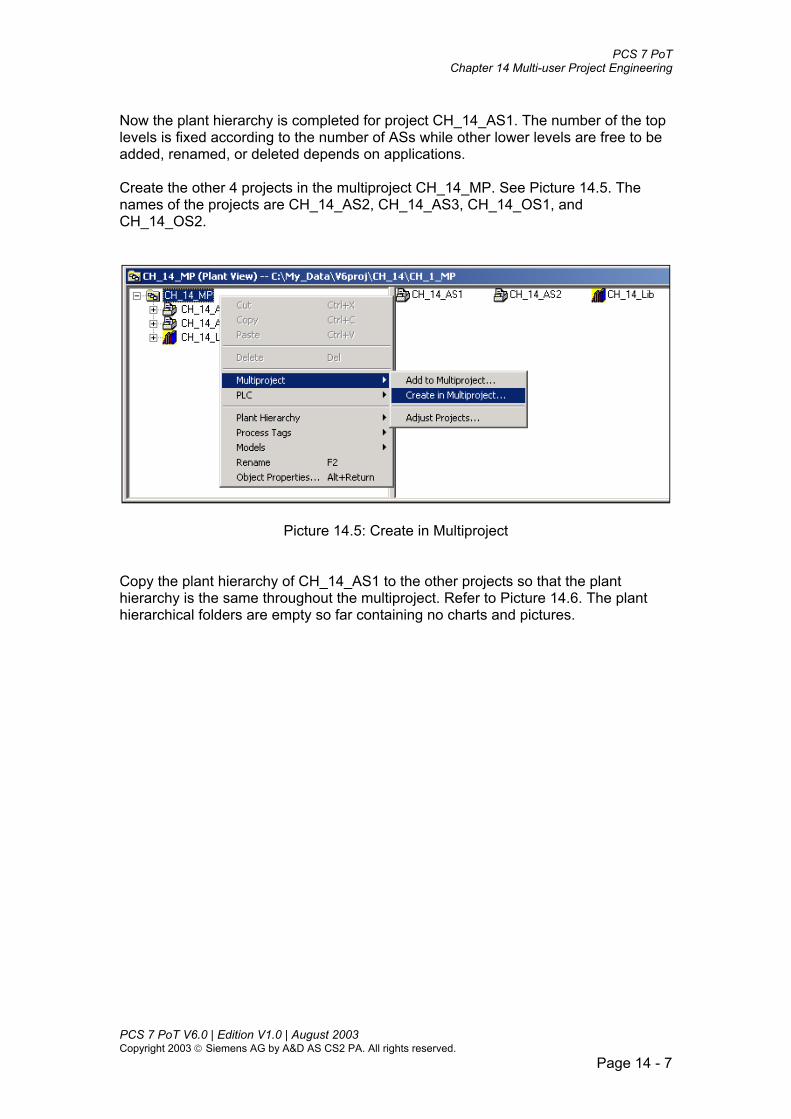
PCS 7 PoT Chapter 14 Multi-user Project Engineering
Now the plant hierarchy is completed for project CH_14_AS1. The number of the top levels is fixed according to the number of ASs while other lower levels are free to be added, renamed, or deleted depends on applications. Create the other 4 projects in the multiproject CH_14_MP. See Picture 14.5. The names of the projects are CH_14_AS2, CH_14_AS3, CH_14_OS1, and CH_14_OS2.
Picture 14.5: Create in Multiproject Copy the plant hierarchy of CH_14_AS1 to the other projects so that the plant hierarchy is the same throughout the multiproject. Refer to Picture 14.6. The plant hierarchical folders are empty so far containing no charts and pictures.
PCS 7 PoT V6.0 | Edition V1.0 | August 2003 Copyright 2003 Siemens AG by A&D AS CS2 PA. All rights reserved.
Page 14 - 7

PCS 7 PoT Chapter 14 Multi-user Project Engineering
Picture 14.6: Plant hierarchy for multi-user engineering
3.3 Automation stations In Section 2.2, we have named the automation station as AS1 and the S7 Program S7 Prog_AS1. The AS is to be connected to the Plant bus. Add an Industrial Ethernet card and configure the network in the HW-Config. Refer to Picture 14.7.
PCS 7 PoT V6.0 | Edition V1.0 | August 2003 Copyright 2003 Siemens AG by A&D AS CS2 PA. All rights reserved.
Page 14 - 8

PCS 7 PoT Chapter 14 Multi-user Project Engineering
Picture 14.7: Adding and configuring plant bus for one AS In the Component view, copy the AS1 to make the other two automation stations. See Picture 14.8.
Picture 14.8: Copying AS When copying AS, the network addresses will not be automatically copied. It is important to assign network addresses manually after copying AS. See Picture 14.9.
PCS 7 PoT V6.0 | Edition V1.0 | August 2003 Copyright 2003 Siemens AG by A&D AS CS2 PA. All rights reserved.
Page 14 - 9

PCS 7 PoT Chapter 14 Multi-user Project Engineering
Picture 14.9: Configuring network after copying AS
3.4 Operation stations Configure two OS stations in CH_14_MP. The two stations should be correctly assigned with networks and addresses. Refer to Chapter 3. Picture 14.10 shows the structure of multiproject, CH_14_MP, consisting of 5 projects, CH_14_AS1, CH_14_AS2, CH_14_AS3, CH_14_OS1, and CH_14_OS2.
PCS 7 PoT V6.0 | Edition V1.0 | August 2003 Copyright 2003 Siemens AG by A&D AS CS2 PA. All rights reserved.
Page 14 - 10
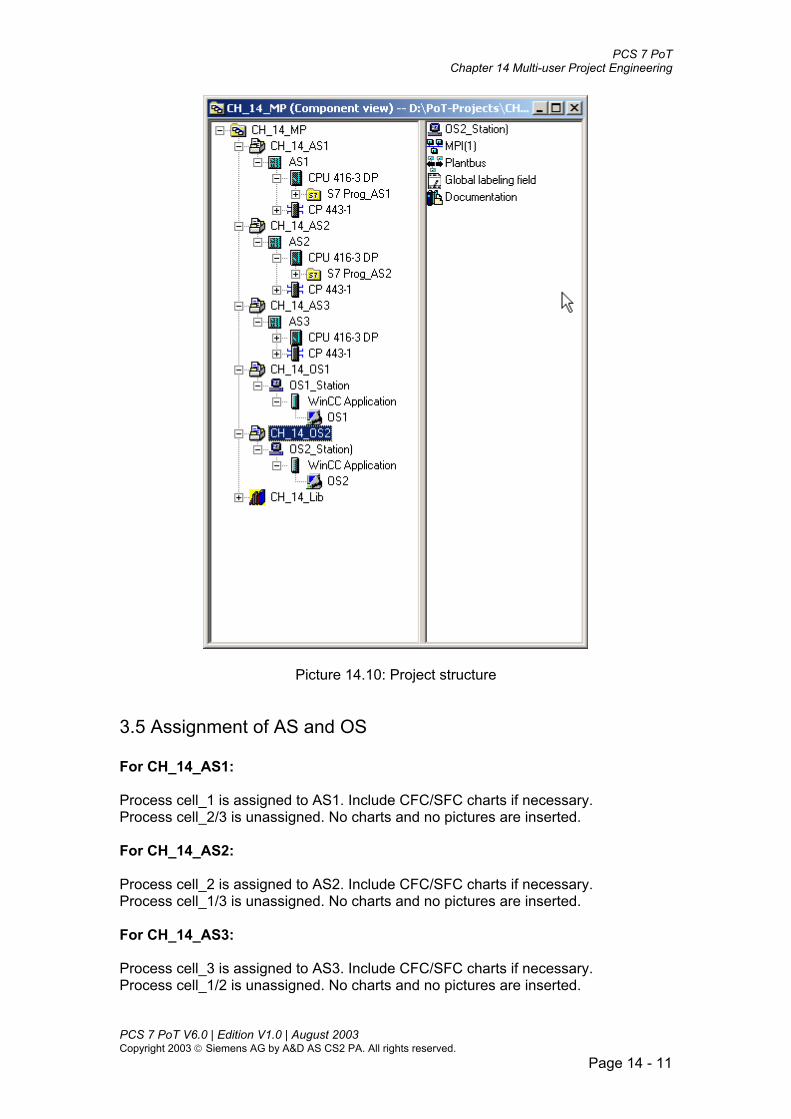
PCS 7 PoT Chapter 14 Multi-user Project Engineering
Picture 14.10: Project structure
3.5 Assignment of AS and OS For CH_14_AS1: Process cell_1 is assigned to AS1. Include CFC/SFC charts if necessary. Process cell_2/3 is unassigned. No charts and no pictures are inserted. For CH_14_AS2: Process cell_2 is assigned to AS2. Include CFC/SFC charts if necessary. Process cell_1/3 is unassigned. No charts and no pictures are inserted. For CH_14_AS3: Process cell_3 is assigned to AS3. Include CFC/SFC charts if necessary. Process cell_1/2 is unassigned. No charts and no pictures are inserted.
PCS 7 PoT V6.0 | Edition V1.0 | August 2003 Copyright 2003 Siemens AG by A&D AS CS2 PA. All rights reserved.
Page 14 - 11

PCS 7 PoT Chapter 14 Multi-user Project Engineering
Picture 14.11 shows the plant hierarchy in CH_14_AS1 with assignment to AS1.
Picture 14.11: Plant hierarchy with assignment to AS
For CH_14_OS1: Process cell_1 and Process cell_2 are assigned to OS1. Include pictures if necessary. Process cell_3 is unassigned. No charts and pictures are inserted. For CH_14_OS2: Process cell_3 is assigned to OS2. Include pictures if necessary. Process cell_1 and Process cell_2 are unassigned. No charts and pictures are inserted.
PCS 7 PoT V6.0 | Edition V1.0 | August 2003 Copyright 2003 Siemens AG by A&D AS CS2 PA. All rights reserved.
Page 14 - 12

PCS 7 PoT Chapter 14 Multi-user Project Engineering
Picture 14.12 shows the plant hierarchy in CH_14_OS1 with assignment to OS1.
Picture 14.12: Plant hierarchy with assignment to OS
3.6 Communication between OS and AS To establish communication between OS and AS, firstly use the NetPro function, Merge/Unmerge Subnetworks, to bring the sub-networks together, and then configure connections between OS and AS. The Merge/Unmerge Subnetworks is shown in Picture 14.13.
PCS 7 PoT V6.0 | Edition V1.0 | August 2003 Copyright 2003 Siemens AG by A&D AS CS2 PA. All rights reserved.
Page 14 - 13

PCS 7 PoT Chapter 14 Multi-user Project Engineering
1
Picture 14.13: Merge/Unmerge Subnetworks function To bring the sub-networks defined in the individual projects together, follow the illustration as shown in Picture 14.14 where you click the arrow button to merge networks.
PCS 7 PoT V6.0 | Edition V1.0 | August 2003 Copyright 2003 Siemens AG by A&D AS CS2 PA. All rights reserved.
Page 14 - 14

PCS 7 PoT Chapter 14 Multi-user Project Engineering
Picture 14.14: Merged sub-networks
PCS 7 PoT V6.0 | Edition V1.0 | August 2003 Copyright 2003 Siemens AG by A&D AS CS2 PA. All rights reserved.
Page 14 - 15

PCS 7 PoT Chapter 14 Multi-user Project Engineering
Communication between OS and AS is defined in NetPro. For each OS – AS communication, insert a connection. OS1 has two connections, one is to AS1 and the other to AS2 as shown in Picture 14.15 OS2 has one connection to AS3 and you need to insert one connection.
Picture 14.15: Communication OS and AS
3.7 Distributing projects Distributing projects involves the procedure shown in Picture 14.16.
PCS 7 PoT V6.0 | Edition V1.0 | August 2003 Copyright 2003 Siemens AG by A&D AS CS2 PA. All rights reserved.
Page 14 - 16

PCS 7 PoT Chapter 14 Multi-user Project Engineering
Picture 14.16: Distributing a project
The projects, CH_14_AS2 and CH_14_OS1, are to put on ES2 (Computer name: Es5de). Use the Save As function to transfer the projects. Refer to Picture 14.17 where you need to browse to find ES2 in the network.
PCS 7 PoT V6.0 | Edition V1.0 | August 2003 Copyright 2003 Siemens AG by A&D AS CS2 PA. All rights reserved.
Page 14 - 17

PCS 7 PoT Chapter 14 Multi-user Project Engineering
Picture 14.17: Saving projects over the network path After the Save As function, use the Remove function to remove CH_14_AS2 from the multiproject. You can delete (SIMATIC Manager > File > Delete) CH_14_AS2 now from the central ES. If you keep the project on the central ES, it may be confused with the project on the ES (i.e. Es5de in this case).
3.8 Integrating projects The procedure for integrating projects is shown in Picture 14.18.
PCS 7 PoT V6.0 | Edition V1.0 | August 2003 Copyright 2003 Siemens AG by A&D AS CS2 PA. All rights reserved.
Page 14 - 18

PCS 7 PoT Chapter 14 Multi-user Project Engineering
Picture 14.18: Integrating projects
The updated project, CH_14_AS2, is firstly transferred from Es6de to the central ES using the Save AS function and then add into CH_14_MP using Add To function. Care has to be taken when adding projects to a multiproject. You have to ensure that you add the projects from the appropriate ESs. Again, to avoid confusion, CH_14_AS2 can be deleted after the Save As.
3.9 Working over network
3.9.1 AS engineering For the AS projects, you need to use the master data library on the central ES. To locate the master data library, CH_14_Lib, open the library on your local engineering station, the ES2 (Computer name: Es5de) in this case. The menu path is SIMATIC Manager > File > Open (Libraries) > Browse. See Picture 14.19. The master data library is on the central ES (Computer name: Es6de).
PCS 7 PoT V6.0 | Edition V1.0 | August 2003 Copyright 2003 Siemens AG by A&D AS CS2 PA. All rights reserved.
Page 14 - 19

PCS 7 PoT Chapter 14 Multi-user Project Engineering
Picture 14.19: Using the master data library over network CH_14_AS2 is developed on ES2. You insert charts and design them. You can compile/download your AS program and test it at ES2. Note At no circumstance that the top plant hierarchy, settings for the plant hierarchy and OS area, and the master data library should be touched on a local ES.
3.9.2 OS engineering For OS project engineering, related tags have to be available. This is realised by compiling OS on the central ES. To compile OS, all projects of a multiproject have to be physically located on the central ES. Follow the procedure depicted in Picture 14.17 to bring back projects to the central ES. Note Compiling OS over network is not safe enough as the network can crash. For the multiproject, CH_14_MP, bring back projects, CH_14_AS2 and CH_14_AS3, and then compile OS1 on the central ES. Refer to Picture 14.20. After compiling, the tags from AS1 and AS2 will be available in the Tag Management of OS1.
PCS 7 PoT V6.0 | Edition V1.0 | August 2003 Copyright 2003 Siemens AG by A&D AS CS2 PA. All rights reserved.
Page 14 - 20
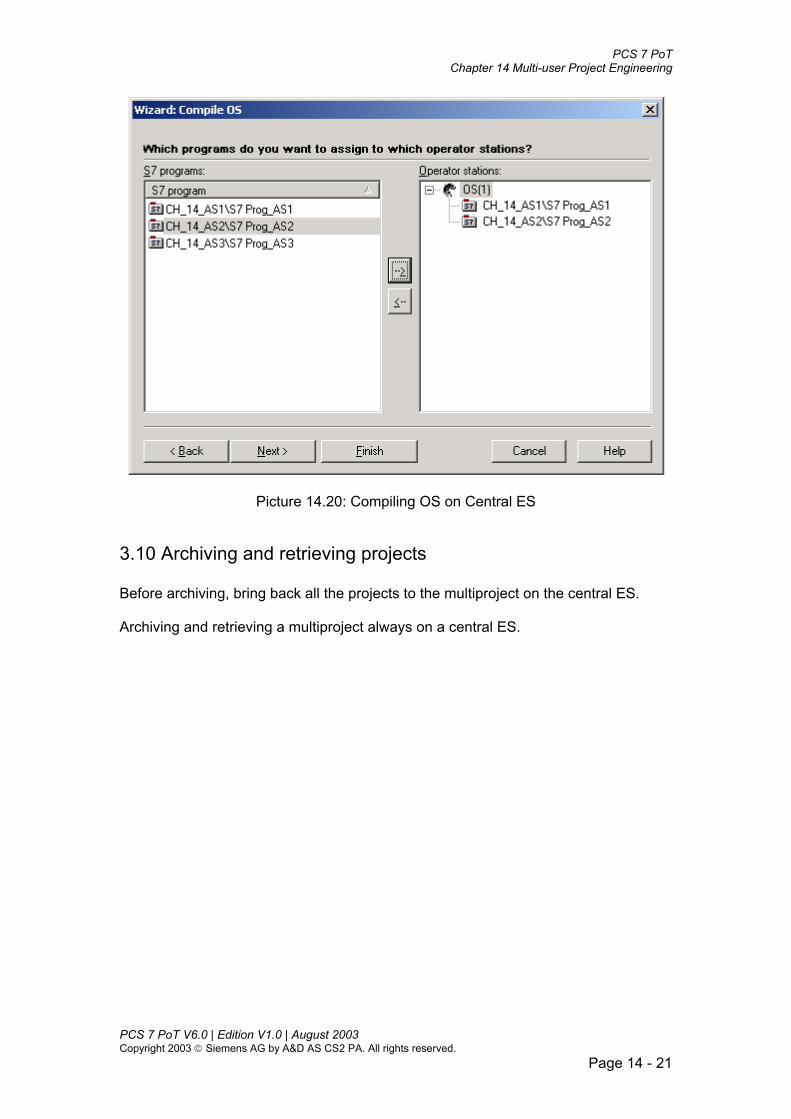
PCS 7 PoT Chapter 14 Multi-user Project Engineering
Picture 14.20: Compiling OS on Central ES
3.10 Archiving and retrieving projects Before archiving, bring back all the projects to the multiproject on the central ES. Archiving and retrieving a multiproject always on a central ES.
PCS 7 PoT V6.0 | Edition V1.0 | August 2003 Copyright 2003 Siemens AG by A&D AS CS2 PA. All rights reserved.
Page 14 - 21

PCS 7 PoT Chapter 14 Multi-user Project Engineering
PCS 7 PoT V6.0 | Edition V1.0 | August 2003 Copyright 2003 Siemens AG by A&D AS CS2 PA. All rights reserved.
Page 14 - 22

PCS 7 PoT Chapter 14 Multi-user Project Engineering
Exercise
Exercise 14.1 Multi-user project engineering
Create a multiproject, CH_14_MP using the New Project wizard. • •
• • • • • • • • • • • •
•
•
• • •
Edit the default project in CH_14_MP including: Renaming objects, e.g. to Process cell1/TANK1/… AS1 S7 Prog_AS1 Disconnecting the assignment between Process cell_1 and AS1 Setting OS area Insert an empty picture in the OS area and define the picture as Derive block icons from plant hierarchy
Copy Process cell_1 to make two more top hierarchical folders in CH_14_AS1. Create two AS projects, CH_14_AS2/3 for AS2/3. Create two OS projects, CH_14_OS1/2 for OS1/2. Copy the top 3 plant hierarchical folders from CH_14_AS1 to other 4 projects. Configure AS1 by adding the plant bus. Copy AS1 to projects CH_14_AS2/3. Configure the networks in AS2/3. Insert two PC stations and rename them as OS1/2-PC and configure them. Assign Process cell_x to ASx in Project CH_14_Asx. Assign Process cell_1/2 to OS1 in Project CH_14_OS1. Assign Process cell_3 to OS2 in Project CH_14_OS2. Merge sub-networks and configure connections in NetPro. Distribute projects:
Use Save As function for the following: CH_14_AS2 and CH_14_OS1-> ES2 CH_14_AS3 and CH_14_OS2 -> ES3 Remove CH_14_AS2/3 and CH_14_OS1/2 from CH_14_MP Delete CH_14_AS2/3 and CH_14_OS1/2 from the central ES.
Insert a CFC chart with a valve in the OS area folders in Projects CH_14_AS1/2/3. Integrate projects:
Use Save As function for the following: CH_14_AS2 and CH_14_OS1-> Central ES CH_14_AS3 and CH_14_OS2 -> Central ES Add CH_14_AS2/3, CH_14_OS1/2 to the multiproject, CH_14_MP on Central ES Delete CH_14_AS2/3 and CH_14_OS1/2 from ES2/3.
Compile OS1/2 on the central ES. Open OS1 and OS2 and check the pictures Add an I/O field in the appropriate pictures in CH_14_OS1/2 and link it with a variable in the Graphics Designer.
PCS 7 PoT V6.0 | Edition V1.0 | August 2003 Copyright 2003 Siemens AG by A&D AS CS2 PA. All rights reserved.
Page 14 - 23


