DOCUMENTED BRIEFING - RAND
57
Exploratory Analysis of “The Halt Problem” A Briefing on Methods and Initial Insights Paul K. Davis, Manuel J. Carrillo Prepared for the Office of the Secretary of Defense National Defense Research Institute R DOCUMENTED BRIEFING Approved for public release; distribution unlimited
Transcript of DOCUMENTED BRIEFING - RAND
Exploratory Analysis of“The Halt Problem”A Briefing on Methods and Initial Insights
Paul K. Davis, Manuel J. Carrillo
Prepared for theOffice of the Secretary of Defense
National Defense Research Institute
R
D O C U M E N T E D B R I E F I N G
Approved for public release; distribution unlimited

iii
PREFACE
The work described here was accomplished in the “Planning Future Forces” project ofRAND’s National Defense Research Institute (NDRI), a federally funded research anddevelopment center (FFRDC) sponsored by the Office of the Secretary of Defense, JointStaff, and Defense Agencies. The project itself is a special cross-cutting effort sponsoredby the NDRI Advisory Board (NAB) as a whole. Especially since the materialrepresents relatively informal and interim analysis within ongoing work, commentsare welcome and should be addressed to Dr. Paul K. Davis at RAND in Santa Monica,CA, or by e-mail to [email protected].

iv
v
SUMMARY
SIGNIFICANCE OF HALT-PHASE CAPABILITYA continuing U.S. military challenge is to deter or defeat armored invasions againstfriendly countries. In planning to meet this challenge, it is natural to focus on theinitial phase of a defensive campaign. In this so-called “halt phase,” the objective is tostop the army’s advance—preferably as far forward as possible to avoid significantlosses of territory and damage to the defending nation. Evident halt-phase capabilityshould be an excellent deterrent. To be sure, deterrence can fail, and in an actualconflict the halt might or might not be prompt. Subsequent operations with allied forceswould probably be needed in any case, notably: a counteroffensive to restore lost territoryand to pursue and destroy the enemy’s armed forces; and perhaps operations to secureand stabilize large areas and cities. Thus, developing halt-phase capabilities is onlyone of many challenges, but an important one. This work focuses entirely on halt-phaseissues.
NEED FOR ANALYTICAL METHODS SUPPORTINGCAPABILITIES ANALYSISMany recent studies have depended upon complex simulations of overall campaigns.The complexity has made it difficult to assess alternative forces and strategies,especially for a wide range of operational circumstances and other assumptions.We believe that it is better in capabilities analysis to first assess alternatives on anoperation-by-operation basis, using simple and transparent models that permit wide-ranging exploration of uncertainty. The tentative conclusions can then be refined withcampaign-level analyses, with high-resolution analyses illuminating the plausibility ofalternative assumptions, and with resource-allocation methodologies that include costsand measures of “How much is enough?” The overall goal should be choices thatmaximize flexibility and robustness of capability within available funding.
A SIMPLE ANALYTICAL MODEL FOR EXPLORATORY ANALYSISWith this philosophy, we describe here a simple model for aggregate-level capabilitiesanalysis of halt-phase issues. We focus on attempting to accomplish an early halt indefense of Kuwait and Saudi Arabia, where Air Force, Army, and Navy precision-strikeforces should have high leverage, and where the U.S. and its allies—in short-warningcases—would lack the in-place ground forces for effective early close combat. Groundmaneuver forces would be invaluable if available soon enough or, if precision firesproved inadequate, would still be necessary for a counteroffensive, and might be neededin large numbers. But during the halt phase, it is at least plausible that much could beaccomplished with precision fires. In this context, our model provides a lethality-focused measure of effectiveness for comparing alternative forces and operationalconcepts for early defense, a measure sensitive to many of the principal uncertainties—including the consequences of plausible enemy countermeasures and strategies.Although by no means offering a precise picture of battle dynamics, the model providesvalid insights about force capabilities—especially because it permits exploratory“scenario-space analysis” across an enormous range of assumptions and uncertainties.
In its core version the model assumes that the invading army moves at a constant speeduntil halted, and that the halt occurs either when the army reaches its objective or whenit has suffered so much attrition that it loses cohesion. The attrition may be caused byfixed-wing or rotary-wing aircraft, by precision missiles such as the Army’s ATACMSor similar missiles launched from Navy ships, or from harassment activities by smallground forces. The core version of the model ignores attrition to defender forces, butassumes the need for an initial suppression of air defenses (SEAD), during which theeffectiveness of the killer systems is degraded by amounts that differ substantially from

vi
system to system (e.g., fixed-wing aircraft may perform very few anti-armor missions,while attack helicopters may be relatively unaffected). This core version of the modelcan be solved analytically. More generally, we use a spreadsheet-simulation version,within which we can allow movement rate to slow as attrition occurs, represent attritionto defending air forces, represent force-employment strategies and even representstylized close combat with heavy ground forces. For present purposes, however, thoseembellishments (which introduce large additional uncertainties) did not pay forthemselves and the work described here omits them.
VARIABLE RESOLUTION AND EXPLORATORY ANALYSISAn unusual feature of the model is its variable-resolution design, which facilitates exploratoryanalysis across many dimensions of uncertainty. Despite the dozens of variables, theproblem’s mathematics is such that outcomes depend on a much smaller number ofintermediate, aggregate, variables (e.g., number of anti-armor D-Day aircraft). Exploratoryanalysis exploiting these intermediates can therefore be relatively comprehensive, rather thanlimited to sensitivity testing around one or two baseline cases. This analysis identifies whataggregate factors matter most to the success of defense. Follow-up work can then go intomore resolution. Aggregated but comprehensive exploratory analysis also permitssomething not readily possible with large-scale campaign models: after collecting results frommany thousands of cases dictated by an experimental design, we can search the outcomespace to discover combinations of circumstances under which various defense objectives arefeasible, and combinations of circumstances in which even impressive force capabilitieswould be inadequate—perhaps indicating existence of Achilles’ heels. Thus, we ask not just“What if?” but questions such as “Under what circumstances can...?”
Although examining many thousands of runs, we accomplished the computations on a singleMacintosh computer. We used RAND’s Data View program on a Sun SPARC work station togenerate graphical displays for exploring the outcome space, and we then copied keydisplays into the Power Point program used for this briefing. Thus, ambitiouslymultidimensional exploratory analysis can be accomplished with familiar desktop tools. Webelieve that this is important to improving the quality of defense analysis more generally, andthat there is need for a whole suite of simplified models to assess capabilities for diversemilitary operations (e.g., counteroffensives and forced-entry operations). Although thesemodels would be no substitute for detailed simulations, they would provide information atthe level of forests rather than trees, and would greatly assist capabilities-based planningunder massive uncertainty.
FEASIBILITY OF A QUICK AND DECISIVE HALT PHASE WITHOUTHEAVY GROUND FORCES Our exploratory analysis of halt-phase issues demonstrates that probable outcomes aresensitive to a myriad of interacting factors. Simple conclusions would be inappropriate,because results depend on everything from the quantity of pre-positioned forces towarning time, weapon-system lethality, the duration of the SEAD campaign,degradations of effectiveness during that campaign, and so on. If we are interested in aforward defense, however, a few points are clear:
• A forward defense in or near Kuwait is feasible, but only in certaincircumstances providing numerous (e.g., 100-150) precision-fire systemsavailable in theater on D-Day.
• Successful defense would depend critically on greatly slowing the rate of enemyadvance. This probably implies the necessity of allied ground forces effective inthat slowing function (perhaps supplemented by U.S. advisors and specialforces). Thus, efforts to improve allied forces—for specialized functions—becomenot just interesting options, but essential measures.
vii
• Successful forward defense would probably require the lethalities of advancedmunitions (e.g., sensor-fused weapons and BAT), a much higher deployment ratefor Air Force tactical aircraft than will be possible with current programs, andsignificant capability (e.g., stealthy aircraft and standoff munitions) for anti-armor missions during the SEAD campaign.
• Any of the several anti-armor options under consideration could be quite capablein principle, but they have different shortcomings (e.g., vulnerabilities todifferent kinds of air defenses and dependencies on somewhat different forms ofC4ISR), which suggests that a mixed-force approach would provide better, andbetter-hedged, capability.
• Force-employment strategy for air forces has large consequences. Rich anddetailed analysis will be necessary to decide such matters, but our aggregateanalysis indicates that there are high costs for delaying massive anti-armorattacks until in-depth air-defense and SEAD operations are complete, and forassigning only a fraction of available aircraft to anti-armor missions. Further,as emphasized in other RAND work by Kent, Ochmanek, and Harshberger,*there may be important benefits to focusing attacks on the leading edges ofinvader attacks—especially if roads and logistics limit the fraction of theinvader force on line.
• Pursuing capabilities for forward defense is well worth doing even though suchdefense capabilities would stress U.S. forces in many ways and even thoughprospects look marginal with conservative assumptions about scenario andthreat. Planning should recognize that the breaks might favor the defense in theevent of an actual crisis or invasion. In particular, the feasibility of an earlyhalt would be enhanced if merely the Iraqi invasion forces were smaller or—most important—less competent and resolute than usually assumed (withoutempirical basis), or if attacks on logistical and other support vehicles had moreeffect than is currently reflected in models. Further, if a forward defense werenot successful in halting the invading army, it would still much improveprospects for decisively successful defense-in-depth by ground forces such asthose deploying to prepositioned equipment (either on the ground or on ships).
TRADEOFFSThe model may be used for direct tradeoffs, but we have avoided doing so becausechoices should be informed by a broader range of considerations, many of which aresoft. One is whether, for a given operational concept, the Services and operationalcommands in question would commit to turning the concept into “real” capability, evenif that meant substantial changes in doctrine and priorities. Another involves D-Dayeffectiveness of C4ISR and operations. Most studies are probably overly optimistic aboutsuch matters.
POTENTIAL POLICY IMPLICATIONSAs discussed here and in earlier work (RAND’s “Access study” for OUSDP(S&R)),establishing a defense-in-Kuwait objective in defense planning guidance andcontingency planning guidance could be a powerful forcing function for beginning atransformation of U.S. forces consistent with Joint Vision 2010 and the QDR. Abalanced approach would include: early introduction of rapid-deployment anti-armorunits into the operational force; ambitious operations plans (with fallbacks); vigorousand unprecedented activities with Persian Gulf allies; and rigorous joint and combinedexperiments using a combination of live activities and distributed simulations. Theanalysis methods in this study could help guide the design of such experiments.
*See Ochmanek, Harshberger, and Thaler (forthcoming). The report uses a model developed byGlenn Kent.

viii

ix
ACKNOWLEDGMENTS
We appreciate discussions with RAND colleagues Roger Brown, Edward Harshberger,Richard Hillestad, Glenn Kent, and John Schrader. They and we have been pursuingrelated concepts in a number of studies for the DoD, Air Force, and Army; we arebenefiting greatly from the overlap and resulting debates. We thank Richard Mesicand Myron Hura for their comments on the draft and Lou Moore for both discussion andtechnical suggestions.

1
This briefing describes a simplified analysis of the “halt-phase problem” highlighted in the Quadrennial Defense Review (QDR) (Cohen, 1997).1 In contrast with most studies (including some of our own), we focus on stopping an invading army early—even in short- or ambiguous-warning circumstances when significant heavy ground forces are not available. This action might avoid strategically significant losses and coalition problems.
The perspective taken is decidedly joint because there are many force options for halting an advancing army and some of them can be complementary as well as competitive. Thus, the analysis—while highly simplified in some respects—can reflect effects of Air Force and Navy aircraft, missiles from Navy Arsenal Ships, Army or Marine attack helicopters, Army MLRS/ATACMs units, and small allied ground forces with either helicopters or ATACMs. One purpose of the work is to illustrate a relatively transparent analytical methodology that could be used by OSD and the Joint Staff to stimulate and assess Service and Command initiatives for improving halt-phase capabilities (including initiatives involving allies). We refer to the work as “exploratory analysis” because the premium is on understanding what capabilities could be achieved in a variety of ways under an enormous range of assumptions about weapon systems, threat, and other scenario details. Our study also includes some substantive conclusions in the form of insights. We hope they will prove useful in developing defense planning guidance.
RAND NDRI
Exploratory Analysis of “Halt Problem”: A Briefing On Methods and Initial Insights
Documented Briefing DB 232-OSD
Paul K. Davis and Manuel CarrilloAugust, 1997
Work for NDRI Advisory Board (NAB) and OUSDP(S&R)
______1In a nominal major theater war, the halt phase might be followed by a “build-up-and-pound phase” during which friendly forces prepare for a subsequent counteroffensive to restore lost territory and, as appropriate, pursue and defeat enemy forces. Halting armored invasions is only one of many operations for which the United States needs robust capabilities, but it is an important one.
2
The structure of the briefing is shown here. We start with some project background, define the analytical model, present the results of initial analysis, draw conclusions, and provide backup material and a bibliography.
RAND NDRI
Contents
• Background• Model
• Initial Exploratory Analysis• Conclusions
• Backup Material and Bibliography

3
This work originated in “The Access Study” done for the strategy and resources office of the Under Secretary for Policy [OUSDP(S&R)]. That study (Davis, et al., 1997) examined the potential implications of base-access problems for U.S. ability to defend in the Persian Gulf. It went on to discuss measures that could improve U.S. ability to halt an advancing army quickly.
Another impetus was the prominence of the halt-phase problem in efforts to think about how best to “transform” the force as discussed in the Quadrennial Defense Review (QDR). These issues are key elements of an ongoing “Planning Future Forces” study for NDRI’s Advisory Board (NAB), which includes work on creating new high-technology forces to address Achilles’ Heels problems.2
A parallel impetus is technical. The future of analysis depends (NRC, 1997) on improved concepts, theories, and tools for dealing with multiple levels of resolution (MRM), and for accomplishing exploratory analysis in a serious treatment of uncertainty. DARPA is currently sponsoring RAND research on the former issue, and RAND has been pursuing the latter in a number of efforts.3
RAND NDRI
Background: Origins of Work
Substantive:– “Access Project” for S&R
– “Planning Future Forces Project” for NDRI Advisory Board (NAB)
– Anticipated “RMA/Transformation” Project for NAB• Need measures of modernization’s value
Technical– Multi-resolution modeling (MRM) theory for DARPA– RAND’s continuing research on exploratory analysis
______2For prior work on the project, see Davis, Gompert, and Kugler (1996); Davis, Hillestad, and Kugler (1997); and Davis, Hillestad, and Crawford (1997).3See Bankes (1994); Brooks, Bennett, and Bankes (1997); and Davis, Hillestad, and Crawford (1997) for other discussions of exploratory analysis. Colleague Lou Moore has used exploratory analysis to consider a range of possible Army structures that could be effective in rapid-deployment scenarios (Moore, unpublished).

4
With this background, let us now describe the analytical model. Again, our purpose in this work is to simplify and focus—in constrast to the more detailed work associated with relatively sophisticated campaign models.
RAND NDRI
Contents
• Background• Model
• Initial Exploratory Analysis• Conclusions
• Backup Material and Bibliography
5
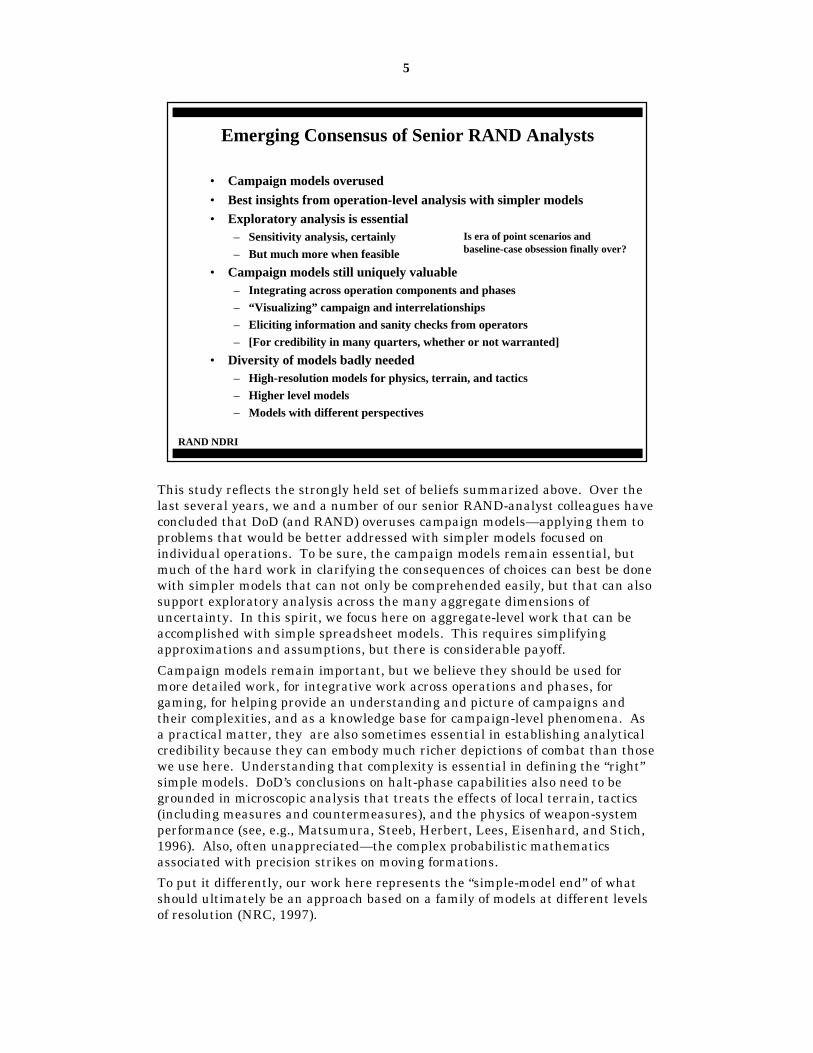
This study reflects the strongly held set of beliefs summarized above. Over the last several years, we and a number of our senior RAND-analyst colleagues have concluded that DoD (and RAND) overuses campaign models—applying them to problems that would be better addressed with simpler models focused on individual operations. To be sure, the campaign models remain essential, but much of the hard work in clarifying the consequences of choices can best be done with simpler models that can not only be comprehended easily, but that can also support exploratory analysis across the many aggregate dimensions of uncertainty. In this spirit, we focus here on aggregate-level work that can be accomplished with simple spreadsheet models. This requires simplifying approximations and assumptions, but there is considerable payoff.
Campaign models remain important, but we believe they should be used for more detailed work, for integrative work across operations and phases, for gaming, for helping provide an understanding and picture of campaigns and their complexities, and as a knowledge base for campaign-level phenomena. As a practical matter, they are also sometimes essential in establishing analytical credibility because they can embody much richer depictions of combat than those we use here. Understanding that complexity is essential in defining the “right” simple models. DoD’s conclusions on halt-phase capabilities also need to be grounded in microscopic analysis that treats the effects of local terrain, tactics (including measures and countermeasures), and the physics of weapon-system performance (see, e.g., Matsumura, Steeb, Herbert, Lees, Eisenhard, and Stich, 1996). Also, often unappreciated—the complex probabilistic mathematics associated with precision strikes on moving formations.
To put it differently, our work here represents the “simple-model end” of what should ultimately be an approach based on a family of models at different levels of resolution (NRC, 1997).
RAND NDRI
Emerging Consensus of Senior RAND Analysts
• Campaign models overused
• Best insights from operation-level analysis with simpler models• Exploratory analysis is essential
– Sensitivity analysis, certainly
– But much more when feasible
• Campaign models still uniquely valuable – Integrating across operation components and phases
– “Visualizing” campaign and interrelationships
– Eliciting information and sanity checks from operators
– [For credibility in many quarters, whether or not warranted]
• Diversity of models badly needed– High-resolution models for physics, terrain, and tactics
– Higher level models
– Models with different perspectives
Is era of point scenarios and baseline-case obsession finally over?

6
Let us now get into the research itself.
The problem we are taking on is a core challenge for what may be called “Era-A RMA.” By that we mean the part of the revolution in military affairs (RMA) that deals with the window in time (perhaps 10 years or so) during which the United States can plausibly achieve extraordinary military dominance in some circumstances through exploitation of precision fires, information dominance, and so on. We should be able to make armored invasions virtually obsolete. This reality will still be important in the longer run (Era B), but in that era military affairs will be more complicated because even second-rate militaries will be able to cause great difficulties for current U.S. forces.4
In any case, the halt-phase problem is potentially an excellent “forcing function” for use in defense planning guidance and Joint Staff guidance to commands. It could assist the transformation envisioned in Joint Vision 2010 and the QDR.
A key to success as a forcing function is moving away from the usual approach of measuring outcome by keeping the invading Iraqi forces away from the Gulf coast, or at least from the key oil facilities. That is not nearly ambitious enough: first, the United States could be undercutting deterrence by planning to “give away” Kuwait, at least temporarily;5 and, second, it is not evident that it would be straightforward to evict a future Iraq with weapons of mass destruction (WMD) and forces ensconced in Kuwait City and elsewhere. Saddam or his successor might not be so foolish as in 1991, and our allies might not be so supportive. Hence, it is of interest to consider defense in Kuwait itself. But is it even feasible?
RAND NDRI
Problem: Halting an Invading Army With Precision Weapons
Background• Core challenge for “Era-A RMA”
• Forcing function for transformation• Most studies “give away” Kuwait
– Defense seen as too hard
– But retaking territory could be costly with urban warfare or WMD
– More forward defense would be better if possible
– Fallback would always be to defense-in-depth
Questions• Is forward defense (=defense in Kuwait) feasible? When?
• What force improvements would have highest leverage?
______4Possible problems include medium-range missiles with chemical and biological weapons endangering tactical air bases, surveillance capabilities adequate to endanger relatively nearby surface ships, high-quality mobile air defenses, and lethal conventional weapons. 5Further, we need challenges that force programmatic and organizational changes believed to be desirable for many reasons.

7
The problem is described above at increasing levels of complexity. The focus here is on Level 3. Level-4 work with a good deal of concern about joint matters is planned by RAND’s Project Air Force for FY 1998. This work could prove useful because strategy and tactics can be a dominating factor. The analysis we present here is broadly consistent with commonly made assumptions about such matters, but those assumptions are not satisfactory. We mention some of the reasons for this later.
RAND NDRI
Problem Statements With Increasing Complexity
Mechanized army invades across desertObjective: halt army early with long-range precision strike from air
forces, naval missiles (arsenal ship), and ground forces Level 1: simple race; constant-speed movement vs. deployment of
precision-fire forcesLevel 2: complications of SEAD and ground-force effort
Level 3: complications of mixed aircraft (fixed-wing, helicopters) and additional ground-force capability (MLRS/ATACMS)
Level 4: explicit attacker tactics (dispersal, concentration in time, decoys), defender counters (loitering...), etc.

8
As a first step, we used Microsoft Excel™ to build a “natural” simulation model for the air-forces-only problem (a special case of Level 1), one that reflected the way simulation modelers would ordinarily go about the problem. We wanted to observe in some detail how this differed from an approach more sensitive to analytical insight and multi-resolution modeling desires.
The result, even in this very simple problem, was a model with 12 parameters. A proponent of spreadsheet models might assert that the model is simple and easy to use for “What if?” analysis. However, 12 is not a small number and, while it is easy to do individual sensitivities, it is difficult to do exploratory analysis in which one considers the effect of changing the parameters simultaneously. It is then easy to draw erroneous conclusions—essentially by treating as fixed the parameters that are as uncertain as the ones varied, and then forgetting the extra degrees of freedom.6
The general problem here is the curse of dimensionality.
RAND NDRI
Baseline: a “Natural” Simulation Model forDefense With Air Forces Alone
Inputs• Speed
• Objective
• Initial aircraft
• Warning time
• Deployment rate• Kills per sortie
• Sorties per day
• D-Day missiles
• Kills per missile
• Number of divisions• Number of armored vehicles per
division
• Break point
Outputs
• Penetration vs. time• Number of remaining vehicles
and divisions vs. time
• Number of aircraft in theater vs. time
• 12 parameters in even a simple model!• “Best-estimate” analysis not meaningful and misleading, but• Exploratory analysis difficult: even here,
Curse of dimensionality
______6One example here involves the “break point” assumed in calculations. If an invading Iraqi army suffered from morale problems, poor leadership, or simple lack of motivation, it might well “halt” long before half of its armored vehicles had been destroyed. However, by building an analysis around the conservative assumption of a break point at 50%, one might gain the impression that halting the invasion was impossible—not even worth trying. Had the British taken an analogously conservative approach in the Falklands war, history would have been quite different.

9
As we add the embellishments in a “natural” way, the simulation quickly proliferates parameters. One soon ends up with scores of parameters.
RAND NDRI
Result of Adding Complexity
• Proliferation of parameters:– types of aircraft and loadings
– before-and-after SEAD data
– parameters of MLRS/ATACMS
– parameters of movement-rate model
– decision algorithms and parameters related to allocation of fire and dispersal of forces
– deployment rates for all
• More dimensions of phenomenology:– attacks on logistical vehicles and support structure– alternative force-employment tactics and strategy (deep vs. shallow,
leading-edge attack; allocations anti-armor vs. other missions over time...)
– Scores of parameters

10
This is not the place to discuss the mathematical theory, but a few figures can demonstrate that even complex versions of the problem are comprehensible.7
RAND NDRI
A Bit of Theory
The Point: while very multidimensional, problem is not theoretically difficult
______7Some of what follows was developed in part for a small DARPA project on modeling theory.

11
The next figure provides more explanation, but this one shows in outline the problem tree resulting from a desire to build in variable (or multiple level) resolution. The principal point here is that the solution (the distance D at which the invader stops) depends on only five intermediate variables (the items in boxes). One needn’t deal explicitly with all of the low-level variables in a first exploration. If a given intermediate variable proves critical, then one can explore how it might come to have alternative values.
RAND NDRI
Tree for Initial Problem(from January, 1996 paper for S&R access paper)
D
V Obj
Th
Ao W RF
R F
N VPD H
BK S
αλ
δξ
VHtot
Only 5 keyvariables forexploration

12
The initial model depicts a race between the advancing attacker and the defender, who is deploying air forces that cause attrition to the invader. There is no close combat. Attrition to the defender is ignored, but we will use effectiveness numbers that reflect air-force tactics avoiding significant attrition. The problem’s mathematical structure is shown here. The penetration distance D depends on the attacker’s speed V, his objective Obj, and the time it takes either to reach the objective (Obj/V) or for the defender to halt the advance, Th. That time depends on the supply of killers, which depends on the initial number of aircraft and missiles, the warning time during which more deployment occurs, the deployment rate, and so on. It also depends on the number of targets to be killed and the effectiveness with which aircraft and missiles kill targets.
The main feature of the figure is its hierarchical structure. The intermediate variables would not appear in a standard model, but they “pop out” in a theoretical approach. For example, the number of aircraft present on D-Day, λ, depends on the initial number of aircraft, the warning time, and the deployment rate. The initial number of aircraft and warning time affect the problem only through λ. So also, in this case, a key intermediate variable is α , the number of aircraft days required to kill enough vehicles to cause a halt. And so on.8
By building the analytical model as shown, we can do exploratory analysis at the intermediate levels—with many fewer variables. We also built a simulation model with a variation of this design,9 for use in subsequent work that allowed V to vary, considered defender-force attrition, and included some other embellishments.
RAND NDRI
Tree for Initial Problem (With Name Tags)
D
V
Obj
Th
Ao W RF
R F
N VPD H
BK S
α
λ
δξ
VHtot
Only 5 keyvariables forexploration Speed Halt Time
Penetration Distance
Attacker’s objective
Aircraft-daysneeded for halt
Vehicles to kill Kills/ac-day
Kills persortie;sorties per dayKills by missiles
Vehicles
Divisions, vehicles perdivision, break point
Deploymentrate for fixed-wing ac;Fraction foranti-armor
Fixed-winganti-armoraircraft presentinitially
Warning time
Anti-armor fixed-wingaircrafton D-Day
______8This illustrates “integrated hierarchical variable resolution (IHVR) modeling” as described in Davis (1996) and NRC (1997).9The design for the simulation model focuses on a data-flow diagram in which the top of the tree is the invader’s ground advance in the next increment of time. The tree is otherwise similar.

13
What happens if we generalize to include suppression of air defenses (SEAD) as a distinct phase during which fixed-wing aircraft are much less effective for anti-armor attacks, and a variety of other sources of precision fire: e.g., Army (or Marine) attack helicopters, Navy missiles from an arsenal ship or some other platform, Army MLRS/ATACMS, and perhaps different classes of tactical aircraft?
This figure shows the revised tree, which is only a bit more complex conceptually than before—if one merely uses vectors and matrices. The ultimate computer program will be more complicated by having many more variables, boundary conditions, and so on, but the problem’s essence is much the same. What is new is the concept of a SEAD campaign during which the killer systems may (or may not) be less effective, and recognizing that most of the variables (e.g., δ) must be matrices as indicated by underlines. That is, there is a kills/day contribution from each of the killer systems; each such contribution depends on the kills per sortie (or volley) of that system, the sorties (or volleys) per day of that system, and the extent to which that system’s effectiveness is degraded during the SEAD phase.
Conceptually, then, the problem is similar to the original one. From the viewpoint of dimensionality, however, there are now 28 lower-level parameters.10 Even if we exploit the hierarchical variable-resolution or multi-resolution design approach, there are as many as 13 intermediate parameters. Still, that is much smaller than 28. And, in practice we can reduce the dimensionality further.
RAND NDRI
Problem Tree With SEAD, Helos, and Missiles
D
V ObjTh
Ao W RF
R F
N VPD H
BK S
λ
δ(t)ξ
VHtot
7 variables, some matrices;13 higher para-meters; 28low-level.
Speed Halt Time (if>Obj/V)
Penetration Distance
Attacker’s objective
Vehicles to killKills/day-system
Kills per sortie or volley; sorties or volleys per dayKills by
naval missiles
Vehicles
Divisions, vehicles perdivision, break point
Deploymentrates of shooters;Fraction foranti-armor
Anti-armorshooters presentinitially
Warning time
Anti-armor shooters on D-Day
φ′
Ts
Time to suppressair defenses (ifT>Ts)
Multiplier (<=1)of capability during SEAD
______10This assumes one type of fixed-wing aircraft, one type of helicopter, and one type of ground-force missile unit, each of which has its own initial number in theater, “warning time” (time to deploy before D-Day), deployment rate, effectiveness, etc. Parameters would proliferate further if more type systems were introduced, but the tree structure would be the same. Some important extensions might include representing effects of attacking logistical or support vehicles, and command-and-control nodes; and representing force-employment strategy explicitly.
14
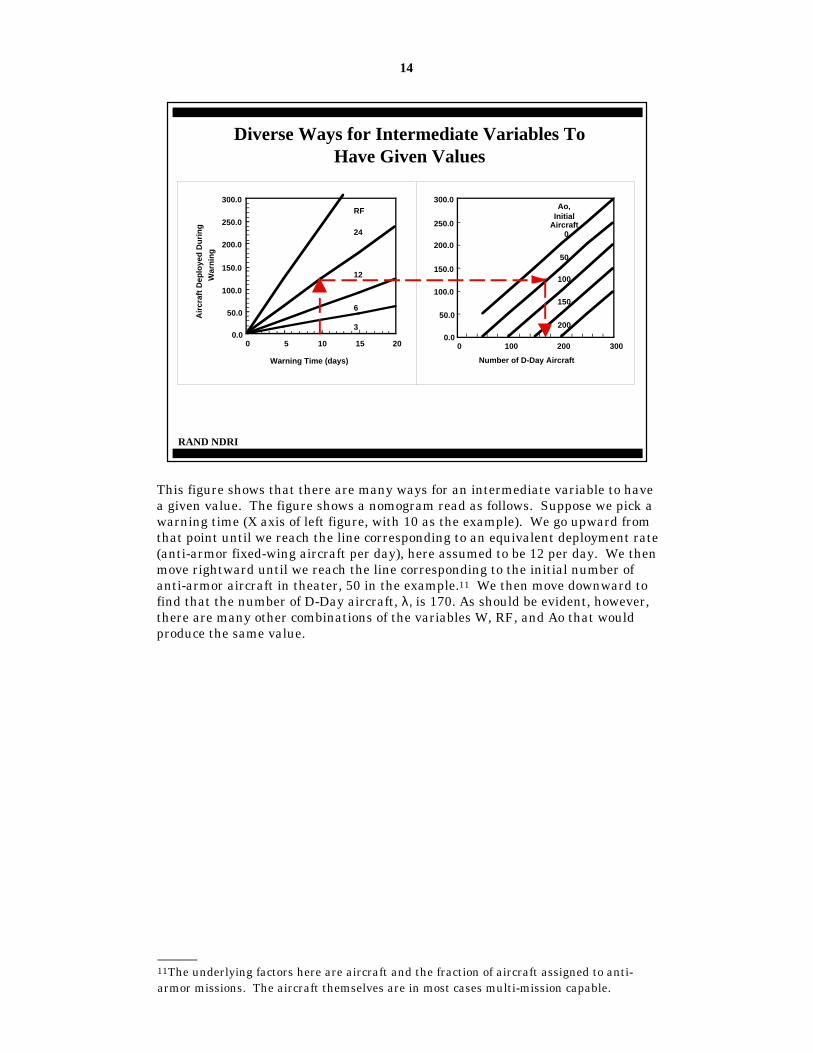
This figure shows that there are many ways for an intermediate variable to have a given value. The figure shows a nomogram read as follows. Suppose we pick a warning time (X axis of left figure, with 10 as the example). We go upward from that point until we reach the line corresponding to an equivalent deployment rate (anti-armor fixed-wing aircraft per day), here assumed to be 12 per day. We then move rightward until we reach the line corresponding to the initial number of anti-armor aircraft in theater, 50 in the example.11 We then move downward to find that the number of D-Day aircraft, λ, is 170. As should be evident, however, there are many other combinations of the variables W, RF, and Ao that would produce the same value.
RAND NDRI
Diverse Ways for Intermediate Variables To Have Given Values
0.0
50.0
100.0
150.0
200.0
250.0
300.0
0 5 10 15 20
Warning Time (days)
Air
craf
t D
eplo
yed
Du
rin
g
War
nin
gRF
24
12
6
30.0
50.0
100.0
150.0
200.0
250.0
300.0
0 100 200 300
Number of D-Day Aircraft
Ao,Initial
Aircraft 0
50
100
150
200
______11The underlying factors here are aircraft and the fraction of aircraft assigned to anti-armor missions. The aircraft themselves are in most cases multi-mission capable.

15
This nomogram illustrates calculation of ξ, which is the number of armored vehicles that remain to be killed after initial missile attacks to achieve a halt. For the example shown (11 divisions, 700 vehicles per division, a break point of 0.5, and 250 missile kills),12 the value of ξ would be 3600.
RAND NDRI
Nomogram For ξ, Vehicles To Be Killed For Halt After Missile Attack
0
2000
4000
6000
8000
10000
12000
0 5 10 15
Number of Divisions
Arm
ore
d V
ehic
les
VPD600700800
0
2000
4000
6000
8000
10000
12000
0 2000 6000 8000
Break Point H 0.3
0500
100015002000
2500300035004000
45005000
0 2000 4000 6000 8000
Vehicles To Be Killed
Pse
e
0, 250, 500, 1000
0.2 0.70.50.4
4000
Missile Kills
______12The missile kills we have in mind might be due to an arsenal ship or other naval surface ships present on D-Day. The kills might be accomplished early, even on D-Day. How many kills would be feasible would depend on C4ISR, maneuver tactics, munitions, range (which affects the number of weapons per missile and the difficulty in subsequent acquisition), and the fraction of the missiles used against armor rather than other targets such as command and control or defense sites. So long as the kills are achieved prior to the halt time, they can be modeled as occurring at the moment the war begins. In this work we assume that the missiles in question are present at D-Day and that no further deployments occur in the period of interest. More generally, this class of killer system could, of course, be treated in parallel with the others. It would then have an initial level, deployment rate, daily firing rate, effectiveness per shot, and so on.

16
RAND NDRI
For Those Who Like Mathematics, Problem Is Solvable(if movement rate is constant and own attrition ignored)
Halt time can be found in closed-form solution. For Th> Ts,
Complexity is contained in the vectors and matrices
D = MIN(Obj,V * Th )
Th = ς"2 +2ψ " −ς"
ς' ' =rδ •
rλ + b
rδ •
rΓ
ψ ' ' = 1rδ •
rΓ
ξ + (rδ −
rΦ) • (
rλTs + 1
2
rΓTs
2)
Bad news: most improvementsenter through square root.Exception: Value of D-Day forces
rλ = l f ,lh{ }
rδ = δf ,δh{ }
rϕ = ϕ f ,ϕ h{ }rΦ = ϕ
fδ
f,ϕ
hδ
h{ } rΓ = R
fF
f,R
hF
h{ }
Note: This formulationtreats ground forcesystems separately, via b.They can be folded intothe vectors instead.
Without elaboration, let us merely note that the problem specified can be solvedanalytically in closed form with nothing more than modest calculus and linearalgebra (see backup material for details). This is significant for several reasons:
• The calculation can be done in a fraction of a second, making it possibleto do exploratory analysis on one’s desktop PC (or Macintosh).
• The analytic form tells us that some improvement measures will nothave the leverage we would like because they fall within a square-rootterm.
• We could find “shadow prices” by differentiation. That is, if we know thecost of an additional unit of any given system or system performanceenhancement, then we can estimate the relative cost effectiveness ofvarious improvements on the margin, by merely taking the derivatives.
This is certainly a special case and, more typically, closed-form solutions are notvery useful because they require unreasonable approximations. In those cases,however, much can still be done with relatively simple spreadsheet-levelsimulation models.

17
This figure illustrates a more or less “normal” sensitivity analysis (taken from Davis et al., 1997), in this case showing the effects of three variables: λ, α, and V for the case in which only fixed-wing aircraft are being used. Recall that λ is the number of D-Day aircraft, α is the number of aircraft days to destroy the requisite number of vehicles to cause a halt (proportional to threat and break point, and inversely proportional to the sortie rate and per-sortie effectiveness), and V is the movement rate.
This type of display has the advantage of being graphical and, in instances in which one can hold many variables constant, it is arguably the preferred approach to showing sensitivities. In what follows, however, we want to illustrate the results of many more dimensions of uncertainty. For that we shall need different display techniques.
RAND NDRI
Illustrative Sensitivity Analysis (3 variables)(see “Access study”)
0
100
200
300
400
500
600
0 100 200 300Lambda (ac)
Pen
etra
tio
n (
km)
20
40
60
(Air-to-ground aircraft available on D-Day)
Speed (km/day)
α = 1000Dhahran
Gulf coast
Wariah
Saudi border
0
100
200
300
400
500
600
0 100 200 300
Lambda (ac)
Pen
etra
tio
n (
km)
20
40
60
(Air-to-ground aircraft available on D-Day)
Speed (km/day)
α = 3000Dhahran
Gulf coast
Wariah
Saudi border
0
100
200
300
400
500
600
0 100 200 300Lambda (ac)
Pen
etra
tio
n (
km)
20
40
60
(Air-to-ground aircraft available on D-Day)
Speed (km/day)
α = 2000Dhahran
Gulf coast
Wariah
Saudi border

18
Let us now move to the exploratory analysis.
RAND NDRI
Contents
• Background• Model
• Initial Exploratory Analysis• Conclusions
• Backup Material and Bibliography

19
To reiterate, the model is simple and fast, so we can do exploratory analysis conveniently.
A core reason for exploratory analysis is that it allows us to go beyond one-at-a-time What if? questions, and to ask questions such as “Under what combinations of capabilities and assumptions would defense of Kuwait be possible?” This is ideal for capabilities analysis, because we can avoid assuming away important possibilities, or drawing conclusions implicitly sensitive to dubious “requirements.”13
Another reason for the simplified analysis is its utility in tradeoff studies measuring both cost and effectiveness. We have in mind other work on the same project using colleague Richard Hillestad’s DynaRank methodology.14
RAND NDRI
Moving On To Fuller Exploratory Analysis
• Whether in closed-form or simulation, problem is quickly solved on PC• Full exploratory analysis is feasible—on PC!
– (with UNIX for some displays)
– Key: using aggregate variables or problem trees
• Questions of interest:– Is defense of Kuwait feasible?
– If so, “when?” (what combinations of capabilities and assumptions?)
– Where is there leverage?
– Note: “beyond what-if” questions
• [Next step: use results in Hillestad’s DynaRank methodology with costing data]
______13See Brooks, Bankes, and Bennett (1997) for an application of exploratory analysis to the deep-attack weapons-mix issue.14The DynaRank methodology assists in assessing where to place the next marginal dollar (or where to take the marginal cut). It is a spreadsheet tool for decision support using the portfolio-management approach to defense planning discussed in Davis,Gompert, and Kugler (1996), which is closely consistent with the QDR’s new strategy.

20
What constitutes an exploratory analysis? In this initial work, we assumed a constant attacker objective of reaching Dhahran. The defender’s objective is to stop the advance in Kuwait, or at least well away from the Gulf coast. In the work shown here we do not include ground combat or the possible influence of MLRS/ATACMS. The latter could be quite important,15 but the intention here was to highlight the potential role of helicopters in combination with fixed-wing aircraft. Although we shall relax this later in the paper, at this point we also hold constant at 3600 the number of vehicles to be killed by tacair and helos. This number would apply if, for example, Iraq had 11 divisions with 700 armored vehicles each, the break point were 0.5, and there were 250 initial kills by Navy missiles launched from an arsenal ship. Many other combinations of division number, composition, and offshore missiles would produce the same number.
With these items held constant, our first exploratory analysis involved 1944 cases, the result of varying speed, D-Day fixed-wing aircraft, etc., as shown.16 We were using a “factorial design” in which the number of cases is the cross product of the number of cases of each variable. Thus, this is not a simple sensitivity analysis in which one has a baseline and considers the effects of varying one or two parameters at a time.
Because the model is simple and analytical, the total run time was five minutes.
RAND NDRI
Assumptions and Initial Explorations
Held ConstantAttacker Objective: Dhahran, about 588 km
Defender Objective: Defense in Kuwait, within about 100 km
No ground combat and no MLRS/ATACMs
Vehicles to be killed for halt: 3600
Experimental Design (Factorial Design)Speed: 20, 40, 60 km/day
D-Day fixed-wing aircraft: 0, 100, 200
D-Day helicopters: 0, 50
Duration of SEAD campaign: 2, 8 days
Multiplier of fixed-wing ac effectiveness during SEAD: 0.1, 0.5Multiplier of helo effectiveness during SEAD: 0.75
Kills/day-ac: 1, 2, 10 [fixed wing]
Kills/day-helo: 2, 4, 16
Effective deployment rate: 3, 6, 12 anti-armor ac/day [fixed wing only]
Example:11 divisions700 armored vehicles eachbreak point of 0.5250 kills from arsenal shipResult: 3600 left to kill
Factorial design:1944 cases
______15See the recent DAWMS (Deep Attack Weapons Mix) study, Institute for Defense Analyses or, e.g., Davis, Hillestad, and Crawford (1997).16In subsequent work we have done a more comprehensive set of cases numbering in the hundreds of thousands.

21
A pause is appropriate to discuss what the parameter values mean. In this figure we consider cases of 1 to 10 kills per aircraft-day, or of 4 to 16 kills per attack-helicopter day.
Consider first the high-end numbers. With advanced weapons (e.g., sensor-fused weapons, or possibly a BAT munition), F-15E or F-18E/F aircraft might achieve 10 kills per day according to analysis by colleague Glenn Kent, which reflects field-test data.17 This figure assumes dispersion of attacker forces to minimize effects of U.S. precision weapons. Much higher numbers are plausible against an invader following more traditional doctrine (e.g., 50m rather than 100m spacings). The figure also accounts for imperfections of weapon delivery. On the other hand, it assumes a match between when the invader is on the road and when aircraft are on the scene. It also assumes reasonably convenient basing and infrastructure.
The attacker, however, could concentrate maneuver in short periods of time (more like 2 than 24 hours of the day) and, if those periods were unpredictable, very few of the available air forces would be flying when needed. Loiter tactics would help, as would good tactical intelligence. The most favorable point here is that it is by no means clear that the invader could in fact “hide” during the time he was not maneuvering. At least in the desert, there might be no opportunities to do so. Even with camouflage, the approximate hide sites might be known from JSTARS and UAVs observing where moving targets disappeared. But perhaps not. In any case, dash tactics and a wide variety of other countermeasures are plausible. Further, chemical attacks on close airfields are plausible, which would force aircraft to operate from more distant bases, probably with less infrastructure, with reductions in sortie rate. Thus, the 1 kill per day level should be considered. And, during the SEAD period, effectiveness might be almost zero.
Similar reasoning leads to a variety of assumptions about helicopter effectiveness.
RAND NDRI
Thinking About Parameter Values for Air Forces
SystemIllustrativeCircumstances
Kills PerDay Comments
F-15Es orF-18E/F withMavericks
Continuous invasion;no complications
2 (afterSEAD)
E.g., 2 sortiesper day X 1kill persortie
F-15E orF-18E/F withSFWs
Continuous invasion;no counters exceptdispersal
10 (afterSEAD)
E.g., 2 sortiesper day X 5kills persortie
F-15E withSFWs
Dash-tactics; somedecoys; dispersal;chemical attacks onclose bases; threats toJSTARS...
1 (afterSEAD)
Canattackersreally hide?
Attack heloswith futureloads
No special counters tohelos
16 E.g., 4 sortiesper day X 4kills persortie
Attack heloswith futureloads
Numerous dispersedinfantry with shoulderSAMs
4 ? E.g., 4 sortiesper day X 1per sortie
______17The number 10 is ours, but inferred roughly from Kent’s work.

22
In a similar spirit, consider briefly what determines the numbers of D-Day killer systems. This figure shows the issues in more detail—going beyond the cases actually run to include the more general picture we intend to explore. Note that D-Day anti-armor systems depends on what was there from the outset, warning time, deployment rates, and allocations of fire (e.g., between deep strategic targets, SEAD targets, and armored forces). To understand deployment rates in detail one must get into issues such as prepositioning, whether in the particular scenario the prepositioned equipment is in the right location, and so on. All of this is perhaps an advertisement for the need to do analysis at different levels of resolution and to have models that explicitly relate those levels.18
For now, let it suffice to say that it seemed reasonable—from a look at many possible cases—to consider a range of D-Day aircraft (AF and Navy combined) from 0 to 200. We looked at 0 and 50 attack helicopters. As for deployment rates, we assumed in this first cut at the analysis that only air forces would be deploying after D-Day. We considered deployment rates roughly half and twice the current rate.
RAND NDRI
Thinking About Numbers of SystemsD-Day killer systems
Pre-deployedaircraft
Air Force Naval
Systems deployedbefore D-Day
“Warningtimes”—AF—Naval ac—Naval missiles—Army helos—Army TACMS
Deploymentrates—AF—Naval ac (CVBGs)—Naval missiles —Army helos—Army TACMs
Army
Helos MLRS /ATACMs
•Prepositioning•Available bases•Strategic and intra-theater mobility•Ship-movement times•Allocations of lift•Intrinsic system deployabilities
Allocationsto anti-armormissions
U.S. andallied!
______18As one example here, the “access study” (Davis et al., 1997) examined the effects of diverse access problems at specific bases and locations, adjusting the assumed deployment plans as appropriate.
23
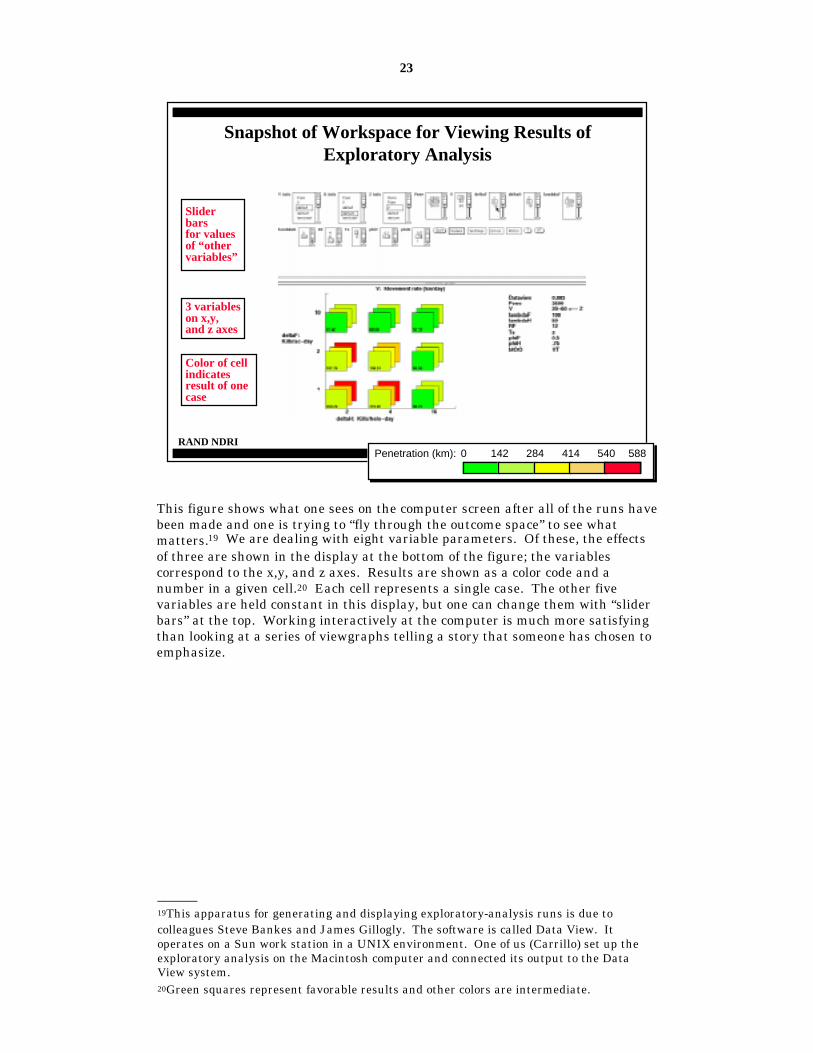
This figure shows what one sees on the computer screen after all of the runs have been made and one is trying to “fly through the outcome space” to see what matters.19 We are dealing with eight variable parameters. Of these, the effects of three are shown in the display at the bottom of the figure; the variables correspond to the x,y, and z axes. Results are shown as a color code and a number in a given cell.20 Each cell represents a single case. The other five variables are held constant in this display, but one can change them with “slider bars” at the top. Working interactively at the computer is much more satisfying than looking at a series of viewgraphs telling a story that someone has chosen to emphasize.
RAND NDRI
Snapshot of Workspace for Viewing Results of Exploratory Analysis
Sliderbars for valuesof “othervariables”
3 variableson x,y,and z axes
Color of cellindicatesresult of onecase
______19This apparatus for generating and displaying exploratory-analysis runs is due to colleagues Steve Bankes and James Gillogly. The software is called Data View. It operates on a Sun work station in a UNIX environment. One of us (Carrillo) set up the exploratory analysis on the Macintosh computer and connected its output to the Data View system.20Green squares represent favorable results and other colors are intermediate.
0 142 284 414 540 588Penetration (km):

24
The coding we used is indicated in this slide.21 We seek results that are green, or at least chartreuse, since those correspond to a forward defense in Kuwait, or at least in northern Saudi Arabia, far from the important coastal facilities and oil fields (and, not shown, short of Riyadh).
RAND NDRI
Dhahran
Color Coding
Jubayl
Kuwait City
Wariah
Persian Gulf
Ras Tanura
Al Batin
Iraq
Saudi Arabia
Kuwait80
142
284
414
540
______21See footnote on page 23.

25
As a base case, we consider zero D-Day aircraft and helos, and assume an eight-day SEAD period.22 We then display results as a function of post-SEAD kills per fixed-wing aircraft-day (y axis), deployment rate for anti-armor fixed-wing aircraft (x axis), and the speed of advance (z axis, with speed being 20, 40, and 60 km/day as one moves into the paper). The values of the other variables are shown to the right. Note that the effectiveness multipliers shown apply during the SEAD campaign only.
As a whole, the results are very bad in this base case unless movement is quite slow(front) and air-force effectiveness high (top). Recall that “red” means the potential to reach deep into the oil-rich regions of Saudi Arabia (Ras Tanura and Dhahran).23
RAND NDRI
Base Case? Bad Results for Short Warning, Long SEAD
Vehicles to killSpeed (km/day)Kills/day (helos)D-Day anti-armor ac*D-Day helicoptersSEAD period (days)Mult. of tacair effect. **
Mult. of helo effect. **
**Fixed-wing aircraft **During SEAD phase
Kills per anti-armor fixed-wing aircraft per day
Arrival rate of anti-armor fixed-wing aircraft per day
2040
60
Speed (km/day)
______22Opinions differ on the likely duration of SEAD, but an intelligent future enemy with mobile SAMs might preclude a short SEAD period by keeping some of them off the air initially and perhaps disguising them. Thus, hopes for a very short SEAD period are probably misplaced, although a short period for destroying major non-mobile air defenses and command-control installations is credible, as is quickly destroying SAMs protecting leading-edge forces. A proper treatment, possible in a simulation, should make more distinctions than made in this analysis. Our analysis suggests that more attention will need to be paid to using stealthy fighters (and bombers) with standoff munitions for anti-armor missions. In the absence of a threatening air force, this may be a preferred tactic. 23In many cases of real-world interest, heavy ground forces with prepositioned equipment could deploy rapidly enough to stop the invasion well short of Dhahran, but here we focus on what air forces and light forces could accomplish.
0 142 284 414 540 588Penetration (km):

26
Even if the SEAD campaign were shorter (two days instead of eight), results are still quite bad. The problem, ultimately, is that a fast-moving army can be through Kuwait and much of Saudi Arabia “in a blink” (i.e., within 3-5 days). Without forces in place, not much can be done given the deployment rates considered here.
RAND NDRI
Even Faster SEAD Doesn’t Help Much In Base Case
Vehicles to killSpeed (km/day)Kills/day (helos)D-Day anti-armor ac*D-Day helicoptersSEAD period (days)Mult. of tacair effect. **
Mult. of helo effect. **
**Fixed-wing aircraft **During SEAD phase
Kills per anti-armor fixed-wing aircraft per day
Arrival rate of anti-armor fixed-wing aircraft per day
Speed (km/day)
2040
60
0 142 284 414 540 588Penetration (km):

27
Even if we have 100 D-Day anti-armor fixed-wing aircraft (which might correspond to 150-200 tactical aircraft overall, counting both Navy and Air Force aircraft), results are still not satisfactory because effectiveness is so badly degraded during the SEAD campaign (a multiplier of 0.1). It is commonly assumed that few missions would be flown against advancing armor until the SEAD campaign was complete. This makes sense for a defense-in-depth strategy, but not for a forward-defense strategy if attrition to aircraft can be kept small by stealth and standoff munitions.
RAND NDRI
With 100 D-Day Fixed-Wing Aircraft, Week of SEAD Hurts
Vehicles to killSpeed (km/day)Kills/day (helos)D-Day anti-armor ac *D-Day helicoptersSEAD period (days)Mult. of tacair effect. **
Mult. of helo effect. **
**Fixed-wing aircraft **During SEAD phase
Kills per anti-armor fixed-wing aircraft per day
Arrival rate of anti-armor fixed-wing aircraft per day
Speed (km/day)
2040
60
0 142 284 414 540 588Penetration (km):
28
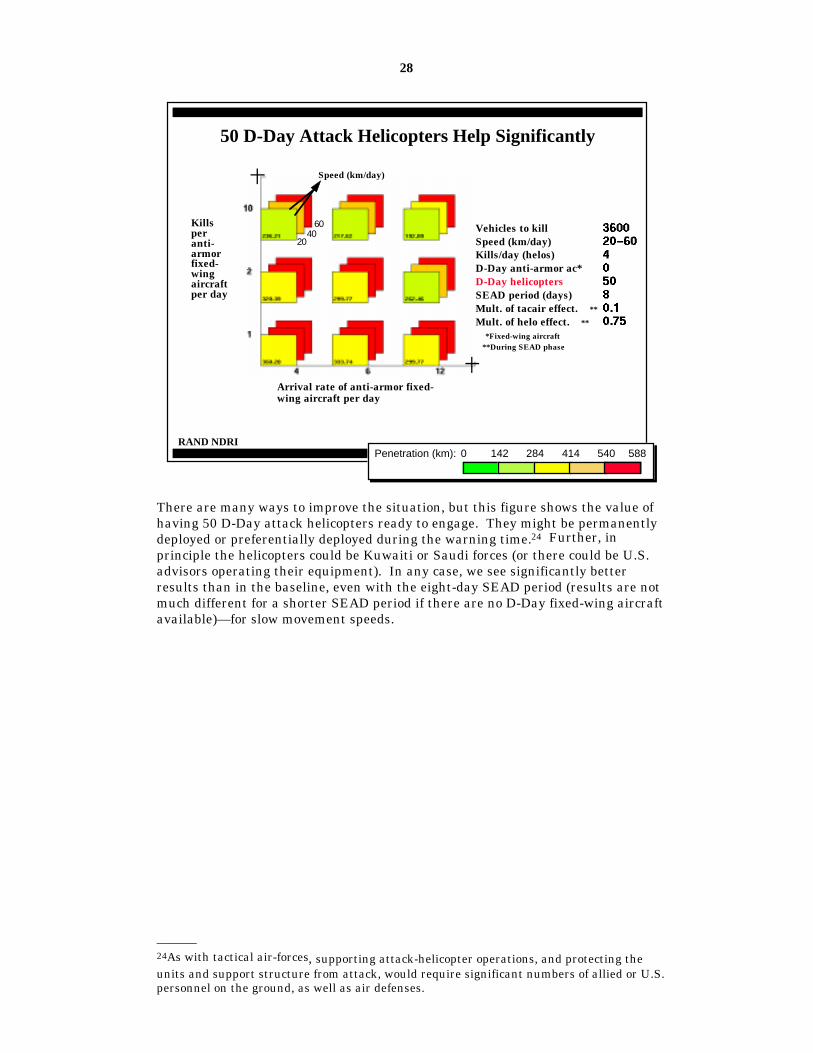
There are many ways to improve the situation, but this figure shows the value of having 50 D-Day attack helicopters ready to engage. They might be permanently deployed or preferentially deployed during the warning time.24 Further, in principle the helicopters could be Kuwaiti or Saudi forces (or there could be U.S. advisors operating their equipment). In any case, we see significantly better results than in the baseline, even with the eight-day SEAD period (results are not much different for a shorter SEAD period if there are no D-Day fixed-wing aircraft available)—for slow movement speeds.
RAND NDRI
50 D-Day Attack Helicopters Help Significantly
Vehicles to killSpeed (km/day)Kills/day (helos)D-Day anti-armor ac*D-Day helicoptersSEAD period (days)Mult. of tacair effect. **
Mult. of helo effect. **
**Fixed-wing aircraft **During SEAD phase
Kills per anti-armor fixed-wing aircraft per day
Arrival rate of anti-armor fixed-wing aircraft per day
Speed (km/day)
2040
60
______24As with tactical air-forces, supporting attack-helicopter operations, and protecting the units and support structure from attack, would require significant numbers of allied or U.S. personnel on the ground, as well as air defenses.
0 142 284 414 540 588Penetration (km):

29
This figure uses a different display. Here the x axis is kills per day per attack helicopter. We see that having 50 attack helicopters present initially helps a great deal if the high-end effectiveness values are valid. Although the figure assumes a fast deployment rate for fixed-wing anti-armor aircraft (RF), 12 per day, that is not a major factor here (as can be seen from cases not shown).
RAND NDRI
Especially If Helicopters Are Very Effective andTacair Deploys Rapidly
Kills per anti-armor fixed-wing aircraft per day
Kills per day (helicopters)
Speed (km/day)
Vehicles to killSpeed (km/day)D-Day anti-armor ac*D-Day helicoptersEff. tacair depl. rate **
SEAD period (days)Mult. of tacair effect. ***
Mult. of helo effect. ***
*Fixed-wing aircraft **Anti-armor fixed-wing ac***During SEAD phase
2040
60
0 142 284 414 540 588Penetration (km):
30
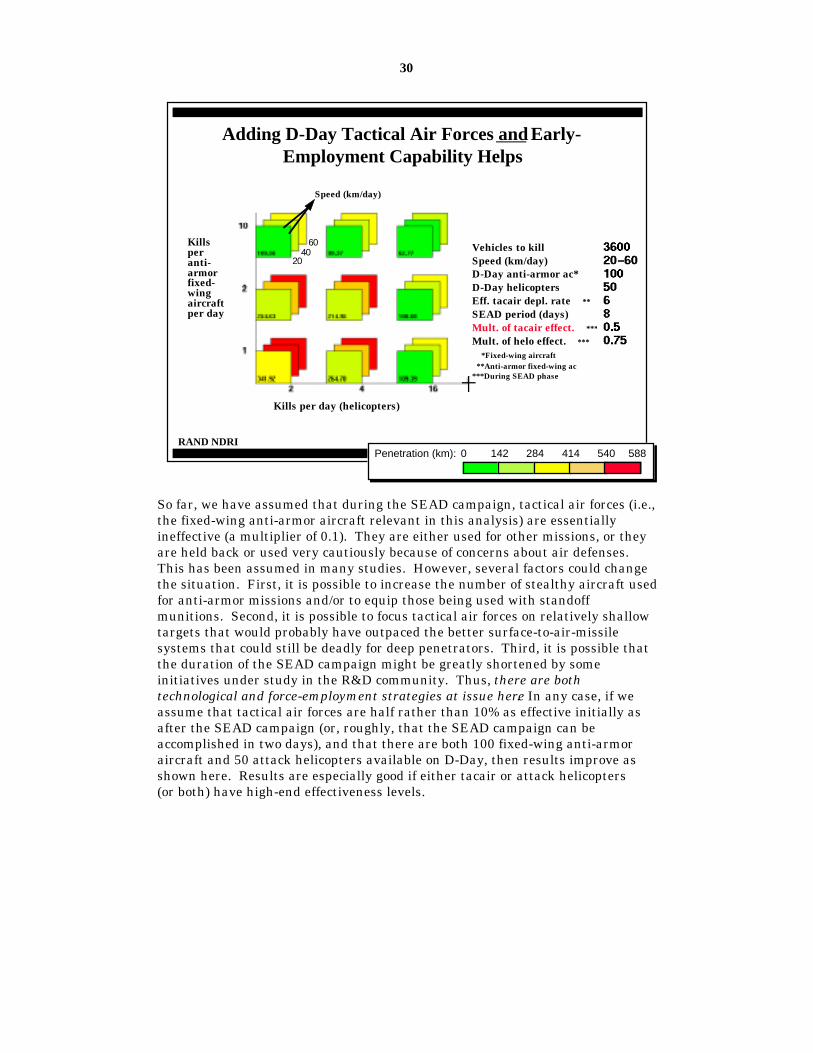
So far, we have assumed that during the SEAD campaign, tactical air forces (i.e., the fixed-wing anti-armor aircraft relevant in this analysis) are essentially ineffective (a multiplier of 0.1). They are either used for other missions, or they are held back or used very cautiously because of concerns about air defenses. This has been assumed in many studies. However, several factors could change the situation. First, it is possible to increase the number of stealthy aircraft used for anti-armor missions and/or to equip those being used with standoff munitions. Second, it is possible to focus tactical air forces on relatively shallow targets that would probably have outpaced the better surface-to-air-missile systems that could still be deadly for deep penetrators. Third, it is possible that the duration of the SEAD campaign might be greatly shortened by some initiatives under study in the R&D community. Thus, there are both technological and force-employment strategies at issue here. In any case, if we assume that tactical air forces are half rather than 10% as effective initially as after the SEAD campaign (or, roughly, that the SEAD campaign can be accomplished in two days), and that there are both 100 fixed-wing anti-armor aircraft and 50 attack helicopters available on D-Day, then results improve as shown here. Results are especially good if either tacair or attack helicopters (or both) have high-end effectiveness levels.
RAND NDRI
Adding D-Day Tactical Air Forces and Early-Employment Capability Helps
Vehicles to killSpeed (km/day)D-Day anti-armor ac*D-Day helicoptersEff. tacair depl. rate **
SEAD period (days)Mult. of tacair effect. ***
Mult. of helo effect. ***
*Fixed-wing aircraft **Anti-armor fixed-wing ac***During SEAD phase
Kills per anti-armor fixed-wing aircraft per day
Kills per day (helicopters)
Speed (km/day)
2040
60
0 142 284 414 540 588Penetration (km):

31
As a variant of the last figure, let us now illustrate the kind of thing this analysis is intended to accomplish. As the result of “flying through the outcome space” we can find “good cases.” This figure shows some of them, illustrating that defense in Kuwait is at least plausible—albeit, only with some major improvements. Here we assume 100 D-Day aircraft, 50 D-day helicopters, a fast deployment rate of Air Force aircraft (enough to increase anti-armor missions by 12 per day), a short SEAD period and a reduced degradation during SEAD. For these assumptions we see that high-end performance of either aircraft or helicopters buys us moderately good results—even for moderate movement rates. The helicopter performance is especially significant in this analysis because fewer helicopters are assumed available. Although not shown here, results are still fairly good for a longer SEAD period, at least at high performance levels.
RAND NDRI
What It Takes for Defense of Kuwait
Killsper anti-armorfixed-wingaircraftper day
Kills per helicopter per day
Speed (Km/day)
Vehicles to KillSpeed (km/day)D-Day AC*D-Day HelosAnti-armor AC/day*SEAD (days)AC Effect. Mult.**Helo Effect. Mult.** *fixed-wing**during SEAD phase
0 142 284 414 540 588Penetration (km):

32
At the price of some redundancy, we now summarize most of the results of our initial exploratory analysis. We show outcomes as a function of the seven dimensions shown on this figure. Although we vary threat later, for now we hold it constant (i.e., the number of vehicles to be killed). We also hold the duration of the SEAD campaign fixed at 8 days. Varying the multiplier of tacair effectiveness during SEAD shows much of what we want to see.
RAND NDRI
Compacting Results Along 7 Dimensions
• Kills per helicopter day
• Kills per anti-armor fixed-wing aircraft day (tacair effectiveness)• Number of D-day anti-armor fixed-wing aircraft (D-Day tacair)
• Movement speed• Multiplier degrading tacair effectiveness during SEAD
• Effective tacair deployment rate (anti-armor fixed-wing aircraft per day)
• D-day attack helicopters
33
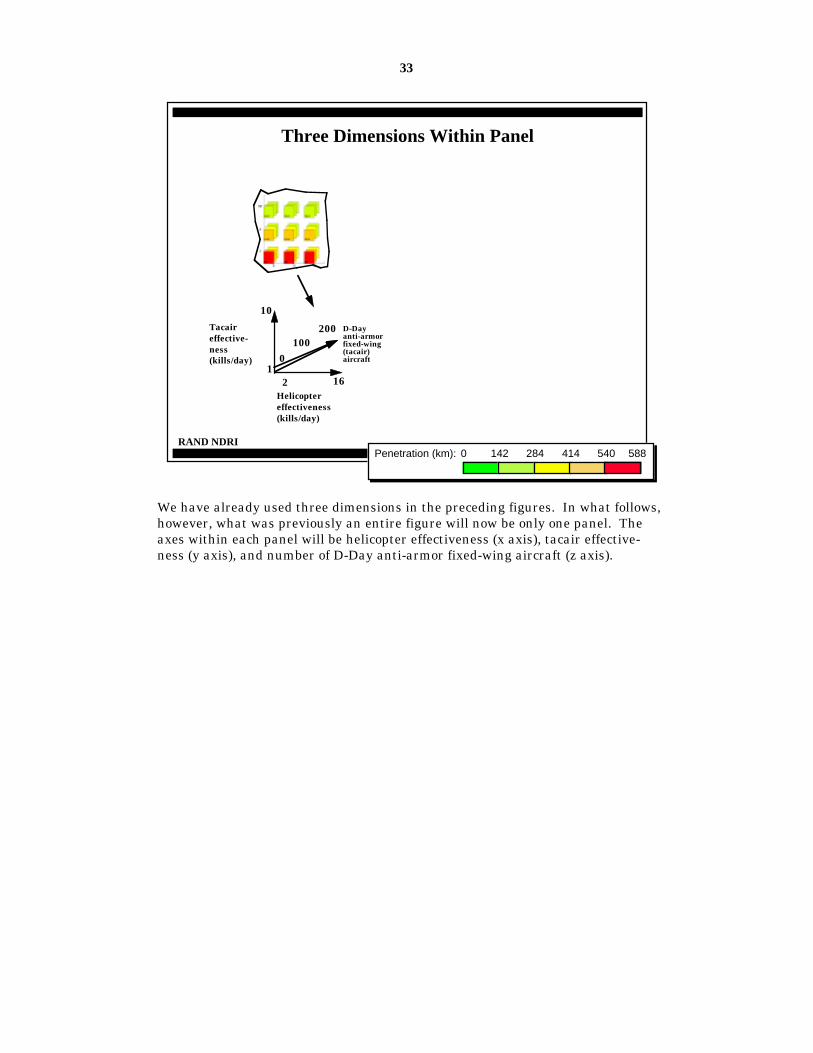
We have already used three dimensions in the preceding figures. In what follows, however, what was previously an entire figure will now be only one panel. The axes within each panel will be helicopter effectiveness (x axis), tacair effective-ness (y axis), and number of D-Day anti-armor fixed-wing aircraft (z axis).
RAND NDRI
Three Dimensions Within Panel
Helicoptereffectiveness (kills/day)
Tacaireffective-ness(kills/day)
D-Dayanti-armorfixed-wing(tacair)aircraft 0
100200
1
10
2 16
0 142 284 414 540 588Penetration (km):

34
Each page will have four such panels. Thus, we reflect a fifth variable horizontally (speed) and a sixth variable vertically (multiplier of tacair effectiveness during the SEAD campaign).
RAND NDRI
Two More Dimensions Across Panels On Page
Speed (km/day)
Multi-plier oftacaireffect.duringSEAD
20 60
0.1
0.5
0 142 284 414 540 588Penetration (km):

35
A sixth variable, the effective deployment rate, changes from one page to the next within a section; whether we do or do not have D-Day attack helicopters distinguishes the first section from the next.
In summary, we will be summarizing results in two sections of two pages each.
RAND NDRI
Sixth Variable Across Two Pages in Section; Seventh Across Sections
Effective deployment rate (EDR)(anti-armor fixed-wing aircraft per day)
6 12
Section 1,page 1
section 1,page 2
Effective deployment rate (EDR)(anti-armor fixed-wing aircraft per day)
6 12
section 2page 1
section 2, page 2
No helicopters 50 D-Day helicopters
0 142 284 414 540 588Penetration (km):

36
The first two summary figures assume no attack helicopters. Outcomes are almost uniformly poor unless the attacker’s movement speed can be kept low (20 km/day as in the left column). Even then, good outcomes depend on having aircraft available on D-Day, and having at least moderate effectiveness during the SEAD period.25 Only in the top row of the bottom left panel do we have truly good outcomes, and then only for 100 or 200 D-Day aircraft.
RAND NDRI
Outcomes With No Attack Helicopters, Slow Deployment Rates
Killsper anti-armorfixed-wingaircraftper day
Kills per helicopter per day
D-Day Tacair Speed: 20Helos: 0Mult: 0.1EDR: 6
Speed: 20Helos: 0Mult.: 0.5EDR: 6
Speed: 60Helos: 0Mult.: 0.1EDR: 6
Speed: 60Helos: 0Mult.: 0.5EDR: 6
0100
200
______25Although not shown here, the effect of assuming a multiplier of 0.5 instead of 0.1 is comparable to the effect of reducing the duration of the SEAD campaign from 8 to 2 days.
0 142 284 414 540 588Penetration (km):

37
Doubling the deployment rate helps significantly—but only if the movement rate is slow.
RAND NDRI
Outcomes With No Attack Helicopters, Fast Deployments
Killsper anti-armorfixed-wingaircraftper day
Kills per helicopter per day
D-Day TacairSpeed: 20Helos: 0Mult: 0.1EDR: 12
Speed: 20Helos: 0Mult.: 0.5EDR: 12
Speed: 60Helos: 0Mult.: 0.1EDR: 12
Speed: 60Helos: 0Mult.: 0.5EDR: 12
0100
200
0 142 284 414 540 588Penetration (km):

38
Adding D-Day attack helicopters helps significantly, even with slow tacair deployment rates. It even buys a modicum of capability against the fast-moving threat—if one assumes high helicopter effectiveness.
RAND NDRI
Outcomes With Attack Helicopters, Slow Deployments
Killsper anti-armorfixed-wingaircraftper day
Kills per helicopter per day
D-Day Tacair
Speed: 20Helos: 50Mult: 0.1EDR: 6
Speed: 20Helos: 50Mult.: 0.5EDR: 6
Speed: 60Helos: 50Mult.: 0.1EDR: 6
Speed: 60Helos: 50Mult.: 0.5EDR: 6
0100
200
0 142 284 414 540 588Penetration (km):

39
The combination of 50 D-Day attack helicopters, fast deployment rates, at least 100 D-Day tactical air forces, and either high tacair effectiveness or high helicopter effectiveness produces good outcomes, at least for the slower movement rates. The bottom left panel is what we showed earlier for “what it takes for defense of Kuwait.”
RAND NDRI
Outcomes With Attack Helicopters and Fast Deployments
Killsper anti-armorfixed-wingaircraftper day
Kills per helicopter per day
D-Day TacairSpeed: 20Helos: 50Mult: 0.1EDR: 12
Speed: 20Helos: 50Mult.: 0.5EDR: 12
Speed: 60Helos: 50Mult.: 0.1EDR: 12
Speed: 60Helos: 50Mult.: 0.5EDR: 12
0100
200
0 142 284 414 540 588Penetration (km):
40
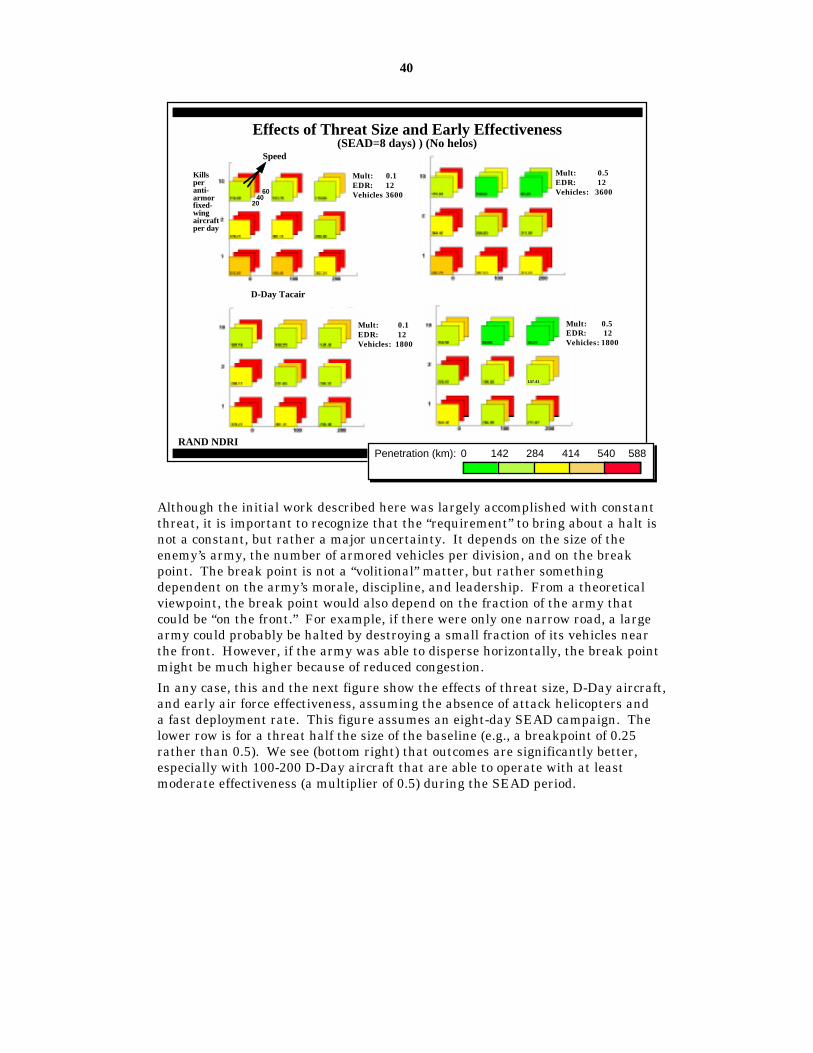
Although the initial work described here was largely accomplished with constant threat, it is important to recognize that the “requirement” to bring about a halt is not a constant, but rather a major uncertainty. It depends on the size of the enemy’s army, the number of armored vehicles per division, and on the break point. The break point is not a “volitional” matter, but rather something dependent on the army’s morale, discipline, and leadership. From a theoretical viewpoint, the break point would also depend on the fraction of the army that could be “on the front.” For example, if there were only one narrow road, a large army could probably be halted by destroying a small fraction of its vehicles near the front. However, if the army was able to disperse horizontally, the break point might be much higher because of reduced congestion.
In any case, this and the next figure show the effects of threat size, D-Day aircraft, and early air force effectiveness, assuming the absence of attack helicopters and a fast deployment rate. This figure assumes an eight-day SEAD campaign. The lower row is for a threat half the size of the baseline (e.g., a breakpoint of 0.25 rather than 0.5). We see (bottom right) that outcomes are significantly better, especially with 100-200 D-Day aircraft that are able to operate with at least moderate effectiveness (a multiplier of 0.5) during the SEAD period.
RAND NDRI
Effects of Threat Size and Early Effectiveness (SEAD=8 days) ) (No helos)
D-Day Tacair
Speed
Killsper anti-armorfixed-wingaircraftper day
Mult: 0.1EDR: 12Vehicles 3600
Mult: 0.1EDR: 12Vehicles: 1800
Mult: 0.5EDR: 12Vehicles: 3600
Mult: 0.5EDR: 12Vehicles: 1800
147.41
2040
60
0 142 284 414 540 588Penetration (km):
41
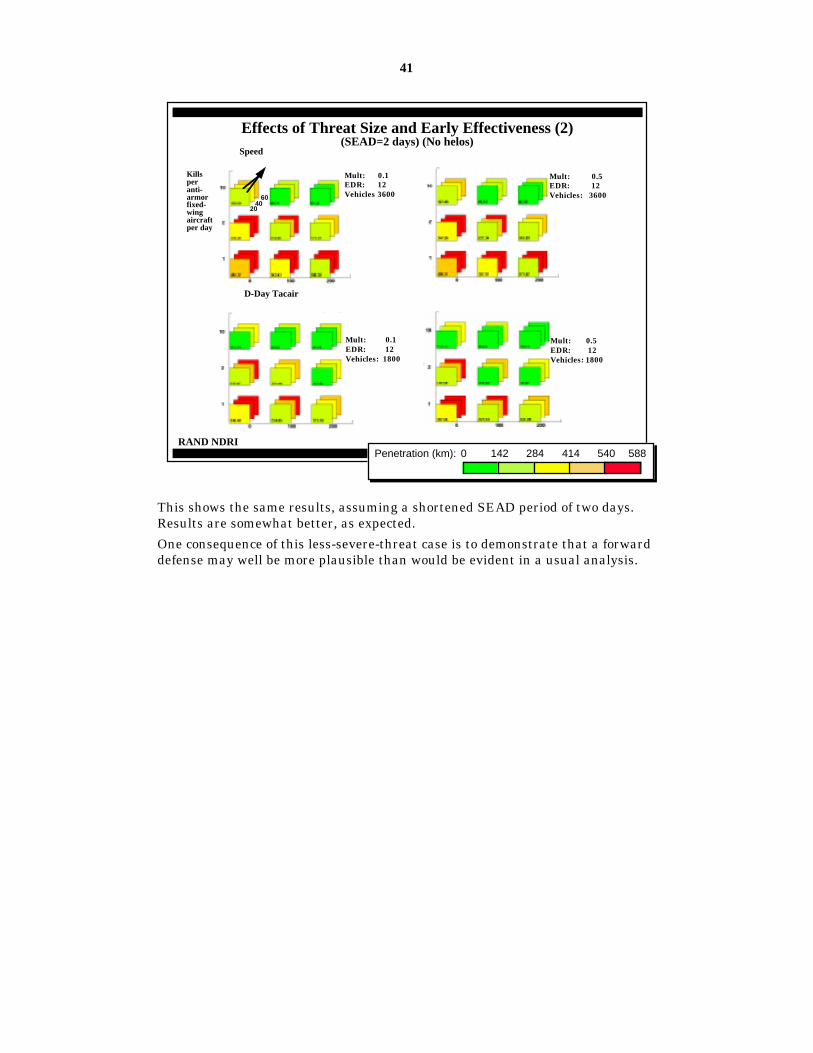
This shows the same results, assuming a shortened SEAD period of two days. Results are somewhat better, as expected.
One consequence of this less-severe-threat case is to demonstrate that a forward defense may well be more plausible than would be evident in a usual analysis.
RAND NDRI
Effects of Threat Size and Early Effectiveness (2)(SEAD=2 days) (No helos)
D-Day Tacair
Speed
Killsper anti-armorfixed-wingaircraftper day
Mult: 0.1EDR: 12Vehicles 3600
Mult: 0.1EDR: 12Vehicles: 1800
Mult: 0.5EDR: 12Vehicles: 3600
Mult: 0.5EDR: 12Vehicles: 1800
2040
60
0 142 284 414 540 588Penetration (km):

42
Let us now turn to conclusions. This briefing has reflected work-in-progress, but some of the insights appear significant and robust.
RAND NDRI
Contents
• Background• Model
• Initial Exploratory Analysis• Conclusions
• Backup Material and Bibliography

43
The first observation is that forward defense appears feasible, but only with enhanced capabilities in favorable circumstances. Critical here is reducing movement rate, which essentially implies the need for allied or U.S. ground forces.26 Since Kuwait and Saudi Arabia lack first-rate ground forces or a tradition making a large buildup likely, one option would be a small number of elite units, supplemented with American operators. The units could include attack helicopters or MLRS/ATACMs batteries, which would have a major impact (given adequate support, air cover, and infantry protection). U.S. personnel might deploy quietly under ambiguous warning.
Air forces have leverage in the desert, but might be insufficient for forward defense, at least with programmed capabilities. Many improvements are possible, however: forward deployment, stealth and use of standoff weapons, a much faster deployment rate, early emphasis on anti-armor missions, better munitions, and a focus on leading-edge forces (something suggested by colleague Glenn Kent).
Navy-based missiles (e.g., on an arsenal ship) could also help, especially against a marginal threat that might be stopped by a strong D-Day missile attack.
Finally, a word of caution from Davis et al. (1997). Most analysis, not just ours, is quite optimistic about U.S. combat forces operating from the moment war commences with superb competence and efficiency. There is little historical basis for such optimism. Serious work on the halt-phase problem should seek high-confidence D-Day command and control through ambitious operations planning, readiness in periods of strategic warning, and rigorous peacetime exercises.
RAND NDRI
Conclusions
• “Forward defense” possible in SWA, but very difficult
• Big leverage is in reducing movement rate– Need D-Day ground forces imposing delays (Allies? U.S. “advisors”
operating allied equipment?)
• Heroic assumptions needed for air-forces-only solution
• D-Day helos (or MLRS/ATACMs) help a good deal
• Air forces could greatly improve capability with– Permanently deployed forces (AF, Navy, and Marine)
– Survivability for anti-armor ops during SEAD campaign (stealth, standoff)
– Doubling or more the deployment rate
– Increasing fraction of aircraft used for attacking armor– Focus on “leading edge” (as in Kent-Ochmanek-Harshberger work)
– High-lethality weapons (e.g., sensor-fused weapons or BAT)
• D-Day missiles (e.g., arsenal ship) help—especially vs. marginal threat
• Everything depends on superb D-Day command and control!!
______26Air forces might slow an advance confined to a few roads. However, in Arabia an attacker without ground-force opposition could spread horizontally, reducing congestion (and the demoralizing visibility of friendly losses). It remains unclear how strongly future logistical forces will be road-bound, but armored forces might conquer Kuwait before becoming critically dependent on vulnerable logistics.

44
Continuing, these are some of the potential recommendations motivated by the work so far. Most of them stem from the earlier work on the S&R “access project.” They include the idea of using US CENTCOM as a testbed for new capabilities, thereby serving the purposes of transformation-related experiments while also addressing real military problems involving Persian Gulf scenarios. The experimental forces could be drawn from all Services and there would be a competition of both concept and execution. There would be tough-minded and rigorous exercising monitored by the Secretary of Defense and Chairman, Joint Chief of Staff to assure readiness for short-warning rapid-deployment early-force-employment operations with ambitious objectives.
While this briefing has dealt with work in progress and has emphasized parametric analysis (or, in our case, a more general exploratory analysis), it has perhaps demonstrated that there is hope in bringing to bear analytical methods to measure the potential and actual effects of improvements. Such methods might also be useful in designing relevant experiments.
RAND NDRI
Recommendations• Establish tough forcing-function requirements in DPG
• Establish competition among and within Services• But seek redundant capabilities without common-failure mode
(JSTARS)
• Direct USCENTCOM to push envelope in making forward-defense option work, especially with new precision forces
• Make USCENTCOM “test bed” for transformational capabilities– Rapidly deployable MLRS/ATACMs or attack helicopters
– Much more rapidly deployable precision-weapon-focused tacair– D-day use of long-range bombers
– High-confidence superb command and control on D-Day, even with short warning
• Options for either AF or Navy-based lead initially
• Establish rigorous OSD/CJCS-monitored test program to assess “real” short-notice capabilities
Some of “transformation” is doctrinal, not futuristichigh tech

45
The remaining material is for backup and reference.
RAND NDRI
Backup Material
46
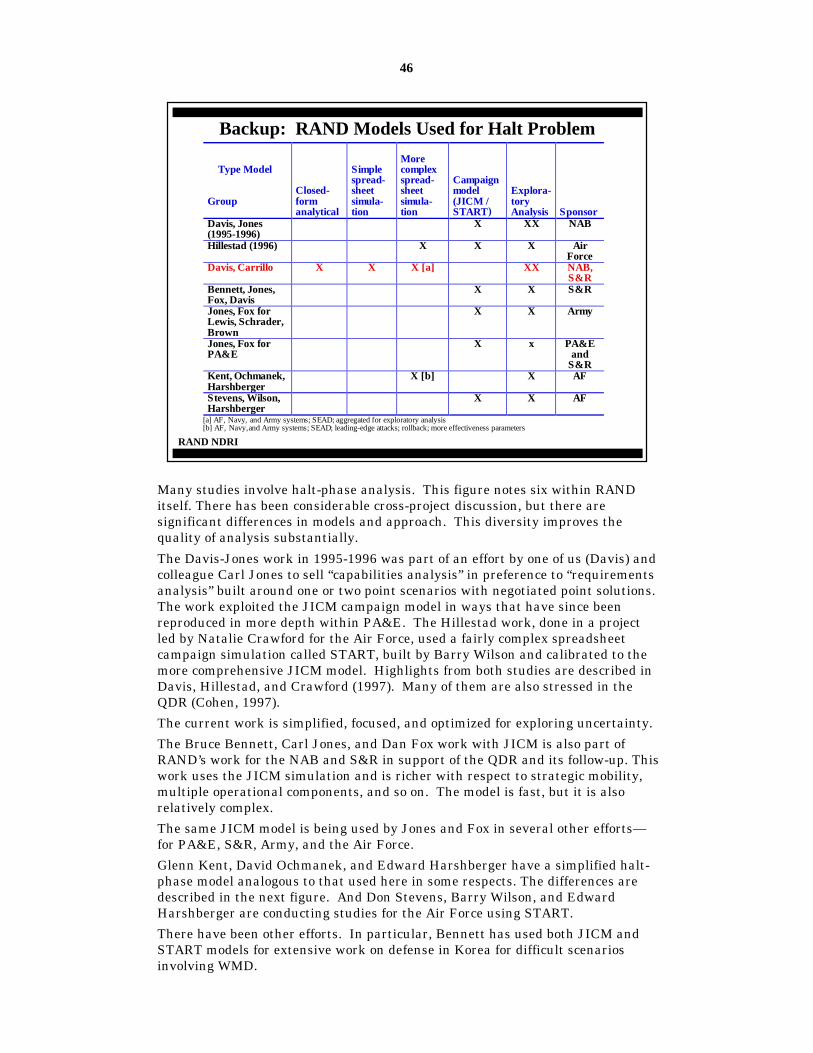
Many studies involve halt-phase analysis. This figure notes six within RAND itself. There has been considerable cross-project discussion, but there are significant differences in models and approach. This diversity improves the quality of analysis substantially.
The Davis-Jones work in 1995-1996 was part of an effort by one of us (Davis) and colleague Carl Jones to sell “capabilities analysis” in preference to “requirements analysis” built around one or two point scenarios with negotiated point solutions. The work exploited the JICM campaign model in ways that have since been reproduced in more depth within PA&E. The Hillestad work, done in a project led by Natalie Crawford for the Air Force, used a fairly complex spreadsheet campaign simulation called START, built by Barry Wilson and calibrated to the more comprehensive JICM model. Highlights from both studies are described in Davis, Hillestad, and Crawford (1997). Many of them are also stressed in the QDR (Cohen, 1997).
The current work is simplified, focused, and optimized for exploring uncertainty.
The Bruce Bennett, Carl Jones, and Dan Fox work with JICM is also part of RAND’s work for the NAB and S&R in support of the QDR and its follow-up. This work uses the JICM simulation and is richer with respect to strategic mobility, multiple operational components, and so on. The model is fast, but it is also relatively complex.
The same JICM model is being used by Jones and Fox in several other efforts—for PA&E, S&R, Army, and the Air Force.
Glenn Kent, David Ochmanek, and Edward Harshberger have a simplified halt-phase model analogous to that used here in some respects. The differences are described in the next figure. And Don Stevens, Barry Wilson, and Edward Harshberger are conducting studies for the Air Force using START.
There have been other efforts. In particular, Bennett has used both JICM and START models for extensive work on defense in Korea for difficult scenarios involving WMD.
RAND NDRI
Backup: RAND Models Used for Halt Problem
Type Model
GroupClosed-formanalytical
Simplespread-sheetsimula-tion
Morecomplexspread-sheetsimula-tion
Campaignmodel(JICM /START
Explora-toryAnalysis Sponsor
Davis, Jones(1995-1996)
X XX NAB
Hillestad (1996) X X X AirForce
Davis, Carrillo X X X [a] XX NAB,S&R
Bennett, Jones,Fox, Davis
X X S&R
Jones, Fox forLewis, Schrader,Brown
X X Army
Jones, Fox forPA&E
X x PA&Eand
S&RKent, Ochmanek,Harshberger
X [b] X AF
Stevens, Wilson,Harshberger
X X AF
[a] AF, Navy, and Army systems; SEAD; aggregated for exploratory analysis[b] AF, Navy,and Army systems; SEAD; leading-edge attacks; rollback; more effectiveness parameters
)

47
This backup figure discusses the relationships between a RAND model developed by Kent, Ochmanek, and Harshberger (called KOH here)27 and the one we are using.
The two are similar in philosophy: relatively simple and focused on a single operation. They are both highly aggregated. Neither is a good depiction of battle dynamics in detail, and neither provides insights about some of the crucial tactical-level issues. Both are merely “devices” for analysis measuring the value of new capabilities.
The KOH model is an interesting innovation because of its focus on obliterating “leading edge forces,” and thereby creating circumstances where almost any observer would agree that the movement would be halted. The KOH model also represents “rollback”: If the advance can be halted at a particular line, and if the defender’s capabilities are increasing (or the attacker’s leading-edge forces are decreasing, even after replacement from the rear), then subsequent-day attacks can “sterilize” a growing band rearward from the original halt line. Work on the KOH model has been sensitive to issues such as the dispersal of attacker vehicles, number of attack corridors, and the type of weapon being used by air forces.
Although the KOH model is parameterized, it is being used primarily to set challenges for future Air Force systems. It is therefore “forward leaning” in some respects. In other respects, we believe it is unduly pessimistic. In its most recent versions, the KOH model is quite joint.
The model used here is somewhat simpler. It assumes a halt when a fraction of the overall force has been killed. Thus, our break point is not the same as the KOH breakpoint. Furthermore, it can be achieved with cumulative attrition, while the KOH model requires a high single-day attrition rate to leading-edge forces.
The two teams have discussed issues frequently, and the models and approaches have affected one another. More convergence will occur, but there are advantages to both that might be lost in an attempt to merge them.
RAND NDRI
Backup: Relationship to Kent-Ochmanek-Harshberger (KOH) Model
• Both models are merely devices for measuring value of additional capability
• KOH – Focuses on assuring halt by high single-day attrition to leading-edge
– Represents “rollback” – Convincingly demonstrates that “halt” is enforceable
– Is probably much too conservative on the halt criterion
– Is often used with forward-leaning assumptions
• Current model: – more suitable for broad exploratory analysis and some high-level
tradeoffs
• Both models are evolving; convergence possible over time—if desirable
______27See Ochmanek, Harshberger, and Thaler (forthcoming).
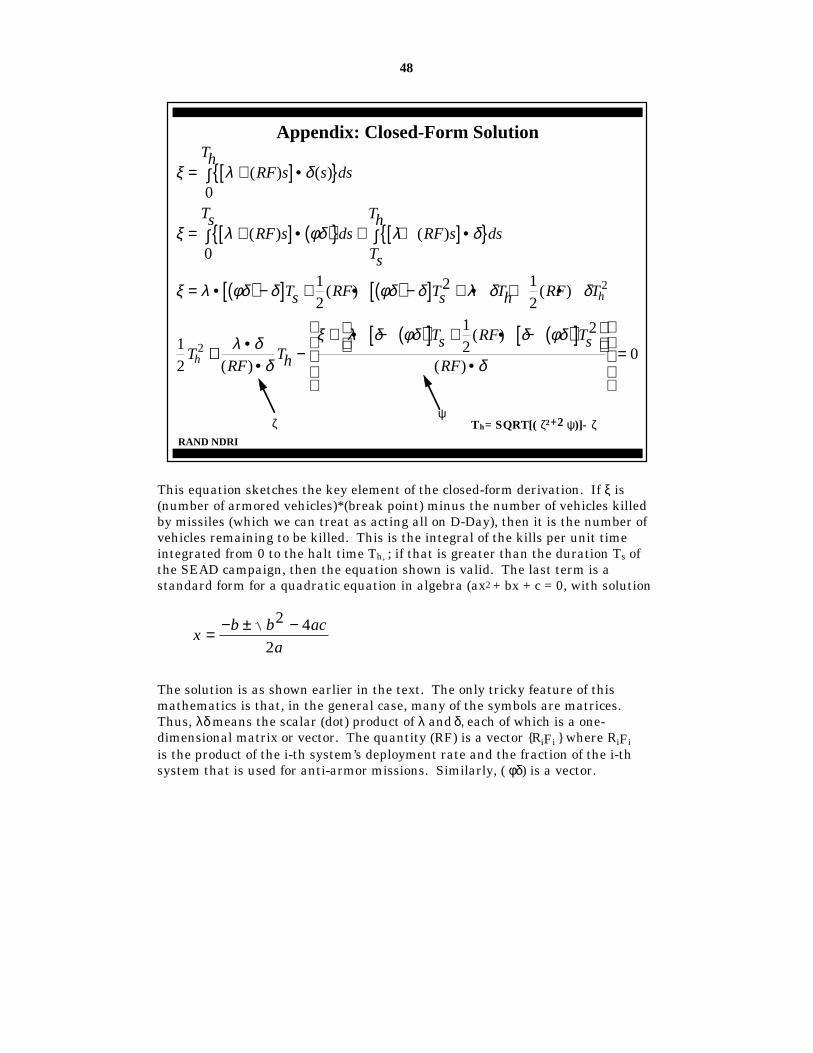
48
This equation sketches the key element of the closed-form derivation. If ξ is (number of armored vehicles)*(break point) minus the number of vehicles killed by missiles (which we can treat as acting all on D-Day), then it is the number of vehicles remaining to be killed. This is the integral of the kills per unit time integrated from 0 to the halt time Th, ; if that is greater than the duration Ts of the SEAD campaign, then the equation shown is valid. The last term is a standard form for a quadratic equation in algebra (ax2 + bx + c = 0, with solution
The solution is as shown earlier in the text. The only tricky feature of this mathematics is that, in the general case, many of the symbols are matrices. Thus, λδ means the scalar (dot) product of λ and δ, each of which is a one-dimensional matrix or vector. The quantity (RF) is a vector {RiFi } where RiFiis the product of the i-th system’s deployment rate and the fraction of the i-th system that is used for anti-armor missions. Similarly, ( φδ) is a vector.
RAND NDRI
Appendix: Closed-Form Solution
ξ λ δ
ξ λ φδ λ δ
ξ λ φδ δ φδ δ λ δ δ
= +[ ]•{ }∫
= +[ ]• ( ){ }∫ + +[ ]•{ }∫
= • ( ) −[ ] + • ( ) −[ ] + • + •
( ) ( )
( ) ( )
( ) ( )
RF s sTh
ds
RF sTs
ds RF sTs
Thds
Ts RF Ts Th RF T
T
h
h
0
0
12
2 12
12
2
2 ++ ••
−+ • − ( )[ ] + • − ( )[ ]
•
=λ δδ
ξ λ δ φδ δ φδ
δ( )
( )
( )RFTh
Ts RF Ts
RF
12
2
0
ζψ
Th= SQRT[( ζ2+2 ψ)]- ζ
xb b ac
a= − ± −2 4
2

49
Bibliography
Bankes, Steve (1994), Exploratory Modeling and Policy Analysis, RP-211. Reprint of article originally published in Operations Research, Vol. 41, no. 3, 1993.
Brooks, Arthur, Steve Bankes, and Bart Bennett (1997), Weapon Mix and Exploratory Analysis: A Case Study, RAND, DB-216/2-AF.
Cohen, Secretary of Defense William (1997), Report of the Quadrennial Defense Review (QDR), Department of Defense.
Davis, Paul K., Introduction to Variable-Resolution and Cross-Resolution Model Connection, RAND, R-4252-DARPA, 1993. Also in Naval Research Logistics, Vol. 42 (1995) and Combat Modeling, a 1996 book by the Military Operations Research Society, edited by Jerome Bracken and others.
Davis, Paul K., David Gompert, and Richard Kugler, Adaptiveness in National Defense: The Basis of a New Framework, RAND, Issue Paper IP-155, 1996.
Davis, Paul K., Richard Hillestad, and Natalie Crawford, “Capabilities for Major Regional Conflicts,” in Khalilzad and Ochmanek (eds.) (1997).
Davis, Paul K., Richard Hillestad, and Richard Kugler (1997), Strategic Issues and Options for the Quadrennial Defense Review, RAND, DB-201-OSD. Documents a briefing to senior DoD officials in December 1996.
Davis, Paul K., William Schwabe, Bruce Nardulli, and Richard Nordin, with Carl Jones and Daniel Fox (1997), Mitigating Access Problems in Persian Gulf Contingencies, RAND, MR-915, Santa Monica, CA.
Khalilzad, Zalmay M., and David A. Ochmanek (eds.), Strategic Appraisal 1997: Strategy and Defense Planning for the 21st Century, RAND, Santa Monica, CA.
Matsumura, John, Randall Steeb, Tom Herbert, Mark Lees, Scot Eisenhard, and Angela Stich (1996), Analytic Support to the Defense Science Board: Tactics and Technology for 21st Century Military Superiority, Santa Monica, CA, RAND, DB-198-A, 1996. This study uses entity-level simulation to study issues such as the relative importance of precision-force response time, footprint size, and tactics.
Moore, Louis (unpublished), “Power Projection in the 21st Centruy: Forces and Concepts—Executive Briefing,” RAND Work for the U.S. Army, November 1996.
National Research Council (NRC) (1997), Volume 9: Modeling and Simulation, a book in the National Research Council study, Technology for Future Naval Forces: The United States Navy and Marine Corps, 2000-2035, National Academy Press, Washington, D.C., September 1997.
Ochmanek, David A., Edward Harshberger, and David Thaler, “Winning the Halt Phase of Future Theater Conflicts: Exploiting Advances in Firepower,” RAND, Santa Monica, CA (forthcoming).


![Documented Briefing [Implementing Best Purchasing and Supply Management Practices]](https://static.fdocuments.us/doc/165x107/577d33f31a28ab3a6b8c2dd2/documented-briefing-implementing-best-purchasing-and-supply-management-practices.jpg)