
Documentation and verification of the world extreme wind ... · scales is given in Trewin (2008)....
10
1 Australian Meteorological and Oceanographic Journal 62 (2012) 1–9 Documentation and verification of the world extreme wind gust record: 113.3 m s –1 on Barrow Island, Australia, during passage of tropical cyclone Olivia (Manuscript received June 2010; revised March 2011) J. Courtney 1 , S. Buchan 2 , R.S. Cerveny 3 , P. Bessemoulin 4 , T.C. Peterson 5 , J.M. Rubiera Torres 6 , J. Beven 7 , J. King 8 , B. Trewin 1 , K. Rancourt 9 1 Bureau of Meteorology, Australia 2 RPS MetOcean, Australia 3 Arizona State University, United States 4 Meteo-France, France 5 NOAA National Climatic Data Center, United States 6 Cuban Instituto de Meteorologia, Cuba 7 NOAA National Hurricane Center, United States 8 British Antarctic Survey, Great Britain 9 Mt. Washington Observatory, United States Introduction On 10 April 1996 a privately operated anemometer on Barrow Island off the northwest coast of Australia measured a wind gust of 113.3 m s –1 as category 4 tropical cyclone Olivia (hereafter Olivia) passed close by. When the observation became known to the Australian Bureau of Meteorology, it was viewed with some scepticism. While the operators of the instrument maintained belief in the validity of the observations, until recently its official status has been unresolved. Since 2006, the World Meteorological Organization (WMO) Commission for Climatology (CCl) has established a critical database for identifying climate change by creating a verifiable archive of weather and climate extremes. That archive, labelled the WMO World Weather and Climate Extremes Archive, is available at: http://wmo.asu.edu/ Such a database is critical in that many reported extreme weather events are often used by the media and the general public as indicators that the Earth’s climate is changing and/ Corresponding author address: J. Courtney, Bureau of Meteorology, PO Box 1370, West Perth, WA 6872, Australia email: [email protected] This paper details the event, recording instrumentation, and verification of a new world extreme three-second average wind gust record of 113.3 m s –1 , measured on Barrow Island, Australia, during the passage of tropical cyclone Olivia in April 1996, and the public and media reaction to that verification. This record super- sedes the previous extreme of 103.3 m s –1 measured at the Mount Washington Observatory in New Hampshire, USA, in April 1934. Members of a World Me- teorological Organization evaluation committee critically reviewed the data of the Olivia event, determined the Barrow Island wind measurement was valid and established the record. With the announcement of the record, interesting public reaction has occurred and is discussed, as well as the concept of more detailed classification of wind extremes. Although Olivia now holds the record for having the highest wind gust ever measured, this record doesn’t imply that Olivia is the most intense cyclone recorded. However, planners should be aware that extreme gusts well above the ‘typical’ gusts quoted on the intensity scale are possible for tropical cyclones, particularly for category 4 and 5 tropical cyclones.
Transcript of Documentation and verification of the world extreme wind ... · scales is given in Trewin (2008)....
1
Australian Meteorological and Oceanographic Journal 62 (2012) 1–9
Documentation and verification of the world extreme wind gust record:
113.3 m s–1 on Barrow Island, Australia, during passage of tropical cyclone Olivia
(Manuscript received June 2010; revised March 2011)
J. Courtney1, S. Buchan2, R.S. Cerveny3, P. Bessemoulin4, T.C. Peterson5, J.M. Rubiera Torres6, J. Beven7, J. King8, B. Trewin1, K. Rancourt9
1Bureau of Meteorology, Australia2RPS MetOcean, Australia
3Arizona State University, United States4Meteo-France, France
5 NOAA National Climatic Data Center, United States6Cuban Instituto de Meteorologia, Cuba
7NOAA National Hurricane Center, United States8British Antarctic Survey, Great Britain
9Mt. Washington Observatory, United States
Introduction
On 10 April 1996 a privately operated anemometer on Barrow Island off the northwest coast of Australia measured a wind gust of 113.3 m s–1 as category 4 tropical cyclone Olivia (hereafter Olivia) passed close by. When the observation became known to the Australian Bureau of Meteorology, it was viewed with some scepticism. While the
operators of the instrument maintained belief in the validity of the observations, until recently its official status has been unresolved. Since 2006, the World Meteorological Organization (WMO) Commission for Climatology (CCl) has established a critical database for identifying climate change by creating a verifiable archive of weather and climate extremes. That archive, labelled the WMO World Weather and Climate Extremes Archive, is available at: http://wmo.asu.edu/ Such a database is critical in that many reported extreme weather events are often used by the media and the general public as indicators that the Earth’s climate is changing and/
Corresponding author address: J. Courtney, Bureau of Meteorology, PO Box 1370, West Perth, WA 6872, Australiaemail: [email protected]
This paper details the event, recording instrumentation, and verification of a new world extreme three-second average wind gust record of 113.3 m s–1, measured on Barrow Island, Australia, during the passage of tropical cyclone Olivia in April 1996, and the public and media reaction to that verification. This record super-sedes the previous extreme of 103.3 m s–1 measured at the Mount Washington Observatory in New Hampshire, USA, in April 1934. Members of a World Me-teorological Organization evaluation committee critically reviewed the data of the Olivia event, determined the Barrow Island wind measurement was valid and established the record. With the announcement of the record, interesting public reaction has occurred and is discussed, as well as the concept of more detailed classification of wind extremes. Although Olivia now holds the record for having the highest wind gust ever measured, this record doesn’t imply that Olivia is the most intense cyclone recorded. However, planners should be aware that extreme gusts well above the ‘typical’ gusts quoted on the intensity scale are possible for tropical cyclones, particularly for category 4 and 5 tropical cyclones.

2 Australian Meteorological and Oceanographic Journal 62:1 March 2012
or becoming more variable. Consequently, the confirmation of new weather extreme records should be recognized as a high priority within the meteorology and climatology communities. Although several countries across the world have initiated weather and climate extremes committees (e.g. the U.S. National Climate Extremes Committee), no such committee or archive existed for the world as a whole prior to 2006. In that year, the WMO CCl Open Programme Area Group (OPAG) on Monitoring and Analysis of Climate Variability and Change established an official, unbiased list of weather and climate extremes for the world and, additionally, created a rapporteur position in order to establish procedures for the verification of future weather records. Upon receipt of a new purported record, an ad hoc extremes committee is organized to provide an expert and unbiased recommendation on whether the extreme in question should be added to the list. In addition to the rapporteur, the committee consists of the President of the Commission for Climatology, the Chair of the CCl OPAG on Monitoring and Analysis of Climate Variability and Change (the rapporteur is part of this OPAG), and a representative of the relevant member state’s national meteorological and hydrologic service, as well as experts in the appropriate meteorological phenomenon and observing instrumentation as required. The committee may also consult with a wide variety of additional experts as the need arises. Based on the available data from the event, the committee creates an evaluation and recommendation for the rapporteur on climate extremes, who then makes a judgment of the record’s inclusion into the WMO CCl World Weather and Climate Extremes Archive. Since its inception, fifteen investigations of extremes have been conducted. Of these, most potential record events have been dismissed as a result of in-depth investigation. However, five events have been officially verified as new record extreme events with some of the associated deliberations having been published (e.g. Quetelard et al., 2009). Unless otherwise stated, all wind gust values discussed in this paper are nominally 3-second averages measured at ten metres above ground level.
Tropical cyclone Olivia
Meteorological descriptionOn 5 April 1996, Olivia, which had developed north of Darwin, achieved cyclone intensity north of the Kimberley and continued to intensify to category 4 (Australian scale)1 strength by 9 April as it approached the Pilbara coast (Fig. 1). Olivia’s intensity was estimated at Dvorak Current Intensity2 of 6.0, corresponding to 105 kn (54 m s–1 or 195 km h–1) mean
10-minute winds, the upper limit of the T6.0 scale, as it passed Barrow Island. The visible image at 0630 UTC (Fig. 2(a)) shows Olivia approaching Barrow Island while the infrared image at 1130 UTC (at night) with Dvorak enhancement (Fig. 2(b)) shows Olivia prior to landfall close to the time of the extreme wind gusts. Olivia made landfall near Mardie station west of Karratha. Mardie and other surrounding stations suffered extensive damage to their properties. More information is available at: http://www.bom.gov.au/weather/wa/cyclone/about/inland_pilbara/olivia.shtml and in the 1995–96 tropical cyclone seasonal summary (Callaghan 1997). Several sites recorded extreme wind gusts during Olivia. Varanus Island reported a wind gust of 74 m s–1 (267 km h–1) which at the time was accepted as the highest surface wind gust ever recorded in Australia’s history, and Mardie station registered a wind gust of 139 kn (72 m s–1 or 257 km h–1). The highest measured wind speed, however, occurred on Barrow Island with a recorded gust of 113.3 m s–1 (408 km h–1). All instruments were cup anemometers.
Recording equipmentThe Barrow Island winds were recorded by an automatic weather station using a heavy-duty three-cup Synchrotac anemometer (McVan Instruments Pty Ltd specification sheet SYN706V4.SAM 2/97 for the RIMCO, MIDDLETON Synchrotac 706 Series, 1997) as shown in Fig. 3. The Synchrotac was a model 706/732 whose 732 designator indicates it was the AC generator speed sensor model. The data logger was the type EMS-16 (RPS MetOcean Technical Note TN190, EMS-16 Operator’s Manual, 1994) which uses
1The Australian category scale is not the same as the Saffir–Simpson scale (Simpson and Riehl 1981) in widespread use. A comparison of the two scales is given in Trewin (2008). In this case tropical cyclone Olivia would have been a Saffir–Simpson category 4 hurricane at its peak intensity.
2In most cases tropical cyclone intensity in Australia is determined using satellite-based (Dvorak) methods (Harper et al. 2008). There is no regular aircraft reconnaissance in the Australian region.
Fig. 1 Track of Olivia over northwestern Australia for 10 April 1996 (times given in WST, subtract eight hours for UTC).

Courtney et al.: World extreme wind gust record 3
pulse counting for wind speed (not AC voltage amplitude measurement). The EMS-16 has a low pass filter on the wind speed input and also has input circuitry to provide some hysteresis (±21 mV) to minimize the likelihood of noise causing false wind speed/wind gust counts. In other words, this reduces the possibility of noise spikes affecting wind speed data. In contrast, data loggers which use voltage for speed measurement may be susceptible to noise spikes. Also included is a 10 nF capacitor on the non-inverting op-amp to ground, which in conjunction with a 47 k input resistor provides a time constant of about 0.5 ms and will provide a measure of HF interference filtering. The anemometer was positioned ten metres above ground level and 64 metres above sea level, mounted on a guyed mast. As stated by the supplier, the mast was a cyclone-rated Aanderaa Model 2772 ten-metre tower, comprised of eight x one metre sections mounted on a 1.5 m base with a 0.5 m instrumented cross arm. Each section was 50 mm diameter anodized aluminium tube, with a 6 mm wall thickness. The tower was guyed at 9.14 m and 4.57 m above ground level by three pairs of 3.5 mm galvanised steel wire, each with a breaking load of 9.9 kN, pre-tensioned to 1.5 kN. The wires were equilaterally spaced about the mast. A small telescopic extension on the tower was fitted such that the anemometer cups were located at ten metres above ground level. Each pair of wires was fixed to a galvanized steel anchor bracket set in a 0.9 × 0.9 × 0.5 m deep concrete block, located 5.4 m from the mast base. The base itself was bolted into a 0.6 × 0.6 × 0.3 m deep concrete pad. All concrete blocks were buried flush with the surrounding ground. The instrument was well-exposed in all directions and sited towards the centre of the island about 6 km inland from the south-southwest, the direction of the strongest wind gusts. The anemometer was originally owned by Western Australian Petroleum Pty Ltd (WAPET) which has since been acquired by Chevron (Australia) Pty Ltd. Maintenance was conducted by WNI Science and Engineering (now known as RPS MetOcean) and was regularly inspected. Data from this station were forwarded to the Bureau of Meteorology for forecasting and climatological applications.
ObservationsThe wind observations made by the Barrow Island anemometer between 0900 UTC (1700 WST) and 1200 UTC (2000 WST) 10 April are displayed in Table 1 and the data between 0400 UTC (1200 WST) and 1555 UTC (2355 WST) graphed in Fig. 4. Observations were recorded every five minutes, the mean wind being the five-minute average and the maximum gust the peak three-second average gust over the previous five-minute observation. The base sampling frequency was 2 Hz and the three-second gust calculated as a ‘moving average’ of a six-sample window of the 2 Hz wind speed counts. The peak wind gust measurement was one of five extreme gusts during a series of five-minute time periods. Gusts of 102, 113 and 104 m s–1 (369, 408, 374 km h–1) were measured
Fig. 3 The Barrow Island Automatic Weather Station (photo courtesy RPS MetOcean).
Fig. 2 Satellite images of Olivia prior to landfall: (a) Visible image at 0630 UTC; and (b) Infra-red image (Dvorak enhancement) at 1130 UTC. Images courtesy of Japan Meteorological Agency.
(a)
(b)
4 Australian Meteorological and Oceanographic Journal 62:1 March 2012
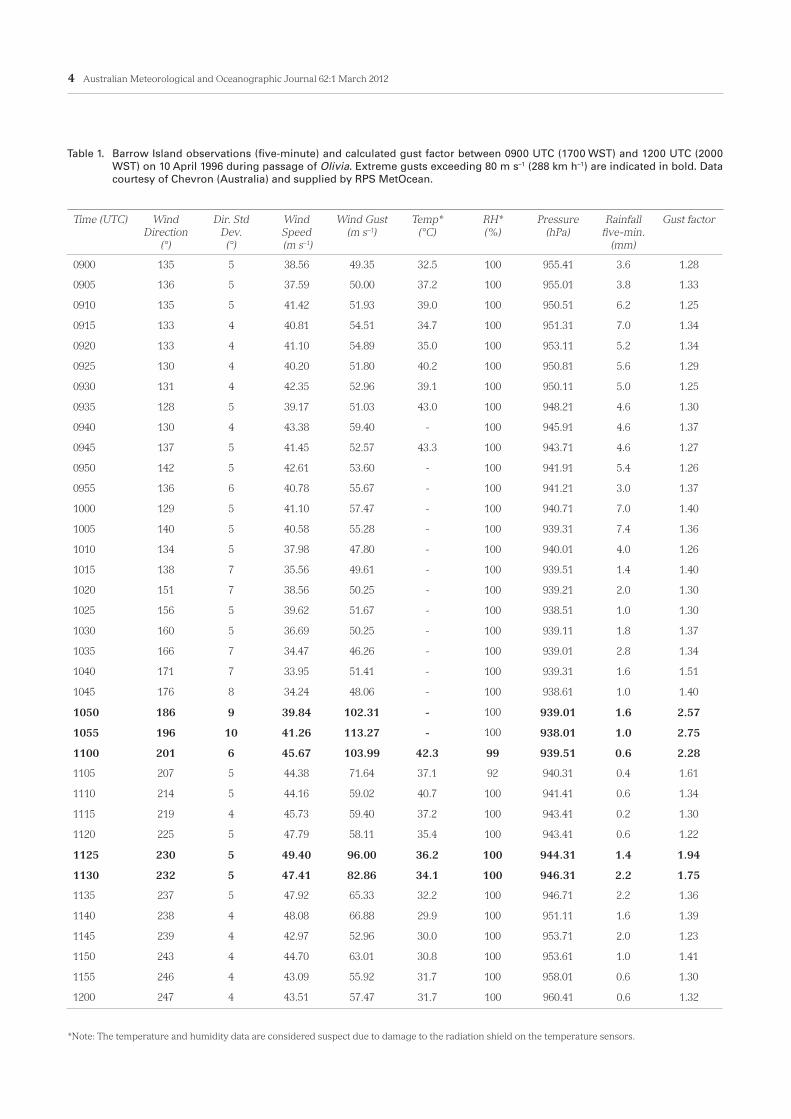
Table 1. Barrow Island observations (five-minute) and calculated gust factor between 0900 UTC (1700 WST) and 1200 UTC (2000 WST) on 10 April 1996 during passage of Olivia. Extreme gusts exceeding 80 m s–1 (288 km h–1) are indicated in bold. Data courtesy of Chevron (Australia) and supplied by RPS MetOcean.
*Note: The temperature and humidity data are considered suspect due to damage to the radiation shield on the temperature sensors.
Time (UTC) Wind Direction
(°)
Dir. Std Dev.(°)
Wind Speed (m s–1)
Wind Gust (m s–1)
Temp* (°C)
RH* (%)
Pressure (hPa)
Rainfall five-min.
(mm)
Gust factor
0900 135 5 38.56 49.35 32.5 100 955.41 3.6 1.28
0905 136 5 37.59 50.00 37.2 100 955.01 3.8 1.33
0910 135 5 41.42 51.93 39.0 100 950.51 6.2 1.25
0915 133 4 40.81 54.51 34.7 100 951.31 7.0 1.34
0920 133 4 41.10 54.89 35.0 100 953.11 5.2 1.34
0925 130 4 40.20 51.80 40.2 100 950.81 5.6 1.29
0930 131 4 42.35 52.96 39.1 100 950.11 5.0 1.25
0935 128 5 39.17 51.03 43.0 100 948.21 4.6 1.30
0940 130 4 43.38 59.40 - 100 945.91 4.6 1.37
0945 137 5 41.45 52.57 43.3 100 943.71 4.6 1.27
0950 142 5 42.61 53.60 - 100 941.91 5.4 1.26
0955 136 6 40.78 55.67 - 100 941.21 3.0 1.37
1000 129 5 41.10 57.47 - 100 940.71 7.0 1.40
1005 140 5 40.58 55.28 - 100 939.31 7.4 1.36
1010 134 5 37.98 47.80 - 100 940.01 4.0 1.26
1015 138 7 35.56 49.61 - 100 939.51 1.4 1.40
1020 151 7 38.56 50.25 - 100 939.21 2.0 1.30
1025 156 5 39.62 51.67 - 100 938.51 1.0 1.30
1030 160 5 36.69 50.25 - 100 939.11 1.8 1.37
1035 166 7 34.47 46.26 - 100 939.01 2.8 1.34
1040 171 7 33.95 51.41 - 100 939.31 1.6 1.51
1045 176 8 34.24 48.06 - 100 938.61 1.0 1.40
1050 186 9 39.84 102.31 - 100 939.01 1.6 2.57
1055 196 10 41.26 113.27 - 100 938.01 1.0 2.75
1100 201 6 45.67 103.99 42.3 99 939.51 0.6 2.28
1105 207 5 44.38 71.64 37.1 92 940.31 0.4 1.61
1110 214 5 44.16 59.02 40.7 100 941.41 0.6 1.34
1115 219 4 45.73 59.40 37.2 100 943.41 0.2 1.30
1120 225 5 47.79 58.11 35.4 100 943.41 0.6 1.22
1125 230 5 49.40 96.00 36.2 100 944.31 1.4 1.94
1130 232 5 47.41 82.86 34.1 100 946.31 2.2 1.75
1135 237 5 47.92 65.33 32.2 100 946.71 2.2 1.36
1140 238 4 48.08 66.88 29.9 100 951.11 1.6 1.39
1145 239 4 42.97 52.96 30.0 100 953.71 2.0 1.23
1150 243 4 44.70 63.01 30.8 100 953.61 1.0 1.41
1155 246 4 43.09 55.92 31.7 100 958.01 0.6 1.30
1200 247 4 43.51 57.47 31.7 100 960.41 0.6 1.32

Courtney et al.: World extreme wind gust record 5
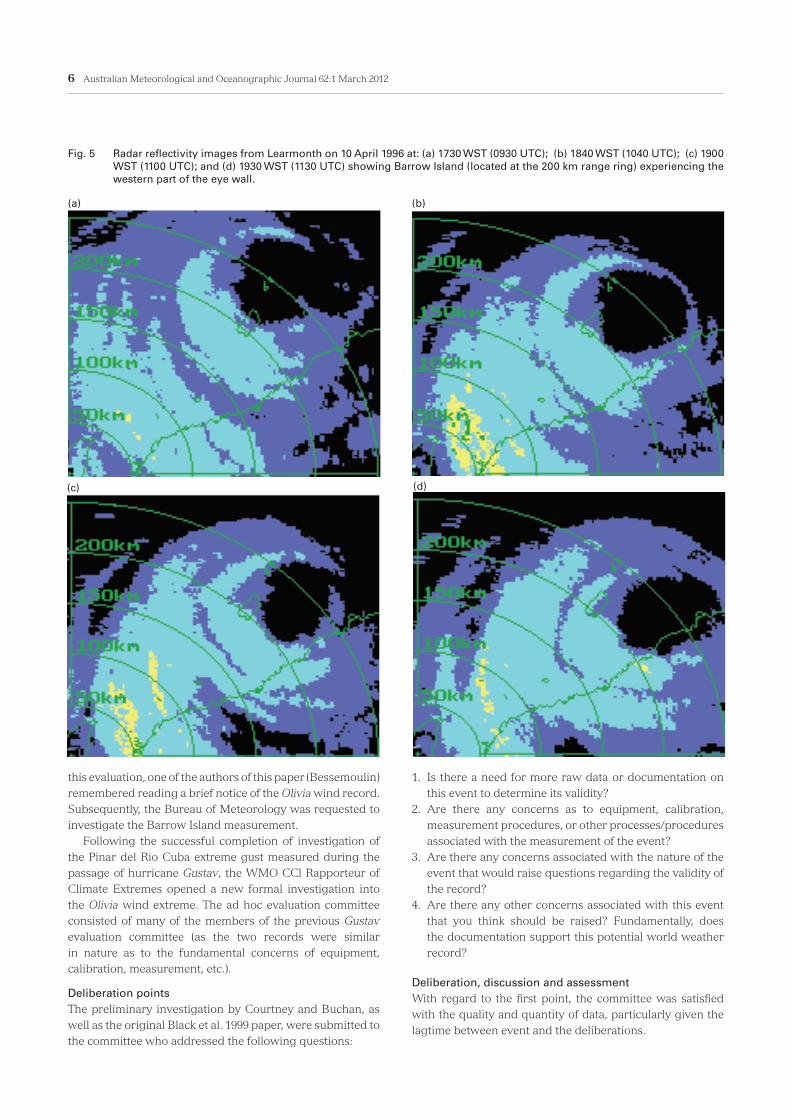
followed by a series of four lower values (minimum of 59 m s–1 (211 km h–1)) which were then followed by two more extreme gusts of 96 and 83 m s–1 (347 and 298 km h–1). The elapsed time between gust maxima was 30 minutes, representing a scale of 15 km compared to the eye diameter of 75 km. The five-minute average winds showed maxima and a minimum at the same time periods as the gusts. The five-minute average winds ‘only’ peaked at 49.4 m s–1 (178 km h–1), resulting in extreme gust factors of 1.75–2.75, well above the average gust factor throughout the cyclone of 1.3–1.4. Radar images from the Bureau of Meteorology radar at Learmonth in Fig. 5 showed that this event took place at the maximum reflectivity gradient at the inner edge of the western eyewall as it passed over the Barrow Island observing station. While it is expected that the reflectivity in the eastern eyewall region would be weaker owing to beam attenuation, satellite imagery confirms the strongest convection was occurring on the western side of the centre in the few hours prior to landfall. The Learmonth radar was a WF44 type having a wavelength of 10.4 cm and, at a distance of just over 200 km, the effective viewing height was approximately 5 km. Hence, the radar would not be able to detect small-scale features near the surface at Barrow Island. The observations also show it occurred just after the minimum pressure of 930 hPa was observed, as the mean winds were increasing steadily. In the previous hour, instruments on nearby Varanus Island showed the minimum pressure to be 927 hPa, also suggesting Barrow Island was at the edge of the eye. Varanus Island measured a peak gust of 74 m s–1 (267 km h–1) as a section of the eyewall passed.
AftermathInterestingly, the Barrow Island anemometer was not damaged, nor was a nearby building. The cyclone-rated structures were subjected to the extreme gusts for a very
short duration which would likely have contributed to their survival. The radiation shield on the temperature sensor was damaged and water ingress may account for the unrealistic temperatures measured for a period as presented in Table 1. It is also likely that relative humidity sensor was wet with rain causing 100 per cent humidity during the period of strong winds. However, in no way does this invalidate the wind data as the temperature and relative humidity probes are essentially independent of the anemometer. The problems appear to be at the sensor end rather than with the data logger especially as the pressure observations are completely valid. Although a full survey of damage on the island is not available, extreme winds displaced a number of heavy oilwell head pumps that were bolted to concrete pads.
Assessing the wind measurement
Deliberation preliminariesOne somewhat confusing aspect to the public concerning this evaluation is the long lag time between occurrence of the wind event (April 1996) and the deliberations of the WMO CCl evaluation committee for that event (2009). At the time of the event the extreme wind measurements were viewed with suspicion and were not included in the post-analysis report by the Bureau of Meteorology, although the observations from Varanus Island were included and given status as the strongest gust ever recorded in Australia (Callaghan 1997). The fact that the Barrow Island instrument was not owned and operated by the Bureau of Meteorology and the data were not ingested into the official Australian observational database contributed to the lack of follow-up investigation. However, staff at WNI Science and Engineering (now RPS MetOcean) believed in the validity of the measurement with their claims for the record presented at the 1999 Offshore Technology Conference (Black et al. 1999) but that was the full extent of the dissemination of information, the observation remaining broadly unknown within the meteorological community. In an attempt to verify the potential accuracy of the Olivia wind record, an identical model instrument was subsequently tested in a NASA high speed wind tunnel, which confirmed a linear wind speed response up to 100 m s–1 (360 km h–1). Harper et. al. (2009) documented unusually high oceanic wind gusts north of Barrow Island in the eye of severe tropical cyclone Orson in 1989, but instrument destruction precluded verification. Since that time, other extreme gusts as measured by aircraft dropwindsondes have been documented, including the measured 107 m s–1
at an elevation of 1400 m on the inner eyewall of hurricane Isabel in 2003 (Aberson et al., 2006). Such studies have given greater credence to the validity of the Barrow Island observations. The involvement of the WMO CCl extremes archive came early in 2009 as an evaluation committee assessed the (then) record tropical cyclone wind gust achieved at Pinar del Rio, Cuba, during the passage of hurricane Gustav in 2008. During
Fig. 4 Graphical plot of wind speed (sustained five-minute winds) and wind gusts in metres per second, wind direction, relative humidity (per cent), rainfall (mm) and pressure (hPa) on 10 April 1996 at Barrow Island, Australia, during the passage of Olivia. Time in UTC. All variables left axis, except wind direction (right axis) and pressure (scale not shown).
6 Australian Meteorological and Oceanographic Journal 62:1 March 2012
this evaluation, one of the authors of this paper (Bessemoulin) remembered reading a brief notice of the Olivia wind record. Subsequently, the Bureau of Meteorology was requested to investigate the Barrow Island measurement. Following the successful completion of investigation of the Pinar del Rio Cuba extreme gust measured during the passage of hurricane Gustav, the WMO CCl Rapporteur of Climate Extremes opened a new formal investigation into the Olivia wind extreme. The ad hoc evaluation committee consisted of many of the members of the previous Gustav evaluation committee (as the two records were similar in nature as to the fundamental concerns of equipment, calibration, measurement, etc.).
Deliberation pointsThe preliminary investigation by Courtney and Buchan, as well as the original Black et al. 1999 paper, were submitted to the committee who addressed the following questions:
1. Is there a need for more raw data or documentation on this event to determine its validity?
2. Are there any concerns as to equipment, calibration, measurement procedures, or other processes/procedures associated with the measurement of the event?
3. Are there any concerns associated with the nature of the event that would raise questions regarding the validity of the record?
4. Are there any other concerns associated with this event that you think should be raised? Fundamentally, does the documentation support this potential world weather record?
Deliberation, discussion and assessmentWith regard to the first point, the committee was satisfied with the quality and quantity of data, particularly given the lagtime between event and the deliberations.
Fig. 5 Radar reflectivity images from Learmonth on 10 April 1996 at: (a) 1730 WST (0930 UTC); (b) 1840 WST (1040 UTC); (c) 1900 WST (1100 UTC); and (d) 1930 WST (1130 UTC) showing Barrow Island (located at the 200 km range ring) experiencing the western part of the eye wall.
(b)
(d)
(a)
(c)

Courtney et al.: World extreme wind gust record 7
Secondly, the committee deliberated as to whether equipment issues may have influenced the record. For example, one committee member wrote: ‘The very radical changes in the gust factors … suggests to me there was an instrumentation problem. Now, the documentation states that the instrument data logger had some safeguards to prevent false reading. I’m wondering, though, if there was some failure mechanism that was not accounted for by these safeguards? What could cause false readings in this instrument in these circumstances?’ However, other members (and a consultant to the committee) noted that if the instrument had been operating with speeds ‘at 90–100 kn, with gusts to 150, then suddenly spiked to over 200 with nothing else even near that, it certainly would raise major red flags. The fact that it recorded three gusts in the 199–220 kn range, not just one, and was verified with a linear response to 194 kn, lends considerable confidence.’ While rarely measured, the high gust factors should not necessarily be unexpected for extreme gust events. During the Scottsdale (Tasmania) tornado event in April 2009 a Synchrotac (cup) anemometer operated by the Bureau of Meteorology recorded a wind gust of 105 knots (54 m s–1 or 194 km h–1) when the mean 10-minute wind was 20 knots (gust factor 5.3). Even accounting for a subsequent increase in the 10-minute wind to 25.4 knots, the resulting gust factor was still at 4.1. Extreme gusts can also be associated with fluctuations in the wind direction. Indeed the standard deviation of the wind direction peaks at the time of the highest wind gust (1055 UTC) increasing the validity of the data, however no such increase is apparent in the second set of extreme gusts some half an hour later. It is notable that the extreme gusts do not correspond to a commensurate increase in the mean winds, something which is often the case. This suggests there were only a small number of extreme gusts amongst the background flow. The mean winds had eased from over 40 m s–1 at 1000 UTC to about 34 m s–1 prior to the onset of the extreme gusts when they increased to 45.7 m s–1 at 1100 UTC and peaked at 49.4 m s–1 at 1125 UTC with the second set of extreme gusts. The variable nature of the flow in the eyewall region should not be that surprising given the convective differences as shown by satellite imagery in Fig. 2. Unfortunately neither the radar nor satellite imagery were of sufficient resolution to detect small-scale features, unlike the case of hurricane Isabel (Aberson et al. 2006). The fact that the extreme gusts did occur with some increase in mean wind, albeit not of the magnitude expected, does lend some support to the validity of the gusts. During the extensive email discussions, another committee member wrote: ‘Of course one can never be 100 per cent sure that an instrument is reading correctly, but there is no reason, in principle, why the anemometer in question should have been overestimating peak gusts … cup anemometers will overestimate the mean wind in gusty conditions (as they respond more rapidly to an acceleration
in wind speed than a deceleration), but the peak gusts should be accurately recorded. Wind tunnel calibrations of a similar instrument confirmed its accuracy at these high wind speeds. I am surprised that the instrument itself and the supporting mast survived these extreme conditions—a tribute both to the designers of the anemometer and those who installed it. I agree that the AC frequency measurement technique used should be relatively immune to noise (e.g. spikes from nearby lightning discharges), so the measurements should be robust.’ Committee members voiced major concerns regarding the third point involving the nature of the event. The comments, however, dealt with the nature of the phenomenon, and not actual occurrence of the event. Specifically, the complex question posed by the committee was whether the measured wind extremes were the result of an inner-rim mesovortex, a downburst, an embedded tornado, or something else. As one committee member noted: ‘As happened in the Gustav [extreme wind] event, these winds occurred in a portion of the eyewall where I would not normally expect them—the right rear quadrant in this case. A similar thing occurred in Atlantic hurricane Celia in 1970 (in the left rear quadrant), so this would not be unheard of. However, it would be unusual.’ A case for the event being a mesovortex was put forth by Black et al. (1999). They specifically reported evidence for the mesovortex theory in the relative humidity measurements. A sudden dip occurred in the near-saturated relative humidity at Barrow at the time of the lull between the two sets of extreme gusts. They argued that this may have been caused by a sudden subsidence such as would be expected to occur within the core of a mesovortex. However one evaluation comment was that ‘both downbursts and vortices (e.g. mini-swirl or mesovortex) could drop the relative humidity’ because parcels of subsident air are being sampled in both cases. It was noted: ‘Multiple mini-swirls and downbursts occurred in [hurricane] Andrew’s intensely convective eyewall, so it’s certainly possible that the site was hit by more than one such event embedded within (and orbiting) the eyewall. In the time it would take a downburst to descend (several minutes) within the ambient current, it would travel multiple miles in a ground-relative framework, and hit the ground with a streak of enhanced wind instead of a donut (i.e. an extremely stretched-out teardrop instead of the textbook, quasi-circular, toroidal process that one would expect with a slow-moving thunderstorm downburst).’ As Black et al. (1999) noted, the extreme gusts represented extreme gust factors of 2.28–2.75, nearly twice the average gust factor of 1.33 throughout the storm. This strongly suggests, they noted, that some process other than mechanical turbulence was important during this measurement period. Although, as shown above, the debate as to the physical mechanism is interesting and important, the critical and last issue for the evaluation committee was whether the documentation supported this event as a world weather

8 Australian Meteorological and Oceanographic Journal 62:1 March 2012
record. The consensus of the committee with regards to this fourth point was that the documentation did support the event as a world record. Consequently, the WMO CCl Rapporteur for Climate Extremes declared the event as a new world record measured surface wind gust.
Response and Debate
The media and public response to a press release (January 2010) issued by the World Meteorological Organization (WMO Media Center 2010) was rather extensive. The previous world weather wind gust record had been long held by the Mount Washington Observatory in New Hampshire, USA. Their measurement of 103.3 m s–1 (372 km h–1) was made on 12 April 1934 and has been a record of long-standing pride for residents of that state. One reporter noted to a committee member that New Hampshire had had two major distinctions, the ‘Old Man of the Mountain,’ a rock formation of a face-like feature, and ‘the Big Wind,’ the extreme wind measured at the Mt. Washington Observatory. The reporter sadly noted that the ‘Old Man of the Mountain’ formation abruptly collapsed in 2003 and ‘now you’re taking the “Big Wind” away from us.’ When the idea of a global weather archive was first proposed (Cerveny et al. 2007), the idea that weather extremes can be community or regional points of pride and community spirit was discussed. The strong reaction to this current wind extremes investigation aptly demonstrated the continued need for meteorologists and climatologists to be deeply sensitive to the local community’s potentially strong feelings regarding replacement of a long- or passionately held connection to a given weather record. As part of that response to the announcement of a new extreme wind, comments have been made by the media and public as to whether or not the new record is valid depending on whether it was caused by a tornado, mesovortex or something else. The opinion has been voiced that an extreme wind record caused by a tornado would not be ‘valid.’ That was a point that was discussed by the evaluation committee and for which the Rapporteur of Extreme Climates made a formal decision. The WMO CCl Weather and Climate Archive currently identify two types of phenomena (tornadoes and tropical cyclones) beyond the basic locational categories (e.g. world, hemispheric, continental/oceanic basin). Consequently, the Archive has (or will have) three separate wind categories:(a) measured surface maximum wind gust (encompassing all
surface winds); (b) measured surface tropical cyclonic wind gust; and (c) measured surface tornadic wind gust (when
measurements achieve such a record). Possible discrimination regarding the number and type of wind categories in the Archive is an issue that has also been raised. One of the co-authors, the Director of Summit Operations at the Mt. Washington Observatory (MWO) in New Hampshire, suggested that the causal mechanisms
are important aspects of the record. For example, he stated that the 1934 wind gust at MWO was apparently due to a very strong pressure gradient in an otherwise commonly occurring passage of a mid-latitude low pressure system (and so neither tropical cyclone nor tornado-related). Also he noted that the MWO gust factor (one of three or four very high gusts) was very low. Just prior to the highest gust the hourly average wind speed at the station was 77.3 m s–1 (173 mph), and two five-minute average wind values near the time of the gust were 84.3 m s–1 and 89.0 m s–1 (189 and 199 mph), so, the MWO Director concluded, the MWO wind gust was only 14.3 m s–1 (32 mph) above these values. However, despite such arguments, the World Meteorological Organization Archive at this time will not further discriminate the extreme wind category beyond the three categories listed above. First, at this initial stage of development of the Archive, the goal is to have fewer categories to ensure global quality control (e.g. the Archive does not yet list any global records for snowfall because of potential inconsistencies in global measurements and coverage). Second, the argument might be raised that if we were to add mountain versus sea level categories to the wind extremes, we should then include upper atmospheric (e.g. 200–300 hPa jet stream) wind extremes as well. While we may actually want to do that at some time in the future, at this time we will keep the categories relatively simple as measured values at the surface. Additionally, at this time, unless further evidence is given, the Archive does not list an official ‘measured’ world record for tornadic wind gust, since the most extreme values at this time have been made through radar inference and not by direct measurement. The Archive presently lists the radar-determined wind record of 135 m s–1 of the Oklahoma City 1999 tornado (Alexander and Wurman 2005) under the tornado category but not under the general measured wind category. Finally, unless future records warrant further subdivision, the Archive will limit locational divisions for wind extremes at this time only to world and hemispheric winds. Consequently, the Mt. Washington reading remains the strongest surface wind gust recorded in the northern and western hemispheres and the Cuban tropical cyclone Gustav reading remains the strongest surface tropical cyclone wind gust recorded in the northern and western hemispheres.
Implications for the category system and design standards
Just because Olivia holds the record for having the highest wind gust ever measured, it doesn’t imply that it is the most intense cyclone recorded. In fact Olivia is officially rated as a category 4 tropical cyclone on the one to five Australian intensity scale and on the Saffir-Simpson scale used in the Atlantic and East Pacific basins. These intensity scales are defined by the maximum mean wind speed over open flat land or water. Olivia’s peak intensity was estimated at 105 kn

Courtney et al.: World extreme wind gust record 9
(54 m s–1 or 195 km h–1) mean 10-minute winds. This would equate to gusts of 75 m s–1 (270 km h–1) using the using the recommended gust factor of 1.38 for onshore winds at a coastline in Harper et. al. (2009). While this is significantly lower than the measured gusts, the estimated maximum mean winds are consistent with the maximum measured 5-minute mean winds of 49 m s–1 (178 km h–1). The official intensity of a tropical cyclone excludes the effects of small-scale and shorter-lived phenomena including eyewall mesovortices that are likely to have caused the Barrow Island extreme wind gusts. These are considered to be ‘unrepresentative’ of the cyclone-scale circulation. Nevertheless, people in cyclone-affected zones, emergency services, engineers and planners should be aware that extreme gusts well above the ‘typical’ gusts quoted on the intensity scale are possible, particularly for Category 4 and 5 tropical cyclones.
Conclusions
As seen by the process of validation for this extreme wind gust record, the need for a carefully monitored global extremes database maintained by an accountable entity such as the World Meteorological Organization is critical in that many reported weather extreme events are often used by the media and the general public as indicators that the Earth’s climate is changing and/or becoming more variable. However, new records of all types should be expected as more capable instruments take measurements for longer periods of time and as additional weather stations are set up in remote locations. After careful examination by a panel of expert meteorologists and climatologists, the Barrow Island peak 3-second averaged wind of 113.3 m s–1 (408 km h–1) measured at ten metre height above ground during the passage of Olivia in April 1996 is now the world’s maximum measured wind gust. As the committee deliberations and reaction of the public and media demonstrate, careful analysis of the new record and marked sensitivity to previous records must be maintained. With improved measurement and data collection, new categories of weather and climate extremes must be considered and, when feasible, incorporated into the WMO CCl Weather and Climate Extremes Archive. While the extreme wind gust has been declared valid, it is not considered to be representative of the cyclone-scale circulation and hence does not mean Olivia’s intensity requires upgrading. Nor should it be used as evidence to suggest that tropical cyclones are becoming more intense. However engineers and planners should be aware that extreme gusts well above the ‘typical’ gusts are possible particularly for strong tropical cyclones.
Acknowledgments
The authors sincerely thank all of those who contributed to this evaluation process, particularly Jeff Kepert, Bruce Harper and Stan Stroud, and also Roger Edwards of the U.S. NOAA Storm Prediction Center. John Masters of RPS MetOcean deserves particular credit for his design of the EMS-16 data logger and technical input to this paper. We also thank the scientists and staff of the Mt. Washington Observatory who, like the evaluation committee, were caught somewhat by surprise by the rapid announcement of the record by the WMO media centre, for their patience, interest and discussion of this process.
ReferencesAberson, S.D., Montgomery, M., Bell, M. and Black, M. 2006. Hurricane
Isabel (2003): New Insights into the Physics of Intense Storms. Part II: Extreme Localized Wind, Bulletin of the American Meteorological Society, 87, 1349–1353.
Alexander, C. R., and Wurman, J. 2005. The 30 May 1998 Spencer, South Dakota, Storm. Part I: The Structural Evolution and Environment of the Tornadoes. Mon. Weather. Rev., 133, 72–97.
Black, P.G., Buchan S.J. and Cohen, R.I. 1999. The Tropical Cyclone Eye-wall Mesovortex: A Physical Mechanism Explaining Extreme Peak Gust Occurrence in TC Olivia, 4 April 1996 on Barrow Island, Austra-lia, Proceedings of the 31st Offshore Technology Conference, Houston TX, OTC 10792.
Callaghan, J. 1997. The South Pacific and southeast Indian Ocean tropical cyclone season 1995–96. Aust. Meteorol. Mag., 46, 325–339.
Cerveny, R.S., Lawrimore, J., Edwards, R. and Landsea, C. 2007. Extreme Weather Records: Compilation, Adjudication and Publication, Bulletin of the American Meteorological Society, 88, 853–860
Harper, B.A., Kepert, J.D. and Ginger, J.D. 2008. Guidelines for convert-ing between various wind averaging periods in tropical cyclone con-ditions. WMO, TCP Subproject, October, 2008.
Harper, B.A., Stroud, S.A., McCormack M. and West, S. 2008. A review of historical tropical cyclone intensity in north-western Australia and implications for climate change trend analysis. Aust. Meteorol. Mag., 57, 121–141.
Quetelard, H., Bessemoulin, P., Cerveny, R.S., Peterson, T.C., Burton, A. and Boodhoo, Y. 2009. World record rainfalls (72-hour and four-day accumulations) at Cratère Commerson, Réunion Island, during the passage of Tropical Cyclone Gamede, Bulletin of the American Meteo-rological Society, 90, 603–608
Simpson, R. H. and Riehl, H. 1981. The Hurricane and Its Impact. Louisi-ana State Univ. Press, Baton Rouge, USA, 398 pp.
Trewin, B.C. 2008. An enhanced tropical cyclone data set for the Austra-lian region. Tropical Meteorology Special Symposium, 88th American Meteorological Society Annual Meeting, New Orleans, 20–24 January 2008.
WMO Media Center. 2010. World Record Wind Gust: 408 km/h. http://www.wmo.int/pages/mediacentre/infonotes/info_58_en.html

10 Australian Meteorological and Oceanographic Journal 62:1 March 2012