Document that explains the chosen concept to the animator 1.
42
Document that explains the chosen concept to the animator 1
-
Upload
erik-stokes -
Category
Documents
-
view
216 -
download
0
Transcript of Document that explains the chosen concept to the animator 1.
Document that explains the chosen concept to the animator
1

Josephson Tunnelling-SIS Junction
When a thin insulating layer is sandwiched between two superconductors, the resulting junction is called a Superconductor-Insulator-Superconductor(S-I-S) Junction. The current-voltage relation with both the metals in the superconducting state are explored in this simulation.
AuthorsAnura.B.Kenkre
Course Name: superconductivity
2
Learning ObjectivesAfter interacting with this Learning Object, the learner will be able to:• Describe the SIS Junction.• Predict the effect of temperature on the I-V characteristics.• Predict the effect of the applied voltage on the current flowing through the
junction.
3

Pre-requisites:•Basic Quantum Mechanics(Phenomenon of tunneling.)
•Target Audience:TYBsc
4
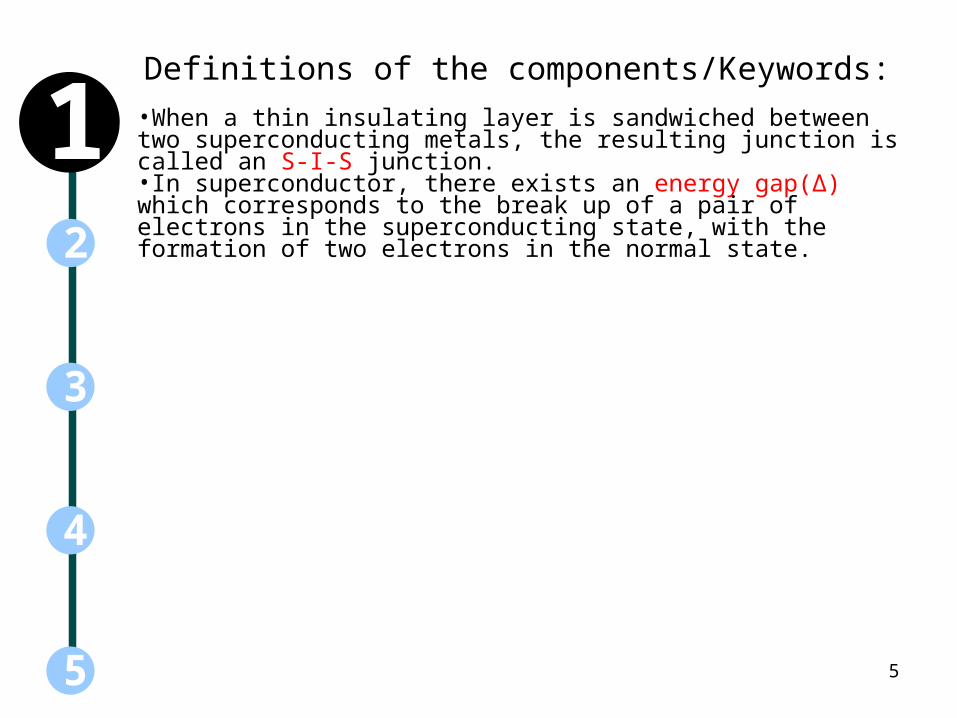
Definitions of the components/Keywords:
5
3
2
4
1 •When a thin insulating layer is sandwiched between two superconducting metals, the resulting junction is called an S-I-S junction.•In superconductor, there exists an energy gap(∆) which corresponds to the break up of a pair of electrons in the superconducting state, with the formation of two electrons in the normal state.
5
6
IMPORTANT NOTE TO THE ANIMATOR:
•All the instructions/labels or anything WRITTEN in blue are CONTENT NOT TO BE DISPLAYED!
•All the instructions WRITTEN in black are CONTENT TO BE DISPLAYED!
•This is not applicable for images as there can be overlapping of these colours there. This should be followed for all the instructions,labels,etc…
Kindly keep a note of this while displaying text in the animation.
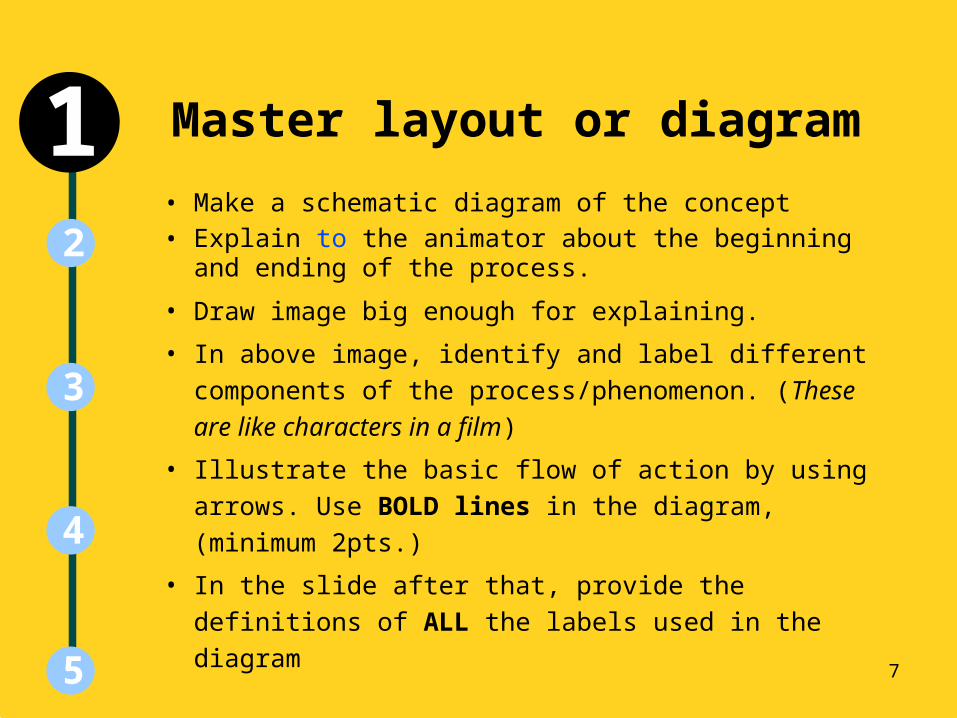
Master layout or diagram • Make a schematic diagram of the concept• Explain to the animator about the beginning and ending
of the process.
• Draw image big enough for explaining.
• In above image, identify and label different components
of the process/phenomenon. (These are like characters
in a film)
• Illustrate the basic flow of action by using arrows. Use
BOLD lines in the diagram, (minimum 2pts.)
• In the slide after that, provide the definitions of ALL the
labels used in the diagram
5
3
2
4
1INSTRUCTIONS SLIDE
7
Master layout or diagram
• You may have multiple master layouts. – In this case, number the master
layout. ( e.g. Master layout 1)– Each Master layout should be
followed by the stepwise description of the animation stages related to it.
5
3
2
4
1INSTRUCTIONS SLIDE
8
Room Temperature
Transition Temperature and zero voltage
Absolute Zero
Transition Temperature and varying voltage
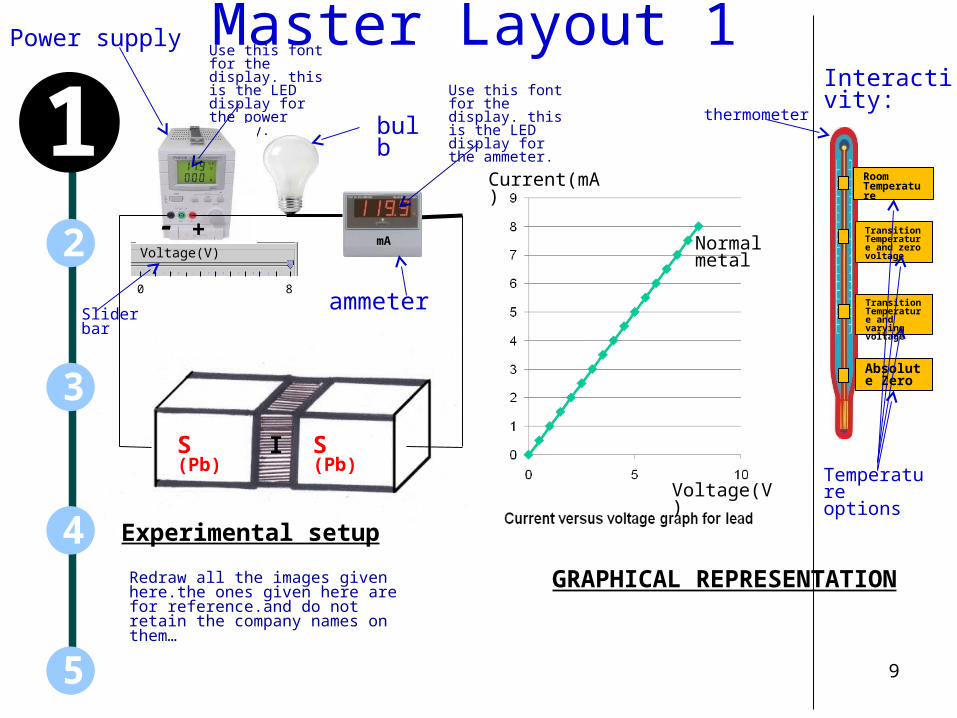
Master Layout 1
5
3
2
4
1Interactivity:
9
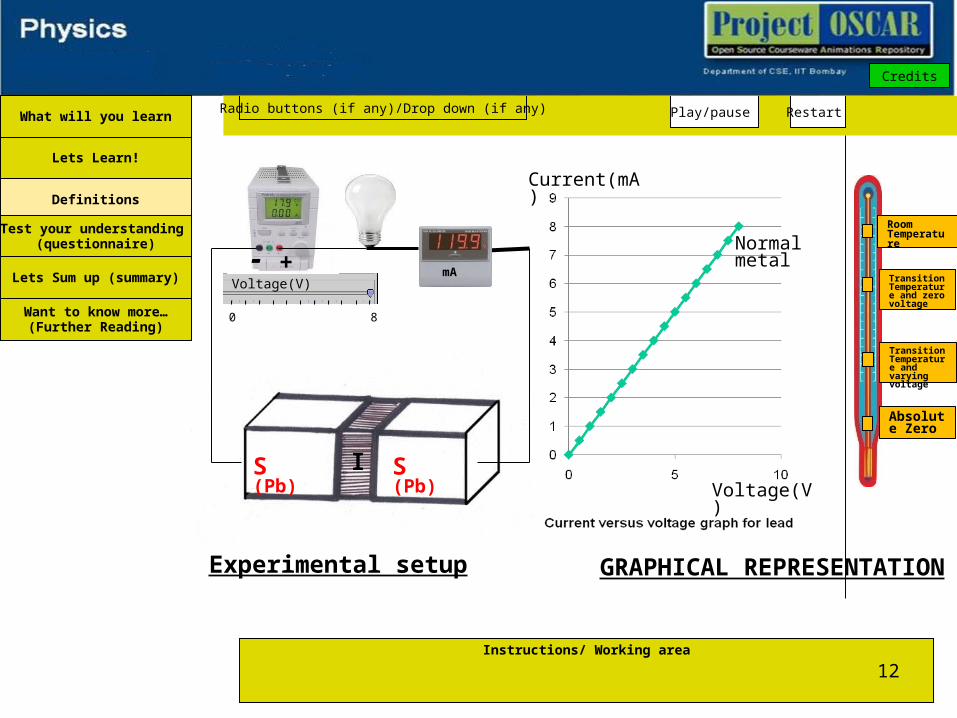
GRAPHICAL REPRESENTATION
Use this font for the display. this is the LED display for the ammeter.
Use this font for the display. this is the LED display for the power supply.
Power supply
I
Voltage(V)
0 8
S (Pb)
mA
ammeter
+-
Experimental setup
bulbthermometer
Temperature options
Slider bar
Redraw all the images given here.the ones given here are for reference.and do not retain the company names on them…
S (Pb)
Current(mA)
Voltage(V)
Normal metal
10
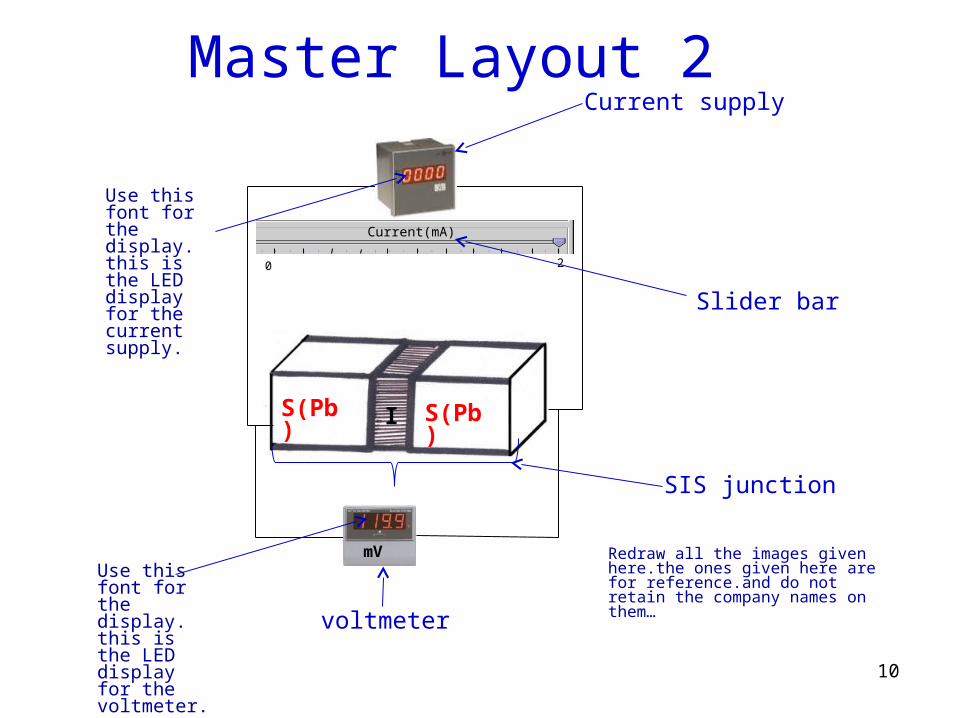
Master Layout 2
0 2
Current(mA)
IS(Pb)
mV
Current supply
Slider bar
voltmeter
Use this font for the display. this is the LED display for the voltmeter.
Use this font for the display. this is the LED display for the current supply.
SIS junction
S(Pb)
Redraw all the images given here.the ones given here are for reference.and do not retain the company names on them…
Animation design
• Please see the design template provided in the next slide.
• This is a sample template, and you are free to change as per your design requirements.
• Try and recreate the sections/subsections as shown in the template.
1
5
2
4
3
11
Instructions/ Working area
Radio buttons (if any)/Drop down (if any) Play/pause Restart
Credits
12
Experimental setup
I
Voltage(V)
0 8
S (Pb)
mA+-
Want to know more…(Further Reading)
Definitions
Test your understanding (questionnaire)
Lets Learn!
Lets Sum up (summary)
What will you learn
GRAPHICAL REPRESENTATION
S (Pb)
Room Temperature
Transition Temperature and zero voltage
Absolute Zero
Transition Temperature and varying voltage
Current(mA)
Voltage(V)
Normal metal
Explain the process1
5
3
2
4
In this step, use an example to explain the concept. It can be an analogy, a scenario, or an action which explains this concept/process/topic
Try to use examples from day-to-day life to make it more clear
You have to describe what steps the animator should take to make your concept come alive as a series of moving images.
Keep the examples simple to understand, and also to illustrate/animate.
13
Analogy1
5
3
2
4
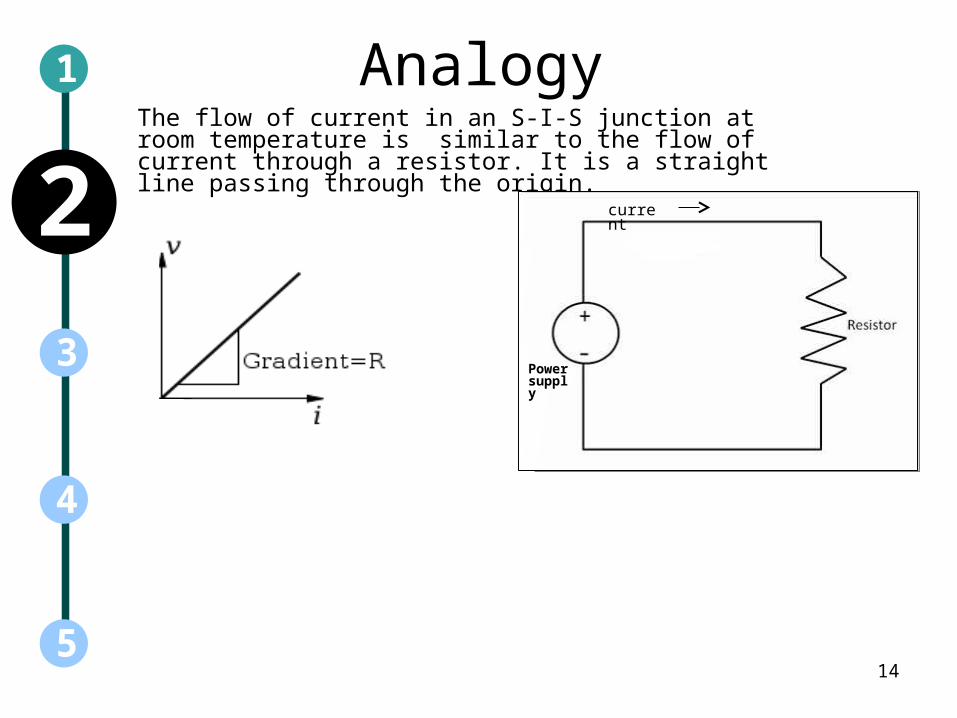
The flow of current in an S-I-S junction at room temperature is similar to the flow of current through a resistor. It is a straight line passing through the origin.
current
Power supply
14
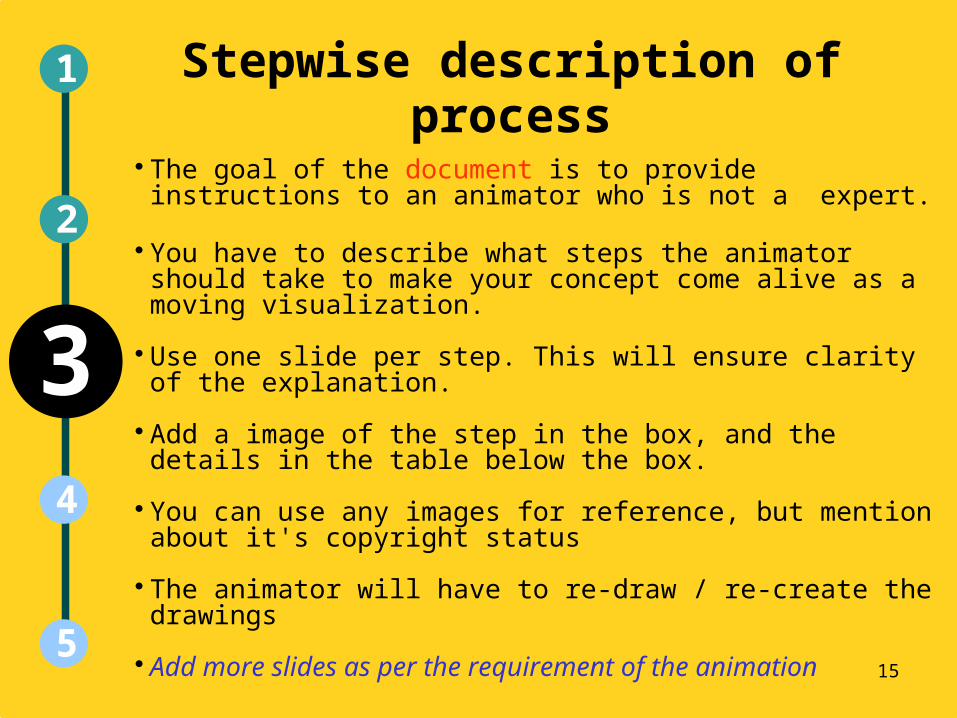
Stepwise description of process The goal of the document is to provide instructions to an animator
who is not a expert.
You have to describe what steps the animator should take to make your concept come alive as a moving visualization.
Use one slide per step. This will ensure clarity of the explanation.
Add a image of the step in the box, and the details in the table below the box.
You can use any images for reference, but mention about it's copyright status
The animator will have to re-draw / re-create the drawings
Add more slides as per the requirement of the animation
1
5
3
2
4
15
1
5
3
2
4
Step No:1
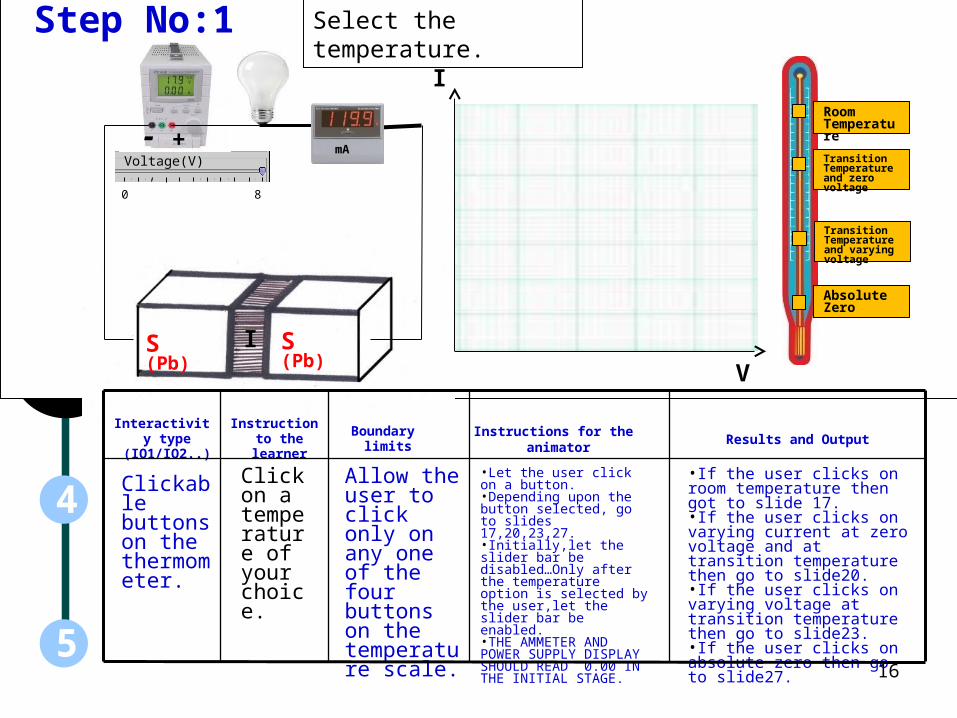
Clickable buttons on the thermometer.
Click on a temperature of your choice.
Allow the user to click only on any one of the four buttons on the temperature scale.
•Let the user click on a button.•Depending upon the button selected, go to slides 17,20,23,27.•Initially,let the slider bar be disabled…Only after the temperature option is selected by the user,let the slider bar be enabled.•THE AMMETER AND POWER SUPPLY DISPLAY SHOULD READ 0.00 IN THE INITIAL STAGE.
•If the user clicks on room temperature then got to slide 17.•If the user clicks on varying current at zero voltage and at transition temperature then go to slide20.•If the user clicks on varying voltage at transition temperature then go to slide23.•If the user clicks on absolute zero then go to slide27.
V
Select the temperature.
16
I
Voltage(V)
0 8
S (Pb)
mA+-
Instructions for the animator
Instruction to the learner
Results and OutputBoundary
limits
Interactivity type
(IO1/IO2..)
S (Pb)
IRoom Temperature
Transition Temperature and zero voltage
Absolute Zero
Transition Temperature and varying voltage
Step 2: 1
5
3
2
4
e
Description of the action/ interactivity
At room temperature.
Fig 2
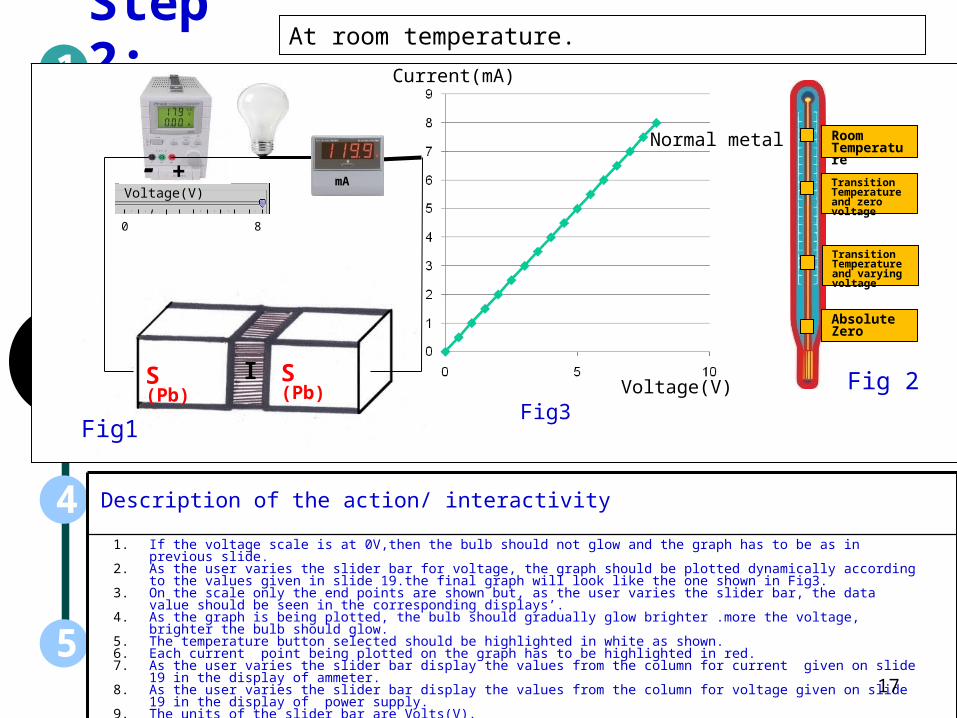
1. If the voltage scale is at 0V,then the bulb should not glow and the graph has to be as in previous slide.2. As the user varies the slider bar for voltage, the graph should be plotted dynamically according to the values given in slide 19.the
final graph will look like the one shown in Fig3.3. On the scale only the end points are shown but, as the user varies the slider bar, the data value should be seen in the
corresponding displays’.4. As the graph is being plotted, the bulb should gradually glow brighter .more the voltage, brighter the bulb should glow.5. The temperature button selected should be highlighted in white as shown.6. Each current point being plotted on the graph has to be highlighted in red.7. As the user varies the slider bar display the values from the column for current given on slide 19 in the display of ammeter.8. As the user varies the slider bar display the values from the column for voltage given on slide 19 in the display of power supply.9. The units of the slider bar are Volts(V).10. After the graph is plotted, the text has to fade in as shown in Fig 3. 17
I
Voltage(V)
0 8
S (Pb)
mA+-
Fig1
S (Pb)
Current(mA)
Voltage(V)
Normal metal
Fig3
Room Temperature
Transition Temperature and zero voltage
Absolute Zero
Transition Temperature and varying voltage
1
5
3
2
4
Instructions for the animator
Instruction to the learner
Results and OutputBoundary
limits
Interactivity type
(IO1/IO2..)
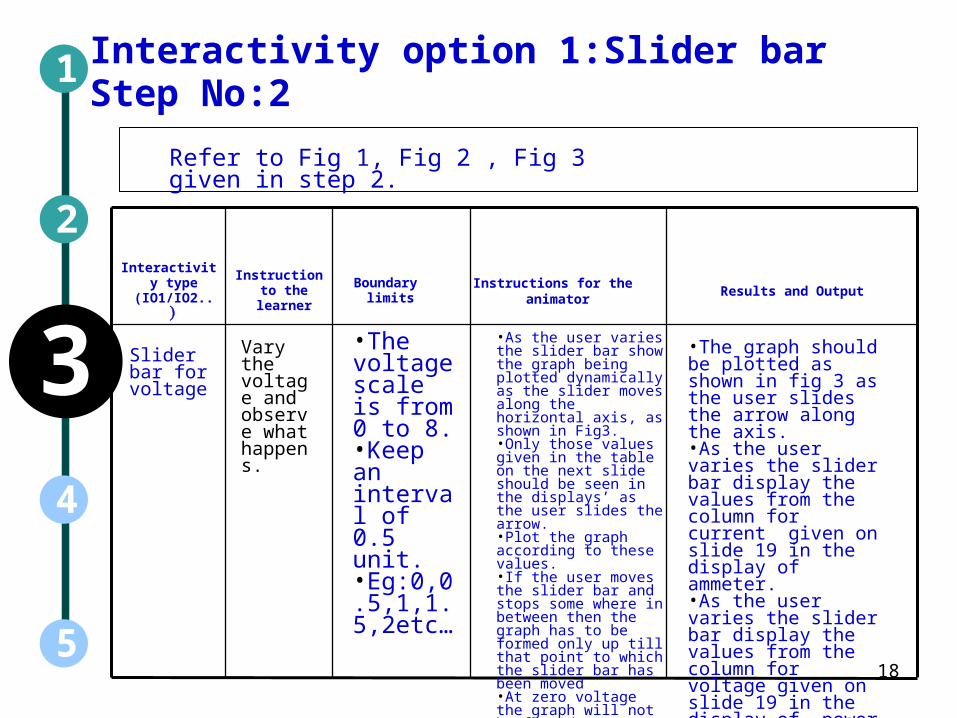
Interactivity option 1:Slider bar Step No:2
Refer to Fig 1, Fig 2 , Fig 3 given in step 2.
Slider bar for voltage
Vary the voltage and observe what happens.
•As the user varies the slider bar show the graph being plotted dynamically as the slider moves along the horizontal axis, as shown in Fig3.•Only those values given in the table on the next slide should be seen in the displays’ as the user slides the arrow.•Plot the graph according to these values.•If the user moves the slider bar and stops some where in between then the graph has to be formed only up till that point to which the slider bar has been moved•At zero voltage the graph will not be formed.•Each point that is currently being plotted has to be highlighted in red.
•The graph should be plotted as shown in fig 3 as the user slides the arrow along the axis.•As the user varies the slider bar display the values from the column for current given on slide 19 in the display of ammeter.•As the user varies the slider bar display the values from the column for voltage given on slide 19 in the display of power supply.
•The voltage scale is from 0 to 8.•Keep an interval of 0.5 unit.•Eg:0,0.5,1,1.5,2etc…
18
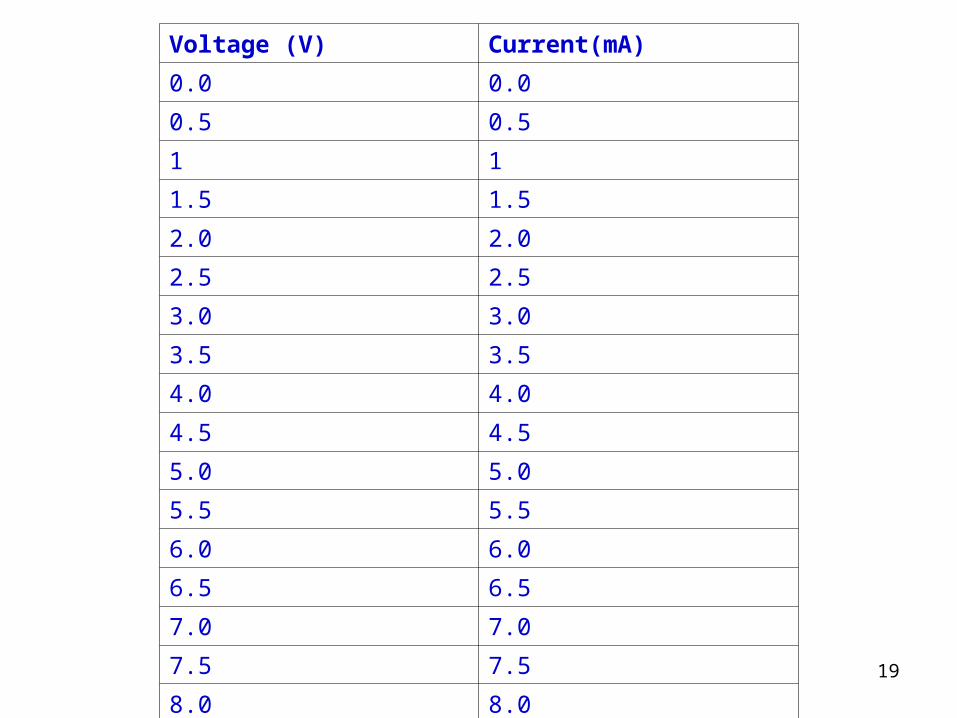
Voltage (V) Current(mA)
0.0 0.0
0.5 0.5
1 1
1.5 1.5
2.0 2.0
2.5 2.5
3.0 3.0
3.5 3.5
4.0 4.0
4.5 4.5
5.0 5.0
5.5 5.5
6.0 6.0
6.5 6.5
7.0 7.0
7.5 7.5
8.0 8.0
19
3
1
5
2
4
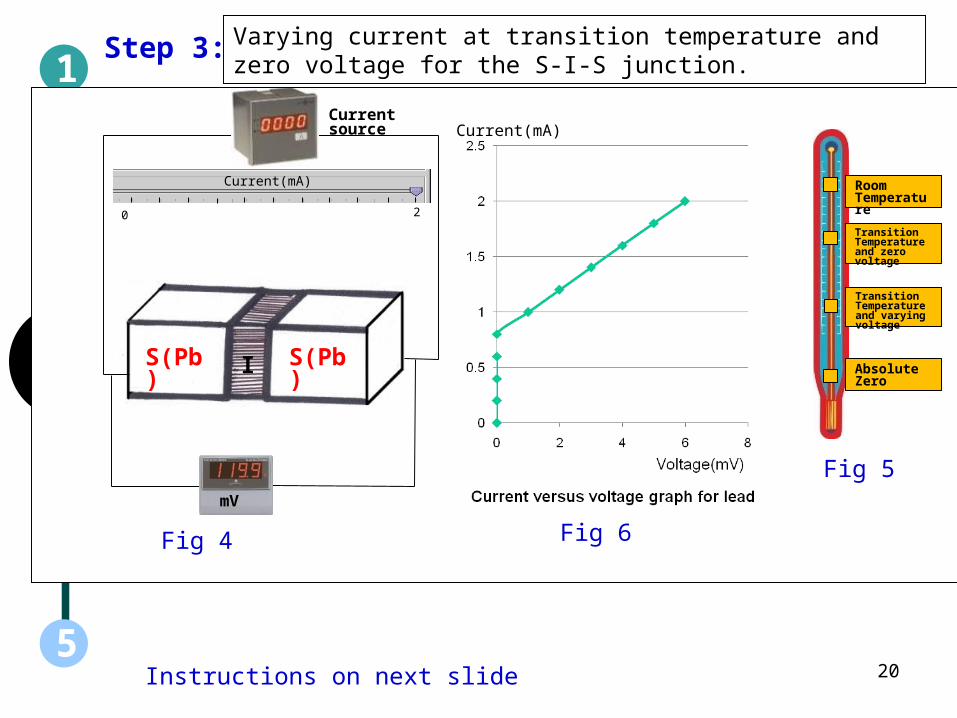
Varying current at transition temperature and zero voltage for the S-I-S junction.
Fig 5
Instructions on next slide
Fig 6Fig 4
Current(mA)
20
Step 3:
0 2
Current(mA)
I
mV
Current source
Room Temperature
Absolute Zero
Transition Temperature and zero voltage
Transition Temperature and varying voltage
S(Pb) S(Pb)
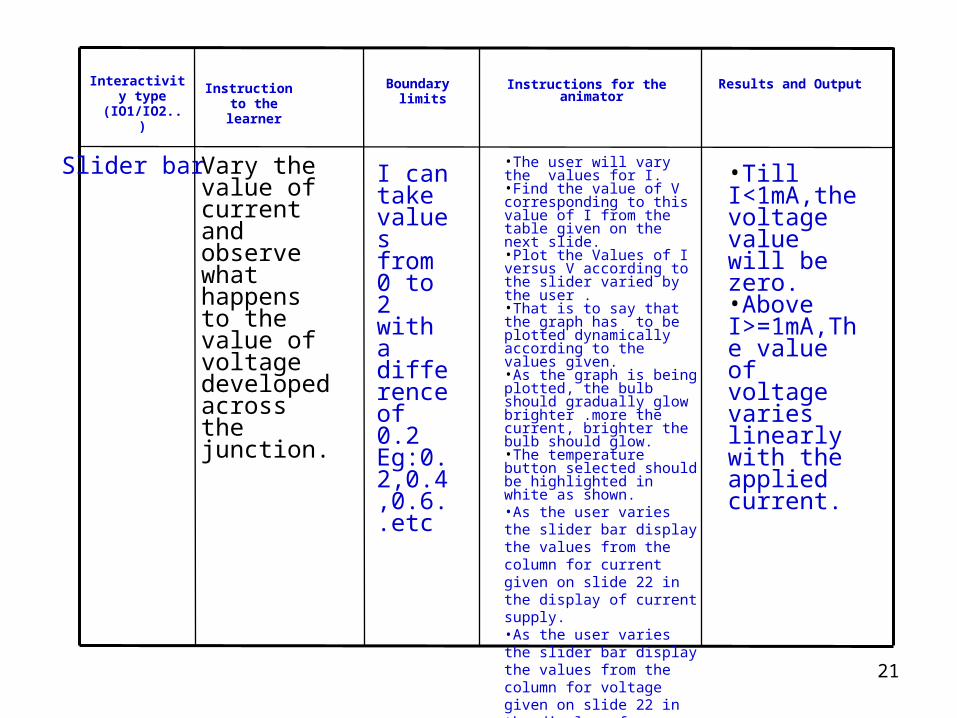
Instructions for the animator
Instruction to the learner
Results and OutputBoundary limits
Interactivity type
(IO1/IO2..)
Slider bar Vary the value of current and observe what happens to the value of voltage developed across the junction.
I can take values from 0 to 2 with a difference of 0.2Eg:0.2,0.4,0.6..etc
•The user will vary the values for I.•Find the value of V corresponding to this value of I from the table given on the next slide.•Plot the Values of I versus V according to the slider varied by the user .•That is to say that the graph has to be plotted dynamically according to the values given.•As the graph is being plotted, the bulb should gradually glow brighter .more the current, brighter the bulb should glow.•The temperature button selected should be highlighted in white as shown.•As the user varies the slider bar display the values from the column for current given on slide 22 in the display of current supply.•As the user varies the slider bar display the values from the column for voltage given on slide 22 in the display of voltmeter.
•Till I<1mA,the voltage value will be zero.•Above I>=1mA,The value of voltage varies linearly with the applied current.
21
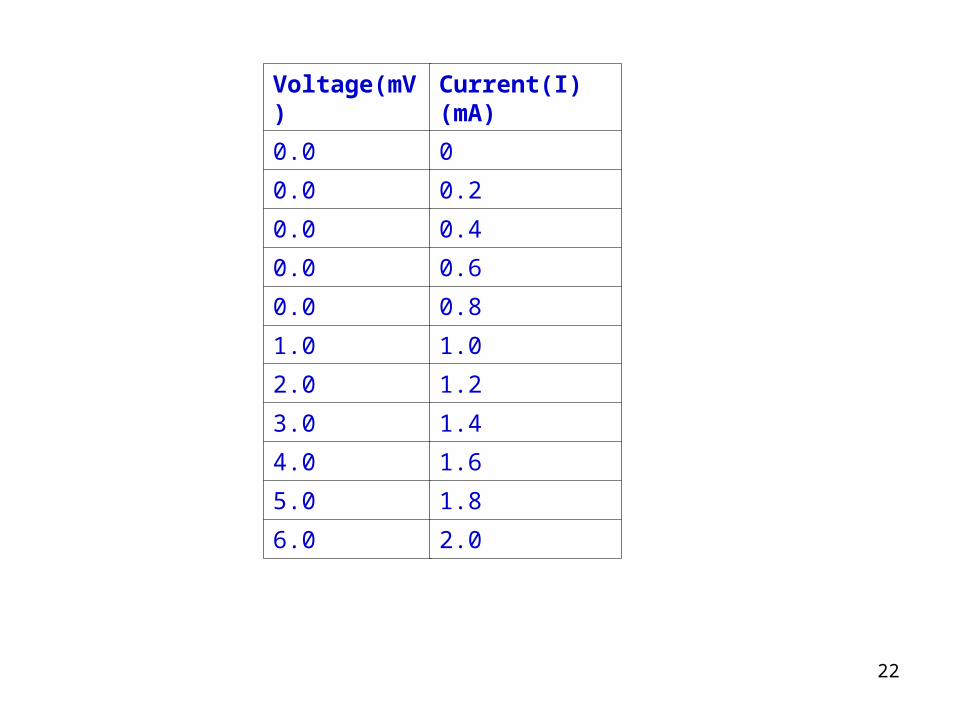
Voltage(mV)
0.0
0.0
0.0
0.0
0.0
1.0
2.0
3.0
4.0
5.0
6.0
Current(I)(mA)
0
0.2
0.4
0.6
0.8
1.0
1.2
1.4
1.6
1.8
2.0
22
Current(mA)
I
Voltage(mV)
0 3.3
S (Pb)
mA+-
S (Pb)
Step 4:1
5
3
2
4
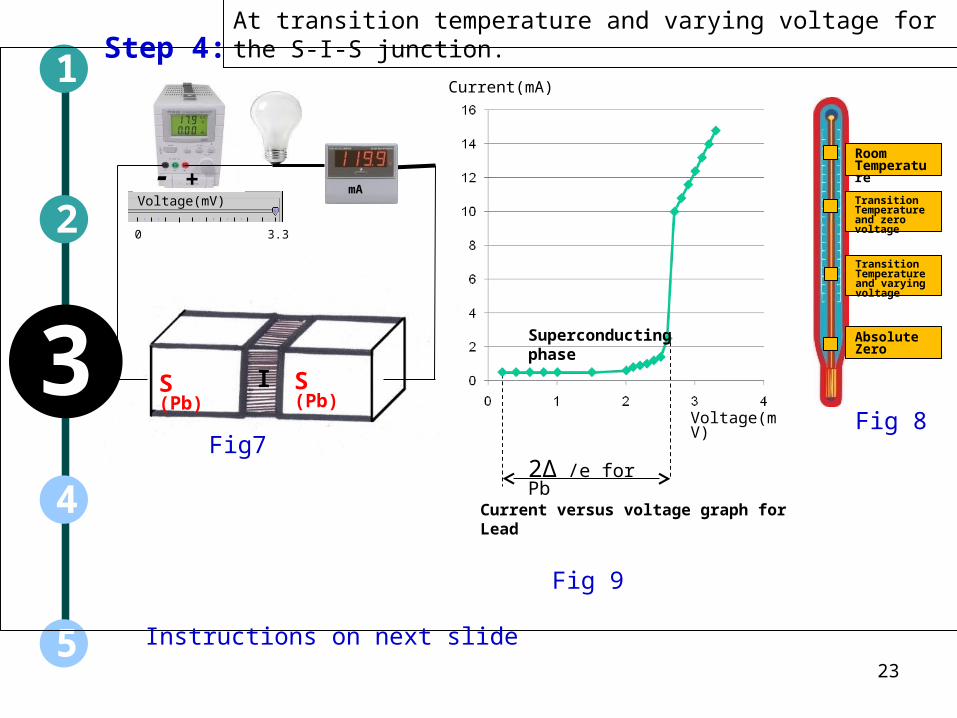
At transition temperature and varying voltage for the S-I-S junction.
Fig7Fig 8
Instructions on next slide
Fig 9
23
2∆ /e for Pb
Voltage(mV)
Room Temperature
Absolute Zero
Transition Temperature and zero voltage
Transition Temperature and varying voltage
Superconducting phase
Current versus voltage graph for Lead
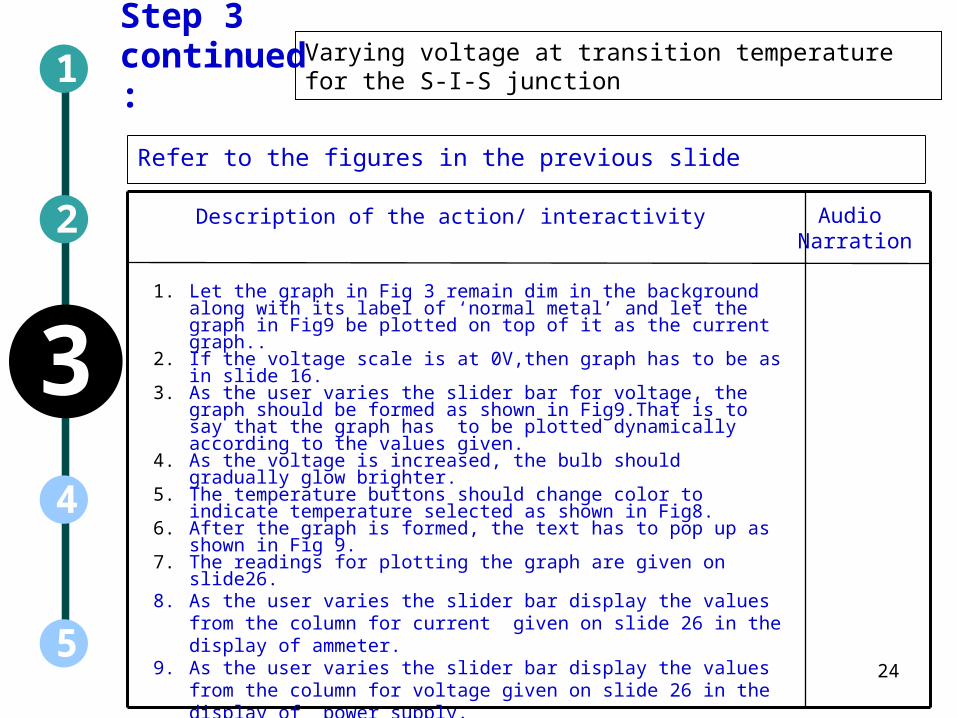
Step 3 continued: 1
5
3
2
4
Refer to the figures in the previous slide
Audio Narration
Description of the action/ interactivity
Varying voltage at transition temperature for the S-I-S junction
1. Let the graph in Fig 3 remain dim in the background along with its label of ‘normal metal’ and let the graph in Fig9 be plotted on top of it as the current graph..
2. If the voltage scale is at 0V,then graph has to be as in slide 16.3. As the user varies the slider bar for voltage, the graph should be formed
as shown in Fig9.That is to say that the graph has to be plotted dynamically according to the values given.
4. As the voltage is increased, the bulb should gradually glow brighter.5. The temperature buttons should change color to indicate temperature
selected as shown in Fig8.6. After the graph is formed, the text has to pop up as shown in Fig 9.7. The readings for plotting the graph are given on slide26.8. As the user varies the slider bar display the values from the column for
current given on slide 26 in the display of ammeter.9. As the user varies the slider bar display the values from the column for
voltage given on slide 26 in the display of power supply.10. The units of the slider bar are millivolts(mV).
24
1
5
3
2
4
Instructions for the animator
Instruction to the learner
Results and OutputBoundary
limits
Interactivity type
(IO1/IO2..)
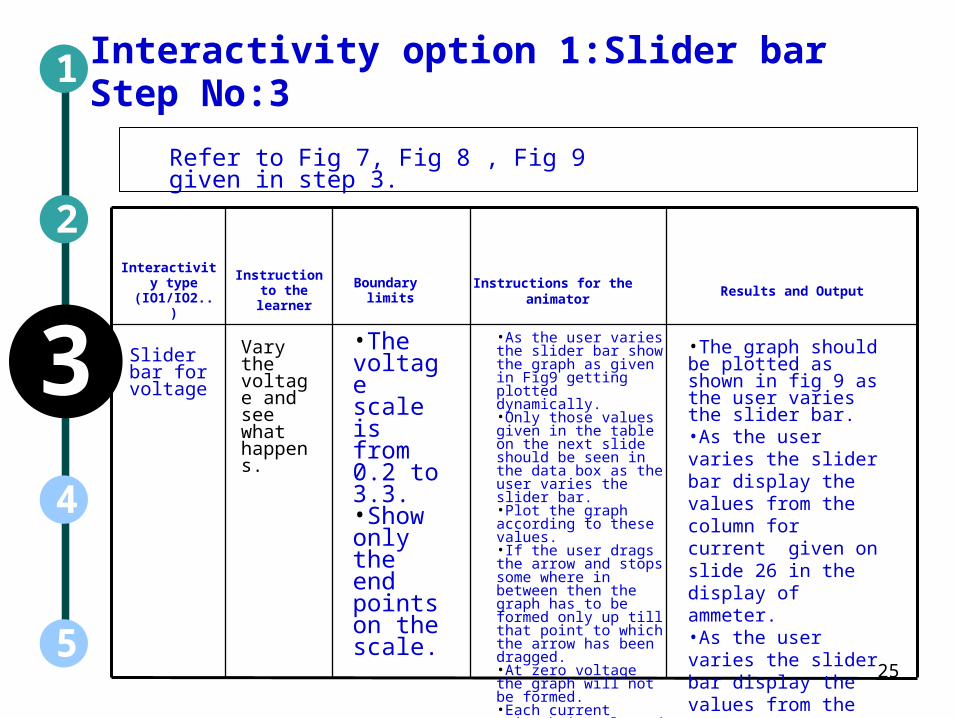
Interactivity option 1:Slider bar Step No:3
Refer to Fig 7, Fig 8 , Fig 9 given in step 3.
Slider bar for voltage
Vary the voltage and see what happens.
•As the user varies the slider bar show the graph as given in Fig9 getting plotted dynamically.•Only those values given in the table on the next slide should be seen in the data box as the user varies the slider bar.•Plot the graph according to these values.•If the user drags the arrow and stops some where in between then the graph has to be formed only up till that point to which the arrow has been dragged.•At zero voltage the graph will not be formed.•Each current point being plotted has to be highlighted in red.
•The graph should be plotted as shown in fig 9 as the user varies the slider bar.•As the user varies the slider bar display the values from the column for current given on slide 26 in the display of ammeter.•As the user varies the slider bar display the values from the column for voltage given on slide 26 in the display of power supply.
•The voltage scale is from 0.2 to 3.3.•Show only the end points on the scale.
25
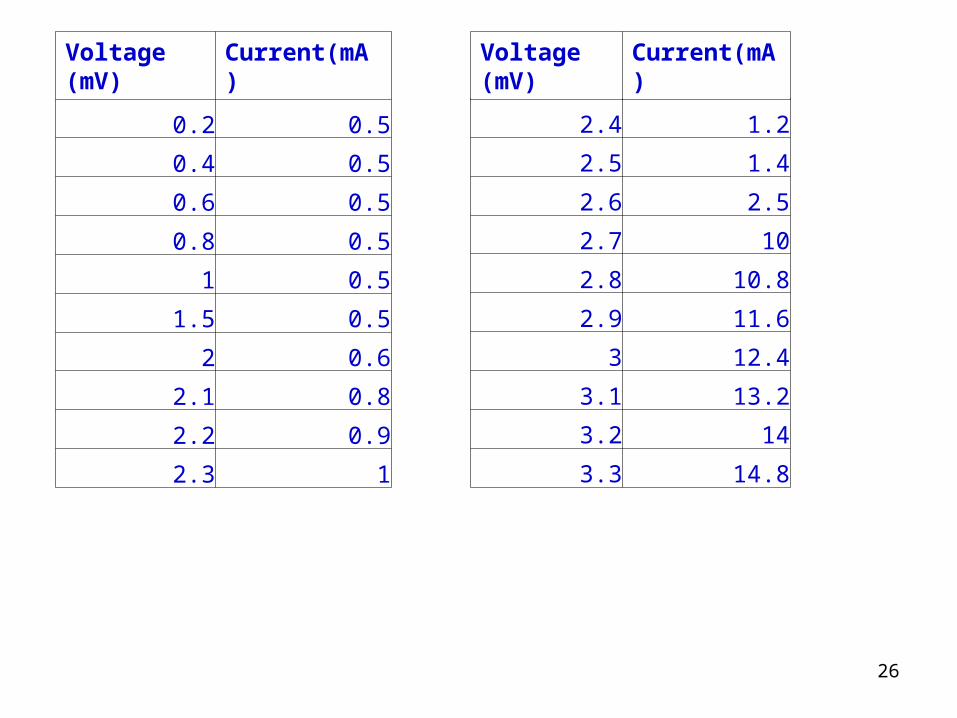
Voltage (mV)
Current(mA)
0.2 0.5
0.4 0.5
0.6 0.5
0.8 0.5
1 0.5
1.5 0.5
2 0.6
2.1 0.8
2.2 0.9
2.3 1
2.4 1.2
2.5 1.4
2.6 2.5
2.7 10
2.8 10.8
2.9 11.6
3 12.4
3.1 13.2
3.2 14
3.3 14.8
Voltage (mV)
Current(mA)
26
I
Voltage(mV)
0 3.3
S (Pb)
mA+-
S (Pb)
Step 4:1
5
3
2
4
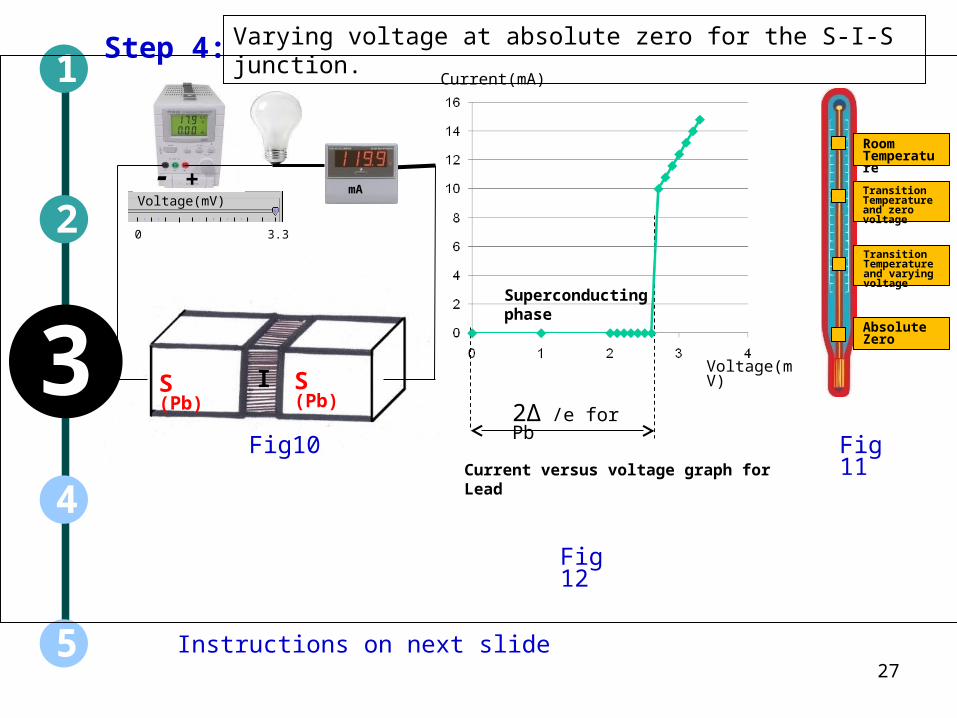
Varying voltage at absolute zero for the S-I-S junction.
2∆ /e for Pb
Fig10 Fig 11
Instructions on next slide
Fig 12
27
Voltage(mV)
Current(mA)
Room Temperature
Absolute Zero
Transition Temperature and zero voltage
Transition Temperature and varying voltage
Superconducting phase
Current versus voltage graph for Lead
Step 4 continued: 1
5
3
2
4
Refer to the figures in the previous slide
Audio Narration
Description of the action/ interactivity
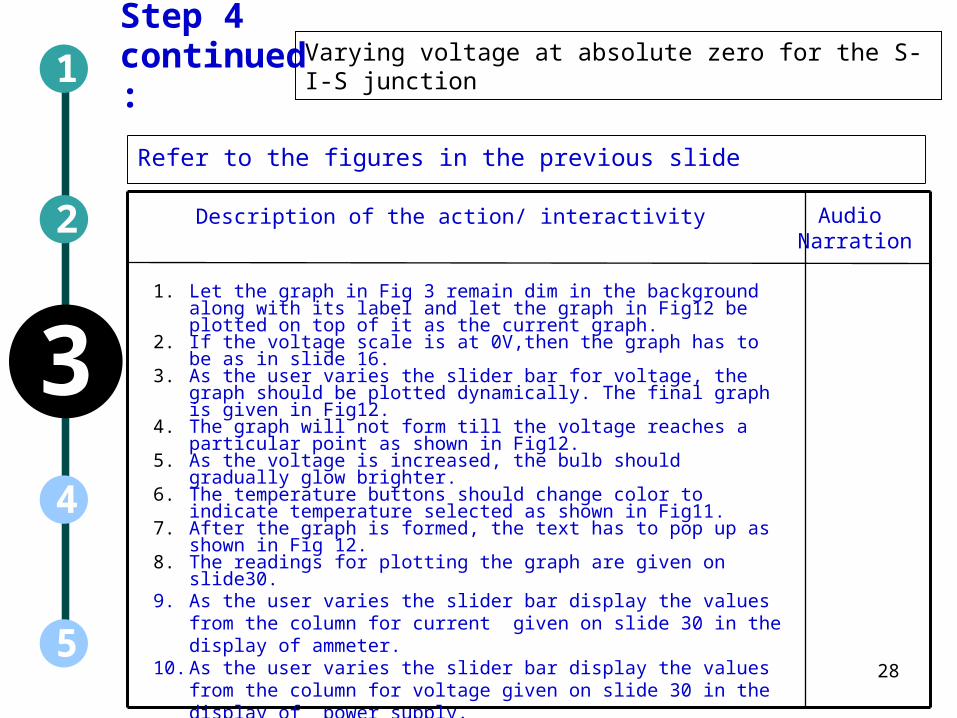
Varying voltage at absolute zero for the S-I-S junction
1. Let the graph in Fig 3 remain dim in the background along with its label and let the graph in Fig12 be plotted on top of it as the current graph.
2. If the voltage scale is at 0V,then the graph has to be as in slide 16.3. As the user varies the slider bar for voltage, the graph should be plotted
dynamically. The final graph is given in Fig12. 4. The graph will not form till the voltage reaches a particular point as
shown in Fig12.5. As the voltage is increased, the bulb should gradually glow brighter.6. The temperature buttons should change color to indicate temperature
selected as shown in Fig11.7. After the graph is formed, the text has to pop up as shown in Fig 12.8. The readings for plotting the graph are given on slide30.9. As the user varies the slider bar display the values from the column for
current given on slide 30 in the display of ammeter.10. As the user varies the slider bar display the values from the column for
voltage given on slide 30 in the display of power supply.11. The units of the slider bar are millivolts(mV).12. Each current point being plotted has to be highlighted in red.
28
1
5
3
2
4
Instructions for the animator
Instruction to the learner
Results and OutputBoundary
limits
Interactivity type
(IO1/IO2..)
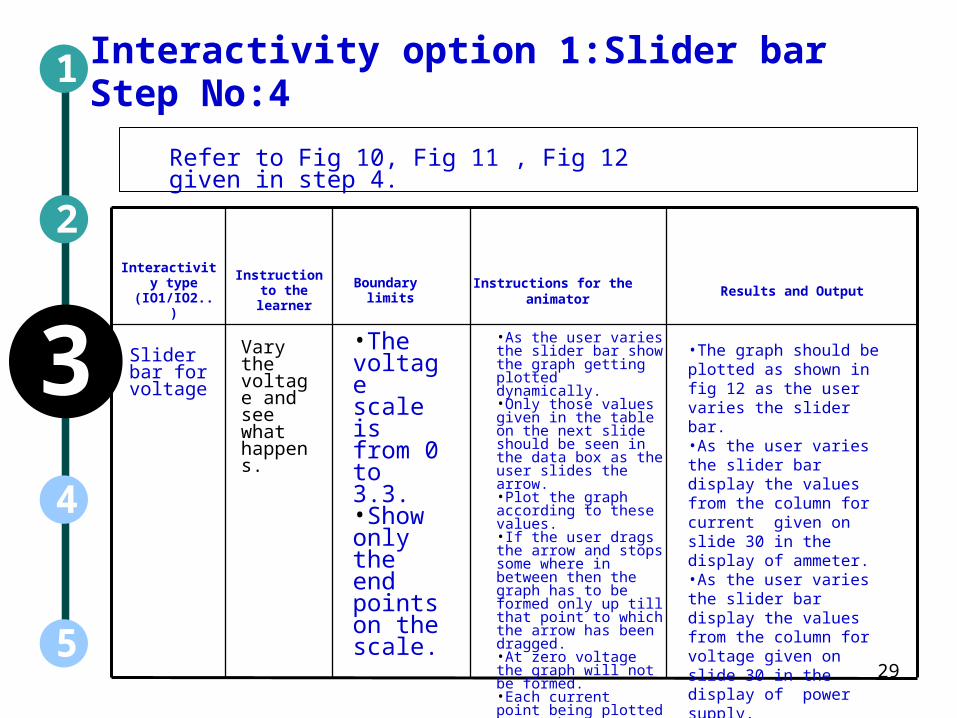
Interactivity option 1:Slider bar Step No:4
Refer to Fig 10, Fig 11 , Fig 12 given in step 4.
Slider bar for voltage
Vary the voltage and see what happens.
•As the user varies the slider bar show the graph getting plotted dynamically.•Only those values given in the table on the next slide should be seen in the data box as the user slides the arrow.•Plot the graph according to these values.•If the user drags the arrow and stops some where in between then the graph has to be formed only up till that point to which the arrow has been dragged.•At zero voltage the graph will not be formed.•Each current point being plotted has to be highlighted in red.
•The graph should be plotted as shown in fig 12 as the user varies the slider bar.•As the user varies the slider bar display the values from the column for current given on slide 30 in the display of ammeter.•As the user varies the slider bar display the values from the column for voltage given on slide 30 in the display of power supply.
•The voltage scale is from 0 to 3.3.•Show only the end points on the scale.
29
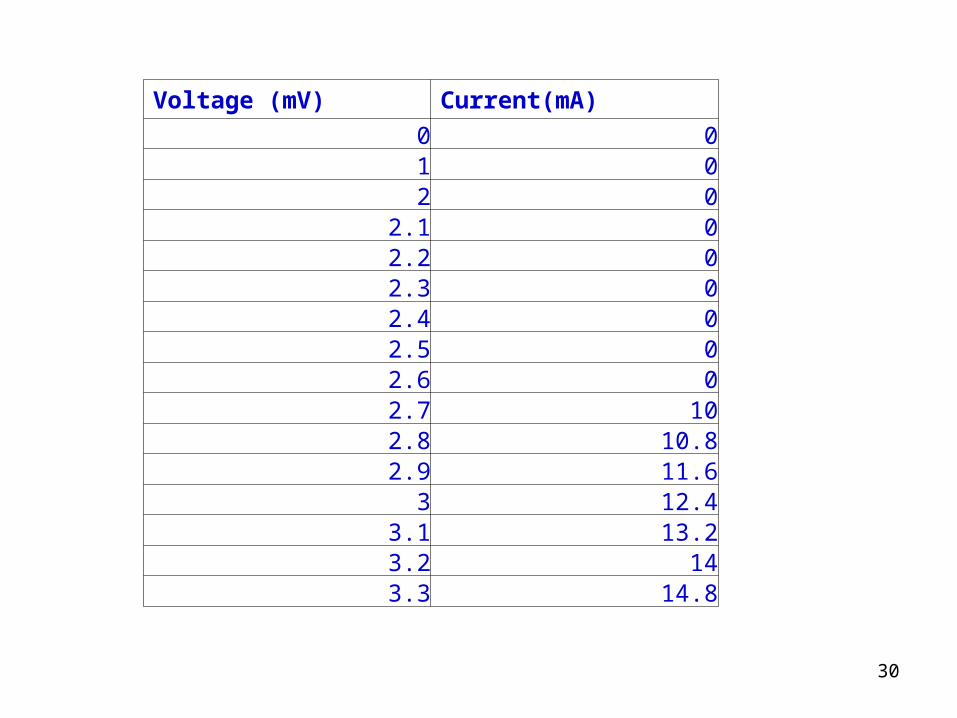
Voltage (mV) Current(mA)
0 01 02 0
2.1 02.2 02.3 02.4 02.5 02.6 02.7 102.8 10.82.9 11.63 12.4
3.1 13.23.2 143.3 14.8
30
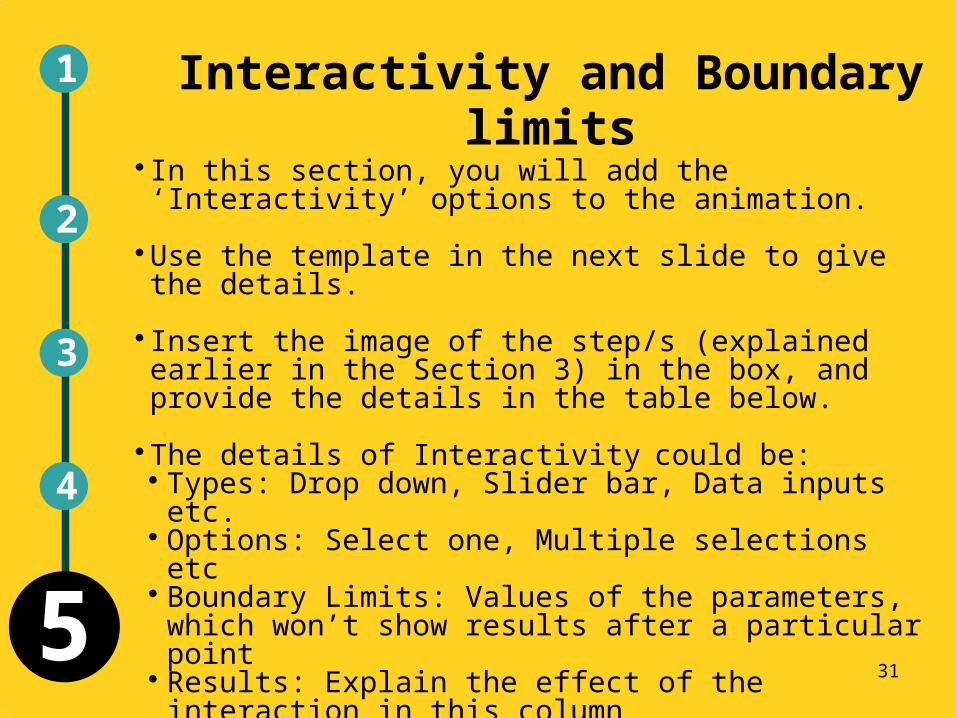
Interactivity and Boundary limitsIn this section, you will add the ‘Interactivity’ options to the animation.
Use the template in the next slide to give the details.
Insert the image of the step/s (explained earlier in the Section 3) in the box, and provide the details in the table below.
The details of Interactivity could be: Types: Drop down, Slider bar, Data inputs etc. Options: Select one, Multiple selections etc Boundary Limits: Values of the parameters, which won’t
show results after a particular point Results: Explain the effect of the interaction in this column
Add more slides if necessary
1
2
5
3
4
31
INSTRUCTIONS SLIDE
Self- Assessment Questionnaire for
Learners• Please provide a set of questions that a user
can answer based on the LO. They can be of
the following types: – These questions should be 5 in number and can be of
objective type (like MCQ, Match the columns, Yes or
No, Sequencing, Odd One Out).
– The questions can also be open-ended. The user
would be asked to think about the question. The
author is requested to provide hints if possible, but a
full answer is not necessary.
– One can include questions, for which the user will
need to interact with the LO (with certain
parameters) in order to answer it.32
INSTRUCTIONS SLIDE
• Please make sure that the questions can be
answered by interacting with the LO. It is
better to avoid questions based purely on
recall.
Questionnaire for users to test their
understanding
33
34
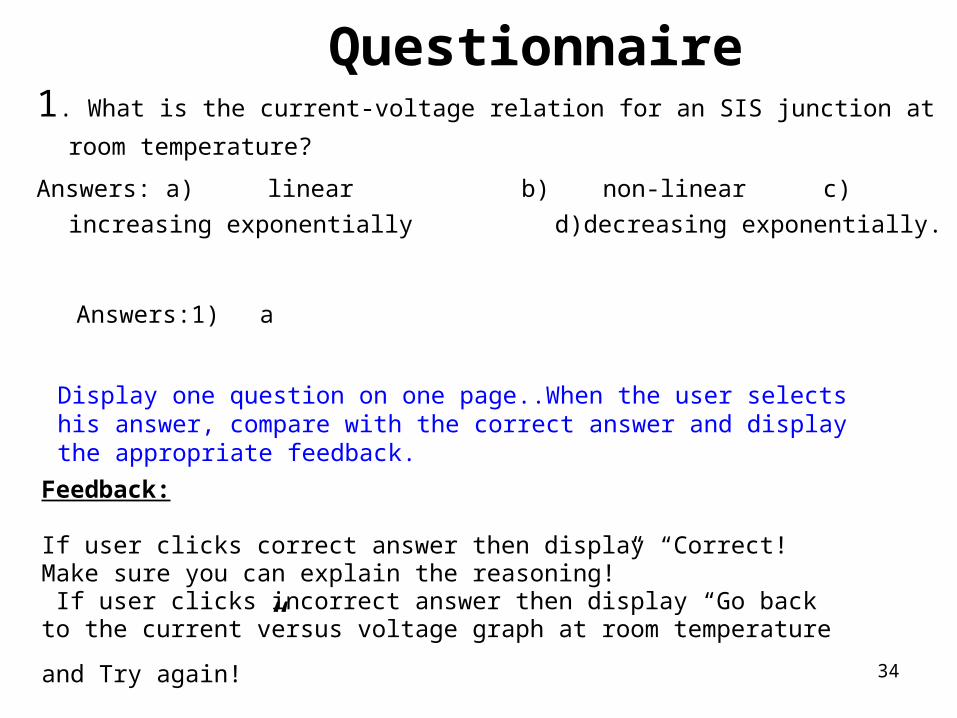
Questionnaire1. What is the current-voltage relation for an SIS junction at room
temperature?
Answers: a) linear b) non-linear c) increasing
exponentially d)decreasing exponentially.
Answers:1)a
Feedback:
If user clicks correct answer then display “Correct! Make sure you can explain the reasoning!” If user clicks incorrect answer then display “Go back to the current versus voltage graph at room temperature and Try
again!”
Display one question on one page..When the user selects his answer, compare with the correct answer and display the appropriate feedback.
35
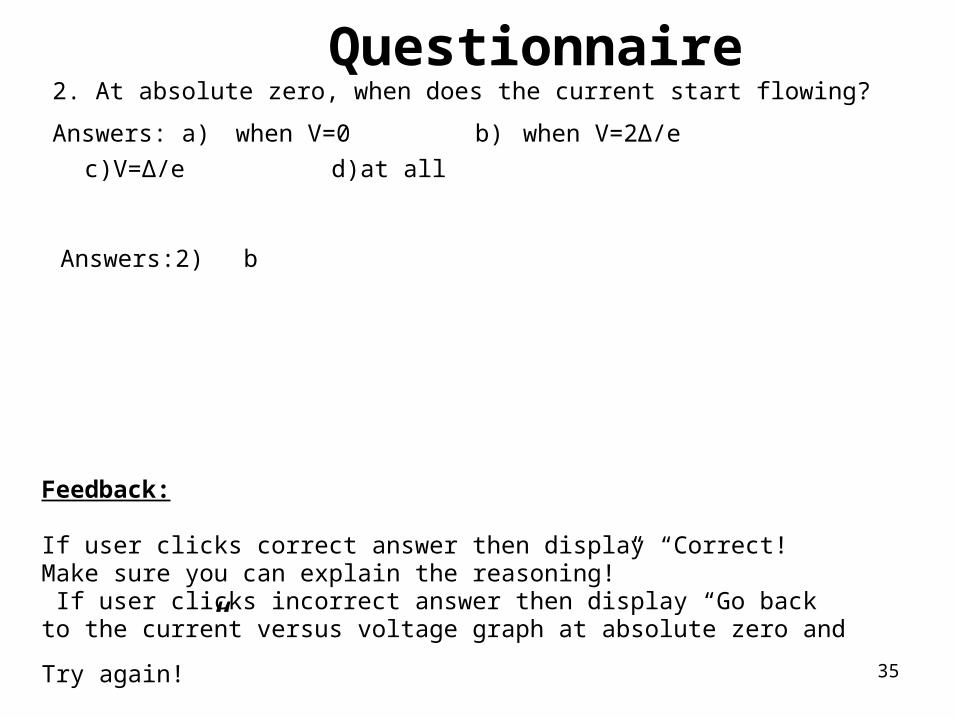
Questionnaire2. At absolute zero, when does the current start flowing?
Answers: a) when V=0 b) when V=2∆/e c)V=∆/e
d)at all applied voltages.
Answers:2)b
Feedback:
If user clicks correct answer then display “Correct! Make sure you can explain the reasoning!” If user clicks incorrect answer then display “Go back to the
current versus voltage graph at absolute zero and Try again!”
36
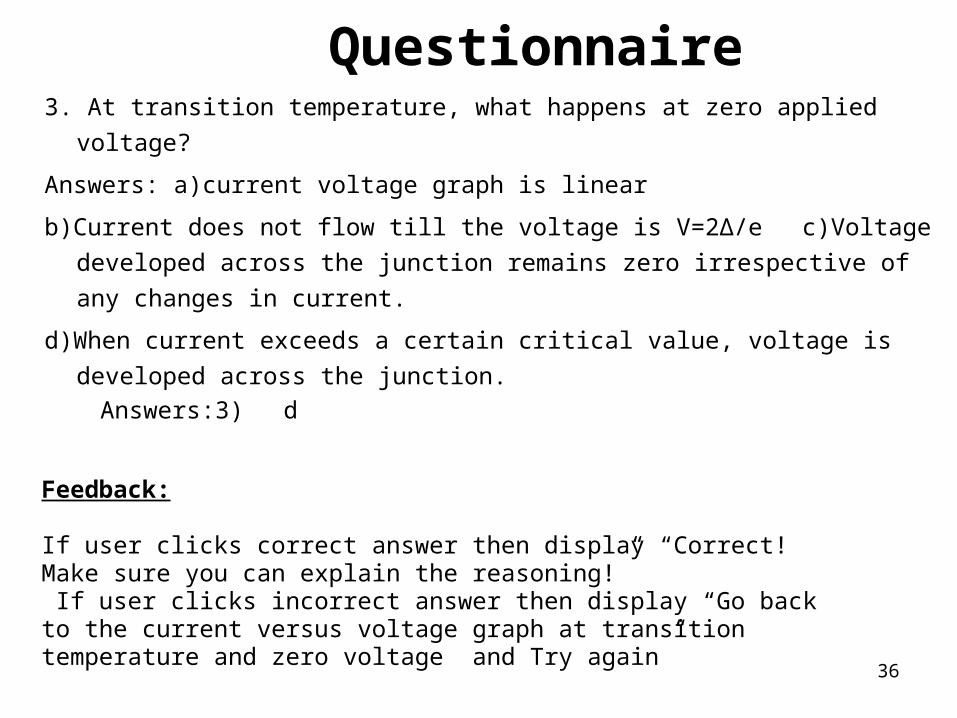
Questionnaire3. At transition temperature, what happens at zero applied voltage?
Answers: a)current voltage graph is linear
b)Current does not flow till the voltage is V=2∆/e c)Voltage developed
across the junction remains zero irrespective of any changes in current.
d)When current exceeds a certain critical value, voltage is developed
across the junction.
Answers:3)d
Feedback:
If user clicks correct answer then display “Correct! Make sure you can explain the reasoning!” If user clicks incorrect answer then display “Go back to the current versus voltage graph at transition temperature and zero voltage and Try again”
37
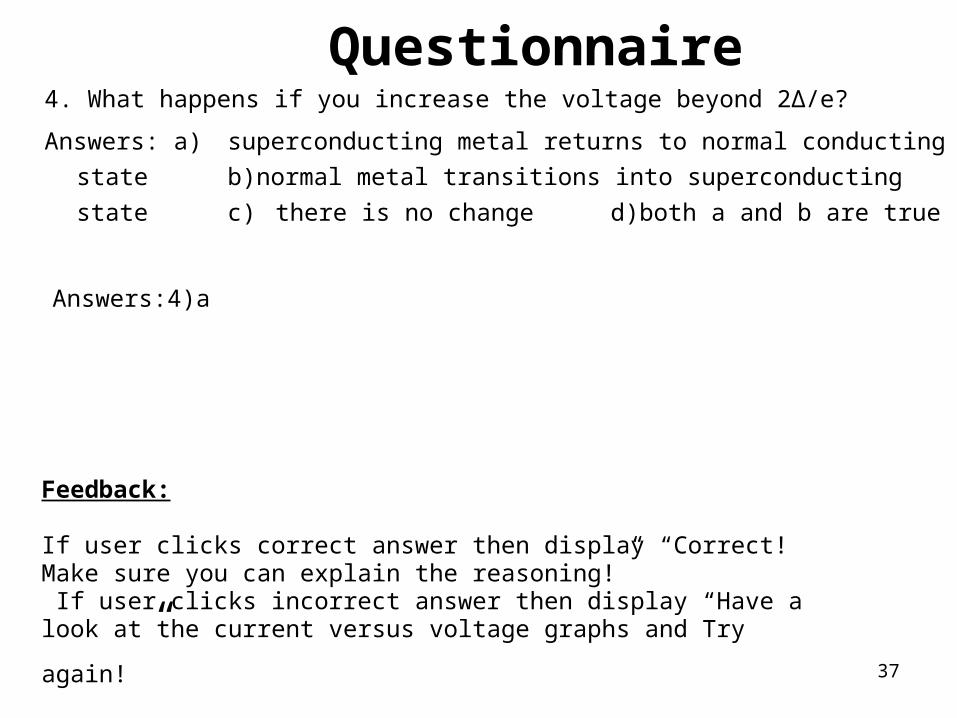
Questionnaire4. What happens if you increase the voltage beyond 2∆/e?
Answers: a) superconducting metal returns to normal conducting state
b)normal metal transitions into superconducting state c)
there is no change d)both a and b are true
Answers:4)a
Feedback:
If user clicks correct answer then display “Correct! Make sure you can explain the reasoning!” If user clicks incorrect answer then display “Have a look at the
current versus voltage graphs and Try again!”
38
Questionnaire5.What is the energy band gap value of lead?
a)2.7mV b)2.5mV c)1.35mV d)1.7mV
Answers:5)c
Feedback:
If user clicks correct answer then display “Correct! Make sure you can explain the reasoning!” If user clicks incorrect answer then display “Have a look at the
current versus voltage graphs and Try again!”
39
Questionnaire6)What is the difference between SIN junction and SIS junction?
a)In SIS junction current flows when V=0 where as in SIN junction, no
current flows at V=0
b)In SIN junction, the energy required for current to flow at absolute zero is
∆/e where as for SIS junction it is 2∆/e
c)For SIN junction, an insulator is sandwiched between a normal metal and a
superconductor where as for an SIS junction, an insulator is sandwiched
between 2 superconductors.
d)All of the above
Answers:6)d
Feedback:
If user clicks correct answer then display “Correct! Make sure you can explain the reasoning!” If user clicks incorrect answer then display “Have a look at this simulation as well as the simulation on Josephson tunneling-SIN
junction and Try again!”
Links for further reading
Books:1)Introduction to Solid state physics-Charles
Kittel(chapter 12)
2)Solid state physics-MA Wahab.(chapter 17)
3)Solid state physics-Ashcroft/Mermin. (Chapter 34)
40
INSTRUCTIONS SLIDE
• Please provide points to remember to
understand the concept/ key terms of the
animation
• The summary will help the user in the quick
review of the concept.
Summary
41
Summary• When T>Tc, both metals are normal. hence, the current-voltage relation
of the tunnelling junction is ohmic with the current directly proportional to the applied voltage.
• When T=Tc and the applied voltage is zero, if current is allowed to flow through the junction by means of a current source, a voltage develops across the junction when the current exceeds a certain value called the critical current.
• When T=Tc, both the metals becomes superconducting, due to which the current-voltage characteristic changes from the straight line to a non-linear curve.
• When T=0,no current can flow until the applied voltage is V= 2∆/e.• The gap 2∆/e corresponds to the break up of a pair of electrons in both
the superconductors, with the formation of two electrons in the normal state. The current starts when V=2∆/e.
42