Document (Text) Visualization Mao Lin Huang. Paper Outline Introduction Visualizing text...
27
Document (Text) Visualization Mao Lin Huang
-
Upload
annice-moody -
Category
Documents
-
view
228 -
download
0
Transcript of Document (Text) Visualization Mao Lin Huang. Paper Outline Introduction Visualizing text...
Document (Text) Visualization
Mao Lin Huang
Paper Outline
Introduction Visualizing text Visualization transformations: from text to
pictures Examples from the MVAB Project Conclusions and directions for future
research and development
Introduction
Current Visualization approaches– For visualizing mostly structured and/or hierarchical
information Some research in information retrieval
– Utilized graph theory or figural display– Information returned is documents in text form
Users still have to read Causes a severe upper limit
Open Source digital information– Available text overwhelms the traditional reading methods
of inspection, sift and synthesis
Visualizing text
True text visualizations– Must represent textual content and meaning without the
user having to read it– Result from content abstraction and spatialization of the text
document
Use primarily preattentive, parallel processing powers of visual perception
Goal is to spatially transform text information into a new visual representation
Visualization transformations: from text to pictures
Four important technical considerations – Clear definition of text
what comprises text how it can be distinguished from other symbolic
representations
– Way to transform raw text into a different visual form– Foundation for meaningful visualization
Suitable mathematical procedures and analytical measures
– A database management system
Processing Text
Requirements of text processing engine– Identification and extraction of text features
Frequency-based measures on words Higher order statistics taken on the words Semantic in nature
– Efficient and flexible representation of documents in terms of these text features
– Support for information retrieval and visualization Pre-process, indexing
Visualizing output from text processing
Representing the document– a vector in high dimensional feature space
Comparisons, filters, and transformations can be applied
Clustering using the normalized document vectors Projection
– Principal Components Analysis– Multi-Dimensional Scaling– Exponential order of complexity
Clustering in the high-dimensional feature space Visualize the cluster centroids
Managing the representation
Two basic classes of data– Raw text files
Static in nature, Simple in structure Easy to manage
– Visual forms of the text Extensive and dynamic
Object-Oriented Database– Flexibility of data representation– Power of inheritance– Ease of data access
Interface design for text visualization
Backdrop– Central display resource
Workshop– Grid having resizable windows to hold multiple
views Chronicle
– Area where views are placed and linked to form a visual story
Examplesfrom the MVAB Project
MVAB– Multidimensional Visualization and Advanced Browsing
Project– Visualization and analysis of textual information– Showcased in SPIRE
SPIRE– Spatial Paradigm for Information Retrieval and Exploration
Starfields and Topographical maps metaphors– Galaxies and Themescapes
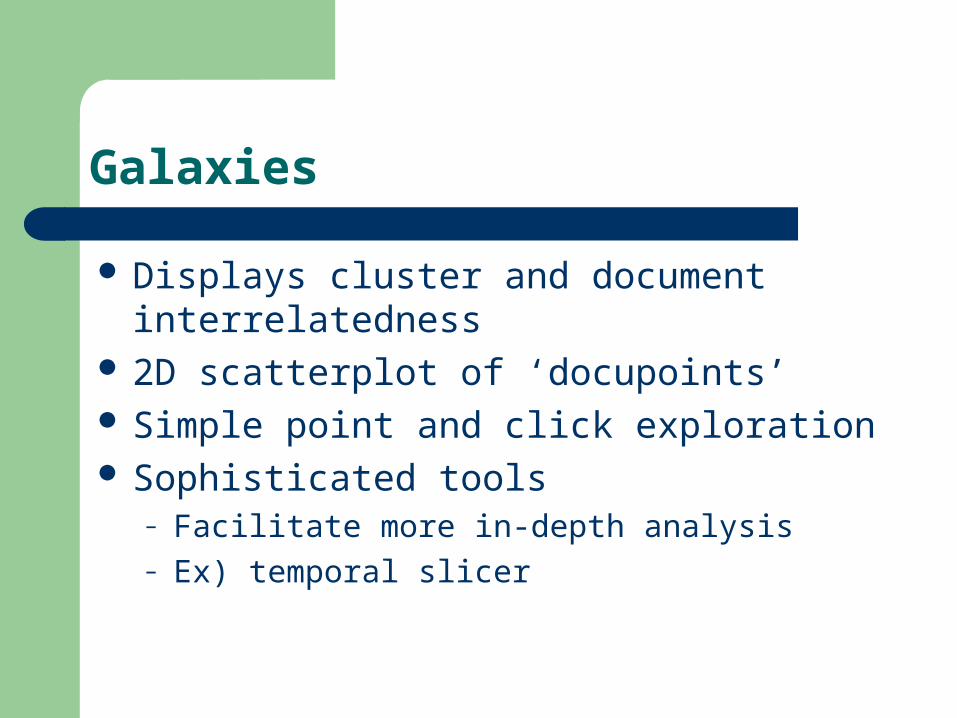
Galaxies
Displays cluster and document interrelatedness
2D scatterplot of ‘docupoints’ Simple point and click exploration Sophisticated tools
– Facilitate more in-depth analysis– Ex) temporal slicer
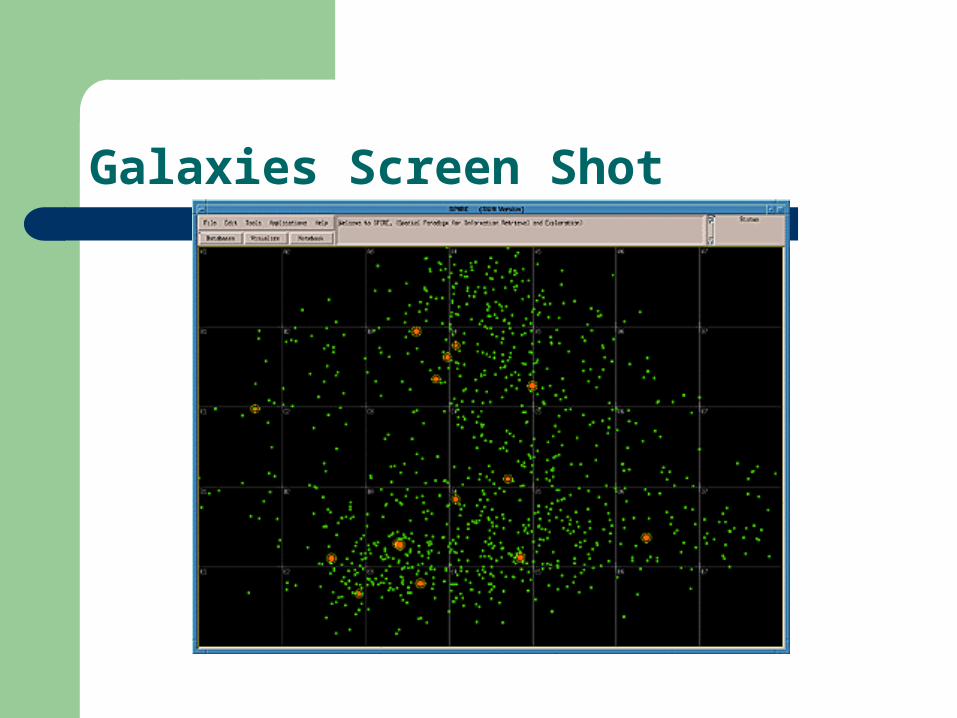
Galaxies Screen Shot
ThemeScapes
Abstract, 3D landscapes of information Convey relevant information about topic or
themes without the cognitive load Spatial relationships reveal the intricate
interconnection of thems
ThemScapes - Advantages
Displays much of the complex content of the document database
Utilizes innate human abilities for pattern recognition and spatial reasoning
Communicative invariance across levels of textual scale
Promote analysis
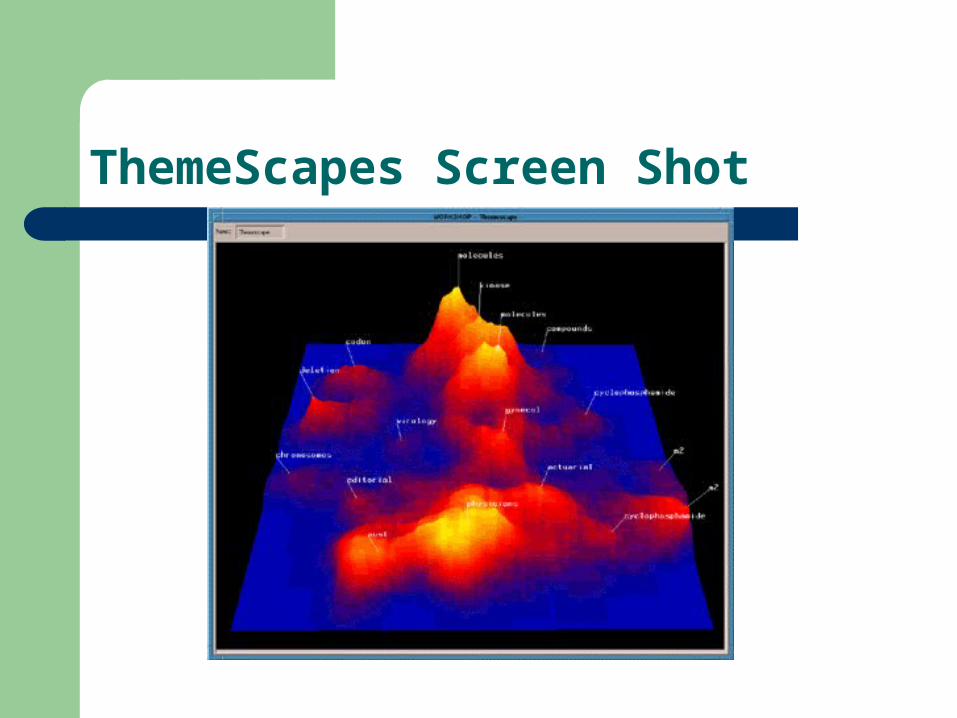
ThemeScapes Screen Shot
Conclusions
Text visualizations can overcome much of the user limitations
– Enhanced insight and time savings (35 mins vs 2 weeks)– Creative with the tool
Querying and analytical manipulation come together in a single visualization
– Permits a different kinds of querying Text visualizations will have to access and utilize the
cognitive and visual processes
Directions for Future R & D
Visual Data Analysis Elaborate the visual metaphors Addition of sensory modalities
– Virtual interaction
My Favorite Sentence
The bottleneck in the human processing and understanding of information in large amounts of text can be overcome if the text is specialized in a manner that takes advantage of common powers of perception.
Contributions
Explorations of new visualizations Discussion of the process for mapping Raw
Data Document collections into visualizations
Notes on the Reference
Designing Interaction: Psychology at the Human Computer Interaction
Interfaces Issues and Interaction Strategies for Information Retrieval Systems
Clustering and Dimensionality Reduction in SPIRE
Critique – Strengths and Weaknesses
Strengths– Provide natural visual metaphors– Enable the users to see the relationships between
documents with minimal required reading
Weaknesses– No validation of some conclusions
What has happened to this topic?
1996 R&D 100 Award OCSB
– On-line Citation Searching and Browsing in UMD
"ThemeScape" is now a trademarked term of Cartia, Inc.
WebThemeTM – an interactive tool that provides a visual display of the
common themes in collections of web-based documents
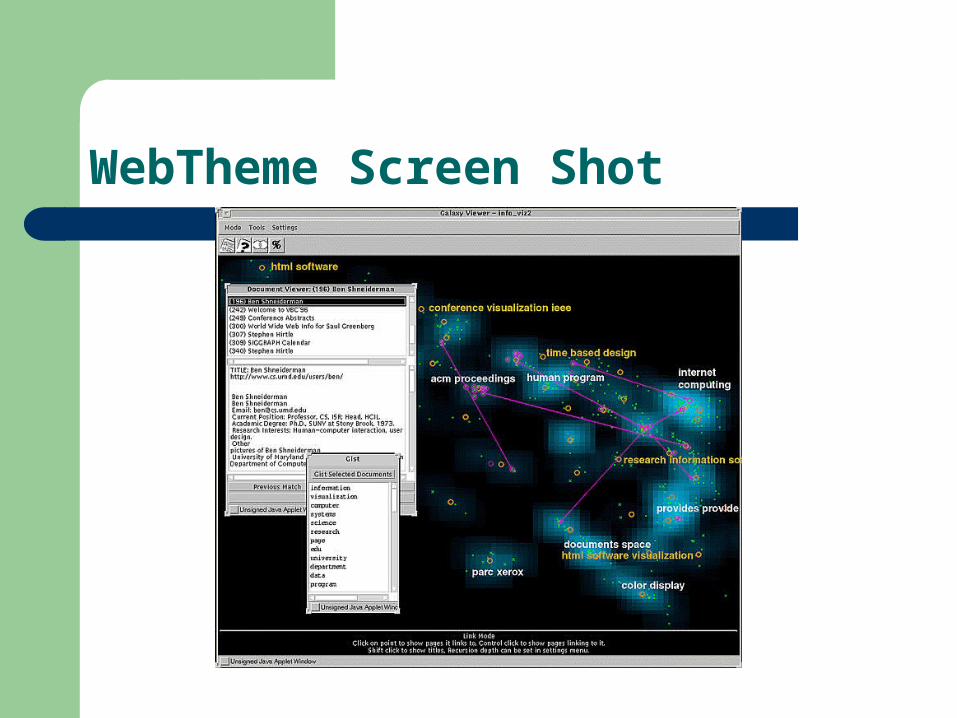
WebTheme Screen Shot
Document Lens
Why: -Text too small to read but yet needed to perceive patterns. - Perspective wall wastes corner areas of screen
What: General visualization technique based on a common strategy for understanding paper documents when their structure is not known.
How: 3D Visualization Tool For Large Rectangular Presentations

Document Lens Features
Lens – rectangular – interested in text that is mostly rectangular
Sides are elastic and pull the surrounding parts towards the lens creating a pyramid
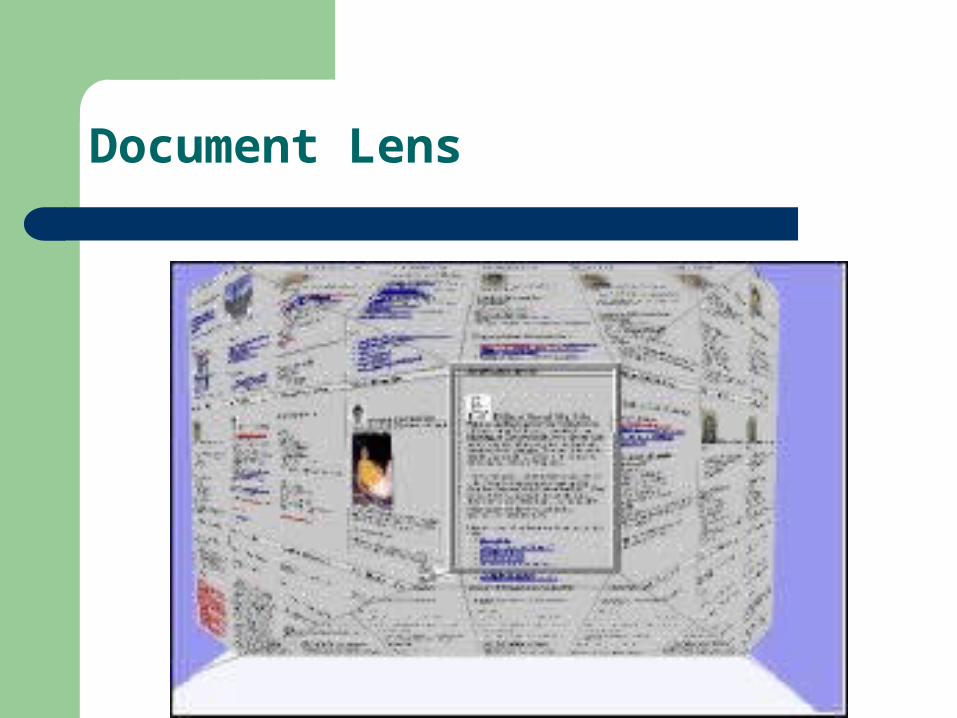
Document Lens

Document Lens