
DOCUMENT RESUME TM 840 567 - ERIC · Test Scores and a Comparison of Scoring Methods for...
42
ED 248 264 AUTHOR TITLE INSTITUTION SPONS AGENCY REPORT NO PUB DATE CONTRACT NOTE PUB TYPE EDRS PRICE DESCRIPTORS DOCUMENT RESUME TM 840 567 Suhadolnik, Debra; Weiss, David J. Effect of Examinee Certainty on Probabilistic Test Scores and a Comparison of Scoring Methods for Probabilistic Responses. Minnesota Univ., Mirneapllis. Dept. of Psychology. Offic Naval Research, Arlington, Va. Personnel and Tr.. ing Research Programs Office. ONR/RR-8303 Jul 83 N00014-79-C-0172 42p. Reports Research/Technical (143) MF01/PCO2 Plus Postage. *Confidence Testing; *Multiple Choice Tests; *Probability; Response Style (Tests); *Scoring; Scoring Formulas; Secondary Education; Test Format; Testing Problems; Test Validity ABSTRACT The present study was an attempt to alleviate some of the difficulties inherent in multiple-choice items by having examinees respond to multiple-choice items in a probabilistic manner. Using this format, examinees are able to respond to each alternative and to provide indications of any partial knowledge they may possess concerning the item. The items used in this study were 3C multiple-:;hoice analogy items.. Examinees were asked to distribute: 100 points among the four alternatives for each item according to how confident they were that each alternative was the correct answer. Each item was scdred using five different scoring formulas. Three of these scoring formulas were reproducing scoring systems. Results from this study showed a small effect of certainty on the probabilistic scores in terms of the validity of the scores but no effect at all on the factor structure or internal consistency of the scores. Once the offeet of certainty on the probabilistic scores had been ruled out, the five scoring formulas were compared in terms of validity, reliability, and factor structure. There were no differences in the validity of the scores from the different methods. (Author/BW) *********************************************************************** Reproductions supplied by EDRS are the best that can be made from the original document. ***********************************************************************
Transcript of DOCUMENT RESUME TM 840 567 - ERIC · Test Scores and a Comparison of Scoring Methods for...
ED 248 264
AUTHORTITLE
INSTITUTIONSPONS AGENCY
REPORT NOPUB DATECONTRACTNOTEPUB TYPE
EDRS PRICEDESCRIPTORS
DOCUMENT RESUME
TM 840 567
Suhadolnik, Debra; Weiss, David J.Effect of Examinee Certainty on Probabilistic TestScores and a Comparison of Scoring Methods forProbabilistic Responses.Minnesota Univ., Mirneapllis. Dept. of Psychology.Offic Naval Research, Arlington, Va. Personneland Tr.. ing Research Programs Office.ONR/RR-8303Jul 83N00014-79-C-017242p.Reports Research/Technical (143)
MF01/PCO2 Plus Postage.*Confidence Testing; *Multiple Choice Tests;*Probability; Response Style (Tests); *Scoring;Scoring Formulas; Secondary Education; Test Format;Testing Problems; Test Validity
ABSTRACTThe present study was an attempt to alleviate some of
the difficulties inherent in multiple-choice items by havingexaminees respond to multiple-choice items in a probabilistic manner.Using this format, examinees are able to respond to each alternativeand to provide indications of any partial knowledge they may possessconcerning the item. The items used in this study were 3Cmultiple-:;hoice analogy items.. Examinees were asked to distribute: 100points among the four alternatives for each item according to howconfident they were that each alternative was the correct answer.Each item was scdred using five different scoring formulas. Three ofthese scoring formulas were reproducing scoring systems. Results fromthis study showed a small effect of certainty on the probabilisticscores in terms of the validity of the scores but no effect at all onthe factor structure or internal consistency of the scores. Once theoffeet of certainty on the probabilistic scores had been ruled out,the five scoring formulas were compared in terms of validity,reliability, and factor structure. There were no differences in thevalidity of the scores from the different methods. (Author/BW)
***********************************************************************Reproductions supplied by EDRS are the best that can be made
from the original document.***********************************************************************

Effect of Examinee Certainty on Probabilistic
Test Scores and a Comparison of Scoring
Methods for Probabilistic Responses
Debra Suhadokilk
David J. Weiss
U... DEPARTMENT OF EDUCATIONNATIONAL INSTITUTE OF EDUCATION
'EDUCATIONAL RESOURCES INFORMATIONCENTER (ERIC:
X This eutainient has beery reproduced asMCP- from the person or organstatiOnoriginating itMinor changes have been made to improvereproduction quality
Points 4 vew or °bantam stated in this documem do not neCeSSanly represent official NIE
position or policy
RESEARCH REPORT 85-3
JULY 1983
COMPUTERIZED ADAPTIVE TESTING LABORATORY
EPARTMENT OF PSYCHOLOGY
UNIVERSITY OF MINNESOTA
MINNEAPOLIS, MN 5545
This research was supported by funds
Air Force Office of Scientific Research, Air Force Human
Laboratory, Army Research Institute, and Office of Navaland monitored by the Office of Nval
from theResourcesResearch.Research
Approved for public release; distribution unlimited.
Reproduction in whole or in part is permitted for
'any puxoose of the United States Government
2

UnclassifiedSEC u',,$TY CL ASS' c1C ATION OF THIS PAGE (When Vote Entered)
REPORT DOCUMENTATION PAGEREAD INSTRUCTIONS
BEFORE COMPLETING FORMI REPORT NUMBER
Research Report 83-3
2. GOVT ACCESSION NO. 3 RECiPIENT'c CATALOG NUMBER
4 rerLEomds,thda.o
Effect of Examinee Certainty on ProbabilisticTest Scores and a Comparison of Scoring Methodsfor Probabilistic Responses
S. TYPE. OF REPORT 6 PERIOD COVERED
Technical Report
6 PERFORMING ORG REPORT NUMBER
7 AuTHOR (a)
Debra Suhadolnik and David -J. Weiss
8. CONTRACT OR GRANT NUMBER(s)
N00014-79-C-0172
9 PERFORMING ORGANIZATION NAME ANO ADDRESS
Department of PsychologyUniversity of Minnesota_!!linneanolis Minnesota 4'5.455
IQ. PROGRAM ELEMEN I% PROJECT, TASKAREA A WORK UNIT NUMBERS
P.E.:61153N Proj.:RR042-04T.A. RR042-04-01w n m14150-4-13
12. REPORT DATE
July 1983it CONTROLLINL, CFFICE NAME AND ADDRESS
Personnel and Training ReseaLa Programs°Mee of Naval. Research
a
13. NUMBER OF PAGES
304 mON T RiNG AGEN Y NAME 6 ADDRESS(tt different front Controlling Office)
ev
15. SECURITY (-LASS of chie report)
15a, OECLASSIFIC Al 'OW DOWNGRADINGSCHEDULE
16 DiSTRIBU IC.F'/PAENT (of this, Report)
Approved for public release; distribution unlimited. Reproduction inwhole or in part is permitted for any purpose of the United StatesGovernment.
I7 DisTriteuTioN ST A TEmENT (ol the ettautimt antared in Mock 20, if different from Report)
6 SUPPLEMENTARY NOTES
'Tai research was supperted by 'funds from the Air Force Office of ScientificResearch, The Air Force Human Resources Laboratory, the Army ResearchInstitute, and the Office of Naval Research, and monitored by the (1;1 iceof Naval Research.
19 KEY *OROS (Continue on reverse side If neceesery and identity liy block number)
Response formats Reproducing scoring systems
Test Item response formats Confidence-weighting procedures
Probabilistic responses Response style variables in probabilistic
Subjective probabilities responsesScorinp mPthpja 1.4.1r_43aQ4a41.1.L0
20 ABSTRACT (Continue on reverse aide if necessary and identify by block manatee)
The present study was an attempt to alleviate some of the difficulsinherent in multiple-choice items by having examinees respond to mu;tiple-
choice items in a probabii:Itic manner. Using this format, examner.s are able
to respond to each alternative and to provide indications of any --)artial
knowledg,:. they may possess gmncerning the item. The items used in tbis ,11dy
were 30 multiple-choice analogy items. Examinees were asked to distr:L.Le 100
points among the four alternatives for each item according to how confident
DD I FJ OANRI473 1473 EDITION OF 1 NOV 45 IS OBSOLETEft*/ 0102-LF-014-6601 Unclassified
SECURITY CLASSIFICATION OF THIS PAGE (WAN, Dos Entered)

UnclassifiedSECURITY CLASSIFICATION OF T$*$ PACE (When Data En WIND
they were that each alternative was the'correct answer. Each item was scored
using five different scoring formulas. Three of these scoring formulasthe
spherical, quadratic, and truncated lag scoring methods--were reproducing
scoring systems; The fodrth scoring method used the probability assigned to
the correct alternative as the item sco i, and the fifth used a function of
Ithe absolute difference between the co ect response vector for the four
alternatives and the actual points assigned to each alternative as the item
score. Total test scores for all of the scoring methods were obtained by
summing individual item scores.
Several studies using probabilistic response methods have shown the effect of
a responsestyle variable, called certainty or risk taking, on scores obtained
from probabilistic responses. Results from this study showed a small effect
of certainty tal the probabilistic scores in terms of the validity of the
scores but no effect at all on the factor structure or internal consistency of
the scores. Once the effect of certainty on the probabilistic scores had been
ruled out, the five scoring formulas were compared in terms of validity,
reliability, and factor structure. There were no differences in the validity
of the scores from the different methods, but scores obtained from the two
scoring formulas that were not reproducing scoring systems were more reliable
and had stronger first factors then the scores obtained using the reproducing
scoring systems. For practical use, however, the reproducing scoring systems
may have an advantage because they maximize examinees' scores when examinees
respond honestly, while honest responses will not necessarily maximize an
examinee's score with the other two methods. If a reprbducing scoring system
is used for this reason, the spherical scoring formula is recommended, since
it was the most internally consistent and showed the strongest first factor of
the reproducing scoring systems.
Unclassified
SECURITY CLASSIFICATION OF THIS PAGE(When Data Etitorad,)

Contents
IntroductionItem Weighting Formulas
1
Variations of the Response Format of MultipleChoice Items 2
Use of Subjective Probabilities with Multiple-Choice Items 4
Extraneous Influences on the Use of Subjective Probabilities with
MultipleChoice Items7
Use of Alternate Item Types9
Purpose10
Method10
Test Items10
Test Administration.10
Item Scoring11
Determining the Effect of Certainty 12
Evaluative Criteria14
Results14
Score Intercorrelations14
Validity and Reliability14
Factor Analyisis of Probabilistic Scores. 18
Discussion and Conclusions18
-The Influence of Certainty18
Choice Among Scoring Methods21
Conclusions22
References23
Appendix: Supplementary Tables a26

Technical Editor: Barbara Leslie Camm
EFFECT OF EXAMINEE CERTAINTY ON PROBABILISTIC TEST SCORES
AND A COMPARISON OF SCORLNG METHODS FOR PROBABILISTIC RESPONSES
Psychometricians have searched for many years for a test item format that
would allow them to measure individual differences on a variable of interest as
accurately and as completely as possible. The multiple-choice item has proven
to be a useful tool for assessing kowledge, but there are several problems with
this item forma. These problems include the possibility of an examinee guess-
ing the correct answer, the lack of information concerning the process used by
an examinee to obtain a given answer, and, in general, an inability to accurate-
ly determine an examinee's level on a continuous underlying trait. based on an
observable dichotomous response.
In attempts to remedy these, problems and'to extract the maximum amount of
informal; ion from an individual's responses'to a set of test items, Lord and No-
vir. (1968, Chap. 14) have identified thre0 important components of interest.
TN-! components are1. The measurement procedure, or the manner in which examinees Are in-
structed to respond to the items.
2. The item scoring formula.3. The method of weighting each item to form a total score.
In their attempts to find alternatives to the conventional multiple-choice item
where the examinee is instructed to choose the one best answer to an item from a"
number of alternatives, investigators have generally focused on one or two of
these components at a time.
The various attempts to improve upon the traditional multiple- "hoice item
can be classified into three broad categories: (1) attempts to improve the mul-
tiple-choice item by using an item-weighting formula other than the conventional
unit-weighting scheme, (2) variations of the multiple-choice item that attempt
to provide more information about an examinee's ability level by asking the ex-
aminee to respond to a traditional multiple-choice item in a manner other than
simply choosing the one best alternative, and (3) the use of item types which
are completely different from the conventional multiple - choice item, such as
free-response items. The first category focuses on the third component enumer-
ated by Lord and Novick, the item-weighting formula. The second category fo-
cuses on Lord and Novick'a first two components--the measurement procedure and
item-scoring formulas -- -while continuing to use a unit-weighting scheme to com-
bine item scores into a total score. The third category focuses primarily on
the measurement procedure and, to a lesser extent, on item scoring formulas.
Item- Weightinj Formulas
For many years the accepted method of combining item scores ti, form a test
score was simply to sum all of the individual item scores. Since this procedure
is equivalent to multiplying each item score by an item weight of 1 and then
summing the weighted item scores, the'method has been called unit weighting. in
attempts to increase the validity and/or the reliability of test scores obtained
by summing item scores, many researchers have abandoned unit weighting in favor
of various forms of differential weighting of individual items. These methods

1/4'
of differential weighting of items include multiple regression techniques (Wes-
man & Bennett, 1959), using the validity coefficient of the item as the item .
weight (Guilford, 1941), weighting items by the reciprocal of the item standard
deviation (Terwilliger & Anderson, 1969), a priori item weights (Burt, 1950),
and numerous other weighting procedures (Bentler, 1968; Dunnette & Hogatti 1957;
Hendrickson, 1970; Horst, 1936; Wilks, 1938).
In reviewing the substantial literature in this area, Wang and Stanley
(1970, p. 664) have concluded that "although differential weighting theoretical-
ly promises to provide substantial gains in predictive or, construct validity, in
practice these gains are often so slight that they do not seem to justify the
labor involved in deriving the weights and scoring with them. This is especial-
ly true when the component measures are test items ...." Gulliksen (1950) con-
cluded, in concurrence with Wang and Stanley (1970), that differential weighting
is not worthwhile when a test contains more than approximately 10 items-and when
the items are highly correlated. Stanley and Wang (1970), after concluding that
differential item weighting is not a fruitful vehture for test items, have sug-
gested that the item score be determined by the response made to an item, where
the examinee is required to do more than just select the correct alternative for
an item. By changing the mode of response and devising item scoring formulas
appropriate for these types of responses, the validity and/or reliability of
test scores might be increased. An additional gain might be more insight into
the process involved in responding to test items.
Variations of the Response Format of Multiple-Choice Items
Several of the earliest attempts at modification of the method of respond-
tog to a conventional multiple-choice item were reported by Dressel and Schmid
(1953) in an investigation of various item types and scoring formulas. A con-
ventional multiple- choice teat and one of four "experimental test forms" were
administered to each subjef.t. The items in each of the experimental test formsresembled conventional multiple-choice items in that an item stem and several
alternatives were provided, but each experimental test form differed from the
conventional multiple - choice format in the following ways:
1. Free-choice format. Examinees were instructed to choose as many of thealternatives provided as necessary to insure that they had chosen the
correct alternative. This Iteo format was scored sing Equation 1,which yields integer scores that range from -4 to 4 and applies only to
five-alternative items:
Item score = 4C - I 11 1
where C number of correctly marked alternatives andI == number of incorrectly marked alternatives.
2. Degree-of-cc:Lainty test. Examinees were instructed to choose the one
best answer for an item and then to choose one of four confidence rat-
ings provided to indicate the degree of confidence they had in the an-
swer they had chosen. This item format was scored as shown in Table 1.
3. Multiple-answer format. Each item contained more than one ccrrect al-
ternative, and the examinees were instructed to choose all of L%e cor-
rect alternatives. The score for this format was the humber of correctalternatives chosen minus a correction factor for any incorrect alter-
natives chosen.

v.
Table 1Scoring System for Degree-of-Certainty Test
Confidence Eating
AOMPOINwo
Item ScoreCorrect InairrectAnswer Answer-
Chosen Chosen
Positive 4 .-44
Fairly certain' 3 -3
Rational guess 2 -2
No defensible basis for choice 1 -1
4. Two-answer format. .EAch item contained exactly two correct alter.na-.tivep, and the examinees were instructed to.indicate both of the cor-
rect alternatives. The item score was simply the number of correct
alternatives chosen.
In comparing these five test forms (the conventional multiple-choice format
and the four experimental test formats),'Dressel and Schmid's (1953) results
showed that the experimental test formats containing more than one correct al-
ternative (Formats 3 and 4'above) exhibited greater internal consistency reli-
ability than the other three test forms, but these test formats also took longer
to administer thanall of the other formats. All of the experimental test for-
mats had higher internal-consistency reliability than the conventional multiple-
choice test except for the free-choice format,.but the conventional multiple-
choice format took less time than any of the experimental test formats. Al-
though the higher reliability coefficients of several of these formats ptnormats
2, 3, and 4) might suggest that these formats aid in introducing more ability
variance. than error variance, the authors warn that the results must be viewed
with caution,osince there were statistically significant differences between the
groups taking each experimental fori on the standard multiple - choice test that
was administered to all of their eubjects; thus; the differences attributed to
the effect of test format might be due to systematic ability differences in the
groups taking each of the experimental test formats.
Hopkins, Hakstian, and Hopkins (1973) used'a confidence weighting procedure
similar to the degree-of-certainty test used by Dressel and Schmid (1953) and
reported higher split-half reliability coefficients for the confidence weighting
format than for a conventional multiple-choice test using the same items. Hop-.
kins et al. (1973) also reported validity coefficients that were correlations
between the test scores and a short-answer form c'f the same test. The validity
coefficient for the conventional test (.70) was higher but not significantly
different from that of the confidence weighting .format (.67).
Coombs (1953) felt that examinees could provide more information about the
degree of knowledge they possessed by eliminating the alternatives which they
felt were incorrect, rather than by choosing the one correct alternative. Items
using this format were'scored by assigning one point for each incorrect alterna-
tive eliminated and 1 - K points when the correct alternative was eliminated,
where K is the number of alternatives provided. This scoring system yields a
9.
7

- 4*ft
range of integer item scores from -3 to 3 for a four-alternative multiple-choice
item.
In comparing tftis test format with'a conventional multiple-choice test,
Coombs, Milholland and Womer (1956) found no differences in validity between the
two formats for separate tests of vocabulary, spatial visualization, anddriver
information. The validity coefficients used were correlations between test
scores and criteria such as Stanford-Binet IQ, another test of spatial ability,
and subtest scores from the Differential Aptitude Test. For- these same content
areas, the exi6rimental teat format yielded higher reliability estimates thanthe conventional test, but the differences between the estimates were not sta-
tistically significant for any of the content areas. One result favor of the
experimental teat format was that the .subjects in the experiment felt the exper-
imental format to be fairer than the conventional format.
Another variation upon the conventional multiple-choice item includes a
self-scoring method advocated by Gilman and Ferry (1972), which requires examin-
ees to choose among alternatives provided until the correct alternativeis cho-
sen. Feedback is given after each-choice is made. The item score is simply the
number of responses needed to choose the correct alternative; thus, a. higher
score indicates. less knowledge about an item. .Kane and Moloneyf(1974) have
warned that although Gilman and Ferry (1972) found an increase in split-half
reliability using this technique, the effect of using this method on the reli-
ability of the test depends upon the ability of the distractors to discriminate
between examinees of varying levels of ability. An increase in reliability will
result when the distractors possess this ability to discriminate among ability
levels, but no increase in reliability will occur if this is not the case.
Use of Subjective Probabilities with'Nu4iple-Choice Items
A modification of the traditional multiple-choice item that has generated
much research and interest is the use of examinees' subjective probabilitiesconcerning the degree of correctness of each alternative provided for an item as
a method of assessing the degree of knOwledge or ability possessed by the exam-
inees. By assigning a probability estimate-for each alternative to an item,
examinees can indicate degrees of partial knowledge they may have concerning
each alternative for an item.
To simplify this procedure for examinees, a number of methods have been
devised to aid examinees in assigning their subjective probabilities to the al-
ternatives. One method is to ask examinees to directly assign.probabilities
from 0 to 1.00 to each alternative, with the restriction that the probabilities
assigned to all of the alternatives for .each item sum to 1.00. Another method
instructs examinees to'distribute 100 points among the alternatives for each
item. The distributed points are then converted to probabilities for scoring
purposes by dividing the points assigned to each alternative by 100. Some in-
vestigators have used fewer points for distribution (Rippey, 1970) or symbols,,
such as a certain number of stars, which are to be distributed among the alter-
natives (deFinetti, 1965), but the concept is the same.
Using these types of measurement procedures (sometimes called probabilistic
item formats or probabilistic response formats), an item scoring formula had to

a
be devised so diet examinees' expected scores would be maximized only when they
responded according to their actual beliefs concerning the correctness of each
alternative. Item-scoring formulas which satisfy these conditions are called
repro ucing scoring.systems'(RSS). Shuford, Albert, and Massengill (1966) and
deFi tti (1965) provide examples of several RSSs. The RSSs presented by these'
twea thorn for use with multiple-choice items that have more than two alterna-tives and only one correct answer are the following:
.
1. Spherical RSS ,,
va
item score = pi(E Pk)k l
a
where pc = probability assigned to the correct alternative
pk - probability assigned to alternative k, k (,1, 2, m)
2. Quadratic RSS
Item score = 2p - E (pk2)
k=1
3. Truncated Logarithmic Scoring System
1 + log(pc), .01 < pc < 1.001Item score =
-1 , 0 < p < .01
or a.modifipation of this scoring function:
112 ,+ iog(pc) /23 , .01 < pc < 1.00
Item score = 151
( 0 , 0 < pc < .01
The truncated logarithmic scoring system is technically not an RSS, but it does
have the properties of an RSS for probabilities between .027 and .973. Accord-
ing to Shuford et al. (1966), when examinees believe that an alternative has a
probability of being the correct answer less than or equal to .027, their score
will be maximized by assigning a probability of zero to that alternative,.. Al-
ternatively, when examinees believe that an alternative has a probability great-
er than or equal to .973, their expected score will be -maximized by assigning a
probability of 1.00 to that alternative. Shuford et al. (1966) stated that "for
extreme values of (pk),'some information about the student's degree-of-belief
probabilities is lost, but from the point of view of applications, the loss in'
accuracy is insignificant" (p. 137). Note also that the truncated logarithmic
scoring function is the only one of the scoring formulas that is dependent only
upon the probability assigned to the correct alternative.
[2)
(31".
(41
Total test scores for examinees are obtained for all of the RSSs by simply
summing the individual item scores obtained using that particular scoring formurr.
la. In addition to the conditions expressed above for an RSS, deFinetti (1965)
has stated that the validity of any reproducing scoring system also rests upon
the following assUmptions:
4
t
Of
1. /The examinees are capable of assigning numerical values to
jective probabilities.2. The 94aminees are trained in using the response format and
the oring system to be used in scoring the items.3e The examinees are motivated to do their best on the items.
their sub-
understand
Rippey (1940 reported results from several studies comparing test scores
obtained using the spherical RSS and the modification of the truncated logarith-
mic scoring functions with test scores obtained by summing dichotomous (0,1)-
item scores to conventional Multiple-choice items. In general, he found in-
creases in Royt's reliability coefficient using,a probabilistic response format
with RSSs under limited conditions. The probabilistic test format produced in-
creases in test reliability with undergraduate college students but could not be
used with fourth graders and produced no consistent increases in reliability for
tests given to high school freshmen or medicAl students. There were also no
consistent tendencies for one or the otter of the scoring formulas for the prob-
abilistic response format ato produce higher reliability coefficients.
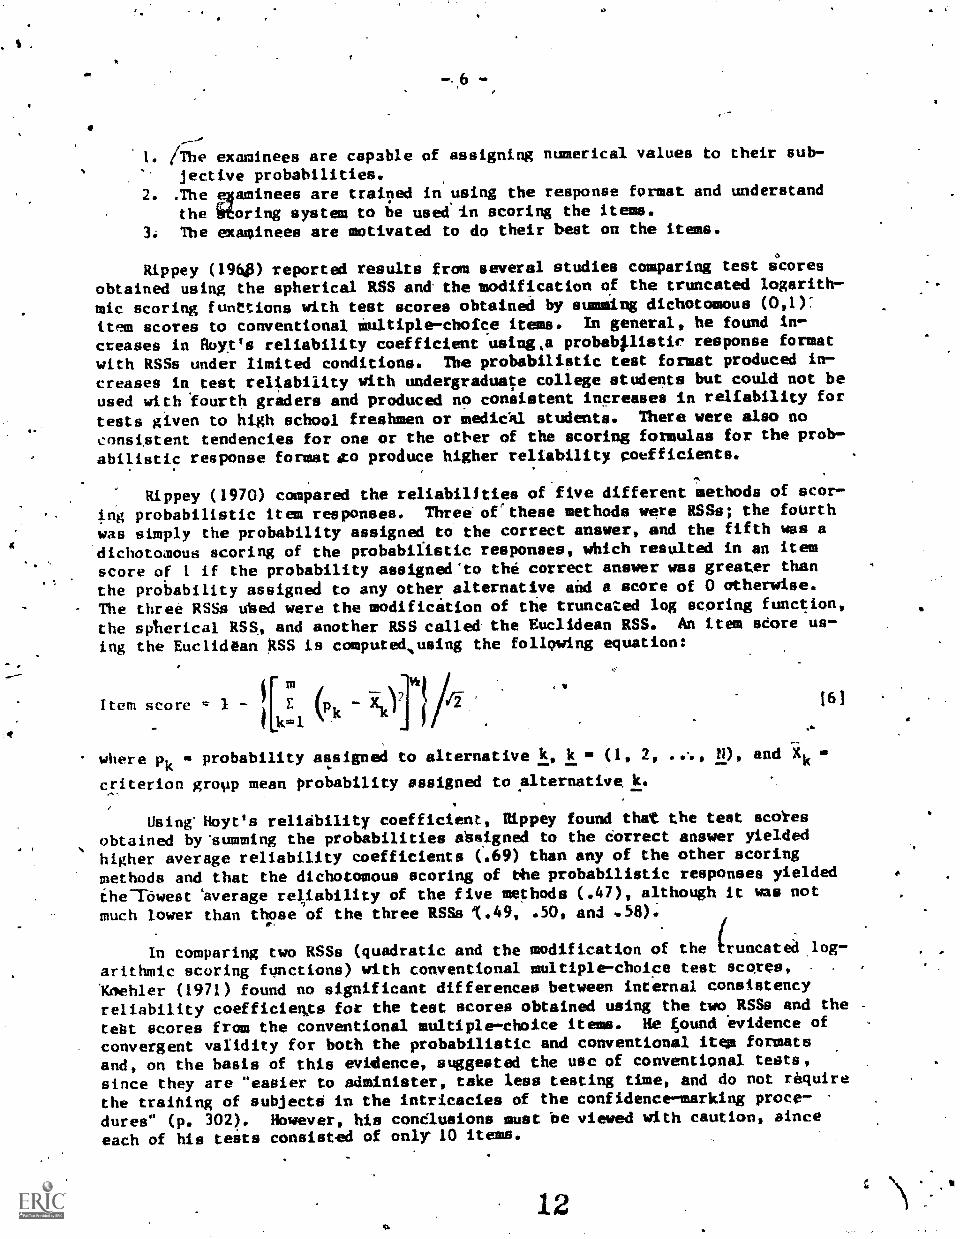
Rippey (1970) compared the reliabilities of five different methods of scor-
ing probabilistic item responses. Three ofrthese methods were RSSa; the fourth
was simply the probability assigned to the correct answer, and the fifth was a
dichotomous scoring of the probabilistic responses, which resulted in an item
score of 1 if the probability assigned'to the correct answer was greater than
the probability assigned to any other alternative and a score of 0 otherwise.
The three RSSs used were the modificition of the truncated log scoring function,
the spherical RSS, and another RSS called the Euclidean RSS. An item score us-
ing the Euclidean RSS is computed,using the following equation:
fItem score - 1[ E
f
-km1
16)
where pk - probability assigned to alternative k, k - (1, 2, *009 N), and Xk
criterion gropp mean probability assigned to alternative k.
Using'Hoyt's reliability coefficient, Rippey found that the teat scores
obtained by 'summing the probabilities assigned to the correct answer yielded
higher average reliability coefficients (.69) than any of the other scoring
methods and that the dichotomous scoring of the probabilistic responses yielded
the-rawest 'average reliability of the five methods (.47), although it was notmuch lower than those of the three RSSs 1.49, .50, and .58);
In comparing two RSSs (quadratic and the modification of the (rungated log-
arithmic scoring functions) with conventional multiple-choice test scores, .
'Koehler (1971) found no significant differences between internal consistency
reliability coefficieats for the test scores obtained using the two RSSa and the
tent scores from the conventional multiple-choice items. He found evidence of
convergent validity for both the probabilistic and conventional it formats
and, on the basis of this evidence, suggested the use of conventional tests,
since they are "easier to administer, take less testing time, And do not require
the training of subjects in the intricacies of the confidence-marking proce-
dures" (p. 302). However, his conclusions must be viewed with caution, since
each of his tests consisted of only 10 items.
12

Extraneous Influences on the Use of
SubjectiveProbabilitiesvMultile-ChoiceItems
Although Koehler's results may not be generalizable due to the small number
of items administered in each format, the use of the probabilistic item format
has been eilestioned for other reasons. Hansen (1971), Jacobs (1971), Slakter
(1967), ELnternachte Boldt, and Selina!: (1972), Koehler (1974), and Pugh and
Bruoza (1974), along with several others, have investigated the possibility that
the increase in reliability demonstrated .by probabilistic item formats is due to
the effect of a personality variable or response style variable rather than a
more decurate assessment of knowledge. This variable-has been alternately
called risk taking, certai,nty, confidence, and cautiousness. If it is the ef-
fect of this response style variable that leads to, increases in reliability for
probabilistic responding over conventional multiple-choice items, this effect
might also explain the fact that the probabilistic item format has not, in gen-
eral, led to increases in the validity of these test scores over that of test
scores obtained from conventional multiple- choice items.
Studies investigating the influence of these various personality variables
have shown n.7ed results. In studies where conventional multiple-choice item
scores an4 ;,-,babilistic item scores were obtained (Koehler, 1974; Echternacht,
Boldt, & Young, 1971), the correlations between the two types of scores
have been consistently high (.71 to .83 for the Koehler (1974) study and .89 to
.99 for the Echternacht et al. .(1971) study). This suggests that a large pro-
portion of the variation in the probabilistic test scores can be accounted for
by the conventional test scores. The question being posed, though, is whether
the variation in the probabilistic test scores -that cannot be accounted for by
the conventional test scores is reliable variance due to increased accuracy of
assessment of knowledge or due to personality or response style variables.
To determine the influence of these personality factors, Koehler (1974)
.embedded seven nonsense items in a 40-item vocabulary test and told examinees
that they were not to guess the answers to any items on the test. The nonsense
items were items with no correct alternatives. From responses to these nonsense
items oft calculated two confidence measures:
C/ proportion of nonsense items attempted under do-not-guess instructions,
and
n m2Hi 1 \
rami
[71
where m = number of alternatives,n = number of nonsense items, and
p s rrobability assigned to alternative i on item 1.
Since the nonsense items had no correct alternatives, an examinee's respon-
ses to these items were a pure measure of a response style or personality vari-
able (confidence) that was influencing that examinee's responses. Responses to
these items were not due to any knowledge the examinee possessed, since there
were no correct answers to those items. The greater the deviation of these in-
dices from 0, the higher the level of confidence exhibited by the examinee.' A
1

Koehler found that both of these confidence indices were significantly negative-ly correlated with three probabilistic test scores (spherical, quadratic. andthe modification of the truncated logarithmic scoring functions), but not sig-nificantly correlated with the number-correct scores from the same items. The
number=correct scores also yielded a higher internal consistency reliabilitycoefficient than the three probabilistic scores (.85 versus .82, .80, and .74).On the basis of these results, Koehler did not recommend the use of probabilis-tic response formats, since "it would appear that confidence respondingmethodi produce variability in scores that cannot be attributed to knowledge ofsubject matter" (p. 4).
Hansen (1971) obtained probabilistic test scoresoand scores on independentmeasures of personality factors such as risk taking-and test anxiety. Hz devel-oped a measure of certainty in responding to probabilistic response formatswhich is essentially the average absolute deviation of a response vector to anitem from a response vector assigning equal probabilities to all alternatives.Hansen's study showed that this certainty index was related to risk taking asmeasured by the Kogan and Wallach Choice Dilemmas Questionnaire and authoritari-anism as measured by a version of the F-scale, deVeloped by Christie, Havel, andSeidenberg (1958). However, the certainty index did not correlate significantlywith scores on a test anxiety questionnaire or scores on the Gough-Sanford Rig-idity Scale.
These results provide more information concerning the nature of the re-sponse style, but there are problems with Hansen's (1971) certainty index, which
he attempts to alleviate but does not. The major problem with this index is
that it is not a pure measure of certainty. This certainty measure is con-
founded by an examinee's knowledge concerning an item. Hansen attempted to par-tial out examinees' knowledge by using their test scores as a predictor in aregression equation to obtain predicted certainty scores. These predicted cer-
tainty scores were then subtracted from the observed certainty scores to obtaina certainty measure free of the influence of examinee knowledge.
Although the rationale is sound, Hansen did not accomplish what he set outto do. The test score he used as a predictor was not a pure or even relativelypure measure of knowledge. The test scores were probabilistic test scores com-puted from the spherical RSS. This scoring system results in scores that repre-
sent a confounding of certainty and knowledge. Therefore, by partialling theseprobabilistic tdbt scores from the certainty index, it is unclear exactly whatthe residual certainty index represents, since both knowledge and some,certaintyhave beet partialled out. Hansen's results were then based upon the relation-ship of various personality variables with a certainty index confounded withknowledge, and the relationship of these same personality variables with a re-sidual certainty index whose composition is somewhat ambiguous. Hansen's re-
sults might best be viewed with caution.
Pugh and Brunza (1974) conducted a study similar to that of Hansen (1971),except that they used a 24-item vocabulary test and scored it using the proba-
bility assigned to the correct answer as the item score. They also obtainedscores on an independent nonprobabilistically scored vocabulary test, and mea-
sures of risk taking, degree of external control, and cautiousness. They fol-lowed Hansen's regression procedure to obtain a certainty measure free of the
14

9
confounding effects of knowledge and were more successful than Hansen. They
used the independent vocabulary test score as a predictor of the same certaintyindex that Hansen used and then calculated a residual certainty index by sub-tracting the predicted certainty score from the observed certainty score. Since
the independent vocabulary test was a relatively pure measure of knowledge, par-tialling its effect from the observed certainty index resulted in a residualcertainty index that (1) was a measure of the certainty displayed in respondingto multiple-choice items in a probabilistic fashion and (2) was not related toknowledge possessed by examinees concerning the items.
Pugh and Brunza (1974) reported that this residual certainty measure wasnot very reliable (.32 icternal consistency reliability) and that it correlatedsignificantly with risk-taking scores obtained from the Kogan and Wallach ChoiceDilemmas Questionnaire but not with the measures of cautiousness and externalcontrol they had obtained. Although this evidence of. the influence of variablesother than knowledge on probabilistic test scores might serve as a deterrent tothe use of these scoring systems, Pugh and Brunza noted that "there is no evi-dence in either utudy [Pugh & Brunza, 1974, or Hansen, 1971] that these factorsare more operative than in traditional tests" (p., 6).
Echternacht et al. (1971) scored answer sheets of daily quizzes obtainedfrom two Air Force training courses using a truncated logarithmic scoring func-tion and number correct. They found that using the number-correct score, theshift of the trainees, and a number of personality variables such as test anxie-ty, risk taking, and rigidity as predictors of the probabilistic test scores didnot account for significantly more of the variation in the probabilistic testscores than was accounted for when using only number- correct scores and shift of
the trainees as predictors. This is evidence that the personality variables didnot operate to a greater extent in a probabilistic testing situation than in aconventional multiple-choice testing situation.
Thus, these studies show some relationship of probabilistic test scores topersonality variables (primarily risk(-taking tendencies); but they also showthat these influences do not seem to be greater in probabilistic testing situa-tions than in conventional testing situations.
Use of Alternate Item Txpes
The research reviewed above relied on the multiple- choice item type andvaried the method of responding to that type of item; however, some researchershave advocated the use of entirely different item types, such as free-responseitems, to aid in the assessment of partial knowledge. Some of these alternateitem types avoid many of the problems inherent in multiple-choice items but aresubject to problems of their own. For example, the free-response item typeavoids the problem of random guessing among a *number of alternatives and has thepotential to provide a large amount of information concerning what the examineedoes or does not know, but it is also more tile-consuming to administer andscore, and may cover much less material than is possible with a multiple-choiceformat. Consequently, if there are any time constraints on testing, fewer itemscan be administered. Practical problems with scoring many of these alternateitem types have prevented widespread use of several of them.

-10-
Pt luose4
Although compariions of the psychometric properties of multiple-choiceitems with several alternate item types are planned, the present research fo-
cused on cormarisons of the probabilistic response formats. This study has at-
tempted to answer the following questions:
1. Does a personality variable such as certainty affect probabilistic test
scores on an ability test to a greater degree than it affects conven-
tional test scores on the same ability test?
2. If the effect of a personality variable can be discounted,. what typesof scoring systems are best for multiple-choice items on an abilitytest requiring probabilistic responses?
Method
Test Items
Thirty multiple-choice analogy items were chosen from a pool of items ob-
tained from Educational Testing Service (ETS) containing former SCAT and STEP
items. Each item consisted of an item stem and four alternatives. The pool of
items had 'seen parameterized by ETS ca groups of high school students using the
c,Anputer program LOCIST (Wood, Wingersky, & Lord, 1976) with a three-parameter
logistic model, resulting in item response theory discrimination, difficulty,
and guessing parameters calculated, from large numbers of examinees for each
item. The 30 items were chosen from a pool of approximately 300 analogy items
to represent a uniform range of discrimination and difficulty parameters. The
parameters for the chosen items are in Appendix Table A. The item discrimina-tion parameters ranged from approximately a = .6 to a = 1.4, with a mean of .975
and a standard deviation of .244, while the difficulty parameters ranged from
approximately b = -.5 to b = 2o5, with a mean of .961 and a standard deviation
of .88i. The range of difficulty parameters was not chosen to be symmetricabout zero because the available examinees constituted a more select group than
the group whose responses were used to parameterize the items. The guessing
parameters for these items ranged from c = .09 to c = .38, with a mean of .20
and a standard deviation of .06.
Test Administration
The 30 multiple-choice analogy items chosen were then administered to 299
psychology and biology undergraduate students at the University of Minnesota
during the 1979-1980 academic year. Students received two points toward their
course grade (either introductory psychology or biology) for their partici-
pation. Items were administered by computer to permit checking of responses tobe sure that item response instructions were carefully followed.
The examinees were insttucted to respond to each item by assigning a proba-
bility to each of the four alternatives. This probability was to correspond to
the examinee's belief in the correctness of each alternative, with the addition-
al restriction that the probabilities assigned to all of the alternatives for an

item sum to one. Specifically, for each item, the examinees were asked to dis-tribute 100 points among the four alternatives provided for each item accordingto their belief as to whether or not the alternative was the correct alternative
for that item. The total number of points assigned to all of the alternativesfor an item had to equal 100. Since the tests were computer administered, itemresponses were summed immediately to ensure that the responses to the alterna-
tives did indeed sum to 100 (sums of 99 and 101 were also considered valid toallow for rounding). The points assigned to each alternative were then con-verted into probabilities by dividing the response to each alternative by 100.
To insure that the examinees understood both how to use the computer andhow to respond to the multiple-choice items in a probabilistic fashion, a de-
. tailed set of instructions preceded each test (see Appendix Table B). If an
examinee responded incorrectly to an instruction, the computer would display anappropriate error message on the CRT screen and the examinee mould have to re-spond correctly before proceeding to the next screen. If an examinee again re-sponded inappropriately to an instruction, a test proctor was called by the cos ,
puter to provide additional help to the examinee in understanding the instruc-
tions. Several examples and explanations of methods of responding to probabi-listic items were provided. Examinees, with few exceptions, did not have any
difficulty understanding how to respond to the items. If, in responding to anitem, an examinee's responses did not sum to 99, 100, or 101, the exmainee wagimmediately asked to reenter his/her responses until an appropriate sum was en-
tered.
Item Scores
The item responses obtained from these 299 examines were then scored usingfive different scoring formulas to determine which of these scoring formulasyielded the most reliable and valid scores. The five different scoring formulas
used were:1. The probability assigned to the correct alternative by the examinee
(PACA) was used as the item score. This scoring formula yields scoresthat range from 0 to 1.00.
2. The second type of item score (AIKEN) was computed from a variation of a
scoring formula developed by Aiken (1970), which is a-function of theabsolute difference between the correct response vector for an item and
the obtained response vector:
Item score = 1
where D = E
1=1
D
Dmax
Pai
pei
m - number of alternatives,pal - probability assigned to the alternative by the examinee;
pei - expected probability for alternative; and
Dmax - maximum value of D, which was 2.00 for all of these items.
Each correct response vector would contain three 0's and one 1, while
[81
[91
7

-12-
the obtained response vector would contain four probabilities that sumto 1.00. For example, for an item where the second alternative was thecorrect alternative, the correct response vector would. be 0, 1.00, 0, 0.A response vector that might have been obtained for this item ;a .20,.60, .20, 0. For this obtained, response vector the item score would becomputed as follows:
Item score 1[10-.201 + 11:00-.60j + 10-.201 + 10-01]
=2.00
.80= 1
2.00= .60 [10]
This scoring formula also yields scores that range from 0 to 1.00.3. The quadratic RSS (QUAD), is defined by Equation 3. This scoring formu-
la yields scores that range from -1.00 to 1.00.4. The spherical RSS (SPHER) is defined in Equation 2. .This scoring formu-
la yields scores that range from 0 to 1.00.5. A modification of the truncated logarithmic scoring function (TLOC).
This scoring formula is a good approximation to the logarithmic Rss. It
is a very good approximation throughout most of the possible storerange, and is defined by Equation 5. This scoring formula yields scoresfrom 0 to 1.00. The actual formula used here to obtain scores via atruncated logarithmic scoring function utilizes a scaling factor of 5rather than the usual scaling factor of 1 or 2. It was necessary toincrease this scaling factor to maintain a logical progression ofscores, since the probability assigned to the correct answer for someitems was as low as .01. Since the log of .01 is -4.6052, the scalingfactor had to be a 5 (actually only some number slightly-higher than4.6052) in order that the scores progress in an orderly fashion from 0to 1.00 according to the probability assigned to the correct answer.This alleviated the problem of assigning negative scores to examineeswho had assigned very small probabilities to the Correct answer whileassigning a score of 0 (a higher score) to examinees who had assigned azero probability to the correct answer. The actual FLOG scoring formulaused is Equation 11.
5 t log(pc)
5, .01 < pc < 1.00
Item score =
0 , 0 < pc < .01
fill
Total test scores for all of the scoring methods were obtained by summing all 30item scores for each of the 30 items.
Determining the Effect of Certainty
To determine the effect of an examinee's certainty or propensity to take

-13-
risks when responding 0 probabilistic items, Hansen's (1971) certainty index
was computed for each examinee using the following formula:
n / m1C ET n I - 1)
j=1 j 11
where
1.
mj Pij [121
CT - certainty Index,
n = number of items in test,mj = number of alternatives for item j, and
pij = probability assigned to alternative i of item j .
This certainty index is a function of the absolute difference between the proba-
bilities assigned to the four alternatives and .25, averaged over items. Since
the probabilities assigned to each alternative are dependent upon both an exam -- f'
inee's knowledge and his/her level of certainty, this certainty index is not a
"pure" measure of certainty, but is confounded with knowledge about the item.
To determine the effect of this response style variable, it was first nec-
essary to obtain a "pure" measure of certainty. This relatively pure measure of
certainty was obtained by scoring the probabilistic responses dichotomously and
then partialling the effect of this knowledge variable out of the certainty in-
dices. A dichotomous test score was obtained from the probabilistic'responses
by making the assumption that under conventional "choose-the-correct-answer"instructions, examinees would choose the alternative to which they assigned the
highest probability under the probabilistic instructions. Thus, for each item,
the alternative assigned the highest probability by the examinee was chosen as
the alternative the examinee mould have chosen under traditional multiple-choice
instructions. A score of 1 was assigned if that alternative was the correct
answer and a score of 0 was assigned otherwise. When more than one alternative
was assigned the highest probability, one of those alternatives was randomly
chosen as the, alternative the examinee would have chosen. This procedure at-
tempted to simulate the decision-making process of an examinee in choosing a
correct answer to an item.
This dichotomous test score-was used in a regression equation to predict
the certainty index. The predicted certainty index was then subtracted from the
actual certainty index to obtain a residual certainty index. This residual cer-
tainty index constituted a "pure" measure of certainty. This pure certainty
index was partialled out of the probabilistic test scores using the same method
as that used to partial the dichotomous test scores out of the original certain-
ty index. The pure certainty index was also used to predict .ne probabilistic
test score. The predicted probabilistic test score was then subtracted from the
probabilistic test score to'obtain a residual probabilistic test score that was
unassociated with the pure certainty index.
As a result of these part4alling operations, the following measures were
available for each of. the five scoring methods:
1. Probabilistic test score. This score represents a confounding of knowl-
edge and certainty.2. Dichotomous test score. This score represents a pure knowledge .index
I9

-14-
and is the dichotomous scoring of the probabilistic responses.3. Residual score. This score is the probabilistic test score with the
pure certainty index partialled out, and thus represents the pure knowl-edge component of the probabilistic scores.
4. Certainty index. This measure represents a confounding of knowledge andcertainty.
5. Residual c.N7r...z.nt index. This measure is the certainty index with thepure knowledge index the dichotomous test score) partialled out andthus represents a, pure certainty index.
Evaluative Criteria
Reliability and validity coefficients were computed,for both the probabi-listic and the residual test'scores. The reliability coefficients were internalconsistency reliability coefficients calculated using coefficient alpha. Thevalidity coefficients were the correlations between test score aid reportedgrade-point average. For each of the five scoring methods used, the validityand reliability of the residual scores was.compared with that of the originalprobabilistic test scores. If there was any difference between the validitiesand the reliabilities of the probabilistic and the residual scores, they couldbe attributed to the effect of certainty' in responding, since the only differ-ence between the two scores was that the effect oi certainty had been removedfrom the. residual adores.
Factor analyses of the item scores (both probabilistic and residual) foreach of the five scoring formulas were performed using a principal axis factorextraction method. The number of factors extracted for each of the scoring for-mulas was determined through parallel analyses (Horn, 1965) performed separatelyfor each scoring formula, using randomly generated data with the sane numbers ofitems and examinees as the real data and with item difficulties (proportion cor-rect) equated with the real data. Coefficients of congruence and correlationsbetween factor loadings for each of the five scoring formulas were computed.
Results
Score Intercorrelations
Correlations between probabilistic test scores, residual test scores, di-chotomous scores, the certainty index, and the residual certainty index for eachof the scoring formulas are presented in Table 1. Since the AIKEN scoring for-mula resulted in item scores and correlations that were identical to that of thePACA scoring formula, only the PACA results are reported.
As expected, due to the partialling procedure, the correlation between theresidual certainty index and the dichotomous score, and the correlation betweenthe residual certainty index and the residual score, were both zero for allscoring methods. The correlation between the original certainty index and thedichotomous score (.71), and the correlation between the original certainty in-dex and the residual certainty index (.71), were exactly the 'same for all fourscoring, formulas. This is due to the fact that the three indices--the originalcertainty index, the residual certainty index, and the dichotomous score --do not

- 15 -
Table 1Intercorrelations of Scores for Multiple-Choice Items with a
Probabilistic Response Format Scored by Four Scoring Methods
Scoring Methodand Score
Probabi- Dichot-listic omous
11111
Residual Residual
Certainty Certainty Score
Quadratic RSS (lower triangle) andProbabilisticDichotomous .91**
Certainty ;56**
Residual 'Certainty 7, 1 2*Residual Score .99**
Truncated Log RSS (lower triangle)Probabilistic .11101PRIN
Spherical RSS (upper triangle).94** .64** -.04 1.00**
.71** .00 .94**
.71** --. .71** .67**
.00 .71** - -,00
.92** , .65** .00 ----
and PACA (upper triangle).93** .83** .24** .97**
Dichotomous .85** .71** .00
Certainty .43** .71** .71**
Residual Certainty -.25** .00 .71**
Residual Score .97** .88** .62** .00,
IMPipM
. 96**
. 68**-.00
011.1.1.4.
*p < .05**p < .01
change with the particular scoring formula used; they are constant for each in-
dividual across sabring methods. These tho significant correlations, along with
the significant correlations exhibited for each of the scoring formulas between
the certainty index and the residual score (.65, .67, .62, and .68 for QUAD,
SPHER, TLOG, and PACA, respectively), show that the original certainty index is
indeed related to both "knowledge" as measured by traditional multiple-choice
tests Ithe dichotomous scores) and "certainty" unconfounded.with "knowledge"
(the residual certainty index).
The correlations between the probabilistic test scores and the dichotoue
test scores were .91, .94, .85, and .93 for the QUAD, SPIER, TLOG, and PACA
scoring methods respectively. Using approximate significance tests for corre-
lations obtained from dependent samples (Johnson & Jackson, 1959, pp. 352-358),
all of the pairwise-comparisons among these correlations were significantly dif-
ferent froreesch other at the .05 level of significance. Practically, the only
correlation of these four that appears different from the others is that of TLOG
(.85 as opposed to .91, .94, and .93 for the other scoring methods). Squaring
these four correlations yields the proportion of variance in the probabilistic
test scores accounted for by the'dichotomous test scores. The squared correla-
tions are .83, .88, .72,' and .86 for the QUAD, SPRgR, TLOG, and PACA scoring
procedures.
The correlations between the residual certainty index (the "pure" certainty
measure) and the probabilistic test scores were -.12, -.04, -.25, and .24 for
the QUAD, SPHER, TLOG, and PACA scoring formulas, respectively. The correla-
tions for the QUAD and SPHER scoring formulas were not significantly different
from zero at the .01 level of significance and thus do not account for signifi-
cant amounts of the variance of the probabilistic test scores. Squaring the
correlations that are significantly different from zero results in squared cor-

-16-
relations of .06 for both the TLOG and PACA scoring formulas. Thus, certaintyas meast.red by the residual certainty index accounts for no more than 62 of thevariance of any of the probabilistic test scores.
,The correlations in Table 1 between the probabilistic testvscores and theresidual scores are very high for all four scoring formulas (.99, 1.00, .97, and.97, for QUAD, SPHER, TLOG, and PACA, respectively). These correlations arehighest (.99 and 1.00) for the QUAD and SKIER scoring formulas, whose correla-tions between the probabilistic test score and residual certainty index were notsignificantly different from zero (-. 12 and -.04); these correlations squared(.98 and 1.00) shuw that aliost all of the variance in the QUAD probabilistictest scores, and all of the variance of the SPHER probabilistic test scores, isaccounted for by the residual scores (representing "knowledge" concerning theitems).
The correlations between the dichotomous test scores and the residualscares are high and significantly different from zero for all of the scoringformulas (.92, .94, .88, and .96 for QUAD, SPHER, TLOG, AND PACA scoring formu-las, respectively). This result is expected, since both the residual scores andthe dichotomous scores are relatively pure measures of knowledge.
It was also expected that the correlations between the original certaintyindex and the probabilistic test scores for the various scoring methods would begreater than the correlations between this certainty index and the dichotomousscores, since the probabilistic test scores and,the original certainty indexboth represent a confounding of certainty and knowledge, while the dichotomousscores are a measure of knowledge less confounded by certainty. This occurredonly for the PACA scoring method, which was the only scoring method that was notan RSS. The correlation between the certainty index and probabilistic testscore was significantly greater than the correlation between the dichotomousscore and the certainty index (.83 vs.71) for the PACA scoring formula, and wassignificantly less (u fling the dependent samples test of significance for corre-lations and a .05 level of.significance) than .71 (.56, .64 and .43) for the '
other three scoring formulas.
Validity and Reliability
Table 2 shows the validity and internal consistency reliability coeffi-cients for the probabilistic test scores obtained from the various methdds ofscoring the multiple-choice items with a probabilistic response format. Thevalidity coefficients were all significantly different from zero but were notsignificantly different from each other, using a dependent samples test of sig-nificance for correlation coefficients (Johnson & Jackson, 1959, pp. 352-358)and maintaining the experimentwise error at a .01 alpha level.
The reliability coefficients were all significantly different from zero andsignificantly different from each other (using the Pitman proceddre described inFeldt, 1980, for testing the significance of differences between coefficientalpha for dependent samples using a .01 significance level). The PACA scoringmethod yielded the highest internal consistency reliability (.91) followed bySPHER (.88), QUAD (.87), and TLOG (.84).
Z. 2

- 17 -
Table 2Validity Correlations of Test Scores withReported CPA and Alpha Internal Consistency
Reliability Coefficients for MUltiple-Choice Itemswith a Propabifistic Response Format (N1499)
Scoring.Method
Validit Reliabilityrr a 2,
Unpartialled ScoresQuadratic RSS .18 <.001 .87 <.001
Spherical RSS .18 <.001 .88 <.001
Ttuncated Log RSS .18 <.001 .84 <.001
PACA .17 <.001 .91 <.001
Residual ScoresQuadratic RSS .13 .011 ..87 <.001
Spherical RSS .13 .011 .88 <.001
Truncated Log RSS .14 .006F .84 <.001
PACA .12 .017 .91 <.001
*Probability of rejecting null hypothesis of nosignificant difference from zero.
Validity and internal consistency reliability coefficients for the residual
scores are also shown in Table 2. The reliability coefficients for the residual._
scores are exactly the same as the reliability coefficients for the probabilis-
tic test scores. The validity coefficients for the residual scores were all
significantly different from zero but not from each other (.01 significance lev-
el), and these validity coeffitients were significantly lower (p < .05) for the
residual scores than for the unpartiallad probabilistic test scores (.18 vs. .13
for QUAD, .18 vs. .13 for SPUR, .18 vs. .14 for T1OG, and .17 vs. .12 for
PACA). This decrease in the magnitude of the validity coefficients of the re- ,
sidual scores is not due to a restriction in range problem, since the range of
scores for the probabilistic test scores was very similar to that of the residtri-
al scores, as is shown in Table 31.
Table 3Range of Scores for Probabilistic and
Residual Test Scores
ScoringMethod
QuadraticSphericalTruncated LogPACA
Probabilistic Residual
27.21 27.30
16.57 16.5613.14 12.74
20.69 20.10
23

-18-
Factor Analysis of.Probabilistic Test Scores
Factor analyses of the unpartialled probabilistic and residual test scoresyielded virtually identical results; therefore, only the results of the factoranalyses of the probabilistic test scores are reported here.
Figures is to td show the results of the parallel analyses performed foreach of the scoring methods (numerical data are in Appendix Table C). The ei-genvalues obtained from the principal axeb factor analysis of the random datawere all low; as expected, no factor accounted for significantly more variationin the items than any other factor. In comparing the eigenvalues of the actualdata with those from the random data, it is clear that one strong factor is pre-sent for all of the scorihg methods. A second factor also appears for each ofthe scoring methods with eigenvalues greater than that of the second factor forthe random data, but the eigenvalue for the second factors of the random andactual data are so close that the second factor (and third factor for TLOG) forthe actual' data can be considered to be the same strength as a random factor.On the basis of these results, one-factor printipal axis factor solutions wereobtained for each of the scoring methRds and are shown in Table 4.
The factor loadings in Table 4 are positive and fairly high for all itemsand all scoring formulas, indicating a global factor for each of the scoringmethods. The magnitudes of the eigenvalues show that 'this factor accounted for
more Of the variance of the it responses for the PACA scoring formula (26%)than for any of the other scoring formulas (19.9%, 20.9%, and 17.4% for theQUAD, SPHER, and TLOG scoring formulas).
The correlations between factor loadings across the 30 items for the vari-ous scoring methods are presented in the lower left triangle of Table 5, whilecoefficients of congruence are reported in the upper right triangle of Table 5.The coefficients of congruence are at the maximum of 1.00 for all of the pairsof factor loadings and the correlations among all of the factor loadings arevery high, except for the correlation between the factor loadings for the PACAand TLOG scoring methods," which was only .80. The fact that all of the coeffi-cients of congruence are equal to the maximum value for this index is due to thedependence of this index upon the magnitude and sign of the factor loadings.Gorsuch (1974, p. 254) notes that this index will be high for factors whoseloadings are approximately 'he same size even if the pattern of loadings for thetwo factors is not 'he same.
Discussion and Conclusions
The Influence of Certainty
The evidence concerning the effect of examinee certainty on probabilistictest scores suggests that certainty as a response style variable has a small,almost negligible effect, on the probabilistic test scores obtained in thissturli. The reliability coefficients for the five scoring methods were exactlythe same for the probabilistic and residual test scores, indicating that thecertainty variable was not contributing reliable variance to the probabilistictest. scores and was artifically increasing the reliability coefficients. The
factor structures of the probabilistic test scores and the residual test scores

4
2
0 1
Figure 1Eigenvalues from 'Parallel Analysis of Random Data
and Actual Data for QUAD, SPHER, PACA, and TLOG Scoring Methods
(a) QUAD
QUAD
Room Dflto
T 1
0 1 2 3 4 5 6 7 8 9 10 11 12 15 14 5ractor Number
(c) PACA
Ft CA
Random Data
....,.-- 4.-- Iv-- e...-.. __44:!............ s.a. futairs.s. etr-allo146044a.aws..
0 1 2 S 4 5 6 7 s 4 rnut, 14 5races- Kerber
(b) SPHER
4-
2-
0-1P
6 -1
4 -I
2-
.... :7:IV'''.11".....4.11.40
SPHER
..... Random Data
Ter,
......................."40:44 ellao..... 0 *.
I
1
I2
-T
31
4'.-
is
11 1 .1 1 1 11r-m--1
5 6 7 8 9 10 11 2 13 14 15rociOr Nurrber
(d) TLOC
--0 TUX.. Random Data
II ee---
0 t 1 1 1 Z -"T
0 1 2 3 4 5 6 It 1117-1-7 U7-1314-r-7-75
ractOr 1414Mber
25

t 6.
4. m
- 20 -
Table 4 .
Factor Loadings on the First Factorfor Multiple-Choice It with a
Probabilistic Response Format
It
Numbet
amismsScold.% Method I
QUAD SPEER PACA ,TLOG
1 .':: .418.
.433 .382 .490.
2 .446 - .458 .412 .493
3 ..439 .456 .409 .476
4 .439 .435 .358 .526'
5 .213 .264 .165 .347-,r
6 .429 .443 .396 .528 vIN
7 .432 .358 .316 .4128 . 0 .424 .428 .413 .505
'..
9
10
.324
.426.354.414
.259
.391.469.500
11 .383 .377 .355 .445
12 .538' .529 .509. .585
13 .513 5,111 .519 .566
14 .444 .422 '' .48315 .368 .384 .341 .41416 ..465 .512 .469
,.543
17 .543 .537 .487 .586.18 .505 .484 .546 .50919 .31§... .338 .244 .44520 .485 .490 .492 .502
21 .552*' .552 .491 .59722 .544 .571 ..518 ,62423 , .498 .503 .463 -.52724 .472 .505 .394 .553
. 25 .4G0 .422 .380 .466
26 .437 .466 .406, .517
27,
.514 .505 .508 .52028 .524 .515 .473 .571
29 .406 .423 .349 .48830 .387 .453 .370 .514
Eigenvalue 5.98 . 6.27 5.22 7.81
Table 5Coirelatione (Lower Triangle) and Coefficients
of Congruence (Upper Triangle) BetweenFactor Loadings Obtained for Pour Scoring Methods
,ScoringMethod QUAD SPEER TLOC PACA
QUAD - 1.00 1.00 1.00SPEER. .97 - . 1.00 1.00
TLOG .95 .92 - 1.00PACA .90 .93
.
.80 -
.

-21 -
were also identical. *le factor structure and internal consistency reliability
data (which are both based upon the intetitem co:46101one for scoring
method), indicate no effect of the certainty variable on probabilistic testscores above and beyond the effect on the reeidiel"%ist scores (i.e., the probe-
-bilistic test scores with the "pz.ze" certainty.index partialled out). This lack
of effect is demonstrated by the extremely high correlations between the scores
derived assuming conventional multiple- choice instructions (the dichotomous
score) and the probabilistic test scores for all of the scoring melts, studied,and by the extremely low, correlations between the "pure" certainty index (the
A residual certainty index) and the probabilistic test scores for each scoring
method. Since the dichotomous test scores simulate testing conditions und!rconventional multiple-choice instructions to choose the one correct answer,these'' high correlations suggest that the greatest portion of the variability inthe probabilistic test scores Ior.all'of the scoring formulas is not different
from that present in scores obtained with traditional multiple- choice. tests.
The validity coefficients did show an effect of the certainty index on the
probabilistic test scores. The significant decrease in the validity coeffi-cients which occurs when the "pure" certainty index is partialled from the prob-
abilistic test scores is evidence of some .effect of the certainty variable on
the probabilistic test scores. However,'even though the decrease wee signifi-
cant for all of the scoring formulas, the practical difference was small. The
validity coefficients of the probabilistic, test scores were all low initially,
since the reported GPA, criterion is a complex variable not easily predicted by a
single factor of analogical reasoning. Although reported GPA might not havebeen a true reflection of actual GPA (although Thompson and Weiss, 1980, data
show a correlation of .59 between the two), this invalidity should not have af-
fected the comparisons made in this study. Additional" research utilizing dif-
ferent criterion measures is recommended to further investigate the generality
of the results obtained here.
Other than the small effect of the certainty variable on the validity coef-
ficients for each of the scoring formulas, there appears to be no effect of the
certainty vcriable)on the probabilistic test scores. However, since not all of
the variance in thd prok:1111istic test scores can be accounted for by the "pure"knowledge am cerLainty ices, there may be some other resronse style variablethat exerts an influence upon, the probabilistic test scores. This influence
would have to be extremely small, .though, since the knowledge and certainty in-
dices accounted for 882, 042, 782, and 92% of the variance in the scores ob-
tained from tie spherical, quadratic, truncated log, and PACA scoring formulas,
respectively.
Choice among Scoring Methods
The choice among the ,five scoring methods must be made on the basis of va-
lidity coefficrents, the reliability coefficients, and the factor analysis re-
sults. Since there were no g4nificant differences between any of the validity
coefficients, theie coefficients do not provide support for any one scoring
method. In terms of the reliability coefficients, the PACA (and its equivalent
AIKEN) scoring formula yielded scores having the highest reliability coeffi-cients of all of the scoring methods.
. 2 7

-22-
The dependence of both the internal consistency reliability coefficient andthe one-factor solution on the interitem correlation suggests that scores fromthe scoring formulas with the highest reliability coefficients would also havethe strongest first factors, and this is exactly what occurred in this study.Hypothesizing that the factor extracted represents verbal ability, it is dealt-able,that this factor account for as large a proportion of each item's varianceas possible. The factor contribution of this first factor was greater for thetwo scoring methods that are not reproducing scoring systeMs (PACA and AIKEN)than for the three scoring methods that are reproducing scoring systems.
4
On the basis of these results, either the PACA or Aiken scaring methods canbe recommended for use with multiple-choice it with a probabilistic responseformat. Since PACA is the simplest of the. two methods, it might be the prefers-
. ble scoring method.
Conclusions
Test scores obtained from the five methods of scoring multiple-choice itemswith a probabilistic response format do not appear to be affected by the re-sponse style or personality variable of examinee certainty to a greater degreethan scores obtained under traditional multiple-choice instructionse The scor-ing method used does not affect the validity of the test scores but does .appearto affect the internal consistency of the scores. Test scores obtained usingthe PACA scoring method were more reliable, simpler to compute, and as valid asthose obtained from the other scoring methods; therefore, use of the PACA scor-ing method is recommended for these types of items.
As a note of caution, however, one of the three reproducing scoring systemsmight have a practical advantage over either the PACA or AIKEN scoring.formaas.In a situation where examinees were aware of the scoring formula to be use andwhere the scores were of some importance to the examinee (as for a classroomgrade or selection procedure), the examinees could optimize their test scoreusing the reproducing scoring systems only by rQapuoding according to their ac-tual. beliefs in the correctness of each alternative, while their total scorescould be maximized with the PACA scoring formula by assigning the MAXIMUM proba-bility of 1.00 to the one alternative they thought was the correct one. If ex-aminees were expected to utilize this strategy, one of the reproducing scoringsystems would be better to use with multiple - choice items with a probabilisticresponse format. Test scores obtained from the spherical reproducing scoringsystem were more reliable, as valid, and showed a stronger first factor thanscores from the other reproducing scoring systems. Thus, if the practical situ-ation requires use of a reproducing scoring system, the spherical RSS should beused.

References
Aiken, L. R. Scoring for partial knowledge on the generalized rearrangementitem. Educational and Psychological Heasurement, 1970, 30, 87-94.
Bentler, P. M. Alpha-maximized factpr analysis: Its relation to alpha and
canonical factor analysis. Psychometrika, 1968, 33, 335-345.
Christie, R., Havel, J., 6 Seidenberg, B. Is the F scale irreversible? Journal
of Abnormal' and_Social Psychology, 1958, 56, 143 -159.
Coombs, C. H. On the use of objective examinations. Educational and Psycholor,
ical Measurement, 1953, 13, 308 -310.
Coombs, C. H., Milholland, J. E., 1 Womer, F. B. The-44seamment of. partial
knowledge. Educational and Psychological Measurement, 1956, 16, 13-37..
de Finetti, B. Methods-for discriminating levels of partial knowledge concern-ing a test item. British Journal of Mathematical and Statistical Psycholo-
, 1965, 18, 87-123.
Di'essel, P. I.-, & Schmid, J. Some modifications of the multiple-choice item.Educational and Psychological Measurement, 1953, 13, 574-595.
Runnette, M.,D., & Hogatt, A. C. Deriving a composite score from several mea-sures .of the same attribute. Educational and Psychological Measurement,1957, 17, 423-434.
Echternacht, G. J., Seliman, W. S., Boldt, R. F., & Young, J. D. An evaluationof the feasibility of confidence testing as a diagnostic aid in technical'training (RB-71-51). Princeton NJ: Educational. Testing Service, October
Echternacht, G. Jo, Boldt, R. F., & Sellman, W. S. Personality influences onconfidence test scores. Journal of Educational Measurement, 1972, 9,235-241.
Feldt L. S. A test of the hypothesis that Cronbach's alpha reliability coeffi-ciat is the same for two tests administered to the same sample. Psycho -
metrika, 1980, 45, 99-105.
Gilman, D. A., 6 Ferry, P. Increasing test reliability through self-scoringprocedures. Journal of Educational Measurement, 1972, 9, 205-207.
Gorsuch, R. L. Factor analysis. Philadelphia: W. B. Saunders Company, 1974.
Guilford, J. P. A simple scoring weight for test items and its reliability.Psychometrika, 1941, 6, 367-374.
Gulliksen, H. Theory of mental tests. New York: Wiley, 1950.
Hansen, R. The influence of variables other than knowledge on probabilistic

24
tests. 'Journal of Educational Measurement, 1971, 8, 9-14.
Hendrickson, G. F. An assessment of the effect of differential weighting op
tions within items of a multiplechoice objective test using a Guttmantype
weighting scheme. Unpublished doctoral dissertation, The Johns Hopkins
University, 1970.
Hopkins, K. D., Hakstian, A. R., & Hopkins, B. R. Validity and reliability,con
sequences of confidence weighting. Educational and Psychological Measure.
ment, 1973, 33, 135-141.
Horn, L214-A rationale and test for the number of factors in factor analysis..
Psychometrika,' 1965, 30, 179-186.
Horst, P. Obtaining a composite measure from a number of different measures of
the same attribute.* Psychometrika, 1936, 1, 53-60.
Jacobs, S. S. Correlates of unwarranted confidence in responses to objective
test items. Journal of Educational Measurement, 1971, 8, 15-20.
Johnson, P. 0., & Jackson, R. M. Modern statistical methodi: Descriptive and
inductive. Chictgo4 Rand McNally & Co., 1959.
Kane, M. T., & Moloney, J. M. The effect of SSM grading on reliability when
residual items have no discriminating power. Paper presented at the annual
meeting of the National Council on Measurement in Education, April 1974.
Koehler, R. A. A comparison of the validities of conventional choice testing
and various confidence marking VIrocedures. Journal of Educational Measure
ment, 1971, 8, 297 -303.
Koehler, R. A. Overconfidence on probabilistic tests. Journal of Educational
Measurement, 1974, 11, 101-108.
Lord, F. M., & Novick, M. R. Statistical theories of mental test scores. Read, ing MA: AddisonWesley, 1968.
Pugh, R. C., & Brunza,.J. J. The contribution of selected personality traits
and knowledge to response behavior on a probabilistic test. Paper present
ed at annual meeting of the American Educational Research Association,
Chicago IL, April 1974.
Rippey, R. Probabilistic testing. Journal of Educational Measurement, 1968,
211-216.
Rippey, R. M. A comparison of five different scoring functions for confidence
tests.. Journal of Educational Measurement, 1970, 7, 165-170.
Shuford, E.H., Albert, A., & Massengill, H.E. Admissible probability measure
ment procedures. Psychometrika, 1966, 31, 1/5-145.
Slakter, M. J. Risk taking on objective examinations. American Educational
0

-25-
a
Research Journal 1967, 4, 31-43.
Stanley, J. C., & Wang, M. D. Weighting test its and test-item options: An
overview of the analytical and empirical literature. Educational and Psy-
chololiEal Measurement, 1970, 30, 21-35.
Terwilliger, J. S. & Anderson, D. H. An empirical study of the effects of
standardising scores in the formation of linear composites. Journal of
Educational Measurement, 6, 1969, 145-154.
Thompson, J. C., & Weiss, D. J. Criterion-related validity of adaptive testing
strategiea, (Research Report 80-3). Minneapolis MN: University of Minneso-
ta, Department of Psychology, Psychometric Methods Program, Computerized
Adaptive Testing Laboratory, June 1980.,
Wang, M. W., 6empirical
Wesman, A. G.,scores in
. surement,
Stanley, J. C. Differential weighting: A review of methods and
studies. Review of Educational Research, 1970, 40, 663-705.
6 Bennett, G. K. 'Multiple regression vs. simple addition of
prediction of college grades. Educational and Psychological Mee-
1959, 19, 243-246.
Wilks, S. S. Weighting systems for linear functions of correlated variables
when there is no dependent variable. Psychometrika, 1938, 3, 23-6(4.
Wood, R. L., Wingersky, M. S., 6 Lord, F. M. LOGIST: A computer program for
estimating examinee ability and item characteristic curve parameters
(RM -76 -6). Princeton NJ: Educational Testing Service, 1976.
31

- 26 -
Appendix:Supplementary Tables
Table AIRT Item parameters for
Multiple-Choice Analogy Items
ItemNumber a
310 .616 -.483 .20
273 .627 2.062 .20
275 .652 1.617 .21
286 .673 2.407 .09
327 .693 1.129 .22
399 .722 .446 .24
419 .750 2.413 .16
278 .770. 2.002 .17
266 .815 1.690 .38
271 .828 1.266 .09
268 .844 1.036 .1.7
392 .865 -.360 .20
492 .914 -.145 .12
331 .930. 1.352 .20
578 .946 .271 .20
405' .983 .739 .16
323 1.005 .828 .20
394 1.006 -.153 .20
277 1.041 1.930 .17
335 1.075 1.525 .20
575 1.098 .197 .25
560 1.132 -.D07 .27
452 1.156 -.341 .30
493 1.172 .076 .26
576 1.211 .633 .20
415 1.234 1.183 .24
322 1.232 .960 .17
250 1.288 .513 .17
284 1.357 2.232 .24
339 1.608 1.818 .17
Mean .975 .961 .20
SD .244 .887. .06
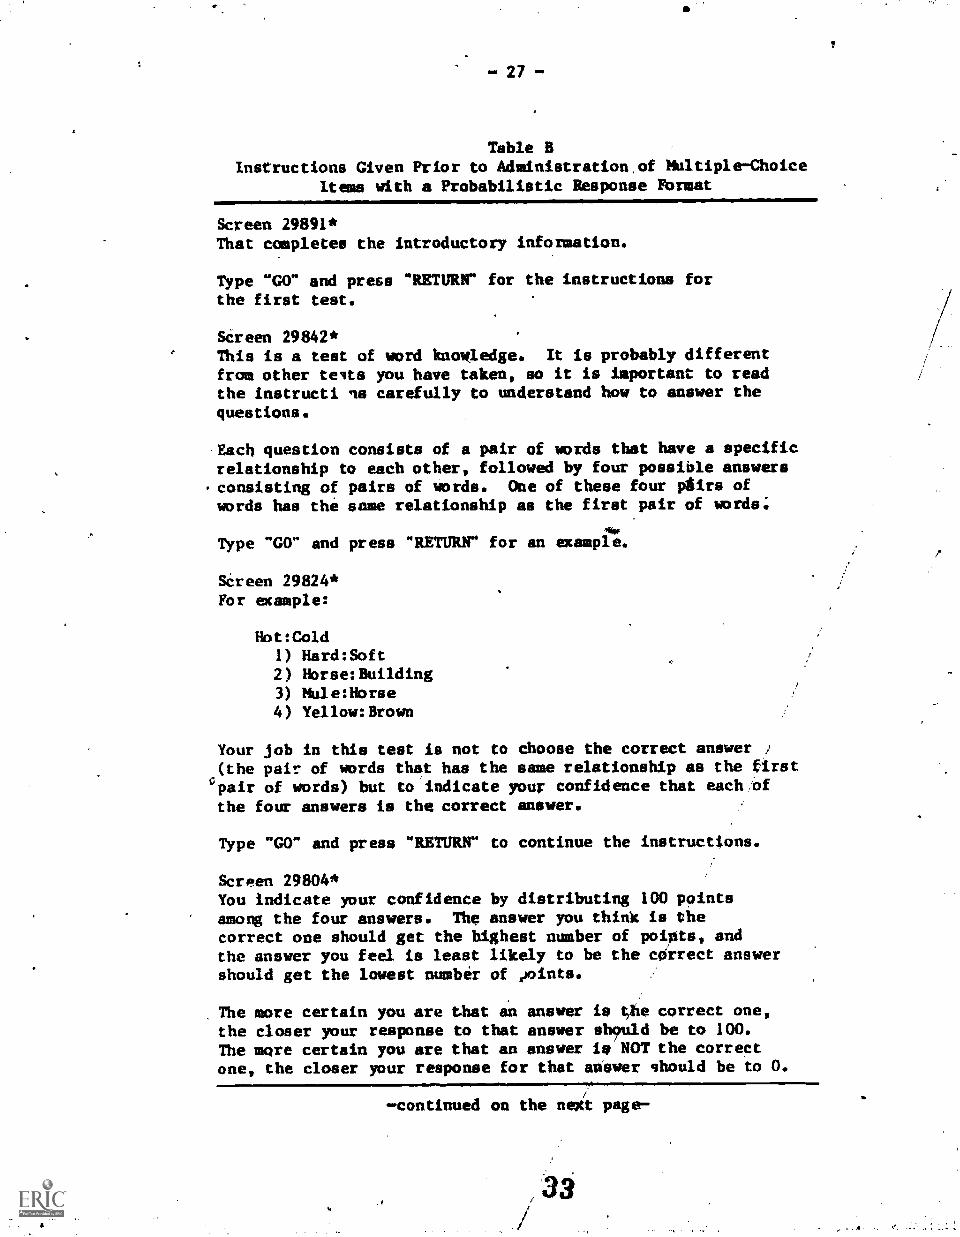
- 27-
Table BInstructions Given Prior to Administration.of Multiple- Choice
Items with a Probabilistic Response Format
Screen 29891*That completes the introductory information.
Type "GO" and press "RETURN" for the instructions forthe first test.
Screen 29842*This is a test of word knowledge. It is probably differentfrom other tests you have taken, so it is important to readthe instructi ns carefully to understand how to answer thequestions.
Each question consists of a pair of words that have a specificrelationship to each other, followed by four possible answersconsisting of pairs of words. One of these four pairs ofwords has the same relationship as the first pair of words;
Type "GO" and press "RETURN" for an example.
SCreen 29824*For example:
Hot:Cold1) Hard:Soft2) Horse: Building3) Mule:Horse4) Yellow: Brown
Your job in this test is not to choose the correct answer i(the pair of words that has the same relationship as the firstpair of words) but to indicate your confidence that each ,'ofthe four answers is the correct answer.
Type "GO" and press "RETURN" to continue the instructions.
Screen 29804*You indicate your confidence by distributing 100 pointsamong the four answers. The answer you think is thecorrect one should get the highest number of points, andthe answer you feel is least likely to be the correct answershould get the lowest number of pints.
The more certain you are that an answer is Ole correct one,the closer your response to that answer shbuld be to 100.The more certain you are that an answer is NOT the correctone, the closer your response for that answer should be to O.
-continued on the neit page-
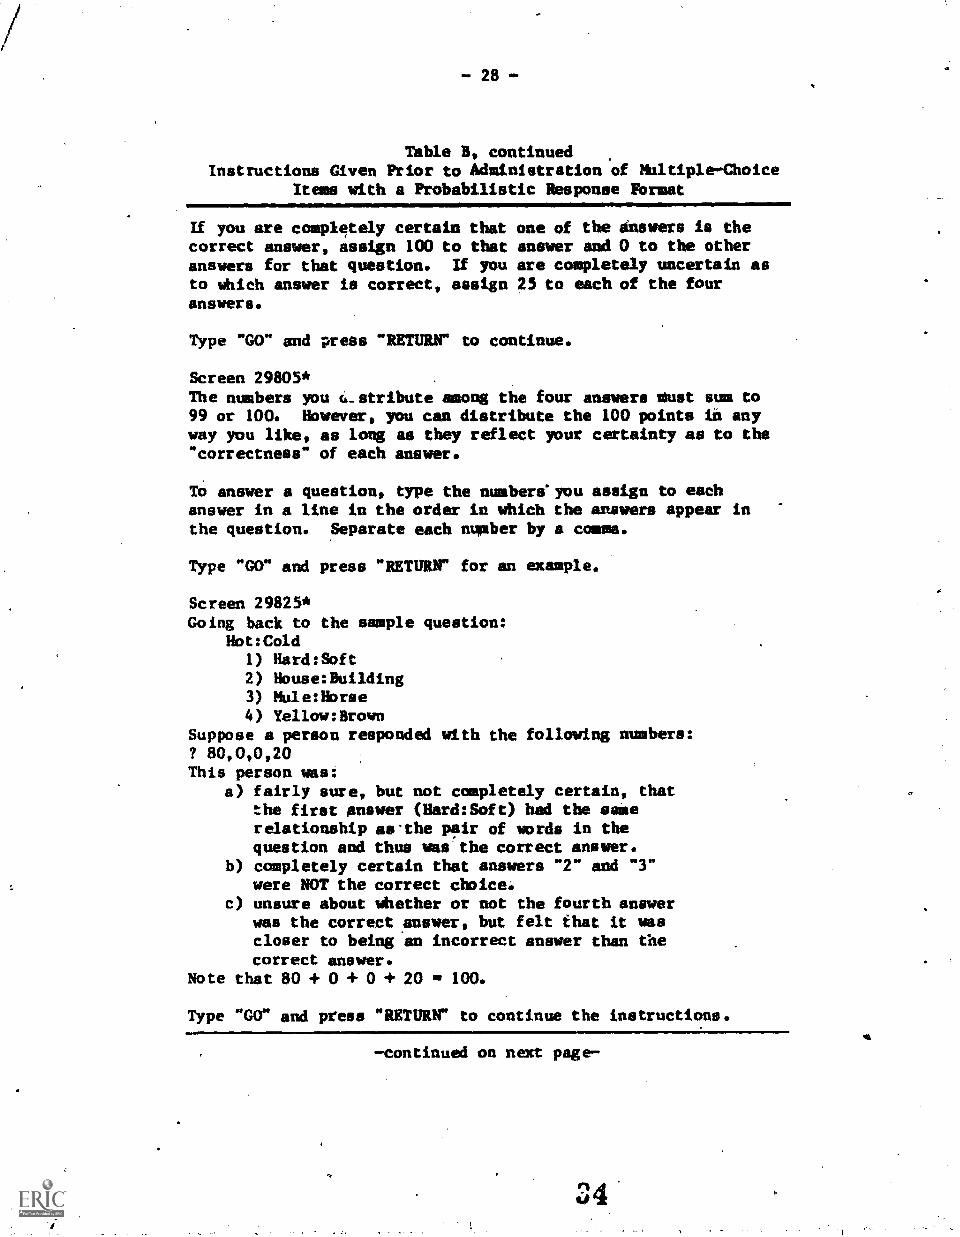
-28-
Table B, continuedInstructions Given Prior to Administration of Multiple-Choice
It with a Probabilistic Response Format
If you are completely certain that one of the sinswers is thecorrect answer, assign 100 to that answer and 0 to the otheranswers for that question. If you are completely uncertain asto which answer is correct, assign 25 to each of the fouranswers.
Type "GO" and press "RETURN" to continue.
Screen 29805*The numbers you cl_stribute among the four answers must sum to99 or 100. However, you can distribute the 100 points in anyway you like, as long as they reflect your certainty as to the"correctness" of each answer.
To answer a question, type the numbers'you assign to eachanswer in a line in the order in which the answers appear inthe question. Separate each number by a coma.
Type "GO" and press "RETURN" for an example.
Screen 29825*Going back to the sample question:
Hot :Cold
1) Hard:Soft2) House:Building3) Mule:Horse4) Yellow:Brown
Suppose a person responded with the following numbers:? 80,0,0,20This person was:
a) fairly sure, but not completely certain, thatthe first answer (Hard:Soft) had the sanerelationship asythe pair of words in thequestion and thus was. the correct answer.
b) completely certain that answers "2" and "3"were NOT the correct choice.
c) unsure about whether or not the fourth answerwas the correct answer, but felt that it wascloser to being an incorrect answer than thecorrect answer.
Note that 80 + 0 + 0 + 20 100.
Type "GO" and press "RETURN" to continue the instructions.
-continued on next page-

- 29 -
Table B, continuedInstructions Given Prior to Administration of Multiple-Choice
Items with a Probabilistic Response FormatIMIIMIIMIMIPOIMIPIONNIMPPOP
Screen 29826*Let's look at this question once more:
Hot :Gold
1) Hard:Sat2) Houselpilding3) Mule:Horse4) Yellow:Brown
.Suppose a person responded with the following numbers:
? 33,003,33
This person was:a) completely certain that the second answer was NOT the
correct answer.b) unsure as to which of the remaining answers was correct
and felt that any of the remaining three answers wereequally likely to be the correct answer.
Type "GO" and press "RETURN" to continue-the instructions.
Screen 29827*As you can see, there is an almdst endless variety Stcombinations of numbers that you may use to state yourconfidence in the four possible answers. Use the entirerange of numbers between 0 and 100 to express yourconfidence. Remember also that the numbers you assign tothe four answers must sum to 99 or 100.
Please ask the proctor for help if you have any questions.'
Type "GO" and press "RETURN" when you ore ready to startthe test.
*This line is for identification only and was not displayed.

d
Table CEigenvaluee for the First Fifteen Principal Factorsof Real and Random Data for Each Scoring Method
Factor(FAD SPEER TLOG PACA
Real Random Real Random Read Random Real Ra out
1 6.38 1.01 6.67 1.00 5.65 1.02 8.16 1.04
2 1.23 .96 1.23 .96 1.36 .95 1.32 .96
3 .98 .93 .92 .94 1.21 .94 .96 .95
4 .93 .89 .91 .90 .97 .90 .80 .89
5 .84 .82 .81 .83 .89 .83" .71 .83
.6 .74 .79 .72 .80 .8J .79 .65 .81
7 .69 .68 .71 .68 .73 .69 .60 .69
8 .67 .66 .66 .67 .72 .68 . .56 .67
9 .63 .64 .61 .63 .63 .64 .55 .65
10 .51 .59 .55 .61 .58 .59 .50 .61
11 .47 .57 .47 .57 .49 .57 .45 .57
12 .44 .53 .43 .53 .47 .53 .42 .53
13 .41 .47 .42 .48 .42 .48 .38 .48
14 .40 .44 .39 .43 .42 .44 .36 .44
15 .38 .41 .35 .40 .39 .41 .30- .41

Navy
1 Liaison ScientistOffice of Naval ResearchBranch Office, London
Box Sc
FPO New York, NT 09510
1 Lt. Alexander RoryApplied Psychology
Measurement DivisionSAHRLHAS Pensacola, FL 32508
I Dr. Stanley Co:lyerOffice of Naval Technology800 N. Quincy StreetArlington, VA 22217
I CDR Mike CurranOffice of Naval Research800 N. Quincy St.Code 270Arlington, VA 22217
1 Mike DurmeyerInstructional Program DevelopmentBuilding 90NET-POGOGreat Lakes NTC, IL 60088
1 DA. PAT FEDERICOCode P13NPRDC
San Diego, CA 92152
I Dr. Cathy FernandesNavy Personnel R&D CenterSan Diego, CA 92152
1 Mr. Paul FoleyNavy Personnel R&D CenterSan Diego. CA 92152
1 Dr. John FordNavy Personnel R&D CenterSan Diego, CA 92152
1 Dr. Kamm J. OrrChief of Naval Technical TrainingNaval Air Station Memphis (75)Millington, TN 38054
1 Dr. Leonard KroekerIsvy Personnel RAD CenterSan Diego, CA 92152
1 Dr. William L. Maloy (02)Chief of Naval Education and TrainingNaval Air Station
Peastacols, FL 32!04
I Dr. James McBrideNavy Personnel R&D Center
San Diego. CA 92152
1 Cdr Ralph MccumberDirector, Research 4 Analysis DivisionNavy Recruiting Command4015 Nilson BoulevardArlington, VA 22203
1 Dr. George MoellerDirector, Behavioral Science's Dept.Naval Submarine Medical Research LabNaval Submarine BaseCroton, CT 63409
DISTRIBUTION LIST
1 Dr Willies MontagueNVIAC Code 13San Diego, CA 92152
1 Bill Nordbrock1032 Fairlawn Ave.Libertyville, IL 60048
1 Library, Code P20ILNavy Persoiest R66 CenterSan Diego, CA 92152
1 Technical DirectorNavy Personnel RAO CenterSan Diego, CA 92152
6 Commanding OfficerNaval Research LaboratoryCode 2627Wsibington. DC 20390
1 Psychological Sciences DivisionCode 442Office of Naval ResearchArlington, VA 22217
6 Personnel A Training Research CroupCode 442PTOffice of Naval ResearchArlington, VA 22217
1 PsychologistONR Branch Office1030 East Green StreetPasadena. CA 91101
1 Office of the Chief of Naval OperationsResearch Development A Studies drenchOP 115
Washington, DC 20350
1 LT Frank C. Petho, MSC. USW (Ph.D)CUT (N-432)NASPensacola, FL 32508
1 Dr. Gary PoochOperations Research DepartmentCode 55PRNaval Postgraduate SchoolMonterey, CA 93940
1 Dr. Bernard *inland (01C)Navy Personnel REM CenterSan Diego, CA 92152
1 Dr. Carl RossCNET-PDCDBuilding 90Great Lakes NTC, IL 60008
1 Dr. Worth ScanlandCNET (N -5)
RAS, Pensacola, FL 32508
1 Dr. Robert G. SmithOffice of Chief of Naval Operation%OP-9878Washington. DC 20350
1 Dr. Richard SorensenNavy Personnel R&D Center
San Diego, CA 92152
1 Dr. Frederick SteinheiserCNO OP115Navy AnnexArlington, VA 20370
1 Mr. Brad Sys eonNavy Personnel R60 CenterSan Diego, CA 92152
1 Dr. Frank Virtu*Navy Personnel R&D CenterSan Diego. CA 92152
1 Dr. Edward Wegnms .
Office of Naval Research (Code 411814)800 North Quincy StreetArlington, VA 22217
I Dr. Ronald WeitzmanCode 54 NZDepartment of Administretive SciencesU. S. Naval Postgraduate SchoolMauterey CA 93940
Dr. Douglas MetallCode 12Navy Personnel RAO CenterSan Diego, CA 92152
DR. MARTIN F. WISROFFNAVY PERSONNEL Rh 0 massSAN DIEGO, CA 92152
1 Mr John N. WolfeNavy Personnel R&D CenterSan Diego, CA 92152
Marine 'Corps
1 H. William GreenupEducation Advisor (E031)Education Center, SCDECQuantico, VA 22134
1 Director, Office of Manpower IltilizatioHQ, Marine Corps (MPU)BCD, Bldg. 2009
Quantico, VA 22134
I Headquarters, U. S. Marine CorpsCode MP1-20Washington, DC 20380
1 Special Assistant for MarineCorps Matters
Code 10011
Office of Naval ResearchPOO N. Quincy St.Arlington, VA 22217
I DR. A.L. SLOWS=SCIENTIFIC ADVISOR (cces lup-) )HQ. U.S. MARINE CORPSimam:row, DC 20380
1 Major Frank Yohannaa, USMCHeadquarters, Marine Corps4Code MP1 -20)Washington, DC 20380
Army
I Technical DirectorU. S. Army Research Institute for theBehavioral and Social Sciences5001 Eisenhower AvenueAIezendrie, VA 22333
1 Dr. Myron Vlach'
U.S. Army Research Institute for theSoOmI and Behavioral Sciences5001 Eisenhower AvonueAlexandria, VA 22133

1 Dr. Milton S. MatsTraining Technical AreaU.S. Army Research Institute3001 Rieenhower AvenueAlexandria, VA 22133
1/Jr. Harold F. O'Neil, Jr.Director, TreiniepResearch LabArmy Research Institute5001 Eisenhower AvenueAlexandria, VA 22333
1 Mr. Robert RosaU.S.' Army Research Institute for the
Social and Sehavinral Sciences5001 Eisenhower AvenueAlexandria, VA 22113
1 Dr. Robert SasserU. S. Army Research Institute for theSebavioral and SocialScleaces
`5001 Eisenhower AvenueAlexandria, VA 22333
1 Dr. Joyce ShieldsArmy Research Institute for theBehavioral and Social Sciencee
5001 Eisenhower Avenuee Alexandria, VA 22333
1 Dr. Hilda WingArmy Research Institute5001 Eisenhower Ave.Alexandria, VA 22333
1 Dr. Robert WisherArmy Research Institute5001 Eisen: over AvendeAlexandria, VA 22333
Air Force
1 APIARL/LRSAttn: Susan RuingRPMVFAFB, 00 45433
Air Force Human Ream; :es LabAPHRL/MPOBrooks APB. TX 78235
1 U.S. Air Force Office of ScientificResearch
Life Sciences Directorate, MLBolling Air Force SameVaehingtcn, DC 50132
A Air University. LibraryAUL/LSE 76t443hexwell AFB. AL 36112
1 Dr. Earl A. Alluisi
RQ, AMIRL (AFSC)Brooks APB, TX 78235
1 Kr. Raymond R. ChristalAMC/NOE&rooks APB, TX 78235
A Dr. Alfred R. FreglyAFOSR/NLRolling AFB. DC 20332
Dr. Roger PennellAir Force Raman Resources LaboratoryLowry AFB, CO 80230
1 Dr. Malcolm ResAMUR?Brooks MC TX 78235
Department of Defense
12 Defeass Technical Information CenterCameron,Skatioa.lldg 5Alexandria, VA 22314Attu: TC
1 Dr. William GrabenTesting DirectoratemucoNhower-rFt. Sheridan, IL 60037
1 Jerry WoesBQ NUCORAttn: WEPCT -PFort Sheridan, IL 60037
1 Military Assistant for Training madPersonnel TechnologyOffice of the Under Secretary of Defeasfor Research 6 Saginsering
Rome 30129, The PentagonWashington, DC 20301
1 Dr. Wayne Sall:memOffice of the Aesisteet Secretary .
of Defense (MIA i L)211269 The VestigesWashington, DC 20301
Civilian Agencies
1 Dr. Helen J. ChristupOffice of Personnel IAD1900 E St., NWOffice of Personnel ManagementWashington, DC 20015
1 Dr. Vern W. UrryPersonnel RAD CenterOffice of Personnel Meneeement1800 E.Strest SWWashington, DC 20415
1 Chief, Psychological Reserch BranchU. S. Coast Board (G4-1/2/TY42)easbiaztoo, DC 20593
1 Mr. Thomas A. WarnI. S. Coast Guard InstituteP. O. Substation 18Oklahoma City, OR 73169
1 Dr. Joseph L. Tenni. DirectorMemory 6 Cognitive ProcessesRational Science FoundationWashington, DC 20550
Private Sector
1 Dr. James AlginaUniversity of FloridaGainesville, FL 326
1 Dr. Erling S. Andersen
Department of StatisticsStudiestraede 61455 Copenhagen=MARK
1 Psychological Research Unit
pope. of Defense (Army Office)Canpbell Park OfficesCanberra ACT 261.0AUSTRALIA
1 Dr. Isaac SejarEducational Testing ServicePrinceton, NJ 08450
1 Capt. J. Jean BelangerTraining Development DivisionCanadian Forces Training SystemCPT8114, CPS TrentonAstra, Ontario, SMKCANADA
1 Dr. Mancha SirenbaumSchool of EducationTel Aviv UniversityTel Aviv, Resat :We 69978
e Israel
1 Dr. Werner DickeDealiPs is StreitkraafteemePostfech 20 50 03D-3300 Some 2WEST =MART
I Dr. R. Darrel BockDepartment of EducationUniversity of ChicegoChicago, II. 60637
1 Mr. Arnold MimeSection of Psychological ResearchCaserne Petits ChateauCMg1000 BrusselsBelgium
1 Dr. Robert BrennanAmerican College Tasting ProgransP. O. Sox 168Iowa City, IA 52243
1 Sundministerise der Vertsidigumg- Referat P II *-
Psychological ServicePostfach 1328D-5300 loan 1F. R. of Germany
1 Dr. Ernest R. Cadotte307 StokelyUniversity of TennesseeKnoxville, TN 37916
1 Dr. Norman CliffDept. of PsychologyUniv. of So. CaliforniaUniversity ParkLos Angeles, CA 90007
1 Dr. Hans CronbagEducation Research CenterUniversity of LeydenBoerhaavelaan 22334 EN LeydenThe NETHERLANDS
1 Dr. Kenneth B. CrossAnecapa Sciences. Inc.P.O. DrawerSanta Barbara, CA 93102
1 Dr. Halter CunninghamUniversity of NiseiDepartment of PsychologyGainesville, FL 32611
1 Dr. Dsttpradad DivgiSyracuse UniversityDepartment of PsychologySyracuse, ME 33210
1 Dr. Fritz DrasgowDepartment of PsychologyUniversity of Illinois603 E. Daniel St.Champaign, IL 61820
1 ER1C'Fecility-Acquisitioes4833 Rugby AvenueBethesda, MD 20014
1 Dr. Beetmain A. Fairbanks Jr.MrVann -Gray 6 Associates, Inc.5823 CallaghanSuite 225San Antonio, TX 78228
1 Dr. Leonard PettitLindquist Center for NeasureentUniversity of IotaIowa City, to 52242
1 Dr. Richard L. FergusonThe American College Tasting ProgramP.O. Box 188Iowa City, IA 52240
1 Dr. Vie.tor FieldsDept. of PsychologyMontgomery CollegeRockville, MD 20850
1 Univ. Prof. Dr. Gerhard Fischer
Liebiggasas S/3A 1010 ViennaAUSTRIA
Professor Donald VitagereldUniversity of Mew EnglandAreidele, New South Wales 2351AUSTRALIA
1 Dr. Dexter FItcherVICAT Research Institute1875 S. Statt, St.Orem, UT 22331
1 Dr. John R. PrederilwnSolt Serene& & NewmanSO Moulted Streetr:ambridgo, MA 02138
1 Dr. Janice GiffordUniversity of Massachus.trsSchool of EducationAmherit, MA 01002
1 Dr. Robert GlaserLearning Research & Development Center
University of Pittsburgh3939 O'Hara StreetPITTSBURGH. PA 15260
Dr. Bert GreenJohns Hopkins UniversityDepartment of PsychologyCharles 6 34th StreetBaltimore, MD 21218
I DR. JAMES G. GRSENOLRDC
UNIVERSITY OF PITTSBURGH3939 O'HAMA STREETPITTSSURGH. PA 15213
1 Dr. Ron HambletonSchool of EducationUniversity of MaseachusetteAmherst, MA 01002
1 Dr. Delwyn RarnischUniversity of Illinois2426 EducationUrbane, IL 61801
I Dr. Lloyd BeephreysDepartment of PsychologyUniversity of IllinoisChampaign, U. 61820
1 Dr. Jack'Hunter2122 Coolidge St.Lansing, MI 48906
1 Dr. Sup* BuynbCollege of EducationUniversity of South CarolinaColumbia. SC 29208
1 Dr. Douglas M. JonesRoam T -255/21 -T
Educational Testing ServicePrinceton, NJ 08541
1 Professor John A. KeatsUniversity of NewcastleN. S. W. 2308AUSTRALIA
1 Dr. Scott KelsoBaskin§ Laboratories.270 Crown StreetNew Bevan, CT 06510
'I CDR Robert S. KennedyCanyon Research Group1040 Woodcock SaidSuite 227Orlando, FL 32803
Inc
1 Dr. William KoleUniversity cf Texas-AustinMeasurement and Evaluation Cant!i°Austin, TX 78703
1 Dr. Alan LeagoldLearning R&D CenterUniversity of Pittsburgh3939 O'Hara StreetPittsburgh, PA 15260
1 Dr. Michael LevineDepartment of Educational Psychology210 Education Bldg.University of IllinoisChampaign, IL 61801
1 Dr. Charles LewisFaculteit Soetale WetenschappenRijksuniversiteir GroningenOude Boteringestrest 2397120C CroniegeeNetherlands
1 Dr. Robert LionCollage of EducationUniversity of IllispieUrbana, IL 61501
I Mr. Phillip LivingatonSystems and Appliel Sciences Corporatto6811 Kenilworth AvenueRiverdale, MD 20840
1 Dr. Robert LockmanCenter for Naval Analysis200 North Resuregara St.Alexandria, 94 22311
1 Dr. Frederic M. LordEducational Testing ServicePrinceton, NJ 08541
1 Dr. James LuesdenDepartment of PsychologyUniversity of Western Australialetelands W.A. 6009
AUSTRALIA
1 Dr. Cary Marco.Stop 31-EEducational Tasting ServicePrinceton, NJ 08451
1 Or. Scott MaxwellDepartment of PsychologyUniversity of HoustonEaueton, TX 77004
1 Dr. Samuel T. MayoLoyola University of ChicagoR20 North Michigan AvenueChicago, IL 60611
1 Mr. Robert McKinleyAmerican College Tasting ProgramsP.O. Box 168Iowa City, IA 32243
1
Professor Jason MillmanDepartment of 4ducationStone Nall .
Cornell UniversityIthaca, NT 14E53
1 Dr. Robert Mislevy711 Illinois Streetcanoes, IL 60134
1 Dr. W. Alan NicewanderUniversity of OklahomaDepartment of PsychologyOklahoma City, OK 73069
1 Dr. Melvin R. Novick356 Lindquist Center for MeasurmentUniversity of IOWAIowa City, IA 52242
1 Dr. Jews OlsonWICAT. Inc.1475 South States StreetOres. UT 84057
1 Dr. Jesse OrlanskyInstitute for Defense Analyses1601 N. Beauregard St.tesendria, VA 22311
1 Wayne N. PatienceAmerican Council on EducationLED Testing Service, !taste 20One Dupont Cirle, 661Washiegts,a. DC 20031.
1 Dr: James A. PaulsonPortland State University
P.O. Box 751Portland, OR 97207
1 Mr. L. 'Nandi*3695 N. Nelson St.AIMING-rue, VA 22241]
1 Dr. Richard A. PollakDirector, Special ProjectsMinnesota Educational' Computing
2520 Broadway DriveSt. Paul.tte
1 Dr. Mark D. ReckatseACTP. O. Box 168Iowa City, IA 42243

1 Dr.. Thomas ReynoldsUniversity of Texas-DallasMarketing Departs etP. O. Sox 688Richardson, 2A 75080
I Dr. Andrew R. RoseAmericas Institutes for Research
1055 Thongs Jefferson St. NW
Wsshingtoe, DC 20007
1 Dr. Lawrence Rudner403 Elo AvenueTakows Park, MD 20012
1 Dr. J. RysnDepartment Of EducationUniversity of South CarolinaColumbia, SC 29206
1 PROF. PURIM SAMEJIMADEPT. OF PSYCHOLOGYUNIVERSITY 011 TENNESSEEKNOXVILLE, TM 37916
1 Frank L. SchmidtDepartmont of Psychology
Bldg. GGGeorge Washington Universitysshington, DC 20052
I Lowell ScheerPsychological A Quantitative
FoundathonsCollege of EdOcationUniversity of Iowatows City. IA 52242
1 OR. ROBERT J. SBIDELINSTRUCTIONAL TECHNOLOGY GROUPIRIMR110
300 N. WASHALEXANDRIA, VA 22314
1 nr. Remo ShigenasuUniversity of TohokuDepartment of Educational PsychologyKawauchi, Sendai 980JAPAN
1 Dr. Edwin ShirkeyDepartment of PsychologyUniversity of Central FloridaOrlando, FL 12816
A Dr. Milian SinsCenter for Naval Analysis200 North Seauregard StreetAlexandria, VA 22311
1 Dr. Richard SnowSchool of EducationStanford University
Stanford, CA 94305
1 Dr. Peter StaloffCenter for Navel Analysis200 North Seauregard StreetAlexandria, VA 22311
1 Dr. William StoutUniversity of Illinoisnapartnent of MathenaticsUrbana, IL 61801
1 DR. PATRICK SUMSINSTITUTE FOR MATHEMATICAL STUDIES IST SOCIAL SCIENCESSTANFORD MINIUMSTANFORD, CA 94!03
1 Dr. Naribaran inothanLaboratory of. yebonetric andEvaluation le rehSchool of tipsU /vomit r-ussechasetts?nherit, 01003
ktCompute Based Education Research Lab252 Eng imolai Renwarch LaboratoryUrbana, IL 61,01
1 Dr. Maurice Tatsuoba220 Educatio Bldg1310 S. Sixth St.Champaign, IL 61820
1 Dr. David Thissea.Departuent of PsychotogyIleiversity of Kansas
Lawrence, IS 66044
1 Dr. Robert lautakawsDepartment of StatisticsUniversity of MissouriColumbia, NO 65201
1 Dr. V. R. R. UppuluriUnion Carbide Corporetion'Nuclear DivisionP. O. Sox yOak Ridge, lb 37830
1 Dr. David ValeAmassment Systems Corporation2233 University AvenueSuite 310St. Paul, NE 55114
1 Dr. Howard WainerDivision of Psychological StudiosEducational Testing ServicePrinceton, V 08540
1 Dr. Michael T. MollerDeportment of Educational Psycholo ,University of WisconsinMilwaukeMilwaukee, WI 41201
1 Dr. Scion MetersRun=300 Worth WashingtonAlexandria, VA 22314
1 DR. GERSHON WELTNANPERCEPTROMICS INC.6271 VARIEL AVE.WOODLAND HILLS, CA 91167
1 DR. SUSAN R. teirraLyPSYCHOLOGY DEPARTMENTUNIVERSITY OF CAMASLawrence. ES 66045
1 Dr. Rand R. WilcoxUniversity of Southern CaliforniaDeparts ent of PsychologyLos Angeles, CA 90007
"I Wolfgang AMIdgrabeStraitkaaafteantBox 20 SO 03D-5300 Roan 2VEST GERMANY
1 Dr. lime 111111ausDepartment of EducationalUniversity of IllinoisUrbana, rt. 61801
1 Dr. Wendy TooCTS/NeGraw rutDel Hants Rsomarch ParkMsateray. CA 93940
Psycho logy

PREVIOUS PUBLICATIONS
Proceedings of the 1977 Computerized Adaptive Testing Conference.July 1978.
Proceedings of the 1979 Computerized Adaptive Testing Conference.September 1980.
Research Reports
8372. Bias and Information of Bayesian Adaptive Testing. March 1983.
83-1. Reliability and Validity of Adaptive and Conventional Tests in a Military
Recruit Population. January 1983.,81-5. Dimensionality of Measured Achievement Over Time. December 1981.
81-4. Factors Influencing the Psychometric Characteristics of an AdaptiveTesting Strategy for Test Batteries. November 1981.
81-3. A Validity Comparison of Adaptive and Conventional Strategies for MasteryTesting. September 1981.
Final Report: Computerized Adaptive Ability Testing. April 1981.
81-2. Effects of Immediate Feedback and Pacing of Item Presentation on AbilityTest Performance and Psychological Reactions to TestiMg. February 1981. .
81-1. Review of Test Theory and Methods. January 1981.
80-5. An Alteinate-Forms Reliability and .Concurrent Validity Cbmparison ofBayesian Adaptive and Conventional Ability Tests. December 1980.
80-4. A Comparison of Adaptive, Sequential, and Conventional Testing Strategiesfor Mastery Decisions. November 4980.
80-3. Criterion-Related Validity of Adaptive Testing Strategies. june 1980.
80-2. Interactive Computer Administration of a Spatial Reasoning Test. April
1980.Final Report: Computerized Adaptive Performance Evaluation. February 1980.
80-1. Effects of Immediate Knowledge of Results on Achievement Test Performanceand Test Dimensionality. January 1980.
79-7. 'lIe Person Response Curve: Pit of Individuals to Item CharacteristIc CurveModels. December 1979.
79-6. Efficiency of an Adaptive Inter-Subtest Branching Strategy In theMeasurement of Classroom Achievement. November 1979.
79-5. An Adaptive Testing Strategy for Mastery Decisions. September 1979.
79-4. Effect of %int-in-Time in Instruction on the Measurement of Achievement.August 1979.
79-3. Relationships among Achievement Level Estimates from Three ItemCharacteristic Curve Scoring Methods. April 1919.
Final Report: Bias -Free Computerized Testing. March 1979.
79-2. Effects of Computerized Adaptive Testing on Black ;and White Students.March 1979.
79-1. Computer Programs for Scoring Test Data with Item Characteristic CurveModelb. . February 1979.
78-5. An Item Bias Investigation of a Standardized Aptitude Test. Decemper 1978.
78-4. A Construct Validation.of Adaptive Achievement: Testing. November 1978.
78-3. A Comparison of Levels and Dimensions of Performance in Black and WhiteGroups on Tests of Vocabulary, Mathematics, and Spatial Ability.October 1978.
-continued inside --

PREVIOUS PUBLICATIONS (CONTINUED)
78-2. The Effects of Knowledge of Results and Test Difficulty on Ability TestPerformance and Psychological Reactions to Testing. September 1978.
78-1, A Comparison of the Fairness of Adaptive and Conventional TestingStrategies. August 1974.
77-7. An Information Comparison of Conventional and Adaptive Tests in theMeasurement of Classroom Achievement. October 1977.
77-6. An Adaptive Testing Strategy for Achievement Test Batteries. October 1977.77-5. Calibration of an Item Pool for the Adaptive Measurement of Achievement.
0. September 1977.77-4. A Rapid Item-Search Procedure for Bayesian Adaptive Testing. May 1977.77-3. Accuracy of Perceived Test-Item Difficulties. May 1977.77-2. A Comparison of Information Functions of Multiple- Choice and Free-Response
Vocabulary Items. April 1977.77-l. Applications of Computerized Adaptive Testing. March 1977.
Final Report: Computerized Ability Testing, 1972-1975. April 1976.76-5. Effects of Item Characteristics on Test Fairness. December 1976.
76-4. Psychologiel Effects of Mediate Knowledge of Results, and AdaptiveAbility Testing. June 1976.
'6-3. Effects of Immediate Knowledge of Results and Adaptive Testing nn AbilityTest Performance. June 1976.
76-2. Effects of Time Limits on Test-Taking Behavior. April 1976. v76-1. Some Properties of a Bayesian Adaptive Ability Testing Strategy. March
1976.
75-6. A Simulation Study of Stradaptive Ability Testing. December 1975.75-5. Computerized Adaptive Trait Measurement: Problems and Prospects. November
1975.
75-4. A Study of Computer - Administered Stradaptive Ability Testing. October1975.
75-3. Empirical and Simulation Studies of Flexilevel Ability Testing. July 1975.
75-2. TETREST: A FORTRAN IV Program for Calculating Tetrachoric Correlations.March 1975.
75-1, An Empirical Comparison of Two-Stage and Pyramidal Adaptive AbilityTesting. February 1975.
74-5. Strategies of Adaptive Ability Measurement. December 1974.74-4. Simulation Studies-of Two-Stage Ability Testing. October 1974.74-3. An Empirical Investigation of Computer-Administered Pyramidal Ability
Testing. July 1974.74-2. A Word Knowledge Item Pool for Adaptive Ability Measurement. June 1974.
74-1. A Computer Software System for Adaptive Ability Measurement. January 1974.73-4. An Empirical Study of Computer-Administered Two -Stage Ability Testing.
October 1973.73-3. The Stratified Adaptive Computerized Ability. Test. September 1973.73-2. Comparison of Four Empirical Item Scoring Procedures. August 1973.
73-1. Ability Measurement: Conventional or Adaptive? February 1973.
Copies of these reports are available, while supplies last, from:Computerized Adaptive Testing Laboratory
N660 Elliott HallUniversity of Minnesota
75 East River RoadMinneapolis MN 554 55 U.S.A.