DOCUMENT RESUME TM 025 882 AUTHOR Mittag, … · AUTHOR Mittag, Kathleen Cage; Taylor, Sharon E....
25
DOCUMENT RESUME ED 401 314 TM 025 882 AUTHOR Mittag, Kathleen Cage; Taylor, Sharon E. TITLE Using Graphing Calculator Technology in Educational Statistics Courses. PUB DATE 12 Apr 96 NOTE 23p.; Paper presented at the Annual Meeting of the American Educational Research Association (New York, NY, April 8-12, 1996). PUB TYPE Reports Evaluative/Feasibility (142) Speeches /Conference Papers (150) EDRS PRICE MF01/PC01 Plus Postage. DESCRIPTORS *Calculators; Comprehension; Educational Research; Educational Technology; Higher Education; Mathematics Instruction; *Statistics; Teacher Education; *Teaching Methods IDENTIFIERS *Graphing (Mathematics) ABSTRACT This paper presents the features of graphic calculator technology that can be implemented in noncalculus-based educational statistics courses. The objectives are to: (1) present potential uses of the graphing calculator; (2) discuss current research concerning graphing calculator implementation in the classroom; and (3) illustrate current instructional strategies advocated for use in the statistics curriculum. On-going studies have indicated increases in conceptual understanding through the use of graphing calculators. While computers may not always be available to students, the hand-held calculator can be used in the classroom and at home. Screens with data, output, and programs are illustrated. With the opportunity to see available technology used with real data and activity-based learning, teachers of educational statistics can lay a better foundation for their students. An appendix presents simulation programs for the Sharp EL-9300 calculator. (Contains 22 references.) (Author/SLD) *********************************************************************** Reproductions supplied by EDRS are the best that can be made from the original document. ***********************************************************************
Transcript of DOCUMENT RESUME TM 025 882 AUTHOR Mittag, … · AUTHOR Mittag, Kathleen Cage; Taylor, Sharon E....

DOCUMENT RESUME
ED 401 314 TM 025 882
AUTHOR Mittag, Kathleen Cage; Taylor, Sharon E.TITLE Using Graphing Calculator Technology in Educational
Statistics Courses.PUB DATE 12 Apr 96NOTE 23p.; Paper presented at the Annual Meeting of the
American Educational Research Association (New York,NY, April 8-12, 1996).
PUB TYPE Reports Evaluative/Feasibility (142)Speeches /Conference Papers (150)
EDRS PRICE MF01/PC01 Plus Postage.DESCRIPTORS *Calculators; Comprehension; Educational Research;
Educational Technology; Higher Education; MathematicsInstruction; *Statistics; Teacher Education;*Teaching Methods
IDENTIFIERS *Graphing (Mathematics)
ABSTRACTThis paper presents the features of graphic
calculator technology that can be implemented in noncalculus-basededucational statistics courses. The objectives are to: (1) presentpotential uses of the graphing calculator; (2) discuss currentresearch concerning graphing calculator implementation in theclassroom; and (3) illustrate current instructional strategiesadvocated for use in the statistics curriculum. On-going studies haveindicated increases in conceptual understanding through the use ofgraphing calculators. While computers may not always be available tostudents, the hand-held calculator can be used in the classroom andat home. Screens with data, output, and programs are illustrated.With the opportunity to see available technology used with real dataand activity-based learning, teachers of educational statistics canlay a better foundation for their students. An appendix presentssimulation programs for the Sharp EL-9300 calculator. (Contains 22references.) (Author/SLD)
***********************************************************************
Reproductions supplied by EDRS are the best that can be madefrom the original document.
***********************************************************************

graphing calculators. aera
USING GRAPHING CALCULATOR TECHNOLOGY
IN EDUCATIONAL STATISTICS COURSES
U.S. DEPARTMENT OF EDUCATIONOffice of Educational Research and Improvement
EDU TIONAL RESOURCES INFORMATIONCENTER (ERIC)
This document has been reproduced asreceived from the person or organizationoriginating it.
Minor changes have been made toimprove reproduction quality.
Points of view or opinions stated in thisdocument do not necessarily representofficial OERI position or policy.
PERMISSION TO REPRODUCE ANDDISSEMINATE THIS MATERIAL
HAS BEEN GRANTED BY
141-7-"Al L FE- e-/,
TO THE EDUCATIONAL RESOURCESINFORMATION CENTER (ERIC)
Kathleen Cage Mittag
The University of Texas at San Antonio
Sharon E. Taylor
Montclair State University
A paper presented at the American Educational Research AssociationAnnual Conference, New York, New York, April 12, 1996.
BEST COPY AVAILABLE
2

ABSTRACT
This paper presents the features of graphing calculator technology that can be
implemented in non-calculus-based educational statistics courses. The
objectives of this paper are: 1) to present potential uses of the graphing
calculator to the audience, 2) to discuss current research concerning graphing
calculator implementation in the classroom, and 3) illustrate current instructional
strategies advocated for use in the statistics curriculum. While computers may
not always be available to students, the hand-held calculator can be used in the
classroom and at home. Screens with data, output and programs are included
in the paper. With the opportunity to see available technology used with real
data and activity-based learning, teachers of educational statistics can lay a
better foundation for their students.

USING GRAPHING CALCULATOR TECHNOLOGYIN EDUCATIONAL STATISTICS COURSES
In recent years, the advent of graphing calculator technology has
influenced the teaching of mathematics and statistics in a profound way
(Dunham & Dick, 1994; Demana & Waits, 1989; Fey & Good, 1985). This paper
will exhibit some of the features of this technology that can be implemented in
non-calculus-based educational statistics courses. Screens with data and
output and programs are included in the paper. Calculators are available for
the audience to explore after the discussion session. Graphing calculators
enhance computer software in statistics rather than replace it. While computers
may not always be readily available to students, the hand-held calculator can
be used in the classroom or at home. This feature alone makes the graphing
calculator a powerful tool in a statistics course.
Leitzel (1993) urged college faculty to implement graphing calculator
technology into their curricula since the majority of high school graduates have
a working knowledge of graphing calculators. With so much success at the high
school level (Osborne et al., 1989) many colleges have begun to implement the
use of graphing calculators in their mathematics departments. Teachers of
educational statistics are now dealing with a large student population that are
carrying this hand-held technology with them to class and wishes to continue its
use. Students' understandings of concepts via the use of a calculator will have
benefited them in previous courses. Graphing calculators can be used to teach
concepts and methods and de-emphasize number crunching (Gilchrist, 1986).
1
4
In order to take the Advanced Placement Calculus Test, the College Board now
requires each student to have a graphing calculator (Gleick, 1995). The Texas
Education Agency furnishes graphing calculators to college students when they
take a mathematics/statistics certification exam.
The objectives of this paper are: 1) to present the potential uses of the
graphing calculator to the audience, 2) to discuss current research concerning
graphing calculator implementation in the classroom, and 3) illustrate current
instructional strategies advocated for use in the statistics curriculum.
POTENTIAL USES FOR GRAPHING CALCULATORS
The potential uses of the graphing calculator are presented by looking at topics
such as, but not limited to, the following areas. One variable descriptive
statistics will be covered first followed by an in-depth coverage of two variable
statistics. Regression, residuals, and correlation are analyzed through a variety
of representations on the calculator. Many types of graphical representations of
one and two variable statistics are explored due to the vast capabilities of the
graphing calculator. Programs written for the calculator are included in the
paper and illustrated. Programs such as probability simulations and regression
analysis are just two examples
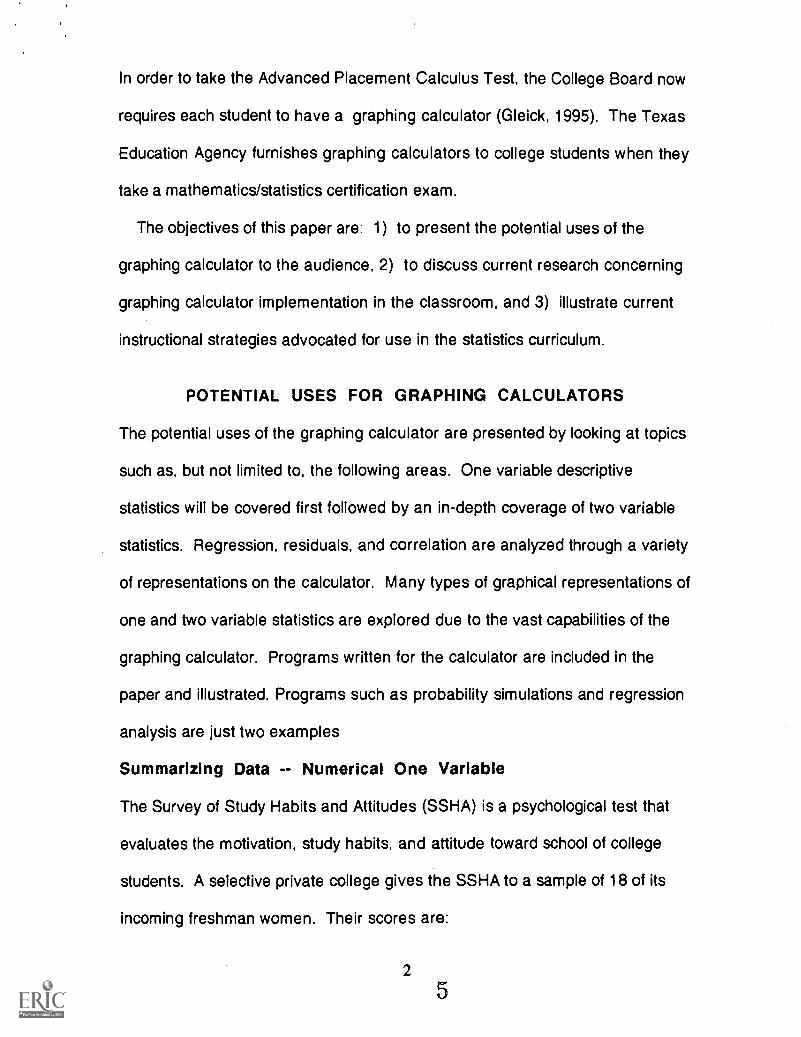
Summarizing Data -- Numerical One Variable
The Survey of Study Habits and Attitudes (SSHA) is a psychological test that
evaluates the motivation, study habits, and attitude toward school of college
students. A selective private college gives the SSHA to a sample of 18 of its
incoming freshman women. Their scores are:
2
5

154 109 137 115 152 140 154 178 101
103 126 126 137 165 165 129 200 148
The measures of central tendency and dispersion using the graphing calculatorare: = 141.055555F;
== 25.691486.z.2= 2539.
3113021.fl .= 18.zmi= 101.tin a.= 200.
Sort the data using the graphing calculator.
Find:
Median = 138.5; Q1 = 126; Q3 = 154; IQR = 28; 1.5 X IQR = 42
Outliers can be determined by subtracting 1.5 X IQR from Q1 or byadding 1.5 X IQR to Q3 and seeing if any of the scores lies outsidethese quantities.
126 - 42 = 84 and 154 + 42 = 196
There is one outlier since the score 200 is above 196.
Summarizing Data -- Graphical One Variable
The same data can be used to look at statistical graphs.
A box plot can be graphed by hand using the statistics above.
3

There are seven types statistical graphs available on the Sharp 9300. They are
the histogram, broken line, cumulative frequency, normal distribution, scatter
diagram, regression curves, and two variable box chart. The types of
regression curves are linear, exponential, natural log, log, power, and inverse.
Since the following data is one variable the screen for the histogram is shown
below. The second graph screen has the trace option activated.
You can recognize clusters, gaps, and possible outliers by looking at the
histogram.
4

Summarizing Data -- Graphical and Numerical Two Variable
The mathematics department of a large state university must plan in advance
the number of sections and instructors required for elementary courses. The
department hopes that the number of students in these courses can be
predicted from the number of entering freshmen, which is known before the new
students actually choose courses. The table below contains the data for recent
years (Moore & McCabe, 1989). The explanatory variable x is the number of
students in the freshman class, and the response variable y is the number of
students who enroll in mathematics courses at the 100 level.
Year 1980 1981 1982 1983 1984 1985 1986 1987
x 4595 4827 4427 4258 3995 4330 4265 4351
y 7364 7547 7099 6894 6572 7156 7232 7450
The screen below is the scatter diagram and the linear regression graph.
The linear regression equation and correlation coefficient are given below.
Regression[1:a+LX]a = 2492.691752
= 1.066322358r = H.P.3582-ziR
5

The TI-82 calculator allows data to be entered in list format. Using the
mathematics department data, List 1 represents the x-values and List 2
represents the
y-values.
We can further analyze this data by looking at the residuals. Residuals are the
vertical distances between the data points and the predicted values that lie on
the regression line. Examining these residual values makes it possible to see
the appropriateness of the regression line. List 3 evaluates the regression line
at every value of x from List 1. List 4 then shows the difference in the actual
data points and the predicted values, the residuals.
Li L2 L3 4 54595.0 7364.0 MMtell -114.3 1982.04827.0 7547.0 7639.8 -139.1 1983.04427.0 7099.0 7213.3 -180.6 1984.04258.0 6894.0 7033.1 46.132 1985.03995.0 6572.0 6752.6 191.44 1986.04330.0 7156.0 7109.9 317.74 : s
4265.0 7232.0 7040.6
L3(0=7392.4429_Not only can we calculate the residuals and examine them numerically, we can
graph them to show the positive and negative aspects.
a a
6
BEST COPY AVAILABLE

Finally, it is possible to graph the residuals over time. By putting the years in
List 5 and plotting the residuals (List 4) versus time (List 5), we can get the
following plot.
aa
a a
a
a
Programs
Many programs can be written for graphing calculators. The COINTOSS
program uses the random number generator to simulate the toss of a fair coin N
times. The DIERACE and COINRACE programs explore random numbers,
binomial and uniform distributions, histogram construction, simulations and the
Central Limit Theorem. The LSLINE program allows for exploration of linear
regression by having students try to minimize the sum of squares of the
deviations. These programs are included in Appendix A.
7
10

Exponential Decay
Infant mortality is an important measure of quality and availability of health care.
We measure infant mortality by the number of children who die within the first
year of life out of 1000 who are born alive. Infant mortality in the United States
has declined as follows:
1920 1930 1940 1950 1960 1970 1980
85.8 64.6 47.0 29.2 26.0 20.0 12.6
The scatter diagram follows:
11,
The linear regression graph and the exponential regression graph follow:
ar4"4'NZta
The linear regression equation and correlation coefficient are:
Regression(1:ailX]a = 87.85714226
=-11.77e5714-1.=-A.96A420961

The exponential regression equation and correlation coefficient are:
Regression(2:a*eAUX]
= 11f:..8 17,C,121;AD. 31042 1' D25-0 . 997:1 94A0
REVIEW OF CURRENT RESEARCH
Since the introduction of graphing calculators, there have been numerous
articles dealing with how to incorporate them into the classroom or their
appropriate use for a particular subject. What has been lacking is significant
research to show the effectiveness of the calculators or how using them affects
students and teachers. This has only recently begun to change. What follows is
a summary of reported findings dealing with graphing calculator research.
The main area of research seems to be on the calculators in general.
Findings that the calculators make calculations less tedious (Harvey, Waits, &
Demana, 1995; Quesada, 1994) and allows the use of real data (Dunham &
Dick, 1994) are common. A less common area of reporting deals with test
scores and performance. However, there are studies that show student
improvement with the use of the calculator (Carlson, 1996; Harvey, Waits, &
Demana, 1995; Quesada, 1994). Finally, results dealing with teacher and
student attitudes toward the technology will be reported (Server, 1996; Carlson,
1996; Kepner, 1994).
According to Harvey, et al, (1995) not only were the tedious calculations no
longer of concern to students who used a graphing calculator, but the machine
facilitated focusing on algebraic concepts and problem solving and less on

procedures. These same results were echoed by Quesada (1994). Along
those same lines, McClendon (1992) reported improved problem solving skills
among students using the calculator.
Due to the nature of a graphing calculator, several studies have focused on
students' understanding of graphical material. Beckmann (1989) showed that
students are able to obtain more information from a graph after experience
using the calculator. The ability to better read and interpret graphical data
(Boers-van Oosterun, 1990) is another positive result of use of the calculator.
Harvey, et al (1995) not only reported similar findings, but went on to say that
multiple graphical representations were more easily understood by the students
in the group.
The above mentioned results were all positive outcomes of students who
used a graphing calculator, but only Harvey goes on to report performance
results. According to the study, there was a significant difference on pre and
post tests between the experimental and control groups in the study (Harvey,
Demana, & Waits, 1995). Quesada (1994) also found a significant difference
with precalculus and calculus students. At the University of Kansas, the pass
rate of college algebra students is up from 50% to 72% since to introduction of
graphing calculators into the curriculum (Carlson, 1996). The same study
reported that students felt more content and were more interested that any other
group of students in the past ten years.
A less scientific, but just as important aspect of graphing calculator research
deals with the attitudes of students and teachers who are working the

calculators. Berver (1996) found that 89% of student responses required to
purchase a graphing calculator were positive. The study also showed a direct
relationship between teacher attitudes toward the machines and their students
attitudes. These results could explain the tie between University of Kansas
teachers who felt the calculators had a positive impact on class interest and
understanding and University of Kansas students who reported their
understanding and interest had been positively affected by calculator use
(Carlson, 1996). Kepner (1994) dealt solely with teacher attitudes. Teachers
involved in a three year program did have major changes in their beliefs, skills
and implementation, but these results came after the three year period.
The published data regarding graphing calculator research studies is not
abundant. Because of this, two ongoing studies are being done by the authors
of this paper. In one study, funded by the Montclair State University Faculty
Scholarship Incentive Program, results have shown that teachers who
participate in a one-week summer workshop on graphing calculator training
have a significant increase in conceptual understanding (p<.001) as measured
by a pre and post test. The other study is a joint venture between The University
of Texas at San Antonio and Montclair State University. This joint venture
involved the development and implementation of a mathematics course
designed for preservice mathematics teachers where graphing calculator
technology usage and applications were modeled. The results of this joint
venture also indicated significant increase in conceptual understanding
(p<0.0001) as measured by a pre and post test.

There is little doubt as to the benefit of graphing calculator technology in the
classroom. Compared to computers, the advantages of portability, affordability
and user friendliness cannot be argued (Cheung, 1996). The stumbling block
remains conversion of teachers to use the technology and schools to purchase
the necessary equipment. It seems from the research students do not need to
be convinced.
STATISTICS INSTRUCTIONAL STRATEGIES
Statistics courses have become one of the essential courses included in the
undergraduate and graduate college curriculum and the number of statistics
courses offered at the university level is increasing every year. (Gordon &
Gordon, 1992). Some of the suggested improvements for statistics courses are
implementing real-world data sets, projects, cooperative learning, and
automated computation. Singer and Willett (1990) wrote that in order to
improve statistics courses education, artificial data sets should be eliminated
from the curriculum and replaced with real data sets. Real data sets are:
authentic; interesting and relevant; have background information available; and
multiple analyses can be performed on them. They also provide substantive
learning and can be presented in raw form.
David Moore (1992, p. 20-23) discussed principles for improving statistics
education by emphasizing data and concepts at the expense of theory and to
"automate calculation and graphics as much as possible." Allen, Efird, and
Eliasziq (1990) reported that introductory statistics students need to learn how
12

to interpret results, formulate questions from a data set, solve real-world
problems, and learn formal writing skills. Hogg (1992) suggested that to
improve statistics education goals should be stated, data should be analyzed,
computation should be automated, projects should be implemented, and
lectures should be de-emphasized. The importance of technology in statistics
education is an issue discussed in Statistics for the Twenty-First Century
( Gordon & Gordon, 1992). Also considered in the development of this paper is
the opportunity to demonstrate how real-world data can be used in the statistics
classroom. Too often "canned data" is used with students and they do not
develop a real sense of the uses of statistics (Scheaffer, 1990; Singer & Willett,
1990). Recent studies show that activity-based learning in the area of statistics
is desired in order for deeper understanding of the concepts (Mittag, 1993;
Taylor, 1993).
CONCLUSION
Statistical knowledge is of paramount importance in society today. Exploratory
data analysis, real-world data sets, computers, and calculators will all be
extensively utilized in the future statistics classroom. With the opportunity to see
available technology used with real data and activity-based learning, teachers
of educational statistics can lay a better foundation for their students. This
paper and presentation allowed the authors to explore the available
technology, present current research, and discuss the impact of graphing
calculator technology on the educational statistics curriculum, instructor, and
classroom.
13

REFERENCES
Beckmann, C.E. (1989). Effect of computer graphics use on student
understanding of calculus concepts. Ph.D. diss., Western Michigan
University, Dissertation Abstracts International, 50, 1974B.
Berver, K.K. (1996). What you expect may be what you get: examining student
and instructor attitudes toward graphing calculators. In Proceedings of the
Seventh Annual International Conference on Technology in Collegiate
Mathematics (pp. 41-45). Reading, MA: Addison-Wesley Publishing Group.
Boers-van Oosterum, M.A.M. (1990). Understanding of variables and their uses
acquired by students in traditional and computer intensive algebra. Ph.D.
diss., University of Maryland College Park. Dissertation Abstracts
International, 51, 1538A.
Carlson, M.P. (1996). A successful transition to a calculator integrated college
algebra curriculum: clues, surveys, and trends. In Proceedings of the
Seventh Annual International Conference on Technology in Collegiate
Mathematics (pp. 61-65). Reading, MA: Addison-Wesley publishing Group.
Cheung, Y.L. (1996). Calculators and microcomputers in statistics. In
Proceedings of the Seventh Annual International Conference on
Technology in Collegiate Mathematics (pp. 73-77). Reading, MA: Addison-
Wesley Publishing Group.
Demana, F., & Waits, B.K. (1990). Implementing the Standards: The role of
technology in teaching mathematics. Mathematics Teacher, 83, 27-31.
14

Dunham, P.H., & Dick, T.P. (1994). Research on graphing calculators.
Mathematics Teacher, 87, 440-445.
Fey, J.T., & Good, R.A. (1985). Rethinking the sequence and priorities of high
school mathematics curricula. In C. R. Hirsch & M. J. Zweng, The Secondary
School Mathematics Curriculum, 1985 Yearbook (pp. 43-52). Reston, VA:
National Council of Teachers of Mathematics.
Gleick, E. (1995, May 22). Role of a new machine. Time, 52
Gilchrist, W. (1986). Teaching statistics to the rest of humanity. Proceeding of
the Second International Conference on Teaching Statistics (pp. 494-497).
Victoria, British Columbia, Canada: University of Victoria Conferences
Services.
Gordon, F., & Gordon, S. (1992). Preface. In F. Gordon & S. Gordon (Eds),
Statistics for the twenty-first century [MAA Notes, No. 26] (pp. vii-ix).
Washington, DC: Mathematical Association of America.
Harvey, J.G., Waits, B.K., & Demana, F.D. (1995). The influence of technology
on the teaching and learning of algebra. Journal of Mathematical Behavior,
14, 75-109.
Kepner, H.S. (1994). Using a college setting to prepare experienced middle
and high school mathematics teachers to use technology. In L. Lum (Ed.)
Proceedings of the Sixth Annual International Conference on Technology in
Collegiate Mathematics (pp. 566-569). Reading, MA: Addison-Wesley
Publishing Group.

Leitzel, J.R.C. (May, 1993). Changing undergraduate programs in mathematics.
UME Trends, 5, 6.
Mittag, K.C. (1993). A Delphi study to determine standards for essential topics
and suggested instructional approaches for an introductory non-calculus-
based college-level statistics course. Unpublished doctoral dissertation.
Texas A&M University, College Station, TX.
Moore, D.S. (1992). Teaching statistics as a respectable subject. In F. Gordon
& S. Gordon (Eds), Statistics for the twenty-first century [MAA Notes, No.
261 (pp. 14-25). Washington, DC: Mathematical Association of America.
Moore, D.S., & McCabe G.P. (1989). Introduction to the Practice of Statistics.
New York: W. H. Freeman and Company.
Osborne, A., Demana, F., Waits, B.F., & Foley, G.D. (1989, August). Annual
report-Mathematics through technology: Establishing concepts and skills of
graphing and functions in grades 9 through 12. Presented to the National
Science Foundation concerning Project No. TPE-8751353.
Quesada, A.R. (1994). On the effects of using graphing calculators in
precalculus and calculus, part II. In L. Lum (Ed.). Proceedings of the Sixth
Annual International Conference on Technology in Collegiate Mathematics
(pp. 296-300). Reading, MA: Addison-Wesley Publishing Group.
Scheaffer, R.L. (1990).Toward a more quantitatively citizenry. The American
Statistician, 44 (1), 2-3.
1619

Singer, J.D., & Willett, J.B. (1990). Improving the teaching of applied statistics:
Putting the data back into data analysis. The American Statistician, 44 (3),
223-230.
Taylor, S.E. (1993). An exploratory study of the statistical competencies of
certain future elementary and middle school teachers. Unpublished doctoral
dissertation. Texas A&M University, College Station, TX.
17
20

APPENDIX A
PROGRAMS FOR GRAPHING CALCULATORS

SIMULATION PROGRAMS FOR THE SHARP EL-9300
Program COINTOSS uses the calculator's pseudo-random random number generator to
simulate the toss of a fair coin N times. To execute the program, press A followed by
the number next to the name "cointoss". When prompted, enter the value of N and watch the
results of the coin flips. What values should the relative frequency of tails (represented by the
rectangles on the left of the screen) and the relative frequency of heads (represented by the
rectangles on the right of the screen) approach as the value of N increases?
Program cointoss (STAT)
Ck.GStat XInput NH = .8NRange 0, 1, 1, -.5, H, 1, 2t = 1Label 1R = ipart 2 randomData RG(HIST)t=t+1If t <= N Goto 1End
The following two programs, the Histogram Horse Races, allow the student to explore
and gain a better understanding of random numbers, the binomial and uniform distributions,
histogram construction, coin toss and die roll simulations and the Central Limit Theorem.
Program dierace (STAT) Program coinrace (STAT)
CkGStat XInput NH = .3NRange 1, 6, 1, 0, H, 5, 6t = 1Label 1R = ipart 6 random + 1Data RG(HIST)t=t+1
t<=N Goto 1End
CIrG
Stat XInput NH = .3125N+ 5Range 0, 5, 1, 0, H, 5, 6t = 1Label 1R = On 2 random + ipart 2 random +
ipart 2 random + ipart 2 random +ipart 2 random
Data RG(HIST)t=t+1Ift < =N Goto 1End
The program that follows, lsline, allows the student to explore linear regression by trying to
minimize the sum of squares of the deviations (SSD). N points are randomly generated and
Iris B. Fetta Texas Technology Conference 1992All publication rights reserved.
22

stored in the statistics data cards, the scatter diagram is drawn, and the user is asked to inputguesses for the y-intercept and slope of the best fitting line. N should be greater than or equal
to 4 for effective use of the program. When it is felt that a value of SSD close to the minimum
value is found, the user of the program should choose the "do not try again option" byentering a value for t other than 1. The program will then draw the least squares regression
line on the graph for comparison with the user's last attempt. The regression coefficients arethen displayed along with the minimum sum of squares of the deviations and the correlationcoefficient. Whenever the program pauses, the user should press ENTER to resume
execution.
Program Is line (STAT)Label Is
arG G(line)Stat XY WaitC =1 Print " Least squares line y intercept "Input N A = aLabel gen Print AM = ipart 9 random - 4 Print Least squares line slopeW = ipart 7 random - 3 B =bIf M = 0 Goto gen Print BIf W = 0 Goto gen WailData M,W arGC =C + 1 Gosub residualKC < N Goto gen G(line)Data ii , ji Wail
Range -4,7, 4.7, 1, -3.1, 3.1, 1, 1 Gosub prt
G(S.D.) r = rWait Print rCIrT Wall
Print ' Line is y = A + Bx " DispG
Label guess EndPrint ' Enter guess for y intercept ' Label residualInput A k =1
Print Enter guess for slope ' s = 0
Input B Label calc
X = -4.7 x = SO ,k]
F=A+BX y = St[2,k]
X = 4.7 Y = A + Erx
G=A+BX s=s+(y-Y)2Line -4.7, F, 4.7, G Line x, y, x, Y
Gosub residual k = k+1
Gosub prt If k <= N Goto calcPrint To try again, enter 1 for t ' Wail
Input t Return
If t = 1 Goto Is Label prtDispG Print ' SSD =Wait Print s
arG Wad
If t =1 Goto guess Return
Iris B. FettaAll publication rights reserved.
23
Texas Technology Conference 1992

AERA April 8-12, 1996
U.S. DEPARTMENT OF EDUCATIONOffice of Educational Research and Improvement (OERI)
Educational Resources information Center (ERIC)
REPRODUCTION RELEASE(Specific Document)
DOCUMENT IDENTIFICATION:
E IC
Title:
'%'"'")( tc)\fi-lf C -\c kekk4/1 t <-1" tAktzi 1-3\,cACC1-%"c.) C `t1%..(3('N
V",-S C-S±-vt c\e\ V,NckePublication Date:
Author(s):
Corporate Source:
II. REPRODUCTION RELEASE:
In order to disseminate as widely as possible timely and significant materials of interest to the educational community, documentsannounced in the monthly abstract journal of the ERIC system, Resources in Education (RIE), are usually made available to usersin microfiche, reproduced paper copy, and electronic/optical media, and sold through the ERIC Document Reproduction Service(EDRS) or other ERIC vendors. Credit is given to the source of each document, and, if reproduction release is granted, one ofthe following notices is affixed to the document.
If permission is granted to reproduce the identified document, please CHECK ONE of the following options and sign the releasebelow.
Check herePermittingmicrofiche(4"x 6" film),paper copy,electronic,and optical mediareproduction
Sample sticker to be affixed to document
"PERMISSION TO REPRODUCE THISMATERIAL HAS BEEN GRANTED BY
SOIrTO THE EDUCATIONAL RESOURCES
INFORMATION CENTER (ERIC)."
Level I
Sign Here, Please
Sample sticker to be affixed to document
"PERMISSION TO REPRODUCE THISMATERIAL IN OTHER THAN PAPER
COPY HAS BEEN GRANTED BY
TO THE EDUCATIONAL RESOURCESINFORMATION CENTER (ERIC)."
Level 2
0or here
Permittingreproductionin other thanpaper copy.
Documents will be processed as indicated provided reproduction quality permits. If permission to reproduce is granted, butneither box is checked, documents will be processed at Level 1.
"I hereby grant to the Educational Resources Information Center (ERIC) nonexclusive permission to reproduce this document asindicated above. Reproduction from the ERIC microfiche or electronic/optical media by persons other than ERIC employees and itssystem contractors requires permission from the copyright holder. Exception is made for non-profit reproduction by libraries and otherservice agencies to satisfy information needs of educators in response to discrete inquiries."
Signature\y_ 15-- Position: IN
IA s ()F0 .
Printed,Npme: rq-46-At(im _4P\LC, }- \A \ Q o A.) t yk ri \ ctr- y
Organization: ...,uke,;.;. ®k 1 4 4- ta./ aka.q-)%0
Address: Ma A.,.,.... .Q) 1,. Sik,_Ii- 0 1) .),..4..4)Telephone
1."1--%
9.40 -'°q l'94 ,.) ,2) )j-
ck .) N-J IA ) 1.1( % Ile\
Number:(tom -1-1, .-2 ST-%S.
Date:

C UA
THE CATHOLIC UNIVERSITY OF AMERICADepartment of Education, O'Boyle Hall
Washington, DC 20064202 319-5120
February 27, 1996
Dear AERA Presenter,
Congratulations on being a presenter at AERA'. The ERIC Clearinghouse on Assessment andEvaluation invites you to contribute to the ERIC database by providing us with a written copy ofyour presentation.
Abstracts of papers accepted by ERIC appear in Resources in Education (RIE) and are announcedto over 5,000 organizations. The inclusion of your work makes it readily available to otherresearchers, provides a permanent archive, and enhances the quality of RIE. Abstracts of yourcontribution will be accessible through the printed and electronic versions of RIE. The paper willbe available through the microfiche collections that are housed at libraries around the world andthrough the ERIC Document Reproduction Service.
We are gathering all the papers from the AERA Conference. We will route your paper to theappropriate clearinghouse. You will be notified if your paper meets ERIC's criteria for inclusionin RIE: contribution to education, timeliness, relevance, methodology, effectiveness ofpresentation, and reproduction quality.
Please sign the Reproduction Release Form on the back of this letter and include it with two copiesof your paper. The Release Form gives ERIC permission to make and distribute copies of yourpaper. It does not preclude you from publishing your work. You can drop off the copies of yourpaper and Reproduction Release Form at the ERIC booth (23) or mail to our attention at theaddress below. Please feel free to copy the form for future or additional submissions.
Mail to: AERA 1996/ERIC AcquisitionsThe Catholic University of AmericaO'Boyle Hall, Room 210Washington, DC 20064
This year ERIC/AE is making a Searchable Conference Program available on the AERA webpage ( http : / /tikkun.ed.asu.edu /aera /). Check it out!
Sincerely,
awre ce M. .udner, Ph.D.Director, ERIC/AE
'If you are an AERA chair or discussant, please save this form for future use.
ERIC Clearinghouse on Assessment and Evaluation