DOCUMENT REsumE. JC 830 033 - ERIC · part-time student's attending the-Commuqty colleges. ... 388...
36
iD 225 617 :TITLE Community Colleges, Fall 1982. INSTiTUTION Hawaii Univ., Honolulu. Office of Institutional Research and Analysis. REPORT NO MIF-9 PUB DATE Dec 82 NOTE _57p. PUB TYpE Statistical'Data (110) Reports - Research/Technical (143) EDR9 PRICE MF01/PC01 Plus Postage. DESCRIPTORS, Class Size; *College Pro4rams; *Community Colleges; *Courses; *Enrollment; *Enrollment Trends; Full Time Equivalency; General Education; School Statisties; State Surveys; Student Teacher Ratio; Two Year Colleges; *Two Year C911ege Students; Vocational Education ," , V IDENTIFIERS *Hawaii ABSTRACT V Fall 1982 course registration data in regular credit programs are provided for six Hawaii community.colleges (i.e., Honolulu, Kapiolani, Kauai, Leeward, Maui, and Windward). Following introductory material highlighting findings, /tables provide data for 1978 through 1982 on course registration by campus;' average class size by prograth and campus; and the number of Classes'with fewer_than 10 students by campus. Next, tables present a course'registration ! summdry by program'for 1982; themumber of classes and.average class size by piogram fdr 1978-1982; and student.semeSter hours (SSH) and courte full-time equivalent (FTE) enrollment by program for 1978-1982. Finally, informatipn is 'provided for each college on registration by pr9gram; number of claSses and average class size; SSI-Ps and course FTE; and classes with less than 10 students. Highlighted tindings include the following: (1) an increase in all course registration measures (e.g., courses, classeS, student and instructor contact hours, and course FTE) to their highest level in 5 years; (2) less substantial inCreases in course registration measures than in overall student enrollment; (3),comparable increases in the number of general education and'vocational education courses (3% each); (4) maintenance of the avernge class size for the system as a whole at 24 students; and (5) a decrease in the number and proportion of small classes. (H8) DOCUMENT REsumE. JC 830 033 Course Registration Report. University of Hawaii, *********************************************************************** Reproductions supplied by EDRS are the best that can be made, from the originnl document. ****************************-******************************************* el
Transcript of DOCUMENT REsumE. JC 830 033 - ERIC · part-time student's attending the-Commuqty colleges. ... 388...
iD 225 617
:TITLECommunity Colleges, Fall 1982.
INSTiTUTION Hawaii Univ., Honolulu. Office of InstitutionalResearch and Analysis.
REPORT NO MIF-9PUB DATE Dec 82NOTE _57p.PUB TYpE Statistical'Data (110) Reports -
Research/Technical (143)
EDR9 PRICE MF01/PC01 Plus Postage.DESCRIPTORS, Class Size; *College Pro4rams; *Community Colleges;
*Courses; *Enrollment; *Enrollment Trends; Full TimeEquivalency; General Education; School Statisties;State Surveys; Student Teacher Ratio; Two YearColleges; *Two Year C911ege Students; VocationalEducation ," , V
IDENTIFIERS *Hawaii
ABSTRACTV Fall 1982 course registration data in regular credit
programs are provided for six Hawaii community.colleges (i.e.,Honolulu, Kapiolani, Kauai, Leeward, Maui, and Windward). Followingintroductory material highlighting findings, /tables provide data for1978 through 1982 on course registration by campus;' average classsize by prograth and campus; and the number of Classes'with fewer_than10 students by campus. Next, tables present a course'registration !summdry by program'for 1982; themumber of classes and.average classsize by piogram fdr 1978-1982; and student.semeSter hours (SSH) andcourte full-time equivalent (FTE) enrollment by program for1978-1982. Finally, informatipn is 'provided for each college onregistration by pr9gram; number of claSses and average class size;
SSI-Ps and course FTE; and classes with less than 10 students.Highlighted tindings include the following: (1) an increase in allcourse registration measures (e.g., courses, classeS, student andinstructor contact hours, and course FTE) to their highest level in 5
years; (2) less substantial inCreases in course registration measuresthan in overall student enrollment; (3),comparable increases in thenumber of general education and'vocational education courses (3%each); (4) maintenance of the avernge class size for the system as awhole at 24 students; and (5) a decrease in the number and proportionof small classes. (H8)
DOCUMENT REsumE.
JC 830 033
Course Registration Report. University of Hawaii,
***********************************************************************Reproductions supplied by EDRS are the best that can be made,
from the originnl document.****************************-*******************************************
el
COURSE REGISTRATION REPORT
UNIVERSITY OF HAWAII,'COMMUNITY COLLEGES
FALL 1982
"PERMI8sION TO REPRODUCE THISMATERIAL HAS BEE,N GRANTED BY
C . Yoshiokarn0
nn TO THE EDUCATIONAL RESOURCESINFORMATION CENTER (ERIC)."
U.S. DEPARTMENT OF EOUCATIONNATIONAL INSTITUTE OF EDUCATION
I- DI ./1 TI(JNAI RI 'AMIN( F ORMA )I\/(INT(
ho, .1 07,1,1 tpPfl Pdre, Th.
rrtioalmq I
hur,r, r1Loilyriorl
OFFICE OF INS,TITUTIONAL RESEARCH & ANALYSIS
UNIVERStTY OF HAWAII
DECEMBER 1982
COURSE REGISTRATION REPORTUNIVERSITY OF HAWAII,' COMMUNITY COLLEGES
FALL 1982
IntroduCtion
Information for .this report is based on registration data in
!regular credit programa at the sijc cOmMunity colleges under the ChanCellor
fOr -ComMunity Colleges: Honolulu, Xapiolani; Kauai, Leeward, Maui, and
Windward. UH ComVUter11eports 3010 and 3011,-which provide detailed and
sUmmary data on coursê,I registration were used as the primary Source
documents. Computer Repoet 3030 (Schedule of Classet) was used as 0
reference. The deans Of instruction were also Consulted for information
regarding the schedule of classes, ,croSs-listed and concurrently taught
classes.. All data are as of mid-October 1982.
EICHLICUla
All course'registration measures (couises, classes;,semester hours,
student regiStrations, student semester hours, course Elm,
instrudtor and student contact' hours) are at their highest level in
5 years .(Table 1). Each.of the measures has'also shown steady
grOwth bince Fall 1979, marking three straight years of gains.
The increases in, coUrSe regiStration measures are .conSistent with
this fall's, reCord high enrollment, of 22,176, a record brought
apout by a 7% increaSe over laSt fall'S record high enrollment.
MOst course registration measures increased between.2% and 4%,
somewhat less. than the percentage gain in enrollment. The
difference betweeh,,the enrollMent and coUrse registration, iodwth
rate is due; Mainly to the .,growing flmbet and proportion of.'
part-time student's attending the-Commuqty colleges.
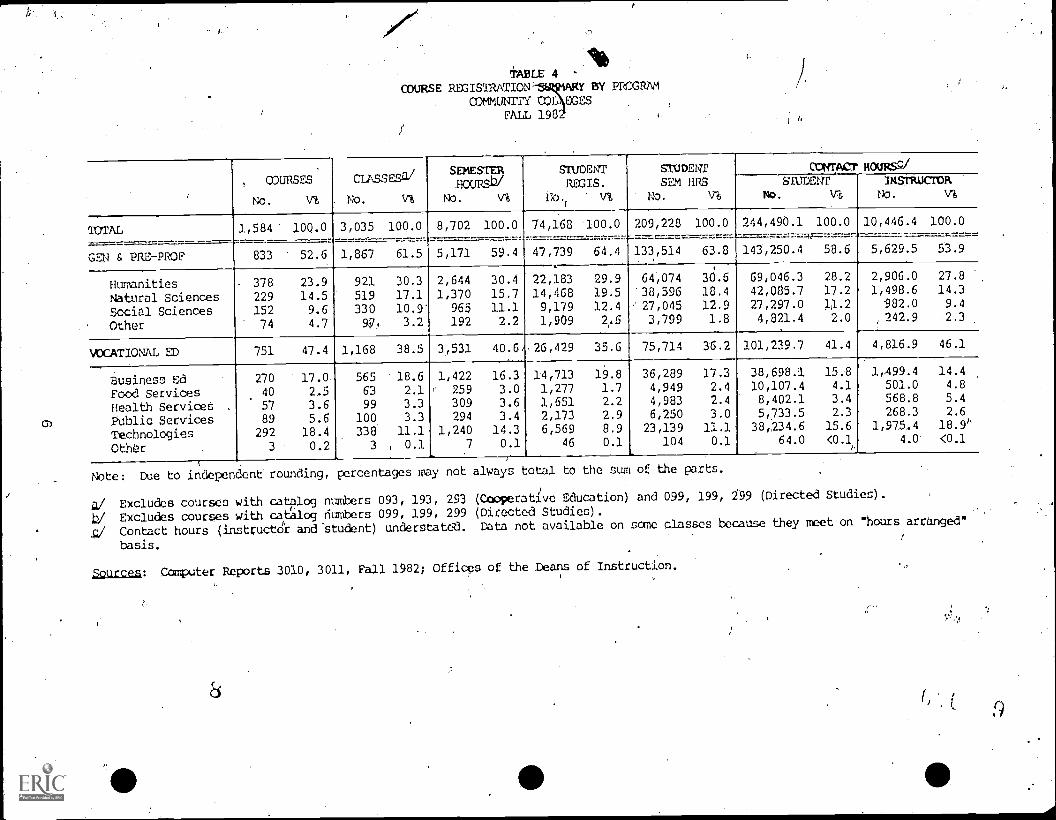
The 3% growth in the total number of classes offerred is shared
rather evenly by the general and vocational education courseareas,
with each showing a 3% incre4se (Table 5). However, individual
campuses varied in the percentage change in the number of classeS
offerred. The changes ranged from -3% (Windward) to +12%
(Kapiolani) for the general eduCation course area, and from 77%
(Kauai) to +30% (Windward) for the vocational education' -cOurse
area.
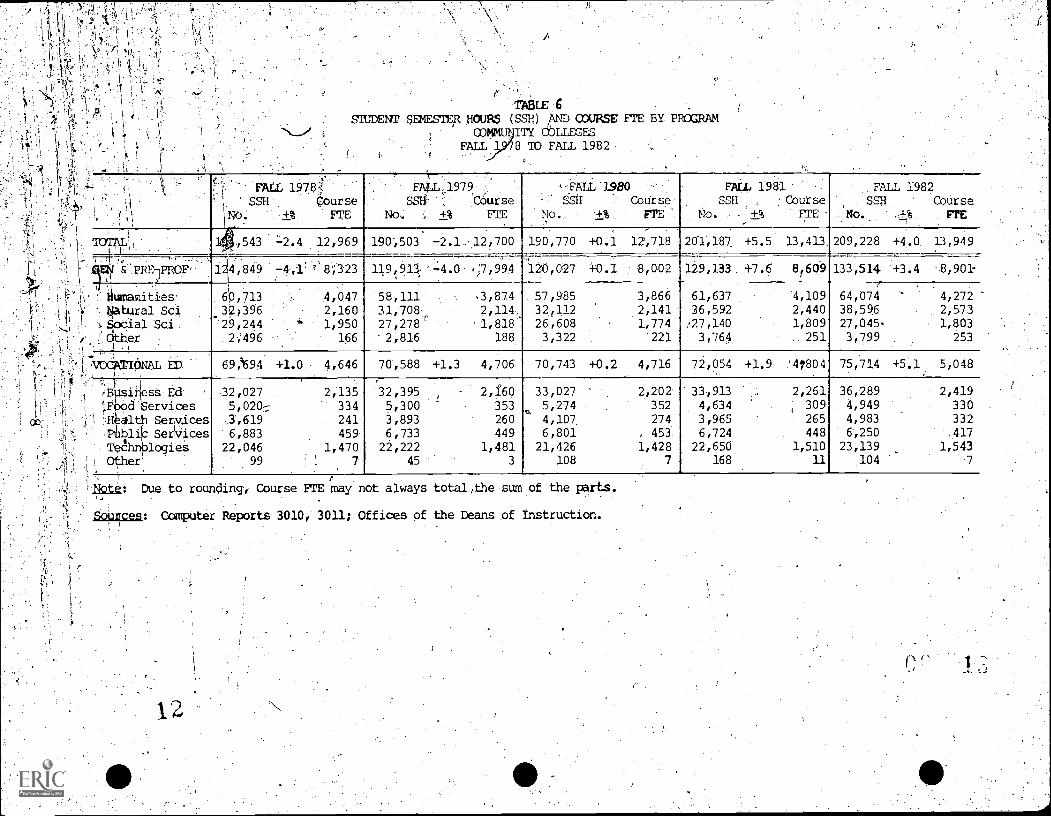
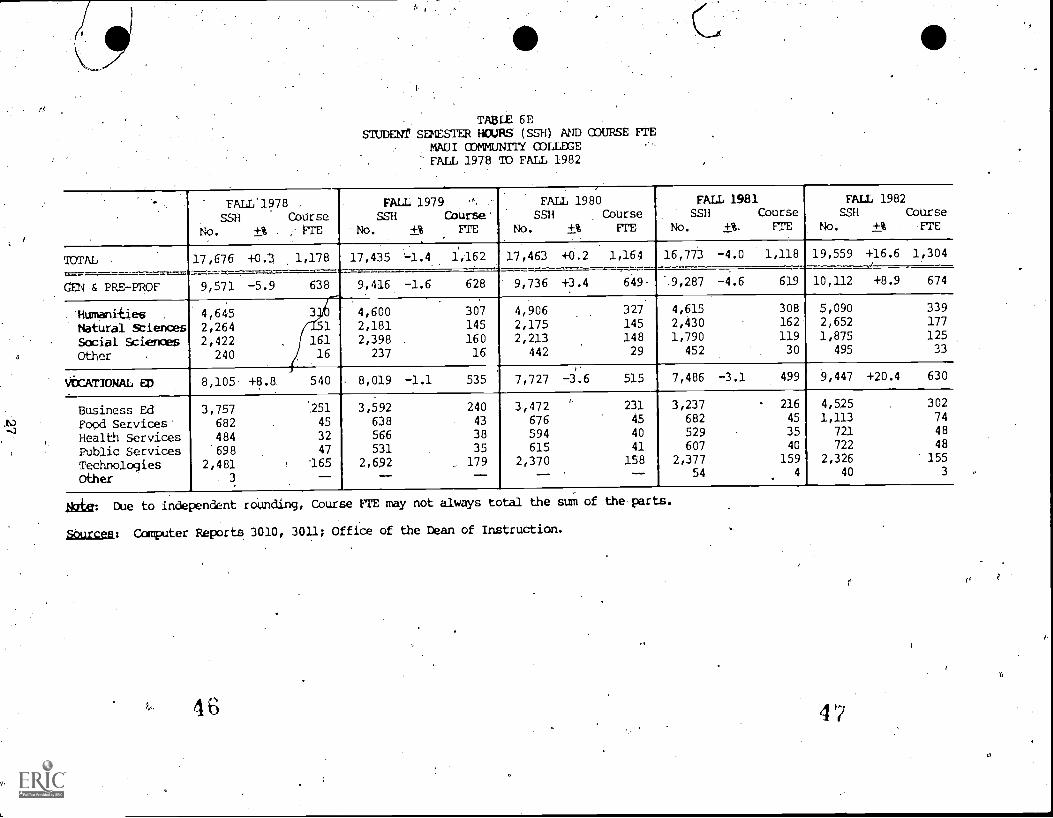
Overall SSH's Showed a 4% increase over last fall, with general and
vocational education course areas marking gains of 31 and 5%,
respectively (Table.6). 'Changes in SSH's generated Varied,from
'campus to cmpus and ranged fram -2% (Windward) to +9 (Maui) for
general education courses, .and from -1% (Honolulu) to +20% (Mad')
for vocational education courses.
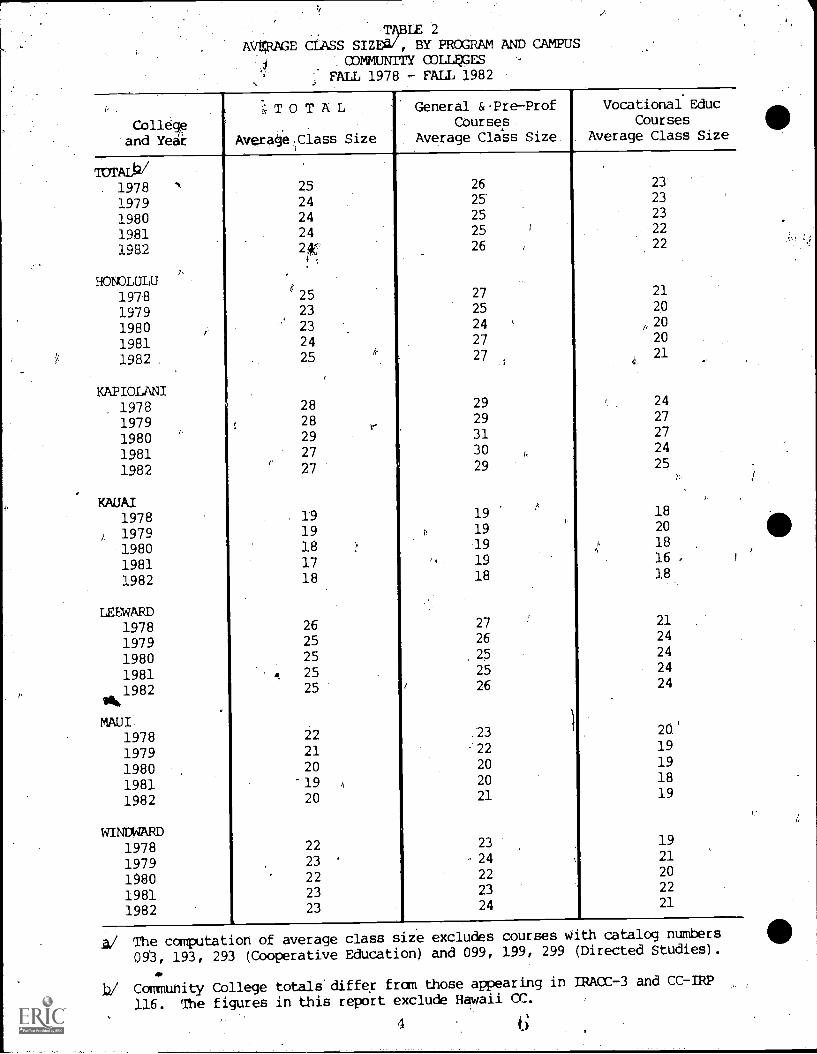
Average class sizes (Table 2) are about the same as last fall: 24
for the system and ranging from 18:(Kauai) to 27 (Kapiolani). The
average class size of general education courses ,(26 students) is
again larger than that in vocational education courses (22
-student8)..
1
The number and proportiOn of clases with nine or fewer, students
decreased this fall (Table 3),, The 125 "small 'classes" is 'the
lowest number since Fall 1979.
ZUMMARY
Aal course registration measures, in line with this fall's record
high student enrollment, are at their highest level in five years. Most
measures increased betWeen 2% and 4%. Average class size continues to
remainat-24. There were 125 "small classes" ,(fewer than 9 students), the,
lowest number since Fall 1979.
r4
2
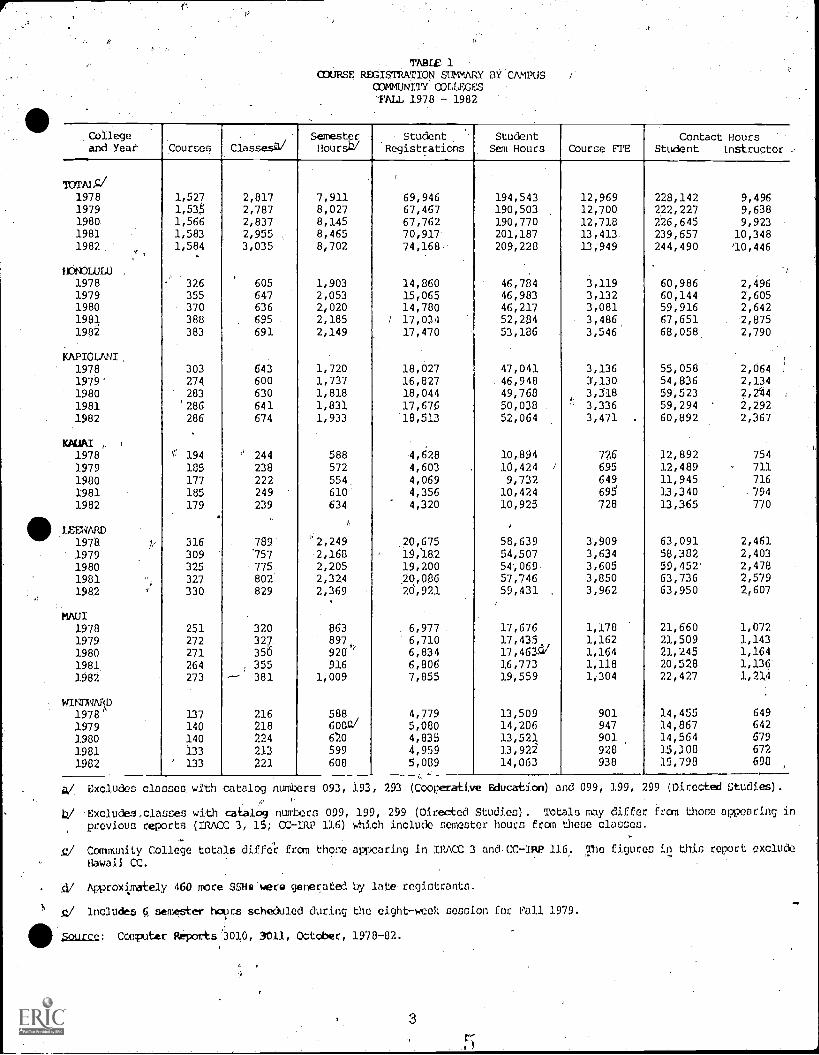
TABLE 1COUBSE REGISTRATION SUMMARY BY CAMPUS
COMMUNITY. COLLEGES'FALL 1978 1982'
Collegeand Year Courses
.
Classesa/SemesterHoursh/
StudentRegistrations
StudentSem Hours Course FTS
Contact HoursStudent instructor
TOFTAL,C/
1978 1,527 2,817 7,911 69,946 194,543 12,969 228,142 9,4961979 1,535 2,787 8,027 : 67,467 190,503 , 12,700 222,227 9,6381980 1,566 2,837 8,145 67,762 190,770 12,718 226,645 9,9231981 1,583 2,955 . 8,465 70,917 201,187 13,413 239,657 10,3481982 1,584 3,035 8,702 74,168, 209,228 13,949 244,490 '10,446
HONOLuL4)b
1978 326 605 1,903 14,860 46,784 3,119 60,986 2,4961979 355 647 2,053 15,065 46,983 3,132 60,144 2,6051980 370 636 2,020 14,780 46,217 3,081 59,916 2,6421981 388 695 2,185 ; 17,034 52,284 3,486. 67,651 2,875
1982 383 691 2,149 17,470 53,186 3,546 68,058 2,790
KAPIOLANI. .
1978 303 643 1,720 18,027 47,041 3,136 55,058 2,064 I
1979 274 600 1,737 16,827 46,948 3,130 54,836 2,134
1980 283 630 1,818 18,044 49,768 3,318 59,523 2,244
1981 286 641 1,831 17,676 50,038 3,336 59,294 2,2921982 286 674 1,933 1E1,513 52,064 3,471 . 60,892 2,367
KAUAI , .
1978 v' 194 ' 244 588 4,628 10,894 726 12,892 754
1979 185 238 572 4,603 10,424 I 695 12,489 711
1980 177 222 554. 4,069 9,732 649 11,945 716
1981 185 249 610 4,356 10,424 695 13,340 .794
1982 179 239 634 4,320 10,925 728 13,365 770
h
LEEWARD,
1978. 316 789P
2,249 20,675 58,639 3,909 63,091 2,461
1979 309 757 2,168 19,182 54,507 3,634 58,382 2,403
1980 325 775 2,205 19,200 54-,069- 3,605 59,452 2,478
1981 327 802 2,324 ,20,686 57,746 3,850 63,736 2,579
1982 330 829 2,369 20,921 59,431. 3,962 63,950 2,607
MAUI1978 251 320 003 6,977 17,676
.
1,178 214660 1,072
1979 272 327 8974. 6,710 17,435 1,162 21,509 1,143
1980 271 356 920' 6,834 17,463CY 1,164 21,245 1,164
1981 264 , 355 916 6,806 16,773 1,118 20,528 1,136
1982 273 -- 381 1,009 7,855 19,559 1,304 22,427 1,214
WINDWARD1978' 137 216 588 4,779 13,509 901 14,455 649
1979 140 218 60Ga/ 5,080 14,206 947 14,867 642
1980 140 224 620 4,835 13,521 901 14,564 679
1981 133 213 599 4,959 13,922 928 15,108 672
1982 ' 133 221 608 5,009 14,063 938 15,798 698
Excludes classe3 with catalog numbers 093, 193, 293 (Cooperative Education) and 099, 199, 299 (Directed Studies).
Excludes,classes with catalOg numbers 099, 199, 259 (Directed Studies). Totals may differ from those appearing inprevious reports (IRACC 3, 15; CC-IRP 116) which include semester hours from these classes.
-
V/ CUmnunity College totals diffe'r from those appearing in IRACC 3 and.CC-IsP 116,. The figures in this report exclude
Hawaii CC.
A/ Approxi,mately 460 more SSHe'were generated by late' registrants.
4/ Includes 6 semesker hoycs scheduled during the eight-week session for Fall 1979.
Zourec,: Cceputor Reports13010, 3011, October, 1978-82.
TMLE 2AVgRAGE CLASS SIZE4/, BY PROGRAM AND CAMPUS
commmy coLL4cEsFALL 1978 - FALL 1982
Collegeand Year
TOTALW19781979198019811982
7.TOTAL
Avera4eClass Size
General &.Pre-ProfCourses
Average Class Size
Vocational EducCourses
Average Class Size
HONOLULU19781979198019811982
KAPIOLANI19781979198019811982
KAUAI19781979198019811982
LEEWARD19781979198019811982
MAUI19781979198019811982
WINDWARD19781979198019811982
25242424241C
4'. 25
23
232425
2828
2927
27
1919181718
2625
25
2525
22
2120
-1920
2223
222323
26
2525
2526
27
25
2427
27
2929
3130
29
1919191918
2726
25
2526
,23
22
20
20
21
23
24
222324
23
23
23
2222
21
2.0
/, 20
20
21
24
27
2724
25
1820
1816 ,
18
21
24
24
24
24
20.
19191819
19212022
21
A/ The computation of average class size excludes courses With catalog numbers
093, 193, 293 (Cooperative Education) and 099, 199, 299 (Directed Studies).
11',/ Community College totals'differ from those appearing in IRACC-3 and CC-IRP
116. The figures in this report exclude Hawaii CC.
4
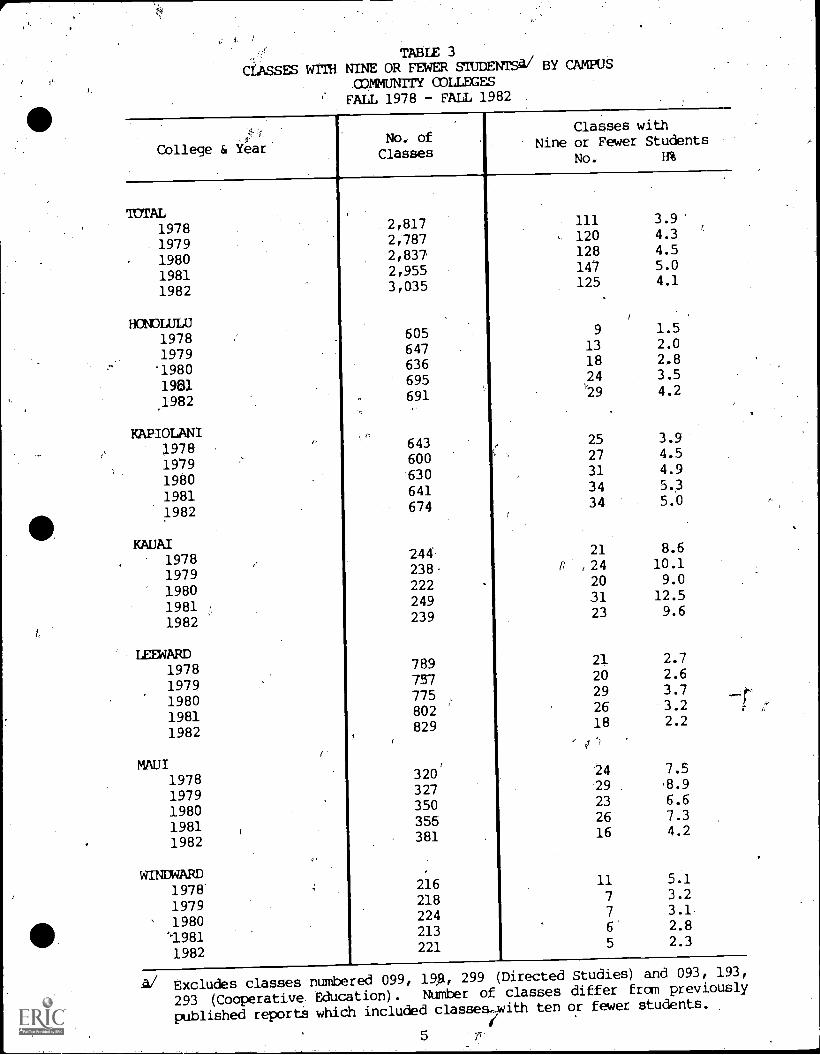
TABLE 3'CLASSES WITH NINE OR FEWER STUDENTSA/ BY CAMPUS
commuNrry COLLEGESFALL 1978 - FALL 1982
College & YearNo. ofClasses
Classes withNine or Fewer Students
No. H%
TOTAL19781979198019811982
HONOLULU
2,81720872,8372,9553,(135
111 3.9
* 120 4.3 '
128 4.5
147 5.0
125 4.1
1978 605 9 1.5
1979 647 13 2.0
1980 636 18 2.8
1981 695 24 3.5
,1982 691 29 4.2
KAPIOLANI1978 643 25 3.9
1979 600 27 4.5
1980 630 31 4.9
1981 641 34 5.3
1982 674 34 5.0
KAUAI1978 244. 21 8.6
1979 238. ,24 10.1
1980 222 20 9.0
1981 249 31 12.5
1982 239 23 9.6
LEEWARD1978 789 21 2.7
1979 737 20 2.6
1980 775 29 3.7
1981 802 26 3.2
1982 829 18 2.2
7 fi
MAUI1978 320' 24 7.5
1979 327 29 8.9
1980 350 23 6.6
1981 355 26 7.3
1982 381 16 4.2
WINDWARD1978'
216 11 5.1
1979 218 7 3.2
' 1980224 7 3.1
1.981213 6 2.8
1982221 5 2.3
Excludes classes numbered 099, 1, 299 (Directed Studies) and 093, 193,
293 (Cooperative. Education). Number of classes differ from previously
published reportS which included classeswith ten or fewer students.
5 r.
IS
+ABLE. 4
COURSE ROGIST'RATION' Y BY PROGRAM
.COMMUNITY CX)11, EGES
FALL 198-
MOSES'
No . V%
CLASSESV
No. VI
SEMESTERBOURSb/
No. V%
sruDENTREGIS.
No V%u
STuDENTSEm RRS
NO. VT6
CCITrACT HOURSC/STODENT
No. VI'INSTRUCTOR
No. V1
-
TJIAL 1,584 100,0 3,035 100.0 8,702 100.0 74,168 '100.0 209,228 100.0 244,490.1 100.0 10,446.4 100.0
GEN & PRE-PROP 833 52.6 1,867 61.5 5,171 59.4 47,739 64.4 133,514 63.8 143,250.4 58.6 5,629.5 53.9
4
Humanities - 378 23.9 921 30.3 2,644 30.4 22,183 29.9 64,074 30.6 69,046.3 28.2 2,906.0 27.8
Natural Sciences 229 14.5 519 17.1 1,370 15.7 14,468 19.5 '38,596 18.4 42,085.7 17.2 1,498,6 14.3
Social Sciences 152 9.6 330 10.9 965 11.1 9,179 12.4 ' 27,045 12.9 27,297.0 1;1..2 982,0 9.4
Other 74 4.7 9. 3,2 192 2.2 1,909 2,46 3,799 1.8 4,821.4 2.0 242.9 2.3
VOCATIONAL ED 751 47.4 1,168 38.5 3,531 40.6,:26,429 35.6 75,714 36.2 101,239.7 41.4 4,816.9 46.1
Susiness Ed 270 17.0 565 18.6 1,422 16.3 14,713 19.8 36,289 17.3 38,698.1 15.8 1,499.4 14.4
Food Services 4.0 2,5 63 2.1 ,' 259 3.0 1,277 1.7 4,949 2.4 10,107.4 4.1 501.0 4.8
Health ServiceS . 57 3.6 99 3.3 309 3.6 1,651 2.2 4,983 2.4 8,402.1 3.4 568.8 5.4
Public Services 89 5.6 100 3.3 294 3.4 2,173 2.9 6,250 3.0 5,733.5 2.3 268.3 2.6
Technologies 292 18.4 338 11.1 1,240 14.3 6,569 8.9 23,139 11.1 38,234.6 15.6 1,975,4 18.9''
Other 3 0.2 3 , 0.1 7 0.1 46 0.1 104 0.1 64.0 <0.1 4.0 <0.1
,
Note: Due to independent rounding, percentages may not always total to the Sum of the parts.
.a/ Excludes courses with catplog numbers 093, 193, 293 (Cooveratilve Education) and 099, 199, /99 (Directed Studies).
t/ Excludes courses with catalog riumbers 099, 199, 299 (Directed Studies).
.Q/ Contact hours (instructdi and 'student) understated. Data not available on some classes because they meeton 'hours arranged'
basis.
Liclulgea: Computer Reports 3010, 3011, Fall 1982; Offices of the Deans of Instruction.

TABLE 5NUMBER OF CLASSES AND AVERAGE CLASS SIZEA/ BY PROGRAM
ODMMUNITY COLLEGESFALL-1978'TC FALL 1982
1.
,
,
FALL 1978.
ClasSes Avg.No. +% Size
FALL 1979ClasSes
NO. +%AVg.
Size
.
FALL 1980Classes
No. +%
Avg.
Size
,
FALL 1981Classes Avg.No. +% Size
FALL 1982Classes Avg.
No. +% Size
TOTAL 2,817 +4.5 25 2,787 -1.1 24 2,837 +1.8 24 2,955 +4.2 24 3,035 +2.7 24
GEN & PRE-PROF 1,718 +2.2 26!,
1,676 -2.4 25 1,706 +1.8 25. 1,819 +6.6 25 1,867 +2.6 26
Humanities 682 24 840 24 849 24 894 24 921 24
Natural Sciences. ,421 28 426 27 440 26 499 27 519 28
Social Sciences 345 29 337 27 329 27 331 , 28 330 28
Other 70 r 19 73 18 88 17 95 - 19 97 20
VOCATIONAL ED 1,099 +8.4 23 1,111 +1.1 23 1,131 +1.8. 23 1,136 +0.4 22 1,168 +2,8 22
Business Ed 516 26 509 27 533 26 530 25 565 26
Food Services 64 23 65 23 64 24 60 21 63 2.0.
Health Services 82 16 87 15 93 15 95 15 99 16.'
Public Services 114 21 123 19 112 20 117 20. 100 21
Technologies 321 19 326 19 327 . 18 331 19 338 19
Other 2 17 1. 15 2 , 18 3 19 3 . 15
'A/ Number ofclasses and average class size exclude courses with catalog numbers 093, 193, 293 (Cooperative Education)
and 099, 199,1299 (Directed Sudies).4'
,SoUrces: Computer Reports 3010, 3011; Offices of the Deans of Instruction.
1
TMLE 6SaUDENT SEMESTER HOURS (5511.) ,AND ODURSE k.it, By PROGRAM
rry coLLEGEs8 TO FALL 1982
i
. FALL 1978)SSH Course
No. +% FTE
FALL 1979<
, CourseNo. , +% 1TE
, FALL '1980
SSI1
No. +%
CourseFTE
FALL 1981SSII
No.
CourseFEE
FALL 1982SSH
No. .+%
CourseFTE
;
aurALh1
0,, ,543 -2.4 12,969 190-,503 -2.1-.12,700 190,770 +0.1 12,718 201,187 +5.5 13,413 209,228 +4.0 13,949
lr& PRE1GROF. 94,849 -4.1 8,323 119,91 -4.0 ,:,7,994 120,027 +0.1 8,002 129,133 +7.6 8609 133,514 +3.4 ,8,901-
i humanities, §atura1 Sci\Social Sci
i
'Other
60,71332096
-29,2442496
*
4,0472,1601,950
166
58,11131,70827,278
/
2,816
3,8742,1141,818
188
57,98532,11226,6083,322
3,8662,1411,774
221
61,63736,592'27,140
3,764
4,1092,4401,809, 251
64,07438,59627,045-
3,799
4,2722,5731,803
253
VCC.ATIoN1\L ED1
69,t94 +1.0 4,646 70,588 +1.3 4,706 70,743 +0.2 4,716 72,054 +1.9 '41,804 75,714 +5.1 5,048
.Busihess Ed .
Food Services441tb ServicesPilb1i[p SerVices
TeChnOlogieSOther
32,0275,020..7
.3,6196,883
22,04699
2,135334241459
1,4707
32,3955,3003,8936,73322,222
45
2,f60353260
4491,481
3
33,0275,2744,1076,801
21,426108
2,202352
274
, 453
1,4287
33,9134,6343,9656,724
22,650168
2,261309265448
1,51011
36,2894,9494,9836,250
23,139104
2,419330332.417
1,5437
NO* Due to rounding.; Course FTE may not always total,the sum.of the parts.
Z'orices: Oomputer Reports 3010, 3011; Offices pf the Deans of Instruction.
C
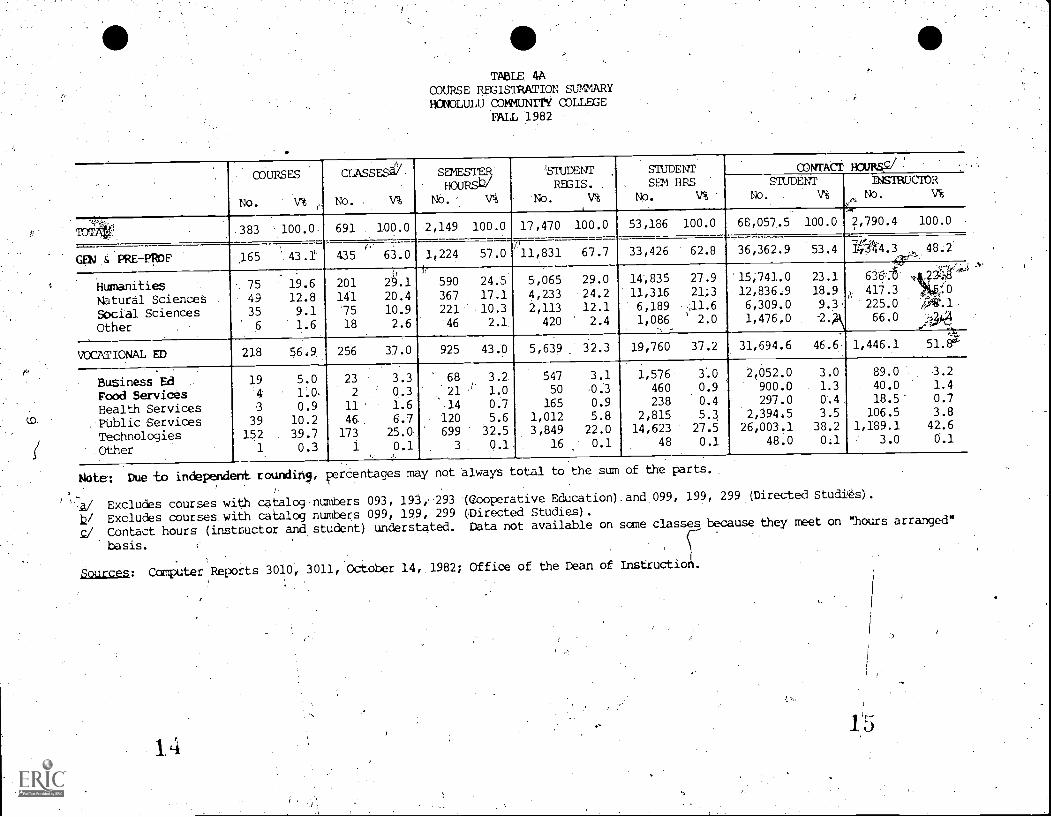
TABLE 4AODURSE REGIgDRATION SUMARYHONOLULU COMMUNITY ODLLEGE
FALL 1982
COURSES
No. V%
)
CLASSESIV.
No. . V%
SFE=NO. '. Vi
1STUDENTREGIS. ,
No. V%
SIUDERPSEM HRS
No. V%
CONTACT HOUBSciSTUDE14T
No. V%
INSIRUCIORNo. V%
-(\--
f0q. 383 ',100.0. 691 100.0 2,149 100.0 17,470 100.0 5,166 100.0 66,057,5 100.0 2,790.4 100.0
7)
GEN & PRE-PROF 165 ' 43.1' 435 63.0 1,224 57.0 '11,831 67.7 33,426 62.8 36,362.9 53.4 104.3 , 48.:2'
Humanities .. 75 19.6 201 2.1 590 24.5 5,065 29.0 14,835 27.9 '15;741.0 23.14,4121 , ,
636t4 42A8--
Natural Sciences 49 12.8 141 20.4 367 17.1 4,233 '24.2 11,316 21.3. 12,836.9 18.9 A 417.3 9.5_0
Social Sciences 35 9.1 '75 10.9 221 10.3 2,113 12.1 6,189 .;11.6
'
6,309.0 9.3 225.0 ./A1.1.
Other 6 -' 1.6 18 2.6 46 2.1. 420 2.4 1,086 2.0 1,476,0 -2.2,.\ 66.0 424.44
A-VOCATIONAL ED 218 56.9 256 37.0 925 43.0 5,639 32.3 19,760 37.2 31,694.6 46.6. 1,446..1 51.8'''
Business Ed 19 5.0 23 3.3 68 3.2 547 3.1 1,576 3.0 2,052.0 3.0 89.0 3.2
Food Services 4 1:0. 2 0.3 21 J, 1.0 50 .0.3 460 0.9 900.0 1.3 40.0 1.4
Health Services 3 0.9 11 1.6 14 0.7 165 0.9 238 0.4 297.0 0.4 18.5" 0.7
PUblic Services 39 10.2 46 6.7 . 120 5.6 1,012 5.8 2,815 5.3 2,394.5 3.5 106.5 3.8
Technologies 152 39.7 173 25.0 699 32.5 3,849 22.0 14,623 27.5 26,003,1 38.2 1,189.1 42.6
Other 1 0.3 1 0,1 3 0.1 16 0.1 48 0.1 48.0 0:1 3.0 0,1
d
Notel
ssai,
ti-c/
Due to independent rounding, percentages may not always total to the sum of the parts.
Excludes courses with catalog:numbers 093, 193' 293 '(cooperative Education).and 099, 199, 299 (Directed Studies).
Excludes courses with catalog numbers 099, 199, 299 (Directed Studies).
Contact hours' (instructor and student) understated. Data not available on some classes because they meet on !hours arranged"
basis.
Sources: ComPuter Reports 3010, 3011, October 14, 1982; Office of the Dean of Instructio
141)5
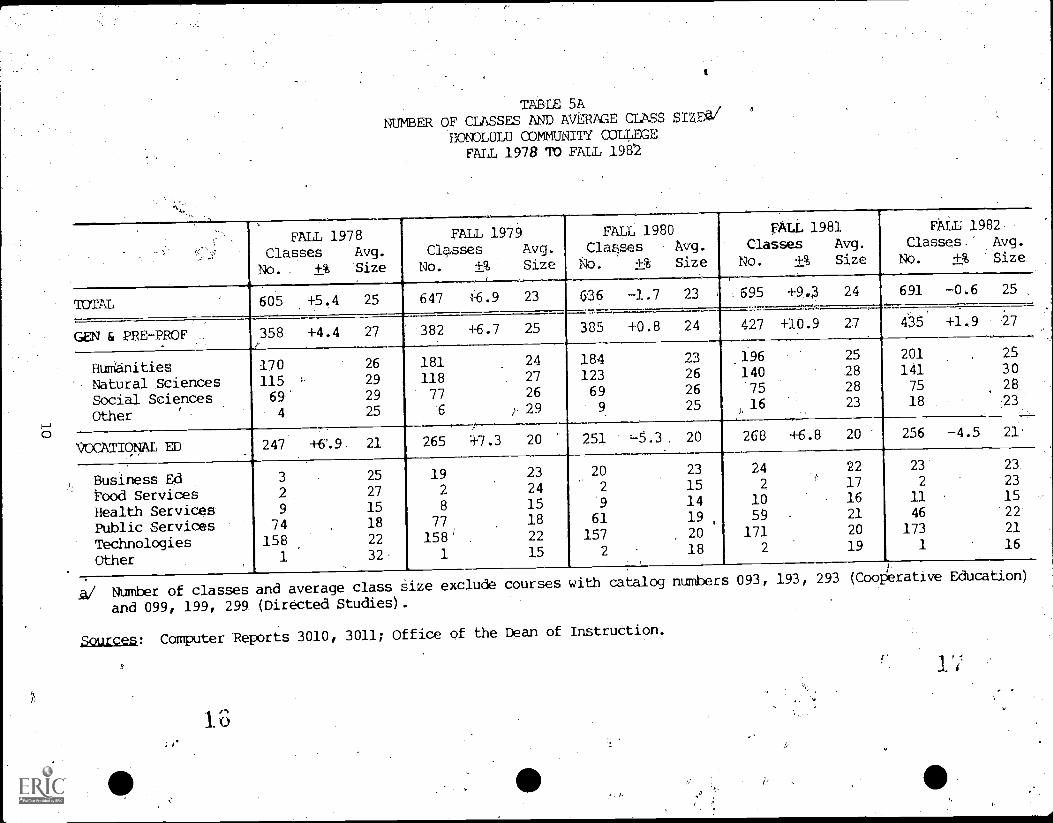
TAKE 5ANUMBER OF CLASSES AND AVERAGE CLASS SIZEIV
HONOLULU COMMUNITY COLLEGEFALL 1978 TO FALL 1982
FALL 1978Classes Avg.
No. . +% Size
FALL 1979Classes
No. +%
Avg.Size
FALL 1980Clases
No. +%
Avg.Size
FALL 1981ClasSes Avg.
No. +% Size
FALL 1982.
Classes." Avg.
NO. +% 'size.
TOTAL 605 +5.4 25 647 4.6.9 23 636 -1.7 23 695 +9.. 24 691 -0,6 25 :-
----GEN & PRE-PROF
..
358 +4.4 27 382 +6i, .7 25 385 +0.8 24 427 +109 27 4'35 +1.9 2.7
HuManities 170 26 181 24 184 23 _196 25 201 . 25
Natural Sciences 115 29 118 27 123 26 140 28 141 30
Social Sciences,
69 29 77 26 69 26 75 28 75 28.
Other 4 25 6 29 9 25 16 23 18 :23
, f___
VcaTiow ED 247 +6.9. 21 265 +7.3 20 251 L-5.3. 20 268 +6.8 20 256 -4.5 21;
Business Ed 3 25 19 23 20 23 24 22 23 23.
Food Services 2 27 2 24 2 15 2 17 2 23
Health ServiceS 9 15 8 15 '9 14 10 16 11 15
Public Services 74 , 18 77 18 61 19 59 21 46 '22
Technologies 158 22 158 22 157 20 171 20 173 21
Other 1 32- 1 15 2,
18 2 19 1 16
A/ Number of classes and average class Size exclude courses with catalog numbers 093, 193, 293 (CooPerative Education)
and 099, 199, 299 (Directed Studies).
Sources: Computer Reports 3010, 3011; Office of the Dean of InstruCtion.
1.3
1';
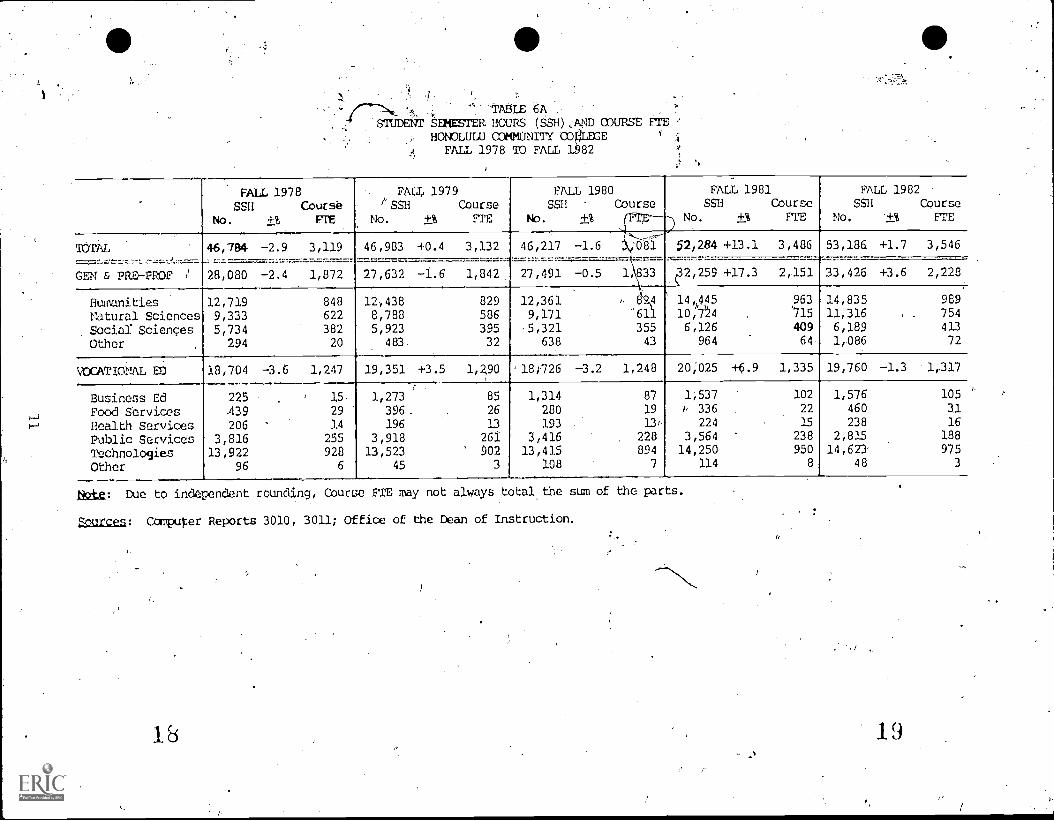
-- TABLE 6A4.0-IUDEINtr 'thiESTER HOURS (SSH) SAND ODURSE 17Ib
HONOLULU COMMUNITY COBLEGEFALL 1978 TO FALL 1982
FALL 1978SSH Cburse
No. +% FTE
FALL 1979/'SSB Course
No. +% FTE
FALL 1980SSB Course
No. (FIE--
FALLSSB
1981Course
+% FrE
FALL 1982SSB Course
No. '+% ETENo.
TOTAL 46,784 -2.9 3,119 46,983 +0.4 3,132 46,217 -1.6 ;081 52,284 +13.1 3,486 53,186 +1.7 3,546
GEN & PRE-PROF ; 28,080 -2.4 1,872 27,632 -1.6 1,842 27,491 -0.5 1,833 /32,259 +17.3 2,151 33,426 +3.6 2,228
Humanities 12,719 848 12438 829 12,361 , 8 4 14,1,445 963 14,835 989
Natural Sciences 9,333 '622 8,788 586 9,171 61 10,7'24 '715 11,316 . 754
. Social Sciences 5,734 382 5,923 395 -5,321 355 6,126 409 6,189 413
Other 294 20 483 32 638 43 964 64 1,086 72
VOCATIONAL ED 18,704 -3.6 1,247 19,351 +3.5 1,290 '14726 -3.2 1,248 20025 +6.9 1,335 19,760 -1.3 1,317
Business Ed 225 15 1,273 85 1,314 87 1537 102 1,576 105
Food Services 439 29 396. 26 280 19 b 336 22 460 31
Health Services 206 14 196 13 193 13y 224 15 238 16
Public Services 3,816 255 3,918 261 3,416 . 228 3,564 238 2,815 188
Technologies 13,922 928 13,523 902 13,415 894 14,250 950 14,621 975
Other 96 6 45 3 108 7 114 8 48 3
Due to independent rounding, Course Els may not always total,the sum of the parts.
Sources: Compqer Reports 3010, 3011; Office of the Dean of Instruction.
18 19
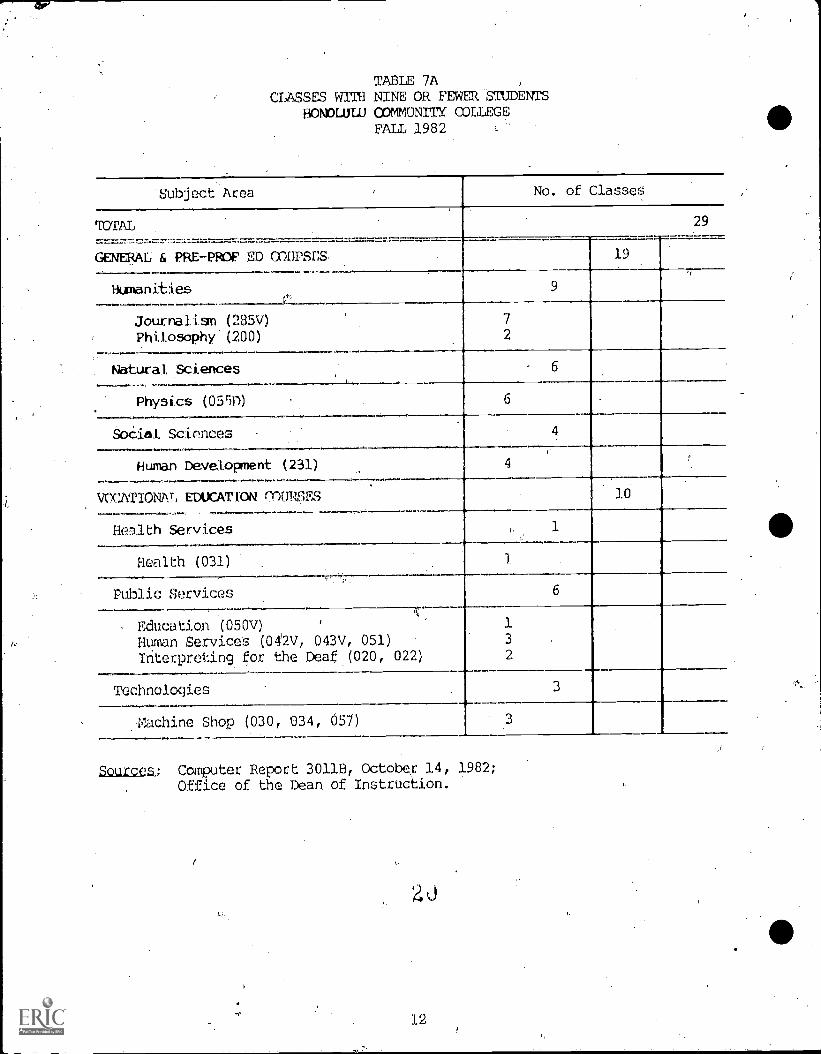
TABLE 7ACLASSES W1TU NINE OR FEWER STUDENTS
HONOLULU COMMUNITY COLLEGEFALL 1982
Subject Area , No. of Classes
TOTAL 29
GENERAL & PRE-PROF ED (MOSES 19
Humanities(6
9
,
Journalism (285V)Philosophy (200)
7
2
Natural. Sciences: 6
Physics (05911) , 6
SaCiat Sciences 4
Hunan Development (231) 4,
VOCATION/0'1 EDUCATION rnURSES-
10
He31th Services 1
Health (031) 1
Public Services 6
-07---
, Education (050v) ,
Human Services (042v, 043V, 051)Interpreting for the Deaf (020, 022)
13
2
Technologies 3
-
Vachine Shop (030, 034, 057) 3
sources; Computer Report 301113, October 14, 1982;Office of the Dean of Instruction.
12
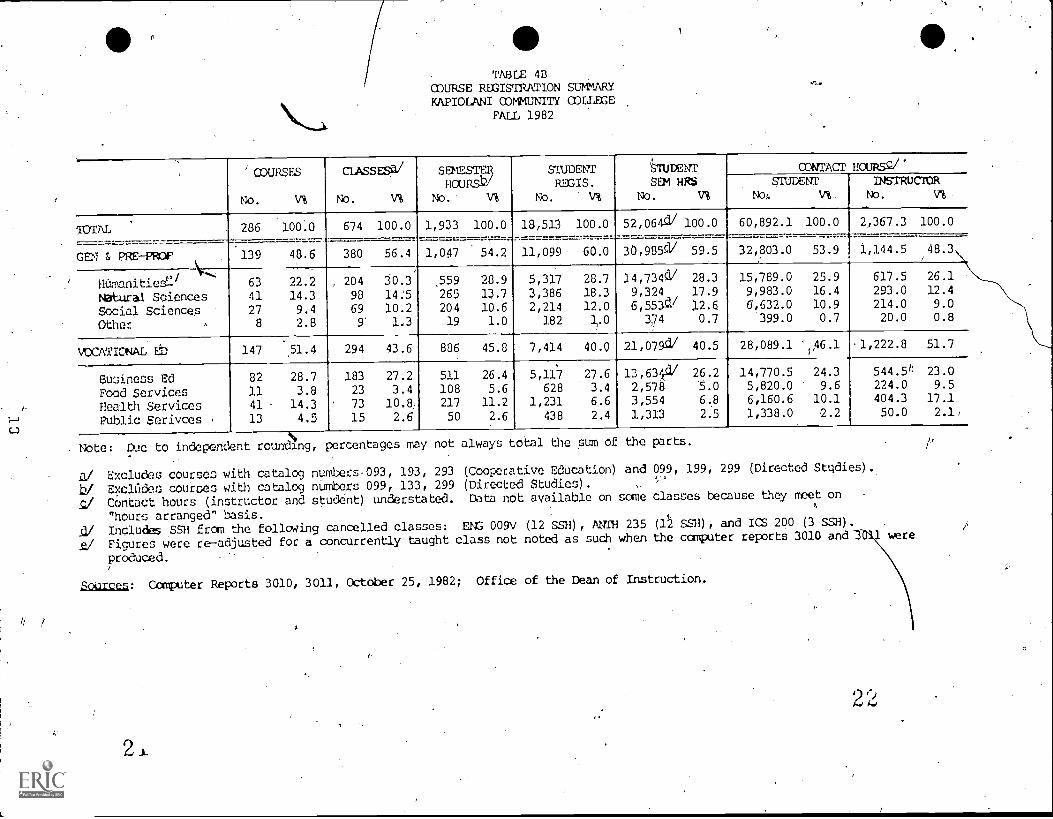
TAaLE 4BCOURSE REGISTRATION SUMMARYKAPIOLANI ODMMUNITY COI,LECE
PALL 1982
,
'COURSES
No. V%
CLASSES.a/
No. V%
SDESTRHOMO&
No. VI
STUDENTREGIS.
No-. V%
itSTUDEIR
SEM HRSNo. V%
CONTACT HOURSQ/-STUDENT
NO VI-
INSTRUCTORNo. v%
TOTAL------
286 100.0 674 100.0._
1,933 100.0 18,513 100.0 52,064d/ 100.0
.-
60,892.1 100.01
2,367.3 100.0
r
GEN & PRE-PROP
\'"'°-
139 48.6_.
380 56.4 1,047 54.2 11,099- 60.0 30,985d/ 59.5 32,803.0 53.9 1,144.5 48.3,
p/11 Umanities-
Natural SciencesSocial SciencesOther ,
63
41
278
22.2
14.39.4
2.8
, 204
98
69
9'
,
30.314:510.21.3
.559
26520419
20.913.7
10.6
1.0
5,3173,3862,214
182
28.718.3
12.01.0
14,734d/9,324
6,553d/374
28.3
17.9
12.60.7
15,789.09,983.0
0,632.0399.0
25.916.410.90.7
617.5293.0214.020.0
26.112.49.00.8
VCCATIONAL Lb 147 51.4 294 43.6 806 45.8 7,414 40.0 21 075d/ 40.5 28,089.1 46.1r
.1,222.8 51.7
Business EdFood ServicesHealth Service8Public Serivces ,
82
1141
13
28.73.8
14.34.5
18323
7315
27.23.410.81
2.6
511108217
50
26.4
5.611.2
2.6
,
5,117628
1,231438
27.63.46.6
2.4
13,63e/2,573,554
1,313
26.25.06.8
2.5
14,770.55,820.06,160,61,338,0
24.39.6
10.12.2
54451224.0404.350.0
23.09.5
17.12.1,
. Nete: Due to independent rounding, percentages may not always total the sum of the parts.
ExcludeS Courses with catalog numbers-093, 193, 293
b./ ExclOdes courses with catalog numbers 099, 133, 299
g/ Contact hours (instructor and student) understated.
"hours arranged" basis.
91/ Includes SSH from Ehe following cancelled classes:
.c./ Figures were re-adjusted for a concurrently taught
produced.
igkillzta: Computer Reports 3010, 3011, October 25, 1982; Office of the Dean of Instruction.
(Cooperative education) and 099, 199, 299 (Directed Stildies)..
(Directed Studies).Data not available on some
ENG 009v (12 SSH), ANTH 235class not noted as such when
classes because they meet ona
(1:2 Sal), and ICS 200 (3 Sal).the computer reports 3010 and aere
/
, '
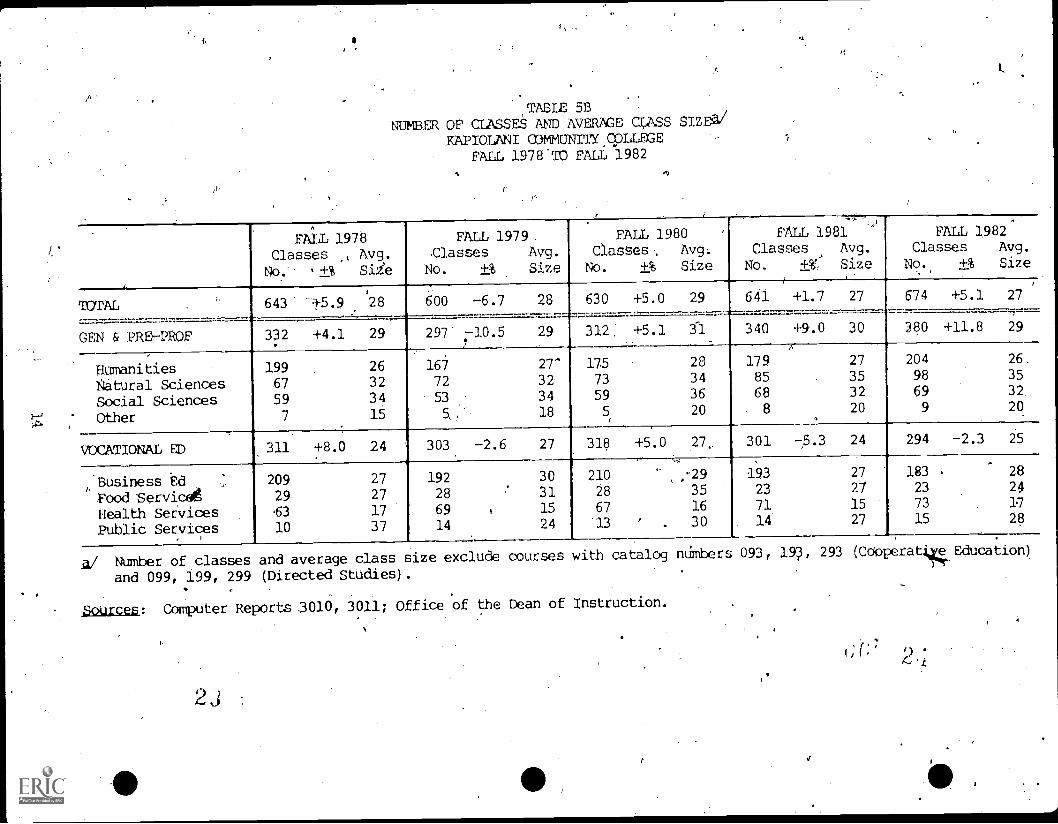
TABLE 5BNOMBER,OF CLASSES AND AVERAGE CLASS SIZEa"
KAPIOLANI COMMUNITY QOLLEGEFALL 1978-TO FALiJ 1982
11
.
FAIL 1978Classes ,, Avg.
No. +% Siie
FALL 1979.Classes Avg.
No. +% Size
.
FALL 1980 ^
C1asSes , Avg;
No. +% Size
-.7.--7..-
FALL 1981Classes Avg.
No. +W: Size
FALL 1982Classes Avg.
No.
. +% Size,
Timm,,
643 1-5.9.
28 600 -6.7 28 630 +5.0 29 641 +1.7 27 674 +5.1 27
GEN & PRE-PROF 332 +4.1 29 297 -10.5 29 312, +5.1 31
____
340 +9.0 30 380 +11.8.
29
Hu manitiesNatural SciencesSocial SciencesOther
19967
59
7.
26323415
,
16772
53
5, ,
27^
323418
175
73595
,.
28
3436
20
17985
688
A
27
35
3220
20498
699
26.
35
3220
VOCATIONAL ED 311 +8.0 24 303 -2.6 27
303115
24
318
210
28
67
13
+5.0.,,
' .
27.
-29
3516
30
301
19323
7114
-5.3 24
27
27
1527
294
183
23
7315
-2.3
.
.
25
28
24
1728
/.
'Business Edfbod Service,Health ServicesPublic Services
209
29.63
10
2727
17
37
19228
6914
''
,
al Number of classes and average class size exclude courses with cat-alog ndmbers 093, 19, 293 (Cdoperatducation)
and 099, 199, 299 (Directed Studies).
LOUrceB: Computer Reports 3010, 3011; Office of the Dean of Instruction.
2J
tf
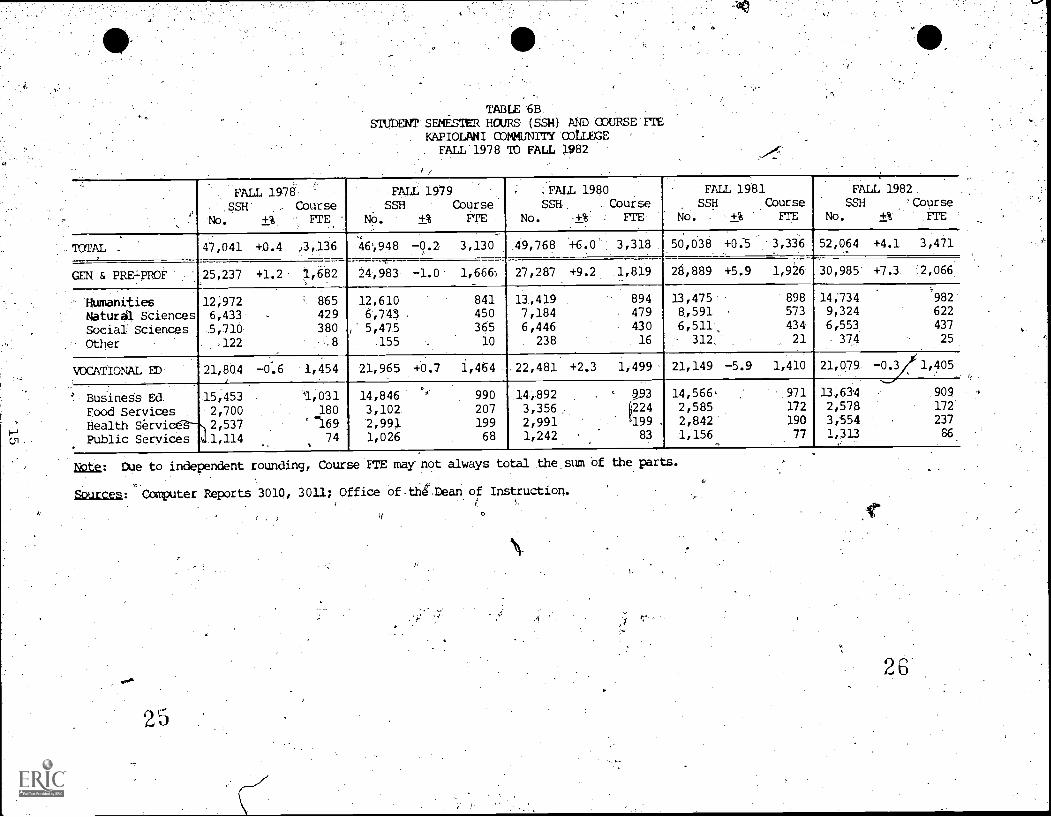
TABLE 6BSTUEENT SEMESTER KERS (SSH) AND:COURSE FrE
KAPIOLANI COMMUNTTY COLLEGEFALL 1978 TO FALL 1982
_
FALL 1978
SSH CourseNo +% FIE.
FALL 1979SSH Course
NO. +% vil,
. .FALL 1980SSH Course
No. +% VrE
FALL 1981SSH Course
No. +% kit.
FALL 1982SSH
No.
'Course
TOTAL - 47,041 +0.1 )3,136 46,918 -0.2,
3,130 49,768 +6.0 3,318 50,038 +0:5 3,336 52,064.
+4.1 3,471
GEN & PRE-PROF 25,237 +1.2 1,682 24,983 -1.0 1,666 27,287 +9.2 1,819 28,889 +5.9 1,926 30,985 +7.3 2,066
,
Humanities 12,972 865 12,610 841 13,419 894 13,475 898 14,734 982
Natural Sciences 6,433 429 6,743 450 7,184 479 8,591 573 9,324 622
Social Sciences 5,710 380 , 5,475 365 6,446 430 6,511 434 6,553 437
Other 122 8 155 10 238 16 312 21 374 25
VOCATIONAL ED 21,804 -0.6 1,454 21,965 +0.7 1,464 22,481 +2.3 1,499 21,149 -5.9 1,410 21,079 -0.3 1,105
Business Ed 15,453 '1,031 14,846 990 14,892 - 9 3 14,566 971 13,634 909
Food Services 2,700 180 3,102 207 3,356 224 2,585 172 2,578 172
Health Servi 2,537 169 2,991 199 2,991 199 . 2,842 190 3,554 237
Public Services 1 1,114 74 1,026 68 1,242 83 1,156.
77 1,313 86
Nste: Cue to independent rounding, Course FTE may not always total the sum of theperts.
5ourcea: Computer Reports 3010, 3011; Office of-thtDean of Instruction.
0
2 6
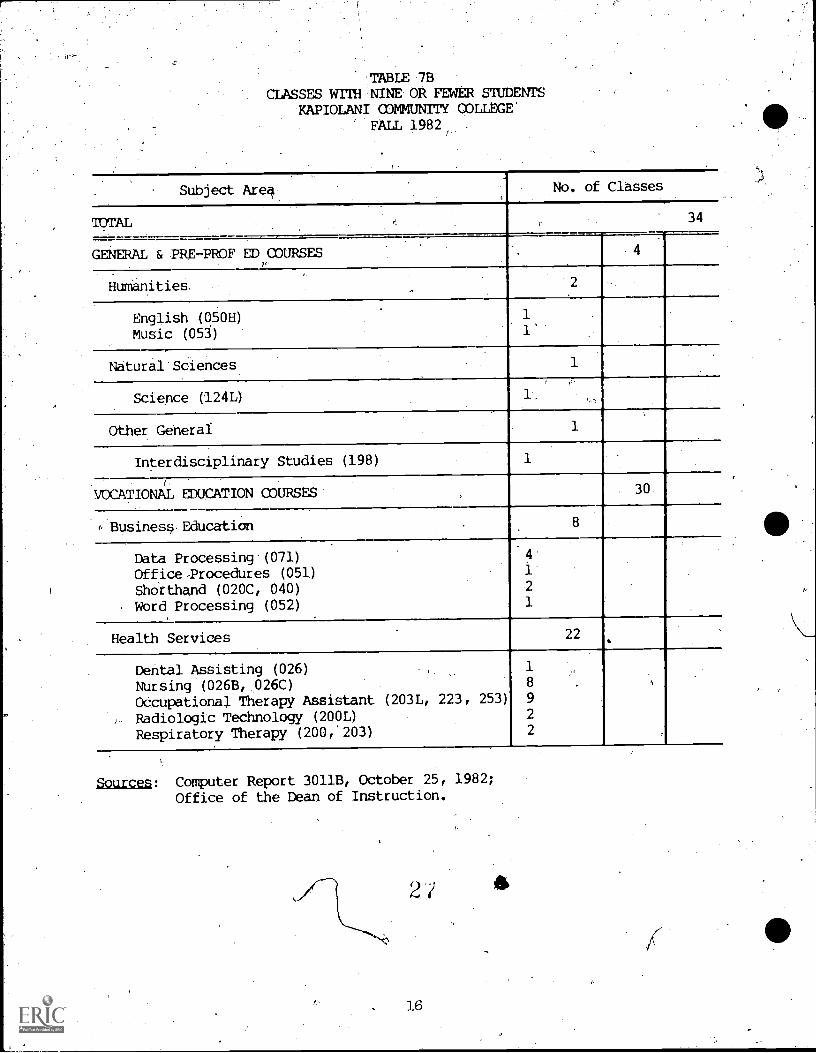
TABLE .713
CLASSES WITH NINE OR FEWER STUDENTSKAPIOLANI COMMUNTTY COLLEGE'
FALL 1982,
Subject Area No. of Classes
TOTAL 34
GENERAL &PRE-PROF ED COURSESP
4
Humanities. 2
English (050H)Music (053)
Natural Sciences 1
Science (124L) 1.,
Other General 1
Interdisciplinary Studies (198)
VOCATIONAL EDUCATION COURSES ,
. 30
P.Business, Education .
Data Processing (071)Office,Procedures (051)Shoithand (020C, 040)
- Word Processing (052)
4-
1'
2
1
.
Health Services 22
Dental Assisting (026)NUrsing (026B, 026C)OCcupational Therapy Assistant (203L,
,.. Radiologic Technology (200L)Respiratory Therapy (200,203)
223, 253)
1
8
9
2
2
,Sources: Computer Report 3011B, October 25, 1982;Office of the Dean of Instruction.
2 /
16
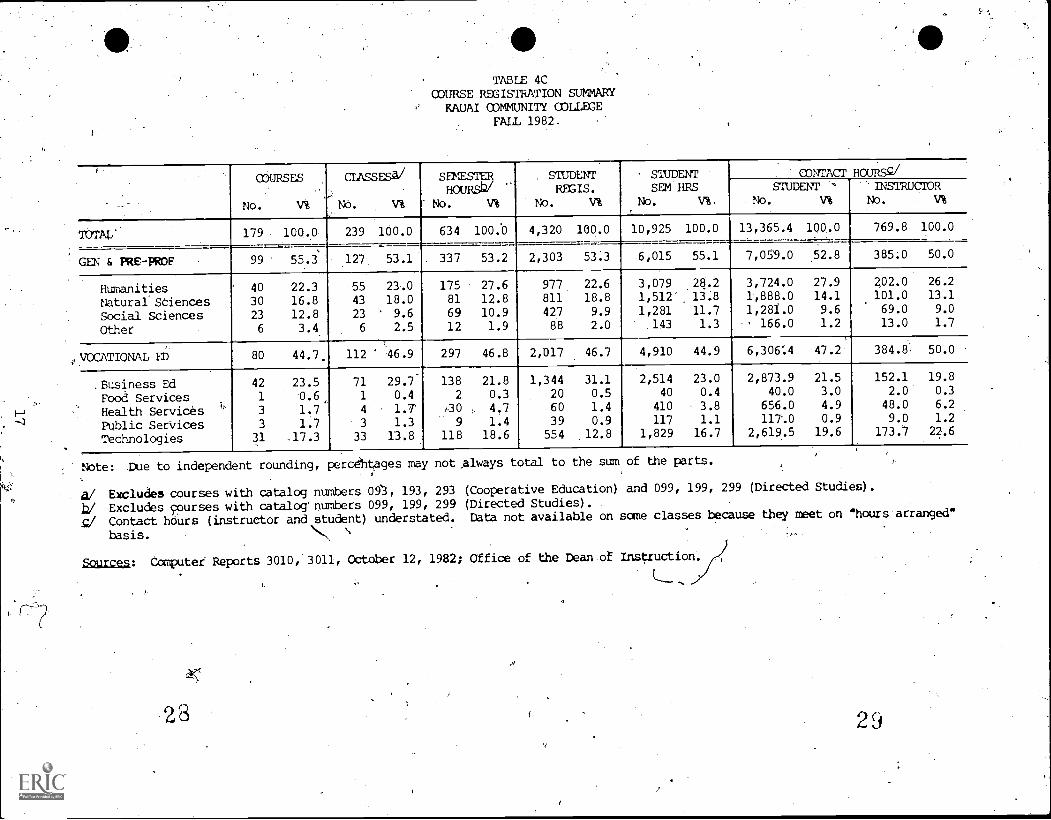
TABLE 4CODURSE REGISTRATION SUMMARY
KAUAI ODMMUNrrY COLLEGEFALL 1982-
COURSES
No. V%
CI1\SSES4/
NO. V%
SEMESTERHOURSb/
No. V%
STUDENTREGIS.
No. V%
STUDENTSEM'BRS
No. WCONTACT HOURSC/
STUDENT "
No. V%-DINSTRU4URNO. V%
TOTAL' 179 100.0 239 100.0 634 100:0 4,320 100.0 10,925 100.0 13,365.4 100,0 .769.8 100.0
.
GEN & PRE-PROF 99 55.3 127, 53.1 337 53.2 2,303 53,3 6,015 55.1 7,059.0 52.8 385;0 50.0
Humanities 40 22.3 55 21.0 175 27.6 977. 22.6 3,079 .213.2 3,724.0 27.9 202.0 26.2
Natural SCiences 30 16.8 43 18.0 81 12.8 811 18.8 1,512' 13.8 1,888.0 14.1 101.0 13.1
Social Sciences 23 12.8 23 ' 9.6 69 10.9 427 9.9 1,281 11.7 1,281.0 9.6 69.0 9.0
Other 6 3.4 6 2.5 12 1.9 88 2.0 .143 1.3 -, 166.0 1.2 13.0 1.7
,
, .
,
VOCATIONAL ED 80 44.7. 112 ' 46.9 297 46.8 2,017 46.7 4,910 44.9 6,3064 47.2 384.8.v 50.0
.Business Ed 42 23.5 71 29.7 138 21.8 1,344 31.1 2,514 23.0 2,873.9 21.5 152.1 19.8
Food Services 1 D.6, 1 0.4 2 0.3 20 0.5 40 0.4 40.0 3.0 2.0 0.3
Health Services4.
3 1.7 4 1.1' ,30 , 4,7 60 1.4 410 3.8 656-.0 4.9 48.0 6.2
Public SerVices 3 1.7 3 1.3 9 1.4 39 0.9 117 1.1 117.0 0.9 9.0 1.2
Technologies 31 _17.3 33 13.8 118 18.6 554 12.8 1,829 16.7 2,619.5 19.6 173./ 22.6
Note: lice to independent rounding, perc4htages may not always total to the sum of the parts.
a/ Excludes courses with catalog numbers On, 193, 293 (Cooperative Education) and 099, 199, 299 (Directed Studies).
b./ Excludes courses with catalog' numbers 099, 199, 299 (Directed Studies). .
g/ Contact hOurs (instructor and student) understated. Data not available on sone Classes because they meet On "hours arranged"
basis.
Sources: Computer Reports 3010, 3011, October 12, 1982; Office of the Dean of Instruction.
28

TABLE 5CNUMBER OF CLASSES AND AVERAGE CLASS SIZEgi
KAUAI COMMVNITY COLLEGEFALL 1978,TO FALL 1982
'FALL 1978Classes Avg.
, No. +% Size
FALL 1979Classes Avg.
No. +% Size
FALL 1980Classes Avg.
No. +% Size
FALL 1981 .
Classes Avg.
NO. +% Size
FALL 1982Classes Avg.
No. +% Size
-
TOTAL 244 +8.4 19 238 -2.5 19 222 -6.7 18 249 +122 : 17 239 -4.0 18
GEN & PRD-PROF 132 +10.9 19 134 +1.5 19 117 -12.7 19 129 +10.3 , 19 127 -1.6 18
-
Humanities 66 18 70 18 54 18 61 18 55 \18
'Natural Sciences 39 18 39 18 37 17 .41 19 43 19
,Gocial ScienCes 24 28 19 24 '22 25 19 24 23 19
Other 3?
17 , 6.
14 4 121. 8 13 6 12
VOCATIONAL ED 112 +5.7 18 104 -7.1 20 105 +1.0, 18 120 +14.3 '16 112 -6.7 18
-t
Business Ed 57 21 59 24 62 20 75 17. 71 19
Food Services 4 10 . 2 7 3 10 A 14 1 , 20
Health Services4 . 15
Public Services 4 33 # 28 4 21 6 10 3 13
Technologies 47 14 39 15 36 13 35 15 33 17
A/ NUmber.of classes and average class size exclude courses with catalog numbers 093, 193,. 293 (Cooperative Education)
and 099, 199, 299 (DireCted Studies).
3Ources:. Computer Reports 3010, 3011; Office of the Dean of InstrOctiOn.
(JO

TABLE 6c ,STUDENT SEMESTER HOURS (SSH) AND COURSE PrE
KAUAI COMMUNITY COLLEGEFALL 1978 TO FALL 1982
,
.
, ,
FALL 1978SSH
No. +%Course
FTE
FALL 1979SSH
No. +%Course
VI%
FALL 1980.
SSHNo. :+%
CourseFTE
FALL 1981SSH
No. +%CourseFa
FALL 1982SSH ,
No. +%
Course.
TOIAL 10,894 -8.9 -726 10,424 -4.3 695 9,732 -6.6 649 10,424 +7.1 695 10,925 +4:8 728.
--GEN L. PRE-PROr. 6,354 '712.1 424 5,952 -6.3 397 5,463 -8.2 364 5,972 +9.3 398 6,015 +0.7 401
HumanitiesNatural SciencesSocial SciencesOther
2,9391,4131,938
64
196
94
129
4
3,1721,3291,344
107
211
.
89
\ 907
2,5021,2181,644
99
167
81
1097
3,1221,4581,266
126
208
97
85
8
3,0791,512
1,281143
,
205
10185
10
VOCATIONAL ED 4,540 -4.1 _ 303 ,4,472 -1.5 298 4,269 -4.5 285 4,452 +4.3 297 4,910 +10.3 ' 327
Business EdFood ServicesHealth ServicesPublic ServicesTechno1ogies"
1,869392
3931,886
6 140
2,254
.
26 1 336126 1,742
1509
23
116
2,282310
2521;425
152
21
17
95
2,367370
159.1,556
1584
11
104
2,514
40
410
117
1,829
' 168
3
27
122
hvie: Due to independent rounding, Course FTE may not:Ialways total the sum)of the parts.
LOPUIC'ea: Computer Reports 30104 3011; Office of the Dean of Instruction:
3
:3
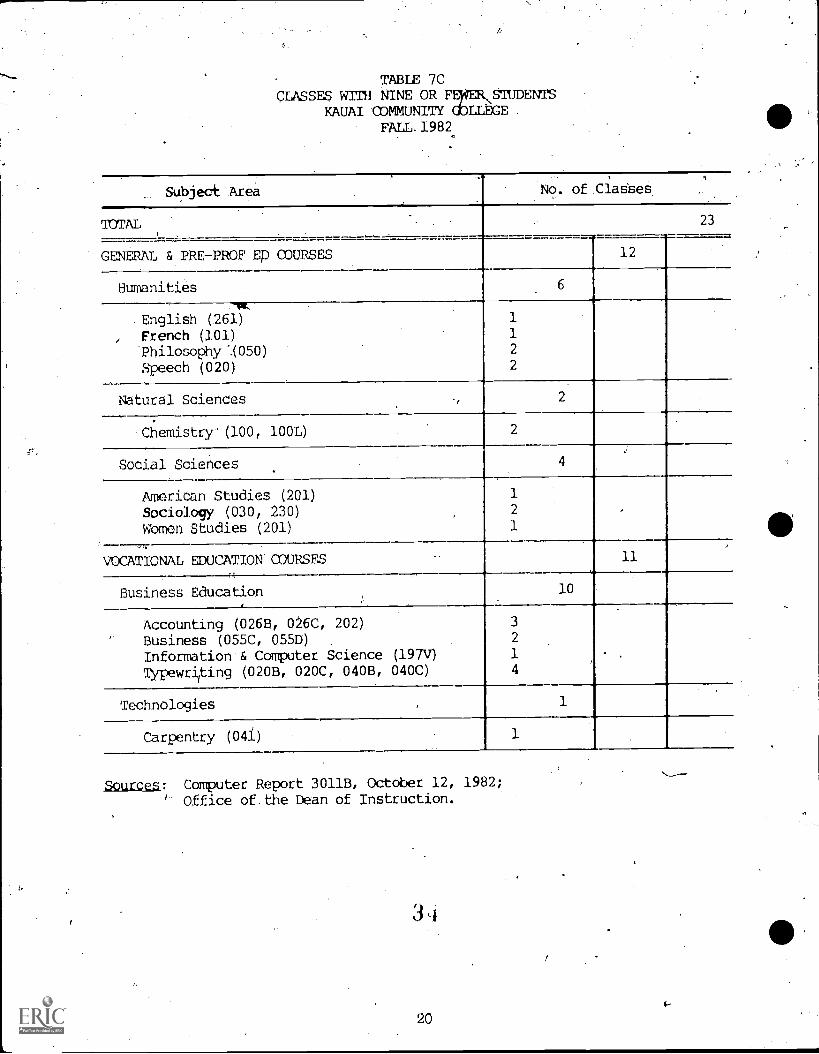
TABLE 7CCLASSES WITH NINE OR FOfiER,STUDENTS
KAUAI COMMUNITY ODLLEGEFALL.1982
.
_ Subject Area...
No. of .ClaSses.
._
TOTAL.
23
GENERAL & PRE-PROF Ep COURSES 12
Humanities 6
-w, .
. English (261) 1
, French (101) 1
'Philosophy ,(050) 2
Speech (020) 2-
Natural Sciences ., 2
,
Chemistry- (100, 100L) 2
,
Social ScienceS 4.
.
American StUdies (201) 1
Sociology (030, 230) ,
2 .
Women Studies (201) 1
----,--,_. ,
VOCATIONAL EDUCATION COURSES.. 11
Business Education 10,
Accounting (026B, 026C, 202) 3
' Business -(055C, 055D) .
2
Information& Computer Science (197V) 1
Typewrifting (020B, 020C, 040B, 040C) 4.
,
Technologies ,1
Carpentry (04i) 1
Zeurces: Computer Report 3011B, October 12, 1982;
' Office of.the Dean of Instruction.
3,i
20f-
r
.
,.
.
.
.
III
, .
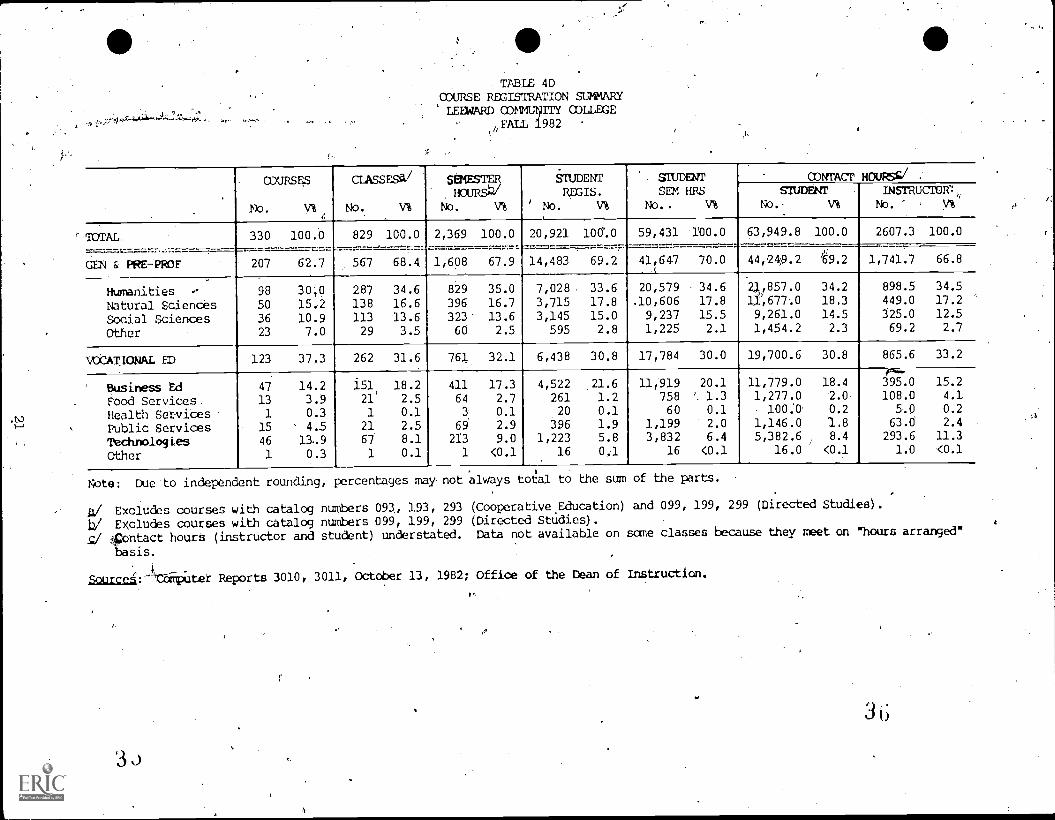
TABLE 4DCOURSE REGISTRATION SUMMARYLEEWARD COMMUNITY COLLEGE
' FALL 1982 ..,If,
,f,
*. .
.
_,
.
.
.
COURSES
No. v%4
CLASSE9al
NO. V%
stmEsTERHCURSb/
NO . V%
'STUDENT
RpcIs.
' No. V%
'. STUDENTSEm HRS
No.. V%
CONTACT HOURSA/STUDENT
No.- V%-
1N5TRUCWR%,,NO.
tTaTAL. 330 100.0 829 100.0.
2,369 100.0 20,921 100%0 59,431 1t0.0 63,949.8 100.0 2607.3 100.0
r
GEN & PRE-PROF 207 62.7 567 68.4 1,608 67.9 14,483 69.2 41,647 70.0.c
44,249.2 t9.2 1,741.7 66.8
Humanities .- 98 3001.
287 34.6 829 35.0 7,028 33.6 20,579 34.6.
21,857.0 34.2.
898.5 34.5
Natural Sciences 50 15:2 138 16.6 396 16.7 3,715 17.8 ,10,606 17.8 11,677.0 18.3 449.0 17.2
Social Sciences 36 10.9 113 13.6 323 13.6 3,145 15.0 9,237 15.5 9,261.0 14.5 125.0 12.5 ,
. Other 23 7.0 29 3.5 60 2.5 595 2.8 1,225 2.1 1,454.2 2.3 69.2 2.7
,
WCATIONAL ED 123 37.3 262 31.6 761 32.1 6,438 30.8 17,784 30.0 19,700.6 30.8 865.6 33.2
Business Ed 47 14.2 151 18.2 411 17.3 4,522 21.6 11,919 20.1 11,779.0 18.4 395.0 15.2
Food Services 13 3.9 21 2.5 64 2.7 261 1.2 758 '. 1.3 1,277.0 2.0 108.0 4.1
.tvHealth Services 1 0.3 1 0.1 3 0.1 20 0.1 60 0.1 1000. 0.2 5.0 0.2
Public Services 15 4.5 21 2.5 69 2.9 396 1.9 1,199 2.0 1,146.0 1.8 63.8 2.4
Technologies 46 13..9 67 8.1 213 9.0 1,223 5.8 3,832 6.4 5,382.6 , 8.4 293.6 11.3
Other 1 0.3 1 0.1 1 <0.1 16 0.1 16 <0.1 16.0 <0.1 1.0 <0.1
. ,
Note: Due-to inderendent rounding, percentages may not always toLl to the sum of the parts.. .
.a/ Excludes courses with catalog numbers 093, 193, 293 (Cooperative.Education) and 099, 199, 299 (Directed Studies).
b/ Excludes courses with catalog numbers 099, 199, 299 (Directed Studies).
g/ 4pontact hours (instructor and student) understated. Data not available on same classes because they meet on 'hours arranged'
basis,.
'; i,5Diarse:----tbirtpiiter Reports 3010, 3011, October 13, 1982; Office of the Dean of Instruction.
,.,
,
,
'
L , ,
, .
,.,
.
,
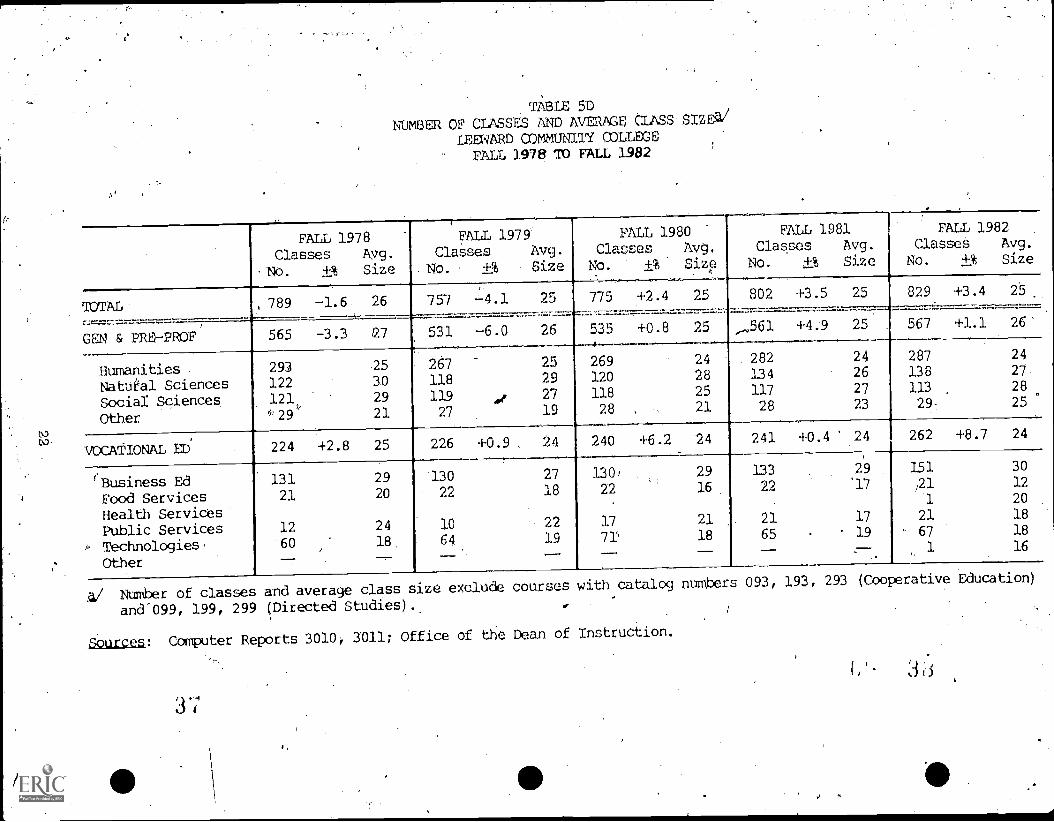
TA'BLE 5D. NUMBER OF CLASSES AND AVERAGE CLASS SIZEa/
LEEWARD OOMMUNITY ODLLEGE.
,
FALL 1978 TO FALL 1982
..
FALL 1978 FALL 1979 FALL 1980 FALL 1981 FALL 1982
Classes Avg. Classes Avg. Classes Avg. Classes Avg. Classes Avg.
No. +% Size No. +% Size No. +% Size No. +% Size No. +% Size
TDTAL , 789 -1.6 26 757 -4.1 25 775 +2.4 25 802 +3.5 25 829 +3.4 25
-.
.
---GEN & PRE-PROF 565 -3.3 27 531 -6.0 26 535 +0.8 25 561 +4.9 25 567 +1.1 26'
Humanities 293 25 267 25 269 24 282 24 287 24
Natuhl Sciences 122 30 118 29 120 28 134 26 138 27
Social Sciences 121 29 119 #4, 27 118 25 117 27 113 28
toN.)
Other ''29 21 27 19 28 21 28 23 29- 25
.
VOCA tIONAL ED 224 +2.8 25 226 +0.9 . 24 240 +6.2 24 241 +0.4 24 262 +8.7 24-'Business Ed 131 29 130 27 130' 29
,
133 29 151 30
Food Services 21 20 22 18 22 16 22 17 21 12
Health Services1 20
Public Services 12 24 10 22 17 21 21 17 21 18
i, Technologies, 60 18 64 19 71 18 65 19 67 18
Cther-- -- -- ---- 1 16
A/ Number of classes and average class size exclucie courses with catalog numbers 093, 193, 293 (Cooperative Education)
and-099, 199, 299 (Directed Studies).,
.15ources: Computer Reports 3010, 3011; Office of the Dean of Instruction.
,.
.
36
.
3 Pi',
,
. ,
1

TABLE 6DSTUDENT SEMESTER HOURS (SSH) AND COURSE.lat;
-LEEWARD COMMUNITY COLLEGEFALL 1978'TO SALL 1982 f
FALL 1978''
SSHNo. -., -IA
Coursei 'FALL 1979
SSH CourseNo. +% PrE
FALL 1980SSH
No. +%
Course1TE
FALL'1981SSH
. No: +%Course.
i.i.1
FALL 1982SSH 'Course
No.. +% Fa,Y.i.T.
d.
TOTAL 58,639.
,-5.5 3,909 54,507A/ 7.0 3,634. 54,069' L0.8 3005 57,746 +6.80 3,850 59,431 +2.9 3,962
--
GEN & PRE-PROF 43,837 -,8.1 2,922 40,124 -8.5 2,675 38,812 -3.3 2,587 41,117 +5.9 2,741 41,647 +1.3 2,776
Humanities 211,773 1,452 ,19,571 1,305 19,068 1,271 20,329 1,355 20,579 1,372
Natural Sciences 10,449 697; 9,828 "655 9,670 645., 10,119 '675 10,606 707
Social ScienCes 10,398 693 9,591 639 8,782 "- 585 9,332 622 9,237 - 616
Other --r- 1,217 81 1,134 76 1,292 ,. 86 1,337 89 1,225 - 82
VOCATIONAL ED. 14,802 +3.3 987 14,381 -2.8 959 15,257 +6.1 1,017. 16,629 +9.0 1,109 17,784 +7.0 1,186
Business Ed 9,400 627 8,903 593 9,407 627 10,439 696 11,919 795
Food Services 1,199. , 80 .1,164 78 962 64 1,031 69 758 51
Health Services r 60 4
joublic Services 830 55 642 43 1,171 78. 1,139 76 1,199 80
'Technologies 3,373 225 3,672 - 245 3,717 ,248 4,020 268 5,832 255
Other. , -- ---. -- -- -- -- -- .16 1
Note: Due to independent rounding, Course. V.1% may not always total the sum of the parts.
A./ Includes 2 Sas for a course in "Other Vocational Education" Which was cancelled.
,Sources: Computer Reports 3010, 30117 Office of:the Dean'of Instruction.

TABLE 7DCLASSES wrrH NINE OR FEWER.SIUDENIS
LEEWARD COMMUNrTY COLLEGEFALL 1982
Subject Area ,No. of Classes
TOTAL le
.......-
GENgRAIL & PRE-PROF ED COURSES 10 ,
Humanities" 5
/; Art (114)
Hawaiian (101)Music (203D, 216)Spanish (1021
r1
1
2
1
,
,
Natural.Sciences, 3
Geology-Geophysics (101)Microbiology (130L) _Oceanography (230)
1
1
1
,
.
.
Social Sciences 1.
.
Social Sciences (2901) 1,
Other General , 1
Interdisciplinary StudieS(105) , 1
VOCATIONAL EDUCATION COURSES. 8
Business Education,
Office Procedures (050)
Food Services 4
Food Services (052, 060) 4
Technologies 3
Marine Technologie8 (036, 042, 046) 3
Zourges: Computer Report 3011B, October 14, 1982;Office of the Dean of Instruction.
1124

TABLE 4E'ODURSE REGISTRATION SUMMARY
MAUI ODMMUNITY ODLLDGEFALL,1982
.
, ODURSES,,.
No. V%
CIASSESA/
No. V%
SX1tEj=
No. V%
STUDENTREGIS.
NO. V%
.
SZUDENiSEM HRS
No.
COMACTAIOURSC/INSTRUCTOR
No. V%
STUDENTNo. V% .
!MAL 273 100.0 381 100:0 1,009 100.0 7,855 100.0 19,559 100.0 22,427.0 100.0 1,213.8 100.0
GEN 4 40RE-PROF, 127 46.5 194 50.9 483 47.9 4,125 52.5 10,112 51.7 10;327.4 46.0 484.2 39.9
,
Humanities 55 20.1 93 24.4 250 24.8 1,846 23.5 5,090 26.0 5,543.4 24.7 278.4 22.9Natural Sciences 35 12.8 53 13.9 124 12.3 1,263- 16.1 2,652 13-.6 2,172.0 9.7 85.0 7.0Social Sciences , 18 6.6 26 6.8 79 7' 7.8 625 8.0 1,875 9:6 1,869.0 .8.3,- 78.0 6.4Other 19. 7.0 22 5.8 30 3.0 391 54 495 2.5 743.0 3.3 42.8 3.5
VOCNTIONAL ED 146 53.5 187 49.1 526 52.1 3,730 47.5 9,447 48.3 12,099.6 54.0 729.6 60.1
Business Ed 57 20.9 93 24.4 197, 19.5 2;199 28.0 4,525 23.1 4,760.9 21.2 207.0 17,1Food Services . 11 4.0 , 16 4.2 64 6.3 318 4.0 1,113 5.7 2,010.4 9.2 127.0 10.5Health Services 9 3.3 i 10 2.6 45 4.5 175 2.2 721 3.7 1,188.5 5.3 93,0 7.7Public Services 18 6.6 14 3.7 43 4.3 260 3.3 722 3.7 654.0 2.9. 36.8 3.0Tlachnologies 50 18.3 53 13.9 174 17.2 764 9.7 2,326 11.9 3,425.8 15.3 .265.8 21.9Other 1 0.4 1 03 3 0.3 14 0.2 40 0.2
Note: Due to independent rounding, percentages may not always tat,a1 to-the sum of -the parts.
a/- Excludes courses with catalog numbers 093, 193, 293 (Cooperative Education) and 099, 199, 299 (Directed Studies).IV Excludes courses with catalog numbers 099, 199, 299 '(Directed Studies).
Contact hours (instructor and student) understated. Data not available on same classes because theY meet on "hours arranged!basis.
SCurcea: Computer Reports 3010, 3011, October 13, 1982; Office of the Dean of instruction.
43
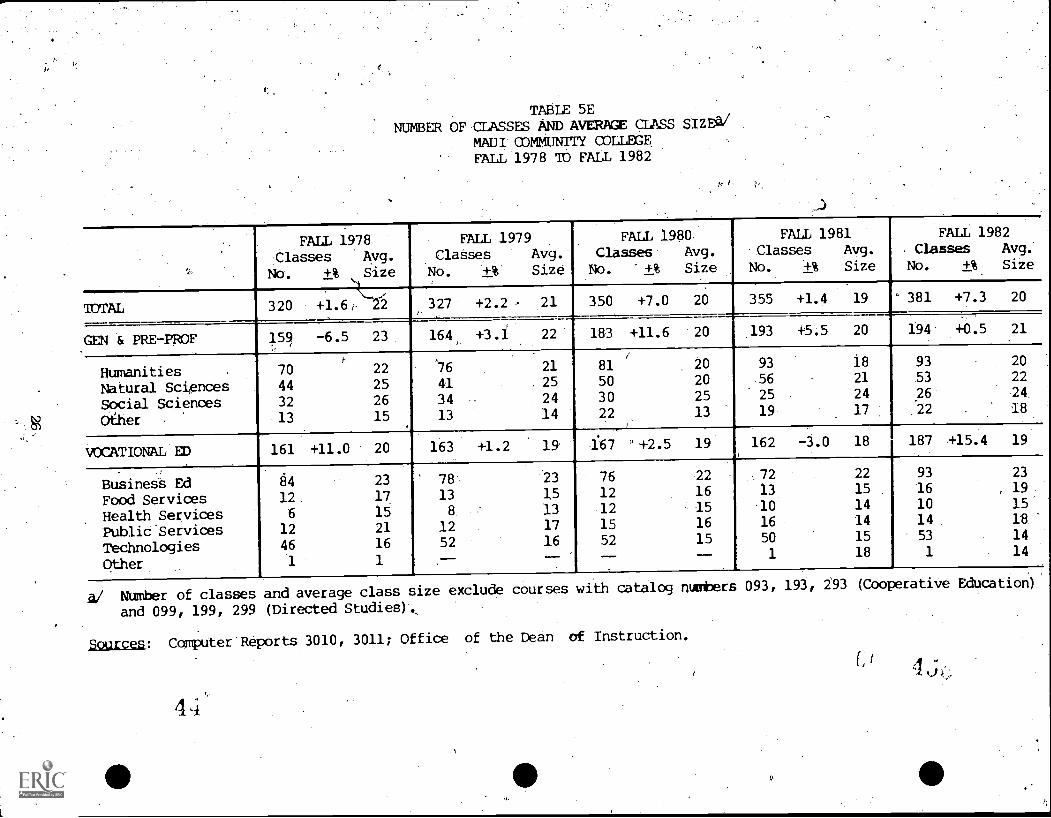
TABLE 5ENUMBER OF.CLASSES AND AVERAGE crAss sma/
MAUI- COMMUNITY OOLLEGEFALL 1978 TO FALL 1982
FALL 1978-ClasSes Avg.
NO. +% Size
FALL 1979ClaSses Avg.
No. +%' SiZe
FALL 1900:
Classes Avg.
NO. 4% Size.
FALL 1981Classes Ayg.
No. 4% Size
,
FAII 1982. Classes Avg..
No. +% Size
. ,.
. .
TOTAL 320 41.62 327. +2.2 - 21 350 +7.0 20 355 +1.4 19 381 +7.3 20
_
GEN & PRE-PROF 159.1,
-6.5 23. 164 +3.1 22 183 +11.6 -20 193 +5.5 20 194. +0.5 21
Humanities .70 22 76 21 81 20 93 18 93 20
Natural Sciences 44 25 Al . 25 50 20 56 21 53 22
Social Sciences 32 26 34 24 30 25 25 . 24 26 24.
Oiher - 13 15 13 14 22 13 19 17 :.22 18
VOCATIONAL ED 161 +11.0 20 163 +1.2 19 167 0+2.5 19 162 -3.0 18 187 415.4 19
Businesb Ed 64 23. 78, 23 76 22 72 22 93 23
Food Services 12. 17, 13 15 12 16 13 15 16 , 19
Health Services 6 15 8. 13 :12 15 10 14 10 15
Pyblid'Services 12 21 12 17 15 16 16 14 14 18
Technologies 46 16 52 16 52 15 50 15 53 14
Other 1 1 -- -- 1 18 1 14
L/ NUmber of classes and average class size exclude courses with catalog numbers 093, 193, 293 (CooperatiVe Education)
and 099, 199, 299 (Directed Studies),
Lources: Computer Reports 3010, 3011; Office of the Dean of Instruction.
r/TABLE 6E
STUDENT SEMESTER HOURS (Sal) AND COURSE FTEMAUI ODMMUNITY ODIJYGEFALL 1978 TO FALL 1982
FALL.1978 .
SSH CourseNo. +% . : i.it,
FALL 1979SSH CoUrSe
-No. +% Fib
FALL 1980SSE
No. +%
CourseFIE
FALL 1981SSH Course
NO. +%. EIE
FALL 1982SSH Course
No. +% FTE
TOTAL . 17,676 +0.3 1,178 17,435 '-1.4 1;162 17,463 +0.2 1,164 16,773 -4.0 1,118 19,559 +16.6 1,304
.CEN 6 PRE-PROF 9,571 -5.9 638 9,416 -1.6 628 9,736 +3.4 649- .9,287 -4.6 619 10,112 +8.9 674
.Hurronities,
4,645 JIC 4,600 307 4,906 327 4,615 308 5,090 339
Natural Stiences 2,264 1 2,181 145 2,175 145 2,430 162- 2,652 177
Social Scierces 2,422 , 161 2,398 . 160 2,213 148 1,790 119 1,875 125
Other 240 16 237 16 442 29 452 30 495 33
VDCATIONAL ED 8,105 +8.8 540 - 8,019 -1.1 535 7,727 -3.6 515 7,486 -3.1 499 9,447 +20.4 630
Business Ed 3,757 251 3,592 240 3,472 231 3,237 - 216 4,525 302
Food Services' 682 45 638 43 676 45 682 45 1,113 74
Health Services 484 32 566 38 594 40 529 35 721 48
Public Services 698 47 531 35 615 41 607 40 722 48
Technologies 2,481 165 2,692 _ 179 2,370 158 2,377 -159 2,326 155
Other 3 -- -- -- 54 4 40 3
figagr Due to independent rOunding, Course FTE may not always total the surn of the parts.
SOurceg: COmputer Reports 3010, 3011; Office of the Dean of Instruction.
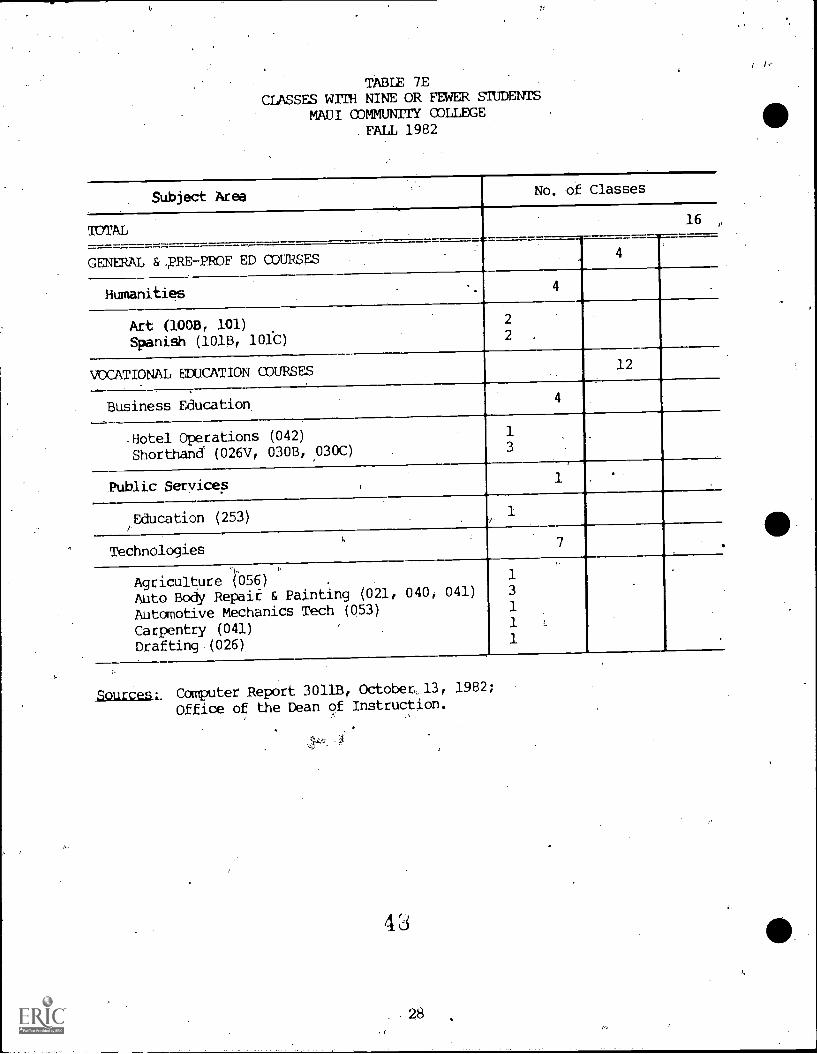
TABLE 7ECLASSES WITH NINE OR FEWER STUDENTS
MAUI commuNrrY coLLEGE.FALL 1982
Subject AreaNo. of Classes
TOTAL16
GENERAL &_pRE-PROF ED COURSES4
Humanities4
Art (100B, 101)Spanish (1015, 101e)
2
2 .
VOCATIONAL EDUCATION COURSES-
12
Business Education4
.Hotel Operations (042)Shorthand (026V, 0308, ,030C) .
13
.
Public Services .
1 .
tEducation (253)
Technologies7 .
Agriculture (056)Auto Body Repair & Painting (021,Automotive MechaniCs Tech (053)
Carpentry (041)Drafting (026)
040, 041)
1
3
1
1
1 .
Sources:, Computer Report 30118, October13, 1982;
Office of the Dean of Instruction.
.28
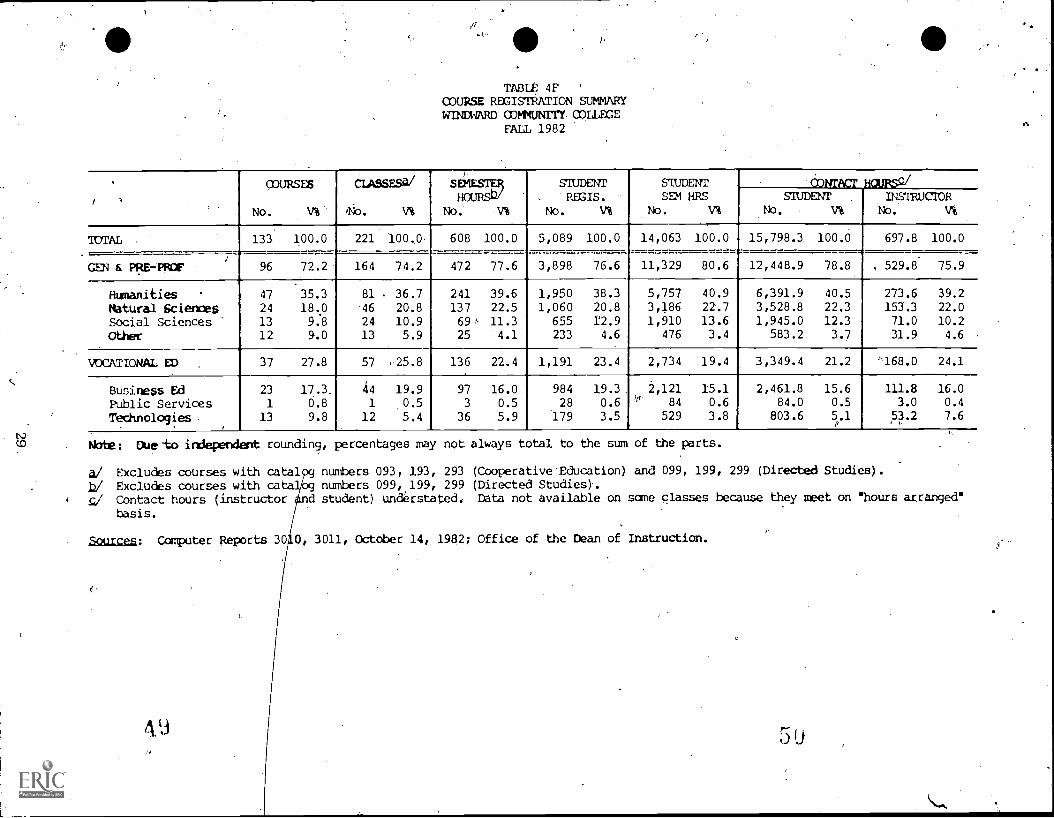
TABLE 4F '
COURSE REGISTRATION SUMMARYWINEWRD COMMUNTIT COLLEGE
FALL 1982
. ODURSES
No.
CLASSESa/
oNo. V%
).S=No.' V%
STUDENTREGIS.
No. V%
STUDENTSEM HRS
No. vi,
dowA CIcr jiOURSSTUDENT
No.INSTRUCTOR
No. V%
133 100.0 221 100,0 608 100.0 5,089 100.0 14,063
.
100.0 15,798.3 100.0 697.8 100.0TOTAL ,
-
GEN & PRE-PROF 96 72.2 164 74.2 472 77.6 3,898 76.6 11,329 80.6 12,448.9 78.8 , 529.8 75.9
Humanities 47 35.3 81 . 36.7 241 39.6 1,950 38.3 5,757 40.9 6,391.9 40.5 273.6 39.2
NatUral ScienceS 24 18..0 .46 20.8 137 22.5 1,060 20.8 3,186 22.7 3,528.8 22.3 153.3 22.0
Social Sciences 13 9.8 24 10.9 69?. 11.3 655 12.9 1,910 13.6 1,945.0 12.3 71.0 10.2
Other 12 940 13 5.9 25 4.1 233 4.6 476 3.4 583.2 3.7 31.9 4.6
VOCATIONAL ED 37 27.8 57 ,25.8 136 22.4 1,191 23.4 2,734 19.4 3,349.4 21.2 %.168.0 24.1
Business Ed 23 17.1 44 19.9 97 16.0 984 19.3. 2,121 15.1 2,461.8 15.6 111.8 16.0
Public Services 1 0.8 1 0,.5 3 0.5 28 0.6 ' 84 0.6 84.0 0.5 3.0 0.4
Technologies,
13 9.8 12 5.4 36 5.9 179 3.5 529 3.8 803.6 5.1.e,
53.2 7.6
Nbte; Dueto independent rounding, percentages may not always total to the sum of the parts.
:12/ Excludes courses with catal numbers 093, 193, 293 (Cooperative Education) and 099, 199, 299 (Directed Studies).bi Excludes courses with ca numbers 099, 199, 299 (Directed Studies)'.
Contact hours (instructor d student) understated. Data not available on same classes because they meet on 'hours arranged'
basis.
5curces: Computer Reports 30i 00 3011, October 14, 1982; Office of the Dean of Instruction.
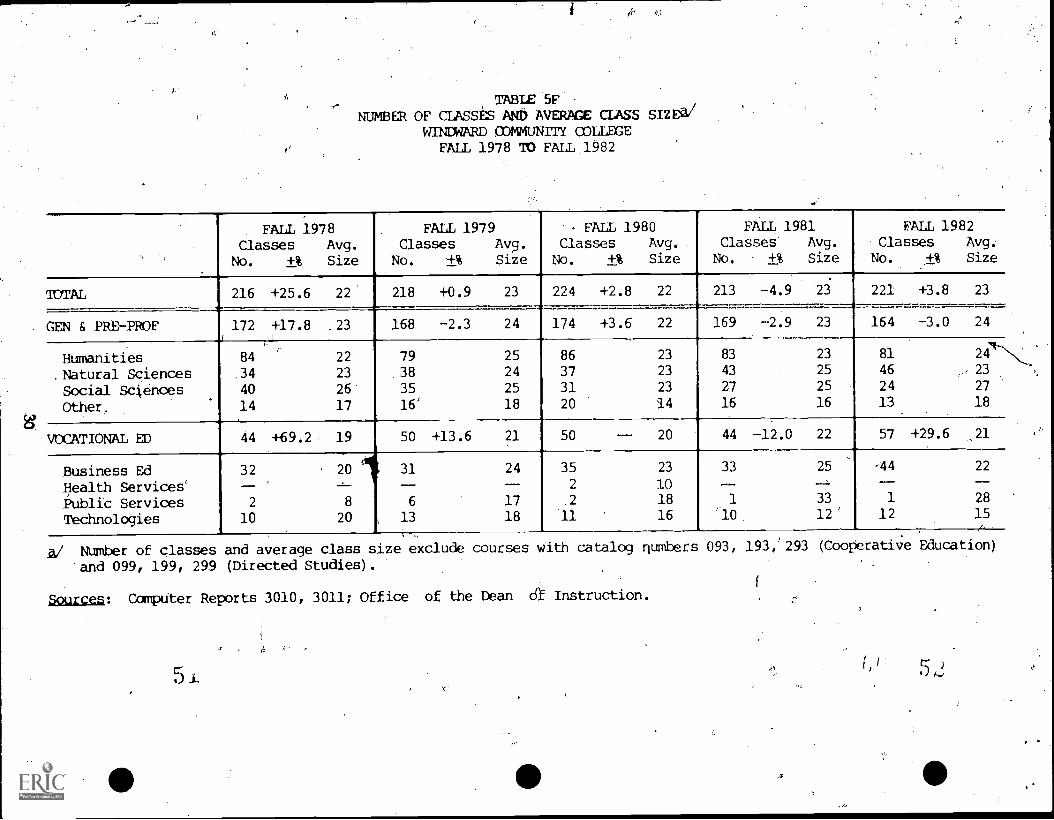
A TABLE 5F,NUMBER OF CLASSES AND AVERAGE CLASS SIZW
WINDWARD COMMUNITY COLLEGEFALL 1978 TO FALL 1982
FALL 1978Classes Avg.
No. +% Size
FALL 1979Classes Avg.
No. +% Size
FALL 1980Classes Avg, .
NO. +% Size
FALL 1981Classes' Avg.
No. +% Size
FALL 1982Classes Avg-
No. +% Size
TDTAL 216 +25.6 22' 218 +0.9 23 224 +2.8 22 213 -4.9 23 221 +3.8 23
GEN & PRE-PROF 172 +17.8 .23 168 -2.3 24 174 +3.6 22 169 -2.9 23 164 -3.0 24
Humanities 84 22 79 25 86 23 83 23 81 24-
.Natural Sciences ,34 23 38 24 37 23 43 25 46 , 23
Social Sciences 40 26 35 25 31 23 27 25 24 27
Other, 14 17 16' 18 20 14 16 16 13. .
18
VOCATIONAL ED 44 +69.2 19 50 +13.6 21 50 20 44 -12.0 22 57 +29.6 ,21
Business Ed 32 20 1 31 24 35 23 33 25 -44 22
Health Services -- 2 10 -- -'
Publit Services 2 8 6 17 ,2 18 1 33 1 28
Ttchnologies 10 20 13 18 11 16 /.10 12 12 15. .
,
Number of classes and average class size exclude courses with catalog numbers 093, 193, 293 (Cooperative Education)
and 099, 199, 299 (Diretted Studies).
Sources: Computer Reports 3010, 3011; Office of the Dean a Instruction.
5 1
1

TABLE 6FSTUDENT arturtIR MIPS (5$.40 AND COURSE FrE
WINDWARD CONNUNTTY COLLEGE:FALL 1978 TO FALL 1982
FALL 1978SSH
No. +%
CourseFTE
FALL 1979SSH .
No. +%Course
FTE
FALL-1980..SSH 'Course
No. ..+% FTE
FALL 1981SSH . Course
No. +% FIT
FALL 1982SSH Course
No.- +% FTE
Tork. 13;509 +7.2 901 14,206 +5.2 947 '13,521 -4.8 901 13,922 +3.0 928. 14,063 +1.0 938
GEN & IPREHPROF 11,770 +2.8 725 11,806- +0.3 787 11,238 -4.8 749 11,609 +3.3- 774 11,329 -2.4 755
Humanities 5,665 378 ,5,720 381 5,729 382 5,651. 377 5,757 384
Natural SCiences 2,504 :67, 2,839 189 2,694 179 3,270 0 218 3,186 212
Social Sciences 3.,042 203 2,547 170 . 202.
2./
147 2,115 141 1,910 127
°Chet 559 37 700 47 613 41 573 38 476 32
NACCAT1CM.ED 14739 +51.0 . 116 '2,400 +38.0 160 2,283 -4.9 152 2,313 +1.3 154 2,734 +18.2 182
_.
. .
Businees E0; 1,323 . 88 .1,527 102 1,660 111 1,767 118 2,121 141
,Bealth SetVicep. -- -- 19 1 -- -- -- --
public Services _32 2 280 19 105 7 99. 6 84 6
Tchnologies 384 26 593 39 499 33 447 30 529 35
Elpitg: Due -bri independent rbunding, Course kat., may not'always.tatal-thesum of-the parts..
,
Lources: Camputer Reports 30161 3011; Office of the Dean of Instruction.

TABLE 7FCLASSES WITH NINE OR FEWER STUDENTS
WINDWARD-COMMUNITY ODLLEGEFALL 1982
Subject Area No. of Classes
1' TDTAL.
. GENERAL &PRE-PROF ED cpupsEs 3
Natural Sciences 1
Matherhatics.(025) 1
SoCial Sciences
Geography (101L)
,Other 1
'Learning Skills (030)
VOCATIONAL'IMCATION COURSES
Technologies
Agriculture (042, 043) 2
Sources: .;Computer Report.3Q118, Octobei 14; 1982;Office of the Dean of Instruction.
r I
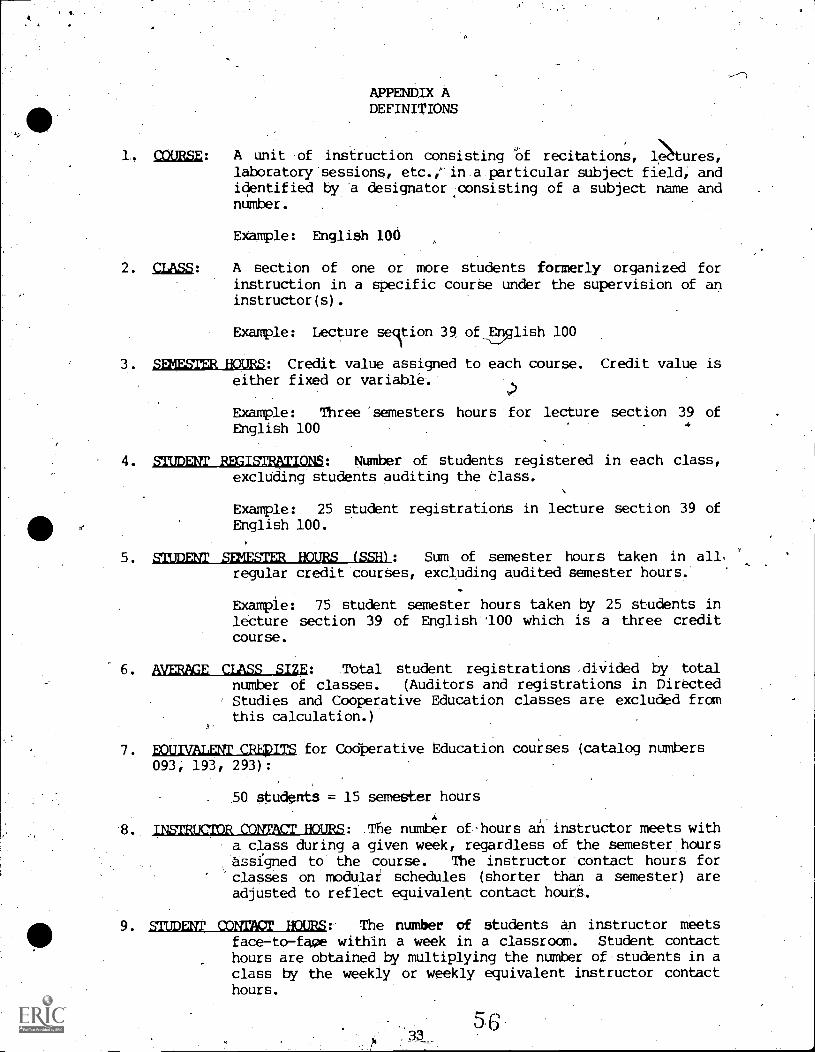
1.. COURSE: A unit oflaboratoryidentifiedntimber.
APPENDIX ADEFINITIONS
instruction consisting Of recitations, 1;.tures,'sessions, etc.lin.a,particular subject field; andby a designatorconsisting of a subject name and
Example: English 106
2. CLASS: A section of one or more students formerly organized forinstruction in a specific Com-Se under the supervision of aninstructor(s).
Example: Lecture se9tion 39 of En lish 100
3. SEMESTER HOURS: Credit value assigned to each course. Credit value iseither fixed or variable..
.?
Example: Three "semesters hours for lecture section 39 ofEnglish 100 4
4. 5TUDENT REGISTRATIONS: NUmber of students registered in each class,excluding students auditing the Class.
Examplel 25 student registrations in lecture section 39 ofEnglish 100.
5. STUDENT SEMESTER HOURS (SSH): Sum of semester hours taken in all,regular credit'courSes, excluding audited semester hours.'
Example: 75 student semester hours taken by 25 students in'lecture section 39 of English-100 which is a three creditcourse.
6. AVERAGE CLASS SIZE: Ibtal student registrations ,diVided by totalnumber of classes. (Auditors and registrations in DirectedStudies and Cooperative Education classes are excluded fromthis calculation.)
7. EOUIVALENT CREDITS for Codperative Education couises (catalog numbers093; 193, 293):
50_students = 15 semester hours
A
;NS'IRUCIOR CONTACT HOURS: .The number of-hours an instructor meets witha class during a given week, regardless of the semester hoursassigned to the course. The instructor 'contact hours for'classes on modular schedules (shorter than a semester) areadjusted to reflect equivalent contact hours..
9. STUDENT CONTACT HOURS:' :The number of students an instructor meetsfaceto-faoe within a week in a classroom. Student contacthours are obtained by multiplying the number of'students in aclass by the weekly or weekly equivalent instructor contacthours.

10. COURSE FTE: M3tal student semester hours (SSHs) summed across all .
course-enr011mente in regular credit undergraduate courses
ddvided by 15. Also called Full-time Eiguiyalent (erE) Course
Enrollment.
ERIC Clearinghouse for Junior Colleges
University of California ,
Los Angeles, California 90924.
FEB e, 1983
5 7
34