DOCUMENT RESUME IR 003 106 Lyle, Jack; Ellis, … RESUME ED 119 643 IR 003 106 AUTHOR Lyle, Jack;...
48
DOCUMENT RESUME ED 119 643 IR 003 106 AUTHOR Lyle, Jack; Ellis, Donna TITLE A General Analysis of the Audience of Public Broadcasting in the New York Area. INSTITUTION Corporation for Public Broadcasting, Washington, D.C. Office of Communication Research. PUB DATE 74 GRANT CPB/OCR-R-211 NOTE 48p. EDRS PRICE MF-$0.83 HC-$2.06 Plus Postage DESCRIPTORS Broadcast Television; Children; Ethnic Groups; Programing (Broadcast); *Public Television;; Tables (Data); Television Research; *Television Surveys; *Television Viewing IDENTIFIERS New York (New York); *WNET TV ABSTRACT A study of four public television stations was conducted in 1972 as part of a Ford Foundation research project. The major focus of the study was on WNET-TV, a very high frequency (VHF) station. The viewer population was sampled by random telephone dialing. In 5025 interviews, questions were asked concerning viewer characteristics, viewing hours,'and programs-viewed. It was found that the WNET audience was predominantly compoted of highly educated families with young chilIten. Music and drama programs were viewed most frequently among black families, and public affairs programs among white families. Twenty statistical tables present the survey data. (DS) *********************************************************************** Documents acquireu by ERIC include many informal unpublished * materials not available from other sources. ERIC makes every effort * * to obtain the best copy available. Nevertheless, items of marginal * * reproducibility are often encountered and this affects the quality * * of the microfiche and hardcopy reproductions ERIC makes available * * via the ERIC Document Reproduction Service (EDRS). EDRS is not * responsible for the quality of the original document. Reproductions * supplied by EDRS are the best that can be made from the original. * ***********************************************************************
Transcript of DOCUMENT RESUME IR 003 106 Lyle, Jack; Ellis, … RESUME ED 119 643 IR 003 106 AUTHOR Lyle, Jack;...

DOCUMENT RESUME
ED 119 643 IR 003 106
AUTHOR Lyle, Jack; Ellis, DonnaTITLE A General Analysis of the Audience of Public
Broadcasting in the New York Area.INSTITUTION Corporation for Public Broadcasting, Washington, D.C.
Office of Communication Research.PUB DATE 74GRANT CPB/OCR-R-211NOTE 48p.
EDRS PRICE MF-$0.83 HC-$2.06 Plus PostageDESCRIPTORS Broadcast Television; Children; Ethnic Groups;
Programing (Broadcast); *Public Television;; Tables(Data); Television Research; *Television Surveys;*Television Viewing
IDENTIFIERS New York (New York); *WNET TV
ABSTRACTA study of four public television stations was
conducted in 1972 as part of a Ford Foundation research project. Themajor focus of the study was on WNET-TV, a very high frequency (VHF)station. The viewer population was sampled by random telephonedialing. In 5025 interviews, questions were asked concerning viewercharacteristics, viewing hours,'and programs-viewed. It was foundthat the WNET audience was predominantly compoted of highly educatedfamilies with young chilIten. Music and drama programs were viewedmost frequently among black families, and public affairs programsamong white families. Twenty statistical tables present the surveydata. (DS)
***********************************************************************Documents acquireu by ERIC include many informal unpublished
* materials not available from other sources. ERIC makes every effort ** to obtain the best copy available. Nevertheless, items of marginal *
* reproducibility are often encountered and this affects the quality *
* of the microfiche and hardcopy reproductions ERIC makes available *
* via the ERIC Document Reproduction Service (EDRS). EDRS is not* responsible for the quality of the original document. Reproductions* supplied by EDRS are the best that can be made from the original. *
***********************************************************************


A GENERAL ANALYSIS OF THEAUDIENCE OF PUBLIC BROADCASTING
IN THE NEW YORK AREA
byDr. Jack Lyle
andDonna Ellis
Corporation for Public BroadcastingOffice of Communication Research
U.S. (APARTMENT OF HEALTH.EDUCATION &WELFARENATIONAL INSTITUTE OF
EDUCATION
THIS DOCUMENT HAS BEEN REPRO-DUCED EXACTLY AS RECEIVED FROMTHE PERSON OR ORGANIZATION ORIGINATING IT POINTS OF VIEW OR OPINIONSSTATED DO NOT NECESSARILY REPRESENT OFFICIAL NATIONAL INSTITUTE OFEDUCATION POSITION OR POLICY
Report CPB/OCR 211
CPB/OCR 211
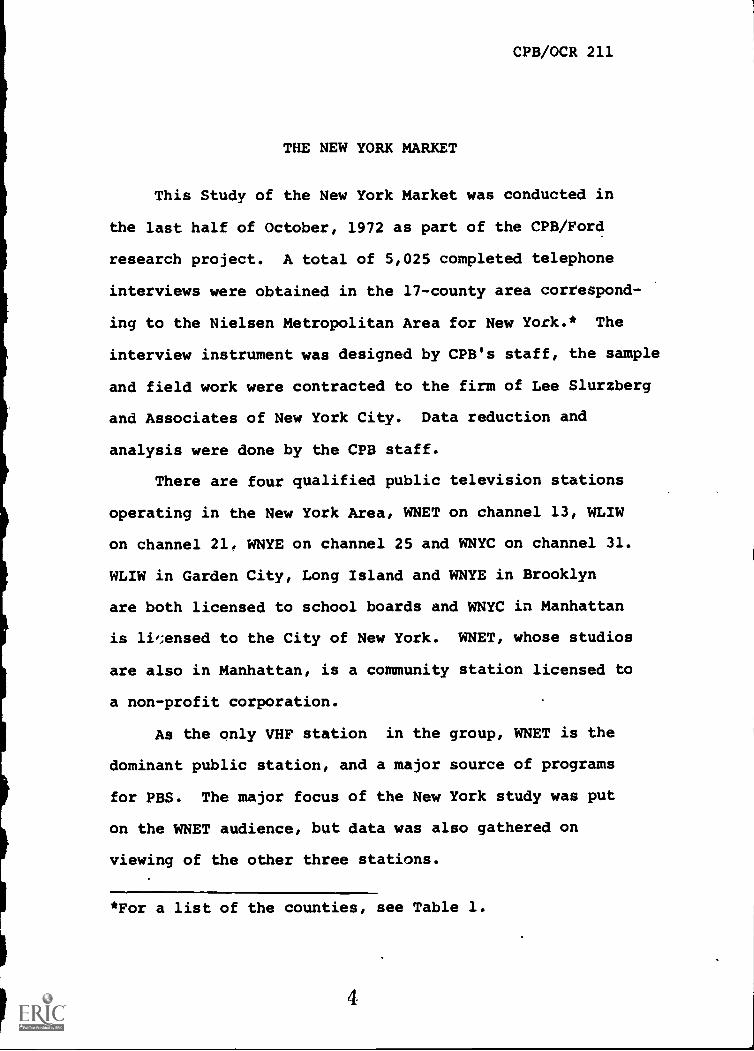
THE NEW YORK MARKET
This Study of the New York Market was conducted in
the last half of October, 1972 as part of the CPB/Ford
research project. A total of 5,025 completed telephone
interviews were obtained in the 17-county area correspond-
ing to the Nielsen Metropolitan Area for New York.* The
interview instrument was designed by CPB's staff, the sample
and field work were contracted to the firm of Lee Slurzberg
and Associates of New York City. Data reduction and
analysis were done by the CPB staff.
There are four qualified public television stations
operating in the New York Area, WNET on channel 13, WLIW
on channel 21 WNYE on channel 25 and WNYC on channel 31.
WLIW in Garden City, Long Island and WNYE in Brooklyn
are both licensed to school boards and WNYC in Manhattan
is licensed to the City of New York. WNET, whose studios
are also in Manhattan, is a community station licensed to
a non-profit corporation.
As the only VHF station in the group, WNET is the
dominant public station, and a major source of programs
for PBS. The major focus of the New York study was put
on the MET audience, but data was also gathered on
viewing of the other three stations.
*For a list of the counties, see Table 1.
4

CPB/OCR 211Page 2
SAMPLING INFORMATION
The sample was stratified by county to guarantee
a proportionate distribution corresponding to actual
population in the 17-county area. The sampling universe
consisted of telephone households. Numbers were selected
using a random dialing technique in 100 telephone ex-
changes. The sampling unit was the household and interviewers
were permitted to complete the interview with any adult in
the household.
Characteristics of the sample are presented in Table 1.
GENERAL INFORMATION
Of the 5,025 households, 55.6% were multiple-set
homes, 42.4% had one set, 2.0% had no set. Only half (49.2%)
of the respondents reported havhig a UHF set. This figure
is considerably below industry estimates of UHF ownership
(78%) and may reflect some confusion over the question.*
The geographic differences in reported possession of UHF
is shown in Table 2.
A third of the respondents reported that the household
TV was turned on six hours or more a day (Table 3).
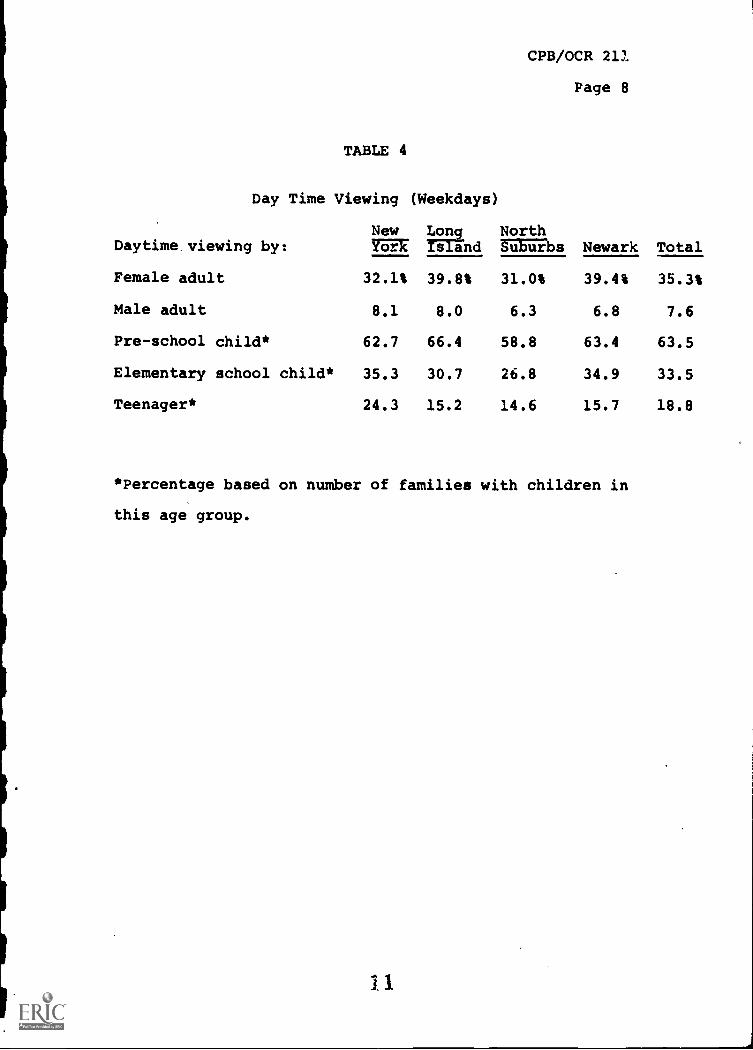
Respondents were asked who in the family (if anyone)
usually watched TV during the day on weekdays. Weekday
day-time viewing ranged from 63.5% of the pre-school
*The same question was used in other markets withoutproducing similar discrepancies.
r.

CPB/OCR 211Page 3
children to 35.5 % of the elementary school-age children,
35.3% of the adult women, down to 18.8% of the teenagers
and only 7.6% of adult men (Table 4).
6

CPB/OCR 211Page 4
TABLE 1
CHARACTERISTICS OF THE SAMPLE
Geographic Disbribution, by Counties
New York City 2,452 48.9%
Manhattan 499 10.0Queens 601 12.0Brooklyn 802 16.0Bronx 449 8.9Richmond 100 2.0
Long Island 799 15.9%
Suffolk 325 6.5Nassau 471 9.4
Northern Suburbs 470 9.4%
Rockland 60 1.2Westchester 299 6.0Morris 111 2.2
Newark 1,415 26.0%
Passiac 152 3.0Hudson 199 4.0Bergin 254 .5.1Union 150 3.0Middlesex 207 4.1Essex 299 6.0Somerset 41 .8
Unknown 4 .1
(Continued)
7

CPB/OCR 211Page 5
TABLE 1(Continued)
Ethnic Groups Age Groups
White 77.3% Under 20 .2%Black 13.3% 20-29 12.5Spanish speaking 4.1 30-39 17.4Refused 5.2 40-49 20.0
50-59 17.460-69 12.070 and over 6.2Refused 14.3
Occupational Groups Education of Man of House
Professional 12.5% Elementary or less 6.5%Proprietorial 9.4 Some high school 10.9Clerical 24.9 Finished high school 40.9Skilled 18.4 Some college 13.7Unskilled 4.6 BA or equivalent 18.4Non-occupation 30.4 Graduate work 8.3
Refused 1.3
Size of Family Education of Woman of House
Single person 10.4% Elementary or less 7.6%Two persons 27.3 Some high school 13.2Three persons 19.0 Finished high school 48.0Four persons 19.4 Some college 13.7Five persons 12.3 BA or equivalent 12.5Six persons 5.7 Graduate work 13.9Seven persons 2.3 Refused 1.1Eight or more 2.1Refused 1.5
Pre-school children in familyEleMentary school childrenTeenagers
18.5%27.027.2

CPB/OCR 211Page 6
TABLE 2
Reported Possession of UHF Sets
New York 49.4%
Long Island 47.9%
Northern Suburbs 36.1%
New Jersey 52.7%
9

CPB/OCR 211Page 7
TABLE 3
Estimated Weekday Average TV Timefor Household
hew York Long IslandNorthSuburbs Newark Total
Usually not on 2.1% 1.0% 1.1% 1.9% 1.8%
1 hour or less 5.7 2.9 8.5 3.8 4.9
2 hours 13.3 8.8 15.3 9.2 11.6
3 hours 16.5 15.9 21.3 13.7 15.9
4 hours 16.4 18.0 17.9 16.5 16.8
5 hours 12.5 12.9 12.8 14.6 13.2
6 hours or more 9,1 11.4 8.5 11.7 10.1
"All day" 21.5 28.5 13.9 27.1 23.6
No TV 2.9 .6 .6 1.4 2.0
(N) (2,452) (799) (352) (1,415) (5,025)*
*Includes 4 cases without geographic
il
10
designation.
CPB/OCR 211
Page 8
TABLE
Day Time Viewing
4
(Weekdays)
New Long NorthDaytime, viewing by: or s and Suburbs Newark Total
Female adult 32.1% 39.8% 31.0% 39.4% 35.3%
Male adult 8.1 8.0 6.3 6.8 7.6
Pre-school child* 62.7 66.4 58.8 63.4 63.5
Elementary school child* 35.3 30.7 26.8 34.9 33.5
Teenager* 24.3 15.2 14.6 15.7 18.8
*Percentage based on number of families with children in
this age group.
1.1
CPB/OCR 211Page 9
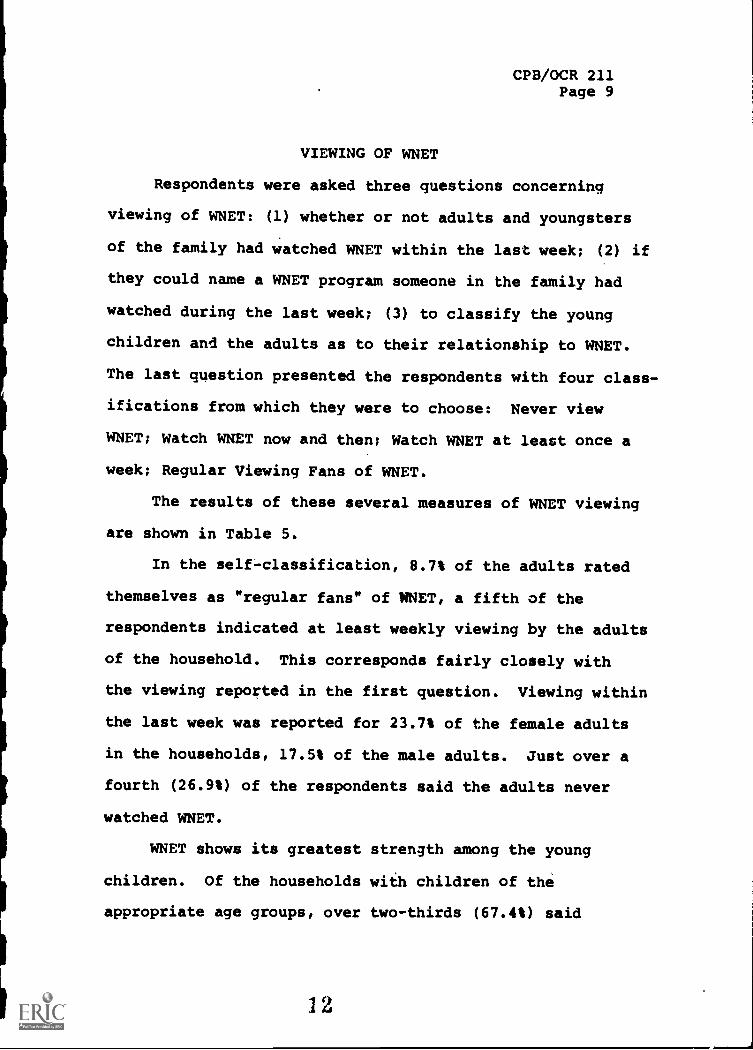
VIEWING OF WNET
Respondents were asked three questions concerning
viewing of WNET: (1) whether or not adults and youngsters
of the family had watched WNET within the last week; (2) if
they could name a WNET program someone in the family had
watched during the last week; (3) to classify the young
children and the adults as to their relationship to WNET.
The last question presented the respondents with four class-
ifications from which they were to choose: Never view
WNET; Watch WNET now and then; Watch WNET at least once a
week; Regular Viewing Fans of WNET.
The results of these several measures of WNET viewing
are shown in Table 5.
In the self-classification, 8.7% of the adults rated
themselves as "regular fans" of WNET, a fifth of the
respondents indicated at least weekly viewing by the adults
of the household. This corresponds fairly closely with
the viewing reported in the first question. Viewing within
the last week was reported for 23.7% of the female adults
in the households, 17.5% of the male adults. Just over a
fourth (26.9%) of the respondents said the adults never
watched WNET.
WNET shows its greatest strength among the young
children. Of the households with children of the
appropriate age groups, over two-thirds (67.4%) said
12

CPB/OCR 211Page 10
pre-school children had watched WNET within the last week,
41.5% of the elementary-school-age children had done so.
Further, 39.4% of the parents of young children said the
youngsters were "regular viewing fans" of WHET and another
11.1% said their children watched WNET at least once a
week.
Viewing by teenagers generally appeared to follow the
adult pattern. (It should be noted that day-time viewing
reported for teenagers was quite low. This suggests that
most viewing by teenagers may be done in the family setting.)
Perhaps the most stringent of the three questions was
the one asking for recall of program titles. Just under
a third (31.6%) of the respondents were able to name a WNET
program which someone in the family had viewed during the
preceding week. About half of those who were able to recall
WNET programs viewed named more than one.
A caution should be interjected here: the number of
programs named as seen should not be interpreted as indicat-
ing the frequency of viewing of WNET in the one-week period.
The response recorded was program titles and some of the
individual programs are daily series. Hence a response
of "Sesame Street" might indicate anywhere from one to
five (or more) viewing experiences.
The importance of the audience of children's program
in WNET's overall audience is underlined by the figures in
13

CPB/OCR 211Page 11
Table 6 which gives a breakdown of the programs named
as having been viewed in the last week. The programs are
grouped into "children's," "public affairs," "dramatic/music,"
combinations of these three and "other types" (such as
French Chef, Yoga, etc.). In all, 61.4% of the respondents
who named programs cited a children's show'and over half,
52.5%, named only children's shows. Dramatic/music shows
had a slight advantage over public affairs.
In this set of figures we see some rather striking
differences between respondents in the four geographic
areas. Children's programs were relatively much more
important among Long Island and Newark-area respondents
while dramatic/music programs were much more frequently
named by respondents in the North Suburbs area.
The great impact of the children's programs is empha-
sized by the unaided recall of program titles named as
having been seen by someone in the household during the
preceding week. Over half of the persons naming programs
cited "Sesame Street," a quarter named the "Electric
Company" and 11% named "Misterogers' Neighborhood"
(Table 5D). By comparison, the leading adult program --
"Masterpiece Theatre"-- was named by 12% (including 6% who
named "Vanity Fair," the current feature of the series).
"VD Blues", a special shown in the interview period, was
named by 9% (and another 1% named Dick Cavett, the narrator
of the program).
14

CPB/OCR 211Page 12
TABLE 5A
Reported Viewing of WNET in "Last Week"
NewYork
LongIsland
NorthSuburbs- Newark Total
Female Adult 24.0% 23.9% 32.4% 20.8% 23.7%
Male Adult 17.2% 19.1% 21.0% 16.0% 17.5%
Pre-School Child* 62.0% 78.3% 72.5% 67.6% 67.4%
Elementary SchoolChild* 43.0% 37.0% 36.1% 44.0% 41.5%
Teenager* 19.7% 16.5% 12.9% 21.4% 18.9%
*Percentages based on number of families with children inthis age group.
TABLE 5B
Number of WNET Programs Named asViewed by Someone in Family During
Past Week
NewYork
LongIsland
NorthSuburbs Newark Total
None 69.0% 64.1% 64.5% 70.3% 68.3%
1 17.3% 17.0% 17.3% 15.8% 16.8%
2 8.7% 10.6% 8.8% 8.1% 8.8%
3 or more 4.8% 8.3% 9.4% 5.8% 6.0%
15

CPB/OCR 211Page 13
TABLE 5C
Self-Classification of WNET Relationship
Elementary andPre-school Children
NewYork
LongIsland
NorthSuburbs Newark Total
Regular viewing fans 39.1% 36.4% 38.5% 42.0% 39.4%
View once a week 11.1% 11.8% 9.8% 11.6% 11.1%
View now and then 31.2% 33.0% 35.2% 28.4% 31.0%
Never watch WNET 18.4% 18.8% 16.3% 18.4% 18.3%
(N) (777) (887) (122) (552) (1,840)
Adults
Regular viewing fans 8.5% 9.6% 8.8% 8.5% 8.7%
View once a week 10.0% 10.4% 20.7% 11.3% 11.2%
View now and then 49.1% 50.2% 51.4% 50.2% 49.8%
Never watch WNET 27.3% 27.4% 18.5% 28.3% 26.9%
No response 5.1% 2.4% .6% 1.8% 3.4%
16

CPB/OCR 211Page 14
TABLE 5D
WNET Programs Named as Having Been Viewed During the"Past Week"
Percentages based on the 1,593 respondents (out of a sampleof 5,025) who named at least one program in the late October,1972 New York Filter Study.
Sesame Street
Electric Company
Electric Circus
Misterogers
Zoom
Hodgepodge Lodge
VD Blues
Dick Cavett
Specials(Unspecified)
855 (54%)
400 (25%)
12 ( 1%)
175 (11%)
90 ( 6%)
35 ( 2%)
145 ( 9%)
Masterpiece Theatre 100 (6%)
Vanity Fair
Plays
102 (6%)
81 (5%)
InternationalPerformance 44 (3%)
Orpheus 8
Antigone 10Ballet 29Medea 19Tchaikowsky/Wagner 5 -(4%)
16 ( 1%)Boston Pops 89 (6%)
63 ( 4%)Music (Unspecified) 51 (3%)
51st State Specials 65 ( 40 Movies (Unspecified) 49 (3%)
Political Analysis 10Political Programs 10- ( 1%)
News
Documentaries
Advocates/Debates
Firing Line
Family Game
California Persons
Soul18 ( 1%)
Black Journal15 ( 1%)
Black News19 ( 1%)
Black movies6 -
Washington Week in5 - Review
17
5 -
5
4
Stock Market 4 MID

CPB/OCR 211Page 15
TABLE 6
Viewing of Program Categories
(Percentage Based on Total Able to Name WNET Programs Viewed)
New Long NorthProgram Types York Island Suburbs Newark Total
Children's 47.6% 64.5% 39.0% 57.5% 52.5%
Public Affairs 13.2% 12.0% 15.4% 11.5% 12.7%
Drama/Music 21.2% 10.2% 25.2% 18.2% 18.7%
Childrens/PublicAffairs 4.9% 3.9% 2.4% 2.8% 4.0%
Public Affairs/Drama /Music 4.8% 4.9% 9.7% 4.0% 5.0%
All Three 1.1% 1.0% 2.4% .2% 1.0%
Other Types 3.2% .0% 2.4% .4% 2.2%
Summary Groups
(Groups Not Mutually Exclusive)
Children's 57.2% 72.5% 47.0% 65.3% 61.4%
Public Affairs 24.0% 21.8% 29.9% 18.5% 22.7%
Drama/Music 30.7% 19.2% 40.5% 27.4% 28.6%
(N) (764) (282) (123) (417) (1,589)
18
CPB/OCR 2'1Page 16
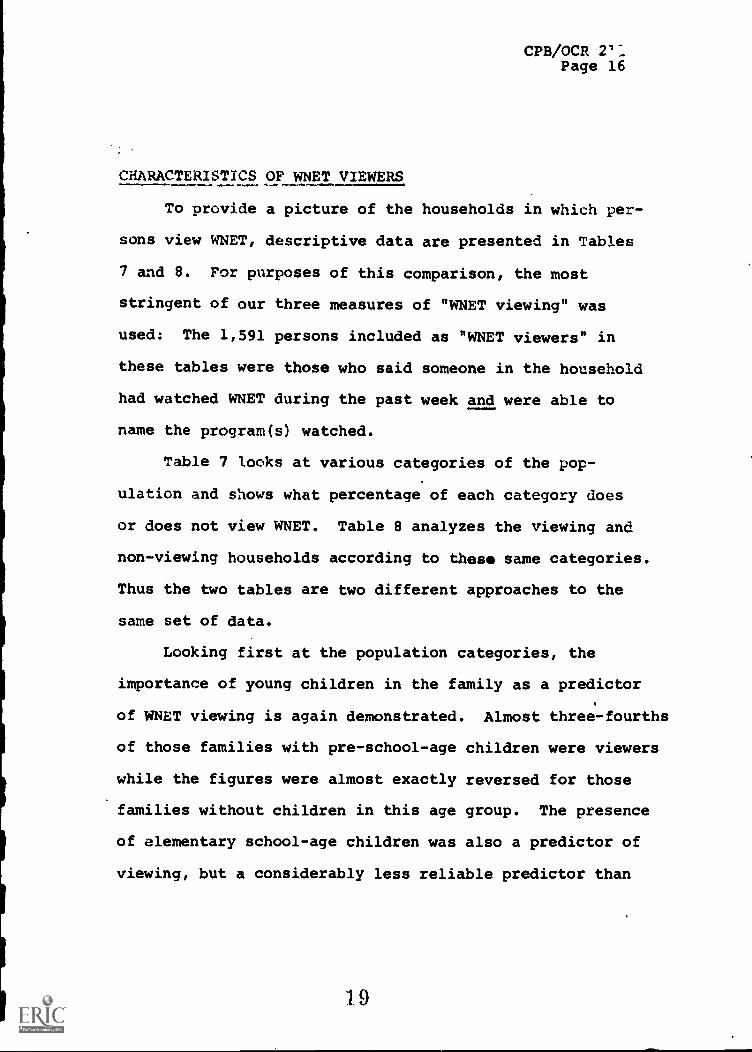
CHARACTERISTICS OF WNET VIEWERS
To provide a picture of the households in which per-
sons view WNET, descriptive data are presented in Tables
7 and 8. For purposes of this comparison, the most
stringent of our three measures of "WNET viewing" was
used: The 1,591 persons included as "WNET viewers" in
these tables were those who said someone in the household
had watched WNET during the past week and were able to
name the program(s) watched.
Table 7 looks at various categories of the pop-
ulation and shows what percentage of each category does
or does not view WNET. Table 8 analyzes the viewing and
non-viewing households according to these same categories.
Thus the two tables are two different approaches to the
same set of data.
Looking first at the population categories, the
importance of young children in the family as a predictor
of WNET viewing is again demonstrated. Almost three-fourths
of those families with pre-school-age children were viewers
while the figures were almost exactly reversed for those
families without children in this age group. The presence
of elementary school-age children was also a predictor of
viewing, but a considerably less reliable predictor than
19

CPB/OCR 211Page 17
TABLE 7
Who Watches WNET
Size of family Do View Do Not View (N)
Single person 15.21 84.8% (572)2 persons 17.31 82.7% (1,372)3 persons 32.3% 67.7% (953)4 persons 44.7% 55.3% (977)5 persons 47.5% 52.5% (617)6 persons 43.91 56.1% (287)7 persons 47.91 52.1% (117)
Pre-School Age Children
Yes 72.01 28.0% (931)No 22.8% 77.2% (3,919)
Elementary School-ageChildren
Yes 54.3% 45.7% (1,358)No 23.8% 76.2% (3,523)
Teenagers
Yes 31.8% 68.2% (1,329)No 32.1% 67.9% (3,478)
Age of Head of House
20-29 40.3% 59.7% (626)30-39 56.4% 43.6% (873)40-49 34.1% 65.9% (1,004)50-59 23.2% 76.8% (875)60-69 19.0% 81.0% (605)70-79 15.4% 84.6% (240)
(Continued)
20
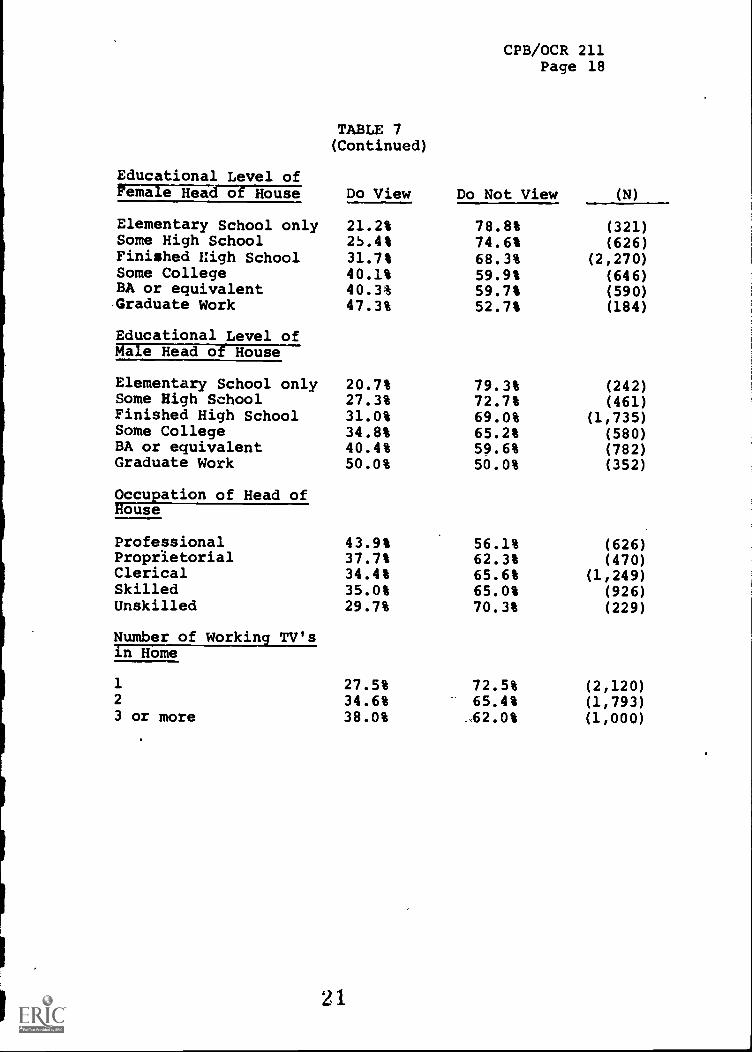
Educational Level ofFemale Head of House
CPB/OCR 211Page 18
TABLE 7(Continued)
Do View Do Not View (N)
Elementary School only 21.2% 78.8% (321)Some High School 2S.4% 74.6% (626)Finished High School 31.7% 68.3% (2,270)Some College 40.1% 59.9% (646)BA or equivalent 40.3% 59.7% (590)-Graduate Work 47.3% 52.7% (184)
Educational Level ofMale Head of House
Elementary School only 20.7% 79.3% (242)Some High School 27.3% 72.7% (461)Finished High School 31.0% 69.0% (1,735)Some College 34.8% 65.2% (580)BA or equivalent 40.4% 59.6% (782)Graduate Work 50.0% 50.0% (352)
Occupation of Head ofRouse
Professional 43.9% 56.1% (626)ProprIetorial 37.7% 62.3% (470)Clerical 34.4% 65.6% (1,249)Skilled 35.0% 65.0% (926)Unskilled 29.7% 70.3% (229)
Number of Working TV'sin Home
1 27.5% 72.5% (2,120)2 34.6% 65.4% (1,793)3 or more 38.0% 62.0% (1,000)
21
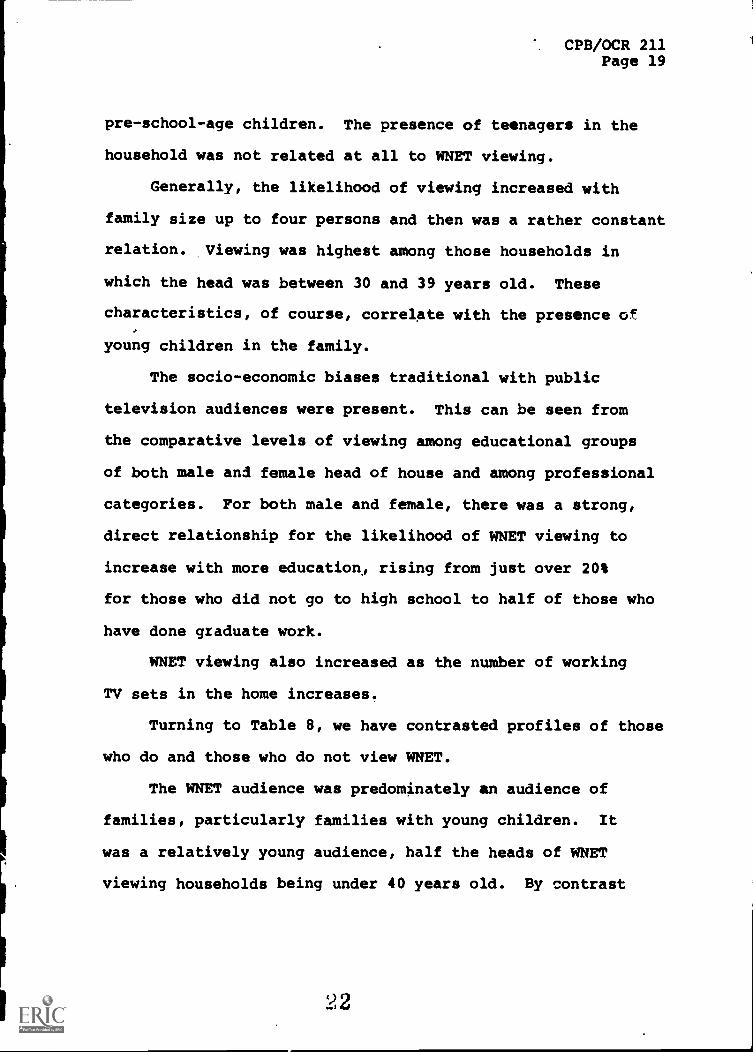
CPB/OCR 211Page 19
pre-school-age children. The presence of teenagers in the
household was not related at all to WNET viewing.
Generally, the likelihood of viewing increased with
family size up to four persons and then was a rather constant
relation. Viewing was highest among those households in
which the head was between 30 and 39 years old. These
characteristics, of course, correlate with the presence of
young children in the family.
The socio-economic biases traditional with public
television audiences were present. This can be seen from
the comparative levels of viewing among educational groups
of both male and female head of house and among professional
categories. For both male and female, there was a strong,
direct relationship for the likelihood of WNET viewing to
increase with more education) rising from just over 20%
for those who did not go to high school to half of those who
have done graduate work.
WNET viewing also increased as the number of working
TV sets in the home increases.
Turning to Table 8, we have contrasted profiles of those
who do and those who do not view WNET.
The WNET audience was predominately an audience of
families, particularly families with young children. It
was a relatively young audience, half the heads of WNET
viewing households being under 40 years old. By contrast
22

CPB/OCR 211Page 20
TABLE 8
Profile of WNET Viewers and Non-viewers
Size of Family Do View Do Not View______(N=1,591) (N=3,345)
Single person 5.0% 13.1%2 people 14.9% 33.8%3 people 19.4% 19.2%4 people 27.5% 16.1%5 people 18.4% 9.6%6 or more people 14.7% 8.2%
Have Pre-School children 42.9% 7.9%Have Elementary School-agechildren 46.8% 18.8%Have teenagers 28.1% 28.3%
Age of Head of House
20-29 17.3% 13.1%30-39 33.9% 13.4%40-49 23.5% 23.2%50-59 14.0% 23.6%60-69 7.9% 17.2%70 & over 3.1% 9.3%
Educational Level of FemaleHead of louse
Elementary School only 4.4% 8.0%Some High School 10.3% 14.7%Finished High School 46.4% 48.8%Some College 16.7% 12.2%BA or equivalent 15.4% 11.1%Graduate work 5.6% 3.0%Refused 1.2% 2.3%
(Continued)
23

CPB/OCR 211Page 21
TABLE 8(Continued)
Educational Level of Male
Do View Do Not ViewHead of House
Elementary School only 3.5% 6.8%Some High School 8.8% 11.9%Finished High School 37.8% 42.5%Some College 14.2% 13.5%BA or equivalent 22.2% 16.5%Graduate work 12.4% 6.2%Refused 1.1% 2.6%
Occupation of Head of House
Professional 21.4% 15.4%Proprietorial 13.8% 12.9%Clerical 34.4% 36.0%Skilled 25.2% 26.4%Unskilled 5.3%
Other 1.0%
7.1%2.2%
On Average Weekday TV SetOn:
All day 34.2% 19.3%5-6 hours 24.3% 23.5%3-4 hours 28.6% 35.7%2 hours or less 12.8% 21.3%
Of Those with UHF TV Sets:
Watch WLIW 40.7% 37.5%Watch WNYE 27.1% 25.7%Watch WNYC 63.3% 49.7%
24
CPB/OCR 211Page 22
only 26% of the non-viewing households had heads that young.
It was a highly educated audience, almost half of
the male heads of households having had at least some
college contrasted to 36% among the non-viewers. The
educational difference for the female heads of households,
while in the same direction, was not so strong. Despite
this educational bias, it should be noted that well over
half the viewing household heads were in either clerical
or skilled occupations and that professionals constituted
only one-fifth of the audience. The point is that while
persons from the higher socio-economic-educational strata
were more likely to watch WNET than those in the lower
strata, the WNET audience is a broad-ranged one which
cuts across all the strata.
The WNET households were much heavier users of TV
generally than were the households in the non-viewing
group. A third of the WNET viewing respondents said the
household TV was turned on "all day" contrasted to only
one-fifth of the non-viewers of WNET. Looking only at those
households in which there was a TV set capable of re-
ceiving UHF, the WNET viewing households were more likely
to have viewers of WNYC than the non-WNET households. The
differences for WLIW and WNYE, while in the same direction,
were negligible.
25

CPB/OCR 211Page 23
ETHNIC GROUPS
Table 9 presents comparisons of WNET viewing by
three major ethnic groupings: white, black, and Spanish-
speaking families. The percentage of respondents who
named a WNET program viewed during the past week was larger
in both minority groups than in the white group. What
deviation there was from the total sample is in the direction
of larger representation of minority viewers than would be
normally expected (Table 10).
When we look at the other two measures of WNET viewing
in Table 9, differences appear between the ethnic groups. On
the self-classification questions, there was no significant
difference between the three groups regarding the elementary
and pre-school children but Spanish-speaking adults were
considerably less likely than either black or white adults
to be regular viewers (regular viewing "fans" and once-a-
week viewers).
This difference was underlined in the response to the
question "who in the household watched WNET last week?"
Spanish-speaking adults were the least likely to have
watched. Young children were the most likely to have
viewed among all three ethnic groups, but WNET programs
seem to nave attracted more pre-school age children among
white families, more elementary school age children among
minority families.
4
26

CPB/OCR 211Page 24
TABLE 9
Ethnic Composition of WNET Audience
Named a WNET Pro ramWhites
(N=1,1iN)Blacks
Spanish -171siedTDIeek
(N=669) INTasy-
Yes 30.9% 35.5% 40.0%No 69.1% 64.7% 60.0%
Self-Classification ofWNET
Elementary and Pre-School age children*
Regular viewing "fails" 40.6% 37.2% 35.8%View once a week 10.0% 15.7% 13.8%View now and then, 31.0% 31.0% 27.6%Never view 18.4% 16.1% 22.8%
Adults
Regular viewing "fans" 9.3% 8.9% 5.6%View once a week 11.8% 12.1% 6.6%View now and then 51.7% 52.4% 46.5%Never view 27.1% 26.6% 41.4%
Who Watched WNET Last Week
Female Adult 24.3% 27.7% 16.4%Male Adult 19.0% 14.4% 6.5%Pre-school child* 70.4% 58.9% 62.3%Elementary school child* 40.0% 47.1% 44.1%Teenager* 19.1% 23.7% 5.9%
*Percentages based on families with children this age.
2 7
Yro
CPB/OCR 211Page 25
When we look at the types of WNET programs that were
named as having been viewed by someone in the household
during the preceding week (Table 11), these differences -
are reinforced. Among the Spanish-speaking families,
children's programs were named by 85% of all those able
to specify WNET programs contrasted to approximately 60%
for both white and black families. Music/Drama programs
scored most heavily among black families and public affairs
among white families.
The implication of this pattern is that while WNET
was attracting Spanish-speaking viewers in October, a far
greater proportion of WNET viewing among those families
was directed to children's programs than was the case for
whites and blacks,
Table 12 details certain information about the three
ethnic groups related to the above findings. TV viewing
generally was heavier among the two minority groups than
among whites, heaviest among the Spanish-speaking families.
And these families also were the most likely to have pre-school
and elementary school age children. They were also far more
likely than white families to have only one TV set in the
home.
VIEWER TYPES
In several points of the preceding analysis reference
has been made to the types of WNET programs reported as
*WNET's Spanish language series, "Realidades", began afterthis study.
28

CPB/OCR 211Page 26
TABLE 10
Ethnic Profile of WNET Audience
Do ViewWNET
Do Not ViewWNET
White 80.6% 82.8%
Black 14.9% 13.4%
Spanish-speaking 5.5% 3.8%
TABLE 11
Categories of WNET Programs Viewed
By Ethnic GroupsSpanish-
Program Types Named* Whites Blacks Speaking
Children's programs 59.8% 61.2% 85.3%
Public Affairs 24.4% 17.4% 10.8%
Music/Drama 28.7% 37.8% 10.9%
*Category responses not mutually exclusive.
29

CPB/OCR 211Page 27
TABLE 12
Ethnic ComparisonsSpanish-
TV Viewing Time Whites Blacks Speaking
TV set on "all day" 23.2% 28.5% 28.9%
Set on 5-6 hours a day 24.5% 20.4% 25.9%
Children in Family'
Pre-school children 17.7% 23.6% 34.7%Elementary schoolchildren 27.0% 29.6% 42.8%Teenagers 28.4% 28.2% 26.3%
Have Only One TV Set 39.9% 53.5% 56.0%
30

CPB/OCR 211Page 28
viewed within the household. By dividing respondents
according to the types of programs named, it was possible
to create four rough categories of viewer types: those
households in which viewing was limited to (1) children's
programs, (2) public affairs programs, (3) music or drama
programs plus (4) those in which viewing included programs of
two or more categories (combination viewers).
Table 13 contrasts these viewer types on a variety
of dimensions.
The largest of these groups was the "children's
program audience". Viewing in these households was over-
whelmingly limited to the young children in the family, but
these children were extremely loyal to the WNET programs
they do watch -- seven out of ten are categorized (by their
parents) as being regular viewing "fans" of WNET. Further, the
respondents for these households were the likely to name
more than one WNET program as having been viewed during the
'preceding week (probably a combination of "Sesame Street" with
either the "Electric Company" or "Misterogers' Neighborhood").
These children's program households were the heaviest users
of TV and their adult heads were generally the youngest
and had the lowest educational level of the four viewer types.
As might be expected, the group which showed the most
intensive overall use of WNET on the self-classification
31

CPB/OCR 211Page 29
Viewer Categories
TABLE 13
Contrasted
PublicChildren's Affairsonly onl
Music/Dramaonly
Combi-nation
(832) (298) (253)
Household TV seton:
All day 44.4% 22.7% 17.8% 28.9%6 hours or more 13.8% 6.4% 9.7% 8.3%'3-5 hours 36.5% 48.2% 48.3% 45.5%2 hours or less 5.3% 22.7% 24.2% 18.0%
Watch:
WLIW 35.4% 34.5% 51.1% 49.4%WNYE 24.3% 23.6% 33.0% 31.2%WNYC 58.3% 56.4% 73.3% 70.4%
Who Watched inLast Week:
Female Adult 19.6% 67.0% 76.4% 75.2%Male Adult 9.9% 54.7% 51.9% 56.4%Pre-school child* 94.6% 37.5%** 30.7% 89.1%Elementary school-age child* 73.3% 40.4% 36.0% 63.6%Teenager* 21.1% 46.2% 50.0% 16.4%
Named only oneMET program: 48.3% 81.3% 82.6% 11.1%
Watched 51st StateElection Specials: 7.2% 31.5% 15.5% 27.4%
*Based on families with children this age.**Base number less than 25.
32
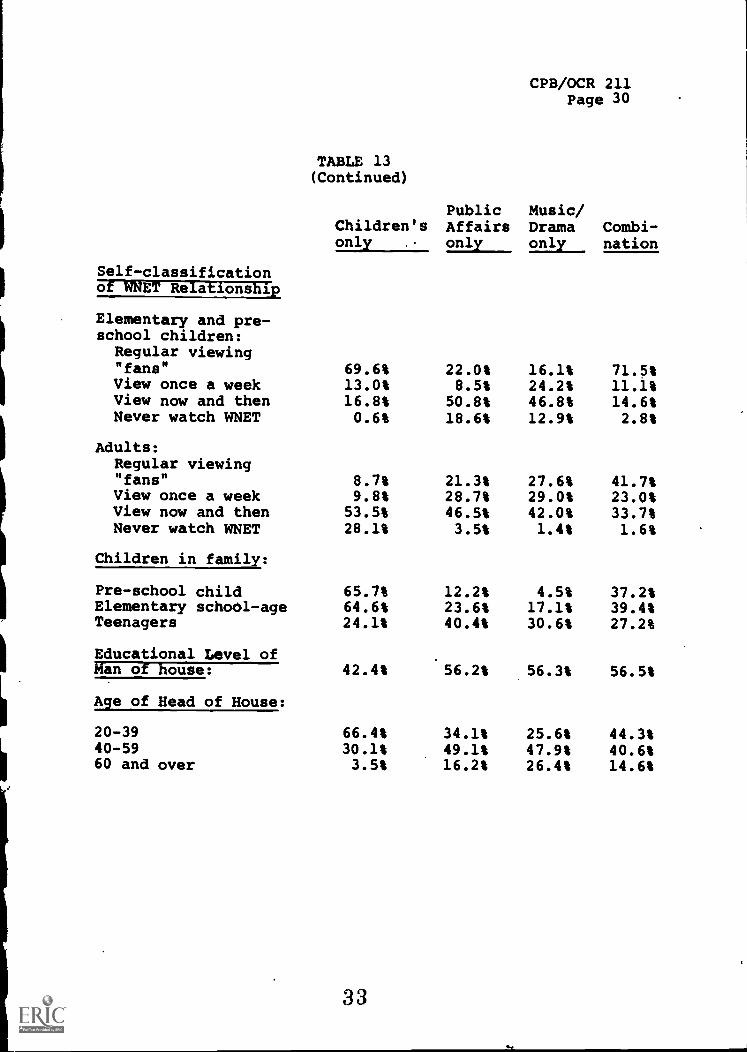
CPB/OCR 211Page 30
Self-classification
TABLE 13(Continued)
Children'sonly .
PublicAffairsonly
Music/Dramaonly
Combi-nation
of WNET Relationship
Elementary and pre-school children:Regular viewing"fans" 69.6% 22.0% 16.1% 71.5%View once a week 13.0% 8.5% 24.2% 11.1%View now and then 16.8% 50.8% 46.8% 14.6%Never watch WNET 0.6% 18.6% 12.9% 2.8%
Adults:Regular viewing"fans" 8.7% 21.3% 27.6% 41.7%View once a week 9.8% 28.7% 29.0% 23.0%View now and then 53.5% 46.5% 42.0% 33.7%Never watch WNET 28.1% 3.5% 1.4% 1.6%
Children in family:
Pre-school child 65.7% 12.2% 4.5% 37.2%Elementary school-age 64.6% 23.6% 17.1% 39.4%Teenagers 24.1% 40.4% 30.6% 27.2%
Educational Level ofMan of house: 42.4% 56.2% 56.3% 56.5%
Age of Head of House:
20-39 66.4% 34.1% 25.6% 44.3%40-59 30.1% 49.1% 47.9% 40.6%60 and over 3.5% 16.2% 26.4% 14.6%
33

CPB/OCR 211Page 31
questions were the "combination viewers." Regular view-
ing of WNET by young children among these households was
equal to that among the "children's only" households
while they also'showed the highest levels of adult view-
ing -- four out of ten saying the household adults were
"fans", another 23% reporting at least weekly viewing of
WNET. Further, about nine out of ten of the respondents
for these households named more than one WNET program as
having been viewed during the past week. While somewhat
older on the average than the "children's only" households,
these "combination" families were younger than the "public
affairs", "music/drama" households.
The second largest of the viewer types was that
composed of households in which only music or drama pro-
grams were watched during the preceding week. This
was the oldest of the four groups. The "public affairs"
households constituted the smallest of the four viewer
group's. It showed the lowest degree of involvement with
the station in terms of self-classification of adults and
children of the four groups. Like the "music/drama" group,
eight out of ten of these respondents named only one WNET
program viewed during the preceding week.
Between the "public affairs", "music/drama", and "combination"
households, there was no educational difference. Overall
use of TV was lowest among the "public affairs" and the
34

CPB/OCR 211Page 32
"music /drama" groups; viewing of the three public UHF stations
in the New York area was highest among the "music/drama" and
"combination" groups; viewing of WNET's 51st State Election
Specials was highest among the "public affairs" and "combina-
tion" groups.
The implication, then, of the data in Table 13 is that
there are, indeed, several WNET audiences. By far the largest
is one in which WNET viewing is primarily restricted to the
young children. In addition there are at least two rather
distinct adult audiences: those who are drawn to the station
primarily by its "cultural" offerings in the field of drama
and music and those who were attracted by its public affairs
programming.
This question of different adult viewer typologies
suggests itself as one of the most interesting for future
research.
35
CPB/OCR 211Page 33
VIEWING OF ELECTION SPECIALS
During the period of the survey, WNET was broad-
casting a special series of programs on the forthcoming
election, focusing on the various New York-area candidates
hnd issues. These were presented as Election Specials of
the station's major local public affairs series, "51st
State". Respondents were asked whether anyone in the
household had watched any of these programs. The results
are detailed in Table 14.
Some seven percent of the respondents indicated
that at least one of the series had been watched and two
percent said two or more had been viewed.
Among those households categorized as WNET viewers
(where the respondent could name a WNET program viewed
during the preceding week), the viewing level was slightly
higher, about 12% having viewed at least one program, 4%
having viewed two or more. In Table 13 we have already
seen that among the WNET viewers, the "public affairs" and
"combination" viewer groups were the most likely to have
watched one of these 51st State Election Specials. Table 15
shows, as we, might expect, that the very highest level of
viewing -- 22% -- was reported by respondents where the
adults are "WNET fans" and that those who did view generally
had more higher education than those who did not. However, it
should be noted that despite this strong relation of viewing
36
CPB/OCR 211Page 34
to education, only 10.6% of those who had gone to college
said they had watched any of the programs (data not shown
in the table).
37

CPB/OCR 211Page 35
TABLE 14
Viewing of 51st State ElectionSpecials
NewYork
LongIsland
NorthSuburbs Newark
TotalSample,
Saw:
None 93.1% 92.0% 89.4% 94.3ss 93.0%One show 4.7% 4.9% 7.4% 4.0% 4.7%Two or moreshows 2.2% 3.1% 3.2% 1.6% 2.2%
Of WNET "viewers":
88.2% did not view7.6% saw one program4.1% saw two or more programs
TABLE51st State Election Specials
Viewing by Self-ClassificationGroups of WNET Viewers
Never
1ChildrourlWatchWNET:Thowiglotthen Weekly Viewing fans
Saw none: 94.6% 92.2% 89.1% 91.9%
Adults Watch WNET:
Saw none: 98.6% 93.1% 88.4% 78.0%Saw one: 1.0% 4.7% 8.8% 13.1%Saw two or more: .4% 2.2% 2.8% 8.1%
Number of Specials Seen
None One Two or more
Didn't finishhigh school 21.5% 15.8% 12.2%Finished highschool 48.6% 39.6% 42.1%Went to college 28.5% 44.6% 44.9%
38
CPB/OCR 211Page 36
VIEWING OF UHF PUBLIC TELEVISION STATIONS
As noted in the first section of this report, there
are three public television stations operating on UF
frequencies in metropolitan New York.
WLIW, channel 21, located in Garden City, Long Island,
is licensed to the Long Island Educational TV Council, Inc.
It began operation in 1969. Operating on a Monday through
Friday schedule, it provides in-school programming during
the day and general adult programs in the evening. It is
not interconnected with PBS.
WNYE, channel 25, licensed to the City School Board of
New York, operates from studios in Brooklyn. Although inter-
connected with PBS network and providing some general audience
programs on weekday evenings, most of WNYE's programming
consists of programs for in-school use. In addition, some
in-service training programs for teachers are offered
during the evening.
WNYC, channel 31, is the only municipally-owned and
operated station in the nation. Located in Manhattan, almost
40% of its programming is locally produced and approximately
17% of tie weekly schedule is devoted to instructional
programs. Half of the daily WNYC schedule is taken from
PBS.
Respondents were asked, in turn, if they had ever
viewed each of these channels. In the question each
station was identified by call letters and channel number.
39

CPS /OCR 211Page 37
For the total sample the percent responding "yes" was:
WLIW 7.9%WNYE 5.3%WNYC 11.4%
However, since approximately half of the respondents had
indicated that their homes did not contain a UHF set, it
seems reasonable to adjust the percentages, projecting the
affirmative responses against the base of UHF households.*
Of those households in which it was indicated that there was
a UHF receiver, the "yes" responses were:
WLIW 14.9%WNYE 9.7%WNYC 21.5%
In the tables which follow, the characteristics of
viewers of these stations were presented together with
comparable figures for WNET and for the total sample. However,
it should be remembered that there was no specific criteria
of program naming or recency of viewing for the UHF stations
whereas "viewers" of WNET included only those who could name
a WNET program viewed by someone in the household during the
preceding week.
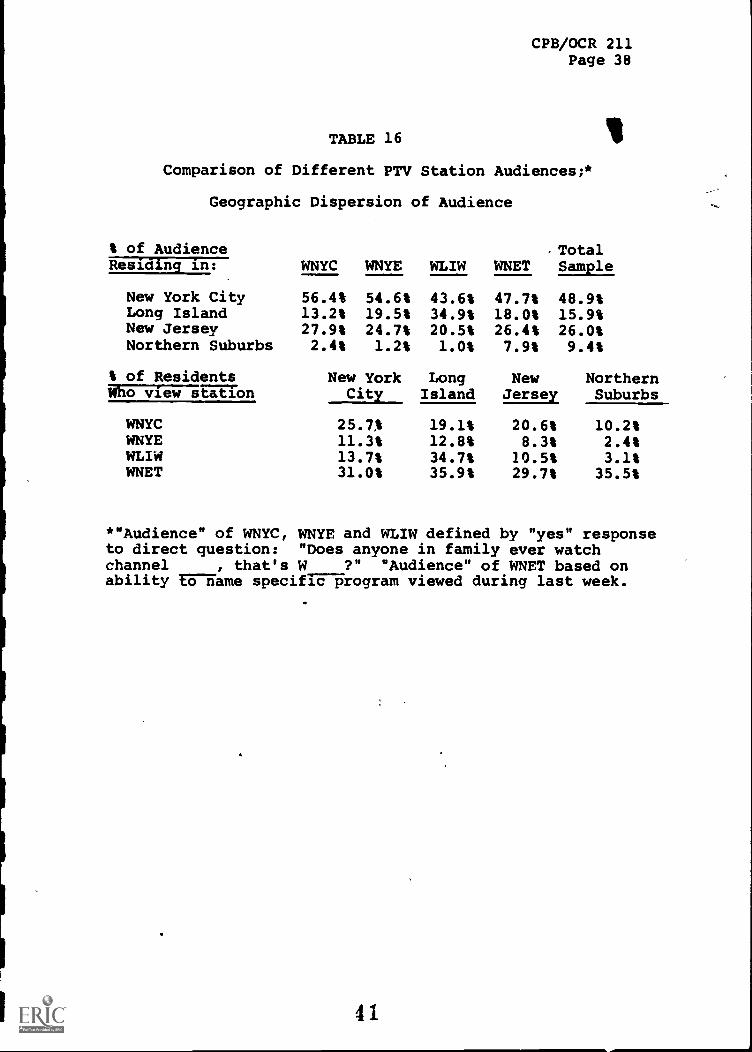
Table 16 gives the geographic dispersion of the audiences
of the several stations. As might be expected both WNYC
and WNYE showed a somewhat disproportionately large segment of
their audience coming from the City of New York while WLIW
drew a disproportionately large percentage from its home
base of operation, Long Island. All three of the UHF
*The reader is reminded that there may be an inflation heresince the percent of homes reporting UHF is lower thanindustry reports estimate.
40
CPB/OCR 211Page 38
TABLE 16
Comparison of Different PTV Station Audiences;*
Geographic Dispersion of Audience
% of AudienceResiding in: WNYC WNYE
TotalWLIW WNET Sample,
New York City 56.4% 54.6% 43.6% 47.7% 48.9%Long Island 13.2% 19.5% 34.9% 18.0% 15.9%New Jersey 27.9% 24.7% 20.5% 26.4% 26.0%Northern Suburbs 2.4% 1.2% 1.0% 7.9% 9.4%
% of ResidentsWho view station
New York Long NewCity Island Jersey
NorthernSuburbs
WNYC 25.7% 19.1% 20.6% 10.2%WNYE 11.3% 12.8% 8.3% 2.4%WLIW 13.7% 34.7% 10.5% 3.1%WNET 31.0% 35.9% 29.7% 35.5%
*"Audience" of WNYC, WNYE and WLIW defined by "yes" responseto direct question: "Does anyone in family ever watchchannel , that's W ?" "Audience" of WNET based onability Urfame specific program viewed during last week.
41

CPB/OCR 211Page .39
stations drew very few of their viewers from the Westchester/
White Plains area suburbs, where WNET does quite well.
Viewing of public television generally -- whether the
VHF WNET or the three UHF stations -- increases with the
availability of multiple TV sets in the home (Table 17).
There is also some indication that viewing -- particularly
for the UHF stations -- increases with cable. This should
be expected, since the general practice of cable operators
is to transpose the UHF stations onto empty locations on
the VHF dial. This, in effect, eliminated the fine-tuning
handicap faced by UHF stations.
Generally, the daily TV time was higher than average
in public television households, although this,trend was
not as marked in the UHF homes as in WNET homes. This
was undoubtedly related to a higher likelihood (as compared
to the total sample) in public television homes that
pre-school and elementary children watched TV during the
day.
This factor, however, is less important for the UHF
stations than for WNET, as can be seen by the relative
precentages of young children in the viewing households
(Table 18). While the three UHF viewing groups were more
likely to contain such children than was the total sample,
their divergence from the sample percentages was generally
small whereas WNET's was more than double for pre-school
42

CPB/OCR 211Page 40
TABLE 17
Comparison of Different PTV Station Audiences:
Media Availability and Patterns of Use
WNYCNumber of Sets (N=550)
Viewers*of:WNYE WLIW WHET(N=250) (N=381) (N=1,590)
TotalSample(N =5, 025)
Only one set 29.7% 28.7% 26.2% 27.5% 42.4%More than oneset 70.3% 71.3% 73.8% 72.6% 55.6%
Subscribe to Cable 9.7% 6.2% 10.9% 4.6% 3.7%
On Average Weekday,TV Set Turned on:
"All Day" 27.8% 25.2% 24.7% 34.2% 23.6%6 hours or more 12.4% 11.6% 12.3% 11.2% 10.1%3-5 hours 44.5% 49.6% 48.6% 41.7% 45.9%2 hours or less 14.2% 12.8% 13.4% 11.81 16.5%Usually not on 1.1% .8% 1.0% 1.0% 1.8%
Who Watches TV Duringthe Day on Weekdays:
Female adult 37.3% 36.1% 35.4% 38.8% 35.3%Male adult 9.1% 11.2% 8.2% 6.3% 7.6%Pre-school child `10.3% 72.4% 65.4% 75.2% 63.5%Elementary child "47.9% 47.7% 34.9% 40.0% 35.5%Teenager** 24.1% 22.3% 16.5% 21.6% 18.8%
*See footnote for Table 16**Percentages based on families with children in this
age group.
4i3

CPB/OCR 211Page 41
TABLE 18
Comparison of Different PTV Station Audiences:
Profile of Individual Station Audiences*
Number in Household WNYC WNYE WLIW WNETTotalSample
Single person 7.8% 6.8% 6.0% 5.0% 10.4%2 persons 20.9% 21.5% 20.7% 14.9% 27.3%3 persons 21.1% 25.9% 22.6% 19.4% 19.0%4 persons 24.9% 22.7% 24.1% 27.5% 19.4%5 persons 12.7% 13.5% 14.2% 18.4% 12.3%6 persons or more 12.6% 9.6% 12.3% 14.7% 9.1%
Children in Household
Pre-school age 25.3% 23.9% 22.8% 42.9% 18.5%Elementary age 30.9% 27.2% 33.7% 46.8% 27.0%Teenager 34.6% 31.4% 35.9% 28.1% 27.2%
Age of Head of Household
Under 30 17.7% 22.1% 21.3% 17.3% 12.8%30-39 24.9% 21.7% 22.7% 33.9% 17.4%40-49 28.2% 29.2% 25.3% 23.5% 20.0%50-59 16.9% 14.6% 19.3% 14.0% 17.4%60-69 8.3% 8.8% 9.5% 7.9% 12.0%70's and over 3.6% 3.1% 1.7% 3.1% 6.2%
Education of MaleHead of Household
Elementary school 3.8% 3.4% 2.9% 3.5% 7.6%Did not finishhigh school 9.0% 6.9% 4.9% 8.8% 13.2%Finished high school 37.7% 35.6% 34.7% 37.8% 48.0%Some college 16.6% 20.2% 16.5% 14.2% 13.7%BA or equivalent 22.8% 22.7% 26.0% 22.2% 12.5%Graduate work 8.8% 8.6% 12.4% 12.4% 3.9%
Ethnic Group
White 75.2% 81.7% 82.4% 80.6% 77.3%Black 15.5% 9.8% 10.8% 14.9% 13.3%Spanish-speaking 5.5% 6.5% 5.0% 5.5% 4.2%
*See footnote to Table 16"Refusals" account for missing percentages.
4 4

V
CPB/OCR 211Page 42
children, about two-thirds again as large for elementary
children.
The parallel entries in Table 19 put this finding in
even more dramatic form. Comparing families who do and do
not have young children, there is only a small tendency for
those with children to exceed those without ip)viewing of
the UHF stations. But 72.0% of the families with pre-school
children were WNET viewers contrasted to only 22.8% of the
families without children in that age group.
Similarly, while the families in the audiences of the
three UHF stations tended to be larger and younger than the
total sample, the difference was less marked than for the
WNET viewer group.
The profiles of all the PTV stations showed a bias
toward the higher-educated (Table 18),. However, both
WNYC and WNYE actually showed less variation in the propor-
tion of each education group they attracted than did WLIW and
WNET (Table 19).
All the stations seemed to do relatively well with the
two major minority groups, blacks and the Spanish-speaking.
This is best seen in Table 19 where both WNYC and WNET attracted
a larger proportion of the minority groups than of whites.
WNYE did better with Spanish-speaking families than with
white families, WLIW attracted proportionately as many of

CPB/OCR 211Page 43
TABLE 19
Comparison of Different PTV Station Audiences*Percent of Various Demographic Sub-Groups
Watching Each Station
Number in Household WNYC
Single persons2 persons3 persons4 persons5 persons6 persons7 persons
Pre-school Children?
YesNo
Elementary Children?
YesNo
Teenagers?
YesNo
Age of Head of House
28.1%18.6%22.4%24.7%20.0%27.3%22.6%
25.5%21.1%
21.8%22.4%
23.9%21.4%
Under 30 25.1%30-39 24.9%40-49 25.9%50-59 19.0%60-69 17.4%70 and over 20.3%
Education of MaleHead'of-Household
Elementary school 18.6%Did not finishhigh school 23.1%Finished high school 20.4%Some college 25.5%BA or equivalent 25.7%Graduate work 20.7%
Ethnic GroupWhite 20.6%Black 32.6%Spanish-speaking 30.2%
*See footnote to Table 16
WNYE WLIW WNET
11.1% 15.0% 15.2%8.8% 12.8% 17.3%
12.5% 16.6% 32.3%10.3% 16.6% 44.7%9.7% 15.4% 47.5%
10.4% 15,6% 43.9%3.2% 17.7% 47.9%
10.9% 15.8% 72.0%9.8% 15.0% 22.8%
8.7% 16.4% 54.3%10.7% 14.8% 23.8%
5.8% 17.1% 31.8%10.1% 14.4% 32.1%
14.1% 20.8% 40.3%9.8% 15.7% 56.4%
12.0% 16.0% 34.1%7.4% 12.0% 23.2%8.3% 13.6% 19.0%8.7% 8.7% 15.4%
7.8% 9.8% 20.7%
8.2% 8.7% 27.3%9.0% 13.0% 31.0%
14.5% 17.5% 34.8%12.0% 20.3% 40.4%9.4% 20.2% 50.0%
10.2% 15.8% 30.9%9.3% 15.5% 35.5%
13.8% 12.9% 40.0%
46

CPB/OCR 211Page 44
the black families as white families.*
The four stations are unique from the standpoint either of location,
type of parent organization, program emphasis--or combination of these.
The question then arises as to whether or not they have specific audiences.
Table 20 details the overlap of audience between stations.
As should be expected due to its advantage as a VHF station and its
generally larger audience, %NET had the largest exclusive audience; over
three-quarters of those who were classified as WNET viewers did not watch
any of the UHF stations. At the other extreme was WNYE. Not only did it
have the smallest audience of the four stations, of those who said there
was viewing of the station within the home over nine out of ten also
watched other public television stations. Both WLIW and WNYC had a cadre
of viewers they did not share with other public stations, ranging from
one-fifth to one-quarter.
The second part of Table 20 details how each station shared viewers
with other public stations. Perhaps the most surprising factor was that
despite its great predominance, WNET was viewed by only half of each of
the other station's viewers. Both WNYC and WLIW gained a larger share of
WNYE's audience than did WNET, and WNYC also gained more of WEIW's viewers
than did WNET. This suggests that there is a small nuclear audience of
UHF public television.
*The apparent contradiction in Table 18, where WNYE, WLIW and WNET allhave larger percentages of whites among their viewers than would be ex-pected on the basis of the total sample, is due to the higher rate ofrefusal to answer the question in the total sample than among the audiencesof these stations. It should be kept in mind, however, that there isthought to be a greater socio-economic bias among minority groups thanamong whites with regard to possession of a telephone. If true, thiswould mean the present data tend to inflate the proportion of minorityviewers.
4 7

CPB/OCR 211Page 45
TABLE 20
Cross-channel Viewing of PublicTelevision Stations
% of Station's Audience* Which Is:
Exclusive Shared
WNET 76.6% 23.4%
WNYC 25.1% 74.9%
WNYE 7.9% 92.1%
WLIW 21.3% 78.7%
Who Also View:
% of Audience* of These Stations
WNET WNYE WNYC WLIW
WNET 46.2% 50.0% 46.7%
WNYE 7.2% 39.3% 46.8%
WNYC 17.2% 83.6% 58.0%
WLIW 11.2% 70.9% 41.0%
*See footnote for Table 16.
43