DOCUMENT RESUME - files.eric.ed.gov for its content. Cecilia Rivera-Casale ... Massachusetts CETA...
121
ED 241 618 AUTHOR TITLE INSTITUTION SPONS AGENCY PUB DATE GRANT NOTE PUB TYPE DOCUMENT RESUME UD 023 317 Rivera-Casale, Cecilia; And Others Can Employer or Worker Subsidies Raise Youth Employment? An Evaluation of Two Financial Incentive Programs for Disadvantaged Youth. Final_Report. Brandeis Univ., Waltham, Mass. Florence Heller Graduate School for Advanced Studies in Social Welfare. Office of Youth programs (DOL), Washington, D.C. Sep 82 99-8-1879-33-41 122p.; A publication of the Center for Employment and Income Studies (CEIS). For a related document, see UD 023 318. Reports - Evaluative/Feasibility (142) EDRS PRICE MF01/PC05 Plus Postage. DESCRIPTORS *Demonstration Programs; *Disadvantaged Youth; *Employees; *Employers; Grants; *Incentives; Job Search Methods; Program Effectiveness; Program Evaluation; *Youth Employment IDENTIFIERS Cambridge Job Factory Voucher Experiment MA; *Employment Subsidies; Employment Vouchers; Wilkes Barre Job Research Voucher Experiment PA ABSTRACT In order to test the effects of financial subsidies on employment for disadvantaged youth, two experimental situations were set up: (1) a worker subsidy operating in Cambridge, Massachusetts, and (2) an employer subsidy operating in Wilkes-Barre, Pennsylvania. The first project, the Cambridge Job Factory Voucher Experiment, tested a voucher payment directly to youth combined with a job search assistance program. In order to separate the effects of these two treatments, two experimental groups (full-treatment and voucher only) and a control group were used. The second project, the Wilkes-Barre Job Search Voucher Experiment, tested the impact of making wage vouchers or tax subsidies available to employers hiring disadvantaged youth. To distinguish the new experimental vouchers from the Target Job Tax Credit (TJTC) already available to firms hiring 18-24 year olds, the new voucher was given only to firms hiring 16-17 year olds. The experimental design was set up in such a way that the new voucher could be compared with TJTC. The findings from the study suggest that employee wage subsidies do raise the employment prospects of disadvantaged youth. Wage subsidies paid directly to youth are more effective than wage subsidies combined with other services such as job search assistance. The study finds no evidence to support the policy of employer-based wage subsidies for hiring disadvantaged youth, either in the form of vouchers or TJTC. (Author/CMG) *********************************************************************** Reproductions supplied by EDRS are the best that can be made from the original document. ***********************************************************************
Transcript of DOCUMENT RESUME - files.eric.ed.gov for its content. Cecilia Rivera-Casale ... Massachusetts CETA...

ED 241 618
AUTHORTITLE
INSTITUTION
SPONS AGENCYPUB DATEGRANTNOTE
PUB TYPE
DOCUMENT RESUME
UD 023 317
Rivera-Casale, Cecilia; And OthersCan Employer or Worker Subsidies Raise YouthEmployment? An Evaluation of Two Financial IncentivePrograms for Disadvantaged Youth. Final_Report.Brandeis Univ., Waltham, Mass. Florence HellerGraduate School for Advanced Studies in SocialWelfare.Office of Youth programs (DOL), Washington, D.C.Sep 8299-8-1879-33-41122p.; A publication of the Center for Employment andIncome Studies (CEIS). For a related document, see UD023 318.Reports - Evaluative/Feasibility (142)
EDRS PRICE MF01/PC05 Plus Postage.DESCRIPTORS *Demonstration Programs; *Disadvantaged Youth;
*Employees; *Employers; Grants; *Incentives; JobSearch Methods; Program Effectiveness; ProgramEvaluation; *Youth Employment
IDENTIFIERS Cambridge Job Factory Voucher Experiment MA;*Employment Subsidies; Employment Vouchers; WilkesBarre Job Research Voucher Experiment PA
ABSTRACTIn order to test the effects of financial subsidies
on employment for disadvantaged youth, two experimental situationswere set up: (1) a worker subsidy operating in Cambridge,Massachusetts, and (2) an employer subsidy operating in Wilkes-Barre,Pennsylvania. The first project, the Cambridge Job Factory VoucherExperiment, tested a voucher payment directly to youth combined witha job search assistance program. In order to separate the effects ofthese two treatments, two experimental groups (full-treatment andvoucher only) and a control group were used. The second project, theWilkes-Barre Job Search Voucher Experiment, tested the impact ofmaking wage vouchers or tax subsidies available to employers hiringdisadvantaged youth. To distinguish the new experimental vouchersfrom the Target Job Tax Credit (TJTC) already available to firmshiring 18-24 year olds, the new voucher was given only to firmshiring 16-17 year olds. The experimental design was set up in such away that the new voucher could be compared with TJTC. The findingsfrom the study suggest that employee wage subsidies do raise theemployment prospects of disadvantaged youth. Wage subsidies paiddirectly to youth are more effective than wage subsidies combinedwith other services such as job search assistance. The study finds noevidence to support the policy of employer-based wage subsidies forhiring disadvantaged youth, either in the form of vouchers or TJTC.(Author/CMG)
***********************************************************************Reproductions supplied by EDRS are the best that can be made
from the original document.***********************************************************************
1
"PERMISSION TO REPRODUCE THISMATERIAL HAS BEEN GRANTED BY
Andre,...) 1-i&im NuHe 0,2( Grad
TO THE EDUCATIONAL RESOURCESINFORMATION CENTER (ERIC)."
Can Employer or Worker SubsidiesRaise Youth Employment?
An Evaluation of TwoFinancial Incentive Programs for
Disadvantaged Youth
by
Cecilia Rivera-Casale, Barry Friedman'and Robert Lerman
FINAL REPORT
U.S. DEPARTMENT Of EDUCATIONNATIONAL INSTITUTE OF EDUCATION
EDUCATIONAL RESOURCES INFORMATIONCENTER IERiel
This document has been rePlOdUCed OSreceived hem the Person or organizationoriginating 0.minor changes have been made to ',Wove
lePfeductinn quality.
Poing, of view or opinions stated in this docu-ment do not necessarily lepresent Oficial NIE
position or policy.
Center for Employment & Income Studies (CEIS)The Florence Heller Graduate Schoolfor Advanced Studies in Social WElfare
Brandeis UniversityWaltham,_ Massachusetts 02254
September, 1982

I
IIIIII1
IIIIIIIIII
The material in this project was prepared under GrantNo. 99-8-1879-33-41 from the Office of Youth Programs,U.S. Department of Labor, under the authority of the YouthEmployment and Demonstrations Project Act. Researchersundertaking such projects with Government sponsorship areencouraged to express fully their professional judgment.Therefore, points of view or opinions stated in this docu-ment do not necessarily represent the official position orpolicy of the Department of Labor.
ii3

1
Acknowledgements
The evaluation of the Cambridge, Massachusetts, Job Search VoucherProgram and the Youth Employment Service in Wilkes-Barre, Pennsylvania, isthe product of the effort and cooperation of program operators, evaluationstaff and program participants. We are specially grateful to PatriciaTankard and Timothy Reidy of COMA, and to Frank Hines and Richard Borofskyof YES.
This study is one component of a series of youth employment evalu-ation projects under the Knowledge Development Retrieval Project at theCenter for Employment and Income Studies. The authors would like toexpress their recognition to other CEIS colleagues for their collaboration.Jay Michaud and Paula Paris provided valuable research assistance. SharonSimmons, Peter Hodsdon and Ellen Chayet were in charge of programming acti-vities. Annette Slocombe typed the final report. We also want to thankPatricia Luzetsky, Thomas Evans, Lisa Handler, and Hildy Feinberg whoserved as interviewers and coders. We also thank the U. S. Department ofLabor for funding the project. The DOL bears no responsibility for theinterpretations and opinions expressed in the text. Only the authors areresponsible for its content.
Cecilia Rivera-CasaleBarry FriedmanRobert Lerman
September, 1982
4
Executive Summary
Among the possible reasons for low youth employment, some haveemphasized adverse incentives. Employers may find.costs of the minimumwage, initial hiring expenses, on the job training and fringe benefitstoo high in relation to the expected marginal productivity of youth to wantto hire them. A similar argument could be made on the side of the youththemselves; they may see their potential gain from work too unrewarding inrelation to alternative activities. If there is a problem with incentivesin youth labor markets, one possible remedy is to change the incentives byoffering financial subsidies. This evaluation reports on tests of twotypes of subsidies: 1) an employer subsidy that operated in Wilkes-Barre, PA;and 2) a worker subsidy that operated in Cambridge, MA.
The Office of Youth Programs (OYP) in the Department of Labor fundedthese projects as part of the knowledge development effort mandated underYEDPA. These projects also constituted D0L's response to Section 317 ofthe 1978 CETA reauthorization, under which Congress directed the Secretaryto test wage vouchers. Each experiment was initiated within the frameworkof an existing job search assistance program: the Job Factory run by theCambridge, Massachusetts CETA Prime Sponsor, and the Workshop Program runby the Youth Employment Service of Luzern County (YES) in Wilkes-Barre,Pennsylvania. There are two primary advantages to linking the voucherdemonstration to job search assistance (JSA) programs. First, it is usefulto have JSA agencies provide an administrative mechanism for enrolling andcertifying youth as job-ready. JSA programs were a convenient vehicle forreaching employers in Wilkes-Barre and youth in Cambridge who are eligiblefor subsidy payments. Second, youth who are eligible for the demonstrationbenefit from a critically important pre-employment service that may increasetheir probabilities of being hired in the private sector.
The Carnbrid'e Job Factor Voucher Ex eriment
The project in Cambridge tested a voucher payment directly to youthcombined with a job search assistance program. In order to separate theeffects of these two treatments, we established two experimental groups(full-treatment and voucher-only), and a control group.
Youth in the full-treatment group received structured intensive jobsearch training and assistance for periods of up to 4 weeks as well asaccess to a voucher. For each hour of instruction or active job searchunder the Job Factory, youth received stipends equal to the minimum wage.In addition, youth in the full-treatment or in the voucher-only group whosucceeded in obtaining unsubsidized jobs were paid a direct supplementalwage bonus for each hour of paid employment during 12 weeks after their jobscommenced. The vouchers equalled $1.50 per hour for the first two weeksand $1.00 per hour for the subsequent 10 weeks.
iv

The Wilkes-Barre Job Search Voucher Experiment
The Wilkes-Barre project (run by the Youth Employment Service, alocal community based organization tested the impact of making wage vouchersor tax subsidies available to employers hiring disadvantaged youth. In
Wilkes-Barre the unit of observation was the employer. The design requireda three-way division of employers. After stratifying firms by size, industryand location employers were randomly assigned to one of three categories.Employers assigned to Group I were (I) encouraged to hire low income18-24 year olds and take advtntage of TJTC; (2) offered a special wagevoucher subsidy to employ 16-17 year olds served by YES program. Employersin Group II were encouraged to use TJTC but had no access to the specialwage subsidy for hiring younger youth. Control group employers were notcontacted or eligible for the special wage voucher subsidy.
The size of the voucher payment to an eligible employer hiring lowincome 16-17 year olds was $1.80 per hour during the first three months theyouth worked for the firm, and $1.00 per hour for the next five months theyouth was employed by the firm. The Workshop program run by YES providedjob search assistance to two groups of youth assigned on the basis of income.
Sample
The total number of youth assigned to the Cambridge experiment was399; 161 in the full-treatment group, 130 in the voucher-only group and108 in the control group. In Wilkes-Barre 125 employers were assigned toeach of the three groups, and 479 youth were enrolled in the two treatmentgroups.
Summary of Findings
A. Process Analysis Results
The two job search assistance programs experienced implementationdifficAties for different reasons. The Cambridge Job Factory operatedunder the following constraints:
o Enrollment of participants in the full-treatment group.was down compared to last year's enrollment. Job Factorystaff relied on interagency referrals as a source ofapplicants. Instead of developing a recruitment networkthat could be utilized to attract youth to the program,counselors had to promote and recruit youth a few days be-fore each cycle was to begin.
r-.
v 6

o The Job Factory program experienced personnel turnoveramong the top administrators. The last two cycles ofthe Job Factory were particularly affected by theseadministrative changes.
o Changes in physical location of the program affected theability of the staff to perform their training functions.
The Wilkes-Barre program experienced the following difficulties:
o Underenrollment in the first 3 months of program operation.
o Recruitment difficulties that stemmed from competition withother youth programs, e.g., CETA, and the fact that YES didnot offer stipend payments for program participation.
o Average amount of program time spent by participants waslimited, and generally less than 10 hours.
o Late beginning of promotional activities for the employervoucher program.
o Personnel experienced high turnover rates, both at theexecutive and the program operator's level.
B. Impact Analysis Results
The evaluation studied differences in the employment levels, qualityof jobs found, the persistence of employment effects, and the extent ofvoucher use.
To summarize, the basic findings of the impact evaluation in Cambridge:
1) a voucher paid to workers consistently raised employment of disad-vantaged youth;
2) the voucher impacts rose over time through 5 months after the startof the program;
3) the combined Job Factory plus voucher treatment produced employmentgains in the initial period after program startup; but
4) the combined treatment did no better and sometimes worse than thevoucher alone in later periods;
5) the positive employment effects in the combined treatment group didnot seem to result from more intensive job search assistance;
6) the voucher-only and full treatments appear to have caused onlyslight increases in job tenure;
vi

7) the voucher-only treatment is able to increase 'job finding amongdisadvantaged youth at a lower cost compared to the full treatment.
In Wilkes-Barre, we found:
1) virtually no employers in any of the experimental groups tookthe voucher or used the TJTC.
2) the lack of response of firms to both the wage subsidy voucherand TJTC cannot be attributed entirely to the employment patternsof selected employers;
3) youth who went through the program showed employment rates ashigh as those experienced by Cambridge youth.
Given the small, single site nature of the experiments, we must becautious in drawing implications and making generalizations. The fact thatthe demonstrations utilized an experimental design does add some weight tothe importance of the findings. Nevertheless, the results can have relevanceto national policy only in the context of other studies of program effect-iveness and the behavioral responses by workers and firms.
The findings do indicate that the availability of voucher paymentsencouraged youth to take jobs at lower wages than they would have withoutthe subsidies.
The nonresponse by employers to the offer of subsidies in Wilkes-Barre lend support for the idea that highly targeted subsidies are unlikelyto yield gains for disadvantaged workers.
The findings from this study suggest that employee wage subsidiesdo raise the employment prospects of disadvantaged youth. Wage subsidiespaid directly to youth are more effective than wage subsidies combinedwith other services such as job search assistance. The study finds noevidence to support the policy of employer-based wage subsidies for hiringdisadvantaged youth.
vii

II1
1
I1
1
III1
III
II1
I
Table of Contents
Page
Executive Summary iv
Chapter 1 Introduction .. 1
1.0 Introduction 1
1.1 The Wilkes-Barre and Cambridge Voucher/Job SearchProjects 2
1.2 The Plan of This Report 5
Chapter 2 Review of Literature on Employment Subsidies 6
2.0 Background on Employment Subsidy Issues 6
2.1 Theory and Practice in Employer Wage Subsidies 7
2.2 Experience with the Targeted Jobs Tax Credit fi2.3 Outcomes of Employer Subsidy Demonstration Projects 16
Chapter 3 The Job Search Wage Subsidy Project in Cambridge 21
3.0 Design of the Experiment 21
3.1 The Treatments 21
a. The Voucher 23
b. The Job Factory 23
3.1.1 Eligibility and Recruitment 26
3.2 The Actual Operation of the Cambridge Job FactoryVoucher Program 28
3.2.1 Recruitment and Enrollment 28
3.2.2 The Actual Operation of the Treatment 31
a. Job Search Assistance 31
b. The Voucher 33
3.2.3 Participant's Evaluation of Program Experiences 35
viii
9
14-

Page
3.2.4 The Transition in the Administration of theCambridge Prime Sponsor: From Consortiumto Central Authority 37
Chapter 4 The Effects of Employee Wage Subsidies inCambridge 42
4.1 The Expected Effects 42
4.2 The Data and Methodology 45
4.3 The Basic Employment Results 48
4.4 Employment Effects: Timing and Mechanisms 53
4.5
Chapter 5
5.1
5.2
4.4.2 Job Search, Job Acceptance'and Job Retention 56
Employment Effects in Relation to Costs 67
The Effects of Employer Wage Subsidies in Wilkes-Bure74
Design of the Experiment 74
5.1.1 The Treatments Directed at Employers andRandom Assignment 75
5.1.2. The Workshop 78
Evaluation of the Wilkes-Barre Job SearchVoucher Project 79
5.2.1 Employer Treatments and Their Impacts 80
5.2.1.1 YES Contacts with Employers 80
5.2.1.2 Impacts of Employer Treatments 81
5.2.2 The Job Search Workshop 85
5.2.2.1 Recruitment and Enrollment 85
5.2.2.2 Structure of the Workshop Programs 88
5.2.2.3 Work Experiences among WorkshopParticipants 90
5.2.2.4 Administration of the Workshop 92
5.3 Program Costs 96
ix10

Page
Chapter 6 Conclusions and Policy Implications 98
6.1 The Findings 99
6.2 Implications for Policy 102
Appendix A-1 103
x
11

List of Tables
Page
Table 3-1 Summary of Experimental Interventions in Cambridge 22
Table 3-2 Cambridge Job Search Voucher Enrollments 30
Table 3-3 Cambridge Job Factory Participation by Cycle 33A
Table 3-4 Rank Order of Cambridge Job Factory Program Components 36
Table 4-1 Schedule and Responses on Surveys 47
Table 4.2 Youth Who Had Worked between Follow-Ups 49
Table 4.3 Logit Analyses of Whether the Person Had Worked 51
Table 4.4 Predicted Effects on Probability of Working withExperimental Treatments - 52
Table 4.5 Voucher Use and Employment 55
Table 4.6 Intensity of Search among Cambridge Employed Youthat Each Follow-Up by Group 57
Table 4.7 Mean Wage Rates 59
Table 4-8 Regression Analysis of Wage Rates 60
Table 4-9 Distribution of Job Finders among OccupationalCategories as of First Follow-Up in Cambridge 62
Table 4-10 Characteristics of Work Experiences among Those WhoDid Find Jobs 63
Table 4-11 Job Retention 64
Table 4-12 Mean Voucher Payments per Youth 66
Table 4-13 Treatment Costs 68
Table 4-14 Unit Costs 71
Table 5-1 Summary of Experimental Variations in Wilkes-Barre 77
Table 5-2 Number of First Contacts and Recontacts 81
Table 5-3 Background Data from the Baseline Survey of Employers 84
xi 12

Page
Table 5-4 Wilkes-Barre New Enrollments per Month 86
Table 5.5 Rank Order of Wilkes-Barre Workshop Program Components 91
Table 5-6 Percent of Youth Who Held Jobs between Follow-Upsin Wilkes-Barre 93
Table 5-7 Characteristics of Post-Enrollment Job at EachConsecutive Follow-Up in Wilkes-Barre 94
Table 5-8 Intensity of Search among Wilkes-Barre EmployedYouth at Each Follow-Up by Group 95
Table 5-9 Program Expenditures 97
Table A-1 Sample Description of Demographic Characteristics 106.r.,L
)
2%
13xii
II1
I1
1
III
1...... Z. IIIIIIIII1

Chapter 1
Introduction
1.0 Introduction
Stimulating private jobs for disadvantaged youth is an objective
widely share1 by tine public and their representatives in the executive and
legislative branches of government. In 1977, the Congress recognized that
in spite of years of progran experience, no one could show which kinds of
initiatives could do-most to accomplish this and other youth policy goals.
To learn more about what programs are likely to work best, the Congress
passed and the President signed the Youth tmployment Demonstration Projects
Act (YEDPA). YEDPA authorized not only several major operational youth programs,
but also an unprecedented amount of money for research and demonstration pro-
jects. The projects evaluated in this report constitute a very small part
of the overall knowledge development effort mounted by the Department of Labor
in response to this congressional mandate.
The two aemonstrations are a partial test of the effects of providing
voucher subsidies and job search assistance on the employment of low income
youth. The projects grow out of a long process of deciding on a variety of
approaches for expanding the number of private jobs for disadvantaged youth.
In 1978, the Department of Labor's Office of Youtn Programs (OYP) commissioned
design work on how best to test the employment subsidy approach. In the same
year, the Congress passed an actual employment tax credit for the hiring of
disadvantaged workers, including low income youth, age 18 to 24. Although
the enactment of this tax credit (the Targeted Jobs Tax Credit-TJTC) emphasized
the importance of stuuying the impact of employment subsidies, it also
14

complicated the mounting of a demonstration project for this purpose. Any
demonstration project would have to take account of the fact that firms
already had access to a subsidy for the hiring of all low income youth.
The passage of TJTC caused DOL to rethink the idea of mounting a
demonstration project to test the subsidy concept. Given the existence of
a national program, some in the Department of Labor argued for using the
research money to evaluate the program itself rather than a limited demon-
stration that would operate alongside the TJTC. Meanwhile, certain members
of Congress, roost notably Senator Lawton Chiles, pressed the Labor Department
to move ahead with a voucher demonstration project, even during the years
wnen employers qualified for TJTC.
As part of the effort to design sound aemonstrations that took account
of existing TJTC and WIN/welfare tax credits, DOL decided to fund the two
projects evaluated in this report.
1.1 The Wilkes-Barre and Cambridge Voucher/Job Search Projects
The voucher/job search demonstration projects came about when DOL
officials concluded that two organizations that had been operating job search
assistance projects could serve as convenient vehicles for mounting a test
of the employment subsidy concept./ After all, it seemed clear that not
all subsidy programs could be self-administering. Moreover, to the extent
that those marketing the subsidies had specific youth who wanted jobs, one
might expect the offer of subsidies to appear less of an artificial exercise and
more of a genuine effort to try new ways to place specific young workers. The
design of the two projects was a collaborative effort between DOL officials,
managers of the two job search assistance demonstration projects, and the
1The Center for Employment & Income Studies evaluated these two
programs in an earlier study. See, The Effectiveness of Two Job SearchAssistance Programs for Disadvantages Youth, by Hahn et al. 19u1
15

-3-
evaluation staff of Brandeis University's Center for Employment & Income
Studies.
To permit the two demonstrations to operate sensibly alongside the
existing tax credit programs, DOL decided to test an alternative set of
approaches. In particular, the voucher/job search projects combined vouchers
With job search assistance, counseling and placement; the vouchers differed
considerably in form and eligibility from TJTC. In one site the voucher
payment would be made directly to the young worker, while in the other, the
voucher would go to the firm hiring young workers.
The Wilkes-Barre, PA project tested the impact of vouchers given to
employers. The problem was to distinguish the new experimental vouchers from
the TJTC wnich was already available. Since TJTC is available to firms
hiring 18-24 year olds, the new voucner was given only to firms hiring 16-17
year olds. In addition an experimental design was developed to compare the
new voucher with TJTC. The design of the project involved drawing a sample
of employers, stratified by the youth share of employment in the firm's industry,
and randomly assigning employers to one of three groups. Job developers from
the community-based job counseling agency, the Youth Employment Service (YES),
would visit firms in the first and second groups and try to stimulate employers
to hire youth going through YES. At the same time, these job developers would
explain the subsidies available to the specific firm for hiring any low
income youth, not just those served by YES. Finis in the first group had access
to a special cash subsidy for employing any low income 16-17 year-old worker;
firms in both the first and the second groups were told of the TJTC and encouraged
to use it to offset the costs of employing low income 18-24 year-olds. The
firms assigned to the third group served as controls. YES job developers
16

-4-
specifically avoided visiting these firms, although interviewers were to
follow the hiring patterns of control group firms.
In short, the Wilkes-Barre model served to tc'si.:
1) the effect of providing subsidies to firms hiring 16-17 year-olds; and
2) the effect of utilizing TJTC as a marketing tool for obtaining jobs
for youth.
The Cambridge, Massachusetts Voucher/Job Factory project differed in
several ways from the Wilkes-Barre project. In Cambridge, the local CETA
prime sponsor ran a job search program that was highly structured, intensive,
stressing self-directed placement and group dynamics. In Wilkes-Barre, a
local community-based organization (YES) operated an informal, short duration
program that emphasized individual counseling and 'agency job placement. The
Cambridge Job Factory participants received stipends for hours of job search
while the Wilkes-Barre youth did not.
In the context of the voucher issue, the most important distinction
between the two projects was who received the voucher payments. In Wilkes-
Barre, one set of the treatment group firms were eligible for vouchers wnen
they hired low income youth. In Cambridge, youth in one of two treatment
groups qualified for vouchers if they worked in private jobs.
Youth applying for the Cambridge, Massachusetts Voucher/Job Factory
were randomly assigned into one of three groups. The first group could enter the
Job Factory and qualified for the voucher. The second group qualified for the
voucher but not for the Job Factory. The third group did not qualify for either
program. Those eligible for the voucher could claim payments for each hour of
employment over a 12-week period starting at the end of the Job Factory cycle.
17
,
-5-
The payment was '41.50 per hour for the first two weeks and $1.00 per hour
for the next 10 weeks.
Thus. the Cambridge Voucher/Job Factory demonstration served as a
test of:
1) the impact of providing a wage subsidy to young workers on
the extent, speed, and duration of job finding; and
2) the impact of combining a wage subsidy with a job finding
club in helping and stimulating low income youth to find jobs.
1.2 The Plan of This Report
The purpose of this report is to evaluate the effectiveness of the
two voucher/job search demonstrations. Before describing the operations of
the projects and analyzing their employment effects, we provide in the next
chapter a background on employment subsidy issues and experience. Chapter 3
describes the Cambridge demonstration. The emphasis in this chapter is on
the process analysis of the operations in Cambridge. Chapter 4 evaluates the
impacts of the Cambridge demonstration and reviews wnat was learned about running
a worker wage subsidy. Chapter 5 describes and evaluates the employer wage
subsidy program in Wilkes-Barre. Chapter 6 concludes with some observations
on what the evaluation results mean for those considering the role of employ-
ment subsidy programs.
18

Chapter 2
Review of Literature on Employment Subsidies
2.0 Background on Employment Subsidy Issues
Using subsidies to stimulate private employers to hire disadvantaged
workers has appealed to public officials in several countries for many
yeari. What is especially appealing about the subsidy approach is the oppor-
tunity for the government to help move disadvantaged workers directly into
private jobs at a lower cost than paying the worker's full salary or providing
training. By offering financial incentives, the government can rely on the
self-interest of firms rather than on the effectiveness of government programs
to increase the employment of disadvantaged workers.
Employment subsidies are one of a number of tools available to reduce
structural unemployment. The renewed interest in employment subsidies has
come about because of the inability of Western economies to achieve full
employment without inflation, and because of the skepticism about the cost-
effectiveness of many work experience and training programs. Opposition to
selective employment subsidies has historically come from some union groups
who feared that hiring stimulated by the subsidy might displace their members
or who believed that the subsidies would simply add to the profits of firms
without aiding disadvantaged workers. For this reason, subsidies for dis-
advantaged workers are easiest to implement in high employment periods.
The impetus for two demonstrations evaluated in this report came in 1978,
a high employment period. At that time, Senator Lawton Chiles proposed a
demonstration project to test the effectiveness of an approach that provided
disadvantaged workers with vouchers that prospective employers could use
19

-7-
to offset part of costs of hiring such workers. To quote the Senator
from the August 25, 1978 Congressional Record:
Disadvantaged youth have a cluster of attributes whichkeep them out of jobs:. lack of skills, no experience,poor work attitudes and expectations, too low productivityto justify the Federal minimum wage or minimum union scale.An effective program should seek to modify all of thefactors and do so in a way that is most attractive toprivate employers.
Senator Chiles suggested that a voucher of about $1.00 might reduce
the costs of hiring enough to encourage firms to hire more disadvantaged
youth.
2.1 Theory and Practice in Employer Wage Subsidies
The theory underlying the voucher concept is that firms decide on
their mix of workers on the basis of their relative costs as compared to
their relative productivity. As the wage falls among a group of workers, firms
have an incentive to employ more from this group. A variety of studies have
documented the general tendency for firms to act in this way. When the costs
of employing one and only one group of workers falls, firms become willing to
hire more of these workers to shift from one type of skill mix to another,
to produce additional output (now that their costs have fallen), and to
redistribute jobsfrom unsubsidized to subsidized workers of similar skill.
Hamermesh and Grant summarize the empirical evidence on the response
by employers to changes in wages of selected groups of workers. The estimates
drawn from a variety of individual studies suggest that as wages of low skill
workers or of young workers fall relative to wages of other workers, employers
raise their utilization of these groups of workers. The studies indicate
that a 1 percent change in the wage of young workers (holding constant the
20
-8-
wages of other workers and the price of capital) would result in more than
a 1 percent increase in the employment of young workers.
In spite of these and other studies suggesting that firms alter
their hiring behavior in response to changes in labor costs, government
efforts to subsidize the labor costs of disadvantaged workers have yielded
meager results. Although detailed evaluations of such programs are rare,
what evidence there is about the WIN and WIN/Welfare tax credit and the
contract component of JOBS (Job Opportunities in the Business Sector) suggests
that the selective subsidies to firms have done little to raise the employ-
ment levels of disadvantaged workers.
Why these subsidies did not succeed is not well understood. However,
there are a number of potential factors that may account for the weak effects
of selective employer subsidies. First, it takes time for firms to learn
about the subsidies and take them into account when making hiring decisions.
Second, the requirement that workers may be certified as fitting into a
disadvantaged category means that firms may have to alter their recruitment
behavior in order to take full advantage of the subsidy. Another cause may
be the potential stigma associated with the very eligibility of workers for
subsidies. While firms already realize that many potential workers come
from a disadvantaged category, the formal link between the subsidy and the
categorizing of workers may make firms wary of who qualify for special
government assistance.
The weaknesses of the selective employment subsidies in the late
1960s and early 1970s did not cause public officials and researchers to lose
interest in the approach. In 1978, President Carter proposed and the Congress
21

-9-
enacted the Targeted Jobs Tax Credit (TJTC). At the same time, the 1978
reauthorization of CETA called for demonstrations testing the employment
subsidy approach. The Wilkes-Barre voucher project and the comparison
approach in Cambridge are two of the demonstrations implemented in response
to these provisions of the CETA reauthorization. As the TJTC and the demon-
strations came into operation, researchers regained interest in the subject
of selective employment subsidies. In 1982, the Brookings Institution pub-
lished a compendium of studies on employment subsidies, edited by Naveman and
Palmer.
The papers in the Brookings volume cover a wide variety of subjects,
ranging from the macroeconomic effects of employment subsidies to administrat-
ive issues in operating subsidy programs. Bishop and Wilson deal with employ-
ment subsidies available to all firms who increase employment, regardless of
who are the newly hired workers. The New Jobs Tax Credit, enacted in 1977
and phased out in 1973, was an example of this type of subsidy. Under the
New Jobs Tax Credit, firms could claim a tax credit for increasing employment
by at least 2 percent more than employment in the base year. The nature of
the tax credit rules were such as to reward increases in employment of workers
earning no more than $4200 per year. As a result, although the credit was not
targeted by characteristics of workers, it did give firms an incentive to
increase their employment with low wage rather than with medium or high
wage workers.
The few empirical studies of the New Jobs Tax Credit indicated that
the subsidy did indeed stimulate employment. Perloff and Wachter compared
the employment growth of firms that knew about NJTC with firms that did not.
22

-10-
It turned out that employment growth was higher among firms that knew than
among similar firms that did not know about NJTC. This would indicate that
NJTC induced increased hiring. Bishop and Haveman tried to determine NJTC's
impact on employment by analyzing employment trends in industries likely to
gain most from taking advantage of the subsidy. In general, these were
firms in the construction and retail trade industries. When relating
employment trends in these industries to the introduction and spread of know-
ledge about NJTC, Bishop and Havemen find a positive and significant effect
generated by the subsidy.
Other studies have focussed on the macro effects of selective employ-
ment subsidies.. The key idea is that, if selective subsidies can target
increases in the demand for workers on the lowest skill groups, reductions
in unemployment can occur with little cost in added inflation. Of course, the
positive macroeconomic effects can only take place if the employer subsidies
actually cause firms to hire more low skill workers. Nichols concludes that
were subsidies effective in raising demand for low wage relative to high
wage workers, selective employment subsidies could do better than general
macroeconomic tools in limiting the inflationary impact of reductions in
unemployment.
In a paper highly relevant to the two demonstrations examined in this
report, Lerman compared subsidy programs whose payments go directly to-
workers with the more conventional programs whose payments go to firms hiring
particular categories of workers. This distinction mirrors the actual differ-
ence in the structure of the two demonstrations reviewed here. The Cambridge
voucher demonstration project is an example of a worker wage subsidy, while
the Wilkes-Barre project involved a selective employer wage subsidy.
23

Until recently, analysts had examined the worker wage subsidy almost
entirely from the standpoint of its potential role as an income mainten-
ance tool. Generally, a worker wage subsidy is a payment directly to low
income workers earning low wages. The primary purpose is to supplement
the income of low income families in a way that encourages work effort by family
members. The structure of most worker wage subsidies is:
S = r(TW - W),
where S is the hourly subsidy payment, r is the subsidy rate, TW is the target
wage, and W is the worker's presubsidy wage. An example of a specific schedule
is for r = .5 and TW = $5.50. Then, workers whose presubsidy wage was $3.50
would receive $1.00 per hour, or .5(5.50-3.50). In the context of income
maintenance proposals, worker wage subsidies are usually made available only
to the family head or the family's primary earner. Such restrictions are
necessary to target the subsidies.on low income families, since many low
wage workers live in middle income families.
Although analysts have usually emphasized the worker wage subsidy's
income supplement role, there are reasons for believing that a worker subsidy
can increase employment of disadvantaged workers. The first possibility is
that the worker subsidy increases the incentive to work of persons who often
face weak financial incentives due to low market wages (relative to alternative
uses of time), the availability of welfare income, and the benefit reduction
rate applied against welfare income. For a worker in a family receiving
AFDC and food stamps, the added income coming from a $4.00 per hour job might
total well less than $1.00 per hour. By supplementing the wage, a worker
wage subsidy raises the hourly return of those working at a low wage job.
The second possibility is that worker subsidies reduce the gain from searching
1
1
24 1
1

-12-
for a $5.00 per hour job instead of accepting a $3.50 per hour job would
fall from $1.50 per hour ($5.00-3.50) to $0.50 per hour ($5.00-4.50). The
decline in the potential gain from search might increase employment.
The question of how worker subsidies compare with employer subsidies
turns out to depend on several factors. Under a common model of structural
unemployment, disadvantaged workers cannot find jobs in high employment periods
because their productivity falls below the legal or social minimum wage:
This would suggest that a subsidy to firms hiring disadvantaged workers would
bring down labor costs enough to offset the lower productivity of disadvant-
aged workers. But, as Lerman and Johnson show, providing a subsidy for
firms to hire a segment of low wage workers might simply redistribute rather
than reduce total unemployment. If the subsidy applied only to a share of
low wage workers, then firms would hire subsidized before hiring unsubsidized
low wage workers: However, after firms exhaust the available subsidized
workers, their demand for additional workers would be unaffected by the
subsidy. As a result, the minimum wage would continue to limit wage flexi-
bility and keep the same number of low wage workers unemployed as before
the subsidy.
Other factors cast doubt on the ability of selective employer sub-
sidies even to redistribute employment toward the subsidy-eligible group.
As noted above, the subsidy program may affect too few workers for employers
to respond by altering their recruitment practices. Data from the WIN/welfare
tax credit and from the TJTC indicate that many employers hire subsidy-eligible
workers without actually claiming the subsidy. As of September 1980, only
about 115,000 jobs going to disadvantaged youth were certified in a way that
allowed firms to claim the TJTC. This figure is about 5 percent of the
25

-13-
approximately 2 million hires of disadvantaged youth that occur annually
without the subsidy. In the case of the WIN/welfare credit, only 19 percent
of job entries occurring through the WIN program itself involved the tax
credit. Since many welfare recipients take jobs that are not WIN placements,
the overall take-up by firms of potential tax credits was actually below
19 percent.
One advantantage of paying directly to workers is the increase in
the actual utilization and thus potential impact of the subsidy. Since the
subsidy is a much larger component of total income when paid to the worker
than when paid to the firm, fewer of those eligible are likely to ignore
the subsidy. The issue of participation is an important aspect of this
evaluation.
Given the uncertainties in the economic and noneconomic effects of
alternative subsidy approaches, Lerman concludes that the. worker subsidy
may raise employment of disadvantaged workers as much or more than subsidies
to employers for hiring disadvantaged workers. This evaluation does not
provide a direct empirical test of the two approaches, since the site and
other variations occur alongside differences in subsidy design. However,
comparing the demonstration outcomes do yield results on some of the differ-
ences in outcomes that can be expected between worker and employer subsidy
programs.
2.2 Experience with the Targeted Jobs Tax Credit
The TJTC has been by far the largest selective employer subsidy pro-
gram that has operated in the U.S. When implemented in early 1979, TJTC
allowed employers to claim tax credits for employing workers from any of the
following categories:
- -economically disadvantaged youth, age 18 to 24;
--economically disadvantaged Vietnam-era veterans and ex-felons;
- -recipients of local welfare (general assistance) programs
26

-14-
or Supplemental Security Income benefits;
--handicapped persons participating in a vocational rehabilita-
tion program; and
--youth, age 16-19, in high school cooperative education programs.
Under the TJTC, employers hiring a worker certified as belonging to
one of these groups could claim a tax credit equal to 50 percent of the
first $6000 of the worker's earnings. While firms claiming the TJTC had to
reduce their normal wage deductions by the amount of the credit, the credit
still represented an effective 50 percent reduction in the gross and net
labor costs of hiring eligible workers.
The administration of TJTC yielded a program similar to the voucher
approach described by Senator Chiles. After certifying the eligibility of
workers, the Employment Service provided those in TJTC groups with vouchers
that could be shown to prospective employers during job search. The employer
would see from the voucher that the firm would qualify for tax credits by
hiring the particular worker. If the firm hired the worker, it would then-
send part of the voucher form to the Employment Service, which, in turn, would
send the firm a certification that verified the fact that the firm could
indeed claim TJTC on behalf of the particular worker.
Unfortunately, this apparently simple administrative design was com-
plicated in practice. Initially, many.local employment service offices
resisted taking an active role in implementing TJTC partly because of a lack
of moneyvto administer the effort and partly because of the belief that TJTC
provided a windfall, to employers and offered little benefit to disadvantaged
workers. Additional problems arose as a result of confusion at the local
level over which agency had primary responsibility for TJTC, the lack of
enthusiasm and time among CETA prime sponsors, delays in the issuing of
27

-15-
regulations by the Internal Revenue Service, and inadequate publicity at
the national and local levels.
In spite of the variety of implementation problems, TJTC did
provide firms with subsidies for employing over 600,000 eligible workers.
After a slow start, TJTC-subsidized hires increased to an annual rate of
400,000 during the first three quarters of Fiscal Year 1981. Among low
income youth only, TJTC hires over the same period reached an annual rate
of 170,000. However, the target group for whom employers claimed the largest
number of credits were students from cooperative education programs, the
least disadvantaged of the TJTC groups.
Since there was no comprehensive evaluation of the extent to which
TJTC increased employment or earnings of disadvantaged workers, we cannot
draw any hard conclusions about the overall success of the approach. A report
by Ripley cast doubt on the idea that TJTC had a significant effect on the
hiring of TJTC target groups. It is clear that TJTC hires failed to exert
a detectable impact on the employment-population ratios of low income youth
and that TJTC hires of disadvantaged youth were a small proportion of the
number of disadvantaged youth that would have been hired in the absence of
the program. Finally, anecdotal evidence indicates that most TJTC certifi-
cations took place when firms asked the Employment Service to determine for
which existing employees could the firm claim tax credits.
On the positive side, one can cite facts showing that:
- -TJTC hires far exceeded hires under several years of
activity under the WIN tax credit;
- -TJTC hires of disadvantaged youth increased rapidly and steadily
over the first few years of the program; and
--a moderate share of employers reported using TJTC to in-
crease overall or target group employmene8

-16-
In the absence of an impact evaluation of TJTC, one can only guess
at the net effect on employment of disadvantaged workers per dollar spent
on the program. Nevertheless, the TJTC experience does offer lessons
about the difficulties of implementing an employer subsidy targeted on
disadvantaged workers.
2.3 Outcomes of Employer Subsidy Demonstration Projects
The Department of Labor supported two employer subsidy demonstration
projects in addition to the demonstrations reviewed in this report. The
other projects were components of a larger demonstration aimed at testing
the effectiveness of providing job guarantees for youth and for low income
heads of families.
The Office of Youth Programs, Department of Labor, sponsored an
experimental test of the employer subsidy-concept as part of the Youth
Incentive Entitlement Pilot Projects (YIEPP). Under this demonstration,
called the Wage Subsidy Variation Experiment, job developers contacted firms
and offered them subsidies for hiring low income youth that varied randomly
with the firm. In Detroit, firms had access to either a 100 percent or a
75 percent subsidy. In Baltimore, firms qualified for either a 50 or
100 percent subsidy on the basis. of their location. Firms that were unlikely
to hire youth or were inappropriate employers as well as firms that had
already hired youth under YIEPP could not participate in the experiment.
The job development took place in early 1980 but were available to firms
only through August 1980. This period coincided with a general economic
downturn.
The results of the experiment are clear but the appropriate inter-
pretation is not. Of 2259 firms contacted, nearly 13 percent agreed to
employ a low income youth using the subsidy. The share of firms participat-
ing varied by city and by .subsidy rate as follows.
29

-17-
100% subsidy 75% subsidy 50% subsidy
Baltimore 20.1 7.5
Detroit 15.6 7.7
The results are consistent with the notion that high subsidy rates
can induce more hiring of disadvantaged youth than low subsidy rates.
However, the experiment does not show the overall effect of the subsidies
because we do not know how many disadvantaged youth would have been hired
in the absence of the subsidy. No firms were included in the experiment and
not offered a subsidy.
The numbers available on the overall effect of the Wage Variation
experiment have been subject to differing interpretations. Some have main-
tained that achieving only a 15 to 20 percent participation rate among firms
offered a 100 percent subsidy indicates that employer subsidies for hiring
disadvantaged youth are unlikely to succeed. Others take a less pessimistic
view of the results. They note that restrictions on the use of the subsidy
may have limited the extent of hiring. Employers had to tailor jobs to the
school day or summer schedules, had to accept YIEPP referrals instead of
any low income youth, and had to make hires' within a few months of learning
about the program. Still, 7.5 percent of firms eligible for a partial
subsidy chose to participate.
In a statistical analysis of the Wage Subsidy Variation Experiment,
researchers from the Manpower Development Research Corporation (MDRC)
estimated that cutting the percentage of earnings subsidized from 100 to 75
percent reduces participation from 18 percent of firms to 10 percent of
firms. A further reduction from a 75 to a 50 percent subsidy rate would
lower the share of firms willing to hire youth from 19 to 5 percent. The
numbers do not indicate whether the effects on youth hired exactly mirror
the effects on the share of firms participating.
30

,- .............
-18-
While overall participation byfirms appeared low, some types of
firms showed substantially higher participation. The statistical analysis
indicates that, among firms that have employed youth and that planned to
increase employment, even a 50 percent subsidy rate elicited participation
by 30 percent of the firms.
The Employment Opportunities Pilot Project (EOPP) also staged an
experiment to test the efficacy of providing firms with subsidies to hire
disadvantaged workers. The EOPP experiment, staged in Dayton, Ohio, differed
in several ways from the Wage Subsidy Variation Experiment. Under EOPP, the
target group of workers was primary earners in heads of families on welfare.
The administration of the EOPP voucher involved giving workers vouchers to
aid in their job search. The program operators did not approach specific
employers with subsidy offers. Thus, where the employer was the unit of
analysis in the YIEPP demonstration, EOPP's focus was on the relative success
of various groups of workers.
The EOPP voucher demonstration divided eligible workers into three
groups. All groups received intensive instruction in job search techniques.
Program operators gave two groups vouchers that entitled employers to sub-
sidies of 50 percent of first year wages (up to $6000) and 25 percent of
second year wages (up to $6000). However, one group carried vouchers that
qualified firms hiring the workers to the federal tax crdits, while the other
group's vouchers gave firms access to direct cash reimbursement every quarter.
The distinction permitted an analysis of whether direct cash subsidies or
indirect tax credit subsidies induced larger responses by firms.
An analysis of the results of this experiment showed that the vouchers
did not have a positive effect on the employment of workers eligible for
31

vouchers. In fact, the job finding rate (covering the first 5 months of
the test) was higher among the controls (those not provided with a voucher)
than those who received vouchers. Both groups of workers provided with
vouchers had the same 13 percent job finding rate, while the controls showed
a job finding rate of 20 percent.
Another illustration of the failure of the vouchers to stimulate
employment is the meager total use of vouchers. Although hundreds of vouchers
were issued to eligible workers, employers ended up using only 19. Moreover,
many employers hiring voucher eligibles did not even claim the subsidy. Of
the workers issued tax credit or direct reimbursement vouchers, 70 found jobs,
but employers claimed subsidies only on behalf of 19. This means that in
the case of about 3 out of 4 jobs covered by subsidies, firms failed to take
advantage of the subsidy.
The Wage Subsidy Variation Experiment and the EOPP Voucher Experiment
resemble the voucher demonstrations reviewed in this report. Like the Wage
Subsidy Variation Experiment, the Wilkes-Barre demonstration divided firms
randomly into groups offered varying subsidy packages. The packages were
somewhat similar to what was offered under EOPP, since one group of firms
were encouraged to use an existing tax credit program and another had special
access to a direct reimbursement subsidy. The Cambridge Job Factory/Voucher
Experiment was similar to the EOPP voucher project in that the voucher
feature operated in combination with a job finding club. However, unlike
the EOPP project, which offered subsidies to employers, the Cambridge demon-
stration involved providing wage subsidies to young workers.
32

-20-
References to Chapter 2
Ashenfelter, Orly, "Sample Design Issues in an Experiment of DirectIncentives to the Private Sector to Hire Out-of-School Youth,"unpublished paper prepared for the Corporation for Public-PrivateVentures, September 1978.
Bishop, John and Donald A. Nichols, The Potential of Wage Subsidies, A ReportSubmitted to the Employment and Training Administration, U.S Depart-ment of Labor, 1979.
Bishop, John and Robert Haveman, "Selective Employment Subsidies: Can Okun'sLaw Be Repealed?" American Economic Review, May, 1979.
Burtless, Gary and John Cheston, "The Montgomery County (Dayton) Ohio Wage-Subsidy Voucher Experiment: Initial Findings," unpublished paper,U.S. Department of Labor, July, 1981.
Hahn, Andrew, Barry Friedman, Cecilia Rivera and Robert Evans, "The Effective-ness of Two Job Search Assistance Programs for Disadvantaged Youth,"Center for Employment and Income Studies, Heller School, BrandeisUniversity, 1981.
Haveman, Robert H. and John L. Palmer (eds.), Jobs for Disadvantaged Workers:The Economics of Employment Subsidies, The Brookings Institution,Washington, D.C., 1982.
Johnson, George, "Allocative and Distributive Effects," in Jobs for Disadvan-taged Workers, Haveman and Palmer (eds.).
Lerman, Robert I., "A Comparison of Employer and Worker Wage Subsidies," inJobs for Disadvantaged Workers, Haveman and'Palmer (eds.).
Lerman, Robert I. and Gary Burtless, "A Report on Wage Voucher ProjectsRequired under Section 317 of the 1978 CETA Reauthorization,"unpublished paper, U.S. Department of Labor, 1981.
Nichols, Donald A., "Effects on the Noninflationary Unemployment Rate," inJobs for Disadvantaged Workers, Haveman and Palmer (eds.).
Perloff, Jeffrey M. and Michael Wachter, "The New Jobs Tax Credit: An Eval-uation of the 1977-78 Subsidy Program," American Economic Review,May, 1979.
Ripley, Randall and Associates, The Implementation of the Tar eted JobsTax Credit, Report No. 3, Mershon Center CETA Study, hio Stateniversi May 1981.
33

Chapter 3
The Job Search Wage Subsidy Project in Cambridge
The first section of this chapter describes the design of the job
search voucher project and its intended operation. The second section
provides a process analysis which examines the implementation and actual
operation of the program. Chapter 4 will examine the impacts of the
Cambridge experimental treatments on youth work behavior.
3.0 Design of the Experiment
3.1 The Treatments
The project in Cambridge tests a voucher payment directly to youth
combined with a job search assfstance program. While an employer voucher
plan aimed to increase youth employment by increasing the demand for labor,
a youth voucher plan was directed at the same objective, but by increasing
the supply of labor. The idea-is that youth may be discouraged from
working by the low pay they receive. A voucher, related to the amount they
work, may induce them to work more even if the actual wage paid by the
employer remains low.
In Cambridge the unit of observation was the youth in contrast to
Wilkes-Barre where it was the employer. Focusing on the behavior of youth
introduced the complication that the youth were really receiving two treat-
ments, the job search assistance program together with the voucher for work-
ing. In order to separate the effects of these two treatments, we established
two experimental groups plus a control group. Table 3-1 summarizes the
treatments.
34

I
-22-
Table 3-1
Summary of Experimental Interventions in Cambridge
Activity
Participation in Job SearchAssistance Program
Full Treatment Voucher Only Control(Group 1) Group
Yes No No
Payment of Voucher Yes Yes No
Forty percent of eligible youth were assigned to the full treat-
ment group and 30 percent to each of the other two. Youth in the full treat-
ment group were eligible for the voucher and in addition attended the Job
Factory for periods of up to four weeks in which they received structured,
intensive job search training and assistance. Youth in the voucher only
group were eligible for the voucher, but not for the Job Factory. Those in
the control group received neither treatment. This design allowed us to
study the following principal hypotheses:
(1) A voucher bonus can increase the rates at which youth seek,
accept, and keep jobs. If so, it means that one reason for
high youth unemployment may be the low economic rewards of
working.
(2) A voucher bonus in conjunction with 'a job search assistance
program is more effective than the bonus alone. This would
mean that the youth need not only incentives, but also
skills in seeking jobs. (The pure effect of the job search
assistance program in Cambridge was evaluated by Brandeis
researchers in an experiment running from May 1979 to
September 1980: There could be a significant interaction
between the job search assistance and the voucher bonus.)1
1See, The Effectiveness of Two Job Search Assistance Programs forDisadvantaged Youth, by Hahn et al., CEIS, 1981.
35
-23-
Consider now the two treatments in more detail.
a. The Voucher
The voucher itself was available to those in both the full-
treatment and voucher-only group who succeeded in finding unsubsidized
jobs. The voucher involved the payment of a direct, supOemental wage
bonus for each hour of paid employment after the job commenced. Voucher
payments were computed as follows:
(1) A payment of $1.50 per hour for up to 48 hours of paid work
per week during the first two weeks of a job. There is,
however, the restriction that the $1.50 payments cease two weeks
after the closing date of Job Factory cycle.
(2) A payment of $1.00 per hour for each hour worked during weeks
three through twelve of a job. If a youth leaves one job
for another during this period, the voucher payment carries
over to the second job. All $1.00 payments cease twelve weeks
after the close of the Job Factory cycle.
b. The Job Factory
The Job Factory treatment offered to the full-treatment group in
this experiment is the same as that tested previously in Cambridge in 1979-80.
We shall review the content of this treatment based on program plans as well
as the actual experience from the earlier experiment. Those in Experimental
Group I who participated in this Job Factory portion of the experiment re-
ceived a stipend equal to the CETA Cambridge consortium-wide minimum allow-
ance payment of $3.50 per hour.
'36

-24-
The premise on which the Job Factory was created is the belief
that for the overwhelming majority of long-term unemployed, there is an
immediate place in a normal employment market. The reasons that they
have not been successful in peer competition in this market place are
largely superficial (i.e., not rooted in serious physical disability or
social maladjustment). Rather, as a group they have been impeded in their
job search by some combination of the following factors:
--Lack of knowledge of effective methods of finding a job;
--Lack of communication skills in presenting themselves asdesirable workers;
--Lack of confidence, drive, realistic job goals and perhapsthe personal ambition to apply to an aggressive job search
--As a result of previous failure to secure a job--discourage-ment and low self-esteem.
It was intended that the Job Factory create an environment in which specific
positive remedies are applied to these factors. In a short four-week
intensive program clients were provided with labor market education and
personal selling skills. Also they followed a carefully planned and closely
supervised job search. Thus, the tenet of the Job Factory, corroborated by
evaluations in Cambridge as well as in other parts of the country (Azrin in
Illinois, Hoffman in California) is that job seeking is a complex skill that
can be learned, and job finding is a discipline which can be imposed in a
structured setting.
The vital tone of the Job Factory operation is one of a practical
real work environment. Relations between program staff and clients are to
be conducted in a manner similar to those between management and workers
in a good industrial organization. The Job Factory requires a "fair day's work
37

-25-
for a fair day's pay." The factory provides instruction, job seeking
skill training, aids, activity planning and close supervision. It demands
satisfactory quality and quantity of work performance and enforces tight
standards with respect to punctuality, attendance and control of work time.
Minimum wage stipends are used as a reward to the work accomplished as
well as a control for attendance. Absence from the program needs to be
justified in order to be remunerated. Rules and tenets of the program are
explained the first day of operation by the Job Factory manager:
- -"Your job is to find a job."
- -"We teach people how to find jobs."
--"We pay you for 40 hours a week."
1'101 all your friends and relatives you are looking for a job."
- -"Chances are you will find a job."
During the first week in the program, with the directed use of a
work manual in both group and individual activities, participants develop
the "tools" needed for an effective job search. These include: a skills-
oriented resume or resumes; a clean, accurate, standard application form;
written references from past employers; letters for solicitation of employ-
ers and for follow-up on interviews. Other important materials are provided:
Industrial Directories, Yellow Pages, Newspaper want ads, street and trans-
portation system maps and local labor market information.
Another component of the program is preparation for job interviews.
Interview skills training includes a consideration of employer motivations,
hiring techniques and procedures. What qualities is the employer seeking?
What is his or her image of the ideal candidate for the job opening? How
do you describe and project yourself in an interview, to match the image?
38

/-
-26-
Following the resume-writing process, a considerable time (3-4 days)
is spent in mock interviews. Participants represent their own actual
backgrounds, while Factory counselors represent hiring authorities,
demonstrating a variety of interviewing methods. Often the participants
are asked to perform in the hiring role.
The participants are drilled as to the questions likely to be asked
in an employment interview and to be ready with a positive and appropriate
response.
After the first week the bulk of the participant's time is spent
in actual job search activities: going out on informational interviews,
using the telephone to find job prospects, making personal "cold calls" on
likely employer organizations, following up on jobs which are advertised
or listed with public employment services--all under close instruction.
The positive group dynamic continues throughout the program. Parti-
cipants who do not have scheduled interviews or planned employer visits on
their agendas return to the Factory at the end of each day to participate
in group discussions about their experiences of the day. They engage in
mutual critiques based on their experiences, and they serve as support group
to their peers. The tone of the Job Factory, then, is peer-oriented and
serious, yet fun for the participants.
3.1.1 Eligibility and Recruitment
The Cambridge prime sponsor recruited and certified 600 CETA/YETP
eligible youth for enrollment in the Job Factory Voucher Programs (JFVP).
To facilitate the Job Factory portion of the treatment, youth were recruited
separately for each of six cycles. Each cycle attempted to serve a mixed
population of eligible youth of both high school graduates and high school leavers.
Some in-school youth were served in a summer cycle.
39

-27-
In preparation for each cycle, eligible youth were certified and random-
ly assigned to one of the three treatment groups. The four-week Job
Search Assistance treatment, which was offered only to those in the full-
treatment group, was scheduled to begin on the first day of each cycle.
The cycles started on the following dates:*
Cycle I
Cycle II
Cycle III
Cycle IV
Cycle V
Cycle VI
November 3, 1980-December 3, 1980
January 23, 1981-February 20, 1981
March 25, 1981-April 22, 1981
June 3, 1981-July 2, 1981
September 18, 1981-October 16, 1981
November 13, 1981-December 11, 1981
Recruitment efforts took place at the planning stages that preceded
each cycle. The following means of publicity were used to promote the
program:
--Letters and brochures sent to the homes of 350 young personswho had applied to various youth serving agencies over thepast few months;
- -Letters sent to homes of graduating seniors;
- ;Radio spot ads on local youth-oriented radio stations (AM & FM)--to run for two weeks;
- -A saturation poster campaign covering all youth social centers,"hangouts," public housing facilities, etc.
- -Irregular TV spots on a late night television program;
- -Display ads in both the employment and sport sections of alocal weekly newspaper;
In addition, counselors contacted program operators from social agencies
serving youth in the Boston area to request referrals and enhance the pool of
applicants. Residence requirements were flexible and not limited to the
Cambridge area.
40

-28-
3.2 The Actual Operation of the Cambridge Job Factor Voucher Program
This section provides a process analysis of the experiment in
Cambridge. One central purpose of a process analysis is to evaluate the
feasibility of a program--whether it can be implemented and managed at all,
or at least in a manner close to plan. Feasibility is not a major issue
in the Cambridge program since the treatments did operate reasonably closely
to what had been planned. The process analysis will concentrate on those
problems that did arise in the course of the program. Did a problem cause
a deviation from plan? Was a particular problem amenable to solution? By
tracing the steps of the program as well as by looking at its administrative
structure, we can detect problems and unexpected developments that might
have arisen during the experiment. Information discussed in this section
comes from interviews with staff and program administrators, from on-site
observations by the Brandeis staff, and from a review of documents, pro-
cedures and clients' flow. This section is organized around four topics:
(1) Recruitment and enrollment;
(2) Participation in treatment and voucher;
(3) Participants' evaluation of program experiences;
(4) Administrative changes and personnel characteristics.
3,2,1 Recruitment and Enrollment
Since the wage subsidy experiment (voucher) is tied to JSA for one
treatment group and reliant on JSA recruitment for the other two groups,
recruitment and intake activities are important features of the process
analysis. It has also proved to be the most difficult part of the project.
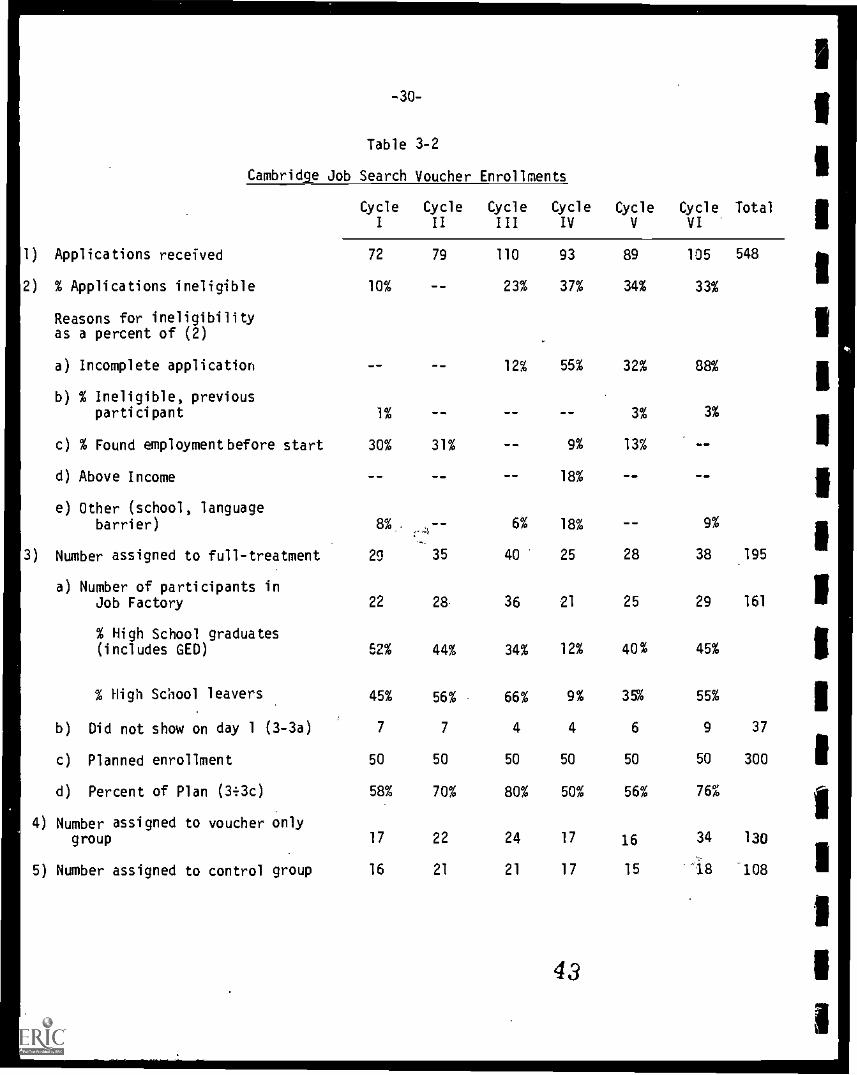
As illustrated in Table 3-2 the enrollment of participants was below planned
. 41

-29-
levels for all cycles. Program operators cite a number of reasons for
recruitment difficulties:
(1) The eligible youth population in Cambridge was beingexhausted;
(2) Social service referral agencies expressed resistance tothe experiment's random selection process which couldassign youth to the control group where they wouldreceive no treatment; and
(3) Potential participants became discouraged by the lag timebetween program applications and random group assignment.
To discuss recruitment difficulties, several meetings were held between
Brandeis and the Job Factory staff at the beginning of the second cycle.
Some programmatic decisions and recommendations resulted from the exchange,
and were fully adopted by the COMA staff:
(1) Recruitment would be expanded to include the Ireater Bostonarea, thus increasing the available pool of applicants;
(2) Random selection would occur as the program applications werecompleted; this would enable each applicant and the referralagency to know the youth's status in the program at anearlier date.
The Characteristics of youth participants presented wider variation as a
result of the expansion in enrollment boundaries. There were even differ-
ent interpretations of the "target groups" to be served by the program. Some
counselors defined potential participants according to the parameters of
the federal guidelines. Consequently, CETA-eligible youth between the ages of
16 and 22 years were considered as the target group. There was no plan to
recruit specific significant segments of that youth population, although some
counselors did favor such an approach. However, the composition of client
characteristics did vary from cycle to cycle. For example, during the
summer there was a larger proportion of recent high school graduates, whereas
42
-30-
Table 3-2
Cambridge Job Search Voucher Enrollments
1) Applications received
2) % Applications ineligible
Reasons for ineligibilityas a percent of (2)
a) Incomplete application
b) % Ineligible, previousparticipant
CycleI
CycleII
CycleIII
CycleIV
CycleV
CycleVI
Total
72
10%
1%
79
my 4.
--
--
110
23%
12%
--
93
37%
55%
89
34%
32%
3%
105
33%
88%
3%
548
c) % Found employment before start 30% 31% -- 9% 13% --
d) Above Income
e) Other (school, languagebarrier) 8%..
--
... 4
--
6%
18%
18%
-- __
9%
3) Number assigned to full-treatment
a) Number of participants in
29 35 40 25 28 38 195
Job Factory
% High School graduates(includes GED)
22
52%
28,
44%
36
34%
21
12%
25
40%
29
45%
161
% High School leavers 45% 56% 66% 9% 35% 55%
b) Did not show on day 1 (3-3a) 7 7 4 4 6 9 37
c) Planned enrollment 50 50 50 50 50 50 300
d) Percent of Plan (3:3c) 58% 70% 80% 50% 56% 76%
4) Number assigned to voucher onlygroup 17 22 24 17 16 34 130
5) Number assigned to control group 16 21 21 17 15 /8 108
43

-31-
during the school year the group was composed primarily of those who were
out of school. Also, during the course of the program the proportion of
ex-offenders increased progressively. This again was not the result of
any conscious administrative decision, but rather, the result of an
increased response by the Boston area halfway houses to the Job Factory's
recruitment efforts.
3.2.2 The Actual Operation of the Treatment
a. Job Search Assistance
For youth in the full-treatment group, the short-term goals of the
Job Search Voucher program were to train participants to find their own
jobs quickly and to help youth decide on the type of job that best suited
their desires and qualifications. The long-term goals of the program
were to provide participants with job search skills and awareness of careers
that might be applied in the future. The program also provided a work
atmosphere that resembled the real world of work in order to show youth
the kind of discipline required on jobs. For youth in both the full treat-
ment and voucher groups, the voucher component's role was to speed job finding
and lengthen job duration. A long-standing argument among job search program
operators centers around the issue of whether the program should encourage
youth to find "any job" or to orient their job search efforts towards a
career. Originally, the program tried to emphasize both immediate job
finding and career planning. Given the short-term nature of the program ,
serious career planning from program participants appears an unrealistic
goal. However, there was a need to provide youth with the opportunity to
discuss future plans as they were preparing for their immediate job search.
A key strategy that program operators used was to encourage youth to develop
44
-32-
their own jobs. The objective was to teach youth to utilize the hidden
labor market by directly contacting business establishments and making
aggressive inquiries; to solicit leads from friends and relatives, and to
follow up on these leads.
Lack of work experience seemed to be the most significant barrier
to employment faced by the Job Factory participants. Program counselors
addressed this gap in several ways. One strategy was to encourage and guide
the participants to assess themselves in terms of what they liked to do and
what they feel they do best. This would be.followed by various drills in
how to organize and present their skills in a letter of introduction, resume
and interview. Another strategy was to stimulate positive thinking. Although
there were participants who exhibited serious behavioral problems, counselors
and other participants did not allow them to be inordinately disruptive.
Through early exercises in group dynamics the group developed a cohesive
capacity to handle most problems that arose. However, counselors mentioned
that in each operating cycle, some participants were inappropriate for such
a self-help program. The counselors voiced the strong feeling that the
random selection procedure did not allow the program to screen out these
inappropriate candidates. The perception of an inappropriate candidate was
someone who neither needed nor expected the program to find them a job, one
who was just there to collect the stipend check for four weeks (referred
to as a "Program Hustler"), or one whose attendance at the program was a
required condition of some other agency (i.e., probation).
Attendance at the Job Factory was monitored very closely. Monitoring
was required for calculating stipend payments based on hours spent in the
program. Attendance was recorded on a daily basis and a detailed log of
daily activities was kept up to date by one of the counselors. When
45

-33-
participants failed to attend, the program wages were reduced by the amount
of time the participant was absent. Only two medical or personal excuses
were accepted (if required documents were presented, and its verification
was positive) before the wages were affected by the absence.
Table 3-3 presents the number of hours that participants spent in
the program by cycle. The mean number of hours spent by youth in all
cycles was 104 hours. This is a much longer participation than most job
counseling pre-employment programs. (See for example the p /py evaluation
of Jobs for Youth and 70001 Ltd.)
b. The Voucher
Youth assigned to the full-treatment group heard an explanation of
the rules of the voucher program the second day of the Job Factory. The
voucher-only participants were sent a letter that explained the reason
for non-admission to the Job Factory part of the program, but that they
qualify for the voucher. A Brandeis representative met with each group of
voucher only youth to discuss the conditions and regulations. Youth who
did not show up at the meeting were phoned. Those not reached by phone
were sent fliers explaining the voucher program. In summary, the terms of
the program were explained to everyone in the full-treatment and voucher-only
groups.
The program operator (COMA) and Brandeis University were responsible
for administering the voucher payments to eligible youth who found jobs.
Prior to the beginning of the program, the COMA staff were concerned about
the cost of administering the voucher payments to eligible youth who
found jobs, and the moral.and legal hazards associated with it. A simple
mechanism was developed at the planning stages to elow for effective
verification of claims. In order to claim a subsidy, a client had to pro-
duce a paycheck stub which included: 46

-33A-
Table 3-3
Cambridge Job Factory Participation by Cycle
MeanHours
C cle I C cle II Cycle III Cycle IV Cycle V Cycle VI Total
100 125 87 112 105 128 104
Humber 21 25 36 21 25 20 148
47
iII1
1
Ie
IIIIIIiIIsII
1

-34-
(1) Individual's name and/or social security number;
(2) The number of hours worked in that pay period or thehourly wage together with gross income.
(3) Employer's name and address.
For those individuals whose paychecks did not include a pay stub with the
required information, their employers had to file a form that was corrobor-
ated by program staff. To insure accurate reports and close account of the
number of hours worked, a COMA staff member was assigned the task of admin-
istering and monitoring the subsidy payments. This was in addition to her
responsibilities as payroll coordinator. Brandeis observed few administrative
problems directly associated with the implementation of the voucher program.
The time required by the COMA accounting system to process payroll checks
resulted in some delays in the verification and mailing of voucher payments
to program participants. As a result, it took.COMA close to four weeks to
make voucher payments.
To guarantee completion of the voucher eligibility period among
Cycle VI participants, Brandeis continued the administration of vouchers
(without COMA) after December 31, 1981. It is interesting to note that
after Brandeis took over the administration of voucher payments the average
time between receiving employment information from youth and mailing back a
check was one and a half weeks. A total of 57 youth in the experiment group,
and 43 youth in the voucher group actually claimed the voucher. In general,
more youth in the voucher-only group took advantage of the voucher compared
to the full-treatment group. Since voucher-only youth did not benefit
from the job search part of the program and subsequently did not receive
stipends, voucher-only youth may have been more motivated towards claiming
vouchers once they found a job. This is explored in greater detail in the
impact section of the evaluation -- Chapter 4.
48

-35-
3.2.3 Participant's Evaluation of Program Experiences
In this section we present the evaluation of the program by youth
participants themselves. The participants gave their views in the Program
Completion Survey, which was administered when youth exited from the program.
Table 3-4 presents the most frequently attended job search activities, as
well as a rank order of the service that youth found to be most helpful.
As expressed by the participants, learning how to prepare one's resume was
both the most popular and attended activity offered in the Job Factory.
Contacting potential employers and preparing in advance for the actual inter-
view came next in frequency of use. However, when asked which activities were
most useful, the ordering was quite different, with personal job counseling
ranking second, followed by preparation for and actual interviews with poten-
tial employers. Group discussions scored somewhat lower regarding partici-
pation, as well as practical value. Individual counseling (about personal
matters) and letter writing were not perceived as useful job search tools by
participants. The low priority assigned to individual personal counseling
(as opposed to job counseling) is consistent with the program's design. Person-
al counseling is not a primary feature of the Job Factory program.
When asked what they liked best, 73% of respondents reported elements
of personal satisfaction, such as "finding myself," and "discovering my
skills". Only 6% said they liked the program's financial incentives best.
Only 25 youth responded about what they disliked in the program. Twenty-
eight percent found the program boring towards the end, 48% disliked getting
up in the morning and looking for a job, and the other 24% mentioned a program
component or a staff member as the source of aggravation.
49
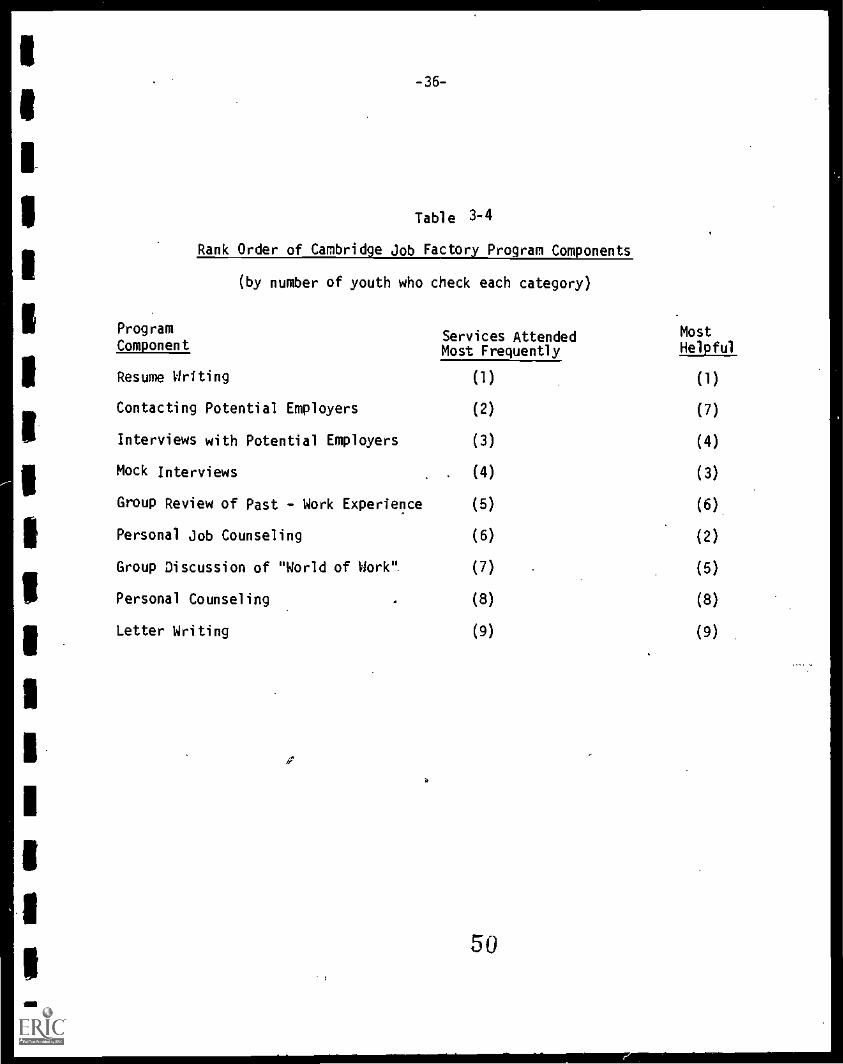
-36-
Table 3-4
Rank Order of Cambridge Job Factory Program Components
(by number of youth who check each category)
Program MostServices AttendedComponent Most Frequently Helpful
Resume Writing (1) (1)
Contacting Potential Employers (2) (7)
Interviews with Potential Employers (3) (4)
Mock Interviews (4) (3)
Group Review of Past - Work Experience (5) (6)
Personal Job Counseling (6) (2)
Group Discussion of "World of Work". (7) (5)
Personal Counseling . (8) (8)
Letter Writing (9) (9)
50

-37-
A general question was asked about how useful the program was.
Out of 120 youth who answered the question, 77% found the program very
helpful. 18% reported it helped them a little, 2% denied its usefulness
and the last 3% did not know how to evaluate the program. Asked about
their willingness to go into another training program it is striking that
nearly half the respondents (n = 114) would go only if they were paid for it.
One of four would attend training regardless of financial reward, 24% felt
that they are already trained for the searched job, and 4% would not bother
to attend another training program. Perhaps Cle current stipended program
created expectations among youth that financial rewards should accompany
program attendance. In any event, it is noteworthy that only one of four
respondents said they were willing to enter a training program that did not
provide stipends.
3.2.4 The Transition in the Adminiitiation of the Cambridge Prime Sponsor:From Consortium to Central Authority
The purpose of this section is to analyze the process of operating
the Job Factory Voucher Demonstration Program at the same time that the
CETA agency (COMA) was undergoing an administrative change. We also present
the details of how this transition affected the last two cycles of the Job
Factory Program.
The Job Factory Voucher Demonstration was one of several CETA Programs
run by the Cambridge office of Manpower Affairs (COMA). Overall admin-
istration of CETA funds and planning of programs was conducted via a
consortium, called the Eastern Middlesex Human Resource Development Authority
(EMHRDA) that served as contractor to the Department of Labor. The Job
Factory and COMA occupied a suite of offices and classrooms in an office
51

1
-38-
building in the center of Cambridge. The EMHRDA, also located in Cambridge
was housed in a suite of offices in a building half a mile from the Job
Factory/COMA location.
Shortly after the announcement was made regarding reductions in the
federal CETA budget and the eventual phaseout of YEDPA, the EMRDA began to
develop a plan to consolidate the operation of all programs under one
centralized authority by October 1, 1981. At this time recruitment efforts
for program Cycle V had just begun. All subgrantee staff were invited to
compete for the limited number of jobs available in the newly created agency.
The reality of this plan generated some anxiety among the COMA and Job Factory
staffs. The immediate common concern among people was their job security.
Many began to take time off to look for work, while some others waited out
the uncertain status of their applications for positions with the new admin-
istration. The main concern for the COMA director was the future operation
of the two remaining Job Factory Voucher Program cycles. Because the Project
was scheduled to run until December 31, 1981 and the final two cycles were
essential to the research design, Brandeis had a vested interest in the contin-
uity of the Job Factory during the transition. The areas of joint concern
for Brandeis and COMA were as follows:
o Staff--The Administrative leadership of the Job Factory Program,stability of training personnel and staff person in chargeof data collection.
o Bookkeeping--Whether a counselor would verify and issue stipendsand social bonus payments.
o Deadlines--Whether cycles would be run according to the schedule,how would recruiting be adequately performed.
o Location--Where would Job Factory be located after the buildinglease expired in October.
52
-39-
In early spring it was decided that the Job Factory would be
placed administratively within the Job Search and Development unit,
whose manager would supervise Job Search and Placement developers, OJT
as well as the youth and adult Job Factories. Along with the Intake
and Outreach unit and the Assessment and Counseling Unit, the Job Search
and Development unit would be subsumed under the Division of Client Services,
whose directors would report directly to the consortium administrator. (See
organizational chart.) Job Search development would no longer be a separ-
ate entity in an array of different programs and services. The question
remained as to what would be the best strategy for implementing the final
three months of the Job Factory Voucher Demonstration contract within the
new organizational context.
In early September the "lame duck" Job Factory manages., consortium
director, and a representative from Brandeis met to resolve this very issue.
The consortium director expressed confidence that the transition could be
effected smoothly. At that time the three parties agreed on the following
administrative details for making the transition:
o A manager of Job Search and Development was hired to beginwork on October 1, 1981.
o The "lame duck" Job Factory manager would remain on a part-timeconsultant basis as needed to assist the new manager or staff.
o The counselors who would run JFFY cycle V were identified. Onehad been hired by the new agency and the other would be re-tained on a consultant contract until December 31, 1981.
o The new agency would assume all responsibilities for recruitingfor JFFY Cycle VI by incorporating it into its own ongoingrecruitment system.
o The hew agency would also assume all bookkeeping responsibilitiesincluding the payment of stipends and vouchers. After Decem-ber 31 Brandeis would handle the voucher payments.
53
-40-
o The staff assistant and intake clerk would remain on contractuntil December 31.
o The new agency would assume record keeping and reportingresponsibilities by incorporating JFFY into its automatedmanagement information system.
There was no resolution made at this time regarding the logistics
of the Job Factory. Brandeis urged an option that would (a) postpone
the moving until the end of the cycle, and (b) consolidate the program
and its manager under the same roof.
From October 1 to December 31 there was some confusion. JFFY cycle V
began on schedule September 18 with a very small pool of eligible recruits.
The recruitment effort had not been particularly successful. This may be
partly explained by the low morale associated with the job insecurity and
by a reduced effort on the part of referring agencies who were also closing
down as the result of budget cuts.
The new manager of Job Search and Development Unit was too preoccupied
with other aspects of the job to devote time and effort to the Job Factory.
So it was decided almost immediately, that the now displaced COMA director
would oversee the running of Job Factory. This decision turned out to be
beneficial in maintaining the program's continuity.
Efforts by the Job Factory staff to coordinate recruitment, outreach
and referral with the other client services were not successful; the Prime
Sponsor staff did not cooperate. Thus, the Job Factory staff assumed re-
cruitment responsibilities. Although this was a partial retrenchment of a
prior agreement, it had beneficial results. The recruitment effort for
cycle VI was quite aggressive and resulted in a sizable pool of eligible
clients. And an additiohal benefit was realized in the extra space that
became available after the Client Services Division moved into its quarters
54
-41-
in the new agency. The moving of office equipment during cycle VI created
a minimum of disruption to the training sessions.
To summarize: the Job Factory experienced implementation difficult-
ies. The process analysis reveals the following:
o Enrollment of participants in the full-treatment group was
down compared to last year's enrollment. Job Factory staff
relied on interagency referrals as a source of applicants.
Instead of developing a recruitment netwnrk that could be
utilized to attract youth to the program, counselors '.id to
promote and recruit youth a few days before each cycle was
to begin.
o The Job Factory program experienced administrative changes
as well as personnel turnover The last two cycles of the
Job Factory were particularly affected by these administrative
changes.
o Changes in physical location of the program affected the
ability of the staff to perform their training functions.
In contrast, the voucher component of the program run generally well
considering that it was the first attempt to carry out such an experiment in
Cambridge.
55

Chapter 4
The Effects of Employee Wage Subsidies in Cambridge
The purpose of the Cambridge experiment was to test the effects of
job search assistance and voucher payments on the employment of disadvantaged
youth. This chapter analyzes the impacts of these experimental treatments.
The first section discusses why one would expect job search assistance and
voucher payments to increase youth employment. The next step is to describe
the methodology and measures that underlie our efforts to test whether the
expected outcomes actually occurred. In the next section, we examine and
interpret the employment and earnings outcomes and draw conclusions concern-
ing the effects of experimental treatments on these outcomes.
4.1 The Expected Effects
Job search assistance and vouchers represent two distinct approaches
aimed,at moving disadvantaged youth into jobs. Under job search assistance,
youth increase their chances to find jobs by learning about their job-related
attributes, by finding out how to look for jobs, by experiencing the discipline
of a job-like environment, and by looking intensively for jobs within a peer
group setting. In short, disadvantaged youth find more jobs because they do
better in reaching prospective employers. The voucher operates by raising
the monetary incentive to work. The hourly voucher payment comes on top of
the wage rate paid by employers. So, the voucher should lower the wage youths
will accept from employers. That is, youth will increase the amount of labor
they supply at low wage rates.
56
-43-
How well each of the treatments succeed should depend on the reasons
disadvantaged youth have low employment levels. If youth are unemployed
because they lack self-esteem, knowledge of job search techniques, and a
willingness to search intensively for work, then the Job Factory should
have a significant impact apart from any impact associated with voucher pay-
ments. To the extent that youth do not accept jobs because of their low pay,
the voucher alone should raise employment.
To test the two approaches, the project randomly assigned disadvantaged
youth into three groups. The full-treatment group qualified for the Job
Factory and the voucher. The voucher-only group had access to voucher pay-
ments but not the job search program. The third group participated only as
a control group. The full treatment theoretically provided youth with two
special aids in finding jobs, while the voucher treatment gave youth simply
an added financial reward for working.
The nature of the treatments and a review of other results suggest
several potential patterns for the timing and mechanism of employment effects.
A 1980-81 study of the Cambridge Job Factory indicated that participation in a
job search program increased youth employment, but only temporarily. When
surveyed ten weeks after the start of the program, 64 percent treatment youth
had found jobs compared to only 40 percent of control group youth. However,
at subsequent follow-ups, the advantage of the treatment group virtually dis-
appeared as control group members also succeeded in finding jobs.
Expectations concerning the timing of the voucher's impact relate
directly to the eligibility for payments. Youth could claim voucher payments
only for hours worked over a 12 week period that began no later than 4 weeks
after application. (The 12 week period could start earlier if the youth finds
57

-44-
a job within the first 4 weeks.) Adding to the short-term incentives
built into the voucher program was the higher rate ($1.50 per hour)
that was available for the first 2 weeks of eligibility. The rate was
only $1.00 per hour for the remaining 10 weeks.
During the initial 4 weeks after application, the full treatment
group could receive $3.50 per hour and training in the Job Factory, while
the voucher-only and control groups have no alternative activity. In
addition, the Job Factory taught youth to show some selectivity in choosing
jobs. These factors suggest that full treatment participants would be
slowest in finding jobs. On the other hand, the push to search and become
hired was highest for Job Factory participants while the program was under
way. This should have led to faster absorption into the labor market.
Once in a job, the treatments might or might not encourage youth to
remain. During the 12 weeks that youths may have claimed vouchers, we
expect that youths would leave at slower than normal rates since the
voucher raised the costs of losing hours of employment. In addition, par-
ticipation in the Job Factory could extend job duration by helping youth
achieve good job matches with employers. After 12 weeks of voucher eli-
gibility, the voucher-only group might show lower than normal retention
as jobs that were worthwhile in combination with the voucher are no longer
acceptable. However, the positive impact expected from the good job
matches should continue even after the first 12 weeks.
On the basis of the expectations about the experiment, we can specify
the key questions, as:
--does access to hourly voucher payments raise the employment levelsof disadvantaged youth?
58
- -does the combination of a
Factory increase the
--does participation in thelead to higher employmentvoucher only?
-45-
voucher and participation in the Jobemployment of disadvantaged youth?
Job Factory' and the voucheramong disadvantaged youth than the
The second set of questions deals with the timing and mechanisms by
which vouchers and Job Factory participation increase employment. These are:
--do positive employment effects resulting from voucher and combinedtreatments fade over time or remain high indefinitely?
- -do positive employment effects occur because treatment groupyouth are willing to accept low wage jobs, because theysearch intensively for jobs, or because they stay with thejobs they find?
--how do the combined and voucher-only treatments affect thejobs youth accept?
--to what extent do youth who qualify for vouchers actuallyclaim the vouchers?
- -how does the pattern of limited taking up of voucher benefitsinfluence our judgement about the voucher's impact on employ-ment and wage rates?
4.2 The Data and Methodology
Data on the employment, earnings, and voucher 'payments of participants
come from intake questionnaires, surveys of participants, and program
records of voucher payments. The intake questionnaire (the Individual
Participant Profile) collected baseline data on the characteristics of
participants. The initial follow-up surveys took place 4 weeks after the
start of each Job Factory cycle, for members of the voucher-only and control
groups. The Job Factory staff obtained comparable data from members of the
full treatment group at the time they exited from the Job Factory program.
Brandeis interviewers undertook the second and third follow-up surveys at
59

-46-
12 and 20 weeks after the start of each Job Factory cycle. Table 4-1 sum-
marizes the timing and the responses to each survey.
The questions of primary interest concerned the employment of par-
ticipants. At each follow -up, the interview data contain information on
whether the participant worked and if so, on the characteristics of the
job. Responses to the employment questions show 1) whether the person
had worked at all since the preceding follow-up (or since enrollment in the
case of the first follow-up); and 2) what the person's principal activity
was during the period since the last follow-up. Those who did find work
reported their wage rate, weekly hours, weekly earnings, and whether the
work was full-time or part-time. All respondents also reported their reserva-
tions wages and their job search methods and intensity.
The simplest way to answer the questions is to compare the mean value
of the employment and earnings outcome measures across the three experimental
groups and to perform significance tests to determine which differences are
statistically.significant. These simple results are good indicators of
actual impacts because of the genuinely random nature of the assignment process.
However, the random assignment to experimental groups does not guarantee
against systematic differences between groups nor against variations in
response rates. To control for these differences and to capture nonexperi-
mental effects, we estimate equations of the following form:
E = f (T, X ) e ,
where E is the value of employment variable i for individual j, T is a vector
of experimental treatment measures, X is a vector of individual character-
istics, and e is the error term for individual j. The nature of the depend-'
60
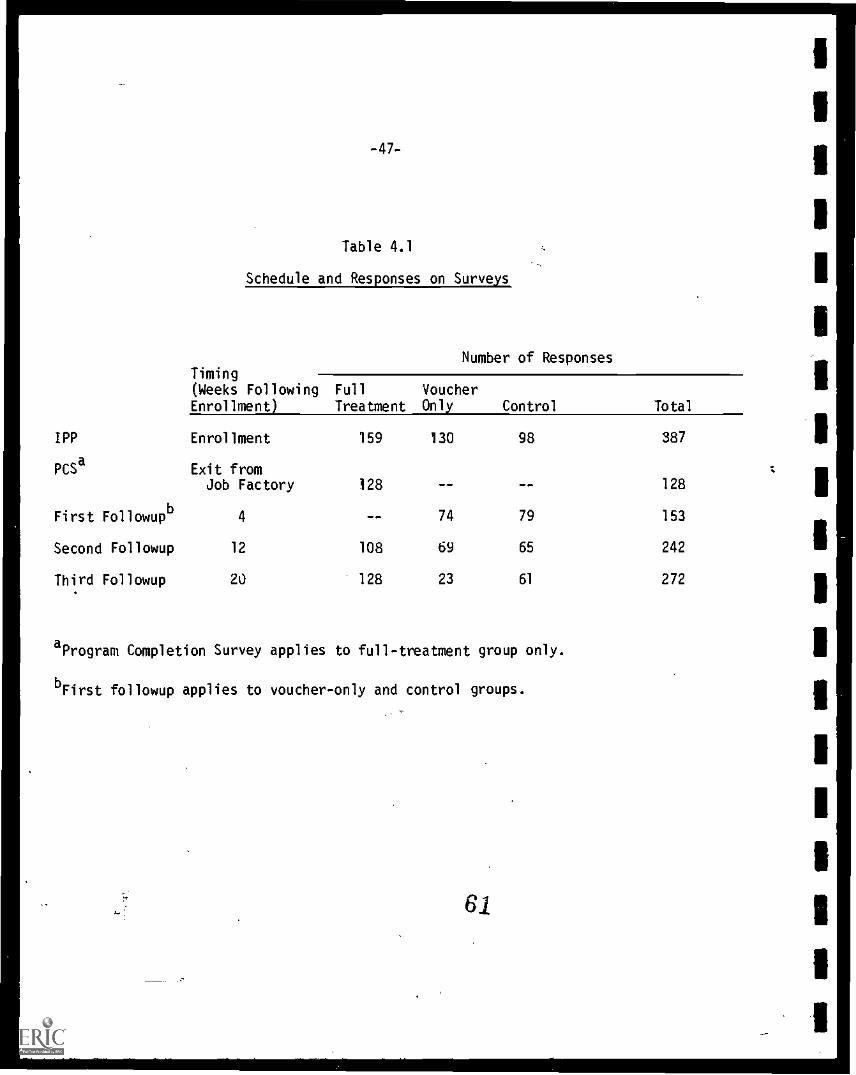
-47-
Table 4.1
Schedule and Responses on Surveys
Number of ResponsesTiming(Weeks FollowingEnrollment)
Full
TreatmentVoucherOnly Control Total
IPP Enrollment 159 130 98 387
PCSa Exit fromJob Factory 128 128
First Followupb
4 74 79 153
Second Followup 12 108 69 65 242
Third Followup 20 128 23 61 272
aProgram Completion Survey applies to full-treatment group only.
bFirst followup applies to voucher-only and control groups.
61
III
1
I
I
I
1
1
II
I
I
I
I
I

-48-
ent variable determines whether we use least squares or :ogit to estimate
the equation.
4.3 The Basic Employment Results
The first step is to determine the impact of voucher-only and full-
treatments on employment levels of disadvantaged youth. Since the primary
purpose of the treatments was to move youth into jobs, we rely largely on
whether the participant worked at any job since the preceding follow-up.
Table 4.2 presents the percentages of each treatment group that
worked as of the three follow-up periods and over the entire follow-up period.
These numbers show that rates of working were lowest for the control group
during each of the post-program periods. At the first follow-up, the differ-
ence between the control and the full treatment group were large, while only
a small difference appeared between the voucher-only and the control group.
By the second follow-up, both the full and voucher-only groups had sub-
stantially higher employment than the control group. The erosion of the
full treatment impact and the strengthening of the voucher-only impact con-
tinued through to the third follow-up.
These results constitute evidence that the treatments did indeed
increase youth employment. However, to see whether the effects hold up
when controlling for nonexperimental variables, we developed a multivariate
analysis of employment impacts. Given our use of dummy dependent variable
equalling 1 if the person worked and 0 if not, we estimated logit equations
at each follow-up. The two treatment variables were dummies reflecting
membership in the voucher or full treatment groups. VOUCHER equalled 1 for
individuals eligible for vouchers and 0 for all others. FULL equalled 1
for individuals eligible for..vouchers and the Job Factory and 0 for
62

-49-
Table 4.2
Youth Who Had Worked between Followups
(Expressed as percentages with sample sizesgiven in parentheses)
Full-Treatment Voucher-OnlyGroup Group Control Group
1st follow-upa 560 39.4 34.3(125) (71) (67)
2nd follow -up 61.5 59.3 44.6(96) (59) (56)
3rd follow-up 57.7 70.0 51.2(104) (70) (43)
Ever Found a Jobc 74.1 70.4 56.5(162) (98) (85)
aFirst follow-up asked youth whether they had worked since program enrollment.
bYouth in Job Factory were interviewed at program exit and were asked if theywere working at that time.
cCalculated as those who had had a job at any follow-up as a percent of allthose who' had a response on at least one follow-W.
63
1
1
1

everyone else. This specification of treatments allows a test of the
difference between effects of the Job Factory plus voucher treatment
and the voucher-only treatment. Moreover, if the voucher had the same
effect on the two groups, the effect of FULL could be decomposed into the
voucher component and the job factory component. Whether the voucher does
exert identical impacts on both experimental groups is an empirical issue
that we address when examining the results.
The logit equation results appear in Table 4.3. Other than the
treatment variables, the only significant variables were FEMALE in the
first follow-up and HSGRAD in the second follow-up. Since the control
variables are mostly insignificant, estimates of treatment effects should
look similar whether they are based on a simple comparison of means or on
the logit analysis. To facilitate the examination of treatment effects, we
present predictions based on the two types of estimates in Table 4.4. The
numbers show the difference in the probability of working attributable to
1) eligibility for the voucher; and 2) the excess of full treatment over
the voucher-only treatment. Both the mean and t value appear in the'Table.
The estimates derived from the logit equations are prediction for individu-
als whose non-treatment variables are zero.
The results form an interesting pattern. The full treatment over
the voucher effect was positive and significant at the first follow-up.
This indicates that the only positive treatment effect came from partici-
pation in the Job Factory. At the second and third follow-up, the voucher-
only exerts a positive and usually significant impact on employment.
However, participation in the job factory exerted no additional effect above what
the voucher-only yields. In fact, including job factory participation on top of
64
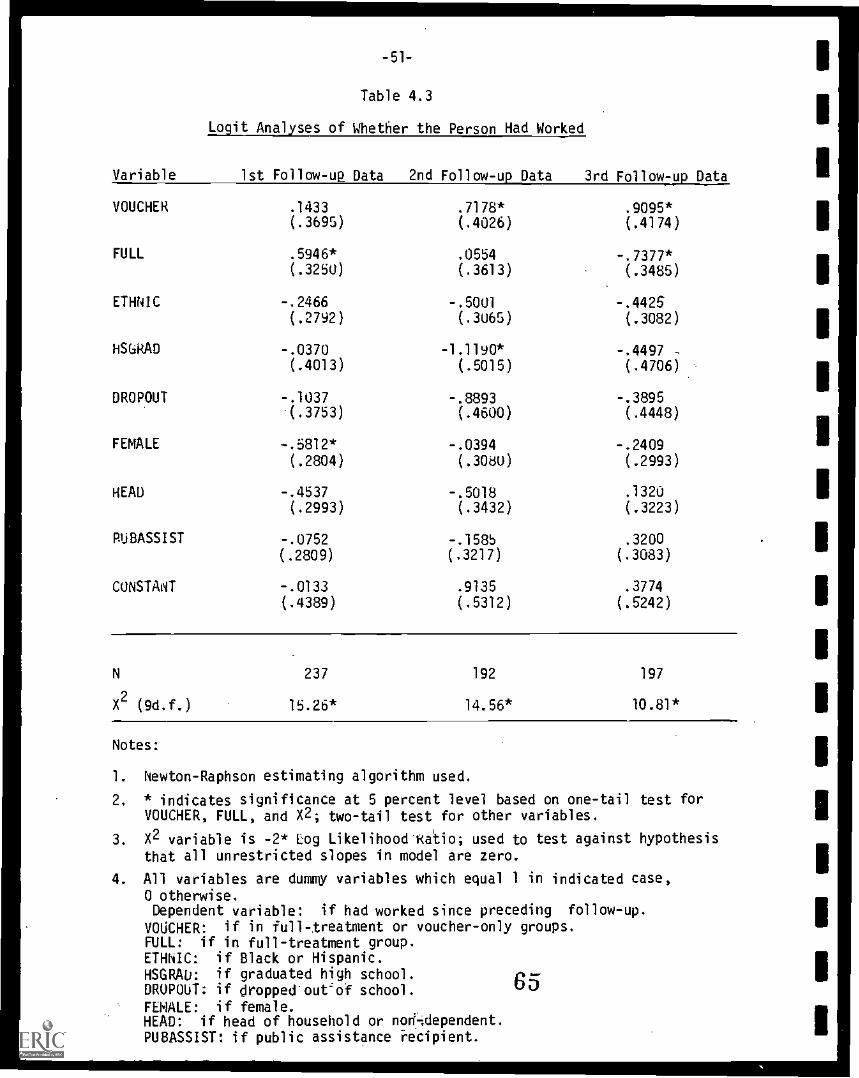
-51-
Table 4.3
Logit Analyses of Whether the Person Had Worked
Variable 1st Follow-up Data 2nd Follow-up Data 3rd Follow-up Data
VOUCHER .1433 .7178* .9095*(.3695) (.4026) (.4174)
FULL .5946* .0554 -.7377*(.3250) (.3613) (.3485)
ETHNIC -.2466 -.5001 -.4425(.2792) (.3065) (.3082)
HS6RAD -.0370 -1.1190* -.4497 -(.4013) (.5015) (.4706)
DROPOUT -.1037 -.8893 -.3895(.3753) (.4600) (.4448)
FEMALE -.5812* -.0394 -.2409
(.2804) (.3080) (.2993)
HEAD -.4537 -.5018 .1320(.2993) (.3432) (.3223)
PUBASSIST -.0752 -.158b .3200(.2809) (.3217) (.3083)
CONSTANT -.0133 .9135 .3774
(.4389) (.5312) (.5242)
N 237 192 197
X2
(9d.f.) 15.26* 14.56* 10.81*
Notes:
1. Newton-Raphson estimating algorithm used.
2. * indicates significance at 5 percent level based on one-tail test forVOUCHER, FULL, and X2; two-tail test for other variables.
3. X2 variable is -2* Log Likelihood Katio; used to test against hypothesisthat all unrestricted slopes in model are zero.
4. All variables are dummy variables which equal 1 in indicated case,
0 otherwise.Dependent variable: if had worked since preceding follow-up.
VOUCHER: if in full-treatment or voucher-only groups.FULL: if in full-treatment group.ETHNIC: if Black or Hispanic.HSGRAU: if graduated high school. 65DROPOUT: if dropped out"of school.FEMALE: if female.HEAD: if head of household or no6dependent.PUBASSIST: if public assistance recipient.
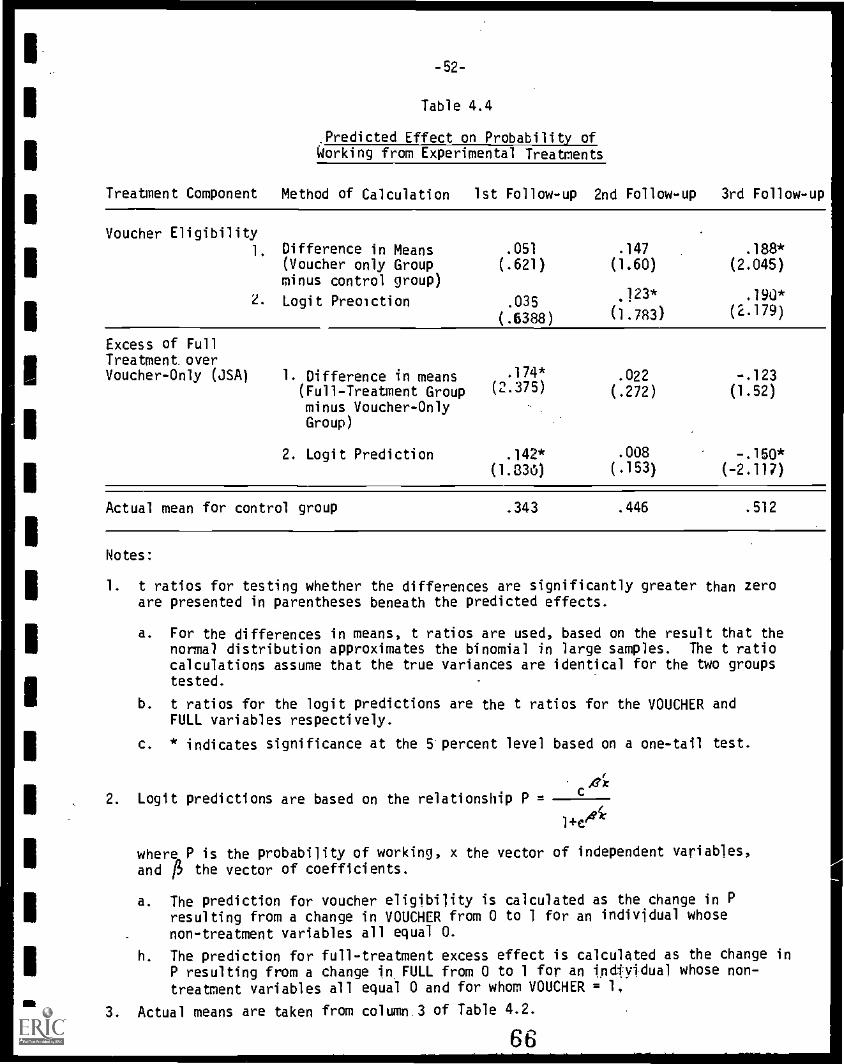
-52-
Table 4.4
,Predicted Effect on Probability ofWorking from Experimental Treatments
Treatment Component Method of Calculation 1st Follow-up 2nd Follow-up 3rd Follow-up
Voucher Eligibility1. Difference in Means .051 .147 .188*
(Voucher only Groupminus control group)
(.621) (1.60) (2.045)
2 Logit Preaiction .035.123* .190*
(.6388) (1.783) (2.179)
Excess of FullTreatment overVoucher-Only (JSA) 1. Difference in means 174* .022 -.123
(Full-Treatment Groupminus Voucher-Only
(2.375) (.272) (1.52)
Group)
2. Logit Prediction .142* .008 -.150*
(1.030) (.153) (-2.117)
Actual mean for control group .343 .446 .512
Notes:
1. t ratios for testing whether the differences are significantly greater than zeroare presented in parentheses beneath the predicted effects.
a. For the differences in means, t ratios are used, based on the result that thenormal distribution approximates the binomial in large samples. The t ratiocalculations assume that the true variances are identical for the two groupstested.
b. t ratios for the logit predictions are the t ratios for the VOUCHER andFULL variables respectively.
c. * indicates significance at the 5 percent level based on a one-tail test.
2. Logit predictions are based on the relationship Pcaz
1+c
where P is the probability of working, x the vector of independent variables,and the vector of coefficients.
a. The prediction for voucher eligibility is calculated as the change in Presulting from a change in VOUCHER from 0 to 1 for an individual whosenon-treatment variables all equal O.
h. The prediction for full-treatment excess effect is calculated as the change inP resulting from a change in, FULL from 0 to 1 for an tnd*yidual whose non-treatment variables all equal 0 and for whom VOUCHER = 1,
3. Actual means are taken from column .3 of Table 4.2.
66

-53-
vouchers apparently reduced youth employment by the time of the third
follow-up.
Note at the bottom of Table 4.4 that employment among control group
members rose steadily over the post-program period. Thus, the increasing
advantage of voucher group members over the control group came on top of
a normal gain in job finding. Similarly, the drop in the advantage of the
full treatment group over the voucher group occurred in the context of
very large increases in voucher group employment. The share of voucher
group members who worked jumped from about 40 to 70 percent between the
first and third follow-up. For the full treatment group to keep pace would
have :required their employed share to reach nearly 90 percent.
To summarize the basic findings:
1) a voucher paid to workers consistently raised employment ofdisadvantaged youth;
2) the voucher impacts rose over time through 5 months after thestart of the program;
3) the combined Job Factory plus voucher treatment producedemployment gains in the initial period after program start-up; but
4) the combined treatment did no better and sometimes worse thanthe voucher alone in later periods.
4.4 Employment Effects: Timing and Mechanisms
0 4.4.1 Implications of Differences in Claiming Voucher Payments
The basic employment effects constitute evidence that job factory pro-
grams and voucher payments can raise employment of disadvantaged youth.
But, we can enhance our understanding of the impact of these treatments by
examining the results on the timing and mechanisms by which vouchers and
67

IIIIII1
IIIIIIIIIIII
-54-
job search assistance produce employment gains.
The timing patterns noted above showed a small initial, but gradually
increasing impact from vouchers and a large initial, and fading impact
from adding Jab Factory participation to the voucher. An odd feature of
the results in Table 4.4 is that, as of the third and final follow-up,
youth who had access both to vouchers and the Job Factory actually had
significantly lower employment than did youth with access to the voucher
only. Although one natural explanation is that the full treatment group
had weaker job characteristics than the voucher group, evidence against
this explanation is the legit results that control for job characteristics.
A second explanation is that the voucher does not exert the same
impact on the full treatment group as it does on the voucher-only group.
It would be understandable that youth in the full treatment group view the
voucher as a marginal part of their treatment, since the Job Factory element
was an intense intervention that provided large stipends. In contrast, the
voucher-only group was likely to pay more attention to vouchers since access
to the subsidies was the group's only treatment.
Evidence for this second explanation comes from data on the share of
treatment group youth that claimed voucher payments. Of course, only those
y-tuth able to find jobs within a 16 week period from the startup of the
program qualified for vouchers. But some youth did not bother to claim
benefits available to them. The numbers in Table 4.5 are consistent with
the idea that the voucher's impact was smaller on the full treatment group
nly group. The rate at which employed members of the
ers was generally much higher than the
1 treatment group. Overall,
than on the voucher-
voucher-only group claimed vouc
take-up rate of employed members of the fu
the fact that many youth did not claim voucher payment
68
even after finding

-55-
Table 4.5
Voucner Use and Employment
First Follow-up
Full Treatment Group Voucher Only Group
56.8b
45.1
39.4
78.6
1. Percent who had job at 1stfollow-up
2. Percent who had job on 1stfollow-up and claimed voucher(vouchereda)
Second Follow-up
61.5 59.31. Percent who had job at 2nd
follow-up
2. Percent who had job at 2ndfollow-up and claimed voucher(vouchereda) 37.3 62.9
Third Follow-up
57.7 70.01. Percent who had job at 3rd
follow-up
2. Percent who had job at 3rdfollow-up and claimed voucher(vouchereda) 46.7 51.0
aVouchered is used here to mean a person who ever claimed a voucher payment.An individual thus will be either vouchered on every follow-up or nevervouchered. The'percent of the sample which is vouchered can vary from onefollow-up to another because the sample of individuals responding differs.
bProgram Completion Survey for full-treatment participants.
69
a job is somewhat surprising. On the other hand, nonparticipation does
occur in most income transfer programs, and the participation rate among
voucher eligibles is not especially low in this context.
The low rate at which the full treatment group claimed voucher pay-
ments suggests that the impact of the voucher treatment was less signifi-
cant for those who participated in the Job Factory. Thus, in decomposing
the Job Factory and voucher effects on the full treatment group, we cannot
assume that the voucher component exerted as large an impact as it did on
those in the voucher-only group. This, in turn, means that the net con-
tribution of theAlob Factory was more positive than implied by the figures
on the bottom of Table 4.4. The.most likely explanation is that the Job
Factory's net impact was slightly positive in the second follow-up, but eroded
to zero by the third.
4.4.2 Job Search, Job Acceptance, and Job Retention
The voucher and Job Factory treatments could raise youth employment
levels in one of three ways:
- -by causing youth to search intensively for jobs;
--by influencing youth to accept jobs that would have beenrejected in the absence of a treatment; and
- -by encouraging youth to stay longer on the job.
In the case of job search intensity, we would expect both the voucher-
only and the full treatments to stimulate youth to increase their time and
effort directed toward finding a job. Table 4.6 allows us to examine whether
differences did emerge in the search activities of the three experimental
groups. Surprisingly, the numbers show no systematic differences in the
intensity with which young people look for jobs.

Table 4- 6
Intensity of Search Among Cambridge Employed Youth
1st Follow-up
1. Found a job
Average number
Full
TreatmentVoucherOnly
of applications 4.6 5.1
filled (48) (24)
Average numberof interviews 5.5 3.1
(50) (20)
2. Unemployed butsearching
Average numberof applicationsfilled 9.g
(3b)
Average number ofinterviews 2.1
(b)
71
at Each Follow-up by Group
2nd Follow-up 3rd Follow-up
Control Full Voucher Control Full Voucher ControlGroup Treatment Only Group TreatmentOnly Group
4.0 6.0 6.5 4.6 7.2(12) (28) (21) (13) (29)
2d 2.7 3.8 4.5 4.6(8) (24) (6) (14) (24)
9.6 8.8 9.1 10.4 8.3(39) (36) (26) (23) (35)
1.6 1.0 1.0 3.0 4.8(11) (4) " (1) (5) (7)
MO I= IM IM r IM IM
7.6 9.2(33) (14)
2.7 4.2(27) (12)
8.0 9.8(16) (13)
1.0
(2)
72
CJ1

-5G-
A second possibility is that the access to voucher payments influence
youth to lower their reservation wage (the lowest wage that will induce a
worker to accept a job). Our expectations were that the exposure to the
voucher-only treatment would reduce reservation wages. However, the Job
Factory component of the full treatment would either have no effect or would
encourage youth to raise their self-esteem, their confidence in finding a job,
and thus their wage expectations.
Since the wage rate does not capture all aspects of the job's desirabil-
ity, the analysis of potential effects on reservation wages must take account
of accompanying effects on what overall job characteristics are acceptable.
Tables 4.7, 4.8, and 4.9 present information on how wage and job character-
istics were affected by the two treatments.
A comparison of the mean wage rates provides evidence that access to
vouchers lowers reservation wages. At all three follow-up periods, the mean
wage rate of members of the voucher-only group was well below that of the control
group. is expected, the full treatment exerted less of an impact or no impact
on reservation wages, partly because inclusion of a 4ob Factory treatment
tended to raise wage expectations and tended to lessen the importance youth
placed on the vouchers.
To examine wage impacts in a way that controlled for nonexperimental.
variables, we regressed wage rates against the two treatments and a set of
control variables. The results in Table 4.9 confirm the findings that 1) the
voucher exerts a negative impact on wages; and 2) the combined voucher -job-
factory treatment raised wage rates in comparison to the voucher-only treat-
ment, but had essentially no effect relative to no treatment.
It is possible that the low wages acceptable to voucher-only youth do
not represent an increased willingness to take jobs, but simply the result of
73

-59-
Table 4.7
Mean Wage Rates
Full-Treatment Group Voucher-Only Group Control
Group
Vouch-ered
Never Vouch- Over-
ered all
Vouch-
ered
Never Vouch- Over-ered all
First Follow-up 3.70 4.05 3.90 3.64 3.66 3.65 3.81
(27) (35) (62) ' (21) (4) (25) (19)
Second Follow-up 3.84 3.95 3.90 3.41 3.41 3.41 4.07(17) (22) (39) (18) (9) (27) (19)
Third Follow-up 4.22 4.10 4.16 3.56 3.80 3.67 4.40
(25) (24) (49) (22) (18) (40) (17)
74
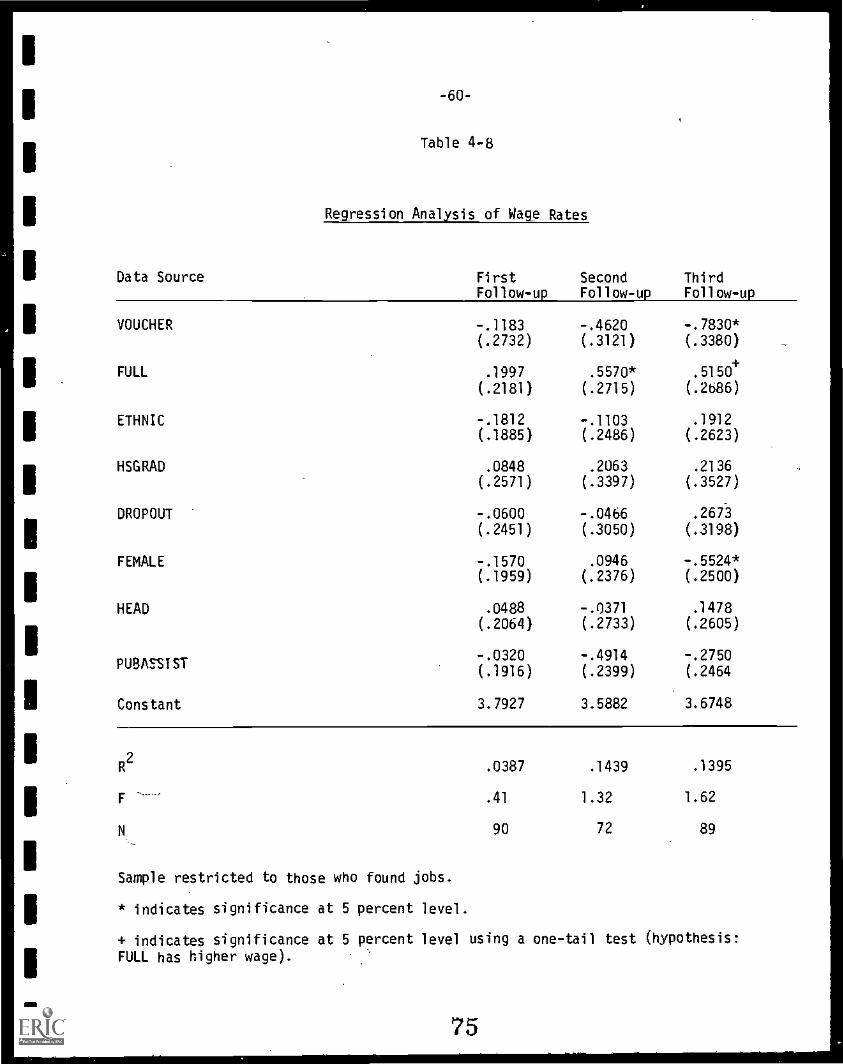
-60-
Table 4-8
Regression Analysis of Wage Rates
Data Source First Second ThirdFollow-up Follow-up Follow-up
VOUCHER -.1183 -.4620 -.7830*(.2732) (.3121) (.3380)
FULL .1997 .5570* .5150(.2181) (.2715) (.2686)
ETHNIC -.1812 -.1103 .1912(.1885) (.2486) (.2623)
HSGRAD .0848 .2063 .2136(.2571) (.3397) (.3527)
DROPOUT -.0600 -.0466 .2673
(.2451) (.3050) (.3198)
FEMALE -.1570 .0946 -.5524*(.1959) (.2376) (.2500)
HEAD .0488 -.0371 .1478(.2064) (.2733) (.2605)
PUBASSTST-.0320
(.1916)
-.4914
(.2399)
-.2750(.2464
Constant 3.7927 3.5882 3.6748
R2
.0387 .1439 .1395
.41 1.32 1.62
N 90 72 89
Sample restricted to those who found jobs.
* indicates significance at 5 percent level.
+ indicates significance at 5 percent level using a one-tail test (hypothesis:
FULL has higher wage).
75

1._
-61-
trading off higher wages for better nonwage job characteristics. However,
when ve' examine Tables 4.9 and 4.10, we find no evidence that youth from the
voucher-only group were able to find jobs in higher level occupations or
jobs offering longer hours. Indeed, voucher-only youth tended to take
jobs providing slightly lower hours than the jobs of youth from control or
full treatment groups. However, since those in the voucher-only group that
claimed payments had no lower hours than did other groups, the lower hours
for the voucher-only group as a whole was not apparently caused by the voucher
treatment.
A final way that treatments can affect employment is to encourage
youth to remain on jobs. In general, we would expect the voucher-only and
the full treatments to lengthen job tenure. The voucher offers a temporary
subsidy to hours of work, and thus raises the financial loss from hours of
not working during the period that the voucher is available. Although a per-
manent voucher would also exert an income effect that might tend to lessen
tenure, the voucher in this experiment was a temporary one and thus should
have a relatively weaker income and stronger substitution effect. The full
treatment should also increase tenure since the Job Factory should contribute
to helping youth match themselves with appropriate jobs.
The numbers in Table 4.11 provide some indication that the voucher
extends job duration. Of those who had worked as of the first follow-up,
94 percent of voucher-only youth but only 32 percent of control youth were
still working at the second follow-up. However, job retention between the
first and second follow-ups was lower for full treatment youth than for control
group youth. The role of the voucher looks more important when examining
retention from the first through the third follow-up. Here, the full
76

6 2
Table 4-9
Distribution of Job Finders Among Occupational Categoriesas of First Follow-up in Cambridge
Full Treatment Voucher-Only ControlGroup Group Group
1. Laborers and low levelservice workers 29.4 30.8 33.3
2. Service workers, lower levelcrafts and operations 26.6 23.1 23.8
3. Clerical, crafts,IIand kindred 44.1 46.2 42.9
4. Higher status -- -..
Sample size 62 26 21
77
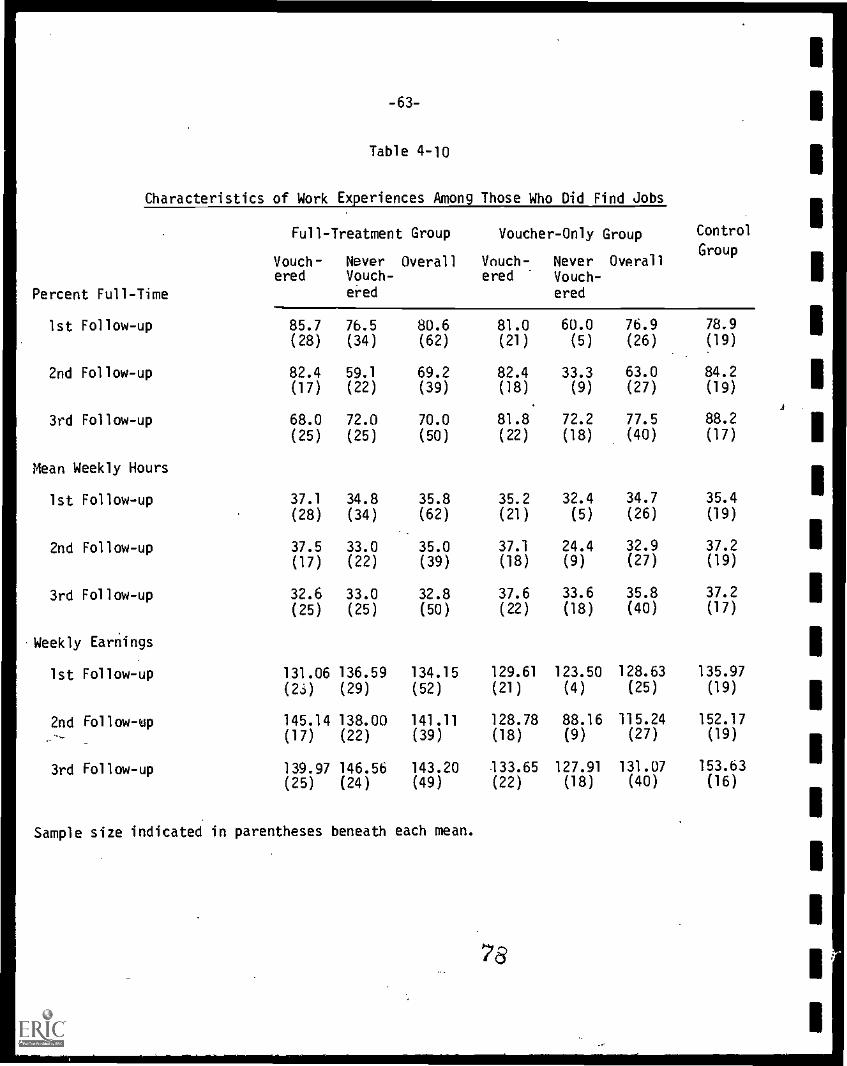
-63-
Table 4-10
Characteristics of Work Experiences Among Those Who Did Find Jobs
Percent Full-Time
Full-Treatment Group
Vouch- Never Overallered Vouch-
ered
Voucher-Only Group
Vouch- Never Overallered Vouch-
ered
Control
Group
1st Follow-up 85.7 76.5 80.6 81.0 60.0 76.9 78.9(28) (34) (62) (21) (5) (26) (19)
2nd Follow-up 82.4 59.1 69.2 82.4 33.3 63.0 84.2(17) (22) (39) (18) (9) (27) (19)
A
3rd Follow-up 68.0 72.0 70.0 81.8 72.2 77.5 88.2
(25) (25) (50) (22) (18) (40) (17)
Mean Weekly Hours
1st Follow-up 37.1 34.8 35.8 35.2 32.4 34.7 35.4
(28) (34) (62) (21) (5) (26) (19)
2nd Follow-up 37.5 33.0 35.0 37.1 24.4 32.9 37.2
(17) (22) (39) (18) (9) (27) (19)
3rd Follow-up 32.6 33.0 32.8 37.6 33.6 35.8 37.2
(25) (25) (50) (22) (18) (40) (17)
Weekly EarOings
1st Follow-up 131.06 136.59 134.15 129.61 123.50 128.63 135.97
(2J) (29) (52) (21) (4) (25) (19)
2nd Follow-up 145.14 138.00 141.11 128.78 88.16 115.24 152.17.,-... (17) (22) (39) (18) (9) (27) (19)
3rd Follow-up 139.97 146.56 143.20 133.65 127.91 131.07 153.63
(25) (24) (49) (22) (18) (40) (16)
Sample size indicated in parentheses beneath each mean.
78
IIIIIII1
IIIIIIIIIII

. Had found job beforefirst follow-up
a. Percent who had jobby second follow-up
b. Percent who had jobjob by third follow-up
c. Percent who had jobbetween first andsecond follow-up
-64-
Table 4.11
Job Retention
Full-Treatment Voucher-Only ControlGroup Group Group
70 94 82
52 75 55
66 81 84
Base for (a) percentage omits cases with missing data on second follow-up;for (b) percentages cases with missing data in third follow-up omitted.
79
-65-
treatment group shows higher retention than controls and the advantage of the
voucher-only group over controls widens.
The only detailed data on hours on the job comes from the program
records on voucher payments. For the subgroups claiming vouchers, we can
determine their total hours by dividing total payments by the hourly voucher,
rate. Table 4.12 shows that the total reimbursements of voucher-only and
full treatments claimants were about the same for the initial two-week com-
ponent, but that payments were considerably lower for the voucher only group
over final 10 week component. If we consider hours reimbursed relative to
a typical 37.5 hour week, it is clear that youth took much more complete
advantage of the initial, $1.50 subsidy than of the later $1.00 subsidy. Once
in a job, youth claiming vouchers worked only about half the potential hours
(over the last 19 weeks) for which vouchers were available.
The findings concerning the timing and mechanisms of treatment effects
do have limitations not emphasized in the above presentation. The attrition
and nonresponses make samples sizes vary. The patterns are often not entirely
consistent with a particular explanation. And the differences among groups
that do fit our expectations are frequently not statistically significant.
nevertheless, we can draw some conclusions about which mechanisms did
and did not influence outcomes. First, the positive employment effects did
not seem to result from more intensive job search assistance. Second, the
reduction in reservation wages may well have contributed to the voucher's
impact on employment, but no such mechanism explained ,the initial positive
effects from the full treatment. Third, the voucher-only and full treatments
appear to have caused only slight increases in job tenure.
80

-66-
Table 4.12
Mean Voucher Payments Per Youth
Full TreatmentGroup
Voucher-OnlyGroup
Mean payments at $1.50 rate $ 82.46 $ 83.94(39) (32)
Mean payments at $1.00 rate 189.10 166.56(49) (41)
Total payments per youth 244.74 226.55(51) (42)
Mean payments as percentageof maximum possible payments at$1.50 ratea 73.3 74.6
Mean payments as percentageof maximum possible payments at$1.00 ratea 50.4 44.5
aThe maximum possible payment assumesa 37.5 hour week.
81
-67-
4.5 Employment Effects in Relation to Costs
The desirability of a program depends on its costs as well as on
its effects on employment and earnings. To compare the effects estimated
above with the costs, we must develop measures of costs associated with
each treatment, net of special research and demonstration costs. To do so,
we draw on itemized cost data provided by the Cambridge program operators.
These actual cost figures appear in Table 4.13.
The first step is to subtract costs associated with the research effort.
Since program counselors had to interact with Brandeis researchers in several
instances, we allocated 5 percent of counselors' time to research activities.
Operators also had to incur some recruitment costs to attract enough appli-
cants for controls as well as participants. Recruitment costs consisted of
advertising and an incentive payment of $2.00 to some youths who completed
applications. This incentive fee was paid on a very irregular basis. After
dividing recruitment costs in proportion to the fraction of youth enrolled
in each group, we deducted that portion of costs attributable to the control
group as a research expense.
Decomposing program costs into Job Factory and voucher components is
the next step. Nearly all operational outlays paid for staff and resources
went toward operating the Job Factory. In addition, all stipends paid for
attendance at the Job Factory. The total costs of the voucher-only treatment
were the voucher payments to the voucher-only group, the costs of recruiting
voucher youth, and the costs of administering the voucher payments to the
voucher-only group. Counselors assisted in preparing voucher claims, spend-
ing no more than half a day each week. A COMA accountant devoted one morning
a week to verification of voucher claims; a payment clerk had to prepare the

-6a-
Table 4-13TreatM6nt Costs
COMA Expenses
ActualCosts Research and
DemonstrationCosts
Allocation to:
Full-Treat-ment Group
Voucher-OnlyGroup
Personnel: Counselors andFringe benefits X112,472 $5,624b $106,049 $799c
Staff Training 12,000 12,000
Rent 15,000 15,000
Telephone 5,500 5,500
Printing/Xerox 3,846 3,846
Video 1,705 1,705
Supplies 3,500 3,500
Furniture/Equipment 2,702 2,702
General & Admin-istrative 20,074 18,876 $1,198c
Total 176,799 5,624 169,178 1,997
Incentive Payments
Recruitment & Incentives 12,375 2,980d
5,940d
3,465d
Stipends (for Job Factory 62,479 62,479Attendance)
Voucher Bonuses 20,972 11,954 9,018c
Total $272,625 $8,604 $249,551 $14,480Notes:
aCOMA presented a budget for both the earlier and the current demonstration combined,
running from May 1979 to Dec. 1981. We subtracted the budget items presented afterthe earlier demonstration to obtain the figures in the first column.bCounselors are assumed to spend 5 percent of their time on research efforts so we
allocate 5% of the personnel budget to research and demonstration costs.
cTo estimate the cost o' administering the voucher payments, we assume the following:
1) Counselors spend altogether 4 hours per week for 69 weeks. Assuming an annualsalary including fringes of $14,000, or $6.73 per hour, counselor costs amount to$1,857.
2) The accountant with a $15,000 annual salary spends 4 hours per week for 69 weeksamountfilg to a cost of $1,990. The payment clerk, earning $12,000 per year,spends 2 hours per week for 69 weeks costina $95 These two items total $2,785and are assumed to be part of general ana aaministrative expenses.
83

t
d
-69-
(Notes to Table 4-13 Continued)
3) We divide these costs and voucher bonus payments between the full-treatmentand voucher-only groups in proportion to the number of voucher claimants ineach group: 57 percent are in the full-treatment group and 43 percent inthe voucher-only group. This gives the following breakdown of voucher costs:
Total Full-Treatment Voucher-Only
Personnel $ 1,857 $ 1,058 $ 799General and Administrative 2,785 1,587 1,198Voucher Bonuses 20,972 11,954 9,018
Total Voucher Costs 25,614 14,599 11,015
For the full treatment group these cost items are lumped together with othercosts on each budget line.
Recruitment and Incentive costs were allocated between all three groups in pro-portion to the numbers of youth actually assigned to each group: 48 percent inthe full-treatment group, 28 percent in the voucher-only group, and 24 percent inthe control group. Since the control group was included strictly for researchpurposes, we include the recruitment costs allocated to it as part of researchand demonstration expenses.
84",.
-70-
checks, spending an average of 2 hours per week. After estimating these
costs of processing vouchers, we allocate them in proportion to the numbers
actually claiming vouchers in two treatment groups (43 percent of claimants
in the voucher-only and 57 percent in the full treatment groups). To
allocate the voucher payments, we used the same breakdowns.
How we allocate additional overhead expenses depends on whether we
view the voucher as an add-on activity or a full, separate program. Were
the voucher program only an add-on activity, its added costs for rent,
supplies, and furniture would be minimal. However, it is not clear that the
voucher program would always be a small component of an existing activity.
In this case, some additional overhead should be attributed to the voucher-
only treatment.
We assigned additional overhead costs of relevant items to the voucher-
only program in the same proportions as the general and administrative costs.
Although this makes the voucher program look more costly than it would be
as an add-on activity, the voucher-only treatment remains much less expensive
than the full treatment.
Having derived the costs of each treatment, we consider these costs in
relation to the number of participants, to the number of participants who
became employed, and to the number of participants whose employment was asso-
ciated with the treaWent. Note on line 3 in Table 4.14 that the unit costs
of the voucher program were far less than those of the full treatment. This
is because the full treatment includes not only the same voucher costs items
as the voucher-only treatment, but also the high costs of running the Job Factory.
Part of the reason for the low voucher-only costs is that many eligible youth
(even some who found jobs) did not claim vouchers and those who did claimed
85

-71-
Table 4-14
Unit Costs
1. Total Cost
2. Number of Partipants
3. Cost per Enrollee (1..i. 2)
First Follow-up Comparisons
4. Proportion of enrollees finding ajob by 1st follow-up
5. Cost per job finder by 1stfollow-up (3 i 4)
6. Net proportion of job finders abovecontrol group rate
7. Cost per net job finder by 1stfollow-up (3 i 6)
Ever Found Job Comparisons
8. Proportion of enrollees who ever foundjob
9. Cost per job finder (3 = 8)'
10. Net proportion of ever job finders
Full-Treat- Voucher-Only Job Factoryment Group Group Treatment
(1981 Study)
$249,551 $14,480 $197,827
161 130 200
$ 1,550 $ 111 $ 989
.57 .39 .64
$ 2,719 $ 286 $ 1,545
.23 .05 .16
$ 6,739 $ 2,220 $ 6,181
.74 .70 .79
$ 2,094 $ 159 $ 1,251
above control group rate .18 .14a
11. Cost per net job finder $ 83611 $ 793 $
aThe proportion for the control group was slightly higher than for the job factory group.
86

-72-
far less than the maximum possible amount. On the other hand, those who
were assigned to the Job Factory did generally participate and take the
stipends to which they were entitled.
Still another reason for the high unit costs of the Job Factory
component was the relatively low participation. In a job search program,
fixed costs tend to be high and recruitment is difficult. So, running a
Job Factory that is not operating at capacity is common and expeniive. In
comparison to the Cambridge Job Factory's operations in the prior year, the
year of this experiment had more cycles (6 instead of 5) yet fewer total
participants (161 instead, of 200). So, while total costs between one year
and another rose about 15 percent, the low utilization of capaCity raised
unit costs by nearly 50 percent.
In principle, the high unit costs of running a Job Factory could be
worthwhile were the program to show enormous impacts on employment and earn-
ings. In fact, the full treatment demonstrated no general advantage over the
voucher-only treatment in generating increased employment among disadvantaged
youth. Even when employment gains for the full treatment group did exceed
the gains associated with the voucher-only treatment, the only part of the
far higher costs are offset by the differential effects. Table 4.14 proliides the
data for these comparisons.
The cost per additional job under the full treatment alternative was not
far from the comparable figure derived in an earlier study of the pure effect
of the Job Factory. At a cost of between $6000-$8000, the Job Factory is
apparently able to increase by 1 the number of disadvantaged youth who find
jobs over a 5 month period.
87

-73-
On the basis of this experiment, the voucher-only treatment is able
to add to the disadvantaged youth finding jobs at a much lower cost. The
results suggest that for the net costs of using the voucher-only approach
lie between $800 and $2000.
These figures alone do not provide conclusive evidence for the
superiority of the voucher-only as compared to the Job Factory or the full
treatment. For one thing, the Job Factory may teach youths about themselves
and about job search strategies in a way that helps participants over a long
period. Such long-term benefits would carry weight in any decision about
choosing between one or the other alternative. However, the evidence from
this experiment does not suggest any positive long-term benefits. Indeed,
the benefits that are associated with the full treatment erode by 20 weeks
after the Job Factory began.
88
Chapter 5
The Effects of Employer Wage Subsidies in Wilkes-Barre
5.1 Design of the Experiment
The Wilkes-Barre (Pennsylvania) Job Search Voucher Project (JSVP)
operated under the auspices of the Youth Employment Service (YES), a
non-profit community based organization that has provided counseling and
job placement assistance to youth in the Wilkes-Barre area for several
years. The voucher experiment offered special wage vouchers to a randomly
selected group of employers if they hired youth from the YES program.
YES was thus used to administer the payment of vouchers to employers as
well as to prepare the youth who if hired, would make the employers eligible
for the voucher. This demonstration expanded from a Job Search Demonstra-
tion Project for low income youth. Over the FY 1981 period, YES was
required to recruit 500 low income youth, ages 16-21, into a job search
program which was part of this demonstration.
Although we were interested in the response of employers to vouchers,
we had to take account of the fact that the voucher experiment co-existed
with TJTC, a national program subsidizing the Hiring of all low income
18-24 year olds. To isolate the effects of TJTC and voucher subsidies, we
developed 2 kinds of treatments. One was simply a direct marketing of
TJTC for 18-24 year olds. The second added access to vouchers along with
direct marketing of TJTC. Firms hiring 16-17 year olds would be eligible
for the vouchers.
89

-75-
The design yields a three-way division of employers. Brandeis ran-
domly assigned employers to one of three categories: 1) A TJTC promotion
group which was urged to use TJTC; 2) a voucher group which was urged to
use TJTC and was eligible for voucher payments if 16-17 year olds were
hired; and 3) A 2- treatment control group. The treatments directed at
employers are summarized in Table 5.1.
5.1.1 The Treatments Directed at Employers and Random Assignment
The size of the voucher payment for eligible firms hiring low
income 16-17 year olds was
(1) $1.80 per hour during the first three months the youth
worked for the firm; and
(2) $1.00 per hour for the next five months the youth
worked for the firm.
A maximum hours' limitation of 40 hours per week and a 'minimum wage
of the Federal minimum wage applied to all voucher recipients. YES, which
administered the experiment, was interested in stimulating employment of
youth in general, but it as particularly interested in encouraging firms
to hire participants in its job search Workshop. YES job developers con-
tacted employers in Wilkes-Barre in order to stimulate job orders for their
participants. It also promoted the use of TJTC for 18-24 year olds during
the contacts with employers. The use of TJTC, of course could not be
restricted to YES participants. Voucher payments (to eligible firms) would
also apply to youth who did not go through the YES Workshop.
In order to facilitate the research effort, YES made available a
list of employers to researchers specifying the size,,class, industry, and
location of each employer.
90

-76-
Three criteria were used for stratifying employers: Youth intensity,
size and location. Based on national statistics, industries were divided
into three groups: high, mediun andow, regarding number of youth
employed. For example, clerical, sales and service industries are high
intensive; processing, fabrication, construction, machinery and tooling
are medium; and professional, technical, and managerial are included in the
low category. Local employers were then assigned a youth intensity rating
based on their industry. Size was the second factor considered. Firms
employing 100 workers and more were defined as large; between 50-99
workers, medium; and between 1-49 workers, small. The third consideration
was whether employers were located in or outside of Wilkes-Barre. Subsequently,
researchers randomly assigned employers to treatment and control groups using
the YES-provided list of employers and a list from the Pennsylvania Industrial
Directory, 1980. As of May 1981, 375 employers were assigned to the treat-
ment and control groups as follows:
Treatment Group #1: 125
Voucher and TJTC
Treatment Group #2: 125TJTC
Control 125
The YES-JSV project was intended to provide a test of three primary hypotheses:
(1) Providing employers with a direct subsidy to wage costs
of employing low income 16-17 year olds would'stimulate0
the firms' demands for low income 16-17 year olds;
(2) Subsidizing 16-17 year olds would adversely affect the
hiring of 18+ year olds.
(3) Firms contacted directly to promote TJTC would make greater
use of TJTC and hire more 18+ year olds than firms not con-
tacted, possibly enough to overcome any adverse effect in (2).
91
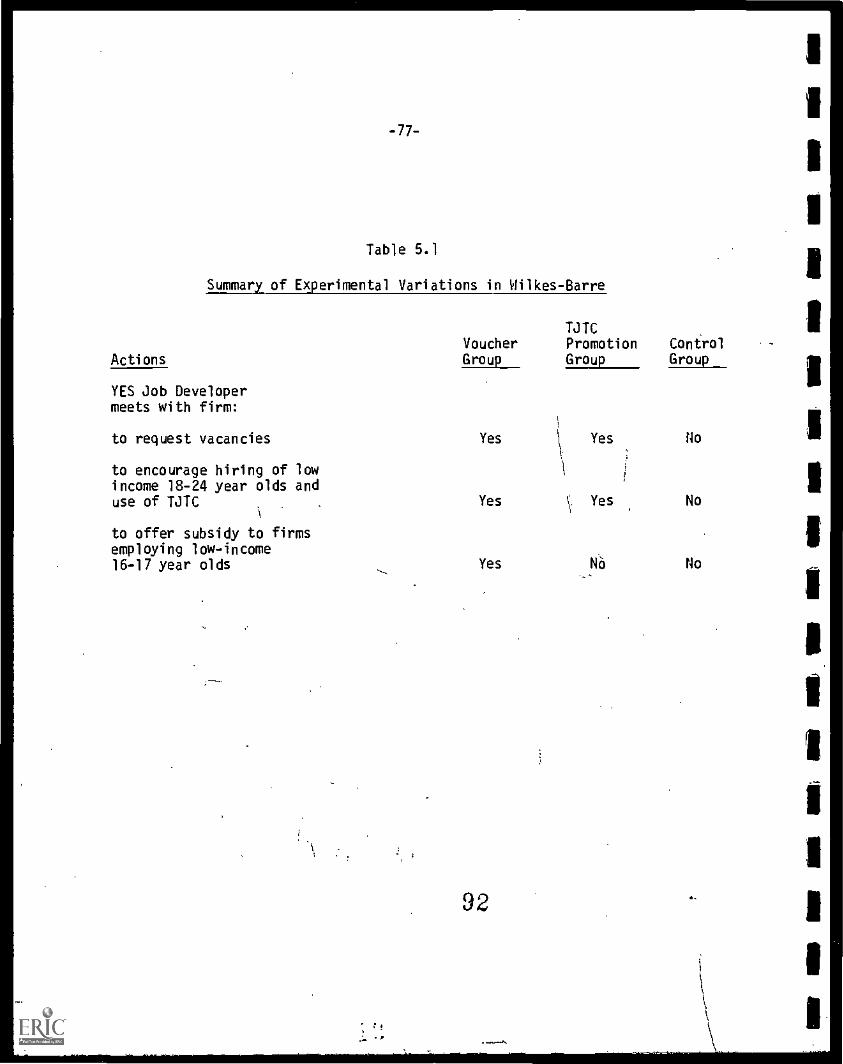
-77-
Table 5.1
Summary of Experimental Variations in Wilkes-Barre
Actions
YES Job Developermeets with firm:
TJTCVoucher Promotion ControlGroup Group Group
to request vacancies Yes
to encourage hiring of lowincome 18-24 year olds anduse of TJTC Yes
to offer subsidy to firmsemploying low-income16-17 year olds Yes
92
Yes No
Yes
Na
No
No

-78-
5.1.2 The Workshop
The Workshop program provided the pool of youth who, if hired,
would qualify eligible firms for the voucher subsidies. Counseling and
job placement services were the-key components of the program. The pro-
gram was premised on the belief that youth need to be assisted in the
development of self-confidence that would facilitate future contacts with
employers.
Youth were counseled on an individual basis. The sessions were
scheduled according to the needs of the client. On the average, youth
attended six counseling sessions and one workshop session per month of
program attendance.1
Job placement services provided -a channel to communicate local labor
market information to youth in the program. Youth were exposed to the
"job bank" that consisted of a current list of local job openings for youth.
The objective was to match the needs of employers in the community to the
interests, experience and skills expressed by the youth through the counsel-
ing sessions. The job bank developed and updated by program counselors
and job developers.
Once counselors received a specific job request from a participating
youth, the information was recorded on a file card that was sent to the
job developer, and circulated among those employers who were being contacted
at the time. If a specific job opening was available, counselors contacted
youth to discuss the details of the job being advertised.
In addition to counseling and job placement, all youth in the program
were expected to attend a minimum of one placement skill workshop. The goal
1Data Source: Report from YES to Department of Labor, December 1981.
This program, like the Job Factory, was evaluated by CEIS. See, Hahn et al.
93

-79-
of the four workshops offered was to teach youth practical job hunting
skills that would make job search more efficient, i.e., how to identify
employers, fill out an application, write a resume, conduct an interview,
etc. Materials used for the workshops were developed by the program staff
and include: instructions to fill out an application, a sample application,
systematic job search instructions and format, and a list of questions that
prospective employers may ask. Youth who received a high score in the
proficiency test developed for each workshop could be exempted from a maxi-
mum of three workshops.
Some of the issues discussed in the workshops included:
- Dealing with a job application
- Dealing with limited past experience or limited skills
- Personal presentation and appearance during job interview
- How to listen
- Specific questions to ask during interview
- What the employer expects of the interview
- Reviewing stress questions that may be asked during job interview.
5.2 Evaluation of the Wilkes-Barre Job Search Voucher Project
The heart of the Wilkes-Barre project was to be a study of how em-
ployers responded to the vouchers and also to the effort to encourage them to
use TJTC. This section will first discuss the treatments applied to em-
ployers and their responses. It will then consider the operations of the
Workshop run by YES which provided the pool of youth that would qualify
firms for the voucher. Finally, it will consider the costs of the Wilkes-
Barre project. For Wilkes-Barre process and impact results will both be
discussed together in this chapter.
94
-8p-
5.2.1 Emplo er Treatments and Their Impacts
5.2.1.1 YES Contacts with Employers
YES contacts with employers involved three tasks: 1) job develop-
ment for youth in the Workshop; 2) promotion of the use of TJTC for 18-24
year olds in or out of the Workshop; 3) encouraging the use of vouchers for
16-17 year olds in the Workshop.
In contrast with the Cambridge Job Factory, the Workshop did use
job development. The job development activities were funded by the Depart-
ment of Community Affairs. Each YES staff person was required to contact
employers to build up a job bank. The staff were not restricted to firms
in the study sample. Indeed, the only restriction was that firms in the
control group would not be approached for job development. YES was assisted,
by the Office of Employment Services which also engaged in job development
and which made its job orders available to the Workshop program. Employers
in the job bank included fast food establishments, banks, retail establish-
ments and factories. Counselors tried to steer youth away from factory
work by informing them of restrictions on age, expericl and education.
Secretarial jobs were also discouraged because the public school secretarial
training is too far below the standards needed by industry. Therefore the
participants were encouraged to apply for such positions as salvs'clerks,
cashiers, bank tellers, short-order cooks and counter clerks.
The experimental design required additional tasks by the job developer
in contacts with employers in the voucher and TJTC promotion groups. Those
in the voucher group had to be informed of their eligibility for voucher
subsidies if they hired 16 or 17 years olds from YES. Those in both treat-
ment groups were encouraged in advance as well as at the time of the
95

-81-
contact with the job developer to use a TJTC voucher for 18 or 19 year
olds. Although advance contacts with employers in the two treatment
groups started late due to administrative problems, the job developer
from YES was able to compensate for the initial delay. All 250 employers
assigned to the treatment groups had been contacted at least once by
May, 1981. The numbers of contacts and recontacts is reported in Table 5.2.
Table 5.2
Humber of First Contacts and Recontacts
1st Contact Recontact
Voucher Group 125 196
TJTC Promotion Group 125 215
Recontacts of treatment employers started in December, 1980. A year
later, the job developer had completed 411 recontacts of sampled employers.
5.2.1.2 Impacts of Employer Treatments
Several sources of information were planned to obtain information
on employer responses. Employers were to be surveyed by the research
contractor. Information on the extent of voucher use would be obtained
from YES records. Data on the use of TJTC would come from records of the
Office of Employment Security.
The research design called for interviews with employers assigned
to the two treatment groups and the control group. There was to be a
baseline survey and a follow-up. Although the baseline survey was completed,
it proved to be so difficult for the researchers to make contact with
employers that the follow-up survey could not be conducted. As it turns
96
-82-
out, programmatic data from YES and the Office of Employment Security
give a reasonable picture of employer response; the baseline survey gives
some further insights into the reasons for the observed response.
COnsider first the data from YES records on the number of firms
claiming voucher payments for hiring 16-17 year olds. Only1 firms out
of the 125 in the Voucher group took advantage of the bonus. A fourth
firm, not originally in the group, requested the opportunity to use the
voucher; the request was granted to test the voucher payment mechanism,
given that so few firms were claiming vouchers. These 4 firms hired 5
out of the 479 youth in the Workshop. Ideally, we would have wanted to
measure whether the voucher contributed significantly to the employment
of 16-17 year olds by Voucher Group firms in comparison to Control Group
firms. Since the voucher itself went virtually unused, it could not have
had any significant effect on employment.
Now consider data from records of the Office of Employment Security
on the use of TJTC among firms in the three groups. Precisely one firm
from each of the employer groups used TJTC for youth it hired. The employ-
er in the voucher group actually claimed the credit 'for 7 youths, but
the other firms claimed it for just one youth apiece. There was thus
no impact from the effort to promote the TJTC among the treatment groups:
the use of TJTC was negligible both for them and for the control group.
-3
The baseline study, even though it was conducted before treatments
began, does provide useful insights into employer behavior. A summary
of background data on firms, broken down by employer treatment group,
appears in Table 5.3. This survey included questions on the attitudes
and behavior of Wilkes-Barre firms toward hiring youth. Fifty-eight
percent of employers scheduled for interviews did provide complete in-
formation (n = 216). Another 9% were out of business and 33% refused to
97

-83- 1
answer the questions.
Employers were asked about their present and future hiring practices
regarding 16-17, 18-24, and 25 and older workers. Overall, 72 percent of
sampled firms have not employed any 16-17 year old workers in the last 3
calendar quarters, while 27 have employed at least one 16-17 year old. The
percentage of firms employing at least one older youth (18-24) is higher- -
74 percent compared to 26 percent of firms that have not employed any youth
in this age group. Considering new hires, there is a slight difference be-
tween the percentage of companies who have not hired any 16-17 year old
workers (80 percent) and companies that do not employ 16-17 year olds.
Sixty-eight percent of employers report no company vacancies (for all
workers) in the current quarter. On the average employers report 11 applicants
for each entry level opening (among all ages) and 24 percent of employers
do not demand any low-wage applicants.
These figures show that many firms do not hire 16-17 year olds. On the
other hand, about 20 percent of sample firms had recently hired 16-17 year
olds and nearly half had hired 18-24 year olds. The composition of the
sample confirms that the treatments did cover many firms that normally hire
young workers. Thus, the lack of response by firms to vouchers or TJTC
subsidies cannot be attributed entirely to the employment patterns of the
firms exposed to the subsidies.
98
IIIIIIIIi1
I1
IIIIII

-84-Table 5-3
Background Data from the Baseline Survey of Employers*
VoucherExperimentalGroup I
Voucher FitTJTCExperimentalGroup II
ControlGroup
Size of Sample 73 73 70
Mean No. ofFull-Time Workers 51.7 60.0 53.8
Mean Ho. ofPart-Time Workers 5.3 28.0 8.2
Mean Amount of Salaries ($) $287,485 $749,237 $335,000
Mean Gross Sales ($) $1,457,452 $2,267,524 $1,555,917
Percent Rot Employing
Total
216
55.3
14.3
$463,631
$1,767,331
16-17 year olds 69.5 78.9 70.4 72.9
Percent Employing atLeast One 16-17year old 30.5 21.1 29.6' 27.0
Percent Not Employing18-24 year olds 23.3 24.1 31.6 26.3
Percent Employing at LeastOne 18-24 year old 76.7 75.9 68.4 73.6
Percent Not Hiring Any new16-17 year old 79.2 82.4 78.4 80.0
Percent Hiring at LeastOne 16-17 year old 20.8 17.6 21.6 20.0
Percent Not Hiring Any Uew18-24 year old 63.0 43.4 44.0 50.1
Percent Hiring at LeastOne 25+ year old 44.3 55.1 51.9 50.4
Percent with VacanciesCurrent Quarter 30.0 36.0 33.0 33.0
Average. No. of Applicationsper Entry Level Position 8.7_ .5 11.2 11.2
Average No. of VacanciesRequiring Little Experience 2.1 7.2 2.9 4.1
Average No of Entry LevelWorkers Needed Now 1.8 1.8 1.9 1.8
Hours per Week 16-17 year olds 9.9 7.6 7.4 8.2
Hours per Week 18-24 year olds 30.1 27.7 26.7 28.1
Hours per Week 25 and over 38.0 36.2 99 37.6 37.3
* Information provided on last three calendar quarter's from time of interview.

-85-
To administer the voucher, a verification system was needed. Verifi-
cation of hours worked by youth employed in voucher firms was done through
tine sheets provided by YES, as well as random unexpected visits by the
job developer. Employers provided work schedules a week in advance to
allow time for verification. Voucher payments were made weekly on the
Friday following the end of the employed youth's working week. Checks were
personally delivered by the job developer. The personal approach to voucher
processing and administration may not have been possible in the event of a
higher takeup rate. Our information from YES on voucher use comes from the
verification process.
5.2.2 The Job Search Workshop
Since the voucher program was linked to the Workshop, this section
will discuss its operation. There was no control group for evaluating
Workshop effectiveness since this had already been studied in the earlier
evaluation. Hence this section presents a process analysis of the Wilkes-
Barre Workshop.
5.2.2.1 Recruitment and Enrollment
During the first 3 mon*hs of operation, the rate of enrollment into
the program was below planned levels. The 15-month plan called for 500
youth to participate in JSA, or an average of 33 youth enrollees per month.
Table 5-4 presents the monthly enrollment rates in Wilkes-Barre. After
four months of operation only 76 youth %ad attended the program. However,
beginning January 15, 1981, a new project manager at YES made significant
progress in increasing outreach and participation. He was able to set
specific goals for the agency and mobilize the staff to comply with the
minimum standards established by DOL. Within 4 weeks of his arrival in
January 1981, a total of 76 youth were enrolled in the program, a 100 percent
increase from the previOus 3 months enrollment level.
100
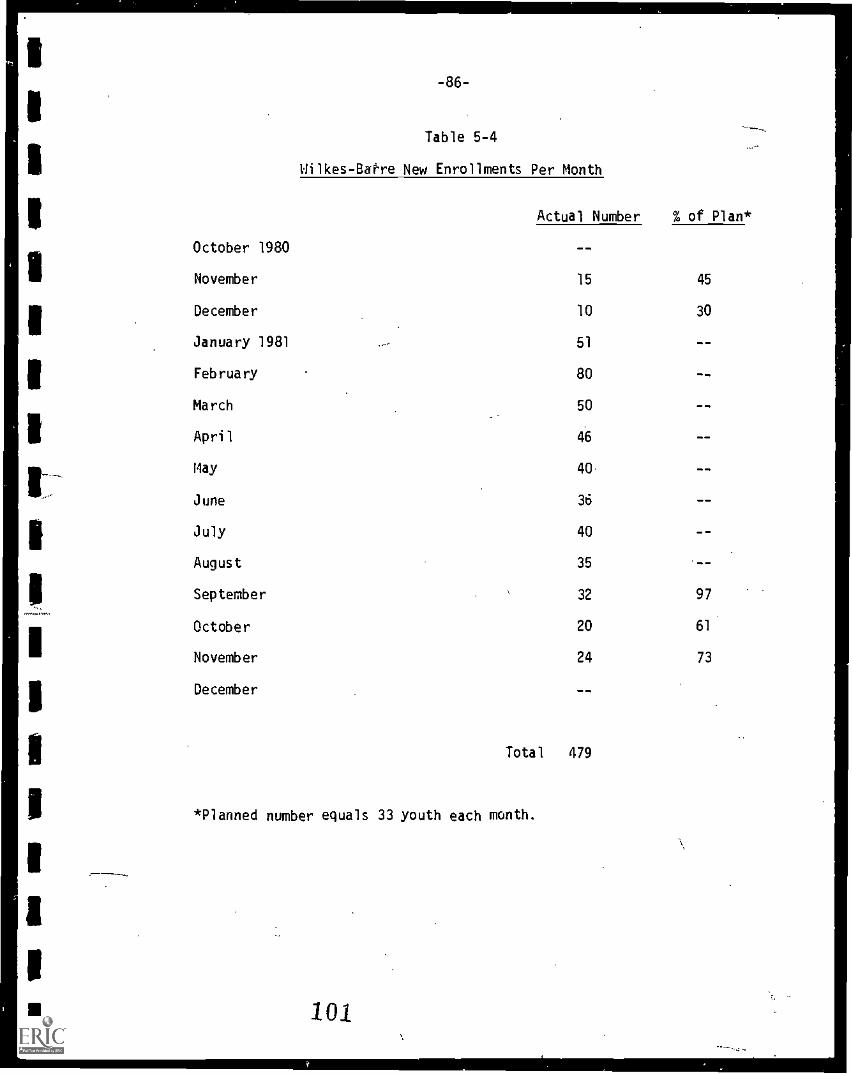
IIIiI1
1
Iit-
1
1
II1
IIIo
1
-86-
Table 5-4
Wilkes-Bafre New Enrollments Per Month
October 1980
Actual Number % of Plan*
--
November 15 45
December 10 30
January 1981 51
February 80 4. OD
March 50
April 46 =11.
May 40 40 40
June 36 .im. 4111.
July 40 --
August 35 --
September 32 97
October 20 61
November 24 73
December __
Total 479
*Planned number equals 33 youth each month.
101
,

-87-
Several changes took place within the agency. More efficient intake
procedures were developed to reduce the waiting period between application
and enrollment; these, in turn, helped to reduce attrition occurring at the
time of program application. All staff in the agency were trained to con-
duct intake interviews as a way to speed up applications whenever counsel-
ors were involved in other programmatic activities. In an effor.t to reduce
time spent answering unnecessary questions, program operators sent letters
to parents of applicants explaining the program and requesting supporting
documents to establish income eligibility. A worker from the Office of
Employment Security (OES) was subcontracted on a part-time basis to certify
applicants and to refer youth from OES to YES. Having a certifying worker on
the premises helped reduce backlogs of applicants. As a result of the
administrative changes, the average waiting period between application and
certification declined from 18 to 5 days.
One limitation that the Workshop program faced was the high unemployment
rate for adults and youth in Wilkes-Barre. The overall unemployment rate
in December 1981 was 11.7 percent (seasonally adjusted), well above the
8.5 rate Pennsylvania and the 8.8 rate for the country as a whole. Job
creation and development in a depressed economy has been a challenge to a
youth employment agency like YES. Youth awareness of the difficulties
encountered in finding jobs may result initially in increasing program
enrollment levels. On the other hand, it may also discourage youth from
participation in program activities that do not guarantee a "real" job at
the end of the training period.
While some youth who might have benefited opted out of the program,
others were placed into it who had special problems. Although the program
had not been designed to serve youth with special needs, close to 20% of
788-
the population served by YES was referred by agencies that serve special
groups. (Law enforcement, drugs and alcohol, and handicapped). This
switch in the composition of target groups may have occurred in response
to pressure placed by the funding agency regarding enrollment levels.
There was general agreement among counselors. that the program was
not geared to handle clients with serious behavioral and emotional programs.
Mentally retarded clients were especially difficult. For those clients
with motivational and attitudinal problems the staff would explore ways to
make the workshops more interesting, experimented with different ways to
schedule activities, and took extra time to call the clients at home. Those
who were deficient in a job-related skill were referred to CETA. Young
mothers who needed child care were referred to an agency serving primarily
unwed mothers; this agency would in turn arrange for day care services. The
respondents felt that the drug and alcohol abusers did not pose any sig-
nificant problems since the Catholic SoCial Services' drug and alcohol
program, and the prison release program referred only those people who
they considered to be "good risks". The problem with t his group was that
employers were reluctant to hire them. Youth in this category had to
overcome an additional employment barrier. One of the ex-offenders was
placed only because he had a previous positive work record.
5.2.2.2 Structure of the Workshop Program
Except for the placement workshops, activities were unstructured and
varied according to the needs of youth. On the average, youths spent 8 to
8.5 hours in the program divided as follows: 6.5 in individual counseling
sessions, and the remaining hour and a half in placement workshops. Youth
were required to attend four placement workshops. Attendance could be
waived if a proficiency test was successfully completed. However, 62% of
103

-89-
eligible youth attended at least one workshop and 35% of all eligible youth
completed all four sessions. Time spent in the program was recorded on an
exit form, part of the Individual Participant Profile (IPP). In general,
time spent in the program was limited. Although service hours were low,
they were in line with other pre-employment/placement programs for youth
(see P/PV's evaluation of (NY and 70001 Ltd)!
Low attendance at placement workshops, even in periods of high
enrollment, was a concern among program staff, as well as the research
and funding agencies. One difficulty may be that the Workshop program
competed with CETA for youth. CETA hasan advantage in that it pays the
minimum wage for the time spent in the program. YES program operators
recognized the pay difference as a barrier to attracting youth to Workshop
program activities. Philosophical principles that have prevailed since the
agency's origin kept program administrators from moving in the direction if
cash payments for program attendance. interventions to improve the content
of the Workshop activities were considered as a feasible means of attract-
ing more participants and increasing the amount of time that they spend in
the program. The inclusion of audio-visual devices, as well as experiments
with motivational techniques and different time schedules were tested by
the staff in the last two quarters of program operation. However, the
amount of time that youth spent in the program remained limited.
How did the participants assess the program? We looked at this
question by examining responses from the Program Completion Survey. Table 5.5
presents the most attended services, as well as the program components most
helpful to youth participants.
Personal counseling and job counseling were the most frequently men-
tioned and most helpful services. This finding is consistent with the
conclusions presented in the previousiection, indicating that youth spent
2 public/Private Ventures, Finallleport, "The .Impact of Pre-Employment Programs
on Disadvantaged Youth", 1982. . 104

-90-
most of their program time in counseling activities. Contacts and
interviews with potential employers were somewhat less attended and help-
ful in the eyes of youth. Resume writing and mock interviews followed in
the list of priorities. Group review and discussion, together with
letter writing participants considered less popular and less helpful.
Youth were asked open-ended questions about what they liked and
disliked most about the program. The majority of youth liked some program
component and a few list personal reasons that make it attractive. Among
the most disliked aspects of the program were such disciplinary aspects as
the requirement to contact a minimum number, of employers and to place cold
calls to potential employers. Forty-seven percent of respondents to this
question (n = 449) found the program very helpful, another 40% claim that
it helped them a little, and the other 6 percent claimed it was of no help.
5.2.2.3 Work Experiences Among Workshop Participants
The Workshop treatment had no control group in Wilkes-Barre so that we
cannot identify the contribution of the treatment to employment behavior.
However, the youth in the Workshop were surveyed three times. Since
many of them did find work, this section reports on their employment record.
It should be noted that while the Cambridge Job Factory program
was part of the local CETA Prime Sponsor delivery system, the Wilkes-Barre
program was community based. Although it received YEDPA funds, it com-
peted for low income youth with the local CETA agency. As a consequence,
the Wilkes-Barre program accepted some youth from families with income slightly
above the CETA/YETP eligibility guidelines. To adjust for this feature of
the program, data are presented separately for CETA eligible and above-Aza
CETA-limit youth.
105

-91-
Table 5.6
Rank Order of Wilkes-Barre Workshop Program Components
(by number of youth who check each category)
Program Service Attended Most
Component Most Frequently Helpful
Personal (Job) Counseling (1) (1)
Personal Counseling (2) (2)
Contacting Potential Employers (3) (3)
Interviews with Potential Employers (4) (4)
Resume Writing (5) (5)
Mock Interviews (6) (6)
Group Review of Past Work Experience (7) (7)
Letter Writing (8) (9)
Group Discussion of World of Work (9) -(8)
106

1
1
1
-92-
Data on the proportions who had had jobs between follow-up appear
in Table 5.6, while characteristics of the jobs found are shown in
Table 5.7. Table 5-b presents information on the intensity of search
among Wilkes-Barre youth.
5.2.2.4 Administration of the Workshop
The Workshop voucher program experienced changes in administrative
leadership, as well as considerable personnel turnover. The acting direct-
or resigned toward the-end of the first contract year. Thus, the start-
up of the workshop program lacked leadership. After the new director
was hired in January, 1981, DOL required a minimum number of enrollments per
month as a condition for continuation of the grant contract. The new director
was able to establish a professional relationship with the Board of Directors
of YES and his credibility was built upon the progress of the program. He
was able to pull the staff together and to promote the idea of "working
for survival". In a sense, staff members were initially motivated by the threat
of losing their jobs. Once the results of the new approach began to show in
terms of enrollment and job placement levels, morale among the staff
improved considerably. However, during the last quarter of program opera-
tion the enthusiasm among the staff began to wear off for obvious reasons.
YES would close down as a result of the termination of the DOL contract.
Thus, finding a job became a first priority among counselors and administrators.
The original staff consisted of the assistant director, job developer,
information manager, 2 counselors and a secretary. During the course of the
year, the assistant director left the agency, a new director was hired, one
of the counselors became information manager, a new counselor was hired,
and the secretary became executive assistant to the director. As a result,
the average time that counselors stayed in the same job was four months.
107

-93-
Table 5.6
Percent of Youth Who Held Jobsbetween Followups in Wilkes Sarre
Group la Group lib
Have Had Job at 1st Followup 56.3 71.2(12 weeks after program exit) (174) (236)
Have Had Job at 2nd Followup 66.3 77.4
(24 weeks after program exit) (95) (159)
Have Had Job at 3rd Followup 71.2 83.3(36 weeks after program exit) (73) (66)
aGroup I consists of youth whose family income met CETA/YETP eligibilityguidelines.
bGroup II consists of youth whose family income exceeded the CETA/YETPeligibility guidelines.
108

1111 MIMI MINI MN_ 111 SIMI VIII MI MO MS IIIII MO
Table 5.7
Characteristics of Post-Enrollment Job at Each
Consecutive Follow-up in Wilkes Barre
ProgramCompletion Survey 1st Follow-up 2nd Follow-up 3rd Follow-up
Group I Group II Group I Group II Group I Group II Group I Group II
Mean Hourly3.28 3.34 3.47 3.37 3.60 3.44 3.63 3.70
Wage (86) (134) (45) (78) (29) (49) (15) (16)
Mean Weekly31.3 28.6 31.8 32.4 31.4 34.0 31.4 38.0
Hours (81) (134) (48) (78) (29) (50) (15) (17)
Mean Weekly105.2 96.2 116.8 110.5 113.3 118.7 116.6 141.6-
Earnings (81) (132) (45) (78) (29) (p) (15) (16)
Percent full-71.6 64.5 72.9 74.4 75.9 80;0 WI 100.0
time* (81) (134) (48) (78) (29) (58y ;15) 07)
Full-time defined as 30 :hours per week or more.
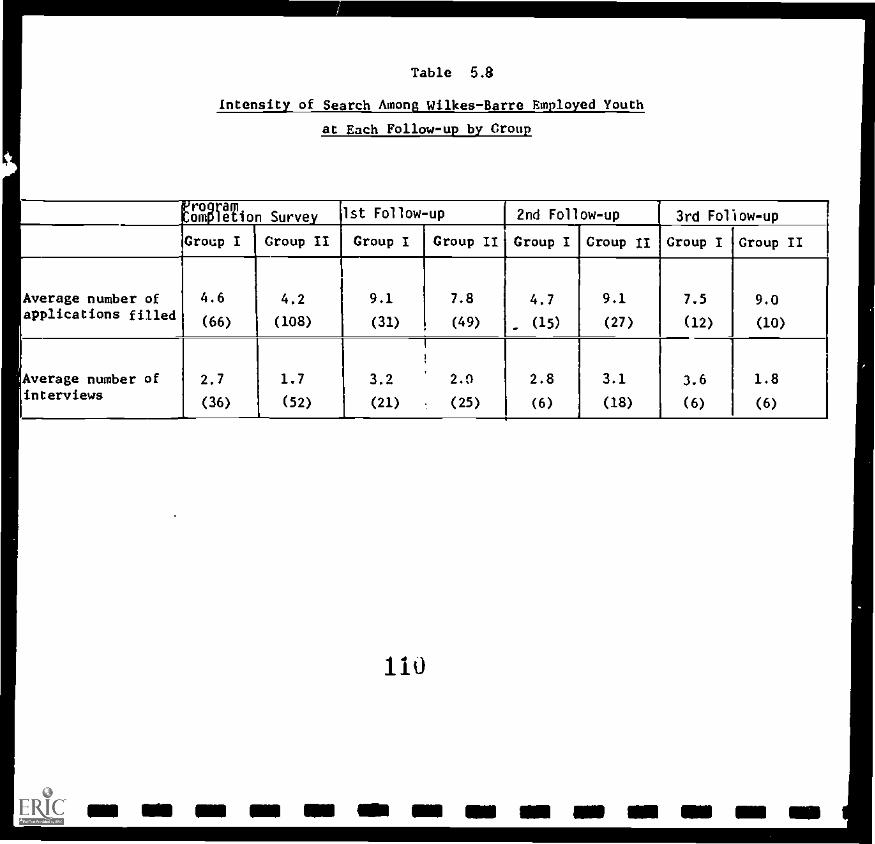
Table 5.8
intensity of Search Among Wilkes-Barre Employed Youth
at Each Follow-up by Croup
rEMOV:Tion Surve 1st Follow-up 2nd Follow-up 1 3rd Follow-up
Group I Group II Group I Group II Group I Croup II Group I Group II
Average number ofapplications filled
4.6
(66)
4.2
(108)
9.1
(31)
7.8
(49)
4.7
(15)
9.1
(27)
7.5
(12)
9.0
(10)
Average number ofinterviews
2.7
(36)
1.7
(52)
3.2
(21)
2.0
(25)
2.8
(6)
3.1
(18)
_ .
3.6
(6)
1.8
(6)
110
IIIIII NO MI 111 I11 MI MI IN me N. mg gm gni

-9b-
This back and forth switch of personnel may have created instability and
confusion among the staff as well as among the youth served.
YES has been out of operation since December 31, 1981, after the
contract with DOL came to an end. Since coming to office, the YES director
sought different funding grants to keep the agency running. However, the
political timing was against his success. The Office of Youth Programs within DOL
went out of business at the same time as YES, and demonstration grants for
youth employment agencies became more scarce and competitive.
5.3 Program Costs
.Program costs for Wilkes-Barre appear in Table 5-9. Given the 479
youths who participated in the Workshop program, cost per Workshop parti-
cipant was $374. The cost per youth finding a job as of the first follow-
up was $577. Since there was no control group of youths in Wilkes-Barre,
we have no estimte of cost per net job found.
In view of the absence of any significant impact of the vouchers on
employer behavior, it would not be meaningful to present any cost effective-
ness measure for the employer vouchers.
111

4
-97-
Table 5-9
Program Expenditures
Workshop Expenses
Personnel: Counselors and Fringe Benefits $132,573
Rent 7,259
Telephone 2,749
Travel 8,584
Printing/Xerox/Advertising 2,016
Video 2,569
Supplies 2,591
Furniture/Equipment 6,130
General & Administrative 4,033
OES Subcontract 10,727
Total Workshop Expenses 179,231
Voucher Bonuses 1,813
Total Wilkes-Barre Costs $181,044
112
4

Chapter 6
Conclusions and Policy Implications
The chronic nature of the youth and structural unemployment problems
has stimulated policymakers to search for approaches that go beyond the
remedial education and training strategies. Because even those who com-
pleted education or training could not find jobs or increase their wage
rates, Federal policy began to utilize demand-side as well as supply-side
interventions. The idea of selective demand policy was to shift the struc-
ture of demand for labor toward groups of workers who normally experience
high unemployment. Since the added demand would be channelled toward
workers already in excess supply, the selective demand approach could achieve
reductions in unemployment with less inflationary pressure than could general
demand stimulus.
The Federal government has used direct job creation as its primary
method for implementing the selective demand policy. Under public service
employment, work experience, and summer employment programs, the Federal
government has paid the full cost of hiring structurally unemployed workers
for jobs in the public or nonprofit sectors of the economy.
Employer wage subsidies have been adopted as an additional tool for
helping the structurally unemployed, largely because of two apparent advantages
over public employment programs. Wage subsidies seem to have a cost advan-
tage over public employment since they allow the government to pay less than
the full salary and overhead required in public jobs programs. A second
advantage is the higher rate of transition to unsubsidized employment expected
from having private firms instead of government agencies hire disadvantaged
workers.
113

-99-
The key criticism of the wage subsidy approach is that firms can
receive subsidies for hiring workers they would have hired in the absence
of the program. A second criticism is that firms pay little attention to
the program since it operates outside their normal recruitment policies.
Ignoring the program will be especially common whin only a small segment of
the work force qualifies for the subsidies.
Given the difficulty of using small subsidy programs to alter the
behavior of firms, some have suggested channeling the subsidy directly to
disadvantaged workers. Although most proposals for wage subsidies to workers
stress the income supplement function, worker subsidies can theoretically
generate increases in employment.
In spite of actual experience with employer wage subsidies (the TJTC
and WIN tax credits) and several studies of worker wage subsidies, there is
little solid evidence concerning the net impact on employment of either
kind of subsidy. This evaluation provides the first evidence on the net
effects of employer and worker subsidies that is based on actual responses
by workers and firms. Although the experiments were small and each operated
only in one site, the results are interesting and highly relevant to policy,
especially in light of the decision by the Congress to continue the TJTC
beyond 1981.
This chapter summarizes the findings from the experiments and discusses
their implications for policy.
6.1 The Findings
The primary purposes of the experiments were to test two subsidy pro-
grams and two behavioral responses. In Cambridge, the question was whether
subsidizing the wages received by young workers stimulated them to take jobs.
114

-100-
In Wilkes-Barre, the question was whether subsidizing employers to hire
low income youth increased their tendency to hire such workers. The basic
results were that:
--subsidizing young workers raised their employment; but
--subsidizing employers had no impact on youth employment.
The offer of subsidies clearly had no effect on employer hiring be-
havior. With virtually no employers taking either the special vouchers or
the TJTC, the lack of response was unambiguous. While the weak labor
market in the experimental site may have contributed to the absence of any
voucher effect, the reasonably good employment experience of youth going
through the job placement program casts doubt on the importance of this
explanation. The youth in the Wilkes-Barre experiment had employment levels
as high as youth in Cambridge, where a positive experimental effect did occur.
In one sense, the employer subsidy program in Wilkes-Barre had a
potential advantage over a national program. The TJTC and WIN tax credits
have operated largely as employer-initiated programs. So, for employers
to respond to the program by hiring more disadvantaged workers, they may
have to make special efforts to recruit and screen eligible workers. In
Wilkes-Barre, the YES organization not only promoted the program with each
employer in the treatment group, but also stood ready to provide eligible
applicants from its pool of participants.
The failure of subsidies to exert an impact on employers is consistent
with the low extent of employer participation in national tax credit pro-
grams. Although no important study has attempted to estimate the effects
of the TJTC and WIN tax credits on employer hiring of disadvantaged workers,
it is clear that many firms who employ eligible workers and qualify for tax
115

credits do not claim the subsidies. Tha only group of workers for whom
claims are a high percentage of hires is youth from cooperative education
programs. This group may elicit more interest from firms because they
are not labeled as disadvantaged. Perhaps more important, the administra-
tion of TJTC directly by cooperative education programs means that employ-
ers who normally use coop youth do not have to alter their recruitment
policies to reap the advantages of the credit.
Neither the TJTC's apparent success with coop students nor its weak
performance with other groups provides any evidence about the number of
workers firms hired in response to the TJTC. While the net impact of TJTC
remains an °On issue, the results from tne Wilkes-Barre experiment suggests
a highly negative conclusion.
In contrast, we observed a significant, positive effect from making
subsidies available directly to young workers. Not only did the experimental
group eligible only for the vouchers exhibit higher employment rates than
the control group, but the vast share of voucher-only participants who did
find jobs actually claimed voucher payments. The negative aspect of the
results of the voucher treatment comes from the experience of youth who had
access to the combination of the Job Factory and the voucher. These youth
gained an initial employment advantage over the other two groups, but their
advantage eroded to the point where their employc.nt levels were no higher
than those of the control group. It is not clear why the voucher's impact
appeared to persist for voucher-only youth, but not for youth exposed to a
combined treatment.
The results of the Cambridge experiment concerning the effect of the
Job Factory also were consistent with findings from other experiments. Par-
ticipation in the Job Factory did raise employment levels initially, but
the effects were apparently transitory.
116

-102-
6.2 Implications for Policy
Given the small, single site nature of the experiments, we must be
cautious in drawing implications and making generalizations. The fact
that the demonstrations utilized an experimental design does add sow
weight to the importance of the findings. Nevertheless, the results can
have relevance to national policy only in the context of other studies of
program effectiveness and the behavioral responses by workers and firms.
The experiment with vouchers and job search assistance for youth
sustains one policy and analytical implication and provides initial evidence
concerning another. The Job Factory's initial, but transitory effect indi-
cates that information gaps and low job search intensity affects the timing
but not the long-term success of youth seeking jobs. To the extent that
programs may be able to follow up on the initial success of the Job Factory
with other kinds of interventions, job search programs could play a role in
lowering unemployment rates of disadvantaged youth. However, taken by itself,
the job factory intervention's positive effect wears off over a 3 to 5 month
period.
Because this experiment is the first one involving voucher payments to
workers, the positive effects we observed !lore value primarily in suggesting
future research, demonstration, and policy work. The findings do indicate
that the availability of voucher payments encouraged youth to take jobs at
lower wages than they would have without the subsidies. Moreover, this
effect on reservation wages contributed to employment gains for those youth
exposed to the voucher payments. To the extent that these results are re-
presentative of the youth labor market, many youth do not find jobs because
they are unwilling to accept low wage employment.
11?

-103-
The nonresponse by employers to the offer of subsidies is consistent
with a few interpretations. One is that firms are not particularly sensi-
tive to small and temporary changes in wage rates. Such a conclusion is
in conflict with a variety of empirical studies indicating that firms do
adjust their hiring in response to relative and absolute wages. A second,
more restricted interpretation of the nonresponse by employers is that
the transaction cost, risk, and labeling aspects of subsidies for hiring
disadvantaged workers outweigh the monetary value of the subsidies. Support
for this conclusion comes from a survey of firms concerning targeted employ-
ment subsidies. David O'Neill found that firms who showed little or no
interest in subsidies for hiring a disadvantaged class of workers said they
would alter their hiring behavior in response to a subsidy for low wage
workers. The Wilkes-Barre results lend support for the idea that highly
targeted subsidies are unlikely to yield gains for disadvantaged workers.
11

Appendix A
Demographic Characteristics of YouthParticipants in Cambridge and Wilkes-Barre
Demographic characteristics of the sample are summarized in Table A-1.
The total sample upon which these analyses are based is 901 youth.
Although there is only about a six-month difference in average age
between the youth in Cambridge and Wilkes-Barre sites, there is a larger
percentage of youth 18-24 years group in Cambridge than in Wilkes-Barre,
where the largest percentage of youth are 16-17 years of age. Moreover, a
much larger percentage of the Wilkes-Barre youth are in-school; less than
1% of the youth were in-school on average, and a higher percentage (over 50%1
were dropouts and the remainder were high school graduates. Males are pre-
dominant in both the Wilkes-Barre and the Cambridge samples. Differences
in racial characteristics between sites are the most dramatic. Nearly all
the participants in Wilkes-Barre are white. This reflects the fact that
Wilkes-Barre is situated in the predominantly white community of Luzerne County.
Cambridge, on the other hand, is more metropolitan and is populated by a
larger number of people from diverse racial and ethnic background. A sig-
nificantly higher percentage of enrollees, therefore, are black and hispanic.
In terms of economic status, youth assigned to all cycles in Cambridge
and Group I in Wilkes-Barre meet the CETA/YETP eligibility guidelines. Youth
assigned to Group II in Wilkes-Barre come from families with slightly higher
incomes. Note that a higher percentage of the youth in Wilkes-Barre Group 1
have had work experience or have been dependent on public assistance, compared
to youth assigned to Group II in Wilkes-Barre.
119
-105-
Another difference between the two sites is the status of youth
with respect to the courts. A higher percentage of youth in Wilkes-Barre
Group I are ex-offenders than Group II,and Cambridge youth.
Most youth in both communities have had some previous work experience
and at least one third have been enrolled in CETA programs at some time
prior to enrollment. The percentages are slightly higher, however, in
Cambridge than in Wilkes-Barre. Differences may be due in part to the differ-
ences in organizational context between the two programs. Whereas the
Cambridge program is part of the local CETA Prime Sponsor delivery system,
the Wilkes-Barre program is community-based, and although it received YEDPA
funds it must compete for low income youth with the local CETA agency.
In general, characteristics between the three groups in Cambridge- -
experiment, voucher-only, and control--do not markedly differ. The one
exception to be noted is the difference in economic status. The average
income level appears to be higher in both the voucher and control groups, as
compared with the experiment group. Approximately 56.4 of the youth in the
experimental group come from families at 70% or less than the lower living
standard, compared with only 1% and 8% in this category of the voucher and
control groups respectively. Also, a slightly higher percentage of youth
in the Cambridge experiment group are ex-offenders.
22 0

-106-
Table A-1
Sample Description of Democra hic CharartPrictirc
Experiment
Cambridge
Control
Wilkes-Barre
Voucher Grotipl Group 2_
N of Participants 186 130 108 219 260
Age: 1 Years 18.1 18.1 18.2 17.0 17.0
Percents: 16-17 41.0 41.7 35.2 70.6 71.018-24 59.2 58.3 64.8 29.4 29.0
Sex: Male 61.8 58.5 53.3 60.3 51.7Female 38.2 41.5 46.7 39.3 47.9
Race: White 47.3 48.0 53.8 92.2 98.1Black 36.0 37.2 35.8 6.8 1.2Hispanic 10.7 11.6 6.6 1.0 --Other 6.0 3.2 3.8 -- 0.7
Family Status:Family Head 6.5 5.5 6.8 7.3 3.5Family Member 69.7 62.5 62.1 73.9 87.5Independent Member 23.9 32.0 31.1 18.8 8.9
Educational Status:*H.S. Student -- _ 1.9 48.6 58.3H.S. Leaver 48.6 52.7 51.0 30.1 12.0H.S. Graduate 36.2 28.7 29.8 14.8 19.7
Ex-Offender Status,Prison Records 17.3 12.6 14.0 25.1 7.0
Public Assistance:AFDC, SS, Other 34.4 37.6 44.7 53.4 3.4
Previous CETA Experience:Yes 39.5 42.4 41.2 38.7 11.5
Previous Work Experience:Yes 72.6 89.2 93.5 70.3 56.0
Economic Status*70% Lower Living Standard 56.4 18.9 8.7 100.0 1.2
71-85% Lower Living Standard 38.5 81.1 87.0 -- 18.586% - More 5.1 _... 4.3 -- 80.3
Mean Program Hours 104 _... 7.6 8.4
Mean Program Wages ($) 367 .4111,mb
*Percentages do not add to 100. Missing categories excluded.
121

-33A-
Table 3-3
Cambridge Job Factory Participation by Cycle
anurs
t Cycle I Cycle II Cycle III Cycle IV Cycle V Cycle VI Total
100 125 87 112 105 128 104
tuber 21 25 36 21 25 20 148
122
IIIIIIII1
IIIIIIIIII