
DOCUMENT RESUME - ERICED 03.3 750 AUTHOR TITLE INSTITUTION Eepert Nc Pub Date Note Available from...
97
ED 03.3 750 AUTHOR TITLE INSTITUTION Eepert Nc Pub Date Note Available from EDES Price Descriptors Identifiers Abstract DOCUMENT RESUME PS 002 430 Kraft, Ivcr; And Others Prelude to School: An Evaluaticn of an Inner-City Preschccl Program. Children's Bureau (DREW), Washington, D.C. Sccial and Rehabilitaticn Service. CB-3-1968 68 96p. Superintendent cf Dccuments, U.S. Government Printing Cffice, Washington, D.C. 20402 ($1.00) EEES price MF-$0.50 BC Not Available frcm EDRS. Culturally Disadvantaged, Family Characteristics, Intelligence Quotient, Language Skills, *Nursery Schocls, *Parent Participation, Preschool Children, *Preschool Pr- )grams, *Program Descriptions, *Program Evaluation, Socioeconomic Status Hcward University Preschocl Ercject, Test of Psycholinguistic Abilities, IIPA, Merrill Palmer Scale Of Mental Tests, Peabcdy Picture Vocabulary Test, PP1) T0 Stanford Binet The purpcse cf Howard University's pre-"war cn poverty" experiment, operating a 2 year, full day nursery schcol for disadvantaged 3-year-olds, was to deermine whether and to what extent a standard nursery schcol program in which parents are invclved could help children in their later schooling. This booklet gives an overall view of the prcject, explaining its experimental-ccntrcl group design, the recruiting and screening of subjects fcr both groups and the detailed characteristics of children selected and their families. The school descripticn includes perscnnel, physical setting, curriculum, and health maintenance measures. The adult activities program is also discussed. The results cf the pre-pcsttesting program (Stanford-Binet, Peabody Picture Vocabulary Test, Merrill-Palmer Scale, and the Illinois Test of Psychclinguistic Abilities) are given. The lcwer a child's initial IQ was, the more likely he was tc made the most gains during the second year of the progra make large gains after nursery school experience indicating that the diversity of intellectual capacity was not as great as the original Ics showed. The children cf low socioeconcmic status whc sccred lcw on the initial I test r.
Transcript of DOCUMENT RESUME - ERICED 03.3 750 AUTHOR TITLE INSTITUTION Eepert Nc Pub Date Note Available from...

ED 03.3 750
AUTHORTITLE
INSTITUTION
Eepert NcPub DateNoteAvailable from
EDES Price
Descriptors
Identifiers
Abstract
DOCUMENT RESUME
PS 002 430
Kraft, Ivcr; And OthersPrelude to School: An Evaluaticn of anInner-City Preschccl Program.Children's Bureau (DREW), Washington, D.C.Sccial and Rehabilitaticn Service.CB-3-19686896p.Superintendent cf Dccuments, U.S.Government Printing Cffice, Washington,D.C. 20402 ($1.00)
EEES price MF-$0.50 BC Not Available frcmEDRS.Culturally Disadvantaged, FamilyCharacteristics, Intelligence Quotient,Language Skills, *Nursery Schocls, *ParentParticipation, Preschool Children,*Preschool Pr- )grams, *ProgramDescriptions, *Program Evaluation,Socioeconomic StatusHcward University Preschocl Ercject,
Test of PsycholinguisticAbilities, IIPA, Merrill Palmer Scale OfMental Tests, Peabcdy Picture VocabularyTest, PP1) T0 Stanford Binet
The purpcse cf Howard University'spre-"war cn poverty" experiment, operating a 2 year, fullday nursery schcol for disadvantaged 3-year-olds, was todeermine whether and to what extent a standard nurseryschcol program in which parents are invclved could helpchildren in their later schooling. This booklet gives anoverall view of the prcject, explaining itsexperimental-ccntrcl group design, the recruiting andscreening of subjects fcr both groups and the detailedcharacteristics of children selected and their families.The school descripticn includes perscnnel, physicalsetting, curriculum, and health maintenance measures. Theadult activities program is also discussed. The results cfthe pre-pcsttesting program (Stanford-Binet, PeabodyPicture Vocabulary Test, Merrill-Palmer Scale, and theIllinois Test of Psychclinguistic Abilities) are given. Thelcwer a child's initial IQ was, the more likely he was tc
made the most gains during the second year of the progra
make large gains after nursery school experience indicatingthat the diversity of intellectual capacity was not asgreat as the original Ics showed. The children cf lowsocioeconcmic status whc sccred lcw on the initial I test
r.
ceD
CID
CHILDREN'S BUREAU RESEARCH REPORTSt DEPARTMENT OF HEALTH, EDUCATION & Wenn
C.) OFFICE OF EDUCATION
tire\reN
LU
THIS DOCUMENT HAS BEEN REPRODUCED EXACTLY AS RECEIVED FROM THE
PERSON OR ORGANIZATION ORIGINATING IL POINTS Of VIEW OR OPINIONS
STATED DO NOT NECESSARILY REPRESENT OFFICIAL OFFICE OF EDUCATION
MOD*. OR POLICY.
number 3
PRELUDE TO SCHOOL
An Evaluation of an Inner-City
Preschool Program
IVOR KRAFT
JEAN FUSCHILLO
ELIZABETH HERZOG
U.S. DEPARTMENT OF HEALTH, EDUCAT!ON, AND WELFARESOCIAL and REHABILITATION SERVICE Children's Thlreau 1968
For sale, Supt. of Documents,U.S. Government Printing Office,Washington, D.C. 20402 - $1.00 '1.

DISCRIMINATION PROHIBITEDTitle VI of the Civil Rights Act of 1964 states: "Noperson in the United States shall, on the ground of race, color, or national origin, be excludedfrom participation in, be denied the benefits of, or be subjected to discrimination under anyprogram or activity receiving Federal financial assistance." Therefore, the programs of the Chil-
dren's Bureau like every program or activity receiving financial assistance from the Departmentof Health, Education, and Welfare, must be operated in compliance with this law.
IN THIS SERIES of publications, theDivision of Research of the Children's Bu-reau reports the findings of studies of childhealth and welfare services and of mattersrelevant to providing such services. Most ofthe studies in the series were conducted aspart of the Bureau's programs of researchand demonstration grants. Some, however,represent work carried on by the Bureau'sown staff, and some the work of investiga-tors not associated with the Bureau. What-ever the source, the primary purpose of theseries is to promote the utilization of re-search findings by those who make policyand those who administer programs in thefields of child health and welfare.
To report the findings of research andfactfinding efforts is not a new activity ofthe Children's Bureau. Indeed, for manyyears the Bureau's chief means of carryingout its mandate to promote the welfare ofAmerican children was to report the find-ings of studies carried on under its auspices.Through these publications many conditionsadversely affecting child life in the UnitedStates were revealed, and from them manyremedial actions flowed.
The very success of these publicationsresulted in a relative diminution in theirvolume. For among the changes in Americanlife that the Bureau's investigations helpedto produce was the passage of the SocialSecurity Act, under which, among other
HELEN L. WITMEREditor
CHARLES P. GERSHENSONDirector, Division of Research
matters, Federal participation in the supportand fostering of public child health and wel-fare programs was authorized. Several ofthese grantin-aid programs were entrustedto the Children's Bureau to administer, andrecent amendments to the act have increasedthe Bureau's responsibilities in this respect.The result has been that for many years theBureau's efforts have been directed largelyto the setting and maintaining of standardsfor the operation of these service programsand to the compilation of the relevant statis-tics. Reports of research and reviews of re-search findings have been published fromtime to time, of course, but the main thrusthas been in other directions.
Recently, however, the Bureau's ca-pacity to produce studies has been greatlyaugmented by the establishment of programsof research and demonstration grants inchild health and welfare. Supported largelyby these funds, many investigations are nowunderway or have been completed. What hasbeen lacking so far is an effective means ofbringing the findings of these and other im-portant studies to the attention of adminis-trators and practitioners in a form in whichthey can be put to use. It is to this objectiveof research utilization that this new series ofChildren's Bureau publications is addressed.We hope that through these reports this ob-jective can be significantly forwarded.
Pti 7/1
JULE M. SUGARMANActing Chief, Children's BureauSOCIAL and REHABILITATION SERVICE
Contents
INTRODUCTION 1
I. HISTORICAL BACKGROUND 3
II. AN OVERALL VIEW OF THE PROJECT 8
III. RECRUITING THE NURSERY AND COMPARISON GROUPS 11
IV. CHILD AND FAMILY CHARACTERISTICS 17
V. THE NURSERY SCHOOL 25
VI. THE ADULT ACTIVITIES PROGRAM 36
VII. TEST FINDINGS AND ASSOCIATED FACTORS 46
VIII. SUMMARY
APPENDIX A. A FURTHER ANALYSIS OF IQ CHANGES 66
APPENDIX B. BRIEF SKETCHES OF FOUR FAMILIES 78
1
Howard University Preschool Project
Flemmie P. Kittrell, Director
NURSERY SCHOOL STAFF
Head TeacherPhyllis Tilley
teachersMarie JudsonNancy LoganJosephine Price
Adult Activities WorkerGladys Martin
Jewell TerrellRuby Joyner, Assistant
RESEARCH STAFF
CHILDREN'S BUREAU
Research DirectorElizabeth Herzog
Research Associates
Ivor KraftJean Fuschillo
HOWARD UNIVERSITY
Research Aides
Marion BassTheron BellWilliam Greenhill
Eileen TobanRichard Bloom
Norma Jean HendersonTressie MuldrowPatricia A. Thompson
INTRODUCTION
AMONG the various means used orproposed for combating poverty, one thatranks high in popular favor is compensatoryeducation for preschool children. Throughthis means it is hoped that some of the dis-advantages of poverty will be offset andthe children's achievement in school will bemarkedly improved. In consequenceso thetheory has itthe children will be able toqualify for good jobs when they are adults,and thus the poverty cycle will be broken.
Under the impetus of modern psy-chological research, this line of reasoningwas being pursued and a number of experi-mental programs were set up a few yearsbefore the official "war on poverty" began.Accordingly, reports of findings as to theeffectiveness of preschool programs are be-ginning to appear.
The present report is one such con-tribution. It tells of Howard University's ex-periment in providing a 2-year, full-daynursery school for disadvantaged 3 year oldswho lived in its neighborhood.* This pro-gram was 'administered by Dr. FlemmieKittrell, Professor and Head of the HomeEconomics Department, under whose direc-tion a well-equipped nursery school for re-search and student training had been con-ducted for over 20 years. The report pre-sented here is based on an evaluative studyconducted by members of the staff of theChildren's Bureau.
The chief purpose of the report is todescribe the accomplishments of the HowardUniversity Preschool Project with respect to
* The project was financed in part by the Children's Bu-reau's Child Welfare Research and Demonstration GrantsProgram.
improving intellectual functioning, and toshow with which sorts of children the proj-ect was most successful. As background forthis, the nursery school and the parent-activity program are briefly analyzed. De-scriptions of four children and their parentsare also presented.
Such a report, obviously, does notgive a full account of the accomplishmentsof the Howard University Preschool Project.It gives little information about the chil-dren's social and emotional development orabout changes that the program broughtabout in their lives at home. It does not(could not yet) tell what the effects of theprogram were on the children's later prog-ress in school. The latter information, how-ever, will be the subject of future reports,for the main test of preschool programs forchildren of the poor is whether they enablethe children to do better in "regular" schoolthan they would otherwise have done.
The report as here presented is asomewhat abbreviated version of the fullstudy that was prepared by the Children'sBureau. In publishing in this form, we aimto present the findings succinctly and in away that will be useful to the greatly in-creased number of people who will be en-gaged in planning and operating nurseryschools and day care centers for children ofthe poor. Research workers who want a moredetailed account of the findings can securecopies of the full report from the Children'sBureau.
THE EDITOR
1

1!
1 !
I, HISTORICAL BACKGROUND
TO SHOW HOW the Howard Univer-sity Preschool Project fits into the larger pic-ture of early childhood education for chil-dren of the poor, a brief historical survey iscalled for. Since we are not concerned withtracing remote origins, we shall merelysketch some of the high points in the latergrowth of this movement and then reviewbriefly the present situation and currentresearch findings.
Comenius' ideas
Belief in the crucial significance ofearly life experiences and of the potentialsof early schooling is very old.1 One outstand-ing example of early interest in the subjectis found in the work of the great Mora-vian educator and theologian, John AmosComenius (1592-1670). More than 300 yearsago he wrote a little book on the history ofearly childhood education that has become aclassic.2 In it he proposed that the first 6years of a child's life be spent in what hecalled a "mother school," his idea being thatthe child's first educator should be a sensitiveand informed mother. These early experi-ences were thought to lay a foundation forall that was to follow in later life. They were
1 See, for example, Robert R. Rusk, A History of InfantEducation, 2nd ed., University of London Press, 1951; andInternational Kindergarten Union, The Kindergarten: Re-ports of the Committee of Nineteen on the Theory and Prac-tice of the Kindergarten, Boston, Houghton-Mifflin, 1913.
2 John Comenius, School of Infancy, Boston, D. C. Heathand Co., 1893.
to include simple lessons, both informal andformal, in naming objects (such as stones,plants, and animals),,in becoming acquaintedwith the terms for the body's parts, in know-ing colors, the "geography" of the crib, thenursery room itself, and the immediatehouse and farm surroundings, and in recit-ing the Lord's Prayer.
The views of Friedrich Froebel
Early childhood education received agreat push forward when Friedrich Froebel(1782-1852) published his Education of Man,3which led to the fully developed idea of tilt:.kindergarten. Froebel's philosophy still com-mands respect among educators. He stressedspontaneous free play as the basis of learn-ing, the importance of self-activity andmotor expression, the primacy of social co-operation as the core of the curriculum, andthe need for special toys and equipment tostimulate learning through manipulation anddoing.
Froebel's idea caught on in Germanyand the United States. By the late 19th cen-tury there was a well-developed and almostcrusading group of kindergarten and nur-sery-school advocates. A training institutefor kindergarten teachers was opened inBoston in 1868. A few years later the first
3 Friedrich Froebel, The Education of Man (Translation ofDie Menschenerziehung, 1826, by W. N. Hailman), Interna-tional Education Series, New York, D. Appleton and Co.,1887.
3

tax-supported public kindergarten was es-tablished in St. Louis, Missouri.
The contribution of Muria Montessori
The present aim of overcoming "cul-tural deprivation" through early childhoodeducation was given prominence in the sys-tem developed by Maria Montessori (1870-1952) . Basing her ideas on the prior workof Pestalozzi, Froebel, and Seguin, Montes-sori held that special forms of early inter-vention could enable children from the slumsof Italian cities to do better in later schoolwork and, in general, to become betterhuman beings. She opened schools in low-income neighborhoods and evolved specialmethods and sets of equipment that stressedsensory training, manual skills, and an in-dividualized approach.
Montessori's work and ideas becamea movement that attracted dedicated follow-ers, but it also stirred up much criticism.4Actually, aside from its early days, it did notdevelop as an enrichment program for low-income or deprived children. Instead, it vr-zzadopted by small groups of middle-classeducators, who founded private Montessorischools in Western European countries.
In the decade between 1910 and 1920American educators investigated the Mon-tessori approach but it was not widely ac-cepted. Some educators regarded it as con-trived and artificial. Others saw it as phil-osophically alien to the pragmatic and pro-gressive spirit that was sweeping throughAmerican education under the influence ofJohn Dewey. In addition, American teachers,accustomed to a rather down-to-earth andunromantic attitude toward childhood, foundthe sentimental and almost rhapsodical ele-ments in Montessori's writings a bit hard totake. A later and perhaps more serious cri-
4 See William Heard Kilpatrick, The Montessori SystemExamined, Boston, Houghton-Mifflin, 1914 ; and WilliamBoyd, From Locke to Montessori, A Critical Account of theMontessori Point of View, London, C. G. Harrap and Co.,1914.
4
ticism of the Montessorians was that theyseemed reluctant to submit their premisesto experimental testing. Recently, however,there has been a revival of interest in theMontessori approach, and quite a few Mon-tessori-type schools have opened in theUnited States.°
Margaret McMillan and the "open-air"nursery
Another influential European educa-tor was the dedicated and enterprising Mar-garet McMillan (1860-1931), who developedthe "open air" nursery school in Great Brit-ain.° She began by transforming a slum lotin the southeast of London into a gardenspot for children 2 to 7 years old, stressingsunshine, fresh air, baths, food, sleep, naturalplay and (for that day) a small ratio of chil-dren to teachers.
In the years before and after theFirst World War, McMillan's efforts andwritings convinced many on both sides ofthe Atlantic that the nursery school could hea major means of counteracting slum condi-tions. In other words, hers was a genui .epreschool enrichment effort. Largely as aresult of the work of Margaret McMillanand Grace Owen, the Fisher Act of 1918made nursery schools a part of the Englishnational school system.
American developments
By the 1920's early childhood editya'-,tion had achieved a small but secure placefor itself in American education. Leadifiguniversities began to sponsor child develop-ment laboratories and model nursery schools,
5 The modern and updated case for Montessori is made byNancy McCormick Rambusch, Learning How to Learn, anAmerican Approach to Montessori, Baltimore, Helicon Press,1962. See also, R. C. Orem, A Montessori Handbook, NewYork, G. P. Putnam and Sons, 1965.
6 See Margaret McMillan, The Nursery School, New York,E. P. Dutton and Co., 1930.

and much attention was paid to the yearsfrom birth to age 6. Since that time, nur-sery schools have become a well-establishedpart of the American educational scene,catering largely to middle-class children andusually on a payment-for-service basis. Theirviewpoint and methods have been taken overto some extent, however, by day care centers.
Recently there has been a resurgenceof the belief that nursery schools can bemade a likely means of compensating for thecognitive deprivation that many childrenfrom low-income families are believed tosuffer. In Intelligence and Experience,? J. Mc-Vicker Hunt reviewed the evidence that un-derlines this belief and showed that grosslack of appropriate stimulation in earlychildhood can seriously depress perceptualand cognitive development.
Belief :iar the efficacy of preschool edu-cation for the "culturally deprived" has led tothe establishment of a considerable numberof experimental centers, largely under privateor university auspices. Enthusiasm about theprobable benefits of early educational inter-vention led the planners of the "war onpoverty" to propose large-scale preschoolservices. From this interest emerged ProjectHead Starts and, most recently, a proposalfor a nationwide network of "parent-childcenters."
Aside from Head Start, we estimatethat by mid-1965 there were in the UnitedStates close to a hundred preschool projectsdevoted to "enriching" the life experiencesof the children of the poor.° Perhaps 15 or20 of them, including the Howard Univer-ity Preschool Project, had a research corn-Clonent of some substance.
, 7 T. McVicker Hunt, intelligence and Experience, NewYork, The Ronald Press Co., 1961.
Cet;8 See An Invitation to Help: Head Start Child Developmentrenters, Community Action Program, Office of Economic Op-portunity, Washington, D.C., 1965, as well as numerous other
allegkpublications of Project Head Start.Nireti ° See Benjamin Bloom, Allison Davis, and Rob "rt Hess,
Compensatory Education for Cultural Deprivation, New York,olt, Rinehart and Winston, Inc., 1965, and The Urban Child
111111111Center, "Inventory of Compensatory Education Projects,1965," School of Education, University of Chicago, 1965WImimeographed) .
In a sense, in the Howard UniversityProject and the other preschool demonstra-tions we have returned to the convictions ofComenius, Froebel, Montessori, McMillan,and others and are seeking to develop a newkind of "infant school" to meet the needs ofdeprived children from low-income environ-ments. In place of Comenius' mother- infantgames, Froebel's and Montessori's specialequipment, and McMillan's fresh air andfree play, a new assortment of devices havebeen developed and are being tried out insome of the projects, while other projectsrely on more conventional methods. Amongthe new devices are tape recorders, phono-graphs, electric "talking" typewriters, full-length mirrors, and a large variety of me-chanical puzzles, plastic materials, and tech-niques to stimulate talking and listening.Instead of the spiritual and almost mysticallanguage of a Froebel or a Montessori, thenew vocabularies speak of "cognitive en-richment" (activities that stimulate think-ing) and "enhanced self-image" (good feel-ings about what one is and is becoming).Despite these differences, however, the basicaim remains the same : to find a means bywhich children from poverty-stricken homescan realize their potentialities.
Research on the effectiveness of earlychildhood education
In the 15 or so years before 1940,some 300 research reports on nursery schoolswere published. These were reviewed andassessed by various authorities,10 and someoverall conclusions were drawn. By andlarge it appeared that attending nursery
1° Among others, the following are useful sources of re-view treatments and comprehensive bibliographies: NationalSociety for the Study of Education, 39th Yearbook: Intelli-gence: Its Nature and Nurture; Part I: Comparative andCritical Exposition, Bloomington, Ill., Public School Publish-ing Co., 1940; National Society for the Study of Education,-16th Yearbook, Early Childhood EducationPart II, Univer-sity of Chicago Press, 1947; Pauline S. Sears and Edith M.Dowley, "Research on Teaching in the Nursery School," inN. L. Gage (ed.), Handbook of Research on Teaching, RandMcNally, 1963, pp. 814-864; Elizabeth Machem Fuller,
5
school did not have a lasting impact on theintellectual functioning of the children whowere servedfor the most part, middle-classchildren of at least average endowment.
The renewed interest in the possi-bility of using nursery schools to improvethe cognitive functioning of the children ofthe poor has stimulated a new wave of eval-uative research. Some of the questions nowbeing asked are old and familiar; others arenew, in the sense that they are derived fromcontemporary educational theory and recenttechnological innovations.
The older questions include the fol-lowing:
1. Can preschooling be made to have alasting and positive impact on the subsequentintellectual and social development of chil-dren in general?
2. Aside from "children in general,' canpreschooling be of particular value to chil-dren from low-income homes and neighbor-hoods?
3. What specific aspects of the preschoolcurricula produce what specific results?
4. Does preschocling enhance school-re-lated skills ; if so, which ones and in whatways (reading, arithmetic, social adjust-ment, and the like) ?
Among the new questions are thefollowing:
1. What are the differential impacts of thevarious enrichment schemes? Are some sig-nificantly more effective than others?
2. How early in the life of a deprivedchild must preschooling be introduced tomake it effective?
3. How essential is the involvement of
"Early Childhood Education," in Chester W. Harris (ed.),Encyclopedia of Educational Research, 3rd ed., MacMillan,1960, pp. 385-398; Joan W. Swift, "Effects of Early GroupExperience: The Nursery School and Day Nursery," in Mar-'tin L. and Lois W. Hoffman (eds.), Review of Child Devel-opment Research, Russell Sage Foundation, 1964, pp. 249-288.
6
parents, and the school-home carryover, tothe enrichment effort?
4. Are there specific subgroups of childrenwithin the low-income population that aremore suitable candidates than others forcompensatory schemes?
5. Are there any particularly effectiveways of offsetting the specific languagedeficiencies of deprived children, ways whichstem from contemporary learning theories,including theories about the acquisition oflanguage?
It is much too early to say what thecurrent wave of research will yield. Only ahandful of projects have published even ten-tative findings but it may be worthwhile tocite a few of them.11 In this brief summarythe research findings from the Head Startprograms are not included, since these havetypically been summer programs and so maynot be comparable with the longer-termprojects cited here. The interested reader isreferred, however, to a forthcoming publica-tion from the Office of Economic Oppor-tunity.12
Beller,13 Bereiter et al.,14 Goldstein,15Gray and Klaus," and Weikart et a.;17 have
11 For overviews and partial assessments of contemporaryenrichment undertakings, see J. W. Getzels, "Preschool Edu-cation," Contemporary Issues in American Education, U.S.Department of Health, Education, and Welfare, Office ofEducation, Bulletin 10034, 1966, No. 3, pp. 105-114; ClayV. Brittain, "Preschool Programs for Culturally DeprivedChildren," Children, July-August 1966.
12 John McDavid, Project Head Start: Evaluation Re-search 1965-1967, Division of Research and Evaluation,Office of Economic Opportunity, Washington, D.C.
13 E. Kuno Beller, "Annual Report of Research in the Phila-delphia Experimental Nursery School Project," Temple Uni-versity, Philadelphia ; 1965 (mimeographed).
14 Carl Bereiter and Siegfried Engelmann, Teaching Dis-advantaged Children in the Preschool, Prentice-Hall, 1966.
15 Leo S. Goldstein, Evaluation of an Enrichment Programfor Socially Disadvantaged Children, Institute for Develop-mental Studies, Department of Psychiatry, New York Medi-cal College, June 1965 (mimeogidphed).
16 Susan W. Gray and Rupert A. Klaus, "An ExperimentalPreschool Program for Culturally Deprived Children," ChildDevelopment, Vol. 36 (1965), No. 4, pp. 887-898.
17 David P. Weikart, Constance K. Kamii, and Norma L.Radin, Perry Preschool Project Progress Report, YpsilantiPublic Schools, Ypsilanti, Michigan, June 1964 (mimeo-graphed).

issued reports indicating that preschoolingproduces certain positive results. There areimportant differences among their findingsbut the positive results reported at the endof the preschool period appear to be thefollowing :
1. IQ test scores increase by approxi-mately 5 to 15 points.
2. Use of language and understanding ofarithmetic improve.
3. The overall school adjustment of thechildren appears to be enhanced.
4. Parents of the children see the pre-schools in a favorable light.
Some of these early findings are basedon objective tests and control-group meas-urements ; others, on teachers' impressions.
With respect to the crucial questionof persistence of effect (for example, whetherthe IQ increase is sustained or whetherthe children who attend preschool do betterin the third grade than those who do not
attend), there is as yet no large and clearcutbody of evidence.
One tentative report from the Racine,Wisconsin, schools cites certain negativefindings and asserts that ". 'one-shot' com-pensatory programs would seem to be awaste of time and money."18 An informalreport by Alpern questions the usefulness ofbrief preschool progra ms."
It is clearly too early to pass judg-ment on long-range results. Only time andcareful testing will tell whether the currentblossoming of interest and effort in thisfield of education will result in major newdevelopments in teaching methods and inthe substantial enhancement of the abilityof the children of the poor to succeed inschool.
18 R. G. Larson and J. L. Olson, Final Report: A PilotProject for Culturally Deprived Kindergarten Children, Uni-fied School District No. 1, Racine, Wisconsin, April 1965(mimeographed draft).
lo Gerald 1). Alpern, The Failure of a Nursery School En-richment Program for Culturally Disadvantaged Children;preliminary report prepared for 1965 regional meeting ofThe American Association of Psychiatric Clinics for Children(mimeographed).

II. AN OVERALL VIEW OF THE PROJECT
AMONG THE MANY preschool dem-onstrations now underway in the UnitedStates, probably no two are exactly alike andperhaps no two have identical aims. The dis-tinguishing features of the Howard Univer-sity Preschool Project were the following :
1. The Project was carried on in a long-established nursery school that was con-ducted by a university for research andtraining purposes.
2. The children that the Project servedwere enrolled at the age of 3. (Many pre-schools have 4 or 5 as the entrance age.)
3. The children were much alike in age,being 36 to 42 months old at the start. (Manyprojects enroll children of a wider age span.)
4. Largely because of the makeup of theDistrict of Columbia population, all the chil-dren were Negroes. All lived in the samegeneral neighborhood. (Some projects stip-ulate a more heterogeneous enrollment.)
5. The nursery day was about 7 hours long(8 hours including the bus trip to and fromschool) .
6. The children attended the preschool fora 10-month school year and a 2-year timespan. (Most demonstrations are consider-ably shorter than this.)
7. Transportation was provided for all thechildren.
8. No fees were charged.
9. The curriculum was essentially that ofa standard nursery school that serves mid-
8
dle-class children, no specific "enrichment"features having been added.
10. The teachers, under the general guid-ance of the Project Director and the HeadTeacher, were allowed to modify the usualnursery school activities to fit the children'sneeds.
11. There was a full-time "adult worker"(parent educator) on the staff who servedthe families of children enrolled in the nur-sery school.
12. Evaluation of the Project's effective-ness was conducted by a team (composed ofstaff members of the Children's Bureau) thatwas independent of the service staff.
13. There was provision for a continua-tion of special schooling beyond the pre-school phase of the demonstration 20 In theschool year 1966-67 this consisted of a kinder-garten specially set up in the Model SchoolDivision of the District of Columbia PublicSchools for the children who had attendedthe Howard University nursery school. Inthe current year (1967-68) the children aredivided between two "special" first-gradeclasses, the other children in these classesnot having attended the Project.
Many preschool demonstrations in-clude provisions similar to these, but prob-ably none includes all of them or combinesthem in such a way as to duplicate the
20 Dr. Ira Cisin, Director, The Social Research Group,George Washington University, who was the statistical con-sultant to the present project, is directing the evaluation ofthe continuation project, under a grant from the Children'sBureau.

Wward University Preschool Project. Thismakes for difficulty in comparing outcomesacross projects but it also has the advantageof making it possible to determine whetherdifferent approaches yield different or simi-lar results.
Research objective
The purpose of the Project was tofind out whether and to what extent a stand-ard nursery school that includes work withparents can enhance the later school achieve-ment of children who live in a slum area.This question cannot yet be answered, forthe children who were served have only nowentered the first grade of elementary school.In this report we shall show, however, whatchanges in IQ and other psychological meas-ures took place between the beginning andthe end of the two nursery-school years, andwhat some of the factors were that dif-ferentiated the children whose IQ's changedgreatly from those who either, did not changeor regressed.
The comparison group
In trying to assess the effects of aneducational program, a perennial problemhas been to prove that educational interven-tion produced the observed effect, and thatthis effect would not have occurred withoutthe specified intervention. Research investi-gators partially obviate this problem by set-ting up a "controlled" experiment. In thepresent instance, we secured two groups ofchildren, more or less the same in the vari-ables presumed to be significant. We then ex-posed one group to 2 years of nursery school.The second group was not exposed to thisinfluence, and in that sense the experimentmay be said to be "controlled."
However, we were aware that manyfactors and influences could enter the livesof both groups of children during the 2-yearperiod of the Project's existence. Other than
offering the experimental children the pre-school experience, we did not really "con-trol" any of these possible influences. Forthis reason, we prefer to call our experi-mental group the "nursery group" and ourcontrol group the "comparison group."
Strictly speaking, the comparisongroup was not entirely "untreated." Therewere certain minimal "treatments." Thefamilies in the comparison group were en-couraged to think of themselves as partici-pating in a university-centered study ofsome significance. They were visited in theirhomes by the research workers, and friendlyinquiries were made about their backgroundand life experiences. The comparison-groupchildren were examined and tested just aswere the nursery-group children. All of thisis certainly a minimal involvement as con-trasted with the service provided to the nur-sery-group families. But it must nonethelessbe thought of as a kind of "treatment"which might yield a significant placebo orexperimental effect.
Although the comparison group wasreferred to formally as the Howard Univer-sity Growth Study, it is doubtful that manyof the comparison-group parents were famil-iar with this official title. Perhaps merelybeing a part of this study and being toldthat one is making a helpful contribution tothe welfare of children was itself a morale-boosting experience for some parents. Per-haps parents in the comparison group wereencouraged in small but palpable ways totake a greater interest in their children andto do a better job as parents. Perhaps thechildren also thought of themselves as insome way "special" and therefore respondedmore vigorously to school-related tasks andsituations. Several of the comparison-groupparents said that they welcomed the oppor-tunity to visit Howard Uni versity periodically and thought the experience was goodfor their children. If there were such effectson the comparison group, they would tend todiminish differences between the two groupsin outcome measures.
There is a simple way to compensate
9
for such experimental effects on the com-parison group. It would be possible to recruitanother comparison group later, made up ofparents and children who have had no in-volvement with preschooling or with an ex-perimen tal enterprise like the Howard Uni-
versity Growth Study. If care is taken tomake sure that this newer comparison grouphas had backgrounds and life experiencessimilar to those of the nursery group, place-bo and experimental effects will be held to aminimum.
1
III. RECRUITING THE NURSERY AND
COMPARISON GROUPS
HOWARD UNIVERSITY IS situatedabout 2 miles north of the Capitol in Wash-ington, D.C. The campus is bounded on theeast, south, and west by densely populated,low-income neighborhoods. These areas arepopulated almost wholly by Negroes and aregenerally regarded as the inner-city slumsof Washington. It was clear from the startthat the areas lying roughly to the south ofthe Howard campus would be the likeliestsource for recruiting children to attend thenursery school or to be in the comparisongroup. After census figures were examinedand neighborhoods visited, it was concludedthat Tracts 40, 47, 48, and 49 should be thetarget area for recruitment. It was obviousthat, no matter what sampling procedurewas used, a sample was bound to consist ofNegro families, most of whom would haveincomes that were low.
Sample
No delimiting criteria of socioeco-nomic level were established. Although theintention was to concentrate on the lowerend of the socioeconomic continuum, it wasassumed that any resident in the target areawould be a suitable candidate, so no screen-ing for income was attempted.
With respect to age, children whowere about 3 years old were the ones wewanted : specifically children who, in Octo-ber 1964, would be not less than 3 years oldand not more than 3 years 7 months old. At
the outset an even more restricted age spanhad been envisaged but it became clear thatdifficulties in identifying suitable candidatesdemanded a broader one. As it turned out,despite considerable effort, errors occurredin determining the exact ages of children,and we ended up with one child in the nur-sery group and three children in the com-parison group outside the stipulated agerange.
For inclusion, it was also requiredthat parents speak English; that the childrenhad never been in formal group care ; thatthe parents agree to bring the children tothe University for psychological testing(called play sessions) ; and that, if their chil-dren were chosen for the nursery group,they be willing to have them ready to go toschool when the bus arrived in the morning.(It was made clear to every parent that onlya limited number of children could be en-rolled in the nursery school and that selectionwould in no way depend on how the childrenperformed during the "play sessions.")
Concerning the physical and healthstatus of the children in both groups, thefollowing requirements were established :
1. The child was to be in generally goodhealth, without gross visual or auditory de-ficiencies and free from serious orthopedicproblems.
2. There was to be no indication of or-ganically based mental retardation, as evi-
11

C)
denced in a routine pediatric examination.3. There was to be no overt sign of severe
mental disturbance.
Recruitment procedures
It was necessary to utilize a practicaland feasible strategy of recruitment. Thisstrategy could not be unduly laborious, ex-pensive, or time-consuming, since there werelimitations of time, money, and staff.
We weighed the relotive merits of aself-referred sample (families who volunteerto enroll their children) as compared witha designated sample (families deliberatelychosen by the research team). Strictly speak-ing, there is no such thing as a purely des-ignated sample in an undertaking like theHoward Project, since for various reasonssome designated families do not or, cannotfollow through. Still, there are major andhighly significant differences between a par-ent who makes the effort to seek out a serv-ice or who goes out of the way to make him-self available for a demonstration projectand one who merely agrees to accept aservice when it is offered to him. There isalways the possibility that a self-referredcandidate is more highly motivated or moreeager for the service or more responsiblyoriented to use it. Thus a self-referred sam-ple may be biased in the direction of pre-determined success, since a self-referred cli-ent may be a self-helping client who wouldfind routes to success with or without theProject's help.
In view of these considerations, allself-referral procedures were ruled out.Among these were the use of mass media(newspaper ads, billboards in stores, radioannouncements), announcements by schoolprincipals concerning the availability of thenursery, and other word-of-mouth recruit-ment devices that could have been providedby social service or health agencies in thecommunity.
Thought was given to the possibility ofreaching target families by canvassing ele-
12
mentary school pupils, asking them whetherthey had 3-year-old siblings. Toward thisend, the cooperation of the Superintendentof Schools and 12 elementary school prin-cipals was obtained. Teachers in grades threeto six were requested to distribute slips ofpaper to all children in their classes, askingthem to enter the names of their 3-year-oldsiblings, as well as the names and addressesof other 3 year olds they knew who lived inthe neighborhood. The pupils could take theslips home and ask parents or older siblingsto fill them out. In this way a total of 379names (including approximately 30 identi-fiable duplicates) were obtained. On inspec-tion, however, and after making a field check,it was found that names and addresses, aswell as year of birth, were frequently in-accurate, and that considerable time wouldbe required to make these lists useful. Thisapproach had the additional disadvantageof containing very few first-born children.The lists were held in reserve but it wasnot necessary to use them in recruiting.
Another strategy that was consideredand subsequently abandoned entailed the useof vital statistics records. Through the co-operation of the D. C. Department of PublicHealth a list was obtained of all the childrenin the target tracts who were born withinthe stipulated period. This list containednames, addresses, and birth certificate num-bers. A chief drawback to this plan was thatthe addresses were at least 3 years old. Inaddition, the list arrived too late to be of use.Later examinations of the list showed thatabout 40 percent of the children finally se-lected were on it.
Still another approach would havebeen to solicit lists of likely candidates fromcommunity agencies, such as the Departmentof Welfare, settlement houses, churches, hos-pitals, family agencies, and health clinics.The disadvantage of this method is that itinvol-res a possible violation of principles ofconfidentiality, is laborious, and results in aroster biased in the direction of familiesknown to social agencies. As an insurance,however, such lists, totaling 79 names, were
obtained from two social agencies in thecommunity.
The house-to-house canvass
After considering, experimenting with,and discarding alternative strategies of sam-ple recruitment, it was decided that the mostpractical and direct approach would be ahouse-to-house canvass. This approach elim-inated many of the undesirable selectivefactors inherent in most of the discardedstrategies and dispensed with the costly, te-dious process of checking and tracing downthe numerous changes in address that wouldhave been encountered in following anyavailable list.
Ten interviewers, mostly HowardUniversity students, were employed parttime to conduct the canvass, which lasted for3 weeks and was supervised by a member ofthe research team. The canvass required atotal of about 500 interviewing hours, at thecost of approximately $700.
In preparing for the canvass, inter-viewers were briefed on recommended in-terviewing procedures. The nature of theProject was explained to them, each item inthe interview schedule21 was discussed, andthe importance of attempting to reach everyhousehold was stressed. At the end of thebriefing session, a mock interview was heldto familiarize the canvassers with the con-tent and sequence of the interview schedule.
A structured questionnaire was used,requiring between 5 and 8 minutes to ad-minister. The chief question was simplywhether there was a child in the householdwho was born between the stipulated dates.If the answer was no, the interview wasterminated, with thanks. If the respondentindicated that there was such a child in the
21 Copies of interview forms used in the Project, as well asother data-gathering materials, will be supplied to researchworkers on request. Address inquiries to Division of Research,Children's Bureau, Dept. of Health, Education, and Welfare,Washington, D.C. 20201.
household, the exact birth date was re-quested, and, if available, the birth certifi-cate number or other official verification ofbirth date. The respondent was also askedwhether the child had any prior or currentgroup care experience and whether the fam-ily was planning to move from the presentaddress in the near future.
At the close of the interview, the can-vasser was instructed to thank the respond-ent for his cooperation and to say that some-one from Howard University might be intouch with the family at a later time. Thecanvassers were to make no commitmentsabout enrolling children in the nurseryschool.
Interviewers were requested to ob-serve the following rules during the can-vassing :
1. The canvasser was to introduce himselfas a student at Howard University and toshow a University identification card if re-quested to do so or if there seemed to besome doubt in the mind of the respondent.
2. Respondents were to be told that How-ard University was planning to start a freenursery program for a small number of 3-year -old children. As a first step it was nec-essary to find out how many such childrenlived in the area.
3. Wherever possible, the mother was tobe interviewed. If this was not possible, anypermanent member of the household (father,grandparent, aunt, teenage sibling) could beinterviewed.
4. The interviewer was to proceed fromone dwelling unit to the next, omitting onlycommercial establishments. In multiple dwell-ing units, the canvasser was to attempt toreach as many of the families as could beidentified.
5. A log was to be kept of all houses vis-ited, whether or not a 3-year-old was identi-fied as living at the address.
I )
Results of the canvass
Unfortunately, because of certain in-accuracies in recordkeeping as well as in-complete reporting on the part of some can-vassers, we are not able to report with pre-cision on the canvassing and recruitmentstage of the Project. We know that a min-imum of 190 families with children withinthe stipulated age range were identified inthe four target tracts. In addition, another10 families (also a minimum estimate) notin the target tracts were picked up duringthe canvasssome inadvertently and somein order to approach the desired quota.
At the start, the aim was to find 250to 300 eligible families. From this pool, anursery group of 38 children and a compari-son group of 80 to 100 children would bedrawn. (The much larger number for thecomparison group was wanted because ofan expected attrition of 25 to 50 percent.)Toward the end of the canvassing stage, itwas apparent that so large a sampling poolwould not be obtained unless we were willingto invest considerable additional time, money,and effort. It was decided not to make thisadditional investment, to settle for a pool ofapproximately 200 families, and to take therisk of reducing the comparison group tonot less than 60 families.
Selectivity in canvassing
According to the records of the D. C.Health Department, 517 children were bornbetween April 1, 1961, and October 31, 1961,in the tracts covered by the canvass. Thismeans that the 190 children identified in thecanvass as living in these tracts in spring1964 probably represented at least a thirdof the total 3-year-old population.
The question then arises : to what ex-ent was this pool of families a biased sam-ple of the total number of families in thetarget area that had eligible 3-year-old chil-dren? (We disregard for the time being thehandful of families from the "outside"tracts.) Were there selective :actors at work
14
as the student canvassers went about theirtask of knocking on doors and making in-quiries?
We must assume that there was someselectivity but we can only speculate as to itsexact nature and significance. Perhaps cer-tain kinds of respondents were less pronethan others to answer the canvasser's knockand to give the desired information. Perhapssome of the canvassers working in some ofthe neighborhoods were more consistent andresponsible than others in making repeatedvisits to dwellings where no one was homeat the earlier visits. Perhaps certain par-entsfor example, young mothers of first-born childrenwere more likely to be atwork or to be absent from the home forother reasons during daylight hours. Per-haps substitute caretakers were less ready toacknowledge the presence of a 3-year-old.Perhaps there were other selectivity factorswe have not thought of.
The "invitation-to-participate" phase
The approximately 200 families iden-tified in the canvass lived in an area thatcovered about one and a half square miles.It was necessary to decide which of thesefamilies should be invited to participatein the nursery school program and whichshould be asked to join the group that wouldbe used for comparison purposes. The nurs-ery school would be able to accommodate lessthan 40 children. The group of children withwhom these would be compared should beconsiderably larger, since it might be harderto hold these people in the study.
The two most populous and promis-ing census tracts were numbers 48 and 49.For convenience in "bussing" the childrenand in order to avoid possible disappoint-ments if one family was invited to enroll achild in the nursery school and its nearbyneighbor was asked merely to take part inthe comparison group, it was decided to con-fine the nursery-group invitations to onecensus tract. A coin was flipped, and the
49th census tract became the locus of thenursery-group recruitment.
At first we also tried to confine re-cruitment of the comparison group to onetract, the 48th. This area did not yield suffi-cient numbers, however, and it was neces-sary to seek candidates in the remainingtracts, primarily in Tract 46.
From the pool of families living inTract 49, a random sample of families waschosen as the ones to be invited to enrolltheir children in the nursery school. A simi-lar procedure was used to select comparison-group families.
The comparison families were invitedto join the Howard University Growth Study.They were told that the purpose of the studywas to learn as much as possible about chil-dren's experiences, so that we might find outmore about what helps children to do wellin school and what makes it harder for themthere. The pediatric and psychological exam-inations ("play sessions") were also ex-plained on this basis. The general "pitch" ofthe invitation was that the families wouldbe making a contribution to other parentsand children by participating in the study.
Nursery school staff as well as re-search workers attached to the Project par-ticipated in inviting the potential nursery-group and comparison-group families to jointhe study. Almost without exception, parentsexpressed willingness to participate as re-quested. Appointments for the first testingsession were made, and free transportationwas offered to families that needed it.
In spite of this favorable response,however, many failed to keep their appoint-ments for the tests and the pediatric exam-inations. An estimated 30 families moved,announced a clear intent to move in the nearfuture, or were otherwise lost track of. Afew children were temporarily separatedfrom their families and could not be tested.Four or five families either enrolled theirchildren in other preschools or announcedan intent to do so. A few families appearedsimply to lose interest in the program anddropped out.
Whenever a family was lost to theProject, another family was randomly se-lected from the original pool of names andinvited to participate. Thus, as the summerweeks went by and the testing was in prog-ress, the original pool of 200 names grad-ually dwindled. It was necessary to makerepeated contacts and visits to attain theminimum figures set for the nursery groupand the comparison group. Indeed, severalother nearby census tracts had to be drawnon to complete the roster (Tracts 33, 34, 36) .These were cf much the same character asthe tracts originally chosen.
Despite these difficulties, by mid-Sep-tember 1964 the recruitment of families forboth groups was successfully completed.Thirty-eight children were enrolled in thenursery group and 69 cTiildren in the com-parison group.
Selectivity during the invitational phase
Despite the intention of obtaining adesignated and not a self-referred sample,it is clear that, since approximately 96 fam-ilies were eliminated during the invitationalphase, the remaining 104 families do notrepresent a purely random selection fromthe 200 in the canvass pool. Some possiblefactors in selectivity were the following :
It required a certain measure ofreadiness and willingness to cooperate dur-ing the testing period, so some of theless conscientious and disciplined familiesmay have dropped out. In addition, it maybe that the families that moved or wereotherwise lost track of constituted a lessstable and dependable group in some re-spects. On the other hand, it may be that,in a significant number of cases, some of the"dropouts" were the more self-sufficient andindependent families who saw little to begained from affiliation with either the nur-sery group or the comparison group.
There may also have been unconsciousand even deliberate selectivity on the part ofthe staff members who participated in the
15
invitational phase. All recruiters were urgedto enroll all geographically eligible familieswithout regard to home conditions, physicalappearance of parents, evidences of moral orsocial irregularities in the household, andthe like. But staff members may have some-times disregarded these urgings, preferringnot to deal with the more "difficult" families.We did learn of one such case but, so far aswe can tell, such cases were verlif few innumber.
Even allowing for various selectivefactors, the Howard Project was by nomeans based on a self-selected sample. Nofamily was permitted to volunteer its parti-cipation without a prior invitation, and nofamily was free to choose between enteringthe nursery group or the comparison group.Moreover, the selective factors probably af-fected the nursery-group and comparison-group families equally. Just how the twogroups compared in certain respects is de-scribed below.
16
Attrition in the study
We settled on 38 children for the nur-sery group by taking into account the ca-pacity of the facility and anticipating apossible loss of eight or so children in thefirst year and perhaps another five in thesecond year. In other words, we hoped toend the 2-year preschool sequence with atleast 25 children. As it turned out, not asingle child was lost from the nursery groupduring the first year. During the second yeartwo children dropped out because of movingfar away from the school. A third child wastemporarily withdrawn for 3 months of thesecond year because she was sent to visither grandparents in another city.
As for the comparison group, the ex-pected attrition of 25 to 50 percent did notmaterialize. At the end of the 2 years, 65 ofthe 69 children were still in the project.

IV. CHILD AND FAMILY CHARACTERISTICS
THE HOWARD UNIVERSITY PRE-SCHOOL PROJECT, then, had as its sub-jects 38 children who attended the nurseryschool, and 69 children who served as a com-parison group. All of these children wereNegroes, and all lived in an area of the cityin which poverty was frequent. All of themwere about 3 years old when the pro-gram started. All were in good health at thattime, and none had previously attended anursery school or had had comparable pre-school experience.
In spite of these similarities, whichstemmed from selection criteria, neither ofthe two groups of children represented anunbiased sample of chilOren with such at-tributes living in the chosen residential areasat the time of the study. In addition to otherreasons, bias was unavoidable because par-ents, of course, could accept or refuse theinvitation to join the study.
This being so, we must show whetherand to what extent this bias interfered withthe comparability of the two groups. More-over, bias or no bias, anyone who wants togeneralize the findings of the study (that is,wants to use them to determine the resultsto be expected of the sort of preschool edu-cation provided by this Project) must knowto what sorts of children and families thefindings refer. This chapter of the report isdevoted to answering these questions.
The Children
Age
According to the selection criteria, thechildren were to be from 36 to 42 months
old when they entered the Project. To thebest of our knowledge these age limits wereadhered to when the children were selectedbut subsequent checking of birth recordsshowed that three children in the compari-son group were 4 to 12 months older, whileone in the nursery school group was 2 monthsyounger.
Sixteen of the 38 children in the nur-sery group were 36 to 38 months old, andthe rest with the one exception just notedwere from 39 to 42 months old. In thecomparison group of 69 children, 21 werein the lower age range. This means that theproportion of children under 39 months oldwhen the Project started was a bit higherin the nursery-school group than in the com-parison group, 43 as compared with 31 per-cent. This is not a statistically significantdifference, however, and we did not attemptto take account of it when determining pro-gram resulth.
Sex
There were 15 boys and 23 girls inthe nursery-school group, and 32 boys and37 girls in the comparison group. In otherwords, boys made up 39 percent of the firstgroup and 46 percent of the second, a differ-ence that was regrettable although it wasnot statistically significant.
Birth order
In birth order the children rangedfrom first-born to seventh or higher. Twenty-six percent of the children in the nurseryschool were first-born, as compared with 16
17
percent in the comparison group. Another21 percent in the nursery school and 16 per-cent in the other gro,:tp were second in birthorder. At the other end of the scale, 37 per-cent of the nursery school children and 49percent of the others were fourth or later inbirth order.
Birth order is a ,factor that might beregarded as of importance for the children'sdevelopment, especially the development ofspeech, by the time they were 3 years old.The differences between the two groups inthis trait were not statistically significant,however.
Intelligence
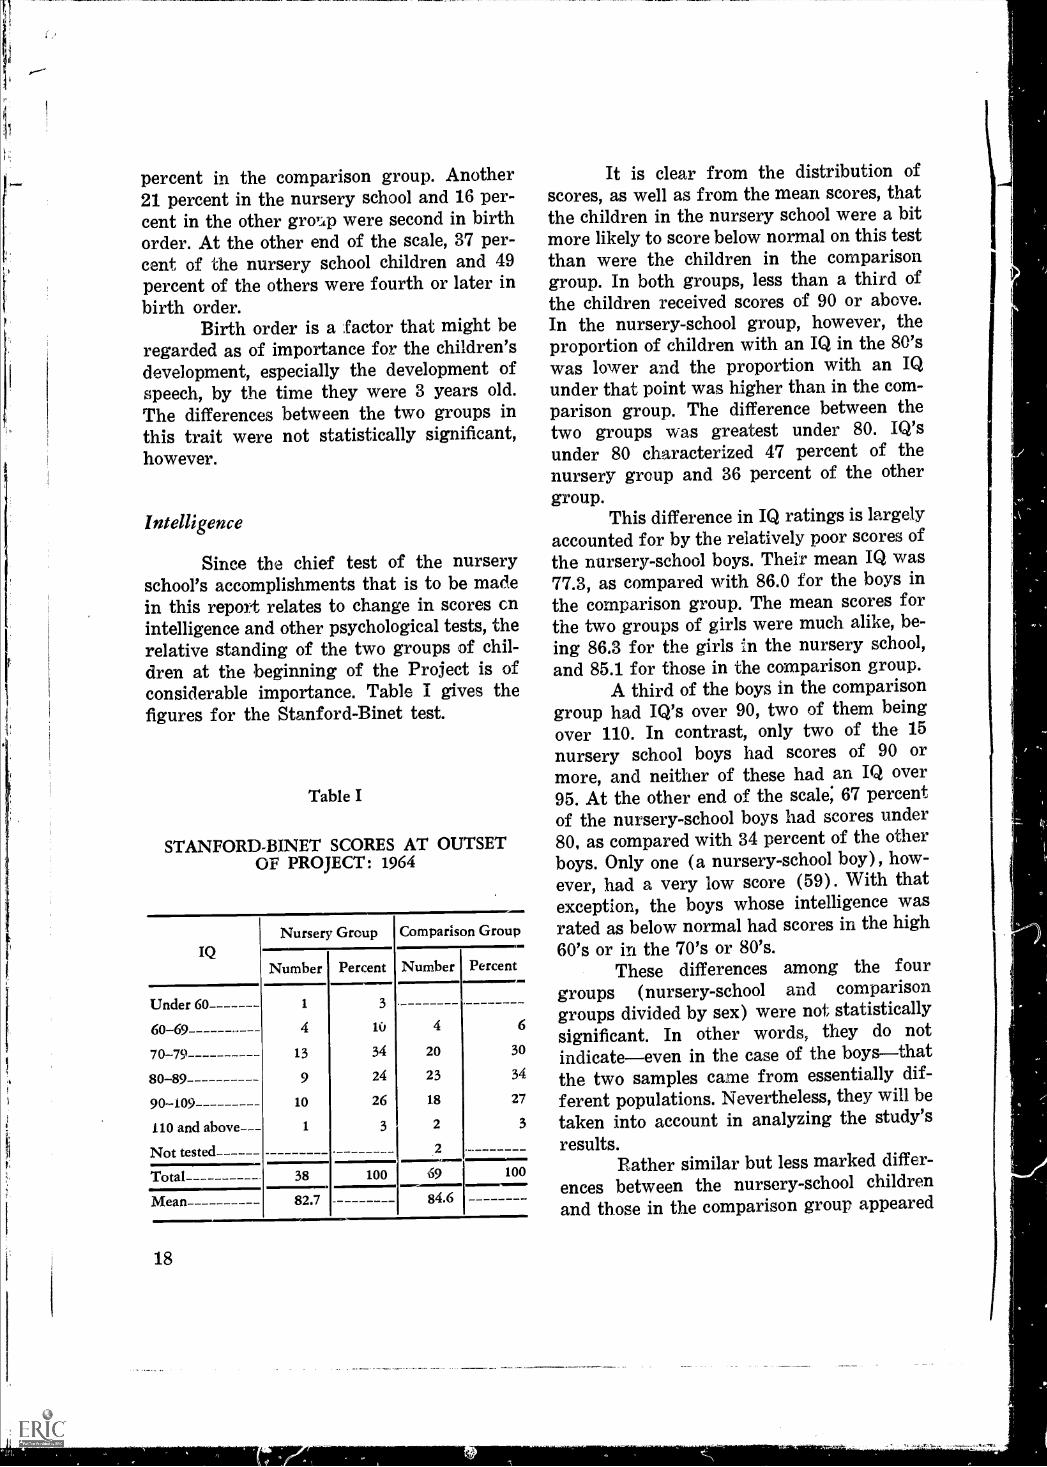
Since the chief test of the nurseryschool's accomplishments that is to be madein this report relates to change in scores cnintelligence and other psychological tests, therelative standing of the two groups of chil-dren at the beginning of the Project is ofconsiderable importance. Table I gives thefigures for the Stanford-Binet test.
Table I
STANFORD-BINET SCORES AT OUTSETOF PROJECT: 1964
IQNursery Group Comparison Group
Number I Percent Number Percent
Under 60 1 3
60-69 4 iu 4 6
70-79 13 34 20 30
80-89 9 24 23 34
90i09 10 26 18 27
110 and above 1 3 2 3
Not tested 2
Total 38 100.0.01M1141',MIM
69 100
Mean 82.7 84.6
18
It is clear from the distribution ofscores, as well as from the mean scores, thatthe children in the nursery school were a bitmore likely to score below normal on this testthan were the children in the comparisongroup. In both groups, less than a third ofthe children received scores of 90 or above.In the nursery-school group, however, theproportion of children with an IQ in the 80'swas lower and the proportion with an IQunder that point was higher than in the com-parison group. The difference between thetwo groups was greatest under 80. IQ'sunder 80 characterized 47 percent of thenursery group and 36 percent of the othergroup.
This difference in IQ ratings is largelyaccounted for by the relatively poor scores ofthe nursery-school boys. Their mean IQ was77.3, as compared with 86M for the boys inthe comparison group. The mean scores forthe two groups of girls were much alike, be-ing 86.3 for the girls in the nursery school,and 85.1 for those in the comparison group.
A third of the boys in the comparisongroup had IQ's over 90, two of them beingover 110. In contrast, only two of the 15nursery school boys had scores of 90 ormore, and neither of these had an IQ over95. At the other end of the scale; 67 percentof the nursery-school boys had scores under80, as compared with 34 percent of the otherboys. Only one (a nursery-school boy), how-ever, had a very low score (59). With thatexception, the boys whose intelligence wasrated as below normal had scores in the high60's or in the 70's or 80's.
These differences among the fourgroups (nursery-school and comparisongroups divided by sex) were not statisticallysignificant. In other words, they do notindicateeven in the case of the boysthatthe two samples came from essentially dif-ferent populations. Nevertheless, they will betaken into account in analyzing the study'sresults.
Rather similar but less marked differ-ences between the nursery-school childrenand those in the comparison group appeared

on other tests. These are described in detailin a later section of the report.
Overall, then, the children to whomthe study's findings refer were healthyNegro children who were about 3 years oldat the start. In both groups there were moregirls than boys. None of the children hadpreviously attended nursery school. Theyranged in. IQ from about 60 to nearly 120,with a mean of about 85. Except for thelower average IQ of the nursery-group boys,the children in the comparison group seemedsufficiently like those who attended nurseryschool to constitute a fairly adequate control.
The Families
We have next to consider the familybackground of these children and the generalsocial and economic conditions under whichthey lived. In this connection, the readershould bear in mind that at the outset of theProject the nursery group numbered 38 chil-dren (including two twin sets) but only 36families, and the comparison group num-bered 69 children (including one twin set)but 68 families. Because of this, the per-centages and comparisons that refer to chil-dren and those that refer to families are notstrictly comparable.
Characteristics
"Family" was defined as the effectivenuclear family at the outset of the Project."Father" was defined as the effective "fatherfigure" in the household ; that is, the maleperson that the child would be expected tothink of as a father or as a father substitute.In cases in which no such father was presentat the start of the Project, an effort wasmade to secure information about the bio-logical father. We assume that this informa-tion was the least precise, for many women
did not know, for instance, their erstwhilehusband's present occupation.
The family characteristics about whichinquiry was made were as follows : age ofparents and children ; presence of father orfather substitute in the home ; number ofchildren living in the home and elsewhere;where mother and father lived when grow-ing up ; how long parents had lived in D. C. ;
marital status of the mother ; amount offamily income per year; chief source of in-come ; number supported on income ; reg-ularity of income ; rent per month ; sharedkitchen and/or bath; people-to-room ratio ;
and telephone in home.The only item on which there was in-
dependent verification was the birth date ofthe child. Such verification was obtained forall of the children. As to other information,it was our impression that family members(typically the mother) were forthright ingiving information, and that the informa-tion they gave was reasonably reliable. Sincewe worked more closely with the nursery-group families, the data for the nurserygroup are more complete, and probably moreaccurate,, than thbse for the comparisongroup.
Most of the baselhie interviews withthe nursery-group families were carried onby the senior research worker and by theadult worker (parent education specialist).The comparison-group families were usuallyinterviewed by research aides from the HomeEconomics Department but occasionally theentire nursery school staff participated in in-terviewing, including the adult worker, theHead Teacher, and the Director.
In compiling the records on familyattributes, we asked only for informationthat seemed clearly useful and necessary. Wecould, therefore, instruct the interviewers totell family members that questions wereasked only because the information wouldhelp us to understand the home and familylife of the children in the Project. Parentswere also told that we had no formal con-nection with other agencies in the communityand would not give agencies, such as police
19
and welfare departments, any informationabout them.
Interviewers were instructed not touse pressure in soliciting information. If aninformant seemed reluctant to answer orwas vague about the answer, the interviewerwas expected to accept this pleasantly andto move on to other matters. In cases inwhich important items were inadvertentlyskipped in an interview, an attempt wasmade to secur the needed information inlater contacts. Because this process some-times lasted over a year, our figures do notrepresent a strict comparison of the nurserygroup and the comparison group at the startof the Project.
Although interview schedules wereprovided, interviewers followed an informalsemistructured or unstructured style in con-ducting the interviews. Wherever possible,or where it seemed indicated, they discussedand clarified items and did not settle for thesingle word or number that would formallysatisfy the requirements of the interviewform.
Family composition: Sixty-six percentof the mothers in the nursery group weremarried and living with their husbands, ascompared with 53 percent in the other group.In the nursery-school group, however, mostof the homes (80 percent) reported either afather or a father substitute. This was trueof a significantly smaller proportion of thefamilies in the comparison group. It mayhave been that father-substitutes were under-reported in the latter group, our informa-tion about this group being less complete.
Six percent of the mothers in the nur-sery group and 13 percent in the comparisongroup reported themselves as single. Four-teen percent of the nursery-group mothersand 32 percent of the comparison-groupmothers were separated or divorced. Nur-sery-group mothers reported five common-law marriages (14 percent) ; comparison-group mothers, one (2 percent) .
20
Number of children: The median num-
ber of children per family, in both the nur-sery group and the comparison group, wasfour. In the comparison group, however, therange was greater. Eight of the 68 compari-son-group families had from 8 to 10 childrenin the home, while none of the nursery-groupfamilies contained more than seven children.The comparison-group children thus camefrom slightly larger families on the av-erage, but the difference was not statisticallysignificant.
Age of parents: There was a wide agerange among the parents in both the com-parison group and the nursery group. Theoldest comparison group "mother" (age 54)was actually the child's grandmother, whoserved as the functional "maternal figure."Her husband was the oldest "father" (age67) in the group. Several mothers in boththe nursery group and the comparison groupwere in their 40's. The median age, how-ever, was 27 and 28, respectively, for thenursery-group and comparison-group moth-ers, and 32 and 31 for the nursery-groupand comparison-group fathers, respectively.Thus, the two groups were quite similar inage.
Parents' education: The nursery-groupfathers were on the whole somewhat bettereducated than the comparison-group fathers,the difference between nursery group andcomparison group in "highest grade com-pleted" being statistically significant. Eleven(37 percent) of the nursery-group fathershad graduated from high school, as com-pared with nine (16 percent) of the com-parison-group fathers.
Whether this difference in reportededucation means that the nursery-group andcomparison-group fathers really differedfrom each other in functional intelligence orability is a moot point. A high school diplomafrom an inner-city school is not synonymouswith literacy. We know that among the nur-sery-group families there were mothers whoclaimed 8 to 10 years of schooling who couldbarely read or write.

The nursery-group and comparison-group mothers were much alike in educa-tional level, approximately a fourth of eachgroup having graduated from high school.The median highest grade completed was the11th in both groups.
Occupation: Relatively few fathers(less than half) in either the nursery groupor the comparison group were reported asbeing the sole source of income for the fam-ily. In both groups, 28 percent of the mothersworked. From our more detailed and reliableknowledge of the nursery-group families,however, we estimated that in only twofamilies in which both mother and fatherworked was the mother the primary sourceof income. Thus, among the nursery-groupfamilies the father was the primary sourceof income in about two-thirds of the homes,even though he was not necessarily the onlysource of income. We did not have sufficientinformation to make this type of judgmentabout the comparison-group families.
Among the nursery-group fathers,three were classified as semiprofessional(one was a proofreader for a newspaper,another was a criminal investigator in theInternal Revenue Service, and a third wasdoing welfare work with a religious-philan-thropic organization). Another six fatherswere classified as skilled workers (e.g. fire-man, bricklayer, addressograph operator,carpet layer) , while the rest were mainlyengaged in unskilled labor.
Most of the nursery-group motherswho were employed were in domestic serv-ice or in some form of restaurant service.Three of them, however, worked in moreskilled occupations : seamstress, playgroundsupervisor, and teacher.
Housing and living conditions: As judgedby the interviewers' ratings, the comparisongroup's homes tended to "look better," atleast on the exterior, than those of the nurs-ery group. Nearly a fourth of the formerwere rated good or excellent, as comparedwith about a 10th of the latter. Half of the
nursery-group homes and a third of those inthe comparison group were rated poor, asthe following percentage distribution shows :
Nursery Comparisongroup group
Excellent 3Good 11 20Fair 39 45Poor 50 32
Housekeeping, however, was some-what less likely to be rated poor in the nur-sery-group families, as the following per-centages indicate:
Nursery Comparisongroup group
Good 19 22Fair 53 38Poor 28 40
The number of people per room (ex-clusive of bath and/or kitchen, except whenthe latter was used as a sleeping area)ranged from less than one person per roomto six persons per room for both the nur-sery-group and the comparison group fami-lies. However, the nursery-group familieslivod in more crowded conditions than thecomparison-group families, their people-to-room ratio being significantly higher. In theaverage nursery-group family there werethree persons per room, as compared withtwo persons per room for the comparisongroup. This difference reflects a differencebetween the census tracts from which thetwo samples were drawn, urban renewal hav-ing eliminated some of the most undesirablehousing from the tracts in which the com-parison group was recruited.
Similarly, significantly more nursery-group families had to share a kitchen and/orbath with another family----47 percent ascompared with 25 percent of the comparison-group families.
21

Rents ranged from $45 to $180 permonth for the nursery group, and $35 to$150 for the comparison group. The medianrent for both groups was $75 per month.
Income level: The median income forthe nursery-group and comparison-groupfamilies was $3,500 and $3,600, respectively.These figures are very similar to those re-ported in the 1960 Census for the tractsfrom which the samples were drawn.
In both groups the lowest family in-come was about $1,000. Annual income ex-tended upwards to $7,000 for the nurserygroup. Two comparison-group families hadannual incomes of over $10,000, but the morerepresentative high income in this groupwas $7,500. Estimates of family income areprobably more accurate for both groups atthe upper than at the lower level, where ir-regular work patterns made it difficult toestimate amount earned per year.
The general similarity between thetwo groups' income level was emphasizedwhen their standard of living 22 was com-puted in accordance with the poverty-incomecriteria used by the Social Security Adminis-tration.28 These criteria take into accountresidence (farm or nonfarm), number offamily members, and sex of family head. Foreach subgroup (for instance, urban, female-headed families with three children) aweighted average of income at each of twolevels of living has been calculated, the "eco-nomy level" and the "low-cost" level. Theresulting figures provide a standard by whichto judge the adequacy of a given family'sincome.
To explain how the SSA standardswere arrived at would involve too much de-tail for the present purpose. It seems suffi-cient to say that families whose incomes arebelow the economy level (which in 1965 was$3,130 for an urban, male-headed familywith two children) are officially regarded as
22 The figures and analysis on this point were prepared bythe Editor.
23 Mollie Orshansky, "Counting the Poor," Social SecurityBulletin, January, 1965, p. 10 and Table E.
22
living in poverty. Those with incomes be-tween the economy level and the low-costlevel we have designated "border-line," whilethose above the low-cost level we called"adequate."
Table II shows the distribution of thetwo groups of families according to thesedesignations.
Table II
LEVEL OF INCOME OF FAMILIES INNURSERY AND COMPARISON GROUPS
Income LevelNursery group Comparison group
Number Percent Number Percent
Below povertyline 20 57 33 53
Borderline 7 20 12 20
Adequate 8 23 17 27
Not known 1 6
Total 36 100 68 100
The figures indicate that the groups weresimilarly distributed in income level and aretherefore strictly comparable on this basis.They also show that over half of the familieswere living in poverty and that only abouta fourth reported incomes that were suffi-cient to meet the children's basic needs.
In this connection it might also benoted that only five families (14 percent) inthe nursery group and 15 (22 percent) inthe comparison group reported receivingfinancial assistance from the D. C. Depart-ment of Welfare. All but two of these 20families were headed by a mother.
Socioeconomic status: In addition to in-formation about income, it was thought thatsome global estimate of the relative socio-economic status of the families was alsoneeded, since social class or socioeconomic

I
lJ
status (SES) is a persistently significantvariable in studies of intelligence, education,social attitudes, child-rearing przctices, andother behavioral correlates.
Despite the importance of this vari-able, there is no uniformity of practice withrespect to its definition or to the elements onwhich it is based. The measure may be de-rived from any or all of the following : fam-ily origins and background, self-definition(the individual says what social class hethinks he belongs to) , definition by groupjudgment, neighborhood residence, housing,income, education, occupation, physical ap-pearance, recreational patterns.
The information already presented in-dicates that, by and large, the families in theProject belonged to the lower end of the SEScontinuum. Obviously none of them wasupper-middle class, and .few would be con-sidered lower-middle class.
As we came to know the families ofthe nursery group during the course of thefirst year and as we accumulated data onfamily characteristics, the families seemedto be classifiableinformally and impres-sionistically--into three definite strata. Onesmall group of families seemed clearly mid-dle class. Another seemed highly disorganized,living in dire poverty, or resembling whatare often called "multiproblem families." Thepreponderant majority, however, did notfall into either of these extremes but rathergave the impression of being "middling"types.
We decided to use this impressionisticevidence in making a threefold breakdownof the nursery-group families. We proceededas follows.
Four staff members (two teachers,the adult worker, and the senior researchworker) rated the families as high, middle,or low in the following five trait-clusters :
Occupation and income level: regularity of in-come ; skills used on the job.
Education: amount and quality of schooling ;how educational background is reflected in
communication skills and ability to plan.
Residence: type of neighborhood ; appearance,cleanliness, condition, and comfort of home ;size of living quarters in relation to size offamily ; condition of furnishings.
Family competence: maintenance of a func-tioning household ; feeding, clothing, train-ing, and disciplining children.
Attitude toward children's schooling: ambitionsfor children and family.
Using these ratings as a guide, theydivided the families into three groups, put-ting in the top group the nine they ratedhighest, in the lowest group the nine theyrated most deprived, and leaving the re-maining 18 in the middle. This, it will benoted, was a division into quartiles (the mid-dle group being composed of two quartiles)and represents the relative standing of thefamilies as compared with each other ratherthan with an external standard, such as thepoverty level.
There vy as substantial agreementamong the raters on assigning families tothese groups, the agreement being greatestwith respect to the high ratings. In, the sevencases in which there was disagreement, 'cheassignment was made by the research staffon the basis of the individual-item ratingsnoted above.
As a check on the validity of theseratings, the highest and lowest quartiles werecompared on 22 objective characteristics. ,Itwas found that they were clearly differentwith respect to the following 10 indicators :family income in dollars, income per child indollars, moderate to high regularity of in-come, number of children in family, sharedkitchen and/or bath, number of people perroom, combined raters' judgment of appear-ance of housekeeping and of premises, tele-phone in the home, and last school gradecompleted by mother.
These indicators were then used toclassify the families in the comparison group,
23
since we did not know these people wellenough to use the method employed withthe nursery-school group. If a family wasabove the median on a particular trait, it re-ceived a rating of "high" for that indicator ;if it was below the median, it was rated"low." A total score for each comparison-group family was derived by adding thenumber of "high" ratings and subtractingfrom this sum the number of "low" rat-ings on the 10 traits. The 18 families thatreceived the highest scores were assignedto the top SES group, and the 18 familiesreceiving the lowest scores became the low-est SES group. This left 32 families as themiddle group.
Tabulation of the relevant data showedthat the median and percentage figures forthe nursery group's SES levels were quitesimilar to those for the comparison group.For instance, the top families in the nur-sery group had a median income of $5,000per year, compared with $5,200 per year inthe comparison group.
We do not think that these SES cate-gories are thoroughly satisfactory. Never;theless, as the study progressed, they seemedto have considerable relevance, at least forthe nursery-group families. As later chap-ters indicate, SES level turned out to berelated to other important variables.
Summary
In summary, most of the children inboth groups came from families that werepoor. A bit over half of them were living in
24
what is officially recognized as poverty. Onlyabout a fourth had a fairly adequate income.Although most of the parents were in their20's or 30's and most of them had lived inthe District for at least 10 years, less thana third of them had graduated from highschool, though most had attended high schoolfor at least a year. A few of the parents weresemiprofessionals and a few were skilledworkers, but most fathers were unskilledlaborers 'Ind most mothers were domestic orrestaurant workers. In most cases, housingconditions were poor or, at best, fair. Inshort, as was to be expected from the Proj-ect's purpose and from its recruitment sourcesand methods, most of the families were def-initely "deprived."
Even so, it is important to note that'there were definite differences among thefamilies in living standards and in thevarious indicators by which socioeconomicstatus is judged. It was possible to dividethem into upper, middle, and lower groupsthat could be reliably distinguished by theProject staff.
Close to two-thirds of the familieswere composed of husbands, wives, and chil-dren. In most of the other families, themothers had been married at one time orhad common-law husbands.
In none of the above respects werethe nursery group and the comparison groupmarkedly different. We concluded, therefore,that the comparison group constituted a fairlyadequate control by which the effectivenessof the nursery school program in improvingthe children's intellectual functioning couldbe tested.

V. THE NURSERY SCHOOL
ASSESSMENT OF the results of theHoward University Preschool Project callsfor information not only about the childrenand parents who were served but also aboutthe program and services the nursery schoolprovided. So far, the school has been identi-fied as being of the traditional, middle-classvariety. This distinguishes it from the new,experimental nursery schools that specifi-cally aim at enhancing cognitive develop-ment. What the designation "traditional"actually means, however, can be shown onlyby a fairly detailed account of the school'sdaily activities.
In general, traditional nursery schoolsemphasize the development of the "wholechild." They count on experience, explora-tion, and creative play, under the guidanceof competent teachers, to advance the chil-dren's emotional and social, as well as in-tellectual, development. The daily programis usually flexible, with free play, music, dra-matics, arts and crafts, storytelling, andgames as the chief media of teaching. Didactic"lessons" are infrequent or entirely absent.
The program of activities providedfor the children in the project was littledifferent from that which the Howard Uni-v,ersity Nursery School had previously usedwith its predominantly middle-class pupils.The major difference lay in the length of theschool day-6 or 7 hours in contrast to theusual half-day sessions. What this meant inprogram will be described below.
Physical Setting
The Howard University NurserySchool is housed in the Home EconomicsBuilding, an attractive, well-maintainedstructure. The indoor nursery premises (ap-proximately 2,000 square feet) are on theground floor of the building with immediateaccess to a yard approximately 2,500 squarefeet in size and a larger outdoor playgroundof approximately 5,500 square feet.
The indoor nursery area, which iscontinuous but divisible into three subareas,forms a large "L" that faces the small out-door playground. The wall of the centralroom is glass, thus providing light and afeeling of spaciousness, as if the playgroundand the interior were one unit.
A large observation booth, equippedwith one-way-vision windows on three sides,is situated in the rear center of the room.It can be entered from a hall behind the nurs-ery area and provides full vision of the en-tire indoor area. "Intercoms" can be turnedon so that an observer can hear what thechildren are saying, although not alwaysclearly.
Both indoor and outdoor areas areequipped in the usual good-nursery-schoolstyle. In the indoor area at the time of ourstudy were blocks, child-size tables, books,puzzles, magnifying glasses, plants, rocks,sea-shell and insect collections, a terrarium,
25
weather charts, and the like, as well as ahousekeeping section for "playing house"and dressing up. In the outdoor area werea sand box, wheel toys, free-form cementanimals for climbing, a jungle gym, swings,and slide. Overall, the physical environmentwas bright, pleasant, and cleana consider-able contrast to the drab homes from whichmany of the children came.
Classroom Groupings, Teachers,and Teacher-child Ratios
The children were divided into groupsof about 12. Each group had its own teacher,who remained with it throughout the year.In dividing the children into three groups, anattempt was made to achieve some hetero-geneity on the basis of apparent family back-ground and test scores. At the beginning ofthe second year, the children were assignedto different teachers and to different groups,insofar as the latter was possible while stillmaintaining a within-group mixture of chil-dren from different kinds of homes.
In addition to the teachers that led thegroups, there was a Head Teacher and a liai-son ("floating") teacher who rotated amongthe groups as time permitted. Over a hun-dred student aides (undergraduates in child-hood education courses) worked with thechildren in the course of the 2 years. Theseaides seldom were on duty for more than 2consecutive hours, since they had to adjusttheir work in the nursery to their classschedules. Thus there was considerable turn-over in personnel in the course of a day, andthe number of aides present and availablefor direct work with the children variedgreatly throughout the day.
The ratio of teaching staff to childrenshifted throughout the day from a probablehigh of one teacher or aide to two childrento a probable low of one to seven. The av-erage ratio was one teacher or aide to three
26
or four children. For the most part, it wasour impression that the aides gave onlyslight assistance to the teachers, partly be-cause they were there for such short periodsof consecutive time and partly because manyof them did not seem to be at ease with thechildren or to be able to take the initiativein helping the teachers. Thus, the effectiveteacher-child ratio was often closer to oneto eight or more.
The Curriculum
In an effort to obtain a detailed andsystematic report of the nursery school'scurriculum, observations were made and re-corded by the research staff on "daily cur-riculum summary sheets". These sheets weredevised to record the children's activitiesthroughout the day according to eight cate-gories : general play ; structured and circleactivities ; tabletop activities ; outdoor play ;juice or snack ; lunch ; rest period ; and otheractivities. An additional category for "trips"was added to the curriculum summary sheetsin the second year.
These curriculum summary sheetswere filled out in three rounds of observa-tions in the first school year (November1964, March and June 1965) and four roundsin the second year (October 1965, February,June, and July, 1966) . Each round consistedof five successive full-day observations.Hence, in the first year, a total of 15 full-dayobservations were made ; in the second year,19 full-day observations were made. (Thereports from one day were not deemed valid.)
The observers included graduatestudents in the Home Economics Depart-ment of Howard University, and two mem-bers of the research staff. All were trainedby the senior research worker. Prior to thefirst round of observations, interrater agree-ment on the meaning of the categories wasinvestigated and judged to be satisfactory.
In an observation session, each of

three observers focused his attention on oneof the three groups of children during anentire morning or afternoon. Each observerrecorded his group's activities once every 15minutes by making numerical entries on thesheets to indicate the number of children en-gaged in an activity, including such "solo"activities as easel painting, water play, orone-to-one engagements with a teacher. Sincelarge blocks of time were spent in undif-ferentiated "rest" and "outdoor play," pre-cise attention to the specific activities ofchildren was required for only limited por-tions of the day. Nevertheless, the observerswere present and made observations through-out the day, even if this meant, on a 2-hourstretch of time, merely verifying that thechildren were engaged in rest or outdoorplay.
During the second year it was notnecessary to have three observers present ata time, since it had become obvious that theobservations were being made with adequateconsistency and that one observer could coverall three groups.
A shortcoming of the summary sheetwas that it made no provision for recording"transitioning," "idling," or "toileting" be-havior. Anyone who has observed childrenin a nursery school knows that they spend agreat deal of time in such behavior. "Idling"might be regarded as "just doing nothing"or "wasting time" or "fooling around," butit can also be viewed as a necessary kind ofresting or seeking release from temporarystates of tension, boredom, or excitement.
The children in the Project spentmuch time in "idling." During an informalobservation kession in April 1965, a seniorresearch worker noted the following kinds ofsuch behavior within a half-hour's time ; sit-ting on floor, playing with feet ; quietly cry-ing ; squatting, sucking thumb ; staring outof window, rubbing thigh ; twirling ; hop-ping and jumping; running and sliding alongfloor ; swaying against partition ; suckingfingers ; swinging feet ; lying on back undertable and patting knees ; rapidly openingand shutting cabinet door ; licking door knob ;straddling chair on stomach, face down,
sucking fist; shuffling along with back towall, rhythmically bouncing against it withbuttocks.
Since the curriculum summary sheetsdid not provide for a record of such activitiesand since we did not ask observers to notethe times devoted to toileting, dressing, pre-paring (or waiting) to leave, and the like,we do not have an objective record of theamount of time spent in these actions. Arough estimate would be that 15 to 25 per:.cent of the time was spent that way.
An analysis of the recorded observa-tions produced the following percentagebreakdown of the time spent in the kinds ofactivities noted on the curriculum summarysheets :
1964-65 1965-66
General play 14 6Structured and circle
activities 9 7Tabletop activities 11 7Outdoor play 18 24Juice or snack 4 6Lunch 8 6Rest period 34 41Trips 3Other 2
Total 100 100
More specifically, the activities in thefirst three of the above categories were ofthe following kinds :
General play (free or guided) : dolls, largeblocks, hollow blocks, unit blocks, water/soap, wheel toys, carpenter's bench, sand andwater play, easel painting, live animals, smalltoys, other.
Structured and circle activities: storytelling,music, rhythms and dancing, games, cooking,other.
Tabletop activities: cutting and pasting, nail-ing and pounding, crayons or paints, puzzles,
27
finger paint, lotto, beads, small blocks, earthor clay, play dough, looking at books, other.
It will be noted that rest periods con-sumed 34 to 41 percent of the time accountedfor. We do not know how this would com-pare with the usual half-day nursery school'sexperience but it is perhaps not unexpectedin view of the fact that the children were inthe school for 6 or 7 hours a day. The Di-rector's comments on this point give an addi-tional reason for the apparently lengthy restperiods :
During the second year, despite the fact thatthe children had become 4 years old and insome cases were nearing 5, most of the chil-dren continued to takeand seemed to needlong afternoon naps . . . Because of thecrowded home conditions, the rest period atschool was the only time that some of thechildren had beds to themselves in a roomconducive to sleep.
Outdoor play was the next most fre-quent type of activity. Some of this was"structured" play; some of it free play un-der general supervision. Other major ac-tivities (indoor play, storytelling, music, andthe like, and the various tabletop activities)consumed a fifth to a third of the time ac-counted for by the observers' records.
The summary sheets also showed thedaily routine of the school. The following wasthe usual daily schedule :
9:00. Arrival of the first bus, removal ofwraps, and breakfast
9:15 to 10:00. General indoor play or out-door play or tabletop activi-ties
10:00. Arrival of second bus
10:00 to 10'15. Continuation of indoor oroutdoor play
10:15 to 10:25. Juice
10:25 to 10:45. Any of the following: story-telling, games, structured
28
didactic play, music
10:45 to 12:00. General indoor play, table-top activities, or outdoorplay, including a walk if theweather permitted
12:00 to 12:30. Lunch
12:30 to 3:00. Rest (including toileting)
3:00 to 3:15. Tabletop activities, games,music, or general indoorplay
3:15. Departure of first bus
3:15 to 3:45. Outdoor play or, in inclem-ent weather, indoor, listen-ing to stories or music, look-ing at books, etc.
3:45. Departure of second bus
Observation on Content of the Program
The curriculum summary sheets pro-vided a quantitative measure of the approxi-mate amount of time spent in various ac-tivities. Just as important but more difficultto describe objectively is the qualitative con-tent of the program. For this description werelied upon the pooled impressions of the re-search team and the narrative observationsrecorded by the senior researcher.
General play
General indoor play, which occupiedapproximately 14 percent of the time thefirst year and 6 percent the second year, wasusually unstructured, with the teachers in-teracting with individual children or withsmall groups of children, sometimes initiat-ing or guiding play activities, sometimesstepping in to settle disputes. Besides theregular teachers and aides, the Head Teacherwas frequently in the classroom. She often
stimulated the children to dramatic, im-provised small-group play. The followingnotes made by the senior research workeron observations made during a morning inMarch, 1965, reflect varieties of dramaticplay and interactions between the HeadTeacher and individual children
9:40The Head Teacher has entered thearea and proceeds to play with Norma. TheHead Teacher has seated herself in front ofthe doll crib, next to the whopper blocks,and there is some conversation, with theHead Teacher encouraging Norma to "putthe dolls to bed." Norma enters in very ac-tively, brings over a dish as if to feed thechild (or herself).
There is now a bit of confusion, with Gretatrying to get into the episode. There is sometugging at the doll, and an argument, withNorma trying to hit Greta on the head withthe doll. By now, Judith also approaches thissection, tugging away at the kitchen imple-ments, with a spoon sticking in her mouth.in the midst of the confusion, Judith seemsto be able to make off with most of theequipment, and she proceeds very officiouslyto line it up on the table, as, if making aplace setting for a meal, getting ready toserve.
After having interrupted her play withNorma, the Head Teacher returns, takes thesame seat, and Norma approaches her withsome of the kitchen equipment. Sarah (fromanother group) has joined them and is sit-ting on the Head Teacher's lap. Meanwhile,Clara, Greta, and Judith continue to playwith toy implements around the table. Judithis very possessive with the toys, vigorouslydefends anything in her possession, andmakes a gesture of protest against any childwho tries to get equipment away from her.Judith performs an effective simulated stir-ring movement, as if she were preparingfood by mixing it, then pouring it intodishes, then cleaning the dishes off nowvery vigorously removing particles (make-
believe) or scraping off the table with theedge of the spoon.
I now notice one of the rare occasions whenJudith appears to be offering some of thesimulated food to another child, or perhapsinviting her into the setting or party-likeatmosphere.
9:50There is a dress-up episode develop-ing with the Head Teacher, Greta, andNorma. Sarah has become a part of thegroup. Apparently this episode is developinginto doctor play, because I just get the endof a sentence involving the word "doctor"and perhaps "baby." The Head Teacher isusing the toy telephone and talking into it.There has been some hitting between Judithand Virginia. The Head Teacher breaks thisup, saying words to the effect, "If you don'twant her to do that, you can talk; shedoesn't want you to hit her." Judith dis-solves in tears, sits on the floor, and bawlsloudly. The Head Teacher takes her by thehand and leads her away.
The Head Teacher approaches with a toystethoscope and puts it around Judith's neck,but Judith will not be consoled.
The Head Teacher stimulates dramatic playon the doctor theme and asks, "Does any-body want to be a doctor?" Now the stetho-scope is around Greta's neck, and she is mak-ing a primitive effort to examine Virginia.Virginia continues to sit on the Car-Go trikeduring the examination, with a large doll,and now Greta is applying the stethoscopeto the chest of the doll. Meanwhile Judithappears to have regained her composure.There is a steady line of chatter between theHead Teacher and the three children in thisgroup.
The Head Teacher has Sarah on her lap, andGreta is again doing some doctoring. Judith,who is now quiet, is dressing up in a long,fancy sort of white robe and has rejoinedthe group.
9:55The doctor play continues. The Head
29
Teacher has lifted Sarah and put her on achair. Greta wants to examine her but Sarahobjects. Judith is drifting. Donald (at thetable) appears to be working quietly andsteadily at his paper punching.
Renee (from another group) now wandersinto the doctor play, right thumb in mouth,and looks on as if wanting to join in orperhaps is just curious.
Norma has the stethoscope and has put theends in her ears in approved fashion.
A. teacher ushers Renee back to her propersection. The doctor-play group is recon-stituted, and Norma is examining Sarah onthe Head Teacher's lap. Judith wanders off,in her sort of dress-up stance; she has got-ten one of the little black purses, which shecarries on her wrist, and is now busy button-ing up the large white coat, which has manybuttons.
Judith has now been handed a white scrawhat, with a broad red ribbon that goes underthe chin. She is quite a striking figure,dressed ;n white, with a black purse and ahuge ribbon under her chin.
To the above excerpts we must add anexplanatory note : Norma was one of themost backward children in the nursery andone who was very difficult to reach. Next toher brother, she had the lowest initial testscore (Stanford-Binet IQ of 66), a poor at-tendance record, and a slight command oflanguage. If any child in the group deservedthe label "culturally deprived," Norma did.Any success in bringing Norma into closecontact with teachers and into a groupplaysituation involving some use of materials andparticipation in dramatic play must be con-sidered a real achievement, not only for theHead Teacher but for all the teachers andaides who came in contac!: with this child.
Structured and circle activities
These activities (comprising about 9
30
percent of the time recorded observationsmade in the first year and 7 percent in thesecond year) involved story-reading, music,rhythms and dancing, games, puppet shows,cooking, and didactic games. It was obviousfrom the materials used and the proceduresfollowed by the teachers that many of thecircle activities were carefully planned. Oftenspecial flash-cards, cut-outs, illustrations,and the like were used by the teachers andwere worked purposefully into the circle ac-tivities and games, so that these materialsand techniques had the potential of invitinga high level of didactic play. As would beexpected, the children did not always payclose attention or respond as well as wouldhave been desired, so it is difficult to gaugethe impact of these games and play lessons.
It was obvious that, at the start, thechildren were not familiar with books andnot used to being told stories. At first theteachers would just show the pictures inthe storybooks and talk a little about them,relating them to objects familiar to the chil-dren. Gradually the children became inter-ested and wanted to look for themselves, findfamiliar things in the books, and show themto the teacher.
During the second year, when thechildren's attention span had increased andthey were familiar with the process of story-reading and storytelling, their ability andpleasure in listening improved.
Music was another frequent activityin the structured and circle activities cate-gory. Different types of musical activitieswere used, especially by two teachers whohad strong interests in this area. One teacherliked kindergarten-type music, using circlegames and songs, etc. The other was moreinterested in the expressive use of music.For instance, after the children had visitedthe zoo, she would play various musicalthemes and ask the children what animalsthey sounded like. Or she would ask the chil-dren to pretend they were a certain animal,as she played an appropriate musical accom-paniment.

Tabletop activities
These activities, comprising approxi-mately 11 percent of the time the first yearand 7 percent the second year, were gener-ally less structured than the circle activities.There was cutting and pasting, playing withdough, nailing and pounding, working onpuzzles, playing lotto, stringing beads, play-ing with small blocks, or looking at books.The teachers helped the children individu-ally as needed and directed the playing ofgames.
Outdoor play
Outdoor play comprised approxi-mately 18 percent of the time the first yearand 24 percent the second year. The in-crease in the second year was attributablein part to there being more warm weatherand in part to difficulties with the air-con-ditioning system.
This sort of activity involved con-siderably less interaction with teachers thandid indoor play. Occasionally a teacher oraide would organize a game but, for themost part, the play was "free" and involveda good deal of desultory running around.Swings were among the most popular typesof equipment, as were toys that moved, suchas a wagon and tricycles. The sandbox wasanother popular item. The children did notpay as much attention to the various sta-tionary toys, such as the free forms, con-crete turtles, or the jungle gym.
Meals and snacks
The nutritional aspects of the mealswill be described briefly below, under"health maintenance." Here meals andsnacks will be discussed only in their socialcontext.
For the most part, the handling ofchildren during meals was fairly permissive,
`?f
in accordance with the usual practice of goodnursery schools. Reluctant eaters and daw-dlers were encouraged to finish their mealsbefore getting their dessert, and all wereencouraged to try new foods. But when achild was obviously not hungry or did notwant a particular food, the teacher did notpress. The atmosphere during lunch andsnacks was friendly and casual. For the mostpart, the table habits of the children wereorderly and good. Toward the end of thefirst year and during the second year thechildren helped set the tables, hand out thefood, and clean upall of which they seemedto enjoy doing.
Flowers or objects that the childrenhad made were used as center-pieces for thetables and were sometimes used as stimulifor conversation. In general, however, littleeffort was made to encourage talking dur-ing meals or to engage children in conver-sation about food. Relatively little conver-sation was initiated by the children them-selves.
Rest
Rest periods took up a rather largepart of the school dayaccording to our ob-servations, about a third of the time duringthe first year and 40 percent in the secondyear. Rest periods were not necessarily"empty" periods, however, since some of thechildren unburdened themselves at that timeand expressed worries or fears, just as asmall child might speak to his mother beforegoing to sleep at night. The Director's com-ments concerning resting patterns duringthe second year are relevant :
As the children became 4 they were moreaware of family problems and concernedover them. For instance, the room had beendarkened for rest one day. As a little boywas sitting on his cot removing his shoes,he pidred up a doll's pocketbook, opened it,and in a very grownup voice said, "All I'vegot is this 10 dollars. We've got to pay the
31
*).

man the rent, and we've got to have food."
There was great variety in the rest-ing habits of the children. Some fell asleepalmost immediately after lunch ; some wereseemingly overtired and found it difficult torelax. Some had to have an adult by the bed-side. About four children found it difficultto sleep at all. The teachers used their judg-ment as to when these children might leavefor quiet play.
During the second year, two childrenwho had difficulty napping were separatedfrom the others during the rest period. Oneof the teachers engaged in some quiet activ-ity with them at first and then eased theminto sleep, often remaining with them.These were two children with special diffi-culties who came from stressful environ-ments. The Head Teacher used this oppor-tunity to give them the additional supportof an adult's interest and warmth.
Toileting
As a rule, children were free to visitthe toilet at any time during the day. Whena child was in the toilet (a very popularpart of the nursery for most of the chil-dren), supervision was usually provided bya teacher or an aide, and the children wereencouraged not to dawdle and to "finish up."Conversation about toileting and body func-tions was not ordinarily pursued, eventhough broached by a child to a teacher oraide.
Curriculum Changes in the Second Year
There were no gross changes in thenursery program during the second yearbut, within the broad categories of the cur-riculum, changes were made to utilize thechildren's increased attention span, their ad-justment to the school routine, and their
32
ti
more orderly and systematic behavior. Chil-dren were helped to carry through on morecomplicated projects, such as planting beanseedlings in small pots, transplanting themto the garden, and watering and nurturingthem until they bore fruit. They were alsogiven more opportunity to choose their ac-tivities, plan their activities with the teacher,and carry out responsibilities, such as put-ting chairs in a circle, putting away blocks,setting the tables for lunch, etc. There wasan increase in what might be loosely termed"reading readiness" activities, such as list-ing the children's names and us;ng sym-bols to represent the tasks each youngsterhad chosen to be responsible for.
The chief change in the curriculumwas the addition of considerably more fieldtrips. The children went to a post office tomail cards to their parents that they hadprepared at school. They visited the railroadstation, a fire department, a bakery, the Na-tional Zoo, the municipal wharf and marina,a farm, a grocery store, a lumber yard (forthings specifically needed for the work-bench), the University greenhouse, RockCreek Nature Center, the Department ofCommerce aquarium, and the Museum ofHistory and Technology.
One strategically planned "field trip"was the visit to a nursery child's home. Herethe children had their mid-morning snackon the front porch, saw some new puppies,and enjoyed a playhouse. (It was betterthan the real house, the mother said, becauseit didn't leak.) The Head Teacher reportedthat the excursion, as had been hoped, helpedthe rigid and withdrawn child who was thehost to mingle more comfortably with theothers. There were also many "walkingtrips" on or near the University campus tocollect nature-study specimens or to seespecific events, such as the raising of theflag. Some of the mothers, as well as teach-ers and aides, accompanied the children.
Two structural changes which oc-curred toward the end of the second yearwere a shift from eating in three separategroups to one common area (as would oc-
cur in kindergarten) and to using separatetoilet facilities for boys and girls.
Teaching Styles and School Atmosphere
No two teaching styles are exactlyalike, and it is not uncommon for styles todiffer markedly even when teachers workside by side in the same room 'with similarchildren. In the Howard University Nurs-ery School these differences were readilyapparent after a few hours' observation.For example, one of the younger teachersseemed more consistently aware of the needto evoke speech on the part of the children,and more often than the other teacherssought to give words and expressions tochildren and to elicit them during times ofgeneral play. Another teacher was excep-tionally calm with the children. Althoughshe seldom exhibited enthusiasm in her en-gagement of the children in play, she never-theless seemed to "wear well" and to haveexcellent rapport with them. A third teacher,while very well organized and highly skill-ful in managing unruly or disruptive be-havior on the part of the more difficult chil-dren, displayed a somewhat "custodial"style in some aspects of her teaching role.
The overall atmosphere of the nur-sery was permissive and warm. Althoughthe children were handled with firmnesswhen behavior was markedly aggressive andclearly unacceptable to the general welfareof the group, we noted few occasions whenemphatically firm handling on the part ofthe teachers (such as in coping with tan-trums or in physically restraining a childfrom striking another) was needed or used.On no occasion did we see a child managedin a punitive or harsh manner. We observeano outbursts of anger or otherwise undisci-plined behavior on the part of teachers oraides. The Howard University NurserySchool was clearly a benign and pleasantsetting for young children.
Health Maintenance Measures
The children did not have a dailyhealth inspection as in some nursery schools,but the teachers were alert to signs of illness.If a child was sick and it was learned thatthere was somebody at home to care forhim, he was sent home by taxi with an aide.If no one was at home, the child was placedin the isolation room of the nursery, withan aide in attendance. The Universityhealth facilities were available, and emer-gency needs were met by Freedman's Hos-pital, which is adjacent to the University.Parents were urged, and occasionally as-sisted, by staff members to keep clinic ap-pointments for routine "shots" and to com-plete all health requirements for the chil-dren's entrance into kindergarten.
During the 2 years of nursery schoolthere was the usual run of childhood dis-eases (measles, mumps, colds, chickenpox,etc.) and a few instances of contagious di-arrhea, ringworm, impetigo, pinworms, andone case of scarlet fever.
As for meals, after the second weekof the school's first year, a breakfast ofcereal and milk was provided, since it hadbecome apparent to the staff that many ofthe children were coming to school withoutbreakfast. A noon meal was also served,consisting of such items as soup, vegetables,milk, meat, bread, j111o, canned fruit, andpeanut butter and jelly sandwiches. "Snacks"were also provided, as is usual in nurseryschools.
School Attendance
The school year lasted 9 months (Oc-tober through July) the first year, and 10months (September through July) the sec-ond year, yielding a total of 187 school daysthe first year and 205 the second year. Theaverage daily attendance at the school wasabout 75 percent each year. Individual at-
33

tJ
tendance varied greatly, ranging from 26 to95 percent of the time the first year and 9to 95 percent the second year. During bothyears, attendance was highest in the first 2months of the school year and lowest duringDecember and January.
The attendance patterns of individ-ual children that were established the firstyear were, by and large, carried over to thesecond year. Five children were among the"top 10" in attendance both years ; sevenwere in the "bottom 10.; both years. In noinstance did a child in the bottom 10 thefirst year jump to the top 10 the secondyear, or vice versa.
As Table III indicates, there was amoderate relationship between attendanceand SES level. In the first year, a third ofthe children from the highest and middleSES groups, as contrasted with less than 10percent of those from the lowest group, at-tended most regularly. The least frequentattenders were concentrated in the familieswith the lowest SES rating. The picture wasmuch the same in the second year.
The attrition of the nursery groupover the 2 years was remarkably low. In thecourse of that time only two children werewithdrawn from the school. In both cases,the withdrawal was due to the fact that thefamily moved a considerable distance fromthe school, and it was impossible to arrangesuitable transportation for the child. A thirdchild was withdrawn for 3 months in thesecond year in order that she could visit hergrandparents in the West Indies. She wasre-enrolled in the school for the final month.
Teachers' Opinions about ProgramChanges Needed
At the close of the second year (thatis, at the end,,,N f the Project), the Directorand the teache -0 were asked by the researchstaff how they would want to improve the
34
Table III
ATTENDANCE AT NURSERY SCHOOLBY SES QUARTILE
Children'sAttendance
Records
First Year Second Year
SES Level SES Level
Top Middle Leossiwt Top Middle LeTvt
Top 10 at-tenders --- 3 6 1 3
=morrow
Middlegroup --- 5 9 4 3 6 6
Bottom 10attenders - 1 3 6 1 4 5
Total 9 18 11 7 17 11
program if they were to do it over again.The following points were made.
1. Shorten the length of the schoolday. (Although the children had a long restperiod, the teachers had to be with themduring this time. Therefore there was hardlya moment during the day when the teacherscould relax. This situation was amelioratedsomewhat the second year by giving eachteacher a half-day off a week.)
2. Provide more focused, specific, anddirectly supervised training for the studentaides and arrange for them to spend longerconsecutive periods of time in the nursery.(With more adequate help from the aides,the day might not have been so tiring forthe rest of the teaching staff.) Two teacherssuggested that the ideal teacher-pupil ratiofor work with children from low-incomehomes would be one teacher and a full-timetrained aide for every five or six children.
3. Have more meetings for the teach-ers and the adult activities worker, at whichindividual children's progress and difficul-ties can be discussed and feelings about theprogram aired.
4. Provide more manipulative equip-ment, such as peg-boards ; also a petty cashfund, so that purchases of small items canbe made as needed.
5. Provide more floor space. Spacelimitations restricted some activities, suchas water play and easel painting, and alsonecessitated a greater than optimal degreeof regimentation.
6. Secure a more heterogeneous groupof children. Some of the children who wereamong the most verbal at the beginning ofthe program did not seem to make furtherprogress in language development. Perhapsthey would have benefited more if they hadhad the stimulus of talkative, middle-classchildren.
It was the opinion of the researchstaff that all of the above points were valid.Points 1 and 2 reflect the teachers' expressed
regret that they did not have enough timeand energy to give as much individual at-tention and help with language developmentas they would have liked. Although the pro-gram was much like that of good, tradi-tional-type nursery schools, there was lessconversation with individual childrenlesssupporting or initiating of conversationsthan one would usually find in a universitylaboratory preschool that serves middle-classchildren or in a superior suburban pre-school. The explanation may lie in theamount of attention to other aspects of theprogram that work with deprived childrenentails. However that may be, it seems likelythat the teachers were right in thinking thatmore attention to language development wasneeded, for even at the end of the 2 yearsthe children seemed to have less verbalknowledge and facility than comparablemiddle-class children.
35
VI. THE ADULT ACTIVITIES PROGRAM
ALMOST WITHOUT EXCEPTION,sponsors of preschool programs for low-income children stipulate that close coopera-tion with parents is important, if not essen-tial, to successful work with children." It israre to encounter an effort in the field ofearly childhood education, especially if theclient population is predominantly of lowincome, that does not make some provisionfor involving parents in the service.
The ways of involving parents dif-fer. Sometimes the parents are joint part-ners in the day-to-day educational work ofthe preschool, being employed as full orpart-time teachers. Sometimes the par-ents are given traditional parent-educationcourses. They are invited to attend lecturesor to enroll in discussion groups dealingwith such topics as methods of discipline,the father's role, feeding problems, sex edu-cation, and the like. Sometimes the parentsare invited to join a parent-teacher associa-tion. Whatever the means, the minimal goalof parent involvement is to secure thefriendly cooperation of the parents with thestaff of the nursery school.
24 For varied expressions of this view, see among othersthe following: Benjamin Bloom, Allison Davis, and RobertHess, op. cit. Training Home Economics Program Assistantsto Work with Low-Income Families, No. PA-681, U.S.Department of Agriculture, Federal Extension Service, U.S.Government Printing Office, Washington, D.C., November1965; Services for Families Living in Public Housing, U.S.Department of Health, Education, and Welfare, and U.S.Housing and Home Finance Agency, U.S. Government Print-ing Office, Washington, D.C., July, 1963; and Louise ProehlShoemaker, Parent and Family Life Education for Low-IncomeFamilies, Children's Bureau Pub. No. 434, U.S. GovernmentPrinting Office, Washington, D.C., 1965.
36
As has been said, the Howard Uni-versity Preschool Project had a parent-involvement program that was carried onunder the heading of "adult activities."Briefly stated, the objectives were:
1. To secure the cooperation of par-ents or parent substitutes in supporting andreinforcing the efforts of the teachers so asto promote the general intellectual and so-cial growth of the children.
2. To support and reinforce thenursery-school experiences of the childrenby activities in their own homes.
A widely held view among practition-ers and program planners is that parent ed-ucation for low-income families is morepromising when it is organized around ac-tivity programs rather than discussiongroups or lectures.25 This was accepted as aguiding principle in setting up adult activi-ties in the Howard Project.
in planning this program it was de-cided to avoid the term parent education andto treat the parents, despite anticipatedhandicaps and limitations, as competentpartners in the nursery school endeavor.They would be invited to join with the staffin working for the present and future wel-fare of their children. It was not expectedthat the parents' chief aim would be their
25 Ivor Kraft and Catherine S. Chilman, Helping Low-Income Families Through Parent Education: A Survey ofResearch, Children's Bureau, Department of Health, Educa-tion, and Welfare. 1966.

1.
if
own improvement, such as acquiring abstractknowledge of child behavior or securing sat-isfaction from working with experts and re-ceiving approval from them. Rather, it washoped that they would enter into the activi-ties in order to improve the lot of their chil-dren and to help the school to help the chil-dren. In other words, the appeal would notbe "You need our help to become better par-ents" but rather "We need your help in do-ing a good job with your children." It wasin line with this approach that the staffmembers chiefly responsible for contactswith the families were called adult workersrather than parent educators.
There were two adult workers on theProject staffone full time and the otherpart time. The chief worker had been trainedin social work ; the other was a youngteacher who, among other duties, regularlyescorted the children to and from school inthe bus the school provided.
The professional style of the chiefworker was warm and pleasant, and her ap-pearance and manner were decidedly upper-middle class. There can be :tittle doubt thatshe was accepted and respected by mostfamilies in the Project. A year after thechildren had completed nursery school, themothers still spoke of her with warm admi-ration and enthusiasm.
The assistant adult worker was lessexperienced than her chief in public rela-tions or social-work types of activities. Hermanner, however, was very pleasant. Shewas well liked by the parents and had afriendly, engaging style in dealing withthem.
During the first 2 months of the firstyear, one of the senior research workerstook part in the group meetings with par-ents, group work being one of his profes-sional competencies. Playing this double roleof researcher and practitioner did not proveto be feasible, however, and was soonabandoned.
The adult activities that were carriedon were of two types : group meetings orother activities at prearranged times, and
individual contacts with families, sometimesby appointment but usually unscheduled.
The Group Meetings
Prior to the opening of school, anorientation meeting for parents was held,with 22 of them in attendance. The HeadTeacher described the nursery school pro-gram, and the parents were requested tohelp with special projects. The parents se-lected Wednesday afternoons and Saturdaymornings as the most convenient days forfuture meetings, though it was clear that noone time would suit all parents. Eveningmeetings were seldom held, being inconven-ient for most of the parents.
During the first school year, 49 groupmeetings were held, including the usualweekly meetings which involved the activityprojects. This figure included special tripsand parties.
The Howard University Departmentof Home Economics provided ample spaceand equipment for the adult activities pro-gram. Parents occasionally commented onthe pleasantness of the surroundings. Fromtime to time special transportation arrange-ments were made for parents who had diffi-culty in getting to and from meetings, al-though this was not done routinely.
Parents were encouraged to bringtheir children to the group meetings, andarrangements were consistently made toprovide special supervision for the children.The supervisor was usually a graduate stu-dent in the Howard University Departmentof Home Economics. When a large numberof children attended, more than one suchassistant was employed. The children werepermitted to play with the toys, stories wereread to them, light snacks were furnished,and organized games and play activitieswere encouraged.
A typical group meeting lasted 2hours or more. It usually included a series
37

of activity projects and a visit to the nurserypremises to see the latest work of the chil-dren or to watch the children from the ob-servation booth. A staff member was presentto answer parents' questions and to explainwhat was going on in the nursery school.At the conclusion of each meeting, punch orcoffee and cookies were served. Occasionallythere was a brief talk by the adult workeror other staff member concerning some as-pect of the nursery program. Once each yeara film on child development was shown,followed by a discussion led by the HeadTeacher.
During the group meetings there wasusually spontaneous discussion and conver-sation among the parents, centering mainlyon their children, especially those who wereattending the nursery school. The parentsoften volunteered information about prog-ress and improvement in the children's be-havior, frequently attributing this to thebeneficial influence of the school. They werealso quite free in discussing their children'sproblems, such as enuresis, temper tantrums,finicky Lod habits, or difficulties with sib-lings. Other problems, such as shopping,job training, and family planning, were alsooccasionally brought up by the parents. Themothers would often give suggestions to oneanother, and staff members gave specific ad-vice on rearing children.
The following kinds of activities wereundertaken d. ring the first year's meetings :making washcloths, sewing smocks, paint-ing nests of tin cans, making lotto games,unpacking and sorting books, decoratingwastebaskets, making doll clothing, ironingsheets, fashioning decorations for Easterand Christmas parties, preparing dessertsfor the nursery school, mending children'sclothing, fingerpainting, making book ends,planting flowers, preparing skirts for use inthe children's dramatic play, keeping ascrapbook of parent activities, sanding andpainting equipment for the playground.Parents were encouraged to borrow booksand games from the school for use at home.Fathers were helpful in assembling and re-
38
pairing toys and painting outdoor equip-ment.
In lieu of the meetings at HowardUniversity, there were occasional meetingsin the neighborhood to accommodate theparents who might be able to attend a meet-ing close to their home but who could notcome to Howard University. (Although theuniversity was within walking distance forsome parents, it involved a bus ride of 10 or20 minutes for others.) Several 'mothersvolunteered or were asked to hold meetingsin their homes ; they seemed to take pridein doing so. Sometimes two mothers sharedthe responsibility for serving refreshments.
Beside these weekly meetings, several"special activities" were planned. In the firstyear these consisted of the following:
1. The library project. A visit was made tothe main branch of the Washington, D.C.,public library that was located in theneighborhood where most of the parentsin the project lived. A special story dem-onstration was conducted by the chil-dren' librarian, and the mothers filledout forms for library cards. The Exten-sion Division of the public library pro-vided a book service that enabled parentsto borrow books for their children.
2. Consumer exhibit. On one Wednesdaythe mothers attended a fashion show ata suburban shopping center. Childrenfrom that area modeled clothing madeby their parents.
3. Christmas party. Mothers, fathers, andsiblings attended this festive occasion,where there was group singing, and aChristmas program was presented by thenursery children.
4. Easter party. The children presented aprogram, and the new playground wasofficially opened.
5. White House tour. This popular trip wassuggested by the mother5.
6. Family night. This was the culminatingand most successful activity of the year,

held late in July. Parents contributed tothe picnic-type supper, helped with thefood preparation, serving, and cleaningup. One father led the group singing.On a tour of the nursery school the par-ents saw the art work of their childrenexhibited, as well as items made by par-ents for the school and the scrapbook ofparent activities.
7. Family exchange. Parents contributedbooks and outgrown clothing to otherchildren in the Project who could usethem. Some of the clothing was receivedfrom friends of the university and wasdistributed to children in the neighbor-hood, not necessarily connected with theProject. This process of sharing and help-ing each other seemed quite importantto the mothers.
Apart from the group meetings, somemothers also assisted in the nursery schoolprogram. They were not employed on aregular basis as aides or helpers but occa-sionally certain parents were invited to helpin serving meals, helping to toilet childrenand prepare them for their naps, storingcots after naps, and reading to the children.Parents also acted as chaperons or assist-ants when the children went on "trips."
At the beginning of the second schoolyear, a committee selected by the mothersmet with the adult worker to decide whattype of adult activities would be most de-sirable during the second year. It was de-cided that there should be fewer group meet-ings and that more emphasis should beplaced on the policy of encouraging parentsto visit the school individually, talk withthe teachers, and assist in the nursery school.As a result, 23 group meetings (less thanhalf the number that were scheduled theprevious year) were held in 1965-66.
The meetings in the second year wereof the same general sort as those held pre-viously. Three meetings were devoted toplanning and discussing the adult activitiesprogram. They were combined with someother activity such as unpacking and sorting
books, making cookies, and repairing toys.Five meetings were devoted to sewing.(Some mothers had specifically asked forassistance in making children's clothes outof discarded dresses. A graduate student inhome economics helped them with this proj-ect, which included instruction and practicein using an electric sewing machine.) Onemeeting focused on a parent-staff discus-sion on how the 4-year-old behaves. Severalmeetings were devoted to making Christmasand Easter decorat:9ns and to compiling acookbook of low-cost, nutritious recipes. Twoneighborhood meetings were held, one ofwhich involved group singing and playingof games. The rest of the meetings centeredon trips to the public library, the Smith-sonian Institution, and a department store atChristmastime and to parties for Christmas,Easter, and Family Night.
Attendance at group meetings
As might be expected, the attendancewas largest at the "special occasion" meet-ings, such as the orientation meeting at thebeginning of the first school year, when 21mothers, one father, and two relatives at-tended, representing 24 of the 36 families.The Christmas parties were attended by 15to 20 parents and 8 to 10 siblings. TheEaster parties were almost as well attended.On Family Night, which was the most "gala"occasion, over 20 parents were present (in-cluding six fathers the -first year, and fivethe second year) plus about 15 siblings andseveral relatives.
At the other group meetings, attend-ance ranged from one to eight parents persession both years, with an average attend-ance of four. There was little shift in at-tendance patterns between 1964 and 1966.The same 11 families accounted for three-fourths of the total attendance at groupmeetings in 1964-65 and about two-thirds ofthose in 1965-66.
The main difference in attendancepatterns between the 2 years was that in the
39
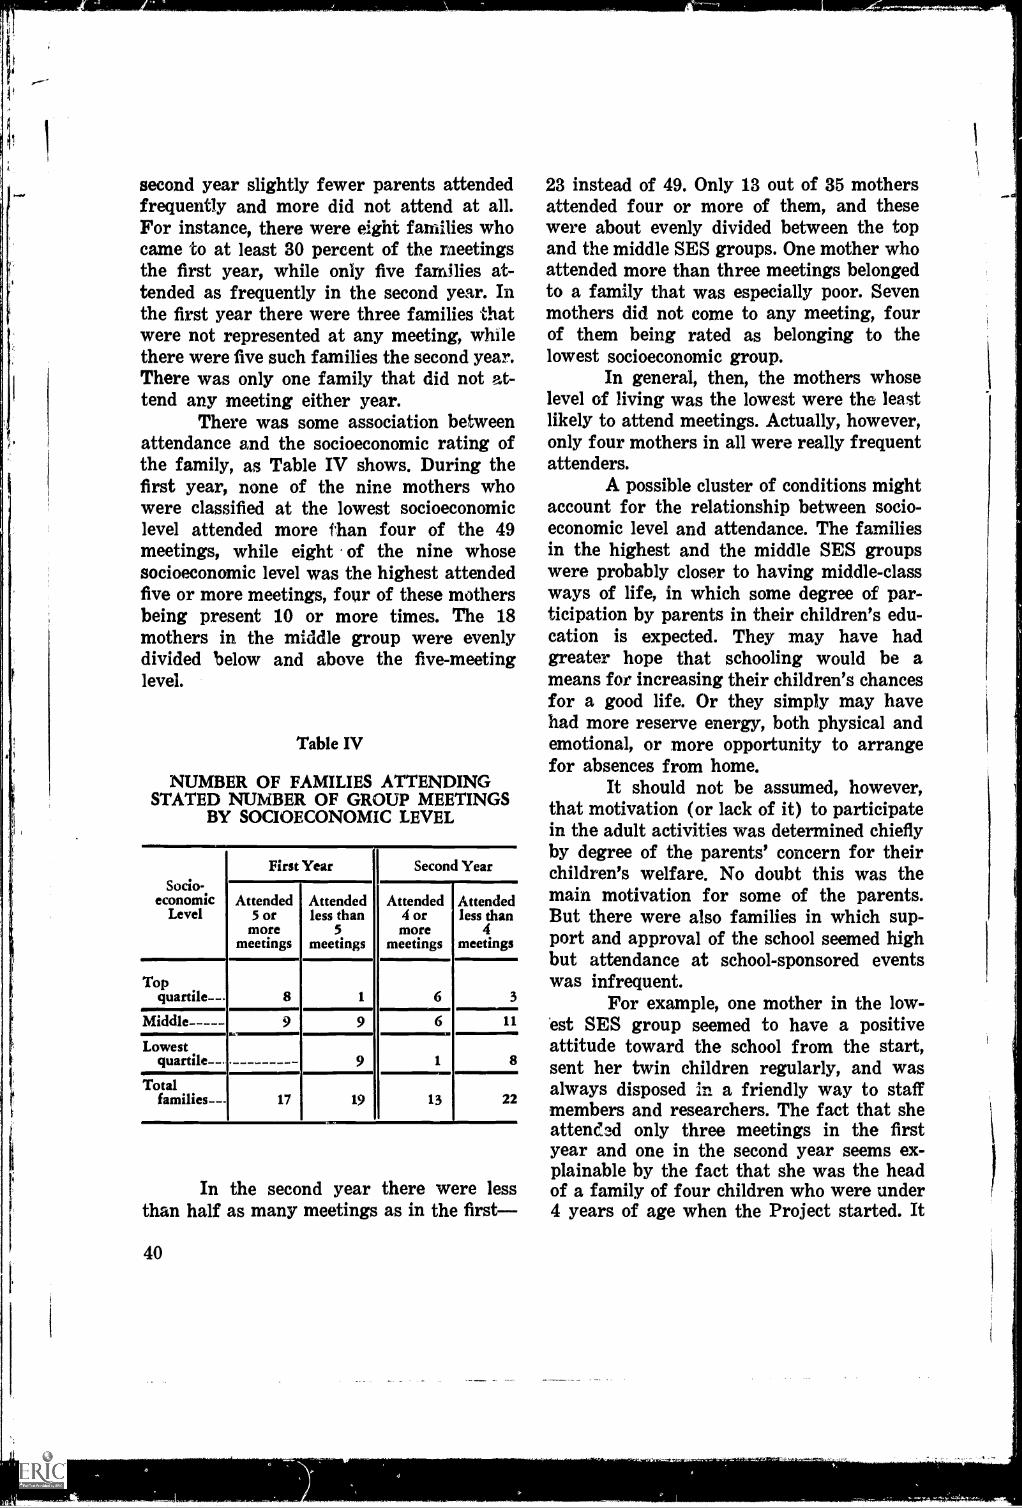
second year slightly fewer parents attendedfrequently and more did not attend at all.For instance, there were eight families whocame to at least 30 percent of the meetingsthe first year, while only five families at-tended as frequently in the second year. Inthe first year there were three families thatwere not represented at any meeting, whilethere were five such families the second year.There was only one family that did not at-tend any meeting either year.
There was some association betweenattendance and the socioeconomic rating ofthe family, as Table IV shows. During thefirst year, none of the nine mothers whowere classified at the lowest socioeconomiclevel attended more than four of the 49meetings, while eight of the nine whosesocioeconomic level was the highest attendedfive or more meetings, four of these mothersbeing present 10 or more times. The 18mothers in the middle group were evenlydivided below and above the five-meetinglevel.
Table IV
NUMBER OF FAMILIES ATTENDINGSTATED NUMBER OF GROUP MEETINGS
BY SOCIOECONOMIC LEVEL
Socio-economic
Level
First Year Second Year
Attended5 or
moremeetings
Attendedless than
5meetings
Attended4 ormore
meetings
Attendedless than
4meetings
Topquartile- -. 8 1 G 3
Middle 9 9 G 11
Lowestquartile-
.9 1 8
Totalfamilies--- 17 19 13 22
In the second year there were lessthan half as many meetings as in the first-
40
23 instead of 49. Only 13 out of 35 mothersattended four or more of them, and thesewere about evenly divided between the topand the middle SES groups. One mother whoattended more than three meetings belongedto a family that was especially poor. Sevenmothers did not come to any meeting, fourof them being rated as belonging to thelowest socioeconomic group.
In general, then, the mothers whoselevel of living was the lowest were the leastlikely to attend meetings. Actually, however,only four mothers in all were really frequentattenders.
A possible cluster of conditions mightaccount for the relationship between socio-economic level and attendance. The familiesin the highest and the middle SES groupswere probably closer to having middle-classways of life, in which some degree of par-ticipation by parents in their children's edu-cation is expected. They may have hadgreater hope that schooling would be ameans for increasing their children's chancesfor a good life. Or they simply may havehad more reserve energy, both physical andemotional, or more opportunity to arrangefor absences from home.
It should not be assumed, however,that motivation (or lack of it) to participatein the adult activities was determined chieflyby degree of the parents' concern for theirchildren's welfare. No doubt this was themain motivation for some of the parents.But there were also families in which sup-port and approval of the school seemed highbut attendance at school-sponsored eventswas infrequent.
For example, one mother in the low-est SES group seemed to have a positiveattitude toward the school from the start,sent her twin children regularly, and wasalways disposed in a friendly way to staffmembers and researchers. The fact that sheattended only three meetings in the firstyear and one in the second year seems ex-plainable by the fact that she was the headof a family of four children who were under4 years of age when the Project started. It
0
took considerable effort on her part to cometo even four meetings.
Actually, evidences of hostility orlack of amiability in dealing with the nurs-ery school staff were extremely rare. Almostinvariably, parents were cordial and pleas-ant when visited or telephoned by staffmembers and research workers. They re-peatedly expressed regret at not being ableto take a more active part in the activitiessupportive of the school.
In the exceptional cases in whichthere was reluctance or unwillingness tocooperate with the school, we suspect thatit had more to do with psychological or so-cial problems in the life of the parents thanwith indifference or hostility toward theProject. For example, one mother gave theappearance of being a seriously depressedwoman. Often she could not mobilize enoughenergy to have her child ready when theschool bus arrived. After numerous warmand cajoling invitations by the adult worker,this mother did manage to attend four meet-ings during the first year. She seemed toenjoy the meetings she did attend.
There were a few other familieswhose apathy and general disorganizationwere reflected in poor attendance at groupmeetings. For the most part, however, theidea that low-income families are indiffer-ent or even hostile to schools was not sub-stantiated by the experience of the HowardProject. From the outset, most parents werehighly sympathetic to the nursery school andproud to have their children enrolled in it.
Attendance of fathers
Parent education programs for low-income families have not usually been suc-cessful in securing the cooperation of fa-thers. In comparAson with other programs,the Howard Project did not do poorly inthis respect. To be sure, it was usually themother who attended group meetings, whichby and large were held during the day.However, there were two fathers who at-
tended meetings although their wives didnot. Both of these fathers were classified asbelonging to the middle SES group.
Turning to more typical situations,we find that during the first school year 12fathers came to at least one group meeting.The maximum number of meetings attendedby any one father was four. Most fatherswho attended at all came only once or twice.During the second year, 11 fathers attendedat least one group meeting; four of thesewere fathers who had not attended anymeetings the first year. As to SES level,only fathers from the highest and the mid-dle SES groups attended the first year, butin the second year, three of the seven fa-thers in the lowest group came to at leastone meeting.
Some fathers participated, however,in other ways. Some visited school on theirday off from work. Some helped repair toysand paint the playground equipment. Twocame to school for the first few days of thefirst school year, when their children werehaving separation problems. Several pro-vided transportation for other parents to"special occasion" meetings. One went on theWhite House tour; one supervised the chil-dren's play at an Easter party ; one led thesinging at several group meetings. The fewfathers who attended discussion meetingsjoined in the discussion and made pertinentcomments about their children.
In both years combined, 18 of the 28fathers or father-substitutes came to groupmeetings at the school or visited the school.The maximum number of meetings attendedby any one man was eight. One father at-tended five meetings, and two attended fourtimes. All of these relatively frequent at-tenders were in the highest SES group.
Individual Contacts
Besides the group meetings, the otherintegral part of the adult activities program
41
1
was what we have called "individual con-tacts." These, typically, were unscheduledbut involved more than incidental or trivialremarks or conversations. All staff memberswho had dealings with parents or relativeswere asked to report these contacts on aspecial form, giving the date, time, place,and circumstances, as well as a two-or-three-sentence description of what took place.These records were apparently preparedregularly, usually by the adult workers. Themajority of these individual contacts wereinitiated by the school. Most of them had todo with giving information, making inquir-ies about the children or their families, orrequesting specific assistance from a parent.
The parent-initiated individual con-tacts generally involved giving informationabout the child and/or family, observationalvisits to the school, offers to help the schoolin some way, or expression of regret for notbeing able to attend a meeting.
There was a decided increase in thenumber of individual contacts in the secondyear, the total number increasing from 322in the first school year to 583 in the second.This was in part a reflection of the decisionby staff and parents to decrease the numberof group meetings and put more emphasison the school's open-door policy, wherebyparents were encouraged to drop in 'when-ever they could.
In the second school year the parentswere more apt to take the initiative in sup-plying the school with information about thechildren or themselves. Conversely, the ,staffmade more inquiries about the families thanabout the children. This may indicate thatby the second year the staff had becomewell acquainted with the families as families,not just as parents of the nursery-schoolchildren.
Another interesting shift in the pat-tern of individual contacts in 1966 was theincreased number of instances in which par-ents offered to assist the school in some way.These offers frequently resulted in a 'mother,a sibling, or some other relative assistingin the nursery school classroom or in the
42
adult activities workroom. Thirteen mothers,one sibling, and one aunt helped in the class-room during the second school year.
Examples of some of the reasons forindividual contacts were enumerated by theadult worker as follows :
Discussion of financial problems
Help with carfare or transportation arrange-ments
Provision,. of clothing for needy children andother family matters
Discussion about problems in child rearing
Referrals to agencies for health problems
Visiting families during times of illness,both at home and in the hospital
Discussion of family problems, such as con-flict between parents
Discussion of school problems of siblings
The families whose socioeconomicrating was the highest initiated proportion-ately more individual contacts in both yearsthan did the other two SES groups. Con-versely, the lowest SES group initiated thefewest individual contacts. There was, how-ever, some increase in the number of parent-initiated contacts by the middle SES groupin the second year. Moreover, in all groupsthe total number of families that initiatedcontacts increased during the second schoolyear.
An entirely different picture is pre-sented when school-initiated contacts are re-lated to SES level. In both years a largerproportion of the lowest SES families thanof highest SES families were contacted fre-quently by the school. This reflects the morefrequent problems in the former group.
For instance, the family that receivedthe highest number (21) of school-initiatedcontacts the first year and the second high-est (15) the second year was one of theneediest families in the project. The childwas definitely undernourished, and the

teachers reported that during the first yearof nursery school he ate ravenously. Duringa period when the father was in jail, thefamily was often without food. School con-tacts with this family involved discussionsof job training for the mother and effortsto secure food stamps and welfare assist-ance. Considerable time was also spent intaking the child back and forth to a clinic.
Another low SiS family had few in-dividual contacts with the school during thefirst year but received the largest number inthe second year. This large increase was duechiefly to a prolonged crisis involving thechildren's health. Following hospitalization,the family had great difficulty in securingclearance from the health department forthe children's return to school. The familyproblems were further complicated by thefact that another child in the family be-came seriously ill and, in a family alterca-tion, the mother shot her husband in theleg. This combination of difficulties led theadult worker to assist in getting the twinsto the clinic and securing their clearance forreturn to school.
Impressionistic Evaluation of AdultActivities Program
The research plan did not call for asystematic evaluation of the adult-activitiesprogram but some of the impressions of theresearch staff may be worth communicating.
In our view the Project was reason-ably successful in attaining the adult-activi-ties program's first goalcooperation of theparents. The relationship between staff andparents was excellent, and the parents wereclearly pleased to have the children enrolledin the school. To what extent the goodparent-staff relationship was due to the in-dividual contacts, the group meetings, or thefestive-occasion parties at the school, or toa combination of all three types of activitiescannot be determined. The decision to have
fewer group meetings the second year andthe increased responsibility that the parentstook the second year in contacting the schoolsuggest that individual contacts, participa-tion in the nursery school, plus the fewactivity-oriented projects that the mothersthemselves suggested (e.g., the sewing proj-ect) and the usual holiday celebrations atschool were a more successful combinationof activities than trying to have a groupmeeting every week.
It should be pointed out, however,that the routine group meetings, althoughnot usually well attended, seemed to have agood deal of significance for about a fourthof the mothers. At the end of the secondyear, the mothers were asked at two meet-ings to respond to the question : "What hasthe Program for Children and Parentsmeant to me?" Although their replies mayhave a testimonial tinge, they are suggestiveof benefits derived from nursery attendancethat go beyond the IQ changes thrt arereported in the next chapter.
By discussing problems your child has, youfind that other parents have the same prob-lems with their children . . . that the 3 and4 year old child wants to do things for him-self without much help from parents . . . .
Children learn how to meet others . . theylearn to share. Cindy was shy and selfishbefore coming to the nursery school. Shetalks now and is not selfish. I have enjoyedmeeting the other parents and working withthem. I did not know any of them beforethe program started.
Andrew is a better child now and is inter-ested in more things. He is friendly andplays better with other children. I enjoyedthe sewing project and the family night.Above all, I enjoyed observing the childrento see how they act and what they weredoing in school. Having Mrs. T [theHead Teacher) explain the activities to par-ents was very helpful. I like the discussions.
43
They have helped me to understand theother children better.
Abigail gets along better now with herbrothers and sisters and the other childrenin the neighborhood . . . The average per-son thinks the child is afraid of the teacherwhen she starts to school, but she is actuallyafraid of the other children . . . I appreciateeverything the nursery school has done andI'll miss it. I'll miss the parents and theactivities.
I have enjoyed working with the childrenin the nursery school . . . I think I get abetter understanding of my own childrenfrom working with the nursery school chil-dren . . . I have met more people since Istarted working with the parent group. Ihad lived in that neighborhood and hadnot met anyone . . . After I started comingto the school I met many people.
I have enjoyed meeting the parents and theteachers. I like to come up to school. I likethe trips, especially to the library.
The nursery school has helped Teresa tothink. Her conversations now make sense.She can make decisions . . . She shares morenow and is not as selfish.
Prudence talks more. She has more opin-ions of her own . . . I like this nurseryschool because the children get more indi-vidual attention. . . .
Vernon did not like milk before he cameto the nursery school . . . He eats foods hedidn't like before he came to nursery school. . . He likes other children and isn't shywith strangers.
Jerome has learned so much . . . He knows
44
the names of so many objects . . . One ofthe things I enjoyed so much was the Fam-ily Night we had last summer.
I was surprised at the progress Donald madein the nursery school. He has learned to getalong with other childrennot only thenursery-school children. I feel that one ofthe biggest mistakes parents make is tryingto push their children too fast. I enjoyedthe family night and meeting all the par-ents and the teachers. I like the idea ofholding the meeting in the nursery schooltoday. We can see where the children goto school and see the work done by all ofthem. (Comment by a father.)
All of the above comments 'weremade by parents who were in either thehighest or the middle SES group. We do notknow whether the meetings could have beenmade more meaningful for the lowest SESfamilies or whether their burden of routineliving was so heavy that they would nothave attended many meetings, regardlecsof content. It is obvious from the recordsthat a feeling of sharing and camaraderiedeveloped among the mothers who attendedfairly frequently. This may have contributedto their cooperative spirit toward the schoolprograms and the staff.
To what extent did the adult activi-ties program fulfill its second goal, that ofreinforcing the nursery school experience inthe home? Unfortunately we have no basisfor answering that question. It is true thatbooks and games were borrowed and takenhome but we do not know the extent towhich they were used. As will be shownlater, there was no relationship betweenparents' participation and the extent oftheir children's increase in IQ. However, itis possible that the adult activity programmay have sparked interest and knowledgethat will bear fruit in future years.
Although shifts in child-rearing at-titudes and practices were not an explicitgoal of the adult activities program, the
staff felt a sense of accomplishment whenthey noticed that the relations between par-ents and children apparently became hap-pier and more relaxed. In summarizing herreport of the last group meeting, the HeadTeacher commented : "From a teacher'spoint of view, the acceptance and apparentenjoyment of their children was a far cryfrom the harsh authoritarian attitude ofthese parents during the initial play sessionsin 1964." It would be difficult to determinewhether this represents a true shift in pa-rental attitudes or whether it was a reflec-tion of the situation. At this final meetingthe parents were "among friends," while 2years previously they did not know eachother and the staff, and they also probablyrealized that the play sessions were actuallytests.
One further comment about the adultactivities program. In practice it was moredidactic and less a meeting of "partners"than it was in theory. One could see that, toa large extent, the parents looked on thestaff as experts and expected them to im-part their knowledge. The staff were crea-tive in using spur-of-the-moment situationsto "slide in" certain child-rearing preceptswhile talking with the parents. For instance,whenever a mother observed her child fromthe observation booth, a teacher was avail-able to interpret what was going on, toanswer questions, and to explain why a par-ticular behavior problem was handled in acertain way. Perhaps this approach wasnecessary and was highly desirable. It wasnot, however, quite the way of relating toparents that had been decided on at thestart.
45
VII. TEST FINDINGS AND ASSOCIATED FACTORS*
WITH THE NURSERY SCHOOLand adult-activities program described andthe characteristics of the children and theirfamilies identified, we are now in a posnionto consider the Project's accomplishments.At present writing, this report on accom-plishments must be limited to telling howmuch the nursery school children's intellec-tual functioning improved during the 2years in nursery school, as contrasted withthe children who did not attend. Eventu-ally, we shall want to know whether theimprovement that was achieved carried overinto the later school years and whether thenursery school children did better than thecomparison group in elementary school. Atpresent, however, we can gain some indica-tion of whether or not the nursery schoolprogram helped the youngsters to acquirecertain skills that should stand them ingood stead when they enter regular school.Such basic achievement-related skills as lan-guage usage, perceptual discrimination, con-cept formation, sensorimotor coordination,comprehension of verbal directions, memoryand number skills can be measuredalbeitimperfectlyby standardized tests. The re-sults of such tests provide a means of evalu-ating some of the short-term benefits of theProject.
The Tests
For measuring the children's skills,the following tests were used : the Stanford-Binet Intelligence Scale, the Peabody Picture
46
Vocabulary Test, and certain subtests in-cluded in the Merrill-Palmer Scale and inthe Illinois Test of Psycholinguistic Abilities.
Several decades ago psychologistswould have questioned the desirability ofusing intelligence tests, such as the Stanford-Binet and the Merrill-Palmer, to measuredifferences between groups in the acquisi-tion of "achievement-related skills." In thefirst part of the 20th century, many psy-chologists viewed intelligence as geneticallyfixed and unresponsive to an individual'smotivation or to his prior educational andcultural experience. The shift from thisdeterministic point of view to one that seesan individual's manifest intelligence as acomplex interaction between genetically de-termined potentialities and the individual'sencounter with his environment has beenadmirably summarized by Stott and Ball."The influence of motivational and environ-mental factors on intelligence test scores andthe cultural bias of tests in favor of middle-class children are now well documented.27
20 L. Stott and R. Ball, Infant and Preschool Mental Tests:Review and Evaluation, Monograph of the Society for Re-search in Child Development, No. 101, 1965.
27 See A. Anastasi, "Racial Comparisons: Problems ofMeasurement" in Differential Psychology (3rd Ed.), Macmil-lan, 1958 ; M. Deutsch, J. A. Fishman, L. Kogan, R. North,and M. Whitman, "Guidelines for Testing Minority GroupChildren," Journal of Social Issues, April 1964, pp. 129-145;Kennedy, op, cit.; M. G. Kline, J. Marshall, and E. Stansbury,Stanford-Binet, PPVT, and Low-Income Preschoolers: NewPitfalls for Old Tests, a paper read at the Annual Meeting ofthe Eastern Psychological Association, April 14-16, 1966 ;R. Dreger and K. Miller, "Comparative Psychological' Studiesof Negroes and Whites in the United States," PsychologicalBulletin, 1960, pp. 361-402.
* This chapter was written in part by Eileen Toban, Re-search Associate, while a member of the Children's Bureaustaff.
"Culturally disadvantaged" childrenoften bring to the testing situation a vari-ety of handicaps; e.g., home backgroundsoffering minimal intellectual stimulation,low motivation for test performance, unfa-miliarity with test objects, a wide range ofpersonality problems, and fear or hostilitytoward examiners. The "unfairness" of giv-ing intelligence tests to such children neednot overly concern us here, however, pro-viding we recognize that the scores fromthese tests do not give a valid measure ofthe learning capacity of the children butrather provide an indication of where theseyoungsters stand in relation to the more ad-vantaged groups upon whom the tests werestandardized. As Deutsch points out, " 'Cul-turally unfair' tests may be valid predictorsof culturally unfair but nevertheless highlyimportant criteria. Educational attainment,to the degree that it reflects social inequityrather than intrinsic merit, might also beconsidered 'culturally unfair.' "28
The Stanford-Binet Intelligence Scale(1960 revision)
This test was chosen for use in theHoward Project because it is one of the bestconstructed and best standardized tests ofintelligence available. The test was stand-ardized on over 3,000 white, native-bornAmericans from 11 States in different partsof the country. A wide range of social andage levels was represented in the standard-ized sample, although the distribution wasslightly weighted in favor of the higher oc-cupational levels."
In developing the Stanford-Binet,Terman and Merrill tried to provide amethod of obtaining "a general knowledgeof the capacities of a subject by the sinkingof shafts at critical points." 30 At the 2-to 6-year level, the test items involve a variety
28 M. Deutsch, op. cit.
99 L. M. Terman and M. A. Merrill, Stan ford -Binet Intern-Bence Scale, Houghton-Mifflin Co., 1960, p. 15.
of skills, such as ihe identification of every-day objects and parts of the body, recogni-tion of similarities and differences in ob-jects, comprehension of simple commands,memory for digits, sentences, and pictures,as well as a variety of hand-eye coordina-tion tasks, such as stringing beads, using aform board, block building, and copying acircle. Whether such a variety of tasks meas-ures a general factor common to all agelevels of the scale, as some factorial analy-ses suggest,31 or whether the relations amongthe items can be explained most satisfactor-ily in terms of group factors, each contribut-ing to the subject's total IQ, is still open todebate."
Of crucial importance to our studyare the reliability and validity of the Stan-ford-Binet at the preschool level. The Stan-ford-Binet tends to be more reliable for thelower than the higher IQ's and for olderthan younger children.33 Even so, the reli-ability of the Stanford-Binet at the preschoollevels is quite satisfactory. A correlation of.88 between alternate forms of the Stanford-Binet for children under age 6 is reported,"and test-retest scores between 3 and 4 havebeen found to have a correlation of .83."
For many years, the Stanford-Binethas been regarded as the standard criterion,among psychological tests, for predictingacademic achievement, particularly at theelementary awl high school levels." Mostof the correlations between Stanford-BinetIQ scores and school grades, teachers' rat-
" L. M. Terman and M. A. Merrill, Measuring Intelligente,Houghton-Mifflin Co,, 1937.
31 See, for instance, Q. McNemar, The Revision of theStan ford -Binet Scale, Houghton-Mifflin, 1942 ; Frank Free-man, Theory and Practice of Psychological Testing, Holt,Rinehart, and Winston, 1962.
92 L. V. Jones, "A Factor Analysis of the Stanford-Binet atFour Age Levels," Psychometrika, Vol. 14, 1949, pp. 299-332.
33 A. Anastasi, Psychological Testing, Macmillan Co., 1961,p. 202.
" Frank Freeman, Theory and Practice of PsychologicalTesting, Holt, Rinehart and Winston, 1962, p. 215.
39 Ibid., p. 216.
36 Freeman, op. cit., p. 215.
47
ings, and achievement test scores, fall be-tween .40 and .75,87 indicating that theStanford-Binet is a moderately good pre-dictor of academic achievement.
The Stanford-Binet is better stand-ardized and has greater predictive powerthan any other test in the battery used inthe Howard Project. Other tests, or portionsthereof, were used, however, to supplementthe Stanford-Binet in specific ways.
The Peabody Picture Vocabulary Test(PPVT)
This test was included in the batterybecause it gives a quick measure of a child'sability to comprehend the meaning of words,without necessitating actual verbal expres-sion. The pictures on the PPVT representobjects or activities or states of being. Inadministering the test, the examiner pro-duces a stimulus word orally, ar d the childthen points to the picture (one of four ona plate) that best illustrates the meaningof the stimulus word. The test thereforereports "receptive" rather than "expres-sive" verbal ability.
Reliability and validity studies on thePPVT are limited. Reliability coefficientsranging from .76 to .81 for preschoolers onalternate forms of the tests have been re-ported. Studies of concurrent validity showa .76 correlation between the Stanford-Binetand PPVT scores among a group of "edu-cable" mentally retarded children, and cor-relations from .45 to .63 between the PPVT,California Achievement Test scores, andteachers' ratings of achievement for juniorhigh school pupils."
31 A. Anastasi, op. tit., p. 205.
38 L. M. Dunn, Peabody Picture Vocabulary Test Manual,American Guidance Service, Inc., 1959.
69 A. Anastasi, op. cit., p. 291.
40 John G. Hurst, "A Factor Analysis of the Merrill-Palmerwith Reference to Theory and Test Construction," Educationaland Psychological Measurement, Vol. 20, 1960, pp. 519-532.
41 Stott, op. cit.
42 Freeman, op. cit., p. 314.
48
Merrill-Palmer Scale of Mental Tests (M P)
This test was designed especially foruse with preschool children and offers a va-riety of tasks that appeal to them. Becauseof time limitations, only part of the Merrill-Palmer scale was given in the study. Allvocabulary items were omitted, since lan-guage facility was covered by other partsof the test battery. Thirteen subtests (yield-ing a total of 49 storable items) were used.These primarily measure sensorimotor coor-dination and perceptual discrimination ;e.g., fitting cubes into a box, completing var-ious form boards, and a variety of picturepuzzles, block building, and matching colors.
Speed is an important factor in manyof these test items. Indeed, the emphasis uponspeed in the Merrill-Palmer test has beencriticized as one of its weaknesses. As Anas-tasi points out, "For the preschool child,speed has not yet become an importantgoal." 8° A factor analytic study of theMerrill-Palmer test 4° suggests that one fac-tor, "willingnest; to cooperate," may be re-sponsible for the degree of speed with whichchildren complete ma ny of the test items.
The Merrill-Palmer was standardizedon 631 children in the Detroit area. The chil-dren who were the subjects were obtainedfrom public and private schools, orphan-ages, day nurseries, -hild-care agencies, andhealth clinics. Within the standardizationsample, a correlation of .92 was found be-tween chronological age and total Merrill-Palmer score. Test-retest reliabilities rangedfrom .72 to .96, with intervals of 2 monthsor less.41. A .79 correlation with. the Stan-ford-Binet was reported for 159 children inthe standardization group who were between3 and 6 years of age.42
The Illinois Test of Psycholinguistic Abilities(ITPA)
This is a test of language abilitiesthat has recently been developed to diagnosespecific language difficulties in children be-

tween the ages of 2.6 and 9 years of age.Raw scores on each of the nine subtests canbe converted to "language-ages," which aresimilar to the "mental age" concept used inthe Stanford-Binet. The test is based on anelaborate and interesting communicationmodel, which has been fully described."
Two subtests from the ITPA wereselected for inclusion in the present batteryin order to gain more knowledge of the chil-dren's language skills (an area of intel-lectual development that is often the mostdepressed in children from low-incomefamilies) the auditory-association and theauditory-automatic subtests.
The auditory-association subtestmeasures the child's ability to relate spo-ken words in a meaningful way. This abil-ity is assessed with a version of the familiaranalogies test, in which the child is asked tocomplete the test statement by supplying theanalogous word. For instance, "I sit on achair; I sleep ,.n a "; "Coffee isbitter; sugar is ."
The auditory-automatic subtest, incontrast, is primarily a "grammar test" andprovides an indication of the child's reper-toire of automatic linguistic habits. Thetest's authors explain the importance of thisskill in the following manner: "A frequentuse of language . . . leads to highly over-learned automatic habits for handling itssyntactical and inflectional aspects withoutconscious effort . . Linguistically normalchildren learn these inflections in a rathersystematic way." 4't
In testing this ability, the sentence-completion technique is again used e.g."Here is a hat. Here are two ."Other test items necessitate the use of in-
43 Samuel A. Kirk and James J. McCarthy, "The IllinoisTest of Psycholinguistic AbilitiesAn Approach to Differen-tial Diagnosis," American Journal of Mental Deficiency, Vol.66, 1961, pp. 339-412 ; B. Bateman, The ITPA in CurrentResearch, Institute for Research on Exceptional Children,University of Illinois, June 1965.
44 J. J. McCarthy and S. A. Kirk, The Construction, Stand-ardization. and Statistical Characteristics of the Illinois Testof Psycholinguistic Abilities. Institute for Research on Excep-tional Children, University of Illinois, 1963.
creasingly more difficult grammatical con-struction, such as, "This cake looks good.This cake looks even PP
The ITPA was standardized on agroup of 700 white children in the Decatur,Illinois, area who were aged 2 to 9 and hadIQ's between 80 and 120. Reliability coeffi-cients for test-retest intervals of 3 monthswere .72 and .79 for the ITPA-AuditoryAutomatic and the ITPA-Auditory Associa-tion, respectively, for a group of 69 9-year-olds. During the past 2 years, the ITPAhas been the subject of a considerable num-ber of studies examining its reliability, va-lidity, and clinical usefulness." In thesestudies, both the ITPA-Auditory Associa-tion and the ITPA-Auditory Automaticshowed moderate correlations (.22 to .59)with Stanford-Binet IQ scores of childrenbetween 3 and 5 years of age.
In summary, the four tests in the bat-tery we used varied in content, reliability,validity, and standardization samples. TheStanford-Binet has the longest history ofwide use and impressive evidence of reliabil-ity. Findings from the other tests must beinterpreted more cautiously, as evidencesupporting their validity and reliability isless conclusive.
Administering the Tests
All testing took place at Howard Uni-versity. Dr. Norman Milgram (CatholicUniversity, Department of Psychology) se-lected the tests and directed their adminis-tration. Five graduate students tested thechildren in the first round, and four testedin the second and third rounds. All of thesestudents had participated in a training prac-
45 These studies are summarized in J. J. McCarthy andJ. L. Olson, Studies on the Illinois Test of PsycholinguisticAbilities, Department of Exceptional Education, Universityof 'Wisconsin, 1964; B. Bateman, op. cit.
49
r)
ticum in which they used the tests withseveral disadvantaged preschool children. Ineach round, two of the testers were Negroes;the rest white. The majority each year werewomen.
Throughout the testing, the Directorobserved the testers and provided any neededadvice. In addition, he tested a number ofchildren himself, chiefly those who presenteddifficulties. At the end of each day of testing,the testers scored the children they exam-ined ; these scores were then checked by anindependent tester. The Director then re-viewed any discrepancies that were found.
In testing, considerable attention wasgiven to establishing and maintaining rap-port with the children. If a child showedsigns of emotional distress, testing was de-
layed until he appeared to be more relaxed.In the first round, each child was
tested in the presence of a family member,usually his mother. This person was told bythe tester that the child would be playingsome nursery games, and she was asked toremain silent regardless of what the childdid with the games. To encourage silence,a number of picture magazines were placednear her seat.
The tests were administered to eachchild individually in a closed room in whichthe curtains were drawn and from whichnovel features had been removed. Althoughconsiderable effort was made to administerthe tests in a standardized fashion, therewere occasional distractions, such as noisein nearby rooms.
The severest handicap to standardizedadministration of the tests came from thefact that during the second and third roundsof testing the nursery-group children wereaccompanied to the testing room by a staffmember, while the comparison-group chil-dren were accompanied by their mothers.Hence the testers knew to which group thechildren belonged. It is possible that suchknowledge may have biased their adminis-tration of the test. The fact that the testershad no affiliation with either the nurseryschool staff or the research group probably
50
i.
reduced the likelihood of such bias, however.Another possible testing bias in favor
of the comparison group was that thenursery-group children were occasionallyused as "fill-ins" for broken appointmentsof comparison-group children. This occa-sionally necessitated an interruption of thechild's lunch or nap and may thus havecaused a decrement in a few of the nurserychildren's scores. On the other hand, duringthe second and third rounds of testing, thenursery children may have possessed someadvantage over the comparison group inthat they were more familiar with the test-ing environment (the testing rooms were inthe same building as their nursery school),whereas the comparison group children hadto be taxied from their homes to the Uni-versity for each round of tests.
The first round of testing was com-pleted for both the nursery grelip and com-parison group during the summer of 1964,prior to the nursery group's entrance intonursery school. Although in each round thetesting took place over a period of 2 to 3months, the bulk of it was done within 1to 2 weeks. The additional time was neededto reschedule and test children who hadmissed earlier appointments.
In the first round of testing, all fourof the tests described above were includedin the assessment battery. Because of thenumber o tests involved and the age ofthe children, it was necessary to have twotest sessions on separate days. The first ses-sion was devoted to a portion of the Merrill-Palmer test and the entire Stanford-Binettest, in that order. In the case of the Merrill-Palmer, three tests within the 18- to 23-month age span were used as rapport or"warm-up" items, since they are easy andappealing to youngsters. The second testingsession was devoted to the remainder of theMerrill-Palmer, the PPVT, and the two sub-tests of the ITPA. We tried to hold the twotesting sessions on consecutive days. If,however, parents and children were unableto meet this schedule, a longer interval (2
to 4 days) elapsed between the two sessions.The second and third rounds of tests
took place during May and June of 1965and 1966; that is, after the nursery grouphad completed 1 and 2 years of nurseryschool, respectively. The test battery wasshortened for these rounds so that eachchild's testing could be completed in onesession. The Merrill-Palmer was omittedentirely in 1965. The Peabody Picture Vo-cabulary Test and the two subtests of theIllinois Test of Psycholinguistic Abilitieswere given only to the nursery group in1966, as a means of noting their within-group improvement after 2 years of nurseryschool.
The Test Findings
Test scores at the start of the Project (1964)
On the first round of tests the aver-age performance of the comparison groupwas slightly better than the nursery groupon all tests, as Table V shows. This edge ofsuperiority was attributable to the fact that,on the whole, the boys in the nursery-schoolgroup performed more poorly than any ofthe other three groupsthe nursery-schoolgirls and both sexes in the comparisongroup. For instance, the mean Stanford-Binet IQ for the nursery-school boys was77,3, a score that was 6 to 9 points lowerthan the mean scores of the other threegroups.
When scores for the two sexes werecombined the difference between the nurserygroup and the comparison group was slight,the mean Stanford-Binet IQ scores being82.7 and 84.6, respectively." This was duelargely to the fact that girls constituted 60
48 These mean IQ scores are similar to those reported byKennedy et al., op. cit., in their standardization on 1,800Negro children in the southeastern United States. Thesewriters report a mean IQ of 86 for Negro 5-year-olds.
percent of the nursery-school group, andtheir scores thus had greater weight thanthe boys' in determining the mean scores ofthe group. The range of scores and the dis-tribution of scores in the two groups werequite similar, as Table I has shown.
On the Peabody Picture VocabularyTest, there was less disparity between thenursery-group boys and the other threegroups than on the Stanford-Binet. ThePPVT mean IQ scores were, on the average,12 points lower than the mean Stanford-Binet IQ scores. (The correlation betweenthe PPVT and the Stanford-Binet IQ scoreswas .51.) An almost identical finding is re-ported by Beller for a similar group of low-income children. He found PPVT mean IQ'sto be 13 points lower than the Stanford-Binet IQ's.47 Even greater disparity betweenPPVT and Stanford-Binet scores is reportedby Kline et al. In their study of low-incomeyoungsters, mean PPVT IQ's were 17 pointslower than mean Stanford-Binet IQ's. 48
Scores on the two subtests of theITPA were very low for both the nurserygroup and the comparison group. Meanscores for both groups on the ITPA-Associa-tion and ITPA-Automatic tests were lessthan 1. On both tests, over 60 percent ofboth groups of children failed to answer anyof the items correctly. Only one nursery-group child and six comparison-group chil-dren were comparable in ability to the"average" youngster of the same age in thestandardization sample. This average childwas able to answer correctly four of theITPA-Association items, and three of theITPA-Automatic items.
On the basis of these findings, it istempting to state unequivocally that at thebeginning of the project the children in both
47 E. Kuno Beller, Annual Report of Research in the Phila-delphia Experimental Nursery School Project (mimeo-graphed), Philadelphia Council for Community Advance-ment, 1965.
48 M. G. Kline, J. Marshall, and E. Stansbury, Stanford-Binet, PPVT, and Low-Income Preschoolers: New Pitfallsfor Old Tests, a paper read at the Annual Meeting of theEastern Psychological Association, April 14-16, 1966.
51
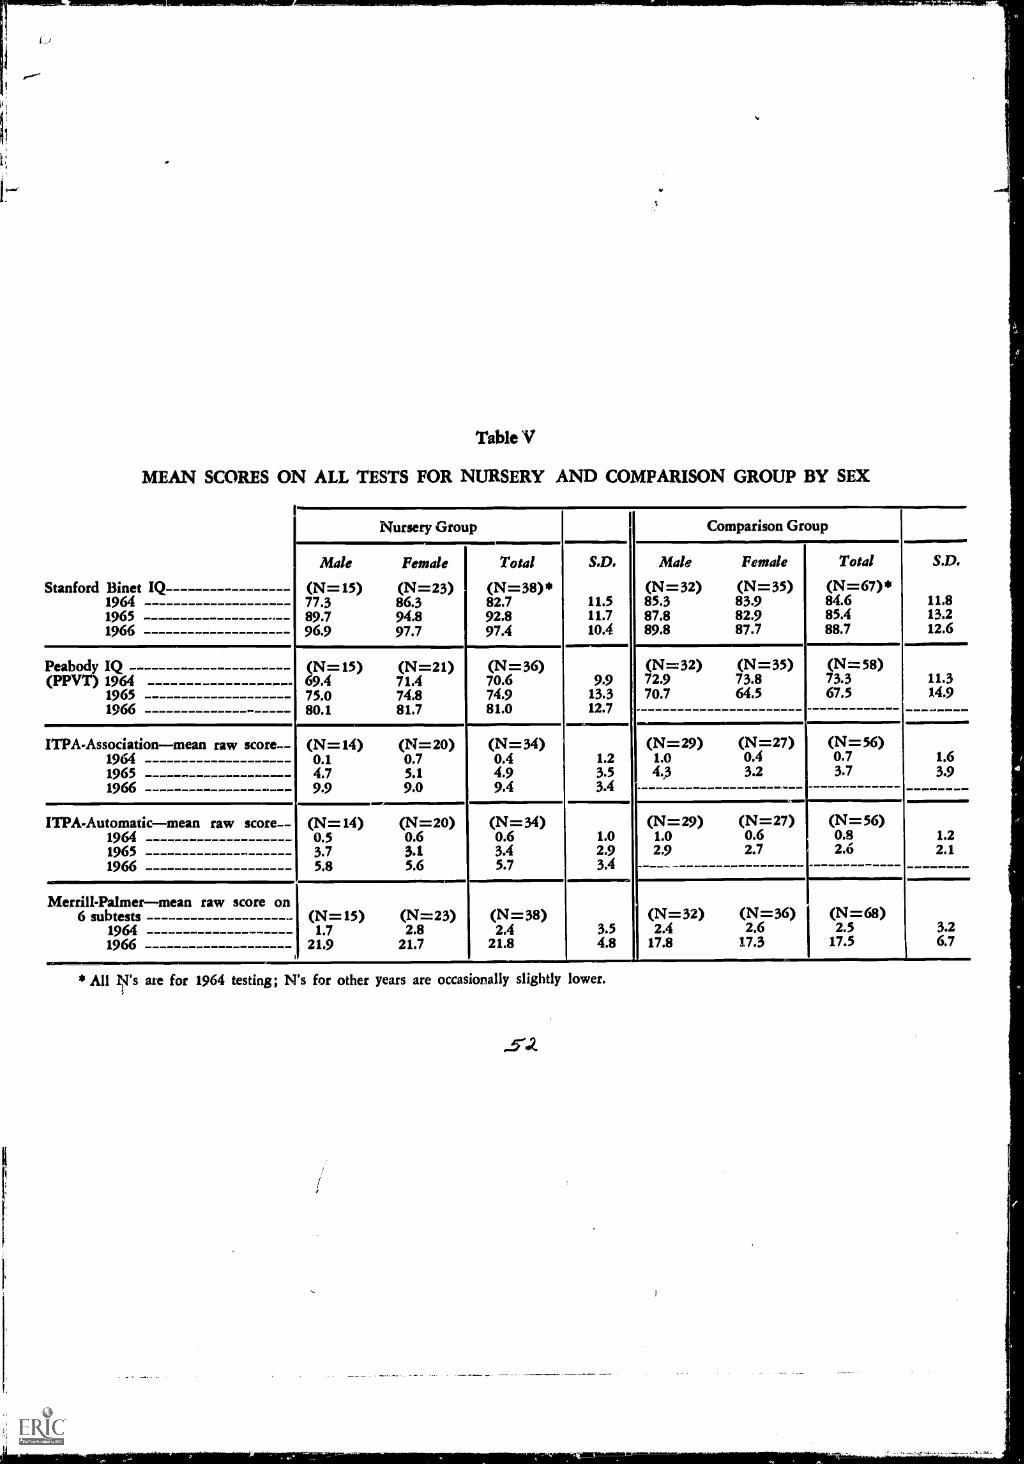
Table V
MEAN SCORES ON ALL TESTS FOR NURSERY AND COMPARISON GROUP BY SEX
Stanford Binet IQ196419651966
Nursery Group Comparison Group
Male Female
(N=15) (N=23)77.3 86.389.7 94.896.9 97.7
Total
(N=38)*82.792.897.4
S.D.
11.511.710.4
Male Female
(N=32) (N=35)85.3 83.987.8 82.989.8 87.7
Total
(N=67)*84.685.488.7
S.D.
11.813.212.6
Peabody IQ (N=15) (N=21) (N=36) (N=32) (N=35) (N=58)(PPVT) 1964 69.4 71.4 70.6 9.9 72.9 73.8 73.3 11.3
1965 75.0 74.8 74.9 13.3 70.7 64.5 67.5 14.91966 80.1 81.7 81.0 12.7
ITPA-Association-mean raw score (N=14) (N=20) (N=34) (N=29) (N=27) (N=56)1964 0.1 0.7 0.4 1.2 1.0 0.4 0.7 1.61965 4.7 5.1 4.9 3.5 4.3 3.2 3.7 3.91966 9.9 9.0 9.4 3.4
ITPA-Automatic--mean raw score (N=14) (N=20) (N=34) (N=29) (N=27) (N=56)1964 0.5 0.6 0.6 1.0 1.0 0.6 0.8 1.21965 3.7 3.1 3.4 2.9 2.9 2.7 2.6 2.11966 5.8 5.6 5.7 3.4
Merrill-Palmer-mean raw score on6 subtests (N=15) (N=23) (N=38) (N=32) (N=36) (N=68)
1964 1.7 2.8 2.4 3.5 2.4 2.6 2.5 3.21966 21.9 21.7 21.8 4.8 17.8 17.3 17.5 6.7
* All N's are for 1964 testing; N's for other years are occasionally slightly lower.
groups were more retarded in language de-velopment than in other areas of "generalintelligence." In both groups, the averagechild was half a year below the nationalaverage in general intelligence as measuredby the Stanford-Binet," but over a yearbelow average in associative language abil-ity, grammar, and understanding of themeaning of words.
A possible explanation of this dis-crepancy lies in the fact that the Stanford-Binet and Merrill-Palmer tests were givenon the first day and the PPVT and ITPAsubtests on the second day. The children mayhave performed more poorly on languagetests, then, because they put forth their bestefforts during the first day of testing andbecame more resistant to testing during thesecond session. This poorer performance onthe ITPA subtests is, however, congruentwith the findings of previous investigators.These indicate that children from low-income families are likely to have a lowerlevel of verbal skills than middle-class chil-dren, even with controls for intelligence.50
Since only a portion of the Merrill-Palmer test was given, it is impossible tocompare the scores of the children in ourstudy with national norms. Suffice it to saythat, as with the other tests in the battery,the nursery-group boys did more poorlythan any other group, while differences be-tween the scores of the total nursery groupand the total comparison group were mini-mal.
Intercorrelations among the tests,with nursery group and comparison groupcombined, ranged from .35 to .63. The high-est correlations were: PPVT and ITPA-Association, Stanford-Binet and Merrill-
49 The Stanford-Binet test contains many verbal items, butis not solely verbal, as are the two ITPA subtests used in ourbattery.
50 See, for instance, A. Anastasi and R. D'Angelo, "A Com-parison of Negro and White Preschool Children in LanguageDevelopment and in the Goodenough Draw-A-Man Test IQ,"Journal of Genetic Psychology, 1952, pp. 147-165 ; A. S.Carson and A. Rabin, "Verbal Comprehension and Communi-cation in Negro and White Children," Journal of EducationalPsychology, 1960, pp. 47-51.
Palmer, and the two ITPA tests. The low-est correlations were between the Merrill-Palmer and the two ITPA tests.
Changes in scores by the end of the firstschool year
By the end of the first school year,the mean scores of the children who attendedthe nursery school were significantly higherthan those of the comparison group on allfour tests. The figures are given in Table V.The differences between the two groups inthe average amount of change on the varioustests can be summarized as follows :
Stanford-Binet: The nursery children'smean IQ as measured by this test increased10.1 points (from 82.7 to 92.8) as comparedwith an increase of less than one point inthe comparison group's mean score (from84.6 to 85.4).
PPVT: On this test, the nurserygroup's mean IQ increased by 4.3 points,while the comparison group's mean scoredecreased by 5.8 points. The decrease in thePPVT scores of the comparison group mayindicate that deficits in language develop-ment, relative to the normal population, tendto become even more pronounced unlesssome form of environmental interventiontakes place.
ITPA-Auditory Association and ITPA-Auditory Automatic: The nursery group madea significantly larger gain than the com-parison group on both of the ITPA sub-tests. The nursery group's mean raw score(which is simply the mean number of ques-tions answered correctly) increased by 4.5points on the ITPA-Auditory Associationtest and by 2.8 points on the ITPA-AuditoryAutomatic test, as compared with approxi-mate increases for the comparison group of3 points and 1.8 points, respectively. Never-theless, at the end of the 1965 school yearthe children in the nursery group were stillnearly a year below normal in associativelanguage ability and slightly over a yearbelow normal in the proper use of grammar.
53
Differences within the nursery group
When we turn to an examination ofthe scores within the nursery group, aninteresting pattern emerges. As indicated inTable V, the greatest increment in IQ gainon the Stanford-Binet was made by thenursery-group boys. Their average IQ, itwill be recalled, was especially low at thestart of the project. The boys' mean scoresimproved by 12.4 points, as compared withthe girls' average gain of 8.5 points.
When the sexes are combined andthe nursery group is divided into groupsabove and below the mean, the increase bychildren with low IQ's is even more pro-nounced. All but one child whose IQ wasbelow the mean in 1964 made some gain in1965, the average gain being 13.9 points.In contrast, the children who were initiallyabove the mean made an average gain of6.2 points. A similar though less strikingpattern was found in the PPVT scores. Thisgreater gain made by the children with thelower IQ's is further discussed below, andalso in Appendix A.
Changes in scores by the end of the secondschool year
By the end of the second year, themean IQ of the nursery-school group wasclose to the national norm, being 97.4. Thirtyof the nursery group children (or 90 per-cent) had, by the end of the second year,achieved IQ scores of 90 or aboveas com-pared with only 11 nursery group children(26 percent) who had scores of 90 or abovebefore the beginning of nursery school.
The mean score of the children in the com-parison group was somewhat lower, being88.7. In other words, the nursery school grouphad gained 14.7 points on the average inthe 2-year period, while the comparisongroup had gained 4.1. Insofar as the com-parison group was an adequate control, itwould appear, therefore, that a mean gain
54
of about 10 points in IQ wa attributable tothe efforts of the Project.
The superiority of the nursery groupin performance and intelligence tests is fur-ther attested to by their achievement on theMerrill-Palmer. Six subtests of this test(which yielded a total of 29 storable items)were given to both groups of children dur-ing the 1966 round of testing. When theresults were compared with the 1964 scoresfor the same 29 items, it was found that thenursery children's raw scores had risen froma mean of 2.4 to a mean of 21.8, while thecomparison group's shift was from 2.5 to17.5. The nursery group's greater increaseis statistically significant. This finding sup-ports and supplements the Stanford-Binetresults and leads us to conclude that overthe 2-year period the children definitely ben-efited from attending nursery school.
A word should be said at this pointabout the fact that during the 2 years thechildren in the comparison group improvedin mean IQ on the Stanford-Binet. Theiraverage gain was not large (4.1 points) butit is a gain that is statistically significant.
One possibility is that of a practiceeffect. This possibility cannot be ignored,but the findings of several other studies 51have shown that there is practically no prac-tice effect on IQ scores over a 1-year periodfor children of this age. It will be recalled,too, that the comparison group's averagescore increased significantly only on thethird round of testing.
Another possibility is that some ofthe comparison-group children attendedother nursery schools or day care centers.Inquiry about this was made in the semi-yearly interviews with their parents. It wasfound that only 11 of the 67 children whowere tested in either 1965 and 1966 wereenrolled in programs (usually Head Start)of 6 or more weeks' duration. The mean IQ
51 M. P. Honzik, et al., "The Stability of Mental Test Per-formance Between Two and Eighteen Years," Journal ofExperimental Education, 1949, pp. 309 -324; S. R. Pinneau,Changes in Intelligence Quotient, Houghton-Mifflin Co., 1961.

of these 11 children in 1966 was 91, ascompared with the total comparison-groupmean IQ of 89. The number of children withthis experience was so small, however, thattheir slightly higher IQ's did not greatlyinfluence the mean score for the whole com-parison group. Moreover, in 1965 the meanscore of these 11 children was four pointshigher than the total group's mean score,so their preschool experience had not re-sulted in any appreciable increase in theirIQ scores.
Another possible explanation of thecomparison group's IQ increase is simply thefact of their belonging to a somewhat spe-cial group. It will be recalled that thesechildren's parents were told that they wereparticipating in the Howard UniversityGrowth Study. This included periodic con-tacts by sympathetic interviewers, specialrecognition and gestures of appreciation fortheir participation, and, perhaps most im-portant, a certain pride and pleasure in hav-ing their children evaluated at Howard Uni-versity. These activities may have stimulatedthem to take a greater interest in their chil-dren's development, and this in turn mayhave had a beneficial effect upon the chil-dren. The low rate of attrition among thecomparison group families is in itself sug-gestive that the parents found somethingworthwhile in being a part of the study,even at this minimal level of involvement.
This possible explanation of the com-parison group's IQ gain is, of course, puresupposition. It is offered primarily as astimulus for considering the possible side-effects of a conscientious effort to hold onto control-group families. If there were side-effects, at least they were presumably bene-ficial to the children.
When the major changes in IQ took place
The foregoing figures with respect tochanges in mean IQ indicate that the nurs-ery children's rate of gain slowed down dur-ing the second year of the program, while
the comparison group's increased. Over the2 years the nursery children gained an aver-age of 14.7 points, but 10.1 of these pointswere achieved by the end of the first year.In contrast, in the first year the children inthe comparison group gained only 0.8 points,on the average, but they moved ahead 3.3more points during the second year. Theresult was that the nursery group's gain inthe second year was not much greater thanthe comparison group's gain in that year-4.6 points as compared with 3.3. The differ-ence between these two figures (1.3 points)is not statistically significant and could haveresulted by chance.
What does this imply for the Proj-ect? Does it mean, as one might off-handthink, that the second year of nursery schoolwas not needed, that the nursery childrenwould probably have made almost as muchgain without its services ? In the followingsection we shall show the bearing of scrip-,economic status on this question, while inAppendix A an analysis by individual scoresshows in more detail where and when thechanges took place. Both analyses indicatethat 2 years were necessary, except for asmall number of children from "better"homes whose IQ's were relatively high atthe start of the project.
IQ Gain and Socioeconomic Status
It was noted above (page 54) thatin the first school year the children whoseIQ's had been below the average for thegroup were the ones who made the greatestmean gain in IQ scores. It thus appearedthat in that year the program was mostbeneficial to the children who were intel-lectually the neediest.
Further inspection of the data sug-gested that socioeconomic status may havebeen an important factor in this change.(See Table VI and the chart on page 57.)
55
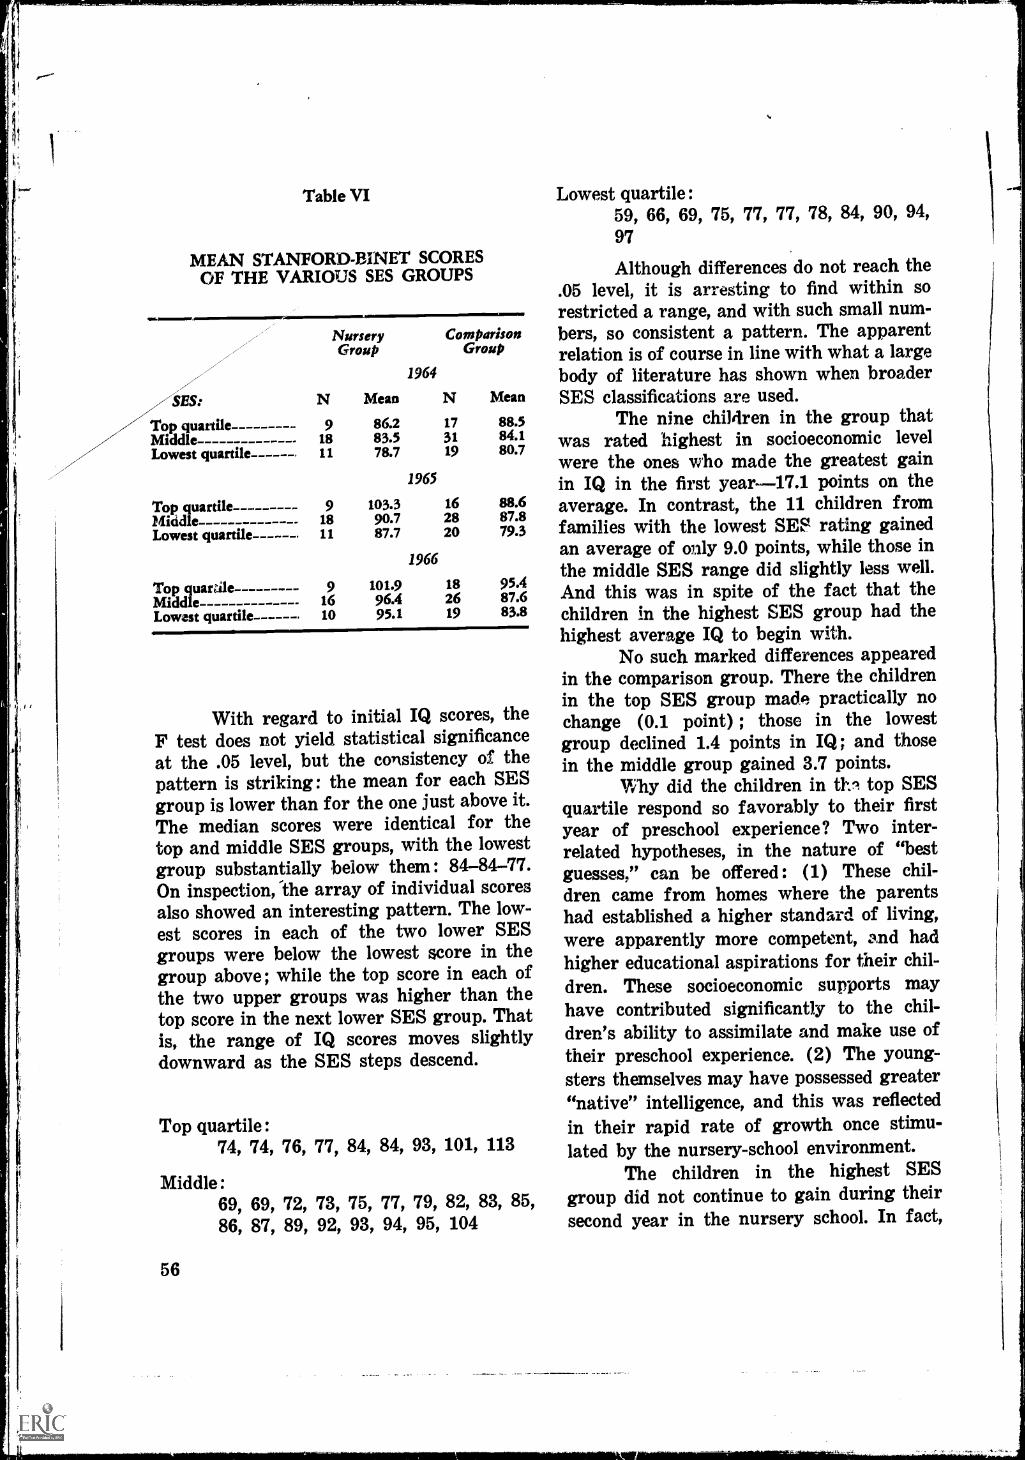
Table VI
MEAN STANFORD-BINET SCORESOF THE VARIOUS SES GROUPS
Top quartileMiddleLowest quartile
Top quartileMiddleLowest quartile
Top quaraleMiddleLowest quartile
NurseryGroup
N Mean
1964
ComparisonGroup
N Mean
9 86.2 17 88.518 83.5 31 84.111 78.7 19 80.7
1965
9 103.3 16 88.618 90.7 28 87.811 87.7 20 79.3
1966
9 101.9 18 95.416 96.4 26 87.610 95.1 19 83.8
With regard to initial IQ scores, theF test does not yield statistical significanceat the .05 level, but the consistency of thepattern is striking : the mean for each SESgroup is lower than for the one just above it.The median scores were identical for thetop and middle SES groups, with the lowestgroup substantially below them : 84-84-77.On inspection, the array of individual scoresalso showed an interesting pattern. The low-est scores in each of the two lower SESgroups were below the lowest score in thegroup above ; while the top score in each ofthe two upper groups was higher than thetop score in the next lower SES group. Thatis, the range of IQ scores moves slightlydownward as the SES steps descend.
Top quartile :74, 74, 76, 77, 84, 84,
Middle:69, 69, 72, 73, 75, 77,86, 87, 89, 92, 93, 94,
56
93, 101, 113
79, 82, 83, 85,95, 104
Lowest quartile :59, 66, 69, 75, 77, 77, 78, 84, 90, 94,
97
Although differences do not reach the.05 level, it is arresting to find within sorestricted a range, and with such small num-bers, so consistent a pattern. The apparentrelation is of course in line with what a largebody of literature has shown when broaderSES classifications are used.
The nine children in the group thatwas rated highest in socioeconomic levelwere the ones who made the greatest gainin IQ in the first year-17.1 points on theaverage. In contrast, the 11 children fromfamilies with the lowest SES rating gainedan average of only 9.0 points, while those inthe middle SES range did slightly less well.And this was in spite of the fact that thechildren in the highest SES group had thehighest average IQ to begin with.
No such marked differences appearedin the comparison group. There the childrenin the top SES group made practically nochange (0.1 point) ; those in the lowestgroup declined 1.4 points in IQ ; and thosein the middle group gained 3.7 points.
Why did the children in thl top SESquartile respond so favorably to their firstyear of preschool experience? Two inter-related hypotheses, in the nature of "bestguesses," can be offered : (1) These chil-dren came from homes where the parentshad established a higher standard of living,were apparently more competent, and hadhigher educational aspirations for their chil-dren. These socioeconomic supports mayhave contributed significantly to the chil-dren's ability to assimilate and make use oftheir preschool experience. (2) The young-sters themselves may have possessed greater"native" intelligence, and this was reflectedin their rapid rate of growth once stimu-lated by the nursery-school environment.
The children in the highest SESgroup did not continue to gain during theirsecond year in the nursery school. In fact,

CI
Mea
n I.
Q.
105
100 95 90 85 80 75
man
twa!
atA
MIN
IMS
ftli
ME
AN
ST
AN
FO
RD
-BIN
ET
SC
OR
ES
FO
R 1
964,
196
5, 1
966
BY
SE
S G
RO
UP
Low
est S
ES
Qua
rtile
Mid
dle
SES
NU
RSE
RY
GR
OU
P
Top
SE
S Q
uart
ile
CO
MPA
RIS
ON
GR
OU
P
IS.
eeee
eeee
eee
eeee
e eee
,*
9
e.
*18
* 11
e.e.
:.*
17
ill0,
11.1
.
** *
31 0
19
1964
1965
1966
1964
* nu
mbe
r of
chi
ldre
n in
196
4te
stin
g; n
umbe
r dr
ops
slig
htly
in s
ucce
ssiv
e ye
ars
1965
1966
during that year their mean IQ declined 1.4points.
Speculation in regard to the "high"children's lack of gain during the secondyear of nursery school can take several di-rections. Having made such gains duringthe first year of nursery school, the secondyear of preschool may have been a periodof consolidation. If this hypothesis is cor-rect, then we would expect that in the nextyear or two they would again increase theirscores. Another possibility is that the cur-riculum of the nursery school in the secondyear was not sufficiently stimulating forthese children. A third possibility is thatthese children, who by 1966 had reached anaverage IQ of 102, were perhaps close tofulfilling their intellectual potential, inwhich case we would not anticipate markedIQ increases in future years. Maintenanceof present gains would in itself be atriumph.
In contrast to the highest SESgroup, the nursery school children in themiddle and lowest SES groups continued togain during the second year. The net ef-fect was that over the 2-year span, the threeSES groups did about equally well. Thenursery school children in the top SESgroup gained an average of 15.7 points inthe 2 years ; those in the middle group gained12.9 points ; and those in the lowest groupgained 16.4 points. In contrast, during thattime the comparison-group children whosesocioeconomic situation was the most fa-vorable gained more in IQ (6.9 points onthe average) than did the children in theother SFS groups.
Following the emergence of a patternof IQ change by SES levels, each of the in-dividual socioeconomic indices was examinedto see which, if any, were related to IQ gain.The only index that appeared related was"income per child." A three-way breakdownof "income per child" was made, and themean Stanford-Binet IQ change was com-puted for each test round. The resulting pat-term is very similar to that presented in thechart on page 57, although the gain made
58
in the first year by the children in the high-est "income per child" group is less strikingthan when the global SES index was used.A similar finding is presented in AppendixA, where IQ gain is related to the SocialSecurity Administration's poverty index.This index, like "income per child," takesinto account family size as well as annualincome.
From all of this, we conclude thatthe nursery school program was beneficialto the children regardless of SES level butthat the pattern of IQ growth was differentin the upper part of the limited SES rangerepresented in this study. The highest SESchildren made their greatest gains in thefirst year and then leveled off, while themiddle and lowest SES children progressedat a more gradual but steady pace. Thisfinding strongly supports the concept of socio-economic differences among low-income fam-ilies, that may be overlooked when work-ing with children who are labeled "cultur-ally deprived." It also suggests that a special"enrichment" program may be needed dur-ing the second year of nursery school forthe children who made marked gains dur-ing the first year.
Other Correlates of IQ Change in theNursery School Children
1. Participation by parents
In an effort to find out whether theamount of change in IQ was related to theextent of the parents' participation in theactivities of the nursery school, the num-ber of family meetings they attended wasused as one measure of the parents' involve-ment. As indicated in Chapter VI, this meas-ure was itself related to socioeconomic level.Dividing the parents into those who at-tended more than the median number oftimes and those who attended less fre-quently, we found that there was little re-lation between frequency of attendance andthe children's gains in IQ. The figures for
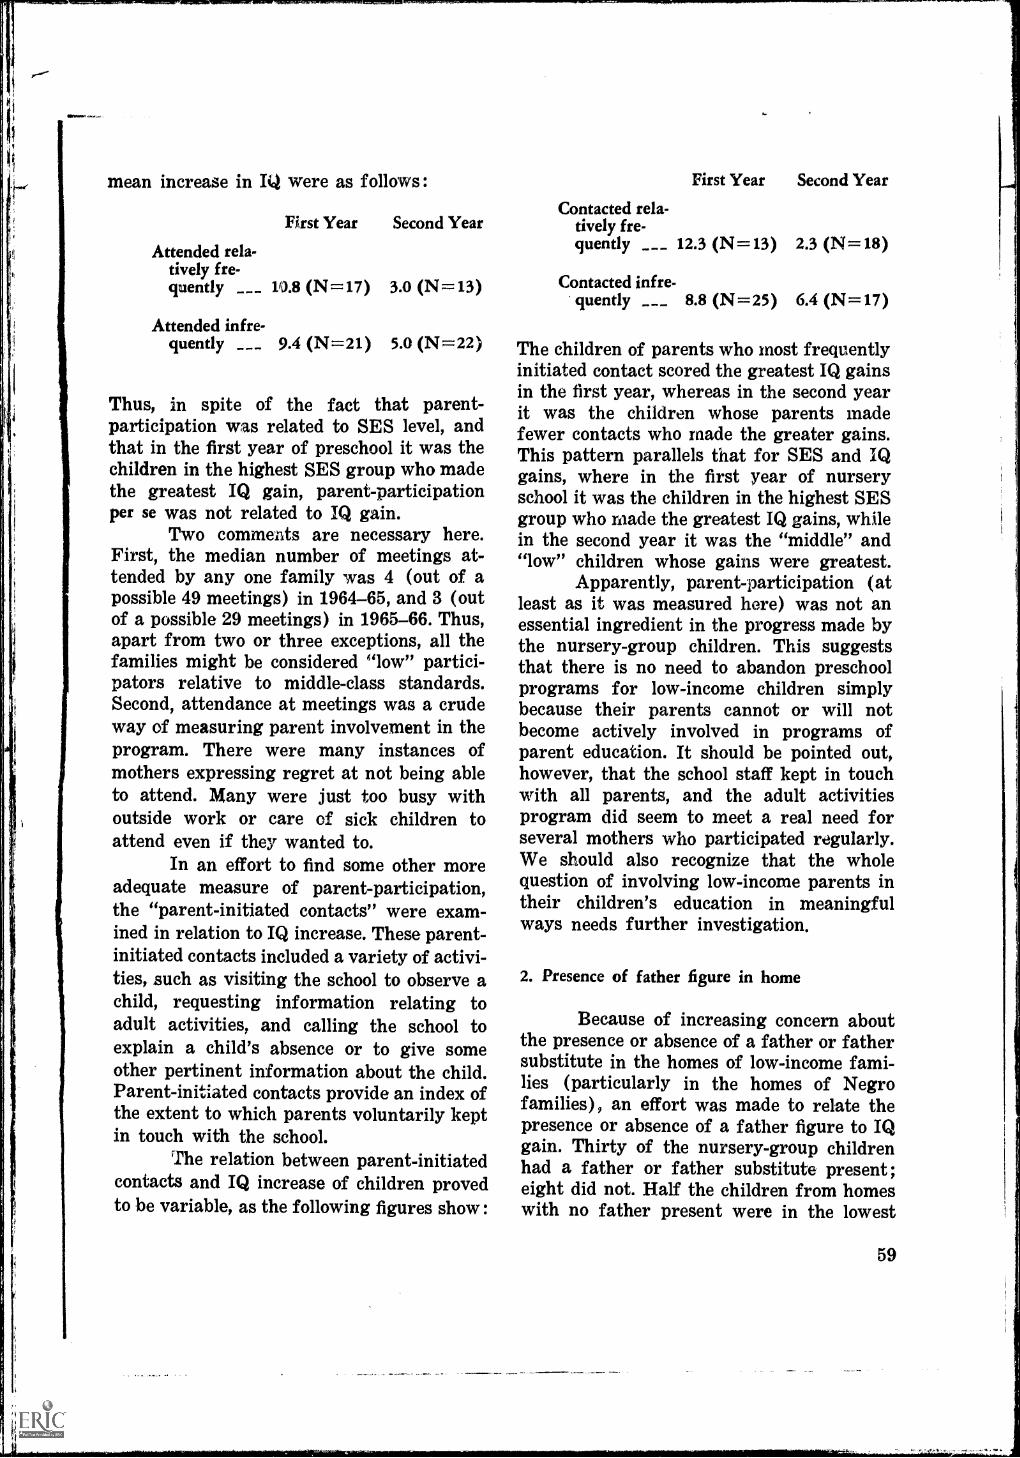
mean increase in IQ were as follows :
Attended rela-tively fre-
First Year Second Year
quently __ 10.8 (N=17) 3.0 (N=13)
Attended infre-quently __ 9.4 (N=21) 5.0 (N=22)
Thus, in spite of the fact that parent-participation was related to SES level, andthat in the first year of preschool it was thechildren in the highest SES group who madethe greatest IQ gain, parent-participationper se was not related to IQ gain.
Two comments are necessary here.First, the median number of meetings at-tended by any one family was 4 (out of apossible 49 meetings) in 1964-65, and 3 (outof a possible 29 meetings) in 1965-66. Thus,apart from two or three exceptions, all thefamilies might be considered "low" partici-pators relative to middle-class standards.Second, attendance at meetings was a crudeway of measuring parent involvement in theprogram. There were many instances ofmothers expressing regret at not being ableto attend. Many were just too busy withoutside work or care of sick children toattend even if they wanted to.
In an effort to find some other moreadequate measure of parent-participation,the "parent-initiated contacts" were exam-ined in relation to IQ increase. These parent-initiated contacts included a variety of activi-ties, such as visiting the school to observe achild, requesting information relating toadult activities, and calling the school toexplain a child's absence or to give someother pertinent information about the child.Parent-initiated contacts provide an index ofthe extent to which parents voluntarily keptin touch with the school.
The relation between parent-initiatedcontacts and IQ increase of children provedto be variable, as the following figures show :
Contacted rela-tively fre-quently ___
Contacted infre-quently __
First Year
12.3 (N=13)
8.8 (N=25)
Second Year
2.3 (N=18)
6.4 (N=17)
The children of parents who most frequentlyinitiated contact scored the greatest IQ gainsin the first year, whereas in the second yearit was the children whose parents madefewer contacts who made the greater gains.This pattern parallels that for SES and IQgains, where in the first year of nurseryschool it was the children in the highest SESgroup who made the greatest IQ gains, whilein the second year it was the "middle" and"low" children whose gains were greatest.
Apparently, parent-participation (atleast as it was measured here) was not anessential ingredient in the progress made bythe nursery-group children. This suggeststhat there is no need to abandon preschoolprograms for low-income children simplybecause their parents cannot or will notbecome actively involved in programs ofparent education. It should be pointed out,however, that the school staff kept in touchwith all parents, and the adult activitiesprogram did seem to meet a real need forseveral mothers who participated regularly.We should also recognize that the wholequestion of involving low-income parents intheir children's education in meaningfulways needs further investigation.
2. Presence of father figure in home
Because of increasing concern aboutthe presence or absence of a father or fathersubstitute in the homes of low-income fami-lies (particularly in the homes of Negrofamilies) , an effort was made to relate thepresence or absence of a father figure to IQgain. Thirty of the nursery-group childrenhad a father or father substitute present;eight did not. Half the children from homeswith no father present were in the lowest
59
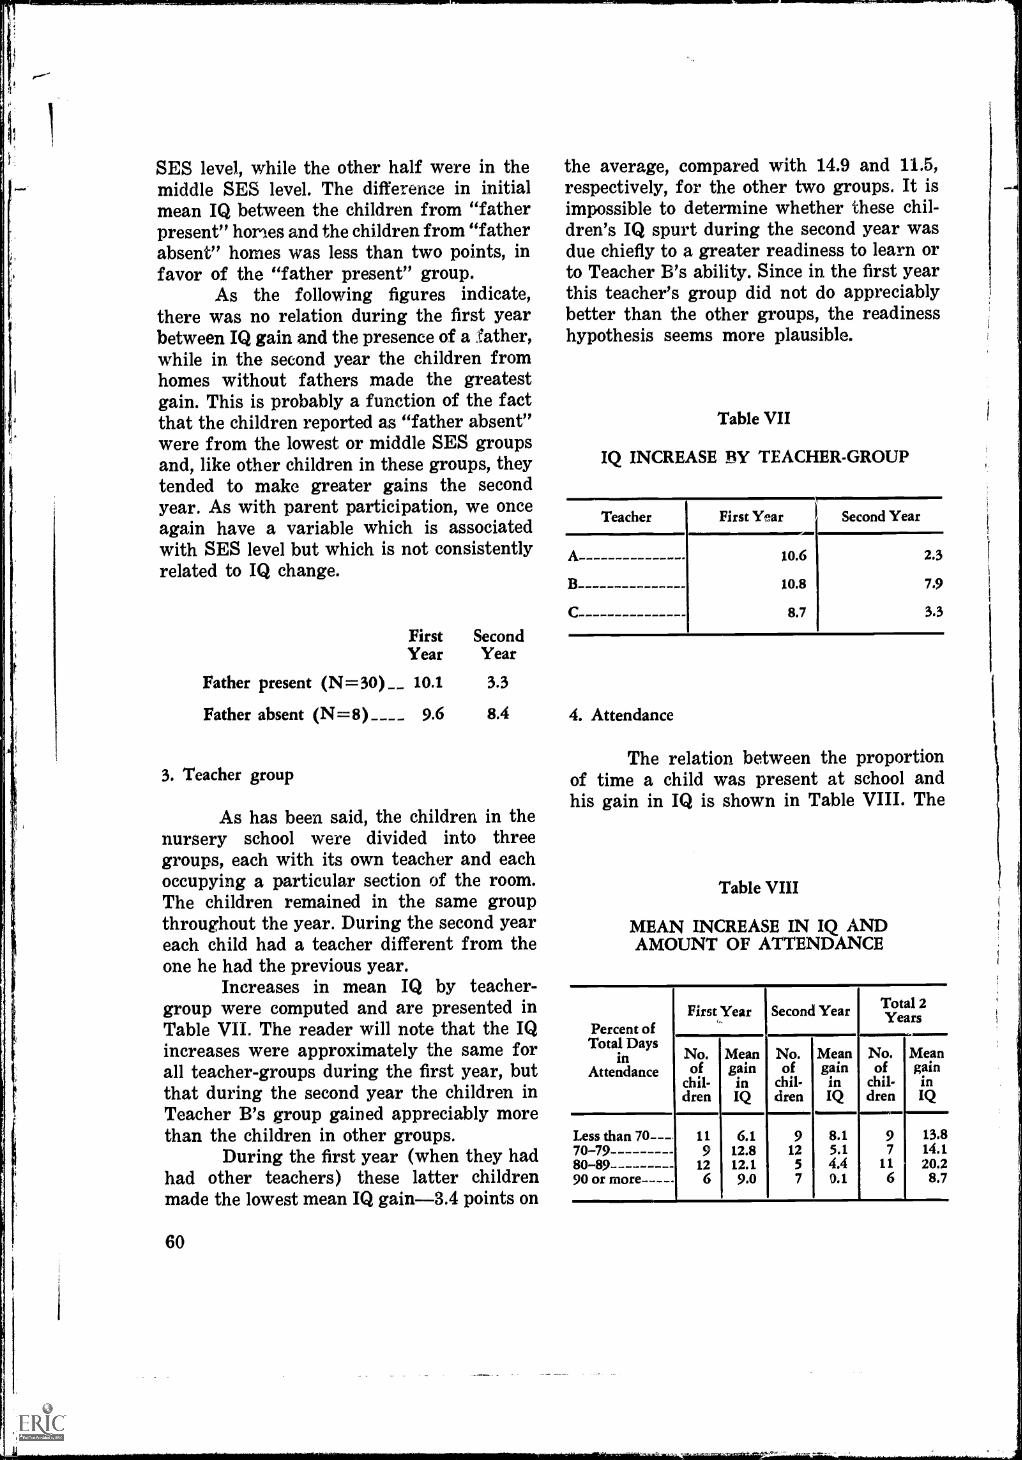
lj
SES level, while the other half were in themiddle SES level. The difference in initialmean IQ between the children from "fatherpresent" hones and the children from "fatherabsent" homes was less than two points, infavor of the "father present" group.
As the following figures indicate,there was no relation during the first yearbetween IQ gain and the presence of a _gather,while in the second year the children fromhomes without fathers made the greatestgain. This is probably a function of the factthat the children reported as "father absent"were from the lowest or middle SES groupsand, like other children in these groups, theytended to make greater gains the secondyear. As with parent participation, we onceagain have a variable which is associatedwith SES level but which is not consistentlyrelated to IQ change.
First SecondYear Year
Father present (N=30)__ 10.1 3.3
Father absent (N= 8) ____ 9.6 8.4
3. Teacher group
As has been said, the children in thenursery school were divided into threegroups, each with its own teacher and eachoccupying a particular section of the room.The children remained in the same groupthroughout the year. During the second yeareach child had a teacher different from theone he had the previous year.
Increases in mean IQ by teacher-group were computed and are presented inTable VII. The reader will note that the IQincreases were approximately the same forall teacher-groups during the first year, butthat during the second year the children inTeacher B's group gained appreciably morethan the children in other groups.
During the first year (when they hadhad other teachers) these latter childrenmade the lowest mean IQ gain-3.4 points on
60
the average, compared with 14.9 and 11.5,respectively, for the other two groups. It isimpossible to determine whether these chil-dren's IQ spurt during the second year wasdue chiefly to a greater readiness to learn orto Teacher B's ability. Since in, the first yearthis teacher's group did not do appreciablybetter than the other groups, the readinesshypothesis seems more plausible.
Table VII
IQ INCREASE BY TEACHER-GROUP
Teacher First Year Second Year
A 10.6 2.3
B 10.8 7.9
C 8.7 3.3
4. Attendance
The relation between the proportionof time a child was present at school andhis gain in IQ is shown in Table VIII. The
Table VIII
MEAN INCREASE IN IQ ANDAMOUNT OF ATTENDANCE
Percent ofTotal Days
inAttendance
First Year Second Year Total 2Years
No.of
chil-dren
MeangaininIQ
No.of
chil-dren
MeangaininIQ
No.of
chil-dren
MeangaininIQ
Less than 70 - - -.70-7980-8990 or more--
119
126
6.112.812.19.0
912
57
8.15.14.40.1
97
116
13.814.120.28.7
figures indicate that in the first year thegreatest gains were made by the childrenwho attended 70-90 percent of the time,while those who attended less frequently andthose who attended more frequently madesomewhat smaller gains. In the second year,in contrast there was a consistent decline ingains in IQ as attendance increased. Thispeculiar finding may be due, in part, to thefact that attendance was associated withSES level and the mean IQ, scores of the"top" SES children decreased the secondyear.
When attendance over the entire 2-year period of nursery school is comparedwith total IQ gain, the pattern is one ofprogressive increase in IQ gain from low tohigh attenders, except for those six childrenwho were present at least 90 percent of thetime. The gain of these high-attenders wasless than that of the children who attendedleast consistently. In this connection itshould be noted that the high-attendingchildren had an initial mean IQ which wasslightly higher (2-3 points) than the rest ofthe children.
Comparison with Analogous Programs
In order to place the Howard Projectin perspective, it is interesting to comparethe test results cited above with those ob-tained in similar studies. The particularstudies which will be mentioned here arethose reported by Alpern," Beller,53 Grayand Klaus," Goldstein,55 Starkweather," andWeikart et al.57 These programs differ from
52 Gerald D. Alpern, The Failure of a Nursery School En-richment Program for Culturally Deprived Children (mimeo-gragraphed). Preliminary Report prepared for Fall 1965 Re-gional Meeting of American Association of Psychiatric Clinicsfor Children, Cincinnati, Ohio.
53 E. Kuno Beller, Annual Report of Research in the Phila-delphia Experimental Nursery School Project (mimeo-graphed), Philadelphia Council for Community Advance-ment in Educationally Deprived Children, Temple University,1965.
the Howard Project and from each other incurriculum, method of selecting children, ageat which the children were enrolled, extentof parent-participation, and tests employedto evaluate the program. Nevertheless, theyare similar to the Howard Project in twoimportant ways, the programs have lastedfor at least 1 or 2 school years and per-formance of experimental children has beencompared with that of control groups.
In all the studies cited above, theStanford-Binet was used either as a basis forinitially comparing nursery-group and com-parison-group children or as a measure ofchange in intellectual performance as a func-tion of preschool experience. In terms ofinitial test scores (i.e., prior to nurseryschool) the children in the Howard Projecthad lower IQ's than the children in any ofthe other studies except the one conductedin Ypsilanti, where the pre-test mean IQ'sof the three experimental groups were 78,79, and 81, respectively. Initial IQ scoresreported in other studies were in the high80's or low 90's.
All studies, except Alpern's,58 reportedsome IQ gains after 1 year of nursery school.The gains ranged from 3 to 20 IQ points,with 9 points being the median gain. Thegreatest average gain after 1 year wasreported by the Ypsilanti project, whosenursery-group children, like those in theHoward Project, had initially lower IQscores than those reported in other studies.
m Susan W. Gray and R. A. Klaus, "An Experimental Pre-school Program for Culturally Deprived Children," ChildDevelopment, December, 1965.
55 L. S. Goldstein, Evaluation of an Enrichment Programfor Socially Disadvantaged Children (mimeographed), Insti-tute for Developmental Studies, New York Medical College,New York City, June, 1965.
58 E. K. Starkweather, Preschool Research and EvaluationProject (mimeographed), Oklahoma State University, 1966.
57 David P. Weikart, Constance K. Kamii, and Norma L.Radin, Perry Preschool Project Progress Report (mimeo-graphed). Public Schools, Ypsilanti, Mich., June, 1964; DavidP. Weikart, Preliminary Results from a Longitudinal Studyof Disadvantaged Preschool Children, Ypsilanti PublicSchools, 1967 (mimeographed).
58 Alpern, op. cit. The relatively short duration of thisprogram (6 hours a week for 7 months) may account for thelack of positive findings.
61
Where preschool projects were con-tinued beyond 1 year, the IQ gains reportedat the end of the second year were uniformlyless than those occurring in the first year, aswas also found in the Howard Project. Inthe Ypsilanti study, where initial IQ gainswere quite spectacular (12, 13, and 20 pointincreases for the three experimental groups),the mean IQ scores decreased during thesecond year. The authors of this study madean item analysis, which indicated that thedecline in IQ scores was due to a decelerationin rate of growth and not to a loss of pre-viously acquired abilities.
Turning to the results from testsother than the Stanford-Binet, we have alimited basis for making comparisons be-tween the Howard Project and similar stud-ies, since a variety of tests of verbal, ability,reading readiness, and measures of social-motivational factors were used in place ofthe ITPA, PPVT, and Merrill-Palmer. Inthe three studies in which the PPVT wasused on a pre-test, post-test basis, the gainsmade by the nursery-group children wereslightly greater than those made by the chil-dren in the Howard Project. In general, theresults from the PPVT are less consistentthan those obtained from the Stanford-Binet.
Two studies (those of Weikart and ofGray and Klaus) used the ITPA on a pre-test, post-test basis. In both of these studies,as in the Howard Project, the nursery-groupchildren made significant increases in ITPAscores but were still functioning below nor-mal in language ability at the end of 2 yearsof nursery school.
In regard to the performance of thecomparison groups, two studies (Weikartand Alpern) have findings similar to thoseobtained in the Howard Project ; i.e., an in-
crease in the comparison grolip's scores overa 1 or 2 year period, whereas two otherstudies (Goldstein and Gray and Klaus)noted decreases in the comparison group'sscores. Where the comparison-grOup scoreshave increased, no documented explanationhas been offered. The Ypsilanti group madean effort to find a growth pattern among thecomparison-group children at various ages toaccount for the IQ increase but no consistentpattern was found.
In conclusion, a comparison of theHoward Project's test scores with the resultsobtained by other groups indicates the fol-lowing :
1. The Howard Project nursery chil-dren made above-average increases in IQscores. This relative superiority in perform-ance is associated with the fact that thesechildren, like those in the Ypsilanti group,had initially lower IQ scores than the chil-dren in other groups.
2. The tapering-off of gains duringthe second year of nursery school, which wascharacteristic of the Howard Project chil-dren, is a common phenomenon.
3. It also seems characteristic for chil-dren from low-income homes to be belowaverage in language, ability (in terms ofITPA test norms) even after 2 years of pre-school experience.
4. The interesting pattern of IQ gainby SES level has not been analyzed in otherstudies, where all the children are groupedtogether as "culturally deprived" or "fromlow-income families."

VIII. SUMMARY
Purpare
The purpose of the Project was todetermine whether a 2-year experience ina traditional middle-class nursery school,plus parent education activities, could helpoffset the difficulties which low-income,inner-city children experience when theyenter elementary school.
Nursery- and comparison-group children
Out of a pool of 200 families, re-cruited by a door-to-door canvass in a denselypopulated, low-income area of Washington,D.C., 38 children (15 boys and 23 girls)between the ages of 3 and 31/2 were assignedto the experimental (or nursery school)group, and 69 of nearly the same age (32boys and 37 girls) were assigned to the com-parison group. As a result of the populationcomposition of the District of Columbia,rather than by deliberate intent, all the chil-dren were Negro.
The final number of children in boththe nursery and comparison groups washigher than originally anticipated due to thefact that the attrition rate was very low inboth groups. In the course of 2 years onlytwo children were withdrawn' from thenursery school program and only fourdropped out of the comparison group.
The families from which both thenursery and comparison groups were drawnwere similar in salient socioeconomic vari-ables, such as family yearly income (medianannual income was approximately $3,500for both groups), income per child, extent of
welfar assistance, number of children inhome, and mother's education.
In general, the families in the Projectbelonged to the lower end of the socioeco-nomic status (SES) continuum. However,distinct socioeconomic differences amongfamilies were noticeable. Some familiesseemed well-organized, responsible, and hada slightly better standard of living. Otherfamilies seemed particularly disorganized,living in dire poverty, and resembling whatare often called "multiproblem" families. Themajority of families seemed to fall some-where between these two extremes. In orderto determine whether these family differ-ences affected the extent to which the chil-dren benefited from nursery school, thefamilies in both the nursery and comparisongroups were divided into three socioeconomiclevelsall within the low SES stratumonthe basis of both impressionistic judgmentsand quantitative socioeconomic indices. One-fourth of the families were rated as "high"SES ; another fourth as "low" SES ; and theremaining one-half in the "middle" SES.
Preschool program
The nursery-group children attendedHoward University Nursery School for 2school years (approximately 10 months eachyear) from September, 1964 to June, 1966.The service was an all-day (7-hour) pro-gram, 5 days a week. Transportation wasprovided for all the children. Daily attend-ance averaged approximately 75 percent.
The children were divided into threegroups, each with its own teacher. Each
63
child remained with his own group andteacher throughout the school year. Eachgroup had approximately 12 children andone teacher, who was assisted intermittentlyby the Head Teacher, a "floating" teacher,and a series of student aides.
The curriculum was not specificallygeared to the problems of low-income childrenbut was an adaptation of the program usu-ally provided by the Howard UniversityNursery School for middle-class children.The program was traditional in nature, withemphasis on fostering curiosity and enthu-siasm for learning through the media ofplay, storytelling, dramatics, music, games,nature walks, and field trips. A considerableportion of the day was spent in outdoor play,and there was a two-hour rest period. Break-fast, lunch, and a mid-morning snack wereprovided.
Adult activities program
Accompanying the program for chil-dren was an active adult program. Duringthe first year, the program for parents wascentered on weekly activity-oriented meet-ings, where parents (chiefly mothers, al-though some fathers attended) met at schooland worked on school-support projects, suchas sewing articles of clothing for the chil-dren, unpacking and sorting books, makinggames for the children, etc. As they workedon the projects, the parents chatted inform-ally and joined in discussions, usually led bythe adult activities worker, about the chil-dren and the school program. Occasionallythere was a special demonstration, such asmaking clothing for children from discardedadults' clothing, or a specific talk or film onchild development. Attendance was small,averaging four parents per session. Theseweekly group meetings were supplementedby field trips, and "special occasion" partiesat school (e.g., Christmas, Easter, and Fam-ily Night) which were much more heavilyattended (15-20 parents) and usually in-cluded a number of fathers and siblings.
64
During the second year the emphasisshifted from weekly group meetings to moreone-to-one contacts with the staff. The par-ents were encouraged to visit the school, tohelp in the classroom, and to watch theirchildren from the observation booth, wherea teacher was usually available to talk withthem about the children's activities. Visitsto the homes were also made by the adultactivities worker and occasionally by othermembers of the staff.
All but one of the families visitedschool at least once during the 2 years, andapproximately one-third of the families (allof whom were in the "high" or "middle"SES category) participated fairly regularlyin the adult-activities program, either by at-tending group meetings or by coming to seetheir children in school. Even the parentswho rarely participated in the adult-activi-ties program seemed very sympathetic tothe school and pleased to have their chil-dren enrolled in it.
Test results
To evaluate the impact of the nurs-ery school program, both nursery and com-parison group children were tested beforethe former group's entrance into preschool,at the end of the first year of preschool,and at the end of the second year.
The Stanford-Binet was adminis-tered on all three test rounds. The PeabodyPicture Vocabulary Test, portions of theMerrill-Palmer, and two subtests from theIllinois Test of Psycho linguistics were givenin two of the three test rounds, as a sup-plement to the Stanford-Binet.
The average Stanford-Binet IQ ofthe nursery-group children prior to theirpreschool experiences was 82.7, with a rangeof 53-113 ; the comparison group's averagewas 84.6, with a range of 65-119. In boththe nursery and comparison groups, meanIQ scores showed a consistent, though notstatistically significant relation to family

to
1
MS level, with the children from the high-est level, within this low-income group, re-ceiving the highest scores, and so on downthe line.
After 2 years of preschool, the nurs-ery group's average IQ was 97.1, a gain of11.7 points. The nursery-group boys, whoseinitial average TQ was only 77.3 (whichmay have been the result of a sampling bias)gained 19.6 points, while the girls, whoseinitial IQ averaged 86.3, gained 11.4 points.The comparison group in the same 2-yearperiod made an average gain of 4.1 points.
All the nursery-group children excepttwo made some gain in TQ over the 2-yearperiod. Taken as a whole, this group madeits greatest gain during the first year. Anaverage 10-point gain was made the firstyear, as compared with a 5-point gain thesecond year.
When TQ gain was related to familySES level, it was found that the nurserygroup's gain in the first year was accountedfor primarily by the children (both boysand girls) from the highest SES quartile.Their average gain was 17 points the firstyear, but during the second year theydropped a point, ending up with an averageIQ of 102. in contrast, nursery-group chil-dren from the middle and the lowest SESlevels tended to make more steady, gradualgains during the 2-year period, ending withan average TQ of 96 and 95, respectively.The highest and the lowest SES quartilesmade the same average TQ gain (1.6 points)over the 2-year period, while the middleSES group made a 13-point gain.
A very similar but less striking pat-
tern of IQ increase was found when IQ gainwas related to family income per child.None of the other individual SES variablesappeared related to the extent or pattern ofTQ increase, nor was the latter clearly asso-ciated with the extent of parent participa-tion in the adult activities program, pres-ence of the father in the home, or theparticular teacher. Except for the very fre-quent attenders, there was a positive rela-tionship between children's attendance andextent of IQ gain. The children who had thebest attendance records had IQ scores thatwere slightly higher than average when theProject started, but they made less thanaverage gain over the 2-year period.
On the other tests, too, the nursery-group children made significant gains. Thetwo subtests from the Illinois Test of Psy-cholinguistics (the Auditory-Association andthe Auditory-Automatic) suggested, how-ever, that by the end of the 2 years thesechildren were still over a year below theirage norm in associative language ability andgrammar, and in understanding the meaningof words. This corroborates the impressionof the teaching and research staff that thechildren still had a long way to go beforecatching up with their middle-class peers inexpressive language skills.
While the results of the Project areencouraging, the full value of the nursery-school experience in improving intellectualfunctioning cannot be determined until wesee how these children perform in the nextfew years of public school, and how theirperformance compares with that of the con-trol group.
65
*MO
APPENDIX A
A FURTHER ANALYSIS OF IQ CHANGES
Helen L. Witmer
THE FINDINGS OF THIS STUDYsuggest that a traditional nursery schoolprogram, carried on for 2 years on a full-day basis, can significantly raise the averageIQ of children from low-income families andthus presumably improve their chance ofperforming adequately in regular schoc.The study also showed (1) that the amountof improvement in IQ was likely to be great-est in children who originally scored belowthe group mean, and (2) that the speed ofimprovement in IQ was related to the socio-economic level of the family.
In reviewing the report for publica-tion, it seemed to the Editor that the dataon which these interesting findings werebased should be further analyzed with a viewto greater specificity. There seemed to beparticular need for this because the cate-gories that were used in arriving at thesefindings were relative to the composition ofthe group of children and families in theProject. To be more specific, the cutoffpoint for making the comparisons in regardto IQ change was the mean IQ for the nurs-ery group at the start of the Project. Thatis, the cutoff point referred to this particu-lar group of children and would doubtlessbe somewhat different for other preschoolgroups. Similarly, the socioeconomic cuttingpoints that were used were also peculiar tothe families whose children attended thisnursery school. While good reasons can be ad-duced for using these procedures, it seemedworthwhile to reexamine the data in an
66
attempt to make the findings more preciseand perhaps more widely applicable.
Change at Specified IQ Levels
Where the greatest amount of changetook place
The first step in the analysis was toexamine the original Stanford-Binet IQscores and the changes in those scores bythe end of the second year. At questionwere (1) how fine a breakdown in scoresshould be made and (2) what breakdownpoints afforded the greatest contrast inamount of change.
The figures that were used in thisanalysis are given i a Table IA, which showsthe mean IQ gains of the nursery-school andcomparison-group children divided in vari-ous ways.
Considering the nursery-school chil-dren first, we see that, regardless of wherethe breaks in scores are made, as originalIQ scores go up there is a steady decline inthe average amount of gain. For instance,the five children who scored under 70 in1964 increased 23.6 points on the averageby 1966, while the 10 who originally scored90 or above gained only about a third asmuch-7.9 points.
The diagonals on the table tell the

Table I-A
MEAN CHANGE IN IQ BETWEEN 1964 AND 1966
(BY VARIOUS IQ CATEGORIES)
Nursery-School Group
IQ at StartNumber Mean Change in IQ of Various Subgroups
Not Testedin '66 Tested 5-point
intervals10-pointintervals
10-pointintervals
Varyingintervals
Below &Above 85
Under 70 5 23.6 23.623.1
20.9 18.670 -74 - -- 1 3 23.0
.. 19.7
75-79 9 18.71 16.1
80-84 5 11.411.5 11.5
7.2
--85-89 1 3 , 11.7}.10.1
90-94 1 5 9.2
7.9 7.995-104 4 6.5
4.6105-109
110 & up 1 -3.0
Total 3 35 13.9 13.9 13.9 13.9 13.9
Comparison Group
Under 70 4 3.7 3.7 7.67.1
3.9
5.570-74 1 6 10.38.0
75-79 11 6.6}. 4.5
80-84 3 11 2.44.0
85-89 1 10 5.6}. 4.5
2.3,90-94 10 3.4
r
0.7 ).-2.495-104 1 7 -4.0
-2.4105-109 _____
110 & up 2 3.0
Total 8 61 4.3 4.3 4.3 I 4.3 4.3
67
same story. The farther up the IQ scale thebreak in scores is made, the smaller theaverage IQ gain. When the lowest cutoffpoint is put at 69, the average gain for thelowest-scoring group is 23.6 points ; when itis put at 74 the gain is 23.1; at 79 it is 20.9points gain ; at 84, 18.6 points. The sametrend, though less marked, is shown at theother end of the scale.
The question then is : which cutoffpoints tell the story best? There is, of course,no right answer. In view of the small num-ber of cases, however, a break at the 5-pointlevels of IQ seemed too fine, while using adichotomy made the picture less dramaticthan it actually was, and perhaps of lesspractical significance. The best cutoff pointsseemed to be the 10-point levels. Was itbetter, then, to make the break at 70, 80,and 90 IQ or at 75, 85, and 95? In the fol-lowing analysis we chose the latter cutoffpoints, chiefly because it showed better thesmall amount of gain made by the childrenwho had high IQ scores at the start. Themean gains for the 2 years in which theProject was in operation were as follows asshown in Table IA. The number of childrenin each subgroup is given in parentheses.
NurseryGroup
ComparisonGroup
Under 75 23.1 (8) 7.6 (10)
75-84 16.1 (14) 4.5 (22)
85-94 10.1 (8) 4.5 (20)
95 and up 4.6 (5) 2.4 (9)
Two main conclusions can be drawnfrom this comparison. First, at each IQlevel the children who attended the nurseryschool outdistanced those in the comparisongroup in average gain in IQ, the nursery-school children's average gain being two tothree times as great as that of the otherchildren.
68
Second, in both groups the averageamount of gain became smaller as the orig-inal IQ level increased. Nursery-school chil-dren whose IQ score was 95 or above in1964 had gained only a fifth as much by1966 as had those whose original scoreswere under 75. There was much the samedifference in the comparison group.
Changes at various IQ levels
Table IIA takes the analysis a bit fur-ther by showing the distribution of individ-ual IQ changes within each IQ range andfor each group of children. Such a compari-son seemed worth making because some ofthe averages concealed a wide variation fromcase to case, in both the nursery-school andthe comparison groups.
Overall, the changes in the nursery-school children's IQ scores ranged from aloss of 3 points to a gain of 45 points be-tween the first and the last round of testing.The 45 points were gained by a child whoattended the nursery school, his IQ risingfrom 77 to 122. (See Terman, Appendix B.)While this was by far the greatest gain,three other nursery- school children gained31 or 32 points, starting from IQ's in the60's or 70's. In the comparison group, onlyone child gained more than 20 points, thischild having started with an IQ score of 80and ending with 101.
As to losses, only one child who at-tended nursery school had a lower score atthe end than at the beginning of the pro-gram, and hers was a change from 113 to110.
In the comparison group, however,11 of the 61 children who were tested inboth 1964 and 1966 lost over 5 points in IQ,six of them losing over 10 points. Losses ofmore than 5 points were relatively more fre-quent among comparison-group childrenwhose IQ's were in the normal range at thestart.
Table IIA again shows that there wasa clear relation between the size of the nurs-ery children's gains in IQ and the scores
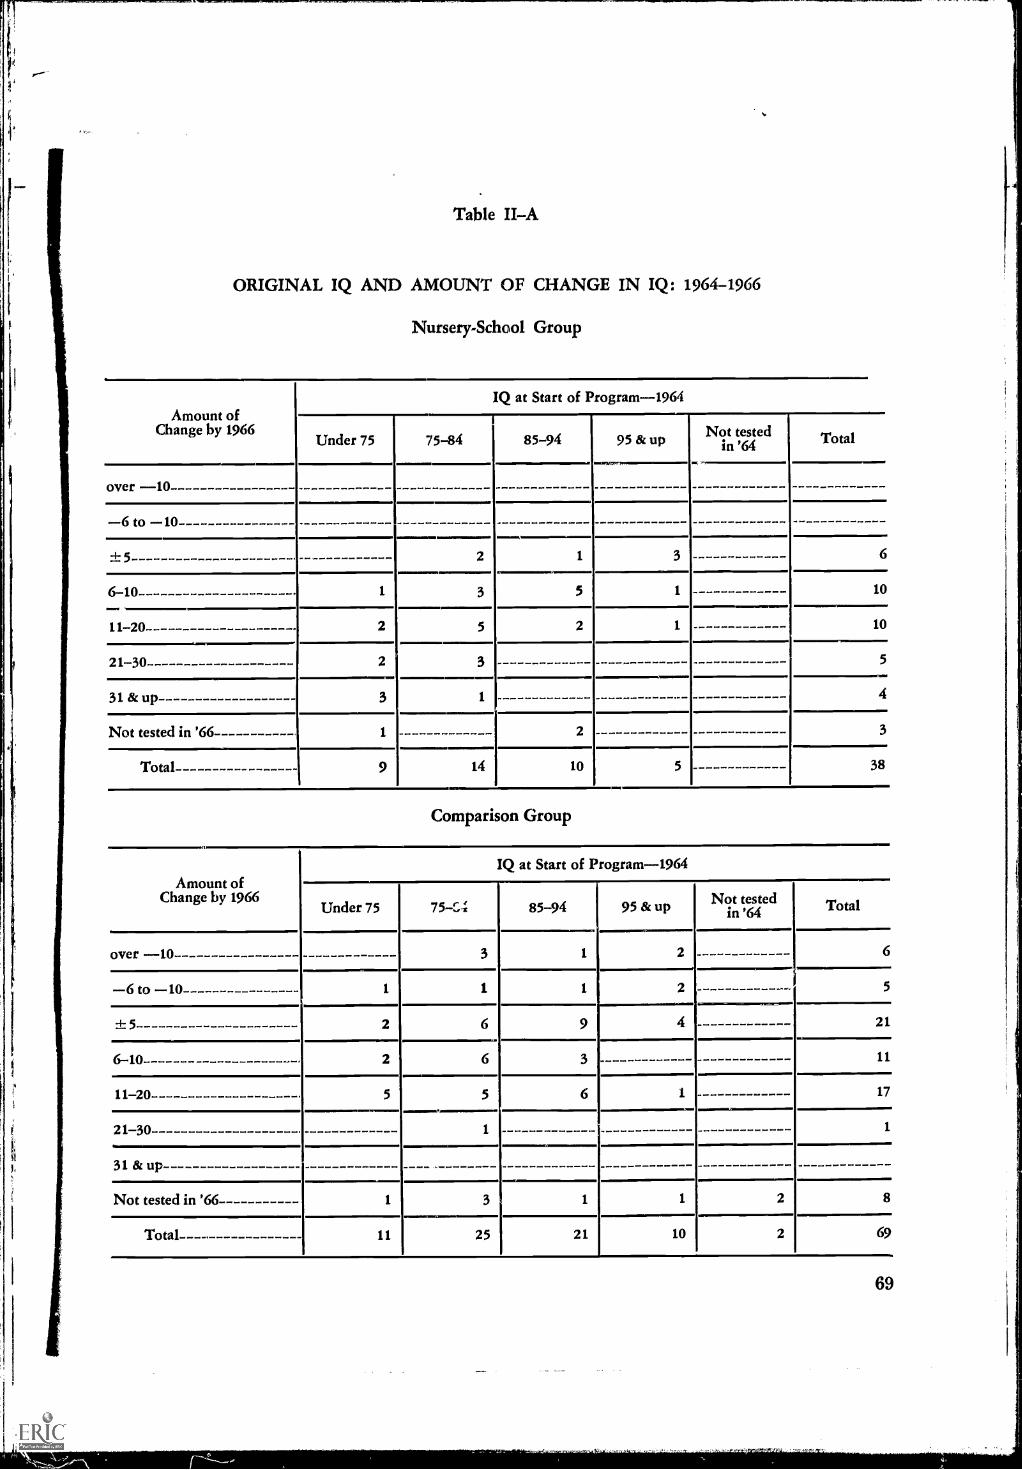
Table IIA
ORIGINAL IQ AND AMOUNT OF CHANGE IN IQ: 1964-1966
Nursery-School Group
Amount ofChange by 1966
IQ at Start of Program-1964
Under 75 75-84 85-94 95 & up Not testedin '64 Total
over 10
6 to 10±5 2 3 6
6-10 1 3 1 10
11-20 2 5 1 10
21-30 3 5
31 &up 3 4
Not tested in '66 1 2 3
Total 9 14 10 5 38
Comparison Group
Amount ofChange by 1966
IQ at Start of Program-1964
Under 75 75 -C= 85-94 95 & up Not testedin '64 Total
over 10 2 6
6 to 10 1 1 1 2 5
±5 2 6 9 4 21
6-10 2 11
11-20 5 5 6 1 17
21-30 1
31 &up
Not tested in '66 1 3 1 1 2 8
Total- 11 25 21 10 2 69
69

with which they started. Only two of thefive nursery-school children with IQ's above94 gained more than 5 points, one gaining6 and the other 13. In contrast, five of theeight children under 75 at the start gainedover 20 points.
The table shows gains of more than10 points becoming increasingly uncommonas the beginning IQ level rises. In otherwords, as the averages listed on page 68indicated, the children who seemed mosthandicapped at the outset were the onesmost likely to make large gains.
The tendency of low IQ's to rise isshown in the comparison group as well asin the nursery group but not to nearly thesame extent. (This was also demonstratedby the mean scores cited above.) Only oneof the 10 comparison-group children whoseIQ's were under 75 at the outset lost over5 points, and five of them gained more than10 points. At the other end of the scale, theratio of losses of over 5 points to gains ofover 10 points was 4 to 1, and the IQ's ofhalf of the children did not change to anysignificant extent. This may evidence thefamiliar phenomenon of regression towardthe mean. If so, however, it is a phenomenonthat was obscured in the nursery group bythe influence of the nursery school, whichapparently exerted an upward push on theIQ's of practically all the children,
Since the size of the change in IQwas related to the original IQ level and sincea somewhat greater proportion of nursery-school than of comparison-group childrenhad low IQ's at the start, Table IIA shouldbe examined with IQ being held constant.In this way the question of whether thenursery school was especially beneficial tochildren of certain IQ levels can be answeredin detail.
At each IQ level and in both nursery-school and comparison groups there was aconsiderable variation in the amount of IQchange made by individual children. Theextent of the variation was greater, how-ever, in the comparison group. This wasprobably to be expected, since these chil-
70
dren did not have the relatively uniformexperience that the nursery school provided.Even so, the absence of losses of more than5 points in the nursery group and the ab-sence of gains of more than 20 points in thecomparison group are striking.
When the extreme IQ levels are con-trasted, it is seen that the nursery-schoolexperience apparently helped many of themost handicapped children to make largegains. (Five a° the eight children with anIQ under 75 gained over 20 points, as con-trasted with none of the 10 such childrenin the comparison group.) Alternatively, thenursery school helped the children whoscored highest at the start to avoid markedlosses. None of the five nursery-school chil-dren with IQ's of 95 or more lost more than3 points, while nearly half of the nine com-parison-group children lost 7 to 17 points.
In between the extremes of under 75and over 94, the story was the same. Thenursery school was more successful in help-ing the children with the lower IQ's to makelarge gains. Four out of 14 nursery-schoolchildren with IQ's between 75 and 84 gainedover 20 points, as contrasted with 1 out of 24in the comparison group. Among the chil-dren with IQ's between 85 and 94, none madeso large a gain, either in the nursery-schoolgroup or in the comparison group. Nearlyhalf of such children in the comparisongroup declined over 5 points in IQ, whileattendance at nursery school presumablykept this from happening to the other groupof children.
When the Change Took Place
The Howard University PreschoolProject provided 2 years of schooling to thechildren in the nursery group. This is aconsiderably longer period of schooling thanthat provided by many preschool projects.With this length of schooling, it seemed im-portant to determine when the major

changes in intellectual functioning occurred,how large the changes were, and at whatIQ levels the change was greatest.
The writers of the report have shownthat the nursery-school children had gainedan average of 10.1 points by the end of thefirst year in school but that during the sec.and year their average gain was muchsmaller, being only 4.6 points. Moreover,while in the first year the nursery-schoolchildren made a much greater gain than thechildren in the comparison group, in thesecond year the average amount of gain inthe two groups did not differ greatly. Doesthis mean that the nursery school's influ-ence declined in the second year? Does itmean, indeed, that the gain made by thenursery-school children in the second yearwas perhaps not attributable to the influ-ence of the school, since the comparison-group gained almost as much withoutattending?
The writers of the report concludethat the explanation is to be found not in adecline in the influence of the nursery schoolbut in the delayed impact of the school'sprogram on the children from the lowestsocioeconomic level. They found that thebetter-situated children made their majorIQ gain in the first year, while in the secondyear these children made relatively smallgains. This lowered the group average forthe second year and obscured the school'seffectiveness with the other children.
This is a finding that will be pur-sued further. First, however, we want toexamine the second year's changes in termsof IQ levels, for it seems possible that anexplanation of the apparent slowing-downof gains can be found in that factor also.
One way of looking at the questionof when the gains occurred and what relationthis bore to IQ level is to ignore the exactsize of the gain and merely to note in whichyears gains of significance occurred. ("Sig-nificance" is here defined as a gain of over 5IQ points.) Table IIIA gives the figures, theIQ scores being those at the start of theproject.
Table IIIA
WHEN GAIN OF OVER5 IQ POINTS TOOK PLACE
Nursery School
Year in WhichIQ at Start of Program
Gain WasMade Under
7575-84 85-94 95 andup Total
First only--- 4 6 4 2 16
Second only 2 1 2 2 7
Both 3 4 7
Neither 2 2 1 5
Missed one ormore tests--- 1 2 3
Total- - -- 10 13 10 5 38
It can be seen in this table that justabout half of the children in each IQ cate-gory made significant gains only in the firstyear. A few children (a fifth of the total)gained only in the second year. All of thechildren who made significant gains in bothyears had IQ's under 85 at the start. Fiveof the 35 children who were tested all threetimes did not gain over 5 points in eitheryear, though several of them had a cumu-lative gain of more than that amount overthe 2 years.
These figures are in line with theearlier finding in regard to a slowdown ingains in the second year. A point that throwsfurther light on patterns of gain is that noneof the children whose IQ's were 85 or aboveat the start gained significantly in both years,though nearly all of them gained in eitherthe first or the second year. This suggeststhat once children gained enough to reacha normal IQ level they were unlikely to makegains of more than 5 points. The figures inthis table could not fully confirm that con-clusion but they set us on the path of re-considering IQ levels in relation to amountof gain made in the second year.
71

In inquiring about the size of thegains made in the second year by childrenof particular IQ levels, there are two waysof stating the question. We can ask howmuch the children gained in the second yearas compared with the first, in terms of theIQ scores they had at the start of the pro-gram. Alternatively, we can ask how muchthe children who had attained certain IQ'sby the end of the first year gained by theend of the second year. In both cases wewould want to find out how much differencethere was between the gains of the nursery-school group and those of the comparisongroup.
So long as the examination of IQchange is confined to the groups as wholes, itmakes no difference which of these two ques-tions was asked. The answer (though not theexplanation for it) would be the same ineither case. But when we want to determinewhen the changes at particular IQ levelsoccurred, it makes a great deal of differencewhich question is asked, especially when thecomparison and nursery-school groups areto be contrasted.
The figures that are secured when thequestion is put in the first way are shown inTable IV-A. Looking at the figures for thenursery school, we see that in each year(just as by the end of the 2 years combined)there was a progressive decline in IQ gainas the original IQ level rose. In the first yearthe average gain ranged from 15.5 points forthe children under 75 to 4.8 points for thosewith IQ's of 95 or more. In the second yearthe range was from 7.6 to -0.2.
In addition, in each IQ category, theamount of gain was smaller in the secondyear than in the first. Indeed, in the secondyear, the average gain of the children whostarted with IQ's of 95 or above was zero.
In the comparison group the storywas somewhat different. In the first year,the average gain was very small in any ofthe IQ groups, ranging from 2.5 to -3.8.In the second year the gains in three of thefour groups were slightly larger. Even so,only the children whose IQ's were under 75
72
Table IV -A
MEAN GAIN IN IQ IN EACH YEAR
Children grouped according to IQat beginning of program
Mean Gain in IQ
IQ at Startof Program
Nursery Group
FirstYear
Sec-ondYear
TotalGain
Under 75 15.5 7.6 23.1
75-84 12.3 3.8 16.1
85-94 6.6 3.5 10.1
95 and up 4.8 -0.2 4.6
Total meangain 10.1 4.6 14.7
Comparison Group
First I Sec- Totalond
MYear I Year Gain
2.2 5.4 7.6
1.7 2.8
2.5 2.0
-3.8 1.4
4.5
4.5
-2.4
0.8 3.3 I 4.1
at the start made an average gain of over5 points.
This difference between the two groupsin regard to when their greatest gains weremade (the nursery-school group in the firstyear and the comparison group in the sec-ond) meant that there was little differencebetween the two groups in the average gainsthey made in the second year.
If the analysis stopped there, thebreakdown by IQ categories would not haveadvanced our understanding of why therewas so little difference between the nursery-school and the comparison group in the sec-ond year. The picture is quite different, how-ever, when the changes in the second yearare described in terms of the children's IQscores at the end of the first year. This dif-ference arises from two facts. First, duringthe first year the amount that particularchildren gained varied considerably, eventhough they were in the same IQ group atthe start. Second, in that year most of thechildren who attended nursery school gainedmuch more than those who were in the com-parison group. In consequence, by the endof the first year the distribution of IQ's in
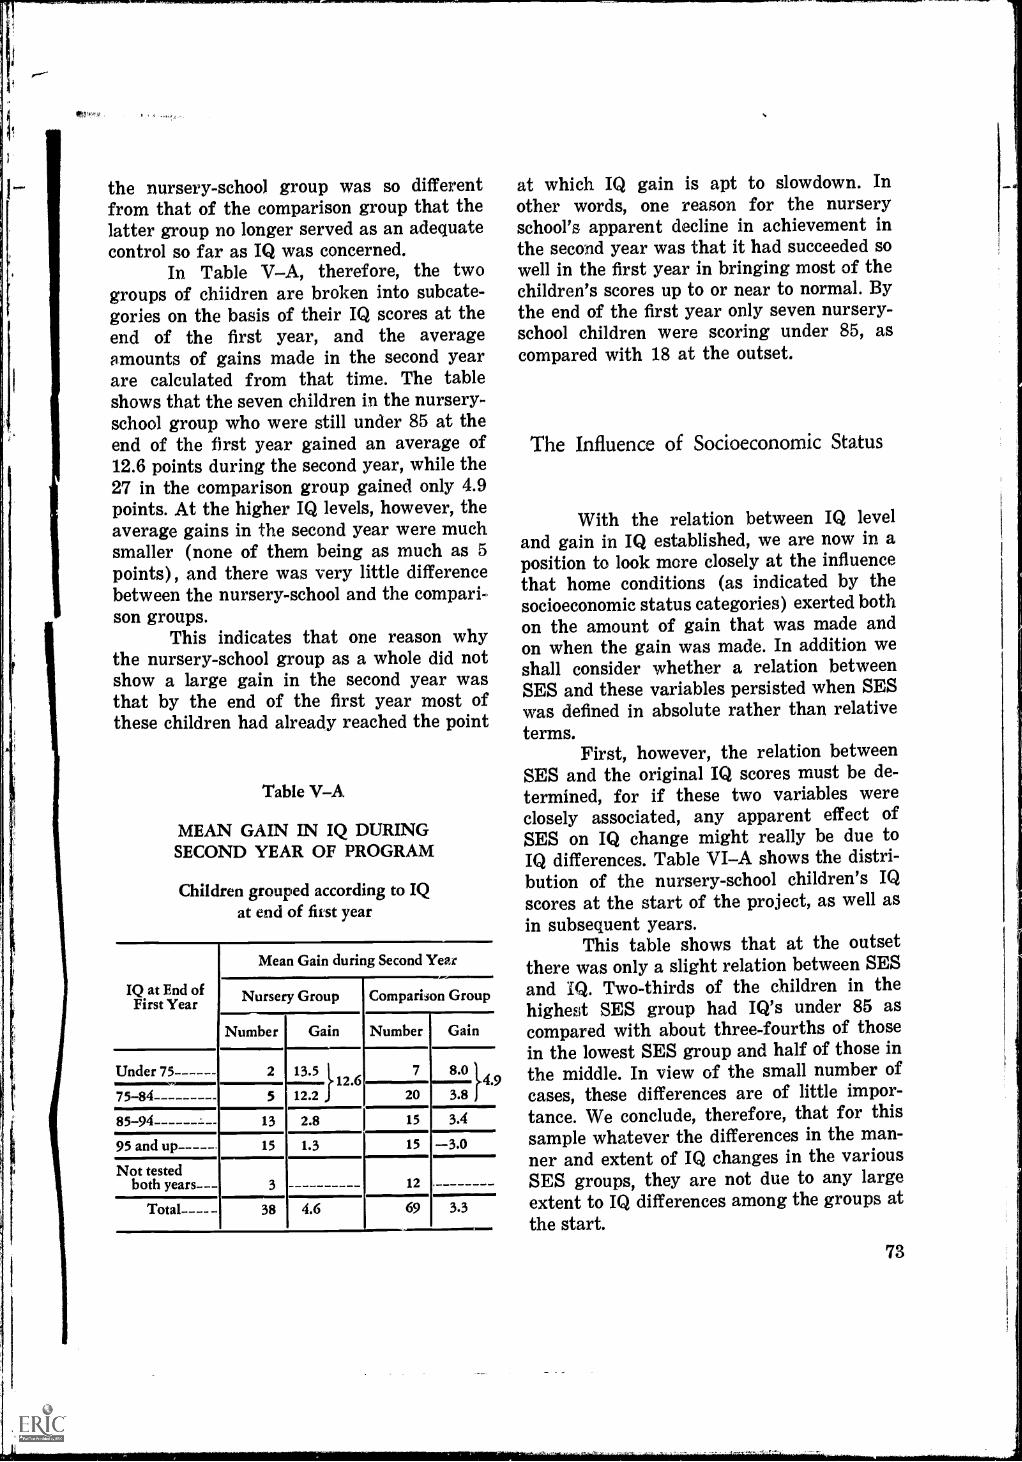
the nursery-school group was so differentfrom that of the comparison group that thelatter group no longer served as an adequatecontrol so far as IQ was concerned.
In Table VA, therefore, the twogroups of chiidren are broken into subcate-gories on the basis of their IQ scores at theend of the first year, and the averageamounts of gains made in the second yearare calculated from that time. The tableshows that the seven children in the nursery-school group who were still under 85 at theend of the first year gained an average of12.6 points during the second year, while the27 in the comparison group gained only 4.9points. At the higher IQ levels, however, theaverage gains in the second year were muchsmaller (none of them being as much as 5points), and there was very little differencebetween the nursery-school and the compari-son groups.
This indicates that one reason whythe nursery-school group as a whole did notshow a large gain in the second year wasthat by the end of the first year most ofthese children had already reached the point
Table VA
MEAN GAIN IN IQ DURINGSECOND YEAR OF PROGRAM
Children grouped according to IQat end of first year
IQ at End ofFirst Year
Mean Gain during Second Year
Nursery Group Comparison Group
Number Gain Number Gain
Under 75 2 13.5 7 8.0
75-84 5 12.2 20H.!
3.8
85-94 13 2.8 I 15 3.4
95 and up 15 1.3 15 3.0Not tested
both years--- 3 12
Total---- - 38 4.6 69 3.3
at which IQ gain is apt to slowdown. Inother words, one reason for the nurseryschool's apparent decline in achievement inthe second year was that it had succeeded sowell in the first year in bringing most of thechildren's scores up to or near to normal. Bythe end of the first year only seven nursery-school children were scoring under 85, ascompared with 18 at the outset.
The Influence of Socioeconomic Status
With the relation between IQ leveland gain in IQ established, we are now in aposition to look more closely at the influencethat home conditions (as indicated by thesocioeconomic status categories) exerted bothon the amount of gain that was made andon when the gain was made. In addition weshall consider whether a relation betweenSES and these variables persisted when SESwas defined in absolute rather than relativeterms.
First, however, the relation betweenSES and the original IQ scores must be de-termined, for if these two variables wereclosely associated, any apparent effect ofSES on IQ change might really be due toIQ differences. Table VIA shows the distri-bution of the nursery-school children's IQscores at the start of the project, as well asin subsequent years.
This table shows that at the outsetthere was only a slight relation between SESand IQ. Two-thirds of the children in thehighest SES group had IQ's under 85 ascompared with about three-fourths of thosein the lowest SES group and half of those inthe middle. In view of the small number ofcases, these differences are of little impor-tance. We conclude, therefore, that for thissample whatever the differences in the man-ner and extent of IQ changes in the variousSES groups, they are not due to any largeextent to IQ differences among the groups atthe start.
73

This point being established, we havenext to ask to what extent the three SESgroups differed in the gains they made andin the speed with which they changed. Sofar as this is indicated by the distributionof IQ's at the end of each year,. Table VI--Atells the story.
By the end of the first year, the dis-tribution of IQ's in the three SES groups hadchanged greatly. All of the children whosehomes were rated in the top SES quartilenow had IQ's of 85 or over. In fact, none ofthem was under 90, three were between 95and 104, and three were over 110. At theother end of the economic scale, only six of
the 11 children in the lowest SES groupwere 85 or over, and two still had IQ scoresin the 60's. In the middle group, 14 of the 18children scored 85 or above, and 10 of thesewere over 90.
By the end of the second year the IQdistributions had come nearer together. Evenso, three children in the lowest SES groupstill scored under 85. Two of these were chil-dren who had changed little over the 2 years:one had stayed at 77 IQ; the other hadmoved from 66 to 74. The third child's IQ,however, had gone up from 59 to 81. Asidefrom these three children and two others inthe middle SES category, all of the children
Table VIA
SOCIOECONOMIC STATUS AND IQ DISTRIBUTION ATBEGINNING, MIDDLE, AND END OF THE PROGRAM
Socioeconomic Status
IQ Scores
At Start of Program
under65
65--74 75-84 85-94 95-104 105 and up Total
Top quartile 2 4 1 1 1 9
Middle 4 5 7 2 18
1 2 5 2 1 11Lowest quartile
Total 1 8 14 10 4 1 38
At End of First Year
Top quartile 2 3 4 9
Middle 4 10 4 18
Lowest quartile 1 1 3 2 3 1 11
Total 1 7 14 10 5 38
At End of Second Year
Top quartile 3 2 4 9
Middle 1 6 6 3 16
Lowest quartile- 1 2 2 3 2 10
TotalI
1
1%3 11 11 9 35
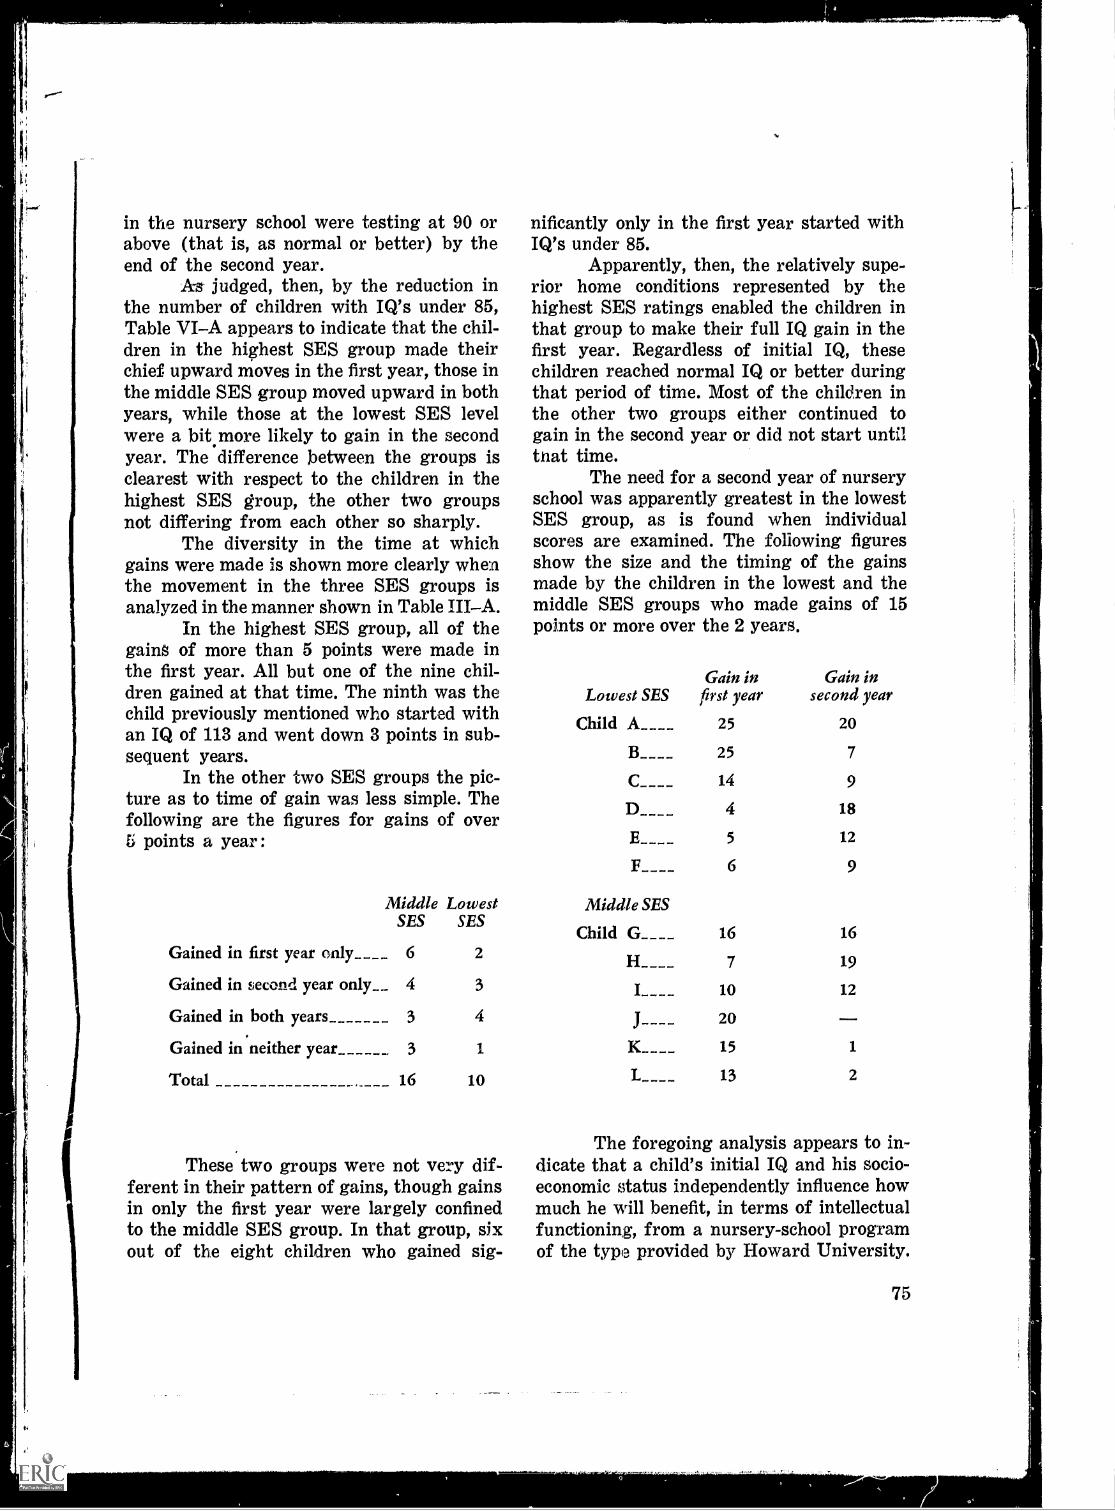
in the nursery school were testing at 90 orabove (that is, as normal or better) by theend of the second year.
A-s judged, then, by the reduction inthe number of children with IQ's under 85,Table VIA appears to indicate that the chil-dren in the highest SES group made theirchief upward moves in the first year, those inthe middle SES group moved upward in bothyears, while those at the lowest SES levelwere a bit, more likely to gain in the secondyear. The difference between the groups isclearest with respect to the children in thehighest SES group, the other two groupsnot differing from each other so sharply.
The diversity in the time at whichgains were made is shown more clearly whenthe movement in the three SES groups isanalyzed in the manner shown in Table IIIA.
In the highest SES group, all of thegains of more than 5 points were made inthe first year. All but one of the nine chil-dren gained at that time. The ninth was thechild previously mentioned who started withan IQ of 113 and went down 3 points in sub-sequent years.
In the other two SES groups the pic-ture as to time of gain was less simple. Thefollowing are the figures for gains of over5 points a year:
Middle LowestSES SES
Gained in first year only__ 6 2
Gained in second year only_ 4 3
Gained in both years 3 4
Gained in neither year 3 1
Total 16 10
These two groups were not very dif-ferent in their pattern of gains, though gainsin only the first year were largely confinedto the middle SES group. In that group, sixout of the eight children who gained sig-
nificantly only in the first year started withIQ's under 85.
Apparently, then, the relatively supe-rior home conditions represented by thehighest SES ratings enabled the children inthat group to make their full IQ gain in thefirst year. Regardless of initial IQ, thesechildren reached normal IQ or better duringthat period of time. Most of the children inthe other two groups either continued togain in the second year or did not start untilthat time.
The need for a second year of nurseryschool was apparently greatest in the lowestSES group, as is found when individualscores are examined. The following figuresshow the size and the timing of the gainsmade by the children in the lowest and themiddle SES groups who made gains of 15points or more over the 2 years.
Lowest SESGain in
first yearGain in
second year
Child 25 20
B____ 25 7
C____ 14 9
D___ 4 18
5 12
6 9
Middle SES
Child G____
J----K____
L____
16 16
7 19
10 12
20
15 1
13 2
The foregoing analysis appears to in-dicate that a child's initial IQ and his socio-economic status independently influence howmuch he will benefit, in terms of intellectualfunctioning, from a nursery-school programof the type provided by Howard University.
75

The first of these factors influences howlarge his IQ gain will be ; the second, howsoon within a 2-year span the major part ofthe gain will be made.
The findings with regard to the IQfactor have been expressed in absolute terms ;that is, in terms that are independent ofthis particular study. With respect to socio-economic status, however, the analysis sofar has been confined to groupings that referto this particular study only. Nearly all ofthe families in the study were described asdeprived but degrees of deprivation and ofability to cope with deprivation were recog-nized and were used as the basis for classifi-cation. The families were grouped (by forcedchoice on the part of the research staff)into an upper and a lower quartile and thehalf that lay between. This grouping, as wehave seen, produced interesting findings, butthe findings cannot be easily applied to otherpreschool programs since the range of con-ditions represented in the quartiles wouldprobably differ from one program to an-other.
As a final step in the analysis, there-fore, we classified the families and theirchildren in accordance with the income-levelcategories that have been devised by the U.S.Social Security Administration and used inconnection with the Federal Government'sprogram. As noted above (page 22) , theselevels take into account the number of per-sons in the family, the sex of the familyhead, and farm vs. nonfarm residence.
In doing this, our chief interest was todetermine whether this classification schemewould provide a means that could be used byother investigators and practitioners to dis-tinguish between the children who would belikely to need 2 years of nursery school tomake their maximum gain and those whowould be likely to make most or all of theirgain in the first year. These figures are givenin Table VIIA, where, as in Table IIIA,gains are regarded as significant if theywere over 5 IQ points.
This table shows much the same rela-ti,..-nship between income level and time of
76
gain as that indicated by the SES groupingsthat were used in the Howard Universitystudy, except that the picture presented bythe children in the highest income level isnot quite so striking. Again, the best-situatedchildren were apt to make their chief gainin the first year. This was the pattern of63 percent of the children at this economiclevel, of 43 percent at the next level, and of37 percent of the children who were livingin poverty. A third of the latter children didnot make a significant gain until the secondyear, as contrasted with about 13 percent ofthe children in the other two groups. Theproportion of children who gained in bothyears increased as income became less thanadequate.
Table VIIA
TIME OF SIGNIFICANT GAIN IN IQAS RELATED TO INCOME LEVEL:
NURSERY GROUP ONLY
Time of Gainingover 5 Points
in IQ
Income Level of Family
Ade-quate
Border-line Poverty Total
First year only 5 3 7 15
Second year only - - -- 1 1 6 8
Both years 1 2 4 6
Neither year 1 1 2 3
No test 3 3
Total 8 7 22 37*
*Income not lc, own in one case.
Comparison of the figures secured bythe two ways of grouping the children inregard to economic standing showed that thethree adequate-income children who madegains in other than the first year were clas-sified in the middle category by the SES rat-ing scheme used in the study. Contrariwise,the three children in the borderline-incomecategory who gained only in the first yearwere in the highest SES group in the study.This and other differences that could be
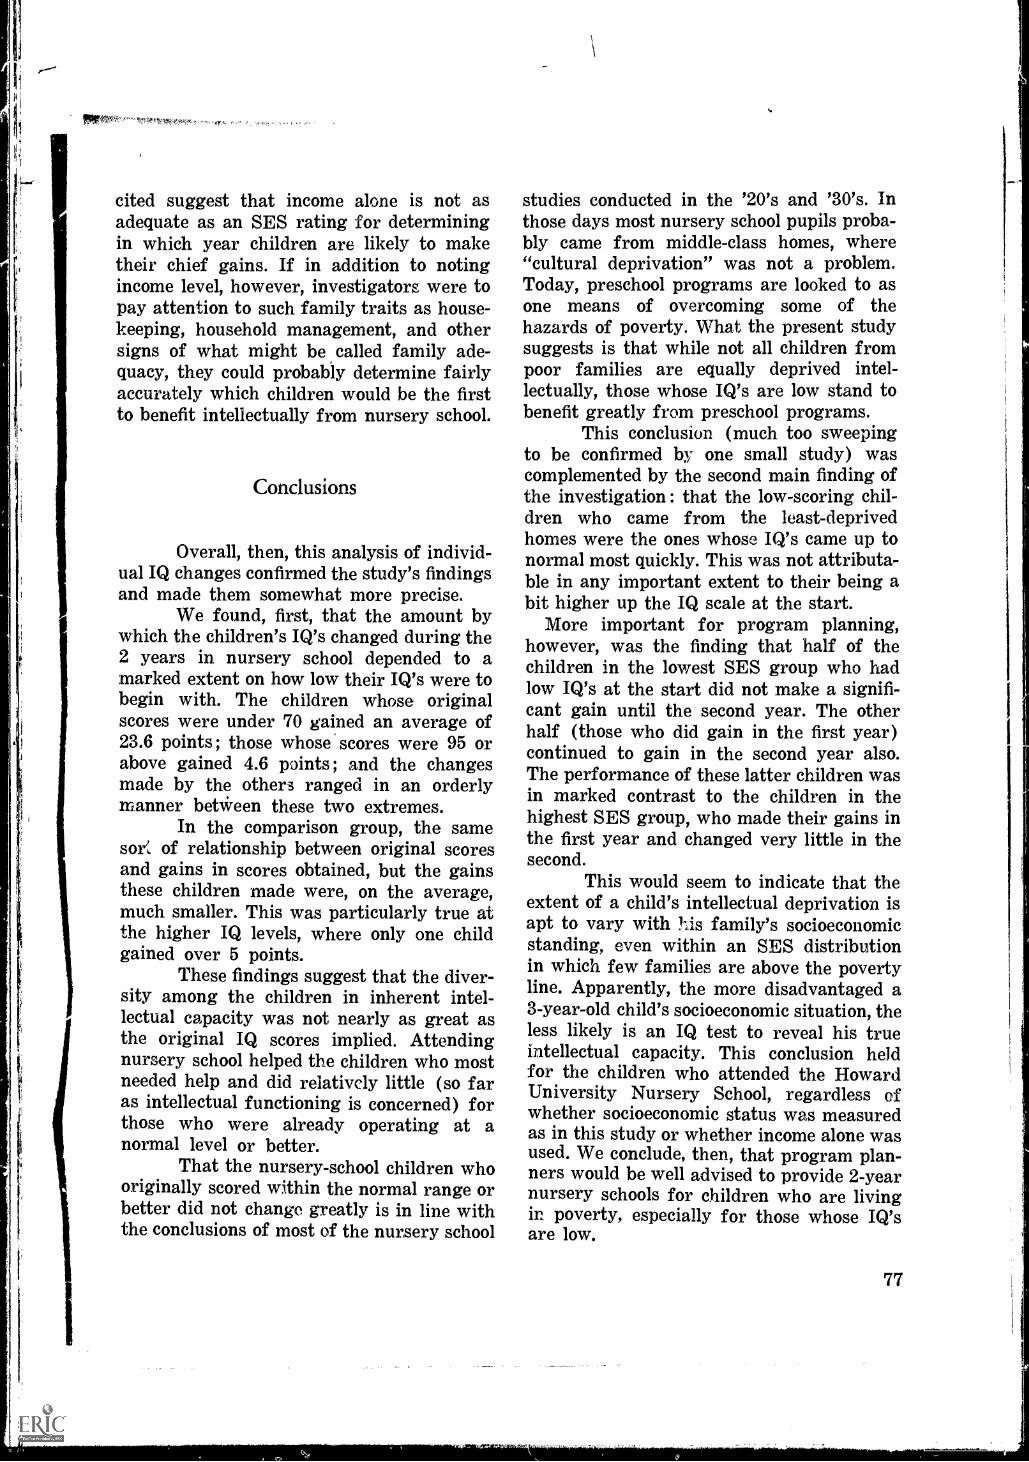
cited suggest that income alone is not asadequate as an SES rating for determiningin which year children are likely to maketheir chief gains. If in addition to notingincome level, however, investigators were topay attention to such family traits as house-keeping, household management, and othersigns of what might be called family ade-quacy, they could probably determine fairlyaccurately which children would be the firstto benefit intellectually from nursery school.
Conclusions
Overall, then, this analysis of individ-ual IQ changes confirmed the study's findingsand made them somewhat more precise.
We found, first, that the amount bywhich the children's IQ's changed during the2 years in nursery school depended to amarked extent on how low their IQ's were tobegin with. The children whose originalscores were under 70 gained an average of23.6 points ; those whose scores were 95 orabove gained 4.6 points ; and the changesmade by the others ranged in an orderlymanner betWeen these two extremes.
In the comparison group, the samesori, of relationship between original scoresand gains in scores obtained, but the gainsthese children made were, on the average,much smaller. This was particularly true atthe higher IQ levels, where only one childgained over 5 points.
These findings suggest that the diver-sity among the children in inherent intel-lectual capacity was not nearly as great asthe original IQ scores implied. Attendingnursery school helped the children who mostneeded help and did relatively little (so faras intellectual functioning is concerned) forthose who were already operating at anormal level or better.
That the nursery-school children whooriginally scored within the normal range orbetter did not change greatly is in line withthe conclusions of most of the nursery school
studies conducted in the '20's and '30's. Inthose days most nursery school pupils proba-bly came from middle-class homes, where"cultural deprivation" was not a problem.Today, preschool programs are looked to asone means of overcoming some of thehazards of poverty. What the present studysuggests is that while not all children frompoor families are equally deprived intel-lectually, those whose IQ's are low stand tobenefit greatly from preschool programs.
This conclusion (much too sweepingto be confirmed by one small study) wascomplemented by the second main finding ofthe investigation : that the low-scoring chil-dren who came from the least-deprivedhomes were the ones whose IQ's came up tonormal most quickly. This was not attributa-ble in any important extent to their being abit higher up the IQ scale at the start.
More important for program planning,however, was the finding that half of thechildren in the lowest SES group who hadlow IQ's at the start did not make a signifi-cant gain until the second year. The otherhalf (those who did gain in the first year)continued to gain in the second year also.The performance of these latter children wasin marked contrast to the children in thehighest SES group, who made their gains inthe first year and changed very little in thesecond.
This would seem to indicate that theextent of a child's intellectual deprivation isapt to vary with !lis family's socioeconomicstanding, even within an SES distributionin which few families are above the povertyline. Apparently, the more disadvantaged a3-year-old child's socioeconomic situation, theless likely is an IQ test to reveal his trueintellectual capacity. This conclusion heldfor the children who attended the HowardUniversity Nursery School, regardless ofwhether socioeconomic status was measuredas in this study or whether income alone wasused. We conclude, then, that program plan-ners would be well advised to provide 2-yearnursery schools for children who are livingin poverty, especially for those whose IQ'sare low.
77
APPENDIX B
BRIEF SKETCHES OF FOUR FAMILIES *
THE PURPOSE of this section is topicture more vividly the children and theirfamilies who were enrolled in the HowardProject. We have chosen four families (fivechildren) more or less arbitrarily, keepingin mind that we wanted at least one familyfrom each of the three SES levels and thatwe wanted to draw on the records of theobservations made by the research staff on12 of the 38 children in the nursery school.Thus the selection was not exactly repre-sentative of the nursery group as a whole.
The Terman Family
The Terman family was in the lowestof our SES categories. The student canvasserwho first identified this family as containinga likely candidate for the nursery schooldescribed the mother as friendly and co-operative. The canvasser rated the neighbor-hood and the appearance of the dwelling asdilapidated and run-down, although thehousekeeping in the apartment unit wasdescribed as neat and orderly.
This impression was reinforced bythe adult worker in a home interview inJuly 1964, when Mrs. Terman was invited toenroll her son Geoffrey in the preschool. Theapartment was described as dark and dingy,located in a basement adjacent to a furnace
* All names have been changed for this report.
78
room, although an effort was apparentlymade to keep the apartment clean and neat.The mother was pleased to have her sonattend the Howard Children's Center andagreed to keep the necessary pediatric andpsychological appointments.
Duly enrolled in the preschool,Geoffrey had one of the best attendancerecords in the 1964-65 year ; he was present92 percent of the time. His attendancedropped to 79 percent the second year, pri-marily because of the 3-week absence de-scribed below.
At the time of the baseline interviews,conducted by the adult worker in fall 1964,the Terman family consisted of the mother,a father substitute, and four boys : one 7years old, the 3-year-old Geoffrey, one a yearand a half old, and an infant of 7 months.Another boy was born in February 1966.Mrs. Terman also had three older childrenwho were in an institution pending theirplacement in foster homes.
Geoffrey's biological father was a 35-year -old native of Washington, D.C., wholived only a few blocks from the Termans'current address. He saw his children infre-quently and did not seem to take muchinterest in them.
Mrs. Terman had been living forabout a year in a common-law relationshipwith a 32-year-old man who grew up in theDistrict and worked as a laborer for awrecking company. The total yearly incomeof the family was assessed at $4,500, whichmay be a high estimate in light of the factthat in the course of the year the father
substitute showed himself to be a somewhatirregular worker. From this estimated in-come, $82 was spent on rent for the shabbybasement apartment, which consisted of akitchen, one general sleeping and livingroom, and a shared bathroom.
At the outset of the project, Mrs. Ter-man was 28 and had lived in the District forthe past 10 years. She grew up in a ruralpart of Virginia, one of six children. Whilereporting that she attended school throughthe 10th grade, it would probably be fair toestimate her scholastic attainments as notmuch above a fourth or fifth grade level.
The adult worker described Mrs. Ter-man as a "pleasant, soft-spoken woman whois attractive and responsive." Mrs, Termanseemed to value highly the preschool experi-ence for Geoffrey, was always reliable inhaving him ready for the bus, and said thatit was only family responsibilities and herneed to give constant attention to the babythat prevented her from participating in theadult activities and visiting Howard Univer-sity. The infant was frequently sick andrequired a number of visits to the hospital inthe 1964-65 year. The 1965-66 year was alsoa difficult time for the family. With the birthof another baby, who almost immediatelycontracted pneumonia, Mrs. Terman had torely on her oldest son, who was 9 whenthe new baby was born, to look after theyounger children while she went to thehospital.
Staff contacts with the Termans con-sisted for the most part of inquiries andassistance concerning Geoffrey's health, in-cluding arrangement of clinic appointments.In May 1965 there was some evidence thatthe common-law relationship was becomingunstable. Mrs. Terman and the childrenmoved away and were absent for about 2weeks. The mother did not inform the schoolof her plans, contact was temporarily lostwith the family, and Geoffrey was absentfrom school 10 out of 20 days in May, thusbreaking his nearly perfect attendance rec-ord. During this time Mrs. Terman stayedin a Salvation Army facility and made an
effort to secure support from the Depart-ment of Welfare, This effort was not fol-lowed through successfully, however, andearly in June 1965 she returned to the apart-ment, and family life seemed to resume itsformer pattern.
This situation repeated itself in June1966 when Mrs. Terman suddenly left hercommon-law husband, again taking the chil-dren with her. After many strenuous butfutile efforts to locate her, the nursery schoolstaff was put in touch with Mrs. Terman'ssister, who informed them that Mrs. Termanhad gotten a job and had hired someone tolook after the children. The sister said thatMrs. Terman "felt bad" about withdrawingGeoffrey from nursery school but thereseemed to be no other solution to her diffi-culties. The sister would not give the staffMrs. Terman's new address but promised torelay any messages or mail. Three weekslater the staff learned that Mrs. Terman hadreturned to her old address. Contact wasresumed with the family, and Geoffrey joy-fully returned to nursery school.
Five gross but perhaps significant cri-teria may be used to summarize the statusand participation of the Howard Projectfamilies : the socioeconomic status of thefamily, the child's initial Stanford-Binet IQ,the child's increase in IQ after 2 years ofnursery school, the child's attendance recordin the preschool, and the parents' attendancerecord in adult activities. This family wasclassified in the lowest SES quartile, highin child's and low in parents' attendance,original IQ was "middle," and increase inIQ unusually high.
Geoffrey himself was described as arobust-appearing child, with excellent bodycoordination, swift and decisive in his physi-cal style. The 1964-65 observations reveal alow level of play and predominantly unin-ventive use of materials. He had a preferencefor the larger equipment, especially thesteering-wheel toy, and he liked water play.There was little evidence of the child's at-traction to the more intellectual (cognitive)type of play materials.
79

From the very beginning of school,Geoffrey seemed to needand was givenagreat deal of individual attention. He was adisruptive child, who could cause chaos in agroup unless he received individual guidancefrom a teacher or aide. However, he wasamenable to an "appeal to reason," as isIndicated in the following excerpt from aresearch worker's early interview with histeacher in December, 1964:
Geoffrey wants a lot of attention . .. At naptime he cries and gets out of bed. He wantsto be held and always wants to sit next tothe teacher. He wants a lot of attention dur-ing non-nap time too. He is difficult in agroup situation. If there is any new toy ormaterial, he wants to monopolize it. How-ever, one can reason with him. If the teacherexplains that he can have his turn but theothers must have theirs, etc., he will be okayafterwards. Yesterday I told the children astory about a farm. Each child was to havean animal and when the name of that animalwas mentioned the child would hold it up.Geoffrey wanted all the animals and afterthey had all been stood up he knocked themall over. The other children were very upsetbecause they were so eager for the song andgame that was to go with the story. I tookGeoffrey into the other room and "reasoned"with him, by telling him we couldn't con-tinue with the story if he behaved that way.When I took him back into the room hebehaved and we were able to continue withthe song-game.
The research workers' observations,as well as the teacher's summary statement,show that Geoffrey's speech was immature,particularly during the first year. The fewexamples in the record of quoted or verbatimlanguage attributed to the child indicatealmost no use of expressive language, and atendency to speak with primitive grammar.He often ignored direct queries, whethermade by adults or other children, as if hepreferred to get by with a minimal use ofspeech. Geoffrey's poor verbal ability was
80
also noted by the testing psychologist, whosummarized his impression after the fall1964 test round by characterizing Geoffreyas an "affable, quiet child who scored belowaverage in a slow-learner range (IQ-77)on all tests." The psychologist further re-marked that the boy was "poor on bothverbal and non-verbal tests" and that he wasnot systematic in approaching problems.
During the first year of school,Geoffrey continued to be negative and some-what difficult in his classroom behavior, sothat one teacher noted his "underdevelopedinner controls." At the same time he wasthought to be receptive to a one-to-one rela-tionship, responsive to praise, and generallyalert. This was also evidenced in the nar-rative observations, in which numerous in-stances are described in which the boyclimbed upon the lap of a teacher or aideand seemed to enjoy and derive reassurancefrom this close contact with an adult.
The teachers noted that the child haddeveloped a special mechanism for control-ling adults. He would occasionally fall, in away to suggest a possible head injury, or hewould over-respond, sometimes crying loudly,upon receiving even a slight bump on thehead. In this way he could sometimes secureimmediate attention and sympathy fromadults, which apparently gave him satis-faction.
According to Mrs. Terman's report,the child had meningitis at 8 months of age,which was assumed to be a possible cause ofhis susceptibility to headaches and his tend-ency to head injury. Following a fall from aplayground swing early in tne school year,examination on the part of the school pedia-tricianincluding a skull x-rayrevealed noabnormal findings, however.
In spite of his difficult behavior innursery school, Geoffrey made the greatesttest gains of the entire group of children.After 1 year of nursery school, his Stanford-Binet IQ jumped from 77 to 102. He madealmost as great a gain in the second year,completing nursery school with an IQ of 122,which was 8 points higher than any other

child in the group. His Peabody IQ (a meas-ure of receptive verbal ability) remainedfairly constant throughout the 2 years ofpreschool, however, and was only slightlyabove average for the group. His scores onboth subtests of the Illinois Psycho linguisticstest shot up in a manner very similar to hisStanford-Binet scores. His scores on theselanguage tests were the highest of thenursery-school group and were well withinthe normal range of scores made by thepredominantly middle-class children uponwhom the test was standardized. Neverthe-less, observations made of his behavior anddirect quotations from his conversations donot suggest such a high level of verbalability. Apparently Geoffrey was a child wholearned a great deal during the 2 years butwho, in everyday speech, reverted to thepatois with which he was more familiar. Asthe Head Teacher mentioned in ratingGeoffrey on verbal expressiveness : "Some-times his speech is colloquial and ungram-matical, but it is meaningful."
In spite of his obvious intellectualgains, as measured by test results, Geoffreyremained a difficult child who was prone toperiods of moodiness, was erratic in atten-tion and persistence, and seemingly in needof much individual guidance from theteachers. He received a good deal of one-to-one attention from the Head Teacher andthis undoubtedly was beneficial. He hadseveral staunch friends among the children,and others who were "tolerated playmates."Narrative observations indicated that duringthe second year of nursery school he engagedin an increasing amount of purposeful,imaginative play, but it is doubtful whetherany of the observers would have predictedthe great gains in test scores that thisyoungster made in the course of the 2 years.
The Baron Family
This family was rated as belonging tothe middle group in socioeconomic level. Both
mother and child were rated high in attend-ance. The child's initial IQ was 92 in 1964and 95 in 1966.
On a number of counts the Baronfamily gave the impression of being a lim-ited but moderately stable inner-city lowerclass family.
Mrs. Baron was born in a small townin the western part of South Carolina, butthe family moved to Washington, D.C., be-fore her third birthday, and Mrs. Baron hadbeen living in the District ever since. Shewas one of the few mothers in the nurseryand comparison groups who was an onlychild. There seemed to be a close relation-ship between Mrs. Baron and her mother.
In the baseline interviews Mrs. Baronreported that she completed the ninth grade,having attended a large number of schools.It seemed clear to the interviewer that shewas not very good in the basic academicsubjects, and perhaps only functionally lit-erate. She said that sewing and cooking wereher favorite studies.
Mrs. Baron was described by the in-terviewer as a "rather mild and shy-appear-ing woman . . . with a pleasant and winningsmile . . . She speaks quite openly and di-rectly but doesn't articulate at all well andhas a feeble vocabulary." The interviewerwent on to say that "it is clear that she isnot much of a talker and sometimes hastrouble getting the words out."
In the course of the 2 years, the nurs-ery school staff noticed quite a change inMrs. Baron's personality. She became muchmore outgoing, talked a good deal in the in-formal adult activities meetings, and fre-quently telephoned the adult worker to chatabout her family. In January 1966 (the sec-ond year of the preschool) the adult workermade this comment : "The change in Mrs.Baron, especially her outgoing characteris-tics in small groups, is simply amazing. Onewould never think she was the same quiet,withdrawn person who first visited theschool."
Before her marriage to Mr. Baronwhen she was 21 years old, Mrs. Baron gave
81

birth to a son and a daughter out of wed-lock, the first being born when she was 17.These two older children, 7 and 5, were liv-ing with Mrs. Baron's mother at the outsetof the Howard Project. Bertha was the firstchild of her union with Mr. Baron, quicklyfollowed by a son (2 years old at the start ofthe project) and a daughter (3 months old),all of whom were in good health.
Mr. Baron was 27 years old at thestart of the project, 3 years older than hiswife. While growing up, he lived in a num-ber of small rural communities in SouthCarolina but settled in the District when hewas 21. His work history was varied, con-sisting of a number of jobs as an unskilledlaborer and also some periods in which hedid farm work. At the start of the projecthe was employed by a construction firm butdid not work every day. He estimated hisyearly earnings at less than $3,000.
Mr. Baron's employment remainedintermittent during the 1965-66 school year,but by the summer of 1966 the family in-come was estimated at $4,000 per annum,due in part to the part-time employment ofMrs. Baron for most of the year.
Mr. Baron was described as givingthe impression of possessing "a kind of ro-bust intelligence." He spoke easily and freelyand admitted that he had no skill in readingand writing (although he reported gettingas far as the eighth grade). He gave theimpression of being fond of his children,especially the 2-yeE.--old boy, described bythe interviewer as looking "like a little an-gel" with "enormous amounts of curly hair."Mr. Baron was one of the few fathers whovisited the preschool in the first year. Hespent an afternoon at the school, helping topaint the playground equipment, and visitedagain in the second year, bringing both theyounger children with him.
The Baron apartment was located onthe third floor of a busy commercial blockin Washington's inner-city. The housekeep-ing and appearance of premises were vari-ously assessed as fair to poor by differentraters. Although the four-room apartment
82
(including kitchen) was described as some-what roomier than that of many other fam-ilies in the nursery group, it was by nomeans spacious for a family of five. Themonthly rent of $75 did riot appear to bemuch of a bargain.
In discussing the neighborhood andways of handling children, Mrs. Baron statedemphatically that she would not let her chil-dren play in the street. She expressed fearof accidents in the neighborhood, and withsome feeling told of an incident in the sum-mer of 1964 when a child on her block waskilled by an automobile. She was quite in-sistent that even her 7-year-old son, in thecare of his grandmother, was never permit-ted to go on the street unsupervised.
Mrs. Baron also showed motherlyconcern for her children by making surethat they had routine health checks at theclinic, visiting her older children's school,and borrowing books from the nurseryschool, which she said she read to Berthaand which Bertha thoroughly enjoyed. Atthe beginning of the second school year theadult worker commented : "Mrs. Baron givesme the impression that she wants to improveeducationally and socially." At one point,Mrs. Baron said that she and her husbandhad taken out an insurance policy so thatthe children could attend college.
In the course of the 2 years it becameclear that Bertha was often cared for by hergrandmother. (The pattern in this familymay be that as the children got older, thegrandmother took a more prominent role intheir care.) It was common for Bertha tospend weekends at the home of her grand-mother and for a brief period during thesecond year of nursery school, Mrs. Baronand all the children lived with the grand-mother, following a quarrel between theparents.
Mrs. Baron was among a small num-ber of mothers who seemed to enjoy hercontacts with the school for their own sake,deriving pleasure from the telephone chatswith the adult worker, as well as from par-ticipation in parent activities. Mrs. Baron's
life was filled almost exclusively with herduties as a mother and housewife, and sherarely found the opportunity to leave thehome and take part in social or recreationalactivities other than those of the nurseryschool. Even during the second school year,when she had a part-time evening job whileher husband stayed home with the children,she maintained a relatively high level ofparticipation in the adult activities program.
Mrs. Baron's shy, diffident, and some-what ineffective manner at the beginning ofthe project was reflected in the personalityof her daughter. Teachers' comments andthe narrative observations during the firstyear contain a number of references to thechild's shyness, frequent passivity, and lackof initiative. Below is a summary statementwritten by Bertha's teacher describing herfirst day in the preschool :
Bertha came in the Nursery School crying. Itwas difficult to get her interested in any-thing. She played in the doll corner for awhile and with the play dough. Bertha hadtears in her eyes while playing. She stoppedcrying on the playground and enjoyed theswing. Her coordination is good and sheswings well and rides the tricycle well. Whencalled in for lunch she started crying again.She did not eat nor would she lie on her bed.The teacher had to hold her on her lap fora while and then she sat in a chair all duringnap time. Bertha enjoyed marching and clap-ping to music time. She wet herself. Sheliked a lot of adult attention.
In September 1964 the testing psy-chologist also stressed the child's shy andquiet manner in his summary statement.Bertha's speech was described as "difficultto understand" and "not fluent," and thechild was characterized as "unable to sus-tain attention and effort on many tasks."Bertha had difficulty comprehending direc-tions and tended to echo rather than fol-low instructions. Despite these shortcom-ings, and although her performance was un-
even in a variety of tasks, Bertha scored inthe average rarige of intelligence (Stanford-Binet IQ-92), which was enough to placeher in the high third of the nursery group.Her initial Peabody IQ, which is a measureof receptive vocabulary, was 69, which wasabout average for the nursery group. Sheobtained one of the lowest scores on theMerrill-Palmer subtests and was untestableon either of the Illinois Psycholinguistic sub-tests.
At 3 years of age Bertha was de-scribed as "chubby" and "bright-eyed" andgiving the appearance of being well-dressedand well-cared-for. She was one of the mostpersistent thumb suckers in the group. Inalmost any half-hour period during the day,an observer could find her with thumb orfingers in her mouth much of the time. Al-though Bertha's physically passive and quietmanner remained her chief characteristicthroughout the 2 years of nursery school,she gave some evidence of coming out of hershell, of interacting more with other chil-dren, and of learning how to use adults forher own ends. Some of these gains carriedwith them an increase in negative behavior,which was true of a number of other chil-dren in the nursery group. The HeadTeacher offered the following comments onaspects of Bertha's social growth during thefirst year of the project :
Her method of managing adults was throughpassive resistance. Later she used inappro-priate ways of ignoring limits, such as stand-ing up in the swings. If a request was madefor her to sit down, she smiled and continuedstanding. If she was removed from the swingand was told why she couldn't stand, it wasnecessary to prevent her from coming backto the swings since it did not seem possibleto either reason with her or divert her. Shealso hit out at adults and children alike,sometimes sprawling on the ground to showher displeasure. In the case of hitting shewas repeatedly told that if she wanted to say"Hello" she could just say it, that teachersand children didn't like to be hit. On one
83
occasion she was given a chance to do some-thing special: going to unlock the gate of thebig playground. Although she hasn't broughtherself to make overtures to adults verballyshe walks up beside a teacher and holds herhand, or smiling, throws her full weight intothe teacher's arms. She has been able to goon a walk on the campus with an adult andone other child. In looking for dandelions,she was alert in searching for them. Shepicked them with the long stems as re-quested, and placed them in the containerstaken for the purpose.
The 21 half-hour narrative observa-tions conducted by student observers be-tween January and July 1965 reveal an al-most unrelieved portrait of a passive child,only minimally involved in the preschool pro-gram. Speech was seldom heard. Passive gaz-ing, watching, or listening were frequentlynoted by the observer. Involvement withmaterials was at a low level. in reading theseobservations it is difficult to detect any overtevidence of intellectual growth on the partof the child in the half year period covered.
During the second year, however,Bertha appears to have made gains, bothsocially and intellectually. Her Stanford-Binet IQ score increased by only 3 pointsin '2 years in nursery school, but her Pea-body scores increased by nearly 20 points,suggesting a marked increase in her abilityto understand the meaning of words. Ex-pressive vocabulary, as measured by the Illi-nois Psycho linguistic subtests, was still verypoor at the end of the preschool project.There was a favorable change in her test-taking behavior, however. On the last roundof testing, the rater described her as "anactive, alert girl ; she showed a good dealof interest in the testing, though she wasnegative once in a while, usually in a teasingway. She worked quickly and with per-sistence."
The tester's comments on Bertha'sbehavior were corroborated by the researchworkers' observations during the second
84
year, and the teachers' ratings and com-ments. Bertha's thumb-sucking continued, asdid the teasing defiance of authority thathad begun to emerge the first year, and shebecame somewhat boisterous in seeking at-tention. In commenting on her behavior to-ward the end of the second year, the HeadTeacher said that, although Bertha madefew overtures to other children, she wasquite popular, and that her speech outputwith her peers had increased a good deal.She still had little verbal communicationwith her teachers, however.
In evaluating the effectiveness ofBertha's verbal communications, the HeadTeacher stated "Bertha shows much im-provement in the 2 years, but she had sucha long way to come from her initial unwill-ingness to verbalize." In her interactionswith the other children she still "wantswhat she wants when she wants it, and herinitial efforts to fulfill her wishes are ag-gressive and hostile, but she can now moreoften accept the guidance of an adult inresorting to verbal means."
The Scudder Family
This family was rated in the lowestSES quartile, in attendance on the part ofparents and children (twins), and in the twochildren's initial IQ ratings. Gain in IQ wasrated high for one child and middle for theother.
Mrs. Scudder was born and spent thefirst 10 years of her life in a small town inSumter County, South Carolina. Althoughshe reported attending the District of Co-lumbia schools until the 11th grade, herintellectual skills were in no way the equiva-lent of a student at the .11th grade level ina middle-class suburban school. Mrs. Scud-dera heavy-set woman with a usuallycheerful mannercomplained of numerousphysical ailments, including heart trouble,high blood pressure, and asthma, and she

was hospitalized briefly at the start of theproject.
Mrs. Scudder bore her first child outof wedlock when she was 15 years old. Thischild, 18 years old at the start of the Proj-ect, was living in a foster home at that time.Mrs. Scudder also had one other daughter(now 13) and a son (now 12) before hermarriage to Mr. Scudder. The daughter wasin a training school, and the son in a localcenter for neglected or otherwise needychildren.
In October 1964 the Scudder familyconsisted of the parents and six children,ranging in age from 9 to 3. The twins werethe last born. With the exception of the 4-year -old, all of the children were attendingpublic school, although not very regularly.Mrs. Scudder reported visiting the elemen-tary school three times in the 1963-64 schoolyear, and gave the impression of having afair knowledge of school procedures and amoderately positive attitude toward the roleof the school in the lives of her children.
Mr. Scudder was reported as beingin poor health ; he suffered from epilepsyand a heart condition. He was 50 years old ;born in South Carolina, he had grown upand lived most of his life in the District.His work history was uncertain, althoughhe had been employed (perhaps intermit-tently) by a fur-storage company. In thefall of 1964, Mr. Scudder was unemployedand the family was receiving a monthly in-come of $204 from the Department of Pub-lice Welfare. The family of six children andtwo adults was attempting to live on thisincome, and Mrs. Scudder seldom failed topoint out to the adult worker that it was notadequate for the family needs. (Subtractingthe yearly rent of $624, which was probablynot paid regularly, from the total income of$2,248, this would leave a total of less than$4.50 per day to feed, clothe, and otherwisenurture a family of six children and twoadults.)
Mrs. Scudder reported that upon be-ing unable to pay $91 in back rent, the fam-ily was evicted from a housing project in
April 1964, and thereupon went to live withthe Miller family, whose daughter Gwen wasalso enrolled in the Howard preschool. TheMillers owned the house and rented part ofthe upper flooractually two roomsto theScudders. Kitchen and bathroom facilitieswere thus shared between the two families.(Since Mr. Miller was a carpet layer, anodd feature of this generally ill-kept house,in which the odor of urine was sometimesoverpowering, was that a few of the roomshad wall-to-wall carpeting, although sosoiled and discolored as to give the impres-sion of never being cleaned.)
The Scudders were one of the fewfamilies in the nursery group in which therewas complete consistency in the three raters'independent judgments of "housekeeping"and "appearance of premises." The ratingswere always given as "poor."
After a number of visits to the Scud-der household, the adult worker recorded thefollowing impressions :
Although the house is very crowded and dis-orderly, with general confusion in the small,dirty two rooms, there is general warmth andacceptance by children of their home andparents. The mother and father are both soft-spoken to each other and to the children.The mother seems to be the dominant figure.She keeps letters from school in her pocket-book and secures them, readily to discuss ap-pointment dates and to show her welfarecheck if needed.
She also reported that Mr. Scudder took ahand in preparing the children for school,and that he would sometimes bring thetwins downstairs to meet the school bus.Even so, Norma and Norman were amongthe poorest attenders during the 1964-65year, both being absent about half of thetime. Attendance improved somewhat thesecond year.
There can be no doubt that the Scud-ders lived a precarious hand-to-mouth ex-
85
istence, in which all orderliness and plan-fulness in maintaining a household had tobe sacrificed to the primary struggle forfood, shelter, and clothing. The bedding ar-rangement for some of the children con-sisted of a mangy mattress on the floor.The father and children were occasionallyobserved eating food directly from cans.Children were frequently kept out of schoolfor lack of shoes.
During the second school year, Mr.Scudder was able to return to work inter-mittently, and the family no longer receivedwelfare assistance. However, by the end ofthat year the Scudder family income wasestimated as only $2,750, which representedsome improvement over the previous yearbut hardly sufficient to pull them out oftheir impoverished condition.
Although neither parent had sufficientvitality to take an active part in the adultactivities program, they each visited theschool both years and seemed pleased tohave the twins enrolled there.
The Scudder family, while by nomeans a thoroughly down-and-out or to-tally disorganized family, appeared to beone of the most deprived, least accessible,and unpromising households in the Howardproject.
In the Head Teacher's summary ofNorma Scudder's first year in the preschool,there appears the comment that few thingssucceeded in claiming Norma's attention,and that in fact "it was difficult to knowif Norma could give attention . . ." She feltthat no child in the group was more in needof making progress than Norma.
Norma was variously described as an"expressionless" child, solitary and silent inher play, listless, and with eyes that "lackedluster." Her speech was perhaps the mostimmature among the group of 38 children,and only on rare occasions was she motivatedto talk.
Norma had trouble understanding andfollowing instructions (a point also notedby the testing psychologist), did not takemuch interest in play materials, and spent
86
much of the time lying on the floor or wan-dering about the room, thus seeming to par-ticipate only passively or to drift aimlesslyfrom activity to activity. Often she wouldparticipate only when the teacher took herfirmly by the hand. The Head Teacher re-ported, however, that there were two re-quests with which the child always complied :"request to go to the bathroom or to cometo the table for lunch." Norma shared theother children's strong interest in using thewash basins, flushing the commodes, andotherwise passing the time in the toiletroom.
On the behavior rating form com-pleted after 3 months of nursery school,Norma was described by her teacher asfollows :
She smiles at children and plays in the dollcorner, but does not talk to the other chil-dren ... She tries to please most of the time,but she does not always understand re-quests ... She does not ask for help. Youhave to sense her needs. Sometimes she willtap you on the side and smile at you andpoint to the object she needs help on.
Norma's initial Stanford-Binet IQscore was the second lowest in the group-66. (Her brother's was the lowest.) She madeno gain in IQ score after 1 year of nurseryschool, but during the second year herStanford-Binet IQ increased by 8 points to74. Other test results were uniformly disap-pointing. Her Peabody IQ score progressivelydecreased from 61 to 49 and finally to 39 inthe last round of testing. Throughout thethree test rounds she was unable to answerany of the Illinois Psycholinguistic items cor-r::.,ctly and her Merrill-Palmer scores wereconsistently the lowest in the nursery group.
Do teachers' comments and observa-tions support this picture of a child whomade minimal or no gains as a result of herpreschool experience? Not entirely. There islittle to indicate that Norma made muchprogress the first year of nursery school, but
by the end of the second year she was atleast beginning to talk, to pay greater atten-tion, and to take part in the school activi-ties. The Head Teacher's comments at theend of the 2 years summarize these gains :
One of Norma's major gains has been in thestrides made in interpersonal relationships.Initially her ability to be in contact withadults seemed to be almost nil .. . WhileNorma's restlessness may seem to exceed thatof her peers, in some activities she is able tosettle in, as at naptime and with some kindsof tablework and often at storytime . . . Inthe last 6 months, we have been aware of asudden spurt of verbal expressiveness that ismeaningful.
By any yardstick, Norma's gains fromnursery school were slight. However, if herfinally awakened need to verbalize continues,these small gains may be significant.
Norman Scudder shared a few of hissister's attributes, although he was a muchmore active and enterprising child. He wasdescribed as a thin but sturdy child withbelow-average coordination, who sometimesmade himself very appealing, although hewas often hard to handle. The half-hour nar-rative observations recorded by student aidesduring the spring of the first year reveal ahighly distractible child, given to muchrandom and undirected activity, and routinelyexhibiting aggression against children.There were frequent incidents in whichNorman ran about, knocking over other chil-dren's play materials. He was much ad-dicted to hurling objects, often with deadlyaim. The Head Teacher provided the follow-ing summary comment on his first year:
Norman's behavior the first year of nurseryschool was characterized by aimless flailingout at somebody or nothing. Sometimes thismight include throwing objects. Most timeshis real aggression was directed toward histwin, Norma; who was in another group, but
who could be reached easily whenever hewent to the bathroom rt' when he ran in asomewhat absent-minded way from his group.Norma seemed accustomed to these attacksand seemed to accept them as inevitable,since she made no attempt to avoid being hit.Norman was also well known by GwenMiller, since the two families lived in thesame house. By the end of the year Norman'sbehavior seemed less antisocial, and he wasable with frequent reminders to accept cer-tain limits.
Norman's restlessness, fleeting atten-tion span, constant physical motion, flashaggressions, and perhaps primitive need toexplore materials orally are conveyed in thefollowing excerpt from an observation on themorning of January 27, 1965 :
. . . Norman goes over to the low shelves andfumbles with the toys. He comes over andputs his arm on Mrs. J who says, "Hello,Norman." He sits in chair behind anotherchild and hits him on the head. The childcries and the teacher says, "Norman, hedoesn't like being hit," after which she holdsNorman's hand. He gets up and goes over toMrs. T's group with finger in mouth. Heleaves and goes to table where fish are andlooks with finger in mouth. He then movesto the water fountain, looks around atteacher in other group. She says, "Norman,you may go to your teacher, dear." He movesto his group and says, "I want dat, teacher,"and takes doll off table. He then comes up tome [observer) and says, "Look at dis,"speaking of doll. (I shake my head.) Hewalks away and throws the doll on floor andwalks to table near windows and begins topick up pieces and put them back. He throwstoy banana on the floor and then walks away.He returns, picks up artificial orange, andputs it in his mouth. He then puts it downand walks back to Mrs. J with toy dog inmouth, removed from table. He returns totable, and then walks to Mrs. T's group, whoare looking at cards. He stands awhile, andthen goes back to table near window, picks
87

up artificial apple, puts it in mouth, andchews. He then picks up grapes and putsthem in mouth. Next he picks up a doll,throws it on floor, stands, and looks outwindow ...
The above observation is obviously verycondensed, probably recording only the grossmovements of the child and omitting manydetails in his apparently aimless and futilesearch for some focus of his attention, somepurposeful and not merely random explora-tion of objects that quickly attract and thenescape his eyes, hands, and mouth.
There is another, and perhaps impor-tant, side to Norman's personality which isoccasionally revealed in teachers' notes rindrecorded observations. Along with his seem-ingly aggressive and hostile behavior towardpeople and things, he would often give aspontaneous demonstration of affectionatebehavior. The following is taken from thenotes of Norman's teacher after his first dayin the preschool:
When one of the children built the towerwith the nesting cans, Norman made punch-ing motions toward it and knocked it down.He ate well at lunch but used his hands andwas quite messy,. When led to do 'somethinghe doesn't want to do, Norman's knees foldunder and he refuses to walk. In the after-noon, Norman came up to me and said some-thing which I did not understand; then hekissed me on the cheek. He did this severaltimes.
On Norman's second day in school thereis another example of his bestowing a kiss,this time on a complete stranger to thenursery : "In the morning, Norman went upto Dr. W and kissed her as he had kissedme the day before."
The student observers occasionally en-countered Norman's more benign side, andwere sufficiently impressed to submit special
88
written reports (aside from the scheduledobservations) to inform staff members andresearchers of the child's actions. Below issuch an informal report:
I walked out on the playground and sat at atable in order to edit my notes. I had beenthere for about 3 minutes when Normanappeared. He walked over and snuggled him-self under my arm. He hugged me, and Isaid, "Hi, Norman." He said "Hi" andlooked up at me. I said, "I missed you theother week when you weren't here." Heanswered, "I missed you." I said, "Oh, youdid ? He replied, "Yeah." He looked up atme again and said, "I like you," and thenhe kissed me on the cheek. I replied, "I likeyou, too." He laughed and ran over and satin one of the swings. He began to swing.
Norman's initial Stanford-Binet IQof 59 was the lowest of all nursery- andcomparison-group children. In the secondround of testing (after 1 year of nurseryschool) he achieved an IQ score of 63, andafter 2 years of nursery school his IQ was81an increase of 21 points in the 2-yearperiod. Scores from other tests were less en-couraging, however. His Peabody IQ in-creased from 58 to 68 the first year and thendropped to 54 on the last testing round.However, he made considerable improvementon the Merrill-Palmer subtests and was ableto answer two of the Illinois Psycholinguisticitems. Although his scores on all the testswere lower than those achieved by most ofthe children, they do suggestwith the ex-ception of the Peabody an overall improve-ment in manifest ability.
Some improvement in his restless, g-gressive, and distractible behavior was alsonoted.
Also, while it is not evident from thenarrative observations, the Head Teacher'scomments indicate that Norman's commandof language improved in the course of the2 years, and that he had made some effortsto use expressive speech in appropriate ways :
Measured against his own earlier verbal ex-pressiveness, Norman made great strides . .
There has been an increasing amount ofverbal expressiveness usually centering aroundsome activity at home with parents or siblings.
At the end of preschool Norman wasalso reported to be more attentive to storiesand games and to take pride in his accom-plishments, but he continued to need a greatdeal of individual guidance.
The Ward Family
Perhaps no two families in the Projectmake for as much contrast in general at-tributes and life styles as the Scudders andthe Wards. In many respects, they would beat opposite ends of any hypothetical con-tinuum of SES along which we would rangethe families of the Project.
Strictly speaking, the Ward familyfalls outside of the target population thatwe had in mind when recruiting for theProject, and it was only the open policyfollowed in the house-to-house recruitmentthat allowed this family to be picked up inthe nursery group. Briefly and imperfectlyexpressed. the Wards were not "lower classenough" to fit into the research frameworkof the project. Nevertheless, their inclusionaffords the useful opportunity to present asmali but suggestive study in contrasts, andshould also make for fruitful observationsin the development of family histories asthe families are followed in coming years.
The five rough indicators of statusshow the Ward family high on all pointsexcept gain in IQ, which was nonexistent.
Mr. and Mrs. Ward were both in theirlate 20's at the start of the Project, havingcome to Washington, D.C., approximately 31/2years earlier. Both of them grew up in Ja-maica, West Indies, in lower class families.They both spoke of their parents with
warmth and respect and said that they hadreceived a good upbringing.
The Wards early came under the in-fluence of a religious society, and in largemeasure grew up under its protective wing.When they were still in their teens theydecided to become professional workers inthe society and to make their life careerswithin its fold. This decision governed theiradult and married-life history. They wereeducated in part under the sponsorship ofthe society and later received special train-ing as youth leaders and home mission work-ers spending a brief period in England.They were employed in Washington, D.C.,as professional workers in the society's so-cial center at the time of the start of theHoward Project.
The Wards were the only family inthe Project in which both mother and fa-ther qualified as "sub-professionals" in ourjob-category index. Their annual income,however, was only $4,000 at the start of theProject. By the summer of 1966 their in-come had increased to $6,000 per year, pre-sumably because they had been given addedresponsibilities by the religious societywhen it opened a new branch in anotherlocation. The religious society provided theWards with living quarters rent-free (thisfact being taken into consideration in esti-mating family income). They were the onlyfamily in the nursery or comparison groupwith a people-to-room ratio of less than oneperson per room. "Housekeeping" and "ap-pearance of premises" were invariably ratedas good or excellent.
In the baseline home interviews, bothMr. and Mrs. Ward expressed typical mid-dle-class attitudes on such topics as mar-riage, family responsibilities, child manage-ment, and life ideals. Both were articulateand voiced their views with clarity and con-viction. They had high hopes not only thattheir children would live as good Christiansbut also that they would become successfuland fairly prosperous. For example, Mrs.Ward mused that "it would be nice if Ar-thur (the 2-year-old brother of Teresa)
89
would become a doctor." Both parents werequite confident that if a child comes from agood home, in which high standards of con-duct are maintained and inculcated, there islittle likelihood of his getting into serioustrouble. More than most parents in theproject, the Wards expressed optimistic andwell-reasoned views concerning the lifeprospects of their children, the chance ofacquiring higher education, and the possi-bility of overcoming handicaps of race prej-udice and a negative neighborhood environ-ment.
All professional staff workers in theProject were agreed that the Wards madean excellent impression as parents and citi-zens, that they were alert and conscientiousindividuals, and that they evinced a uni-formly cooperative attitude toward the pre-school.
At the beginning of the Project, whenTeresa was 31/2, she was variously describedas being bright, exhibiting a capacity forleadership in play, capable of getting on wellwith other children (although occasionallybossy and a tease), a picky eater, and some-what more actively curious than many otherchildren in the group. (For example, shewas one of the few children to note preg-nancy in a teacher, and once impulsivelylifted up the teacher's blouse and giggled.)
Teresa had a good attention span dur-ing storytime. Unlike many other childrenin the group, she would from time to timeopenly express her likes and dislikes aboutthe teachers. From the narrative observa-tions we are given a picture of a child whoseplay patterns, orientation to materials, andattitudes towards adults and other childrenare generally more mature and purposefulthan those of most other children in theproject.
In her teacher's notes recorded soonafter the first school day in the project,Teresa is depicted as an alert and tractablechild with orderly habits and a dash of in-dependence in her spirit. She was one of thefew children who started off by politely ask-ing permission to play with the toys. But
90
she also let the teacher know that her motherhad assured her that she did not have tosleep during rest time if she didn't want to.Also, she told the teacher that at home shewas called "Terry" and not "Teresa." Shespecifically asked the teacher, "What is yourname?" and inquired about the names ofother children as well. She spontaneouslynoted and commented on the behavior ofother children, seemed to seek out adult ap-proval, and exhibited from the very firstweek a good attention span in playing withvarious equipment, such as play dough anda toy xylophone.
Thus, it seems that from the firstdays at school we were dealing with a well-brought-up and accessible child, quite readyand even eager to use to good advantagethe preschool setting. This impression wasreinforced by a brief summary commentmade by the psychologist who tested Teresain September 1964, at which time she re-ceived a Stanford-Binet IQ score of 113.The psychologist noted that the child was"very testable" and showed herself to beattentive and cooperative as well as "syste-matic in her approach," revealing persist-ence until able to solve a problem.
Narrative observations, as well asteachers' ratings and comments, did not sug-gest any great change in Teresa's behavioras a result of the 2 years of preschool, otherthan natural growth and maturation. By thesummer of 1966 she was still a high-spirited,sometimes restless little girl, who remainedthe verbal "star" of the class. She usedspeech both as a means of expressing curi-osity and as a means of expressing frustra-tion, by asking help from the teachers. Per-haps the most noticeable change in her be-havior during the second year was that shewas more apt to ask a teacher to tell a childto stop bothering her rather than to hitback, as she was prone to do the first year.Overall, there was little in the observationalrecords to suggest that Teresa gleaned anyparticular benefits from nursery school, al-though it is obvious she was doing wellthere, seemed to enjoy herself, and that her
parents were pleased with her school expe-riences.
Test results support the conclusionthat Teresa made no real gains in intellectualability as the result of preschooling. The onlyexception was a large jump in her scores onthe two Illinois Psycho linguistic subtests atthe end of the first year. Her scores at thattime were above average, as compared withthe predominantly middle-class childrenupon whom the test was standardized, andwere far above average when compared withthe other Project children. This suggeststhat Teresa made considerable progressduring the first year of preschool in theuse of grammatical constructions and inmaking proper associations between words.
These language scores, however, didnot improve any further as the result of asecond year of preschool. Moreover, herStanford-Binet IQ, which had remained con-stant at 113 during the first and second testrounds, dropped to 110 in the final testround. Her scores on the Merrill-Palmersub tests and the Peabody remained consist-ently high but improved only slightly in the2-year period.
It is possible that Teresa's 3-monthabsence from the country, and her returnto school just prior to the last round oftesting temporarily depressed her test scoressomewhat. The testing psychologist's com-ments do not support this idea, however, al-though it is obvious that Teresa showedtraces of having been in a different culture :"Teresa must have either a Spanish motheror father. She has the most delightful ac-cent, and sometimes asked what thingsmeant in Spanish. Very flirtatious young-ster. Teresa appeared to be quite contentin the situation . . . she was at ease . . .
attacked problems with ease." PerhapsTeresa "picked up" her Spanish accent fromher relatives in Panama, since it had notbeen noted previously.
Perhaps a fairly bright and verbalchild like Teresa would have made morevigorous intellectual growth had she beenin a class where many of the children were
her intellectual peers or superiorsas cer-tainly would have been true if she had at-tended a middle-class suburban nurseryschool. It is quite possible that her homebackground was enriching enough so thatany good nursery school would have beenan adjunctive experience (as it is for mostmiddle-class children) rather than a com-pensatory one. This is not to deny that amore heterogeneous group of children wouldhave provided a more stimulating, competi-itive, experience for her.
Concluding Comments
The descriptive accounts of the fivechildren presented above illustrate the widerange of individual differences and varyingpatterns of change existing within the nurs-ery group of "low income" families. Geof-frey Terman, whose home life had been un-stable since birth, made very extensive gainsduring both years of school, according tohis test scores. However, because of hismoody, erratic behavior, these gains maywell prove precarious, particularly when hereaches public school, where he will prob-ably not receive the individual attention hewas fortunate enough to have had in nurs-ery school.
The Scudder twins come from a fam-ily that is emotionally more stable thanGeoffrey's but even more chronically de-pressed economically. One twin (Norma)showed hardly any improvement the firstyear of nursery school but during the sec-ond year she showed some progress. Theother twin (Norman) likewise made moreprogress thI second than the first year, andto a greater extent than Norma. He in-creased his initial pitifully low IQ to atleast the dull-normal range and made someprogress in speech.
Bertha Baron was another "latebloomer," in the sense that most of hergains, both social and intellectual, occurred
91
during the second preschool year. Consider-ing Mrs. Baron's high degree of interest inBertha's schooling and her desire for self-improvement, Bertha's gains were somewhatdisappointing. However, we suspect that hergains are less precarious than those madeby Geoffrey and Norman.
Of all the children in nursery school,Teresa Ward appeared the least needyin-tellectually, socially, and emotionallyand in
92
fact did not make great strides forward inthe 2 years. She is a youngster who wouldprobably have progressed satisfactorilythrough public school with or without thebenefit of nursery school, although a morechallenging environment might have pro-duced greater progress.
This variety in patterns of intellec-tual growth make the followup studies ofthese children of particular interest.
* U. S. GOVERNMENT PRINTING OFFICE: 1969 0-313602


![New York Tribune.(New York, NY) 1869-07-24 [p 11]....tion from Kad Mountain City, iVcr I^o.!. "The seaiioiis are too short. andthenighu*ar. *_oldSuaiitities: h' re for corn; but wheat](https://static.fdocuments.us/doc/165x107/5f1e04c6b7746305d633961f/new-york-tribunenew-york-ny-1869-07-24-p-11-tion-from-kad-mountain-city.jpg)