DOCUMENT RESUME - ERIC · DOCUMENT RESUME. RC 005 550. Madden J. Patrick; ... (CD) Program and the...
167
ED 053 857 AUTHOR TITLE INSTITUTION SPONS AGENCY PUB DATE NOTE EDRS PRICE DESCRIPTORS IDENTIFIERS DOCUMENT RESUME RC 005 550 Madden J. Patrick; Yoder, Marion D. Program Evaluation: Food Stamps and Commodity Distribution in Rural Areas of Central Pennsylvania. Pennsylvania State Univ., University Park. Department of Agriculture, Washington, D.C. 2 Aug 71 166p. EDRS Price MF-$0.65 HC-$6.58 Dietetics, Eating Habits, *Economic Disadvantagement, Economic Research, *Federal Programs, Low Income Groups, Models, *Nutrition, Nutrition Instruction, Research Needs, *Rural Population, *Statistical Analysis, Tables (Data) Pennsylvania ABSTRACT Since one primary goal of the Commodity Distribution (CD) Program and the Food Stamp (FS) Program is to improve diets of low-income families, this 1969-70 study focused on whether the adequacy of a low-income family's dietary intake was improved by their participatior in a food-assistance program. As stated, the adequacy of a family's dietary intake is influenced by a wide range of factors, which may be classified under 2 major categories: (1) the family's food-purchasing power and (2) the efficiency with which the food resources are utilized. Thus, data on these factors were obtained from more than 1000 repeated interviews of rural homemIkers and were subjected to multivariate analysis. Some of the main conclusions were that low-income families were most deficient in vitamin A and calcium, and were least deficient in phosphc:Ils and protein; CD families had no better diets than non-CD families; the FS provided some improvement in diets of families experiencing temporary fund shortages (e.g., more than 2 weeks since payday) ; when families had received some income within the past 2 weeks, the impact of FS was not significant; families receiving income at least once every 2 weeks had significantly more adequate diets than those who were similar in other respects but received income less often; FS families substituted a large proportion of their increase in food-purchasing power for expenditures other than food; and families did not use their increased purchasing power to obtain foods that would provide the nutrients most deficient in the family's diet. (JB)
Transcript of DOCUMENT RESUME - ERIC · DOCUMENT RESUME. RC 005 550. Madden J. Patrick; ... (CD) Program and the...
ED 053 857
AUTHORTITLE
INSTITUTIONSPONS AGENCYPUB DATENOTE
EDRS PRICEDESCRIPTORS
IDENTIFIERS
DOCUMENT RESUME
RC 005 550
Madden J. Patrick; Yoder, Marion D.Program Evaluation: Food Stamps and CommodityDistribution in Rural Areas of Central Pennsylvania.Pennsylvania State Univ., University Park.Department of Agriculture, Washington, D.C.2 Aug 71166p.
EDRS Price MF-$0.65 HC-$6.58Dietetics, Eating Habits, *EconomicDisadvantagement, Economic Research, *FederalPrograms, Low Income Groups, Models, *Nutrition,Nutrition Instruction, Research Needs, *RuralPopulation, *Statistical Analysis, Tables (Data)Pennsylvania
ABSTRACTSince one primary goal of the Commodity Distribution
(CD) Program and the Food Stamp (FS) Program is to improve diets oflow-income families, this 1969-70 study focused on whether theadequacy of a low-income family's dietary intake was improved bytheir participatior in a food-assistance program. As stated, theadequacy of a family's dietary intake is influenced by a wide rangeof factors, which may be classified under 2 major categories: (1) thefamily's food-purchasing power and (2) the efficiency with which thefood resources are utilized. Thus, data on these factors wereobtained from more than 1000 repeated interviews of rural homemIkersand were subjected to multivariate analysis. Some of the mainconclusions were that low-income families were most deficient invitamin A and calcium, and were least deficient in phosphc:Ils andprotein; CD families had no better diets than non-CD families; the FSprovided some improvement in diets of families experiencing temporaryfund shortages (e.g., more than 2 weeks since payday) ; when familieshad received some income within the past 2 weeks, the impact of FSwas not significant; families receiving income at least once every 2
weeks had significantly more adequate diets than those who weresimilar in other respects but received income less often; FS familiessubstituted a large proportion of their increase in food-purchasingpower for expenditures other than food; and families did not usetheir increased purchasing power to obtain foods that would providethe nutrients most deficient in the family's diet. (JB)

U.S. DEPARTMENT OF HEALTH,EDUCATION & WELFAREOFFICE OF EDUCATION
THIS DOCUMENT HAS BEEN REPRO-
DUCED EXACTLY AS RECEIVED FROMTHE PERSON OR ORGANIZATION ORIG-INATING IT POINTS OF VIEW OR OPIN
IONS STATED DO NOT NECESSARILYREPRESENT OFFICIAL OFFICE OF EDUCATION POSITION OR POLICY
ni
RECENEU
AUG 20 1971
E. 1, C. ."-"'
PROGRAM EVALUATION: FOOD STAMPS AND COMMODITY DISTRIBUTIONIN RURAL AREAS OF CENTRAL PENNSYLVANIA
by
J. Patrick Madden and Marion D. Yoder
4
Department of Agricultural Economics and Rural SociologyThe Pennsylvania State University
August 2, 1971
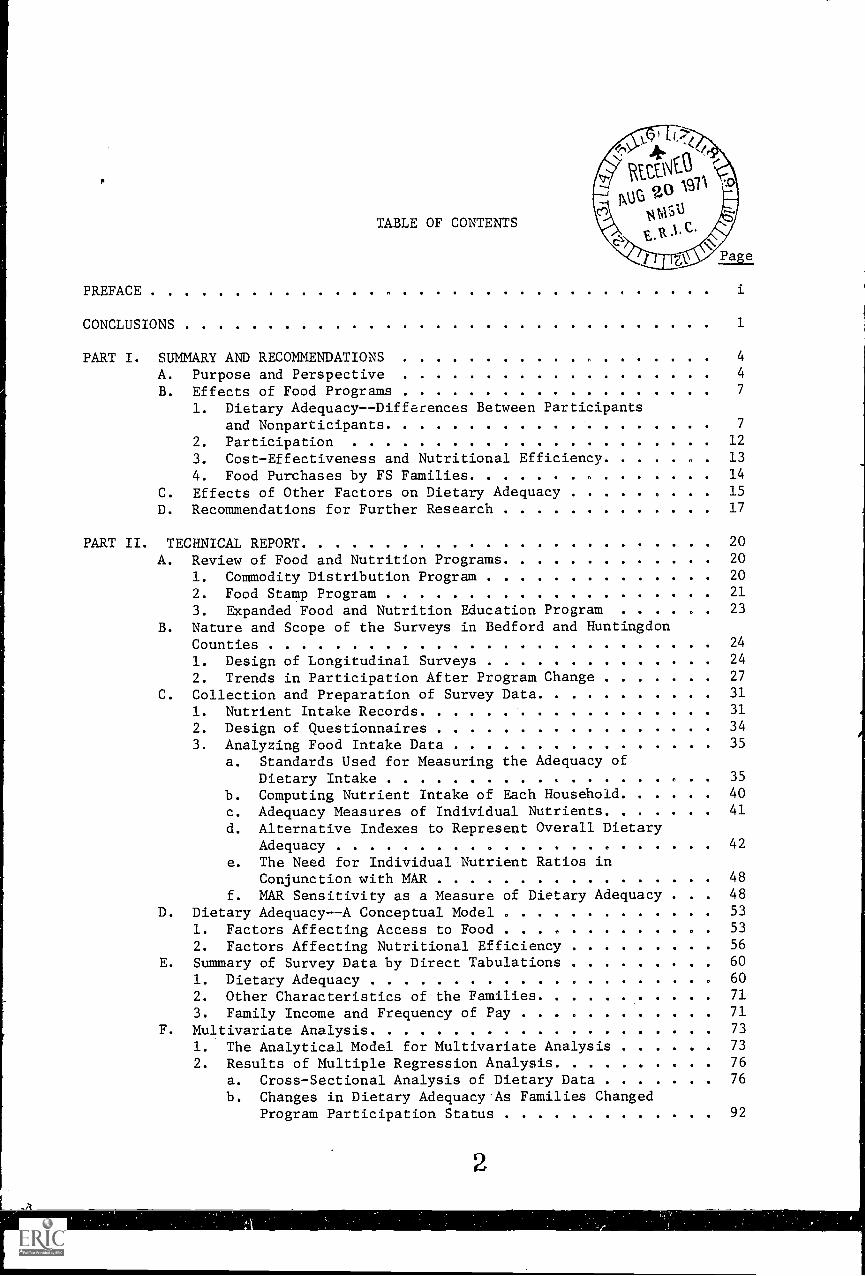
TABLE OF CONTENTS
PREFACE
CONCLUSIONS 1
PART I. SUMMARY AND RECOMMENDATIONS 4
A. Purpose and Perspective 4
B. Effects of Food Programs 7
1. Dietary Adequacy--Differences Between Participantsand Nonparticipants 7
2. Participation 12
3. Cost-Effectiveness and Nutritional Efficiency. ..... 13
4. Food Purchases by FS Families 14
C. Effects of Other Factors on Dietary Adequacy 15
D. Recommendations for Further Research 17
PART II. TECHNICAL REPORT 20
A. Review of Food and Nutrition Programs 20
1. Commodity Distribution Program 20
2. Food Stamp Program 21
3. Expanded Food and Nutrition Education Program 23
B. Nature and Scope of the Surveys in Bedford and HuntingdonCounties 24
1. Design of Longitudinal Surveys 24
2. Trends in Participation After Program Change 27
C. Collection and Preparation of Survey Data 31
1. Nutrient Intake Records 31
2. Design of Questionnaires 34
3. Analyzing Food Intake Data 35
a. Standards Used for Measuring the Adequacy ofDietary Intake 35
b. Computing Nutrient Intake of Each Household 40
c. Adequacy Measures of Individual Nutrients 41
d. Alternative Indexes to Represent Overall DietaryAdequacy 42
e. The Need for Individual Nutrient Ratios inConjunction with MAR 48
f. MAR Sensitivity as a Measure of Dietary Adequacy . . 48
D. Dietary Adequacy--A Conceptual Model 53
1. Factors Affecting Access to Food 53
2. Factors Affecting Nutritional Efficiency 56
E. Summary of Survey Data by Direct Tabulations 60
1. Dietary Adequacy 60
2. Other Characteristics of the Families 71
3. Family Income and Frequency of Pay 71
F. Multivariate Analysis 73
1. The Analytical Model for Multivariate Analysis 73
2. Results of Multiple Regression Analysis 76
a. Cross-Sectional Analysis of Dietary Data 76
b. Changes in Dietary Adequacy As Families ChangedProgram Participation Status 92

41
c. Cost-Effectiveness and Nutritional Efficiency ofthe Programs 101
d. Food Expenditure 109
G. Procedural Summary 114
REFERENCES 116
APPENDIX A. RECORDING THE 24 HOUR DIETARY RECALL 119
APPENDIX B. EQUATIONS (1.02 to 1.11) WITH NUTRIENT ADEQUACY RATIOS ASDEPENDENT VARIABLE
APPENDIX C. SAMPLING PROCEDURE
132
153

LIST OF TABLES
Tables Page
1 Program Participation of Low-Income Families in ThreeInterviews in Bedford County, 1969-70 25
2 Program Participation of the Huntingdon County Sample,1969-70 26
3 Food and Nutrition Board, National Academy of Sciences:National Research Council Recommended Daily Dietary Allow-ances Revised 1968 37
4 Correlations Between Individual Nutrient Adequacy Ratiosand Overall Dietary Adequacy Indexes (Wave I BedfordCounty, n = 274) 47
5 Sensitivity of MAR Illustrated by the Addition ofHypothetical Quantities of Selected Foods to the ActualDaily Intake of Selected Four-Person Families 50
6 Cost Effectiveness--The Cost Per Point of Increase inMAR of a Four-Person Family by Addition of HypotheticalQuantities of Selected Foods 52
7 Average Sample Values of MAR and Nutrient Adequacy Ratiosfor Ten Individual Nutrients, for Families ReceivingFood Assistance Within the Past 14 Days. Versus Non-participants at Same Location and Time, Bedford County. .
8 Percent of Sample Families in Three Nutrient AdequacyLevels by Program Participation Status, Bedford County. .
61
63
9 Average MAR and Nutrient Adequacy Ratios for Ten Nutrients,for Families Receiving Food Assistance Within the Past 14Days Versus Nonparticipants at the Same Location and Time,Huntingdon County 68
10 Percent of Sample Families in Three Nutrient Adequacy Levelsby Program Participation Status, Huntingdon County 69
11 Equation 1.01 MAR as Dependent Variable (n = 1001) 79
12 Estimated Values of MAR and individual Nutrient AdequacyRatios, by Program Participation Status and by County,Based on Regression Equations 1.01 to 1,11, AssumingConstant Family Characteristics--More than 14 Days Since
Pay. . . . ....... ......... 84
13 Estimated Values of MAR and individual Nutrient AdequacyRatios, by Program Participation Status and by County,Based on Regression Equations 1.01 to 1.11, Assuming ConstantFamily CharacteristicsLess Than 15 Days Since Pay 85
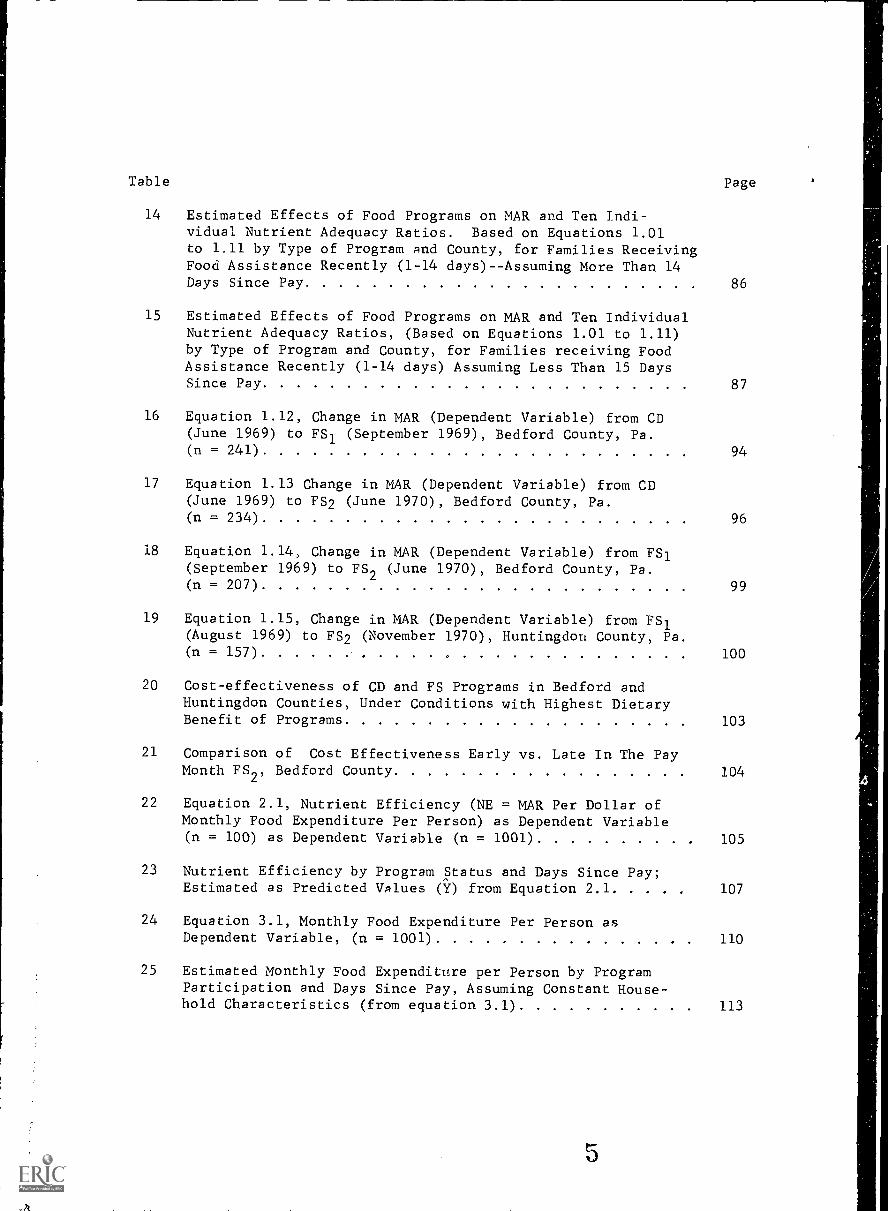
Table Page
14 Estimated Effects of Food Programs on MAR and Ten Indi-vidual Nutrient Adequacy Ratios. Based on Equations 1.01to 1.11 by Type of Program and County, for Families ReceivingFood Assistance Recently (1-14 days)--Assuming More Than 14Days Since Pay
15 Estimated Effects of Food Programs on MAR and Ten IndividualNutrient Adequacy Ratios, (Based on Equations 1.01 to 1.11)by Type of Program and County, for Families receiving FoodAssistance Recently (1-14 days) Assuming Less Than 15 DaysSince Pay
86
87
16 Equation 1.12, Change in MAR (Dependent Variable) from CD(June 1969) to FS1 (September 1969), Bedford County, Pa.(n = 241) 94
17 Equation 1.13 Change in MAR (Dependent Variable) from CD(June 1969) to FS2 (June 1970), Bedford County, Pa.(n = 234) 96
18 Equation 1.14; Change in MAR (Dependent Variable) from FS1(September 1969) to FS2 (June 1970), Bedford County, Pa.(n = 207) 99
19 Equation 1.15, Change in MAR (Dependent Variable) from FS1(August 1969) to FS2 (November 1970), Huntingdon County, Pa(n = 157) 100
20 Cost-effectiveness of CD and FS Programs in Bedford andHuntingdon Counties, Under Conditions with Highest DietaryBenefit of Programs 103
21 Comparison of Cost Effectiveness Early vs. Late In The PayMonth FS2, Bedford County 104
22 Equation 2.1, Nutrient Efficiency (NE = MAR Per Dollar ofMonthly Food Expenditure Per Person) as Dependent Variable(n = 100) as Dependent Variable (n = 1001) 105
23 Nutrient Efficiency by Program Status and Days Since Pay;Estimated as Predicted Values (Y) from Equation 2 1 107
24 Equation 3.1, Monthly Food Expenditure Per Person asDependent Variable, (n = 1001) 110
25 Estimated Monthly Food Expenditure per Person by ProgramParticipation and Days Since Pay, Assuming Constant House-hold Characteristics (from equation 3.1) 113
5

Table Page
B1 Equation 1.02; Energy Adequacy Ratio As Dependent Variable,(n = 1001) 133
B2 Equation 1.03; Protein Adequacy Ratio As Dependent Variable,(n = 1001) 135
B3 Equation 1.04; Calcium Adequacy Ratio As Dependent Variable,(n = 1001) 137
B4 Equation 1.05; Phosphorus Adequacy Ratio As Dependent Variable,
(n = 1001) 139
BS Equation 1.06; Iron Adequacy Ratio As Dependent Variable,(n = 1001) 141
B6 Equation 1.07; Vitamin A Adequacy Ratio As Dependent Variable,(n = 1001) 143
B7 Equation 1.08; Thiamin Adequacy Ratio As Dependent Variable,(n = 1001) 145
B8 Equation 109; Riboflavin Adequacy Ratio As Dependent Variable,
(n = 1001) 147
B9 Equation 1.10; Niacin Adequacy Ratio As Dependent Variable,(n = 1001) 149
B10 Equation 1.11; Vitamin C Adequacy Ratio As Dependent Variable,
(n = 1001) 151
PREFACE
This report is the culmination of more than two years of research.
The surveys and early analysis were sponsored by the Department of Agri-
cultural Economics and Rural Sociology and the Agricultural Experiment
Station (Project 1744, "Low Income People of Rural Pennsylvania," and NE-68,
"Paths Out of Poverty"). Funds to support and expedite the final analysis
were recently obtained from Food and Nutrition Service, USDA.
Helpful comments and suggestions for improving earlier drafts
of this report were obtained from many reviewers, especially Helen Guthrie,
George Brandow, Bob Herrmann, Don Epp, Steve Hiemstra and Keith Bryant.
The authors accept full responsibility for any deficie.Acies that may remain
in this report.
CONCLUSIONS
One of the primary goals of the Commodity Distribution (CD)
Program and the Food Stamp (FS) Program is to improve the diets of low-
income families. Till's, in this study the focus has been on the question
of whether the adequacy of a low-income family's dietary intake is improved
by their participation in one o.:1 the family food assistance programs.
The adequacy of a family's dietary intake at any point in time
may be influenced by a wide range of factors, both within and outside the
family. Two major categories of relevant factors are (1) the family's
food purchasing power, or more generally the availability of food resources,
and (2) the efficiency with which the food resources are utilized, in terms
of the types of food obtained and the manner in which it is prepared and
cooked for the family. While the CD and FS programs are designed to in-
crease the family's food purchasing power, factors reducing nutritional
efficiency can have an off-setting effect.
The data on which this report is based were obtained from re-
peated interviews of a panel of homemakers during 1969 and 1970 in Bedford
and Huntingdon Counties, located in rural Pennsylvania. The sample in-
cluded both program participants and nonparticipants. The main conclusions
are as follows:
1. As in other studies of this type, the low-income families
were found to be most deficient in Vitamin A and calcium,
and least deficient in phosphorus and protein.
2. CD families were found to have no better diets than non-CD
families that were similar in other respects.
3. Food Stamps provided some improvement in the diets of
families experiencing temporary shortages of funds, e.g.
more than two weeks since pay day.
8A
2
4. Under more favorable conditions, when families had received
some income recently (within the past two weeks) the impact
of FS was not significant.
5. Families receiving income at least once every two weeks had
significantly more adequate diets than those who were simi-
lar in other respects but received income less often.
6 The FS bonus (difference between purchase price and re-
demption value of the coupons) varies widely by family size
and income. Recent (1970) revisions in the FS cost schedule
did not change the amount of the bonus for some families.
But for families interviewed in this study, on the average,
the revision led to about twice as large a bonus. However,
the amount of a participating family's FS bonus was not
significantly related to their dietary adequacy.
7. Families achieve a greater nutritional efficiency (more
nutritional value per dollar of food cost) when less re-
sources are available. The study results suggest this is
true for both cash and food coupons.
8. Nutritional efficiency tends to decline as the family
approaches or exceeds dietary sufficiency. Families with
the most adequate dietary intake were generally the least
efficient in the utilization of food acquisition resources.
This presumably results from the tendency to emphasize
convenience and taste satisfaction rather than nutritional
value, especially as the level of food consumption is ex-
tended above the barest subsistence level.
9. The effect of FS participation on the dietary adequacy of each
of the 10 nutrients was also examined. When less than two weeks
had elapsed since pay day, no significant improvements were
predicted in any of the 10 nutrients. However, when more than
two weeks had elapsed since pay day, FS families who had recently
purchased food coupons had significantly higher intake of some
nutrients. In 3 of the 4 FS surveys conducted, the iron and
thiamin intake of recent FS recipients was predicted to be much
higher than that of other low-iacome families.
10. Similar improvements were predicted, though less consistently,
in the case of protein, phosphorus, riboflavin, and niacin.
Typically the increases in these four nutrients were beyond an
already adequate level, so that no real improvement in dietary
adequacy was effected.
11. Food expenditures of the families surveyed here usually did not
increase significantly with the introduction of FS.
12. Based on the evidence that the dietary impact of FS is signi-
ficant only under less favorable conditions (such as a shortage
of cash) and that food expenditure was usually not increased
significantly, it is apparent that (a) the FS families are
substituting a large proportion of their increase in food
purchasing power for expenditures other than food, and (b) the
families are typically not using their increased purchasing
power to obtain foods that would provide the nutrients most
deficient in the family's diet.
10

4
PART I. SUMMARY AND RECOMMENDATIONS
A. PURPOSE AND PERSPECTIVE
Society has devised a number of programs to cope with various
aspects or dimensions of poverty. Programs in aid to the poor are broadly
categorized as "in-cash" income transfers (for example, AFDC or Public
Assistance), or "in-kind" income transfers (such as Medicaid or Food Stamps).
It seems self-evident that the poor would prefer to be considered as
consumers, rather than dependent clients who must be told how to spend the
aid society offers. Yet society prefers to bypass consumer sovereignty in
the case of certain goods and services, through use of various "income-
in-kind" programs. The implicit assumption seems to be that people will
achieve more adequate medical care through use of Medicaid than they would
with the same amount of money given as a cash grant, for example. Similarly,
the continued existence of the Food Stamps Program seems predicated on the
premise that it will enable the poor to buy more and better food, prepare
better meals, and achieve better nutritional status and health, and hence
greater productivity in jobs, school or other occupations.
The primary purpose of the study reported here was to question the
key aspect of this premise: is the adequacy of a poor family's dietary
intake enhanced by their participation in family food aid programs? The
study was designed to determine changes in adequacy of the family's diet as
the family changed program participation status. It was hypothesized that
families participating in these programs would have better diets than those
not participating, other things being equal. Furthermore, it was hypothesized
that families who drop out of the program would have less adequate diets
than those who remained in the programs. Three family food programs were
involved in this analysis. First is the Commodity Distribution (CD)
11.
5
Program; second is the 1969 Food Stamp Program (FS1); and a revised Food
Stamp Program (FS2), which included modifications adopted early in 1970.
[26] It was hypothesized that families who remained in the food aid programs
would have improved diets, as they moved from CD to ni to FS2, The strategy
of this study was to obtain and analyze data from a sample of low income
families at crucial points in time, just before and after changes in avail-
ability of these food assistance programs. A total of 5 surveys were
conducted; 3 in Bedford County and 2 in Huntingdon County. More than 1,100
interviews were completed, and more than 1,000 of these were sufficiently
complete to allow their inclusion in multivariate analysis.
Through this analysis, it was hoped that additional light would
be shed on the important policy questions with regard to the dietary
effectiveness of the "income-in-kind" food aid programs. Proponents argue
that this type of program is more effective in improving the diets of
the target population than is true of cash income transfer programs. The
analysis done in this study provides additional information regarding that
question, but it does not answer the entire question. If it is found, for
example, that a certain food aid program has a highly beneficial effect
on the diets of the poor, the question still remains whether cash income
transfers of the same magnitude would bring about similar improvements.
On the other hand, if little or no improvement in the diets of the poor can
be brought about by the food aid programs, they must be justified on other
grounds, such as their income transfer effect. In that case a serious
question would arise as to whether the programs should continue in their
present form.
The study reported here is based entirely on data obtained from
the five surveys conducted in rural areas in Central Pennsylvania (Bedford
and Huntingdon Counties). In terms of the overall national policy questions,
12
6
it is not possible to draw definitive answers from a study as limited in
scope as the present one. Additional analysis is now underway, using data
from rural areas in two additional states (North Carolina and Iowa). These
data were collected as part of the third quarterly interview of families
participating in the rural negative income tax experiment, being conducted
by the Institute for Poverty Research at the University of Wisconsin. Data
from these states will allow analysis of possible tradeoffs between the
negative income tax and food aid programs. When the results are completed
from all of these locations, it is hoped that a consistent pattern of policy
inferences may be drawn. As soon as the data from the other states are
analyzed, a supplementary report will be prepared. Additional studies
will be needed in a number of urban locations, as well as a wider range
of rural situations in different parts of the nation.
7
B. EFFECTS OF FOOD PROGRAMS
Primary attention is given to estimation of the effects of the pro-
grams on the dietary adequacy of the participants, since improved nutrition is
currently the primary purpose of the programs. However, other effects are also
considered, including changes in participation, cost-effectiveness, nutritional
efficiency, and effects on food purchase.
1. Dietary Adequacy--Differences Between Participants and Nonparticipants
The primary focus of this analysis is on the effects of the various
food aid programs (CD, FS1, and FS2). The effects of these programs are
interpreted in the context of nonparticipant comparison groups in the same
county and time period, so that adjustment for seasonal changes would not be
necessary.1/
The effect of food programs was isolated and tested by holding
a number of other variables constant in multiple regression equations. In-
dexes were devised for purposes of this analysis, to reflect differences in
the dietary adequacy of various subgroups of the sample--e.g. participants
versus nonparticipants. Comparisons were made for 10 individual nutrients./
For this purpose a ratio of family intake to need was computed to represent
the adequacy of intake for each nutrient. An overall index of dietary adequacy
(the MAR or Mean Adequacy Ratio) was also computed, as the average of the 10
nutrient ratios, each cut off at an upper value of 100 percent, representing
an intake equal to or exceeding the Recommended Dietary Allowances (RDA).2/
A family reporting an intake of 100 percent or more of the RDA levels of each
of the 10 nutrients would have an MAR of 100, for example.
l "ThisThis does not preclude the possibility that the dietary benefitsderived from the program may vary from one season to another during the yearAdditional research is needed, including observations from different times ofthe year and various locations, to obtain a valid estimate of seasonal effects.
2.1Other nutrients were ignored because data for necessary computations
were not available. The following 10 nutrients were used: energy, protein,calcium, phosphorous, iron, Vitamin A, thiamin, riboflavin, niacin and Vitamin C.
21See the attached technical report for a detailed discussion of the
MAR index. .1 4

8
The results were quite different for the various programs and
locations. Tests of statistical significance were computed for comparison
of program participants versus a comparison group of nonparticipating
families.
It should be understood, however, that statistical significance
and economic or practical significance are not always the same. A result
can be statistically non-significant, and this fact can have considerable
practical importance. Negative results can be just as relevant as positive
findings. For example, if a factor that was thought to influence strongly
the dietary adequacy is found to have a very weak and statistically non-
significant effect, this result can have important policy implications.
Conversely, when a result is "statistically significant," say at the 5
percent level of probability, this means there is very 14ttle chance that
this result is due to random variation (a 1 in 20 chance). Even when a
result is statistically significant, the actual magnitude may be large
or small, depending on the variance of the estimate. If the variance is
low, as is the case in several instances reported here, then a very small
difference can be statistically significant. For purposes of program
evaluation, statistical significance should be used only as a guide to the
reliability of the estimates. Beyond this, the actual magnitudes should be
scrutinized carefully, to determine whether the differences have any practical
importance.
CD Versus Non-CD in Bedford County
The CD program, as it was operating in Bedford County in June 1969,
had no significant impact on the overall dietary adequacy (MAR) of the
participating families. It was hypothesized that a significantly beneficial
effect would be observed, particularly during the first two weeks after
15
9
receiving the CD foods. Similarly, it was hypothesized that when more
than two weeks had elapsed since pay day, these effects would be greater
than during the early part of the pay month. Neither of these hypotheses
was supported by the evidence found in this study. The program seemed to
have no significant effect, even beyond two weeks since pay, and when the
families had recently (within two weeks) received their commodities.
CD users were predicted to have 18 percentage points more adequate
intake of protein (150 versus 133 percent of RDA) than did non-CD families,
other things being equal. However, this result was not highly significant;
differences this large have about a 1 in 10 probability of occurring by
chance. Furthermore, the nutritional, as opposed to the statistical,
significance of raising intake further above an already more-than-a?lquate
level (from 133 to 150 percent of RDA in this case) may be open to question.
Conversely, the predicted calcium intake of CD users was signifi-
cantly lower than the comparison group--23 percentage points (66 versus 89
percent of RDA). The two groups had similar predicted intakes of the other
eight nutrients, and their indexes of overall dietary adequacy were not
significantly different.
Several reasons are offered why the CD program made no significant
impact. Other studies have shown that families receiving CD foods tend to
substitute free foods for those formerly purchased, thus freeing funds for
other expenditures. [12] The full 22 item package which the USDA offered
during 1969 would provide more than the "recommended adult requirements"
for 6 of 8 nutrients. [30, p. 22] However, the national average number of
items distributed to CD recipients was about 18; only 13 items were dis-
tributed in Bedford County during the months of this survey. A family of
four in Bedford County with children ages 10 and 12, would have acquired the
following percentages of recommended dietary allowances, assuming the family
ate only the CD foods and there was no waste:16

10
Nutrient: Percent of RDA from 13 CD foods(Bedford County, 1969)
Energy 43
Protein 53
Calcium 33
Phosphorous 50
Iron 49
Vitamin A 32
Thiamin 58
Riboflavin 37
Niacin 38
Vitamin C 44
As a matter of fact, many of the respondents said they did not
use some foods--particularly the scrambled egg mix. Therefore, it is
not surprising that little impact was observed from the CD program
FS Versus Non-FS in Bedford and Huntingdon Counties
In each of the surveys conducted, somewhat better diets were
found among FS than non-FS families, under certain circumstances, as follows:
1. The beneficial effect of Food Stamps was apparent only
within the first two weeks since the family purchased
the stamps. Very little benefit was found more than two
weeks since purchase. Apparently a disproportionate share
of food stamps are used up soon after they are purchased.
2. Similarly, the nutritional benefit due to FS was perceptible
only when some time had elapsed (over two weeks) since the
family had received its major income for the month. These
differences in dietary adequacy were statistically signifi-
cant (at the 5 percent level of probability) in Bedford
County, indicating that there is very little likelihood
that the results are due to random variation. in Huntingdon
County the improvement due to FS was less significant.
Among those families interviewed within two weeks since
1'7
11
receiving their major income, no significant difference
was apparent between FS participants and nonparticipants.
3. The dietary difference between FS participants and non-
participants was expected to be somewhat greater with FS2
than FS/. However, no consistently significant difference
was found between the two programs.
Under the combination of conditions which reflects the greatest
advantage due to food stamps (less than two weeks since getting FS2, more
than two weeks since pay, in Bedford County) the difference between the
dietary adequacy index of users versus nonusers of FS2was 9.4 percentage
points of MAR. This amount of increase in the MAR index constituted about
a one-seventh increase in dietary adequacy, for the average participating
sample family, and would be sufficient to bring many families from an
inadequate to an adequate dietary level, during the latter part of the pay
month, if they bought food stamps every two weeks. However, under other
conditions the improvement due to FS has considerably less impact,
For example, if it has been less than two weeks since a
Bedford County family received its monthly income, the impact of FS2was
only 3.9 percentage points increase in MAR.
In Huntingdon County no improvement in dietary adequacy could
be attributed to food stamp participation. For example, an FS/family
having purchased food stamps within the past two weeks, and whose latest
receipt of income was more than two weeks ago, had an MAR only 3.6
percentage points higher than a similar family that does not use FSL or
hasn't bought them for more than two weeks. Under the same circumstances,
an FS2
family had an MAR only 1.3 percentage points higher than its
comparison group family, Neither of these differences was significant,
18

12
The effect of food stamp participation on the adequacy of dietary
intake of each of the 10 nutrients was also examined. In 3 of the 4 FS surveys
conducted, the iron intake of recent FS recipients was predicted to be higher
(by 15 to 30 percentage points) than other low-income families, when more
than two weeks had elapsed since pay day. In two of these surveys (both
in Bedford County) the differences were statistically significant, and from
a nutritional health standpoint, these differences in iron intake were quite
important, since the iron intake was found to be inadequate (below two -- thirds
of RDA) in more than a fourth of the families interviewed.
Under similar assumptions, thiamin was also consumed at higher
levels (18 to 36 percentage points higher) by recent FS buyers in 3 out of
4 FS surveys. And again the differences were found to be statistically
significant in the two Bedford County surveys. Similar improvements were
predicted, though less consistently, in the case of protein,
riboflavin, and niacin. When less than two weeks had elapsed
however, no significant improvements were predicted in any of
phosphorus,
since pay day,
the 10 nutrients.
2. Participation
In Huntingdon County, nearly a fourth of the low-income sample
families not using FS1 during the initial survey had joined the program by
the time of the second survey, some 15 months later. This increase in
participation could have resulted from the increased financial attractiveness
of the revised FS2
program. Only one of the families reinterviewed had
dropped out of FS1between surveys. Despite this higher participation level,
however, it appears that the overall dietary adequacy of the low-income
families did not improve, as discussed above.

13
In the Bedford County surveys, a higher dropout rate was found.
More than 2 in 5 CD recipients had not begun using FS1 at the time of the
second interview (more than a month after the county had switched from CD
to FS1). Meanwhile, about 1 in 4 of the former non-CD families in the
sample began using FS].. Between Wave II and Wave III surveys in Bedford
County, the FS1 program was improved to form FS2. When the families were
reinterviewed, it was learned that 35 former FS1 users had dropped out, and
19 of the non-FS1 families had joined FS2., The net effect, obviously, was
an overall decline in participation among the panel of families interviewed
in these surveys. This trend cannot be applied to the county as a whole,
however, because the CD families were purposely over-sampled in the initial
survey. The fact that a fourth of the former CD nonparticipants joined FS
is numerically very important, and it portends a great increase in overall
participation. This in fact seems to be the case: the trends at the
county, state, and national levels indicate a strong rise in participation
since the initiation of FS2. Apparently the increase in participation is
coming from the large mass of former nonparticipants.
3. Cost Effectiveness and Nutritional Efficiency
The FS2program embodies a considerably higher bonus value than
does FS1,
in terms of the federal subsidy for the difference between the
cost and redemption value of the food coupons. The average FS2bonus per
family was about double that of FS]. in Bedford and Huntingdon Counties. At
the same time, the effectiveness of the program as a method of increasing
the adequacy of dietary intake of participating families did not change
appreciably. Consequently, the cost-effectiveness ratio (cost per unit
increase in MAR) is much higher with FS2 than with FS].. However, increased
participation rather than reduced cost-effectiveness seems to be the factor
20
14
motivating the federal government to improve the FS program; and increased
participation has been achieved.
The nutritional efficiency with which the low-income family's food
dollar is spent was also analyzed, in terns of food cost per point of MAR.
It appears that during conditions of relative plenty (when more ample food
resources became available, either through recent purchase of FS or recent
receipt of income), the family got significantly less nutritional value
per dollar of food purchased, Under these conditions, nutritional efficiency
was found to be significantly lower for users of FS1 and FS2 in Bedford
County and FS2 in Huntingdon County than for their respective comparison
groups.
Nutritional efficiency must be interpreted with caution. Effi-
ciency is not equivalent to adequacy, since families who are most nutrition-
ally efficient may have very inadequate diets. Families with more adequate
diets may be rated as nutritionally less efficient, due to their use of higher
priced items such as preferred cuts of meat, which provide proportionately
more taste satisfaction but less nutritional value per food dollar.
4. Food Purchases by FS Families
Food stamp families were estimated to have a somewhat higher food
expenditure per person than do nonusers, other things being equal. However,
in only one of the four FS surveys was this found to be a significant
difference: in Huntingdon County, recent FS2users were predicted to spend
about $8.00 per person more per month on food, as compared with nonpartici-
pants. In most other circumstances, FS users were predicted to spend about
$3.00 more, and these differences were not significant.
21
15
C, EFFECTS OF OTHER FACTORS ON DIETARY ADEQUACY
Families with incomes in the range from 100 to 125 percent of
the poverty line had no better diets than those below the poverty line,
other L'ai.ngs assumed to be equal. Those with incomes greater than 125
percent of the poverty line had significantly better diets (4.5 points
of MAR) compared with those below the poverty line. What would be the
cost-effectiveness of a straight cash income transfer payment? Only a
very tentative indication can be provided by the analysis reported here,
because the surveys encompassed a relatively narrow range of income varia-
tion. Relatively few families had a major increase in income. However,
for purposes of illustration, let us assume a family's income is raised
from 75 percent of the poverty line to just over 125 percent. This would
cost about $1860 a year for a four-person family, or roughly $5.10 a day.
Given the low-income elasticity of demand for food, little of this increase
(perhaps most one dollar) would go for food. If this caused a 4.5 point
increase in MAR, the cost-effectiveness would be more than one dollar of
public cost per point increase in MAR. (This is a very tenuous conclusion,
however, and quite different results might be obtained from other survey3,
such as the rural negative income tax experiment and other studies.)
The net effects of several characteristics of the household were
found to be statistically significant, though very small in practical terms.
For example, families of size 5 to 6 were found to have the most adequate
diets (if other factors were held constant)--5.2 MAR points higher than
one and two-person families. Families reporting home-produced food had
significantly better dits (2.4 points) than those reporting none. Age of
the homemaker was found to be negatively related; but even though the
effect was statistically significant, it amounts to less than 4 points
22
16
decline in MAR for a 65 versus a 25 year old homemaker.
Education of the homemaker was found not to be significantly
related to the adequacy of a family's diet throughout most of the analysis.
It should be emphasized that this was essentially a sample of the poor,
and education beyond the twelfth grade was rare. For a broader segment
of society, there could be a more significant relationship, though this
question is beyond the scope of the present study.
Families were found to have significantly more adequate diets on
the weekend than during week days--2.7 points of MAR.
Are the extension nutrition aides effectively improving the diets
of the poor? The results of this analysis do not indicate any significant
difference in adequacy of dietary intake related to the number of nutrition
aide visits. However, less than 100 participating homemakers were inter-
viewed, and this is too small a sample to allow definitive conclusions about
the nutritional impact of the nutrition education program.
These and other findings of the study are presented in detail
below, in Part II, Technical Report.
23

17
D. RECOMMENDATIONS FOR FURTHER RESEARCH
As stated earlier, national policy recommendations cannot be made
confidently on the basis of a study of such limited scope as this one.
Additional replications of the study would be required in other locations,
covering a wide range of cultural and economic factors, as well as seasonal
variation. The following are several specific recommendations for further
research. These recommendations are predicated on the assumption that the
Food Stamp program will continue in existence. This assumption is made
without drawing any conclusions or making any value judgments about
whether or not the program should continue. The purpose of these recommenda-
tions is to point the way for future research that could lead to improvements
in the intervention programs for the poor.
1. Given that nutritional inadequacy is most likely to occur
two weeks or more after the family receives its pay, a pilot study should
be conducted in which an experimental group of low-income families now
getting social security, retirement, and other income once a month would
be given their checks more frequently than once a month. For example, one
large check could be sent at the first of the month, (when most bills come
due) followed by three smaller checks at one-week intervals. With computer-
ized preparation of checks, the administrative costs would be minimal, and
if major improvements in dietary adequacy occured, the cost-effectiveness
ratio would be very low. This proposal may seem to be excessively
paternalistic--not giving the family its entire check at one time per month.
Carried to its next logical step, this argument could be used to justify
giving checks even less often than once a month--perhaps quarterly or
even annually. The point is that there is nothing inherently special
about a month as a fiscal period. And if biweekly or weekly pay checks
24
18
would bring about the same dietary benefit as recent reception of food
stamps, for example, then public policy-makers should be made aware of this
fact. It is possible that the poor would prefer frequent cash payments to
food stamps; presumably the cash payments could include the cash value of
the food stamp bonus. This idea should be tried on a pilot basis, to see
if in fact there is a tradeoff between income frequency and food stamp
bonus.
2. A change in the FS regulations should also be tried on a
pilot basis. Foods which have a very low dietary value per dollar of cost,
as determined by nutrition specialists, could be declared ineligible for
purchase with food stamps. Such foods as soft drinks and snacks that are
nutritionally void would be deleted, as well as high-priced prestige items
(such as high-priced cuts of meat) that may be nutritious but have a low
nutritional value per dollar. There is no doubt that such foods have con-
siderable psychic value and recreational utility for the families, and
these are important. But if the Food Stamp program is to be justified as
a means of enhancing dietary adequacy of low-income families, a more
restrictive food list would seem desirable. Admittedly this proposal
would not be enthusiastically supported by certain manufacturers of candy,
snacks, and soft drinks. However, this should be tried on a pilot basis
in several Jocations, if more cost-effective ways are to be found for
improving the dietary intake of low-income families.
3. Besides providing additional food resources (whether through
increased cash income payments or income in kind), it is important to seek
ways to help the families use these food resources efficiently. The basic
idea of the Extension Nutrition Aide program has been widely recognized as
having considerable potential for improvement in diets of the families.
If homemakers can be taught nutritional principles, and motivated to improve

19
their families' diets, this can provide major longrun benefit. However,
the results of the present analysis found no significant dietary benefit
from the nutrition education program. Further analysis under a broad
range of conditions should be done to ascertain the extent that the diets
of the poor are improved through the efforts of the nutrition aides.
4. The present study has given primary attention to the dietary
effects of participation in CD and FS programs. Further analysis is needed
to determine the factors underlying the participation patterns. Which
types of low-income families are least likely to participate? What is
the effect of enhanced FS bonus on participation? These and other questions
are now being analyzed as part of another study using data from the same
interviews used as the basis of this report. Replications from other
locations are needed for nation-wide program inferences.
5. Research is needed to determine the relative effectiveness
of in-kind versus cash aid to the poor. Specifically, if the CD retail
value or the FS bonus is given to families in cash rather than through the
FS program, would the same dietary benefits occur? Research is now under
way using data from the rural "negative income tax experiment" in Iowa
and North Carolina, for the purpose of quantifying the extent of tradeoff
between CD or FS (in-kind) versus cash income transfers, as methods of
improving dietary intake. Further replications in other locations would
be very desirable.
26
20
PART II. TECHNICAL REPORT
A. Review of Food and Nutrition Programs
Three federally supported programs designed to enhance the dietary
status of the poor have been operating in the study area: Commodity Distribu-
tion (CD), the Food Stamp Program (FS), and the Expanded Nutrition Education
Program. All three of these programs (CD, FS, and nutrition education) are
discussed briefly here to provide the background for this study and the review
of related studies
1. Commodity Distribution Program
The Commodity Distribution Program was developed to alleviate sur-
plus agricultural stocks. A second purpose was to provide food for the needy.
Commodities are purchased by the U. S. Department of Agriculture and shipped
to states and localities desiring assistance. State and local authorities in
turn distribute the commodities to schools and institutions as well as to
qualifying households in that state. The following discussion deals only with
the assistance given to families.
Currently, 24 food items are theoretically available to participat-
ing families in the counties using the CD program. These commodities provide
a nearly balanced diet for recipients. Retail value of the full package is
about $16.14 per person per month. Foods distributed are as follows: beans
(dry), bulgur, butter, cheese, corn meal, egg mix, flour, fruit or vegetable
juice, grits, peas (dry or split), macaroni, meat (chopped), meat (poultry),
milk (evaporated), milk (NFD or instant fortified), oats or wheat (rolled),
peanut butter, potatoes (instant), prunes, raisins, rice, shortening, syrup
(corn), and certain canned vegetables. The specific items vary from time to
time among counties. The average number distributed by each administrative
unit in the U. S. as of April 1969 was 18 C30, p. 231.
27
21
In Pennsylvania, an average of 14 commodities were distributed in
the 16 participating counties at the time of our first survey (June 1969). [311
During the same period 13 different items were distributed in Bedford County
with a retail value of $6.57 per person per month. Thus, considering the
relatively low amount of food subsidy in the Pennsylvania version of the CD
program at the time of our survey, it would be surprising if any significant
improvement in the diet resulted from the program. Since 1969, nearly all
the counties in Pennsylvania have dropped the CD programs and have adopted
the Food Stamp Program. The CD program, still operating in three counties,
has been expanded to include a greater number and value of commodities than
were distributed at the time of our surveys. Therefore, any inferences
drawn from this study with regard to the CD program must be interpreted as
applying to the earlier version.
2. Food Stamp Program
The present Food Stamp Program was initiated on a pilot basis under
the administration of President Kennedy in 1961. Stamps or coupons are sold
to qualifying families at a price lower than their face value, the difference
being the amount of "bonus" for participating. Stamps are then used to
purchase food at cooperating grocery stores. Families must buy a specified
amount of stamps each month at a participating bank. This is designed to
insure that the family spends a "normal" amount for food and that the bonus
is not diverted to nonfood expenditures. Until recently, the FS plan deter-
mined "food needs" on the basis of income as well as number in the household.
Households with lower incomes received fewer stamps. As income increased
within the eligible range, the FS cost increased and the amount of stamps
increased. A recent change, effective in Pennsylvania April 1, 1970, provides
a larger amount of stamps for families with very low incomes, and allows the
28
22
dollar value of stamps to be the same for all families of a given size. The
cost of the stamps is still graduated so that families having a lower income
pay less for the same dollar value of stamps. On the average, families in
the U. S. pay about $.40 for each dollar's worth of food stamps. Aside from
the fact that families must pay to participate, this plan has advantages not
present under the CD program. It gives the family the freedom to select the
kinds and amounts of food desired.
It has been argued that administration of the Food Stamp Program
would be more efficient than the CD program. Adoption of FS has reduced the
costs for some state and local governments. Low participation has been a
serious problem, but has improved with recent modifications of the program.
Historically the percent of poor participating in counties where the FS pro-
gram is offered has been much lower than in counties served by the Commodity
Distribution Program. [14] Some of the reasons for nonparticipation are:
(1) The outlay for stamps is based on what a family of a given size and a
given amount of income would "normally" spend for food; since the determined
"norm" is an average, some elderly families or those with small children or
home produced food typically spend less, and find purchasing that amount diffi-
cult; others require much more. (2) It is often difficult for the household
to accumulate the lump sum needed to buy the stamps, (3) Prior to the recent
revisions, as income increased, the FS cost sche&ale required unrealistic in-
creases in the amounts required to buy the stamps. (This seems less problematic
with the current revision of the program.) (4) Lack of knowledge of the program
and its requirements. As compared with the CD program, the food stamp program
requires more individual initiative and responsibility in terms of applying
for, buying, and using the stamps.
Since 1966, the number of families in the U. S. participating in the
family food assistance programs has increased. Part of this increase is due
to the number of counties or independent cities now administering a program.
23
Participation in CD has been about steady at about 3.8 million persons, while
FS participation has been rising rapidly in recent months, to a current total
of about 9.8 million persons (January, 1971). CD programs are gradually being
replaced by FS programs in most states.
3. Expanded Food and Nutrition Education Program
The Expanded Food and Nutrition Education Program is an effort to
teach low-income families the importance and the essentials of a balanced
diet. This program developed from the realization that the family food
assistance programs did not guarantee good diets, partly because of frequent
lack of nutritional motivation or knowledge about meal planning and nutrition.
In a sense, this program supplements the food assistance programs.
The Nutrition Education Program has incorporated extension tech-
niques. Paraprofessionals (Nutrition Aides) are recruited from among the
local homemakers from the community itself and are trained and supervised by
Extension home economists. The aides then visit low-income families The
Extension method has the advantage of being able to approach those who, for
a number of reasons, may not participate in a food assistance program. Aides
have shown competence in teaching and in developing and maintaining contacts.
As of October 1970, the program was operating in 929 counties and independent
cities, with 6,732 program aides serving the 247,743 participating families.1/
1/Recent data from Federal Extension Service, U.S. Department
of Agriculture.
30
24
B. NATURE AND SCOPE OF THE SURVEYS IN
BEDFORD AND HUNTINGDON COUNTIES
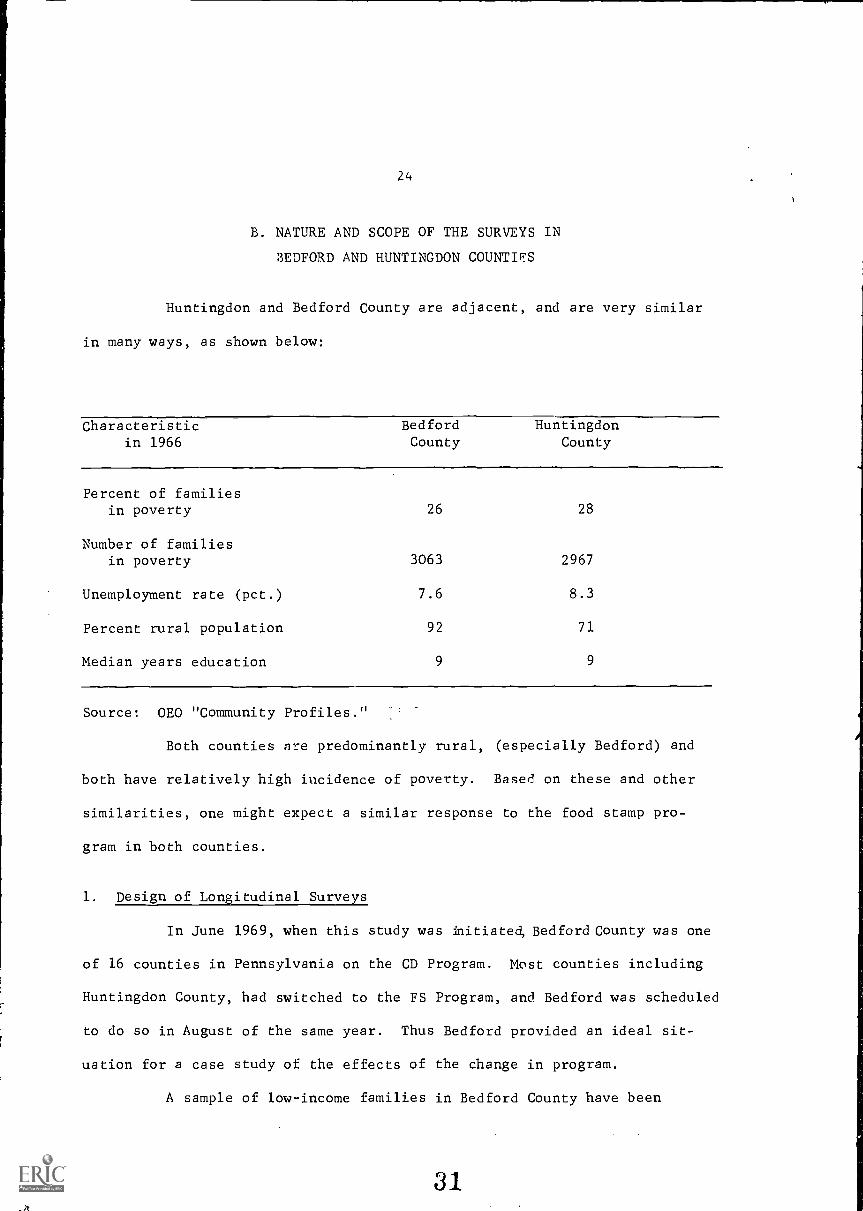
Huntingdon and Bedford County are adjacent, and are very similar
in many ways, as shown below:
Characteristicin 1966
BedfordCounty
HuntingdonCounty
Percent of familiesin poverty 26 28
Number of familiesin poverty 3063 2967
Unemployment rate (pct.) 7.6 8.3
Percent rural population 92 71
Median years education 9 9
Source: 0E0 "Community Profiles."
Both counties are predominantly rural, (especially Bedford) and
both have relatively high incidence of poverty. Based on these and other
similarities, one might expect a similar response to the food stamp pro-
gram in both counties.
1. Design of Longitudinal Surveys
In June 1969, when this study was initiated, Bedford County was one
of 16 counties in Pennsylvania on the CD Program. Most counties including
Huntingdon County, had switched to the FS Program, and Bedford was scheduled
to do so in August of the same year. Thus Bedford provided an ideal sit-
uation for a case study of the effects of the change in program.
A sample of low-income families in Bedford County have been
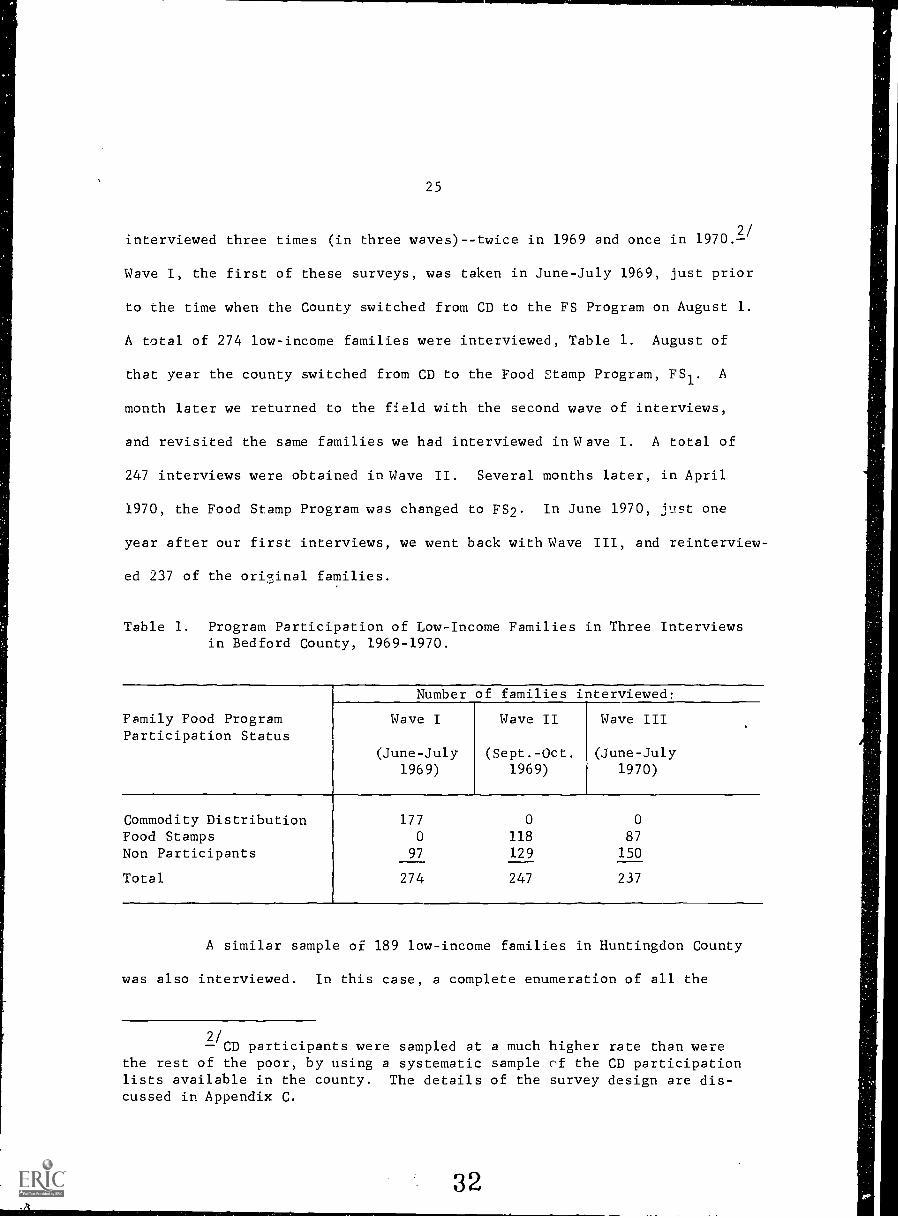
interviewed three times (in three waves)--twice in 1969 and once in 1970.2./
Wave I, the first of these surveys, was taken in June-July 1969, just prior
to the time when the County switched from CD to the FS Program on August 1.
A total of 274 low-income families were interviewed, Table 1. August of
that year the county switched from CD to the Food Stamp Program, FS1. A
month later we returned to the field with the second wave of interviews,
and revisited the same families we had interviewed in Wave I. A total of
247 interviews were obtained in Wave II. Several months later, in April
1970, the Food Stamp Program was changed to FS2. In June 1970, just one
year after our first interviews, we went back with Wave III, and reinterview-
ed 237 of the original families.
Table 1. Program Participation of Low-Income Families in Three Interviewsin Bedford County, 1969-1970.
Family Food ProgramParticipation Status
Number of families interviewed:
Wave I
(June-July1969)
Wave II
(Sept.-Oct.1969)
Wave III
(June-July1970)
Commodity Distribution 177 0 0
Food Stamps 0 118 87
Non Participants 97 129 150
Total 274 247 237
A similar sample of 189 low-income families in Huntingdon County
was also interviewed. In this case, a complete enumeration of all the
2/CD participants were sampled at a much higher rate than were
the rest of the poor, by using a systematic sample of the CD participationlists available in the county. The details of the survey design are dis-cussed in Appendix C.
32

26
homemakers participating in the Nutrition Education Program were included in
the sample, along with the random sample of low-income families, Table 2.
The first wave of interviews in Huntingdon County was conducted in August 1969,
while the county was participating in FS1. The second wave was done in November
of 1970 while the county was participating in FS2. This was 7 months after
the April program modification.
Table 2. Program Participation of the Huntingdon County Sample, 1969-70.
Program Participation Status
Number of families interviewed:
Wave I
(Aug. 1969)
Wave II
(Nov. 1970)
Food Stamps Only 20 39Both FS and Nutritional Education 18 23
Total FS 38 62
Nutrition Education Only (not iS) 65 45Neither Program 86 60,
Total 189 16
In all of the surveys a sample of nonparticipants was included as
a comparison group, thus eliminating the need for making adjustments for
seasonal variations. Information was obtained on the age and education of
the homemaker, the size of the household, the number of days since the
family had received its latest pay, number of nutrition aide visits (if
any), the number of days since it had received food aid, presence of home
produced food, income, day of the week, and other relevant variables.
Thus, the same families were interviewed at crucial points in
time, to provide data reflecting change in dietary intake related to changes
in the food aid programs. This report is based on analysis of data from
the five surveys, including the effects of switching from CD to FS, as well
PS the improvements in the FS program.
33
27
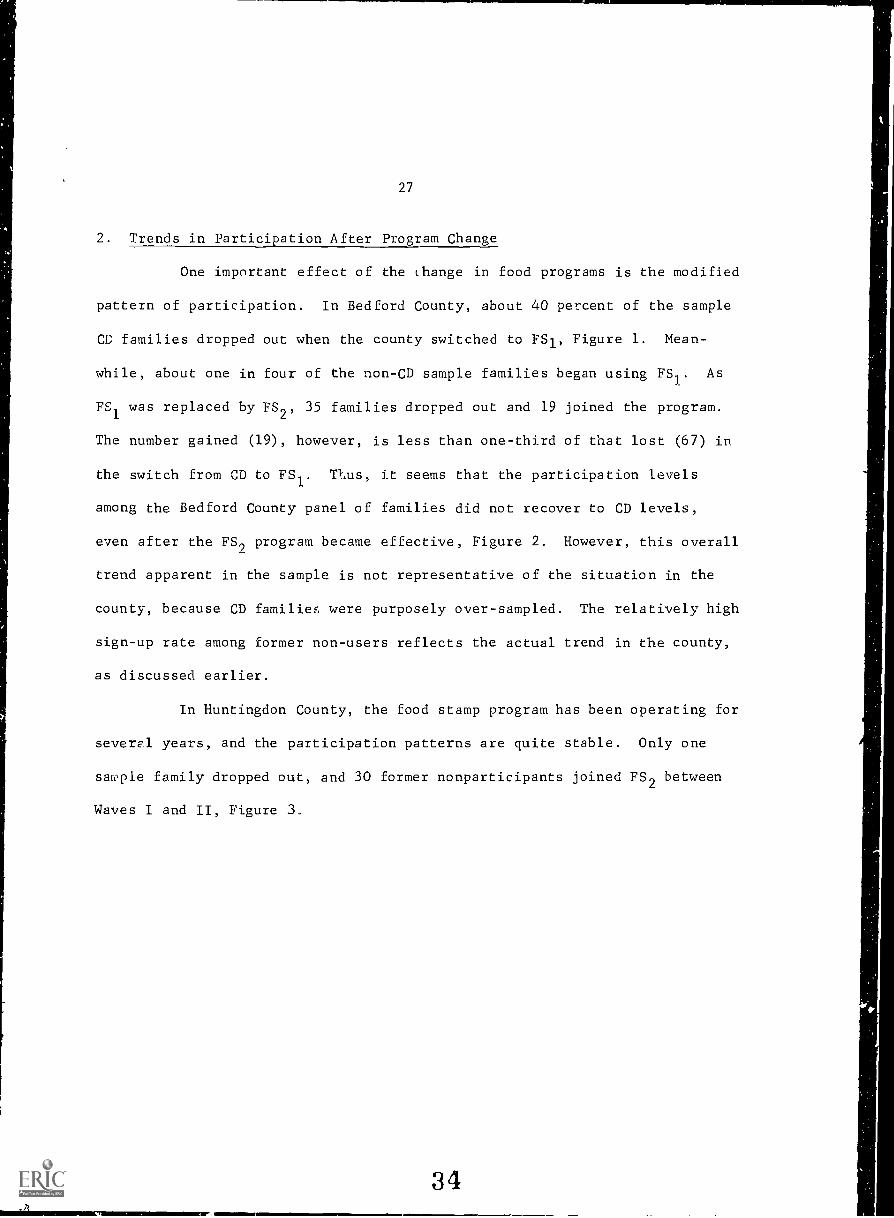
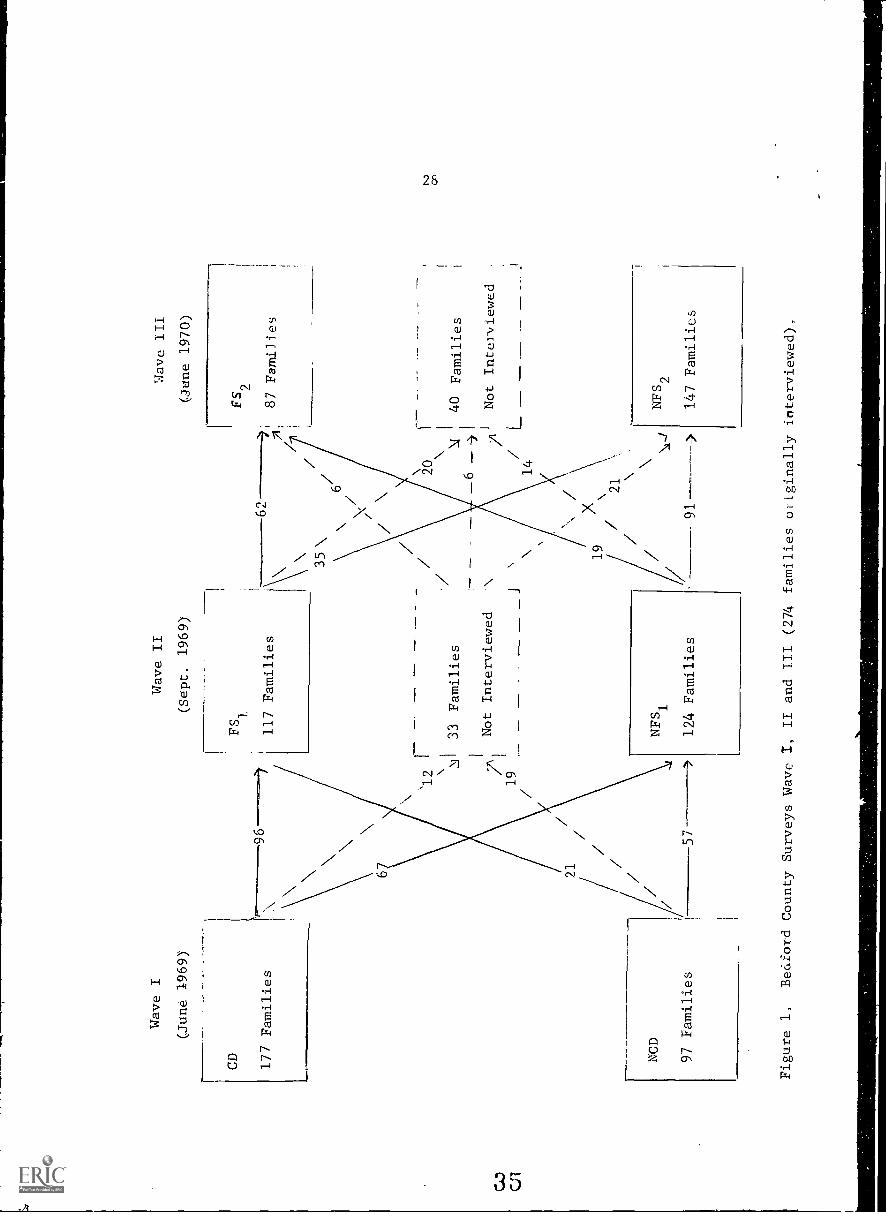
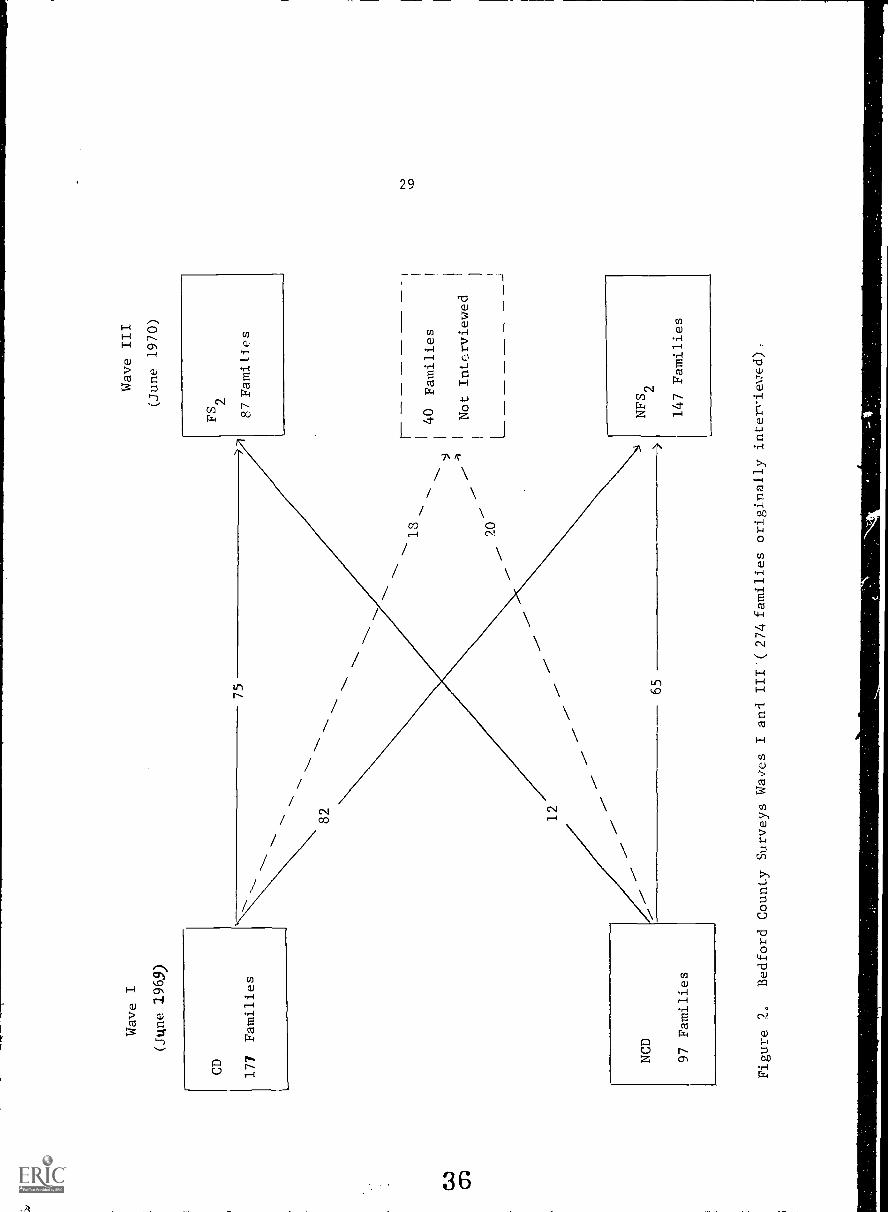
2. Trends in Participation After Program Change
One important effect of the change in food programs is the modified
pattern of participation. In Bedford County, about 40 percent of the sample
CC families dropped out when the county switched to FS1, Figure 1. Mean-
while, about one in four of the non-CD sample families began using FS]. As
FS1was replaced by FS2, 35 families dropped out and 19 joined the program.
The number gained (19), however, is less than one-third of that lost (67) in
the switch from CD to FS1. TI-.us, it seems that the participation levels
among the Bedford County panel of families did not recover to CD levels,
even after the FS2program became effective, Figure 2. However, this overall
trend apparent in the sample is not representative of the situation in the
county, because CD families were purposely over-sampled. The relatively high
sign-up rate among former non-users reflects the actual trend in the county,
as discussed earlier.
In Huntingdon County, the food stamp program has been operating for
severel years, and the participation patterns are quite stable, Only one
sample family dropped out, and 30 former nonparticipants joined FS2 between
Waves I and II, Figure 3.
34
Wave I
Wave II
(June 1969)
(Sept. 1969)
CD
177 Families
96
FS1
117 Families
35\
62-
6/
Wave III
(June 1970)
FS2
87 Families
'12
,
33 Families
71
19
Not Interviewed
\ 20
/\
I
40 Families
Not Interviewed
NCD
97 Families
57
NFS1
124 Families
91---------->
NFS2
147 Families
Figure 1,
BecIford County Surveys Wave I, II and III (274 families originally interviewed)
Wave I
(June 1969)
CD
177 Families
82 12
NCD
75
Wave III
(June 1970)
FS2
87 Families
18
-...
40 Families
I-...
I
I
I1
----
.1
Not Interviewed
.--
20
,
97 Families
65
NFS2
147 Families
Figure
20Bedford County Surveys Waves I an-I III-( 274 families originally
interviewed)

Wave I
Wave II
(Aug. 1969)
FS1
37 Families
NF S1
152 Families
32
30
104
4,
22 Famine:,
1Not Inter'..i,ved
1
-->
(Nov. 1970)
FS2
62 Families
13
1
NFS2
105 Families
Figure 3,
Huntingdon County Survey Design, Waves I and II (189 families originally interviewed),
31
C. COLLECTION AND PREPARATION OF SURVEY DATA
1. Nutrient Intake Records
Several methods of measuring nutrient intake were considered for
the purpose of this study. Numerous methods have been used for similar
studies in the past, but no one method is best for all situation?. Each
appears to have advantages and disadvantages which should be pointed out.
Nutritional status is a much more complex and comprehensive con-
cept than adequacy of dietary intake ascertained by interviews. An assess-
ment of nutritional status, however, requires in addition several chemical
and physical determinations.-3/
Although there has been some doubt about
the validity of nutrient intake records as a proxy for biochemical evaluation
of nutritional status, a review of 50 carefully selected studies conducted
during the period of 1950 to 1967 indicates a striking consistency between
the results of nutrient intake studies and the results of biochemical
studies. [29, pp. 1057-1059] Three widely used techniques for obtaining
food intake and consumption data are discussed below.
Seven-Day Family Food Consumption Record(Food Inventory)
This method, sometimes called the food inventory method, requires
that one weigh and record the quantity of all foods in the house by kind or
item before and after a 7-day period. Food brought in after the initial
inventory must be recorded in the same manner. Inventories are usually
performed by trained personnel and the daily records are kept by the
homemaker.
3/--The biochemical determination of nutrients, metabolites and
enzyme levels of the blood, urine and tissues, and a physical examinationto detect evidence of nutritional deficiencies, and anthropometric data,as determined in the National Nutrition Survey, for example.
38

32
The average consumption of food per person is calculated as follows:
1) Equivalent= Number of meals served this week X number persons
persons
2) Averageconsumption = Total amount of food consumedof food per
Equivalent personsperson
The family food consumption record is useful in determining
"economic consumption"--the weights, quantities and cash value of food
brought into the kitchen from various sources, including bought, home grown,
etc. In principle, this method overstates "dietary consumption," however,
if the amounts thrown away due to spoilage, waste in preparing, food fed to
pets, or unused leftovers are not considered. Furthermore, this method
requires a substantial amount of time and finances which in turn reduces
the possible sample size. [16] In addition, there are several reasons
why this method tends to introduce a bias: (1) Studies have shown the
homemaker sometimes varies her buying habits as a result of being interviewed.
The presence of someone recording the food inventory often creates a
consciousness on the homemaker's part to buy the "proper" foods. (2) The
considerable effort and time required of the homemaker may reduce her
willingness to cooperate. [16, pp. 305-306]
Seven-Day Recall-List Method
The recall-list method is quite different from the one above. The
interviewer asks the homemaker for a complete report of all foods used by
the family during some immediately previous period, usually one week. With
this method the homemaker must recall all servings of foods and their
amounts for the previous seven days. This method is much less expensive
than the seven-day food consumption record. In a study of these two methods,
39

the family record and the recall-list give similar results. [16, pp. 15-16]
Despite this evidence, however, it seems the difficulty of remembering seven
days back would tend to increase the chances of inaccurate and incomplete
reporting.
24-Hour Recall Method, with Food Models
This method, like the seven-day recall-list method, is a detailed
list of quantities of various foods eaten by the family in a previous
period. The nutrient intake may be calculated from the list of foods,
which includes the quantities or weights of foods consumed. All food for
pets, waste or leftovers are excluded, thus providing a better measure of
nutritional intake as opposed to a measure of overall consumption or food
demand. With this method, "food models" representing sizes of servings,
containers and measures can be shown to the respondent to help him describe
the size or amount of serving. This method was used by the U.S Public
Health Service in conducting their National Survey of low-income persons
in 10 states. [23]
When assessing the adequacy of dietary intake of individual
families, there are both advantages and disadvantages to this method as
opposed to the seven-day record. The 24-hour recall interview may be taken
during a day of a typically low or high intake. However, much efficiency
is regained since less time and cost are involved for each record, thus
increasing the potential sample size attainable with a given total cost.
Compared with the seven-day food inventory, this method would tend to intro-
duce less bias, since the respondent has no foreknowledge of the interview.
Also, the memory or recall requirement is much less compared to the seven-day
recall-list method. A more complete discussion of alternative methods of
determining dietary intake can be found in Guthrie [7, pp. 306-308] and
40

34
Morgan. [16, pp. 12-15] In general, these studies indicate the 24-hour
recall is the best method for determining the adequacy of dietary intake
for large groups of respondents,
In light of these considerations, the 24-hour recall method was
adopted for the present study because of the efficiency it offered as well
as its appropriateness to the purposes set forth. Details of the method
used in conducting the 24-hour recall are shown in Appendix A,
2. Design of the Questionnaires
The survey questionnaires for the various waves of interviews
were designed to provide information concerning several characteristics of
the families: household composition, income, food program status, commodity
food acceptance and reasons for nonparticipation, information received on
food and nutrition education, cooking facilities, food expenditure and
shopping habits, sources of foods, food consumption, and transportation
facilities. Information on program eligibility status for nonparticipants
was based on income and assets criteria corresponding to that used by the
Department of Public Assistance of Pennsylvania to determine eligibility.
This also served as a screening process during the first 10 or 15 minutes
of the interview. Families not on CD who did not qualify for the program
by these standards were excluded from the sample.
Information on food consumption was obtained from the homemakers'
recall of foods served and eaten by the family in the 24-hour period prior
to the interview. A special kit of food models of various sizes and shapes
/". v . the northeast study group recommended the one-day recall
method as more efficient and equally accurate for determining the foodpatterns of a group." [22, p. 15]
41
35
was used to help the homemaker describe sizes of servings of foods. See
Appendix A for a discussion of the method used in recording and coding the
dietary data.
A typical interview required approximately one hour to complete.
When famili,:s were not found at home, enumerators were instructed to return
to a residence a second and if necessary a third time; always at different
times of the day.
3. Analyzing Food Intake Data
a. Standard Used for Measuring the Adequacy of Dietary Intake
Various measures are employed for indicating the dietary adequacy
of household food intake. The measures developed for the analytical
purposes of this study are based on the Recommended Dietary Allowances
(RDA) proposed by the Food and Nutrition Board of the National Research
Counci1.2/ The term "allowance" is not to be interpreted as a minimum
requirement, but as a nutritional goal which will satisfy the needs of all
with the exception of only extreme cases. Special nutritional needs due
to health problems, such as anemia for example, are not Lecognized in
these average allowances. However, these allowances do take into account
several considerations: (1) that nutrient losses might occur in cooking
and storage of food; (2) a wide range of requirements exist in the population;
2/An alternative standard of dietary adequacy is that being usedin the analysis of data from the National Nutrition Survey (NNS) [29]. Inour analysis of other data (from Iowa and North Carolina) each family'sdietary adequacy is being computed with both the RDA and NNS standards. This
will provide a comparison of the effects of the different standards on theprogram evaluation conclusions. The NNS standards are somewhat lower thanthe RDA in some cases, and 7 rather than 10 nutrients are considered. Whilethese differences may yield a numerically different index of dietary adequacy,we anticipate that the program evaluation estimates will be roughly thesame; i.e. the differences between the predicted MAR of participants versusnonparticipants will probably remain unchanged.
42

36
and (3) a buffer is necessary for stress conditions, Therefore, a margin
of safety of from 10 to 50 percent is added to the minimum requirements
depending on the nature of each nutrient, (16, p. 288]
The: number of nutrients considered in this study was iii.ited to
ten since these were the only nutrients for which both RDA and food compo-
sition data (used in tabulating nutrient intake) were available. Table
3 contains the RDA for each of the 10 nutrients as fol.lowso protein and
energy (kilocalories); 3 minerals--calcium, phosphorus and iron; and 5
43nomImwmmouress11111111M10..1
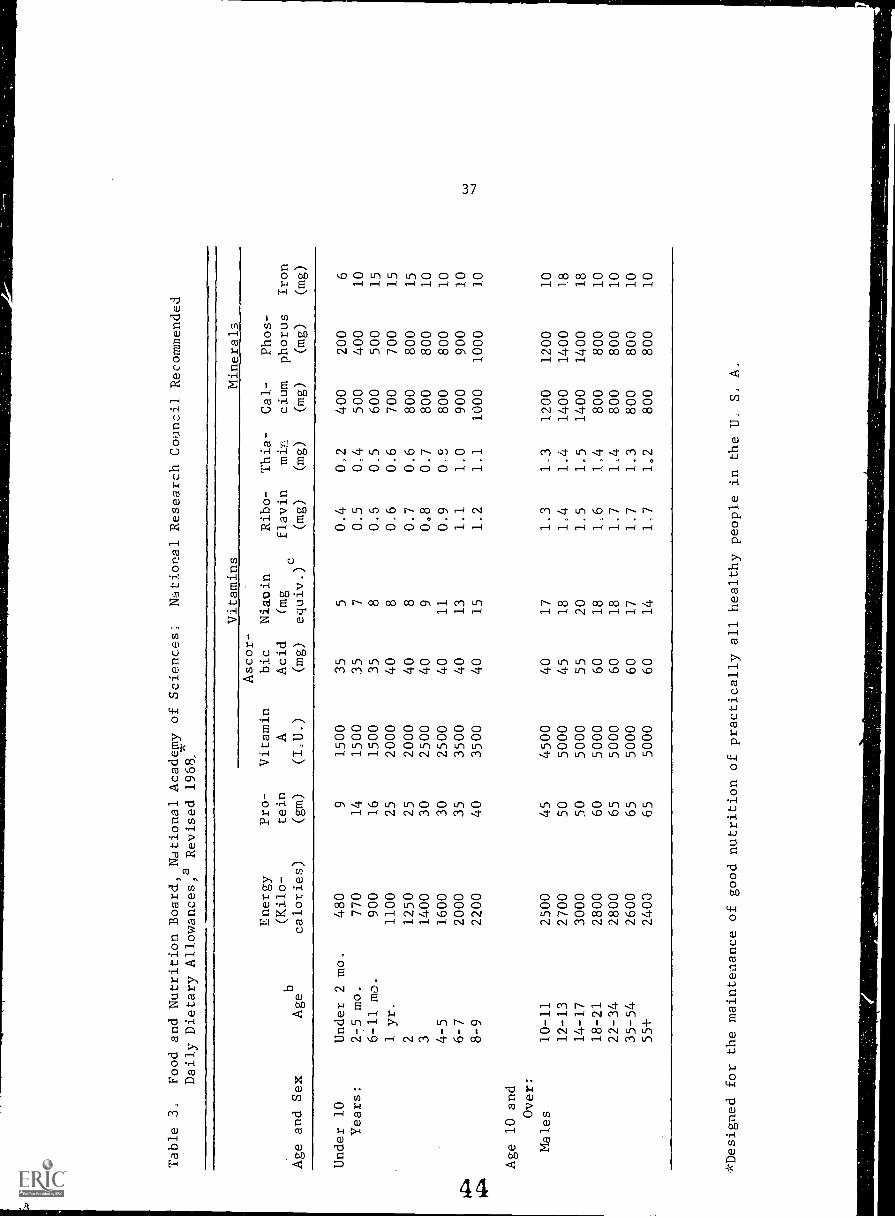
Table 3.
Food and Nutrition Board, National
Academy of Sciences;
National Research Council Recommended
Daily Dietary Allowances,a Revised 1968.
Age and Sex
Vitamins
Minerals
Ascor-
Energy
Pro-
Vitamin
bic
Niacin
Ribo-
Thia-
Cal-
Phos-
bto in
AAcid
(mg
flavin
min
cium
phorus
Iron
Age
calories)
calories)
(gm)
(I.U.)
(mg)
equiv.)
(mg)
(mg)
(mg)
(mg)
(mg)
Under 10
Under 2 moo
480
91500
35
50.4
0.2
400
200
6Years:
2-5 mo.
770
14
1500
35
70.5
0.4
500
400
10
6-11 mo.
900
16
1500
35
80.5
0.5
600
500
15
1 yr.
1100
25
2000
40
80.6
0.6
700
700
15
21250
25
2000
40
80.7
0.6
800
800
15
31400
30
2500
40
90,8
0.7
800
800
10
4-5
1600
30
2500
40
11
0.9
0-S
800
800
10
6-7
2000
35
3500
40
13
1.1
1.0
900
900
10
8-9
2200
40
3500
40
15
1.2
1.1
1000
1000
10
Age 10 and
Over:
Males
10-11
2500
45
4500
40
17
1.3
1.3
1200
1200
10
12-13
2700
50
5000
45
18
1.4
1.4
1400
1400
18
14-17
3000
50
5000
55
20
1.5
1.5
1400
1400
18
18-21
2800
60
5000
60
18
1_6
1,4
800
800
10
22-34
2800
65
5000
60
18
1.7
1.4
800
800
10
35-54
2600
65
5000
60
17
1.7
1.3
800
800
10
55+
2400
65
5000
60
14
1.7
1,2
800
800
10
*Designed for the maintenance of good nutrition of practically all healthy people in the U.
S. A.
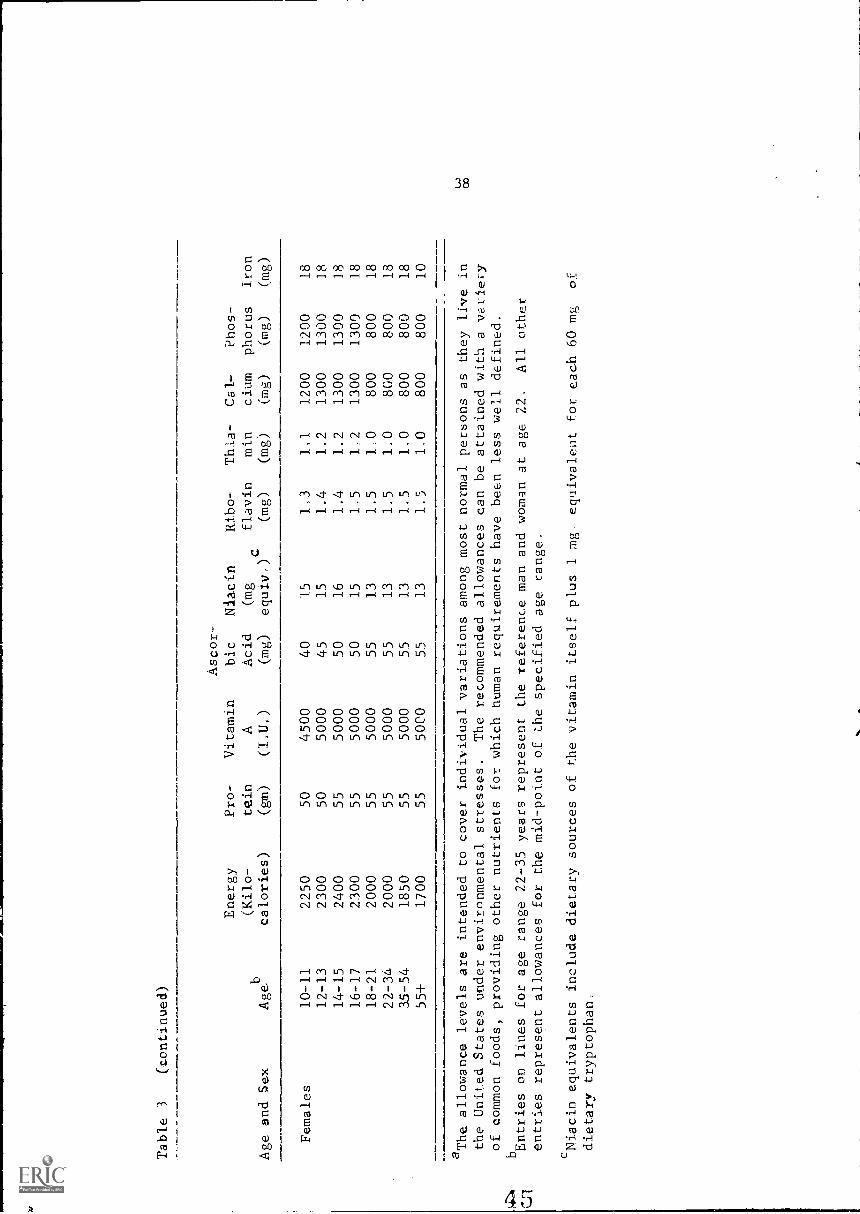
Table 3
(continued)
Ribo-
flavin
Energy
(Kilo-
Pro-
tin
Vitamin
A
Ascor-
bic
Acid
Niacin
(mg
Thia-
min
Cal-
cium
rhos-
phorus
Iron
Age and Sex
Age
calories)
calories)
(gm)
(I.U,)
Ong)
equiv,)c
(mg)
(mg)
(mg)
(mg)
(mg)
Females
10-11
2250
50
4500
40
15
1,3
1,1
1200
1200
18
12-13
2300
50
5000
45
15
1.4
1.2
1300
1300
18
14-15
2400
55
5000
50
16
1,4
1.2
1300
1300
18
16-17
2300
55
5000
50
15
1,5
1,2
1300
1300
18
18-21
2000
55
5000
55
13
1.5
1,0
800
800
18
22-34
2000
55
5000
55
13
1.5
1.0
800
800
18
35-54
1850
55
5000
55
13
1.5
1.0
800
800
18
55+
1700
55
5000
55
13
1.5
1,0
800
800
10
aThe allowance levels are intended to cover individual variations among most normal persons as they live in
the United States under environmental stresses.
The recommended allowances can be attained with a veriei-y
of common foods, providing other nutrients for which human requirements have been less well defined.
bEntries on lines for age range 22-35 years represent the reference man and woman at age 22.
All other
entries represent allowances for the mid-point of Lhe specified age range,
c. i
Niacn equivalents include dietary sources of the vitamin itself plus 1 mg
equivalent for each 60 mg
of
dietary tryptophan,
vitamins--vitarwin A, three of the B vitamins (thiamin, riboflavin and
niacin)--6/, and vitamin C (ascorbic acid) . The RDA for each nutrient varies
by the age and sex of the person. For a given nutrient, the RDA for a
family is calculated on the basis of the age and sex of each person
For purposes of the present analysis, an "adjusted RDA" was used
as the basis for measuring the adequacy of dietary intake. The adjustment
is a proportional reduction of the RDA for any meal eaten away from home
during a 24-hour period. For each nutrient analyzed, this proportional
reduction was based on t...e propor:ion of the total nutrient intake eaten
at each meal by the sample families who ate no meals away from home. This
procedure assumes that meals eaten away from home provided the same propor-
tion of nut,ients as the meals at home.-7/
This assumption seems superior
to an assumption often used--that each of the 3 meals provides a third
6/It should b3 noted that niacin actually available for use in
the body is underestimated here, since niacin can be converted from excesstryptophan (in protein) within the cell. Niacin adequacy as discussed inthis study is based solely OD niacin intake in the form of niacin and notas derived from protein.
2/This assumption was tested empirically, and a small adjustment
was sul-,sequently made. It: was found that, a multiple regression model,
the index for adequacy of dietary intake (MAR, discussed beim') was foundto be biased downward by about 0.06 percentage points for eac.c one percentagepoint increase in the index of proportion of meals eaten away from home (PMA).For example, a family reporting 20 percent of its meals away from home wouldhave an MAR biased downward by 1.2 percentage points This amount of biaswas statistically significant (at the 0.05 level of probability), but ineffect it was trivial. When adjustments were made for this bias, theresulting conclusions (with regard to food program effects, etc.) did nrtchange. Perhaps in otr_tr studies an adjustment will prove to be morecritically needed. If so, the adjustment factor can be computed byincluding the PMA index as an independent variable in the multiple regression.1del with MAR as dependent variable. The PMA index is computed simply asone minus the ratio of adjusted RDA to unadjusted RDA of a specific nutrient.
46

40
of the intake of each nutrient.13.)
This adjustment makes the standard
9/comparable with the dietary intake data for meals eaten at home. For
families that consumed all their meals at home, the "adjusted RDA" is
exactly equal to the RDA; for others it is smaller.
A computer program was designed to tabulate nutrient intake from
the "24-Hour Recall" (food records) for each household and to determine the
Recommended Dietary Allowance which can be used as a standard of comparison
for that household. The computer program, Nutrient Intake Tabulator and
Evaluator (NITE), is composed of three phases:
Phase I. Outrient Intake for Each Household
Phase II. Percent of Total Nutrient Intake Obtained at Each Meal
Phase III. Recommended Dietary Allowances (RDA) for Each Household
A detailed description of the NITE program is available from the authors.
A brief description of the computing logic follows.
b. Computing Nutrient Intake of Each Household
The nutrient intake of each household is tabulated for 10
nutrients (e.g., gms. of protein, mgs. of Vitamin C, etc.) by considering
each food and the amount consumed by the household. The amount of each
nutrient in 100 grams of each of 2483 foods was compiled on magnetic tape
from the standard sources, "Composition of Foods, Raw, Processed and
Prepared," Agricultural Handbook No 8, USDA, (1963). A few additions
8/That each of 3 meals provides one-third of the intake of each
nutrient, is implied in Lite method of calculating the RDA for the household,used in some studies; see Morgan [16, p. 15]
9/Between-meal consumption is excluded when computing the adjusted
RDA for each person in the family. This was done under the assumption thata person's between-meal consumption away from home would be proportionateto the meals eaten awa) from home.
47
41.
and corrections were made in the published data from an errata sheet
supplied by USDA, prior to the analysis3'9IV The amounts of each nutrient
contributed by a particular food were added for all foods consumed by a
household, to determine the total amounts of intake for each nutrient. For
foods recorded in volumetric un_ts or quantity measures, a table of food
weights compiled from a number of standard sources provided the basis for
conversions from volume or quantities to weight (see Appendix A).
c. Adequacy Measures of Individual Nutrients
For each of the 10 nutrients analyzed, an adequacy ratio was
computed for each family, based on the family's intake and adjusted RDA
of each nutrient. Taking energy (kilocalories) as an example, "the energy
adequacy ratio" is a ratio of the total kilocalorie intake for the house-
hold during a 24-hour period divided by the adjusted RDA for energy
(kilocalories). If this ratio is less than two-thirds, the household
is said to have an "inadequate" intake of energy during that 24-hour
period. A ratio of 1 denotes a dietary intake equal to the adjusted RDA.
It should be emphasized that the dietary intake data obtained
from the 24-hour recall are not intended as an accurate indicator of the
nutritional adequacy of any individual family,11/ Rather, these data are
1 /Separate tabulations were made for families receiving CD foods
using nutritive values as given by Feeley and Watt [6] for those whosecomposition differed from foods given in Handbook No. 8. Although some ofthese foods were enriched with vitamins, they sometimes had lower nutritivevalues than most comparable foods found in Handbook 8 (e.g., dehydratedegg mix).
11/Two of the reasons why errors may occur are: (1) Some members
of the family may get less than "their share" of certain foods, Thus, eventhough the family's overall dietary intake may appear adequate in total,some members of the family may be receiving an inadequate diet, (2) Certainmembers of the family may have special dietary needs not reflected in theRDA--anemia for example. Both of these possible sources of error arerecognized; both lie beyond the scope of the present study and are ignored,
4c

42
inteLded to be used to indicate comparisons among large groups of families,
Due to the day-to-day variation in the dietary pattern of the families,
cl-,sr. would ordinarily expect the responses obtained from individual families
to be subject to considerable random variation. For example, the family's
intake of Vitamin A on the interview day may be extremely low (e.g., 20
percent of the RDA) and this may be an abnormal day in this respect. But
when large groups of observations are analyzed, these individual variations
tend to average out, so that the inherent differences between two or more
groups may become apparent. The idea of the validity of inter-group
comparisons is a key concept in the development of an overall indicator
of dietary adequacy for each family, based on the information obtained in
the 24-hour dietary recall.
While individual nutrient adequacy measures are useful in
determining particular nutritional inadequacies or intake patterns amoag
various groups, interpretation of the overall impact of food programs using
a number of measures is sometimes impractical. Conflicting indications
among nutrients may confuse the interpretation of the overall effect of the
program. A way of combining individual nutrient measures to develop an
overall index of dietary adequacy helps to facilitate the kind of analysis
reported here.
d. Alternative Indexes to Represent Overall Dietary Adequacy
Most studies concerned with dietary adequacy or nutritional status
have adopted 67 percent of the Recommended Dietary Allowances (11419as
"adequate" under the assumption that diets supplying nutrient levels below
this amount might indicate a "suboptional state of nutrition". 17, p, 309]
It is also true that a persistent deficiency in just one nutrient, even with
a very adequate intake in all other nutrients, may cause serious health
49
43
problems or illnesses. Thus it seems appropriate to use an index which
will take into account the critical level as well as the serious effect
of deficiency in any one nutrient. Three alternative Indexes were designed
and considered for purposes of this study. The least sensitive of these
is discussed first.
"Meets 10:"
This index is given a value of "one" if the intake of all ten
nutrients met or exceeded the 67 percent level of RDA; but if the intake
of any one nutrient was below the 67 percent level, the family is assigned
a "Meets 10" index value of 0. While this index is useful to point out the
number of families whose dietary adequacy is above and below a very critical
point, it does not detect variations within the ranges above or below that
points Extremely low intake is coded the same as intake just slightly below
the 67 percent level. This feature is highly undesirable for purposes of
the kind of multivariate analysis reported here.
"Nutrient Sum:"
A second index of overall dietary adequacy was calculated for
each family, based on the critical point (i.e., 67 percent level) of each
of the ten nutrient adequacy ratios. The "nutrient sum" is simply the
total number of nutrients for which the family's intake meets or exceeds
the 67 percent level of the adjusted RDA. The "nutrient sum" is a whole
number between 0 and 10; it is more sensitive to variations than the
"Meets 10" index, which has a value of either 0 or 1. The "nutrient sum"
shares the rigor of the first index, in that over-consumption of one
nutrient will not compensate for an under-consumption of another nutrient,
no matter how high or low the level of intake. A major weakness of this
50
4
index was noted, however, for the purposes of this analysis, Since the
.iequacy ratios of various nutrients tend to be positively correlated, it is
not unusual to find a family for which all or nearly all of the nutrient
adequacy ratios are just above or just below the 67 percent level. As an
extreme example, one family may have a 66 percent adequacy level in all
ten nutrients and thus its "nutrient sum" would be 0. A second family may
have a 67 percent adequacy level in all ten nutrients for a nutrient sum
of 10. This wide difference in "nutrient sum" (0 versus 10) is too extreme
to accurately reflect the observed difference in dietary adequacy in this
hypothetical example--66 versus 67 percent for each nutrient ratio. Thus,
a more reasonable alternative was sought which would be less sensitive to
any particular adequacy level and more sensitive to all levels within a
reasonable range.
"MAR:"
A third overall index of dietary adequacy was calculated for each
family, based on the ten nutrient adequacy ratios. This index, called
Mean Adequacy Ratio (MAR) is calculated as the simple average of the ten
adequacy ratios. For this purpose, each of the nutrient ratios was truncated
at a maximum value of 1.0, or an intake 100 percent of RDA. This was done
to prevent a gross over-consumption of one nutrient from compensating for
an under-consumption of another nutrient in the calculation of the MAR
index. This truncating was found to be necessary to avoid distortion due to
extremely high consumption of some nutrients. For example, one family
which consumed an extremely large amount of liver, had a Vitamin A intake
more than 10 times the RDA. This procedure is consistent with nutrition
theory, in that a high level of consumption of one nutrient does not
generally compensate fo:7 a low intake of another. A family whose intake
45
of all ten nutrients was at 100 percent or more of the RDA levels would
have an MAR index of 100, for example. In cases where the family's con-
sumption of one or more nutrients is less than 100 percent of RDA, and
MAR index will be less than 100. In the hypothetical example mentioned
above, if all of the nutrients are consumed at the level of 66 percent of
RDA, then the MAR index would be 66, while a family consuming each nutrient
12/at the 67 percent level would have an MAR of 67.--
The MAR index shares the general defect of the 24-hour recall
as a measure of dietary adequacy for an individual family; it is designed
for use with groups of data. It should be noted, for example, that a
small amount of inter-nutrient compensation is allowed within the range
under 100 percent of RDA. For example, if the Vitamin A adequacy ratio
was 0.8 and the Vitamin C adequacy ratio was 0.6 and all the other nutrient
ratios were 0.7, then the MAR statistic would be calculated as 70. In this
case, the slightly higher consumption of Vitamin A would be allowed to off-
set the slightly lower consumption of Vitamin C This small degree of
averaging clearly would not seriously distort the MAR as a general index of
dietary adequacy for purposes of group comparisons. A somewhat more extreme
case, one which seems to occur only rarely, is where the adequacy ratio is
extremely low for one nutrient (20 percent of RDA for Vitamin C, for example)
yet the adequacy ratio approaches or exceeds 100 percent for all the other
nine nutrients. If this information were taken literally as representing
the family's usual diet, then the acute deficiency of the one nutrient would
render the diet "deficient," for serious health problems may occur if even
one nutrient is critically short for a sustained period.
12, The MAR index is a simple arithmetic mean of the ten nutrientadequacy ratio. Equal weights were ascribed to the various nutrients, becauseall are essential. If food composition data and RDA were available for otheressential nutrients, these also would have been included in MAR.
52.

46
The MAP index, by virtue of being an average, tends to obscure
extreme deficiencies in individual nutrients In practice, however, the
adequacy ratios of the various nutrients tend to be positively correlated.
The usual situation is for the adequacy ratios to be similar, If one
nutrient is deficient, several are deficient, reflecting an inadequate
intake of a particular food group) and consequently the MAR index reflects
these deficiencies by being rather low,
For further comparison cf overall dietary indexes, simple cor-
relations were calculated between these and individual nutrient ratios
(Table 4). The nutrient sum and MAR (variables 11 and 12, respectively) are
very highly correlated -- r = 0L963. The question arises, which of these
overall dietary adequacy measures is more highly correlated with each of the
ten individual nutrient ratios? Table 4 shows that MAR is slightly more
highly correlated. It is not possible to calculate meaningful correlation
coefficients with the "Meets 10" index, since the only values this variable
can have are 0 and 1- MAR 67 (variable 13 on the same tabl) is similar to
the Mi2, with one exception; MAR 67 is calculated by truncating each of the
nutrient ratios at 67 percent rather than 100 percent. MAR 67 is very
highly correlated with MAR (r = 0.934) and with nutrient sum (r = (31870).
However, MAR 67 is not as highly correlated as MAR with the individual nut-
rient ratios. The results of this correlation analysis supports our tendency
on a priori grounds to prefer the MAR as a measure of overall dietary adequacy,
for purposes of the present analysis. The question remains, how well does
the MAR reflect the levels cf individual nutrients? How sensitive Is
the MAR to an improvement in dietary intake? How large an increase in
food intake is needed to enhance the MAR by one point? And, from an
economic point of view, what is the cost of enhancing the MAR by one point,
through addition uf various food items to the diet? These questions are
53

Table 4.
Correlations Between Individual Nutrient Adequacy Ratios and Overall Dietary Adequacy Indexes.
(Wave I Bedford County;
VARIABLE
No.
12
34
56
78
910
11
12
ENERGY
11.000
PROTEIN
20 706
1.000
CALCIUM
30.553
0.483
1.000
PHOSPHOROUS
40,756
0.771
0,772
1.000
IRON
50.632
0 662
0:295
0.645
1.000
VITAMIN A
60 528
0.464
0.370
0.468
0.465
1.000
THIAMIN
70,636
0.723
0.412
0.622
0.682
0.319
1 000
RIBOFLAVIN
80 693
0.845
0,740
0.822
0.571
0 503
0.715
1 000
NIACIN
90.687
0.755
0.246
0.641
0.719
0,374
0 694
0.618
1.000
VITAMIN C
10
0.281
0.269
0,127
0.205
0.293
0,363
0.396
0,306
0,337
1.000
NUT. SUM
11
0.693
0,786
0,550
0:736
0,637
0.526
0.680
0.756
0,662
0.449
1.000
MAR
12
0,711
0.824
0.565
0.762
0.674
0:547
0.712
0,802
0.698
0.493
0.963
1.000
MAR 67
13
0.560
0.687
0.458
0,614
0.559
0 448
0,580
0.667
0.565
0,466
0.870
0:934
48
answered in the following sect ions, as a means of making more tangible
the meaning o1 the MAR index,
e. The Need for Individual Nutrient Ratios in Conjunction With MAR.
The MAR index is very highly correlated with several of the
individual nutrient ratios; e.g. 0,82 for protein, 0,80 for riboflavin, etc.
However, the MAR is less highly correlated with the ratios for Calcium (0.57),
Vitamin A (0,55), and Vitamin C (0,49), These relatively low correlations
are to be expected, in view of the fact that these three nutrients are
seldom found abundantly in the same foods. Another indication of the inde-
pendence of these nutrients is their low correlation with each of the other
nutrients. For example, all of the correlations between VItamin C and the
other nutrients are below 0.4; and its correlation with calcium is only 00127.
These findings lead to the procedural conclusion that, while the MAE. is a
useful index of overall dietary adequacy for program evaluation purposes,
some of the individual nutrient ratios should be considered separately as
well.
f. MAR. Sensitivity as a Measure of Dietary Adequacy
Tn order to illustrate the sensitivity of the MAR both to the
quantity and types of foods consumed, the MAR of several size 4 families was
calculated before and after adding certain hypothetical quantities of
certain foods to their actual intake, Table 5a
tn general, the lower a family's intake the more benefit it
derives from the addition of food--especially the more complete foods such
as milk. Consider, for example, the effect of an added quart of milk. per
day to the observed intake of two families. Family 1 had an MAR of 43,
comyared with 78 of Family 2, When a quart of milk is added to their
observed 24-hour intake, tne MAR of Family 1 increases 34 points, while
that of Family 2 goes up by only eight pOints. The contrast is even sharper

49
in the case of adding orange juice, because Family 1 was initially more
deficient in Vitamin C than Family 2,
Other families shown in Table 5 exhibited a greater or smaller
improvement, depending on their initial position, and the specifics nutrients
in which they were deficient. When a pound of hamburg is added in addition
to the quart of milk, the MAR rises by an additional 16 points in the case
of Family 3; but this meat provided no further improvement in the case of
Family 4, whose MAR was brought up to 99 by the quart of milk alone.
Family 5 gains substantially from milk plus meat. What if rolled oats
rather than milk or meat is added to the dietary intake? Family 5 gains
relatively little from the addition of rolled oats (+6 points) while
Family 6 showed essentially as much improvement from oats (+20 points) as
from milk.
56

50
Table 5, Sensitivity of MAR Illustrated by the Addition of t.ical
Quantities of Selected Foods to the Actual Daily Intake ofSelected Four-Person Families.
Change in MAR After Increasing Daily Intake by:FamilyNumber
ActualMAR
1 QuartMilk
1 Quart MilkPlus l# Hamburg
1.33 CupsRolled Oats
16 OunceOrange Juice
1 43 +34 4-44 +33 +382 78 +8 +12 +2 +33 46 +30 +46 +36 +434 82 +17 +17 +16 +16
5 67 +13 +22 +6 +.. °.
6 71 +20 +23 +20 +20
5?
51
Thus, a family whose intake is deficient in certain nutrients
contained in a given food will benefit more than will a family already
consuming an adequate level of these nutrients. The magnitude of improve-
ment in MAR that can be caused by an increase in intake of certain goods
may range from zero to more than 40 points, in the examples shown here.
Likewise the cost of increasing the MAR varies from family to
family, and from one assumed food to another, Table 6. The cost per day
for improving the diet of Family 1 is less than lc per point increase in
MAR, if we assume the family consumes an additional quart of milk. In
contrast, Family 2 has a far better diet initially, and the comparable
cost figure is more than 30 per day per point increase in MAR,
These examples illustrate the amount by which the MAR of a four-
person family could be increased by the addition of a modest amount of
food to the family's diet, and the daily cost of enhancing the diet by
these amounts.
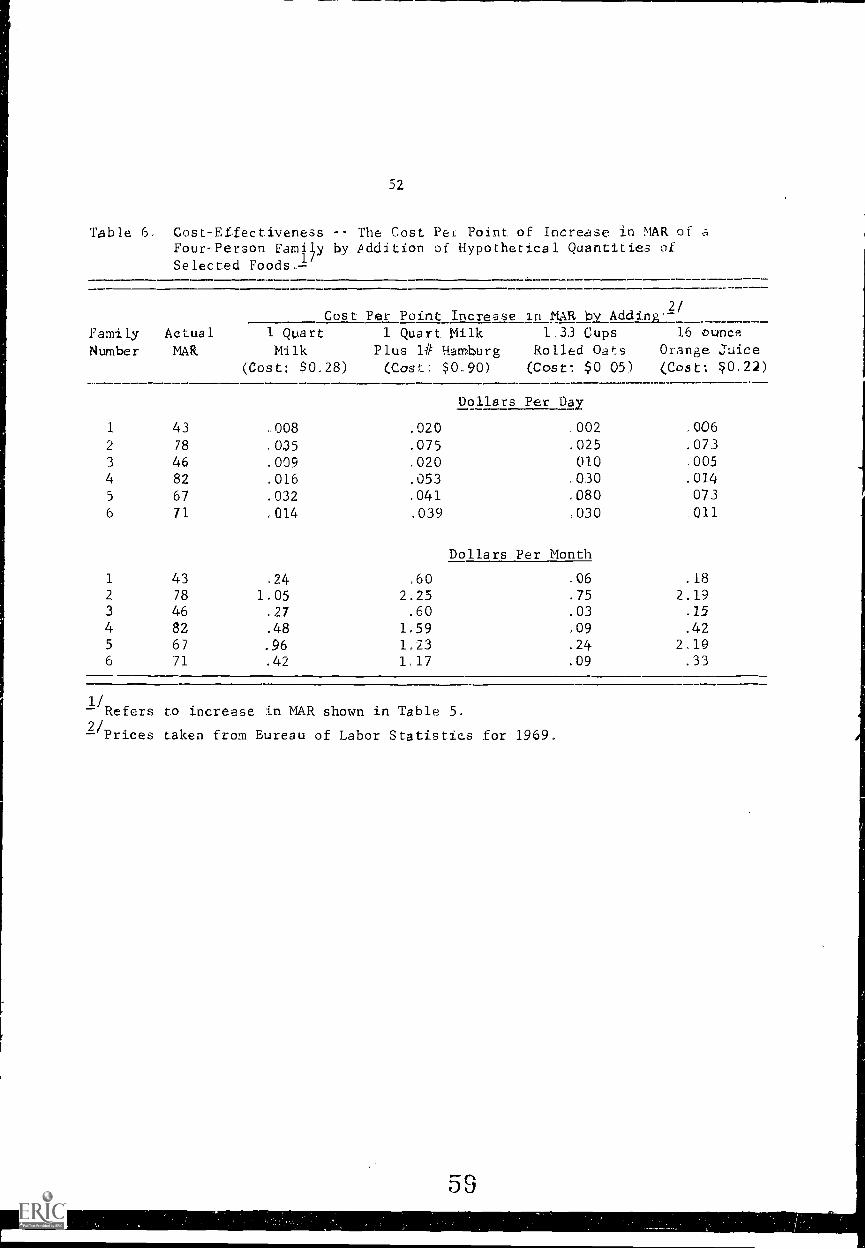
52
Table 6. Cost-Effectiveness -- The Cost Pei Point. of Increase in MAR ofFour-Person Family by Pddition of Hypothetical Quantities ofSelected Foods): /
Cost. Per Point Increase/
in MAR loy_AddinsL-2
FamilyNumber
ActualMAk
1 Quart
Milk(Cost: $0.28)
1 Quart. Milk 1.33 Cups
Plus 1# Hamburg Rolled Oats
(Cost $0.90) (Cost: $0.05)
16 ouncP.
Orange Juice(Cost: $0.22)
1 43 .008 .020
Dollars Per Day
006.002
2 78 .035 .075 .025 .073
3 46 .009 .020 010 .005
4 82 .016 .053 .030 .014
5 67 .032 .041 .080 073
6 71 014 .039 ,030 .011
Dollars Per Month
1 43 24 .60 .06 .18
2 78 1.05 2.25 .75 2.193 46 .27 .60 .03 .15
4 82 .48 L59 ,09 .42
5 67 .96 24 2,196 71 .42 1,17 .09 .33
1/Refers to increase in MAR shown in Table 5.
2/Prices taken from Bureau of Labor Statistics for 1969.
59

53
D. DIETARY .ADEQUACY -A CONCEPTUAL MODEL
The adequacy of a fandly's dietary intake at any point in time
may be influenced by a wide range of factors, both within and. outside
the family. Two major categories of relevant factors are (1) the family's
food purchasing power, or more generally, its access to food, and (2) the
nutritional efficiency with which the nomemaker uses the food resources,
in terms of the types of food obtained, and the manner in which it is pre-
pared and cooked for the family,
Factors Affecting Access to Food
Access to food or the resources needed to obtain food are ob-
viously relatigd to income, but other factors are also relevant.
1. The family's income--particularly the discretionary income which re-
mains after the bills are paid (rent, utilities, installment credit
accounts, etc.). Families with acute shortages of money frequently are
faced with pressing needs, such as a rent bill or a car payment that must
be paid, or a health crisis, which takes precedence over food expenditure
for use of the limited funds.
2, Income includes the amount of real income supplement a family derives
from participation in a food assistance program. This varies with several
factors, With the CD program, the value of' foods distributed is essentially
a constant amount per person per month- This amount will vary from one
state to another, depending on the commodities accepted by the State from
the federal government. Over time the amounts also vary, as commodities
are added to or dropped from the CO list, The: amount of real income
supplement derived from the CD foods will be generally less than their
retail value, for families who would not have purchased ox do not use
certain commodities.
60
54
The real income supplement accruing from the food stamp program
is essentially the difference between the face value and the cost of the
stamps. This amount of bonus diminishes as the family's income rises.
Conceptually the cost a family must incur to participate (e.g., transporta-
tion to the bank, etc.) must be deducted from the bonus in arriving at an
increase in real income. Obviously only a small fraction of an increase in
income or a real income supplement will be spent for food. It is not known
whether the income elasticity of demand for food is the same for real income
supplements (e.g. FS or CD) as for cash income.
3. Number of days since receipt of income and frequency of pay are very
relevant. Important variations in food access occur within the family's
financial budgeting period (usually a month), Late in the pay month,
many families--particularly the poor--tend to run short of food, This may
be less likely to occur in families receiving a significant amount of pay
two or more times during the month.
4, The same type of time relationship seems likely to prevail with
regard to the length of time since food assistance (CD or F$) has been
received. Caseworkers, extension nutrition aides, and others have
repeatedly seen evidence that several of the more palatable commodities
(e.g., fruit juice, canned meat) are used up during the first few days
after they are distributed. The same may be true to a certain extent with
regard to the food stamps. One of the purposes of the present study is to
see whether the benefit of food program participation fades out, and to
determine the extent to which food assistance compensates for the lack of
food resources late in the pay month.
5. Family size is obviously an important factor in determining the
adequacy of a family's food resources at a given income level. For this
reason, a relative income index (income divided by the poverty line) is

55
used as a measure of the family's economic well-offness. This income-
poverty ratio has a value less than 1.0 for families below the poverty
62

56
level of income. Given the fact that the official poverty line has been
established at a level considerably below the amount of money needed to
buy all the basic necessities L14] one should expect inadequate food
intake to occur at or above the poverty Line, due to lack of access to food
resources.
Likewise, the increase in food resource adequacy due to the real
income supplement from CD or FS will depend on the size of the family,
For this reason; the bonus per person seems relevant to the overall dietary
adequacy. Given the tendency for benefits to fade with increasing time
since receipt of food aid, it seems reasonable to hypothesize that bonus
per person per day since receiving food aid would be significantly re-
lated to food availability and to adequacy of dietary intake.
6. Home-produced foods (gardens, milk cows, etc.) can be an important
source of food, especiallN- during the suumer and fall.
Given the amount of food resources available to the family, the
question remains how efficiently are these resources used?
Factors Affecting Nutritional Efficiency
The use of food resources is influenced by a wide range of factors
related to nutritional knowledge, homemaker skills, and her aspirations for
a more nutritious diet. Cultural factors are important, in that traditional
food habits are difficult to change.
1. Educational attainment of the homemaker is generally expected to have a
beneficial effect on the dietary level of the family. However, a higher
level of educational attainment, measured in years of school completed, is
not an accurate indicator of the nutritional knowledge of the homemaker,

57
Nor does it necessarily indicate a higher aspiration for improved diet.
Homemakers with college education are more likely to overcome traditional
food patterns and cultural barriers, but such high levels of education are
seldom found among the poor. Most homemakers in poor families have less
than a high school education. Thus, one should not expect higher levels
of homemaker education, within this range of observations, to have a strong
effect on the diets of the poor families.
2. Number of nutrition aide visits should improve the nutritional efficiency
in use of food resources, The aides encourage the homemaker to obtain and
prepare more nutritious foods for her family. It should be recognized,
however, that the families with the least adequate diets are frequently
the most resistant to changes in dietary behavior. Often the aide finds
such severe problems of health, clothing, and housing that she is unable to
get the homemaker interested in nutritional information. Many preliminary
visits are often needed before any improvement in dietary behavior could
reasonably be expected. Even then, some homemakers may choose not to
change their food patterns, Therefore, it does not seem reasonable to
expect an ithmediate transformation from inadequate to adequate diets as a
result of a certain number of nutrition aide visits.
3, Age of the homemaker is generally expected to be negatively related
to dietary adequacy. Older people seem to place relatively low emphasis
on food than do younger families - - particularly' those with children.
4. Family size should be relevant for the same reason: one- and two-
person families would be expected to have less adequate diets than larger
families.
64

58
5. Day of the week is thought to have an important effect. On weekends,
particularly Sunday, many families customarily have a larger meal than usual,
Whether or not this is true among the poor is open to question.
6, Income adequacy may also exert an important influence on the nutritional
efficiency with which the family uses its food resources. Families with low
income may feel forced to buy the lower priced cuts of meat, which are a
more economical source of nutrients than are the higher priced cuts. Or.
the other hand, it must be recognized that food provides a broader range
of utility than just nutritional value. Variety in the diet is also con-
sidered a desired end. Specialty food products, snacks, and convenience
foods have a definite recreational value, in providing easier meal prepara-
tion and variety. The poor families who feel deprived in other ways may
choose to compensate by buying such food items, many of which may be very
low in nutritional value. Thus, it is not clear on a priori grounds what
net effect a marginal change in income would have on the nutritional effi-
ciency with which a family uses its food resources.
7. Adjustment lea may be apparent in a family's dietary behavior. That is,
soon after adoption of a food program or a major change in the nature of a
program, families may have different food purchasing patterns than would
be true after a longer period of adjustment to some sort of "equilibrium
position". When surveys are taken very soon after a program is adopted,
participating families may not have reached an equilibrium behavior pattern,
thus giving misleading results. For example, the FS1 survey in Bedford
County (Wave II) was conducted 1 to 3 months after the food stamp program
went into effect, whereas the FS program had been operating in Huntingdon

County for several years. In both counties, new families were signing up
for food stamps each month. The extent of adjustment lag is not known, but
its effect is not thought to be significant, and it has been ignored in the
present study.
The ideas underlying this conceptual model were taken into account
in defining and computing the variables for the analysis, and in devising
an analytical model for testing the hypotheses implied by the conceptual
model_ Before proceding to the analysis, the survey results are smenarized
to provide a more concrete idea of the characteristics of the sample,

bO
E, SUMMARY OF SURVEY DATA BY DIRECT TABULATIONS
Data collected by the 24-hour dietary recall are usually analyzed
for groups of families rather than by individual family, because food or
nutrient intake of a single day may not be a good indication of the average
daily nutrient intake for a household. There are right ways and wrong ways
of aggregating the data, however, This may be done simply by adding together
the dietary intake for a group of households representing consumption on
various days of the week, and under a variety of conditions, and combining
the observations into aggregate group average intake values, which are then
compared with aggregate requirements for the same nutrients. This aggregate
method has a serious weakness in that distribution within the group is
obscured, That is, it may appear that diets are adequate for all households
since the total consumed equals or exceeds the total needs, while in fact,
inadequate intake of some households is offset by the overconsumption of
others, In an attempt to avoid this error, the adequacy ratios were computed
separately for each family, Direct tabulations were made of the nutrient
adequacy ratios-- program participants versus nonparticipants, for example,
averages of the nutrient ratios were plso computed, The results of these
and other tabulations are presented below:
1. Dietary Adequacy
Several measures of dietary adequacy were computed from the survey
data. The individual nutrient adequacy ratios may be used as an
indication of nutrients that are most severely lacking. Average values of the
various nutrient adequacy ratios are shown in Table 7, where recent: program

61
Table 7.. Average Sample Values of MAR and Nutrient Adequacy Ratios for TenIndividual Nutrients, for Families Receiving Food AssistanceWithin the Past 14 Days, Versus Nonparticipants at Same Location
and Time, Bedford County.
ItemWave I J Wave II Wave III
I
--
CD<14 NCD FS <141-
NFS1
FS <142-Others
n 1/ 66 89 67 112 64 154
MAR 82.6 82.3 8206 78.3 7204 66.9
Energy 97.0 98.9 91.0 88.4 70.3 65.6
Prot. 142.4 132.6 140.3 118.8 118.8 100.0
Calc. 75.8 82.0 83.6 75.0 59.4 58.4
Phos, 121.2 129.2 128.4 119.6 103.1 94.8
Iron 98.5 100.0 88.1 91.1 81.3 71.4
Vit. A 86.4 82.0 88.1 84.8 73.4 6506
Thia, 104.5 109.0 116.4 99.1 93.8 81.2
Ribo. 113.6 112.4 119.4 104.5 98.4 81.8
Nia, 107,6 109.0 116.4 100.9 95.3 80.5
Vit. C 104.5 112.4 110.4 102.9 73.4 73,4
1/ The sample size in each cell (n) varies slightly from one table toanother in this report. The reason is that not all the respondentsprovided complete questionnaires, and observations v'ith missing datawere deleted for some tabulations and not for others.
participants (those receiving CD or purchasing FS within two weeks prior to
the interiew) are compared with nonparticipants, In Bedford County during
Wave I, it appears that energy (kilocalories) was not lacking, in that the
average energy adequacy ratio for recent CD recipients was 97 percent of RDA;
that for nonparticipants was 98.9 percent of RDA. Table 8 shows, however,
that one in four (24 percent) of the families had energy intake less than
two-third of RDA. This comparison highlights the fact that distributional
data reveals problems covered up by averages. The same is true to an even
greater degree in the case of Vitamin A. The average adequacy ratio for
Vitamin A was over 82 percent (Table 7), yet roughly half (45 and 56 percent
for CD and NCD respectively) of the sample had intakes below two-third of
the RDA. It is interesting to note in this connection that a higher
percentage of food program participants than nonparticipant had diets in-
adequate in Vitamin C. Again, this pattern was not found consistently among
all the nutrients. The oppo4ite was true, for example, in the case of
Vitamin A; 45 percent CD families versus 56 percent of NCD families had
intake less than two-third of RDA. Adequacy ratios for protein, phosphorus,
and the vitamins all are high on the average, yet in each case a substantial
number of families reported intake less than two-third of RDA.
How can we interpret findings such as this - that a fourth of the
families interviewed in Bedford County reported inadequate energy intake
(less than two-chird of RDA) and half the sample reported inadequate Vitamin
A? Can we conclude that this many poor people are "starving" in central
Pennsylvania? This kind of conclusion is clearly not warranted by these
data. As discussed earlier, a complex series of biometric tests and
chemical analyses would be required to determine if any one individual has
69
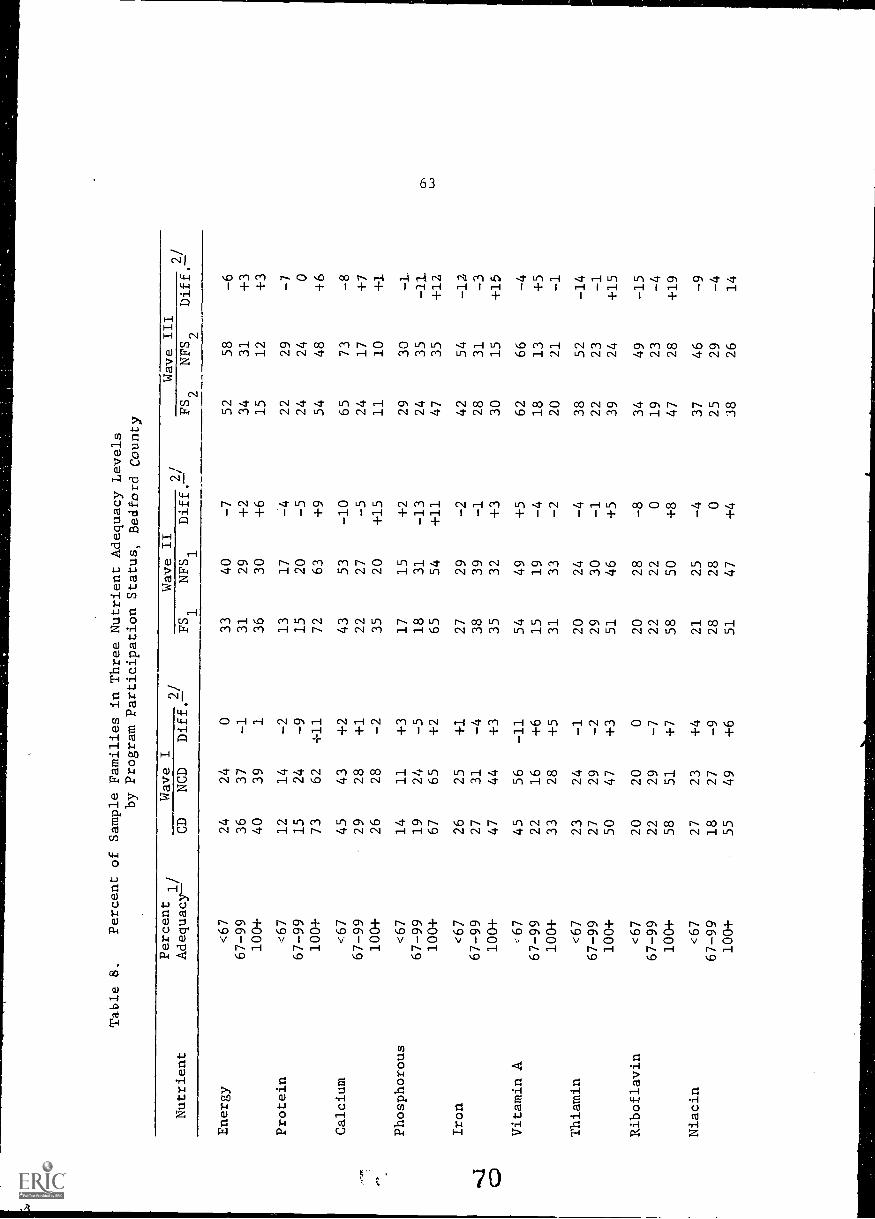
Table 8.
Percent of Sample Families in Three Nutrient Adequacy Levels
by Program Participation Status, Bedford
County
Nutrient
Percent
1/
Wave I
Wave II
Wave III
Adequacy
CD
NCD
Diff.2/
2/
FS1
NFS1
Diff.
FS2
NFS2
Diff,2/
Energy
Protein
Calcium
Phosphorous
Iron
Vitamin A
Thiamin
Riboflavin
Niacin
<67
24
24
033
40
-7
52
58
-6
67-99
36
37
-1
31
29
+2
34
31
+3
100+
40
39
136
30
+6
15
12
+3
<67
12
14
-2
13
17
-4
22
29
-7
67-99
15
24
-9
15
20
-5
24
24
0100+
73
62
+11
72
63
+9
54
48
46
<-67
45
43
+2
43
53
-10
65
73
-8
67-99
29
28
+1
22
27
-5
24
17
+7
100+
26
28
-2
35
20
+15
11
10
+1
<67
14
11
+3
17
15
+2
29
30
-L
67-99
19
24
-5
18
31
-13
24
35
-11
(:;
100+
67
65
+2
65
54
+11
47
35
+12
w
<67
26
25
+1
27
29
-2
42
54
-12
67-99
27
31
-4
38
39
-1
28
31
-3
100+
47
44
+3
35
32
+3
30
15
+15
=67
45
56
-11
54
49
+5
62
66
-4
67-99
22
16
+6
15
19
-4
18
13
+5
100+
33
28
+5
31
33
-2
20
21
-1
<67
23
24
-1
20
24
-4
38
52
-14
67-99
27
29
-2
29
30
-1
22
23
-1
100+
50
47
+3
51
46
+5
39
24
+15
<67
20
20
020
28
-8
34
49
-15
67-99
22
29
-7
22
22
019
23
-4
100+
58
51
+7
58
50
+8
47
28
+19
<67
27
23
+4
21
25
-4
37
46
-9
67-99
18
27
-9
28
28
025
29
-4
100+
55
49
+6
51
47
+4
38
26
14
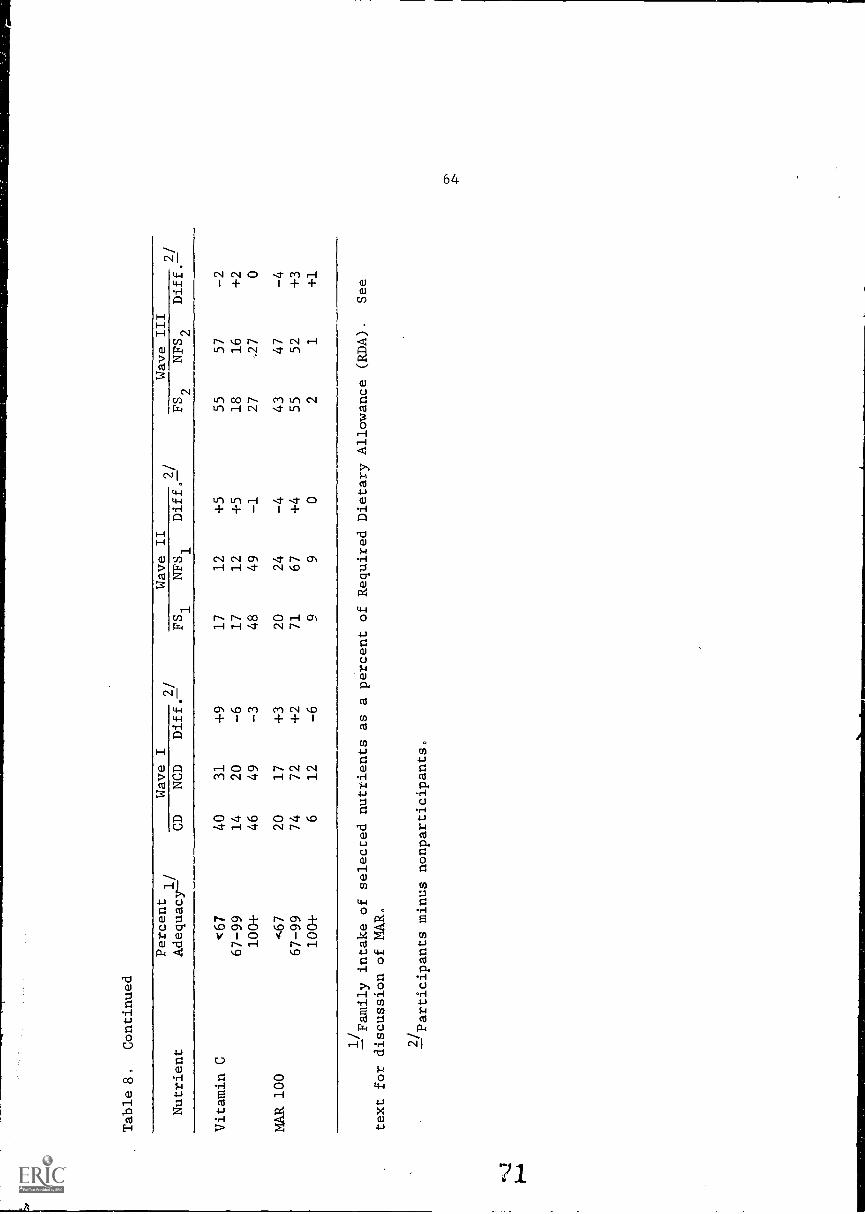
Table 8.
Continued
Percent
Wave I
Wave II
Wave III
Nutrient
11
Adequacy
CD
NCD
Diff.2/
FS1
NFS1
Diff.2/
FS2
NFS2
Diff.2/
Vitamin C
<67
40
31
+9
17
12
+5
55
57
-2
67-99
14
20
-6
17
12
+5
18
16
+2
100+
46
49
-3
48
49
-1
27
,27
0
MAR 100
<67
20
17
+3
20
24
-4
43
47
-4
67-99
74
72
+2
71
67
+4
55
52
+3
100+
612
-6
99
02
1+1
1/Family intake of selected nutrients as a percent of Required Dietary Allowance (RDA).
See
text for discussion of MAR.
2/Participants minus nonparticipants.
65
a serious nutritional deficiency. Dietary intake is known to fluctuate from
day to day, and many nutrients can be store d in the body, so that an
inadequate intake on any given day is not serious, unless it is part of a
consistent pattern of undernutrition. The 24-hour dietary recall is designed
for group comparisons, not individual diagnosis. When one group is compared
with another and is found to have a considerably lower 24-hour dietary
intake (lower adequacy ratio on the average, or a greater incidence of
reported intake below the dietary standard), this is evidence that families
in this group are more likely to have serious deficiencies. One trouble
with this kind of comparison, of course, is that other things (e.g., income,
time since pay, family size, etc.) are generally not equal between groups
being compared, Regression analysis (see the predicted Y values presented
later) has the advantage of permitting estimates in which other things are
held constant, so that the effects of certain factors such as program
participation can be measured. Comparison of group averages can pinpoint
problem areas, but cannot tell us why one group is better off than another;
regression analysis gives insight into the underlying reasons.
CD participants and nonparticipants in Bedford County (NCD) both
reported inadequate energy intake in one out of four families interviewed.
Three months later, during Wave II, a somewhat higher proportion reported
inadequate energy intake - one-third of FS1 participants versus 40 percent
of NFS1
sample families. During Wave III, one year after Wave I, an even
higher incidence of energy inadequacy was reported, but again the food
program participants had proportionately fewer families in the inadequate
range: 52 versus 58 percent,
72

66
The reason for this trend toward less adequate energy intake is not
known. This pattern was not found consistently among the various nutrients.
In most cases there was little or no change from one survey to the next, and
in some cases the trend was toward an improved dietary intake.
For example, the incidence of inadequate Vitamin C intake dropped
sharply (from 31 to 12 percent) among the program nonparticipants between
Wave I (early Summer,1969) and Wave II (Fall, 1969). Program participants
showed a similar improvement: 40 percent of CD families consumed less than
two-third of the RDA of Vitamin C, compared with 17 percent of FS1recipients.
The fact that there was a general improvement in adequacy of
Vitamin C (among both participants and nonparticipants) could. perhaps be
explained partly by the increased supply of fresh fruits and vegetables in
the fall, as gardens become mature and as the quality and prices of these
items in grocery stores become more favorable. Families receiving CD had an
average MAR of 82.6 - the same mean value as those receiving FS1 during
Wave II, Meanwhile the average MAR of nonparticipant families dropped
slightly, from 82.3 to 78.3. Thus, according to these averages and the
frequency distributions, it appears that participating families remained at
about the same overall dietary level from Wave I to Wave. II, and in the rela-
tive sense they become better off, as the diets of nonparticipants got
somewhat worse. Many factors are not held constant in these comparisons,
however, the questions are re-examined subsequently with multivariate analysis,
and similar results were obtained.
Between Wave I and Wave III (June 1969 to June 1970) the incidence
of inadequate Vitamin C intake increased substantially, both for program
participants and nonparticipants. More than half of the FS2 and. NFS2
67
families in Bedford County. reported Vitamin C intake less than two-third
of RDA in June 1970, Table 8. A similar deterioration was observed in
ali the other nutrients as well.
The trend in MAR is consistent with these changes. The average
MAR declined from 83 to 67 among program participants (first CD, then FS2);
a slightly bigger decline was observed among nonparticipants, Table 7. The
proportion of families with MAR values less than 67 also indicated a general
deterioration of the diets. For example, 20 percent of CD sample families
had MAR less than 67, compared with 43 percent of FS2 families. An even
greater increase was observed among nonparticipants: 17 and 47 percent.
Thus, using the nonparticipants as a comparison group, it appears that the
program participants had comparatively better diets, in the sense that their
dietary intake deteriorated less during the year June 1969 to June 1970.
The surveys conducted in Huntingdon County revealed that the most
serious nutrient inadequacy was in calcium. The average of the calcium
adequacy ratios was 63 percent of RDA for the 24 families who recently
received FS1, Table 9. The averages for Vitamin A and energy (kilocalories)
were 79 and 88, respectively, for this same group of families. All the
other nutrients were reported at levels at or above 100 percent of RDA on
the average. Nonparticipants had somewhat higher averages during these
surveys, and, consistent with this, a lower proportion of families reporting
inadequate intake of each nutrient, Table 10.
The average MAR values for participants and nonparticipants were
similar during wave 1, 71 and 73 for FS1 and NFS1, respectively, Table 9.
During wave II, the average MAR values were higher: 81 versus 87
7 4

68
Table 9 Average MAR and Nutrient Adequacy Ratios for Ten Nutrients, forFamilies Receiving Food Assistance Within the Past 14 Days VersusNonparticipants at the Same Location and Time, Huntingdon County,
ItemWave I
FS1<14 Others
Wave II
FS2<14 Others
n 24 138 34 94
MAR 70.,7 72.,5 80,5 86.8
Energy 87.5 92.8 88.2 106.4
Prot. 125.0 131,2 129.4 152.1
Cale. 62.5 82.6 76.5 96.8
Phos. 120.8 129 7 123 5 144.7
Iron 104,2 100.0 100 0 117.0
Vit. A 79.2 92.0 82.4 90.4
Thia. 100 0 114 5 105.9 116.0
Ribo. 100.0 11308 108.8 124.5
Nia, 116.7 118.1 114.7 130.9
Vit, C 116 7 131,2 94.1 110,6
75

69
Table 10. Percent of Sample Families in Three Nutrient Adequacy Levelsby Program Participation Status, Huntingdon County
NutrientPercentAdequecyl/
Wave IFS1 NFS1 Diff.-2/
Wave IIFS2 NFS2 Diff.Z/
Energy <67 37 25 +12 25 21 +467-99 26 40 -14 32 31 +1100+ 37 35 +2 43 48 -5
Protein <67 18 18 0 6 7 -1
67-99 18 18 0 21 16 +5100+ 63 54 -1 73 77 -4
Calcium <67 55 40 +15 48 33 +1567-99 23 29 -6 25 28 -3
100+ 22 30 -8 27 39 -12
Phosphorous <67 11 10 +1 6 9 -3
67-99 27 19 +8 19 9 +10100+ 62 71 -9 75 82 -7
Iron (67 27 25 +2 22 19 +367-99 28 28 0 32 26 +6100+ 45 47 -2 46 55 -9
Vitamin A <67 50 40 +10 56 45 +1167-99 15 27 -12 6 17 -11
100+ 35 33 +2 38 38 0
Thiamin <67 28 15 +13 24 13 +1167-99 20 31 -11 24 34 -10
100+ 52 54 -2 52 53 -1
Riboflavin <67 30 20 +10 22 15 +767-99 25 28 -3 30 18 +12100+ 45 52 -7 48 66 -18
Niacin <67 20 14 +6 14 13 +167-99 27 27 0 16 21 -5
100+ 53 59 -6 70 65 +5
Vitamin C <67 30 22 +8 38 31 +767-99 10 12 -2 13 18 -5100+ 60 66 -6 49 51 -2
MAR 100 <67 23 15 +8 19 13 +667-99 67 76 -9 68 73 -5
100+ 10 9 +1 13 13 0
1/Family intake of selected nutrients as a percent of Recommended
Dietary Allowance (RDA). See text for discussion of MAR.
2/Participants minus nonparticipants.
76
for FS2and NFS2, respectively.
Thus, based on the results of these tabulations it would appear that
the Food Stamp program did not enhance the diets of the Huntingdon County
low-income families, However, as mentioned earlier, several important
variables are riot held constant, so that inferences may not be made as to
program effectiveness on the basis of this information. Before turning to
the multivariate analysis for a more incisive view of program effects, let us
consider several important differences between program participants and non-
participant groups of the survey families. Differences in characteristics
such as family size, education and age of the homemaker, and family income
all seem relevant to an analysis of the effects of food programs on dietary
adequacy of the poor.
77

71
2. Other unaracteristics of the Families
When the data from the five surveys were sumuarized into tables,
it became clear that there was no strong and consistent pattern relating
program participation t) three other family characteristics: size of
family., age and education of the head of household. The fact that these
are apparently unrelated is an advantage, as far as the multivariate analysis
(discussed later) is concerned; multicollinearity could be a problem other-
wise.
3. Family Income and Frequency of Pay
The ratio of income to poverty threshold (INPO) was used in this
study as an index of income adequacy, Nearly 9 out of 10 of the families
interviewed in Bedford Wave I had incomes which for the month prior to the
interview were below the poverty line (INPO< 100). This same proportion was
found among both CD and NCD families. In subsequent surveys, a much lower
percentage of nonparticipants was below the poverty line--about 70 to 80
percent in Waves II and III.
The fact that 10 to 15 percent of program participants in the
sample reported incomes above the poverty line seems inconsistent with the
eligibility rules. However, one main reason that could account for this
apparent discrepancy is that the certifying social case worker may deduct
a number of expenses such as those associated with work, medical care, etc.,
in determining eligibility.
In Huntingdon County, the proportion of nonparticipants below the
poverty line dropped somewhat--from 65 to 56 percent--betweenWave I and
Wave II (August 1969 and November 1970). This could be the result of
more poor families signing up for FS2, plus an increase in income of others
who were formerly below the poverty line and not using Hi,
72
In examining the frequency of receiving income, it was found that
program participants are more likely to be paid biweekly than otherwise.
Likewise, nonparticipants are more likely to be paid monthly, weekly, or
more often than weekly. This is partly a reflection of the fact that the
welfare (DPA) checks are mailed out every two weeks, whereas social security
checks (received mainly by the elderly) come only once a month.
79

73
F. MULTIVARIATE ANALYSIS
1. The Analytical Model for Multivariate Analysis
Since the primary objective of this study is to measure and test
the effects of various independent variables--principally food aid program
status--on dietary adequacy, statistical tools were selected which could
utilize the available data most efficiently. Many important variables
are not held constant in the tabulations presented earlier. Consequently,
it is not possible to draw valid inferences about the effects of the program
per se based solely on these results. In an atLempt to adjust for the other
variables so as to dete-mine the effect of the program variable alone,
multiple regression analysis of the data was done. This kind of analysis
makes it possible to achieve some of the advantage of aggregating the data,
(compensating errors) and at the same time analyze the relationships between
dietary adequacy levels of individual households and their other character-
istics and conditions. This method analyzes several independent or explan-
atory variables at once, That is, under the assumptions of the method,
the effect of the program participation variable on the dependent variable
is measured while the effects of all other independent variables in the
equation are held constant. The model used for the regression equation
permits the examination of the effect of both quantitative and qualitative
factors on the dependent variable. Dummy variables were used to incorporate
qualitative and discrete variables such as food assistance program status,
and day of the week. Other variables that are naturally quantitative (such
as income or days since pay) were coded both as a continuous and as a
categorical variable, representing the latter with sets of dummy variables.
This procedure is illustrated in detail below, along with the various
equations and test statistics. The main conclusions drawn from the analysis
are presented below.
80
-74
In an attempt to explain the variation in the dependent variable,
adequacy of dietary intake, several independent variables were selected
for the regression equations, These variables are:
(1) number of persons in household (no.)
(2) education of the homemaker (years)
(3) age of the homemaker (years)
(4) her participation in the nutrition education program(coded as number of nutrition aide visits)
(5) ratio of current annual income to current poverty threshold.This variable is in real or price-adjusted terms, becausethe poverty thresholds are inflated each year by the amountof increase in the Consumer Price Index. (coded alternatelyas continuous variable and a categorical variable)
(6) whether or not any food was produced at home (1 = yes,0 = otherwise)
(7) day of week (1 = Saturday or Sunday, 0 = otherwise)
(8) days since pay (days since the month's largest pay; codedas a categorical variable split at 14 days.)
(9) food program participation status (CD, FS1, FS2
, or NFA--no food assistance)
(10) days since food assistance (CD or FS) was received. (codedas a continuous variable and as a categorical variablesplit at 14 days)
(11) amount of food assistance obtained per month (coded as dollarsof monthly bonus per person)
(12) bonus per person per day since receipt of food assistance(formed as the ratio of item 11 divided by item 10)
13/(13) food expenditure per person per month (dollars)---
(14) income frequency (coded as 1 if the family receives itspay once a month or less often, zero otherwise)
13/Based on a simple global question, how much did the family
spend on food last month. While the data obtained in this way were notintended to accurately reflect the actual expenditure level for an individualfamily, it may provide adequate accuracy for the purposes of group comparisonanalysis presented here. Multicollinearity does not seem to have been criticalbetween this variable and others, principally program status, as discussedlater.
81
75
It would have been impractical to include the race variable since
virtually all households in the sample--as in all of rural. Pennsylvania- -
are white.
The conventional ordinary least squares multiple regression model
(analysis of covariance), with continuous and discrete (dummy) variables,
was used as the basis of the multivariate analysis, The residuals from an
equation with MAR as dependent variable were analyzed with the Automatic
Interaction Detector (AID) program, to test the additivity assumption in-
herent in the regression model--that the errors are distributed independently
of the independent variables. The complex interaction terms implies by the
AID results were entered as dummy variables in a subsequent regression.
The F test for the contribution of these interaction terms was rmt signifi-
cant at the 5 percent level, This finding was taken to mean that the
original regression equations with simple 2-way interactions, as presented
in this report, are essentially. free of complex (3-way or higher order)
interactions. Consequently, the complex interaction dummies were deleted
in subsequent analysis.
Weighted regression was considered and discarded at an earlier
stage of this study, because a serious bias is introduced through the use of
weights. The bias stems from the fact that the weights vary with. program
participation status of the observation, so that the program effects are ob-
scured when weighted regression is used. Therefore, the conventional un-
weighted regression techniques were used in this study,
Eleven different dietary adequacy equations were computed, one
with MAR as dependent variable, and one with each of the. 10 individual
nutrient adequacy ratios as dependent variable. Results of these equations,
as discussed below, led to other hypotheses calling for additional regressions
using food expenditure and dietary efficiency as dependent variables.
82
76
2. Results of Multiple Regression Analysis
In interpreting the findings of the multiple regression analysis,
3 central questions are emphasized:
(1) How does program participation affect the overall dietary
adequacy of the families?
(2) How is the adequacy of each nutrient affected? In cases
where nutrient intake is increased, were the non-participating
families deficient in these nutrients? Or is the increase re-
dundant, adding to an already adequate quantity?
(3) How can the variations in dietary intake associated with the
programs be best explained? How is program status related to food
expenditure? Do program participants use their food dollar with
greater nutritional efficiency than other low-income families?
a. Cross-sectional analysis of dietary adequacy data:
A large number of individual equations were estimated in this
study. Those presented here seem to be the most relevant and reliable.
When alternative equations involving different equation forms and inter-
action terms were computed, the findings with regard to effects of the food
aid programs remained remarkably consistent. The equation featuring MAR
as the dependent variable, equation 1.01, has been computed with and with-
out the adjustment for bias due to percent of meals eaten away from home
as discussed earlier, and the findings were essentially the same. The ad-
justed MAR is used here, because it seems conceptually and statistically
more defensible than the original MAR. Equation 1.01 is discussed in de-
tail, as a procedural guide to interpretation of the other equations,
presented in Appendix B. Each of the equations 1.02 through 1.11 is like
1.01, except the dependent variable is an individual nutrient adequacy
ratio, rather than MAR.
77
Whenever a nutrient adequacy ratio--for example, energy or kilocalories--is
used as a dependent variable, the ratio is truncated at an upper value of 200
percent of RDA for that nutrient. That is, for each family that consumed
more than twice their adjusted RDA of energy (calories), that family's energy
adequacy ratio was set equal to 2. This method was adopted for the follow-
ing reasons:
1. It is generally recognized that energy intake above the RDA
does not contribute to "adequacy" of the diet; intake of
twice the RDA or more could even be detrimental in the long
run. The same is true of most other nutrients.
2. By truncating the ratios at a value of 2, the distribution of
the ratios was made more nearly normal, and the variance was
made much more uniform, thus reducing the likelihood of the
statistical problem of heteroscedasticity. This feature
also reduced the possibility of the results being greatly
distorted by the overconsumption of a few families on the day
covered by the interview.
In calculating the MAR, each of the 10 nutrient adequacy ratios
was truncated at 100 percent of RDA before the average was calculated.
This procedure was adopted to prevent over-consumption of one nutrient from
obscuring underconsumption of another, as discussed earlier. This trun-
cating procedure clearly introduces a form of heteroscedasticity, in that
the MAR for that subset of families having the most adequate diets will
have a lower variance than the families with less adequate diets. However,
this statistical objection was over-ruled in favor of the nutritional
considerations.
84

78
Equation 1.01 contains two types of explanatory variables, con-
tinuous and discrete, Table 11, The regression coefficient (b) of a
continuous variable, such as age of the homemaker, measures what effect an
increase of one unit of that explanatory variable has on the dependent
variable. Thus, the average net effect of one more year of age on the MAR
index was minus 0.09 percentage points--implying the family would have 3.6
percentage points (40 times 0.090) lower MAR if the homemaker was age 60
than if she was age 20, other things assumed to be equal. The regression
coefficient (b6
) is significant in this case, since its t value (2.23) is
greater than the tabulated value at the 5 percent level of probability.
It should be noted, however, that despite the fact that this effect is
significant in the statistical sense, it is still too small in magnitude to
have any practical significance. A small difference in consumption of a
nutritious food could have a much greater impact, as discussed earlier.
The regression coefficient of a dummy variable representing a
qualitative or discrete variable, such as having home produced food,
measures the net effect of a particular category as opposed to the category
which was omitted or assigned the "0" value in that set of dummy variables.
The positive effect on the MAR index of having home-produced food was 2.20
points (see b4),) significant at the 5 percent level.
Entire sets of variables were also tested for the significance of
the extent to which they explain variation within the dependent variable,
using Snedecor's F statistic. This is a test of the null hypothesis that
the estimates of these parameters are all zero (6, pp. 10-11). For ex-
ample, income turned out to be a significant variable (F = 3.4 for
variables X40 and.X41; p.4(.05); families with income below the poverty

Table 11.
EQUATION 1.01 MAR AS DEPENDENT VARIABLE
(n = 1001)
Variable
i
Variable
Number
n1 .
,
Cell
Count
bi
Regression
Coefficient
sb4
Standard
Error
Relevant
Student
t Values
F Ratio
Education of Homemaker (years):
Age of Homemaker (years):
Home Produced Food
(1=yes):
3 6 4
n n523
-0,035
-0.090
2.431
0.052
0.040
1.106
0.56
2.23*
2.20*
(Omitted: No HPF)
478
Size of Household:
3.16*
Size 3 - 4
23
261
1.819
1,649
Size 5 - 6
24
231
5.176
1.885
Size 7 +
25
202
4.617
1.915
(Gnitted:
size < 3)
307
1Nutr. Aide Visits:I
N.A.V. 3 - 5
37
37
7.397
6.863
N.A.V. 6 - 12
38
57
4.445
7.028
N.A.V. 13 - 60
39
29
5.651
7.818
(Omitted:
N.A.V. < 3)
878
Interactions:
N.A.V. < 3; HFS < 15 days
33
32
19.085
12.192
N.A.V. 3+; HFS < 15 days
34
24
10.185
14.185
N.A.V. < 3; no F.S. or > 15 days
35
135
-0.489
7.801
N.A.V. 3+; no F.S. or > 15 days
36
92
-6.600
10.340
(Omitted:
HFS 15 + days)
718
Unit Vector (constant)
21
n70597
4565
Weekdays
22
932
-2.661
2.117
1,26
(Omitted:
Sat. and Sun.)
69
1/These variables include observations
in Huntingdon County only, since the Nutrition Education Program
did not exist in Bedford County.
*pl* 0.05
**p < 0, 01

Table 11.
(continued)
Variable
Variable
Number
n. 1
Cell
Count
b, 1
Regression
Coefficient
sb.
Standard
Error
Relevant
Student
t Values
F Ratio
Days Since Payday:
1,89
DSBP 15 + days
14
198
4.151
3-150
DSBP Not rep-
15
89
-3.218
3.213
(Omitted:
DSBP < 15 days)
714
Interactions:
0.94
DSBP < 15; CD < 15 days
839
1,713
10.378
DSBP 15 +; CD < 15 days
924
-5.303
10.802
DSBP < 15; FS < 15 days
10
151
-3.695
8.811
DSBP 15; FS < 15 days
11
33
-3.089
9.372
DSBP < 15; No F.A.
12
400
-2,223
2.958
DSBP 15+; No F.A.
13
102
-7.101
3.861
(Omitted:
All DSFA 15+)
252
Food Program Status:
9.91**
Huntingdon County:
DSFS1 < 15 days
16
24
-15 265
14.463
No FS1 or 15+ days
17
138
4.687
7.967
DSFS2 < 15 days
19
34
-3.074
14.479
No FS2 or 15+ days
20
94
19.248
7.636
Bedford County:
No CD
26
89
15.873
2,269
No FS
27
112
11.492
2,094
1DSCD < 15 days
28
66
12.598
9,818
DSCD 15+ days
29
97
10.993
2,936
DSFS1 < 15 days
30
67
15.411
8.641
DSFS1 15+ days
31
36
7.158
3,714
DSFS2 < 15 days
32
64
5.369
8.776
(Omitted No FS2 Bedford)
157
Income/Poverty Threshold:
3,41*
In/Po 1-1.25
40
90
1.224
1.903
0.64
In/Po 1,26+
41
147
4.549
1.747
2 -60 **
(Omitted In/Po < 1.0)
764
Monthly Food Exp./person ($)
59
n0.103
0.038
2,69**
Income Frequency (1 = once or less
per mo.)
61
253
-3,53$
1,478
2,39**
R= 0-194
A.O.V. of regression:
F = 6.101*
*p<0,05
*pp<0 DY
81
line (INPO 1.0) have at least--/ 4.5 points lower MAR, compared with families14
having incomes slightly Above 125 percent of the poverty level (t41= 2.6; p <.01).
Size of household was also found to he significant (F = 3.16; p <.05).
Families of 5 or 6 persons have the best diets, other things being equal. This
seems to be related to economies of family size. When monthly food expendi-
ture per person is regressed on family size (et al) in equation 3.1, it was
found that larger families spend less per person, assuming a given level of
overall dietary adequacy. (This relationship is discussed in greater detail
later.) Number of nutrition aide visits does not appear to be significantly
related to the overall adequacy of dietary intake (MAR). The families
seem to eat somewhat better on the weekends (b22
= 2.7 points of MAR) but
this was not significant at the .20 level of probability.
Food expenditure is generally expected to be a very important de-
terminant of dietary adequacy. As monthly food expenditure per person in-
creases by a dollar, MAR increases by 0.1 points (see b59
). This is signi-
ficant at the .01 level of probability. What is the interpretation of this
food expenditure variable, in the context of equation 1.01, which features
program participation variables? Is it not possible that food expenditure
and program status are so highly correlated as to lead to distorted estimates
of program effects? Apparently this is not the case, as evidenced by two
kinds of information. First, a similar equation computed with all the same
variables except with food expenditure omitted gives almost identically the
14/Actually the higher income families are estimated to have a
slightly (0.35 points of MAR) larger advantage than indicated in the co-efficient b41, for the following reason. Their food expenditure is esti-mated at $3.4 higher per person per month (equation 3.1) And the effect ofthis through b59 in equation 1.01 is slight increase in MAR--3.54 times0.10 equals 0.35 points higher MAR due to this effect.

82
same findings with regard to program effects. Second, when this food ex-
penditure variable is regressed with program variables (et al) as in depen-
dent variables, it appears that the effect of the food program status of
the family on monthly food expenditure per person is usually not significant,
as discussed later. Therefore, .it would appear that the food expenditure
coefficient can be interpreted as indicating how much the MAR will rise
with an increase in food expenditure, other things (including program par-
ticipation) assumed to be equal.
Income frequency (X61) was also found to be significantly related
to dietary adequacy. Families who receive their income more often than once
a month have 3.5 points higher MAR than families paid less frequently,
other things being equal. The DPA (welfare) checks are mailed out every
two weeks, but social security, retirement, some wages, and several other
sources of income are typically paid only once a month. It is possible
that the families who are paid more often than once a month are somehow
"different" from the other low-income families, and that these other dif-
ferences are the cause of their better diets. It is also possible that the
obvious interpretation of the income frequency coefficient is correct- -
that frequent receipt of income, in and of itself, leads to improved
dietary adequacy. Further research, including observed changes in income
frequency, would be required to establish the causal relation with a
greater degree of certainty.
The effects of the variables discussed above are easy to infer
directly from the individual coefficients in equation 1.01. This direct
approach is not permitted in the case of variables included in interaction
terms, such as food program status and length of time since pay. Testing
the effects of these variables must be done jointly, using comparisons of
89
Apredicted values (Y) representing various combinations of attributes.
Alternatively (and equivalently) t tests of linear combinations of coeffi-
cients can be used to test the same relationships. Both methods are used
here.
Table 12 contains the Y values for a simulated family with certain
assumed characteristics, under n variety of different program/days since pay
situations. The hypothetical household is a size 4 family, (X23 = 1) with
home produced food (X4 = 1). The homemaker is assumed to be age 40 (X6 = 40)
and to have a 10th grade education (X3 = 10), and she is assumed not to
participate in the nutrition aide program. Food expenditure per person per
month is assumed as $25.00 (b59 = 25); if $15 had been assumed, for example,
the MAR values would be reduced by 1 point (i.e. $10 times b59). The family
is assumed to receive its income more often than once a month, and the in-
come is arbitrarily set at a relatively low level, less than 100 percent of
the poverty line; a family assumed to have income at 125 percent of the
poverty line would have 4.5 points higher MAR, other things assumed equal.
A weekday (X22 1) is assumed; on weekends the family would have 2.7
points higher MAR.
AThe top row of Table indicates the predicted values (Y) of MAR
for the hypothetical family under the various programs assuming more than
A14 days since pay. Subsequent rows show the analogous Y values from the 10
individual nutrient equations, 1.02 through 1.11. Table 13 is a similar
table, but assuming less than 2 weeks since pay. Tables 14 and 15 are the
counterparts of Tables 12 and 13, respectively, in that they contain the
linear combinations and t statistics for testing the difference between
families recently receiving food assistance (FS or CD within 2 weeks) ver-
sus nonparticipants and those who received food assistance more than 2 weeks
prior to their interview.
90mmomaawsm
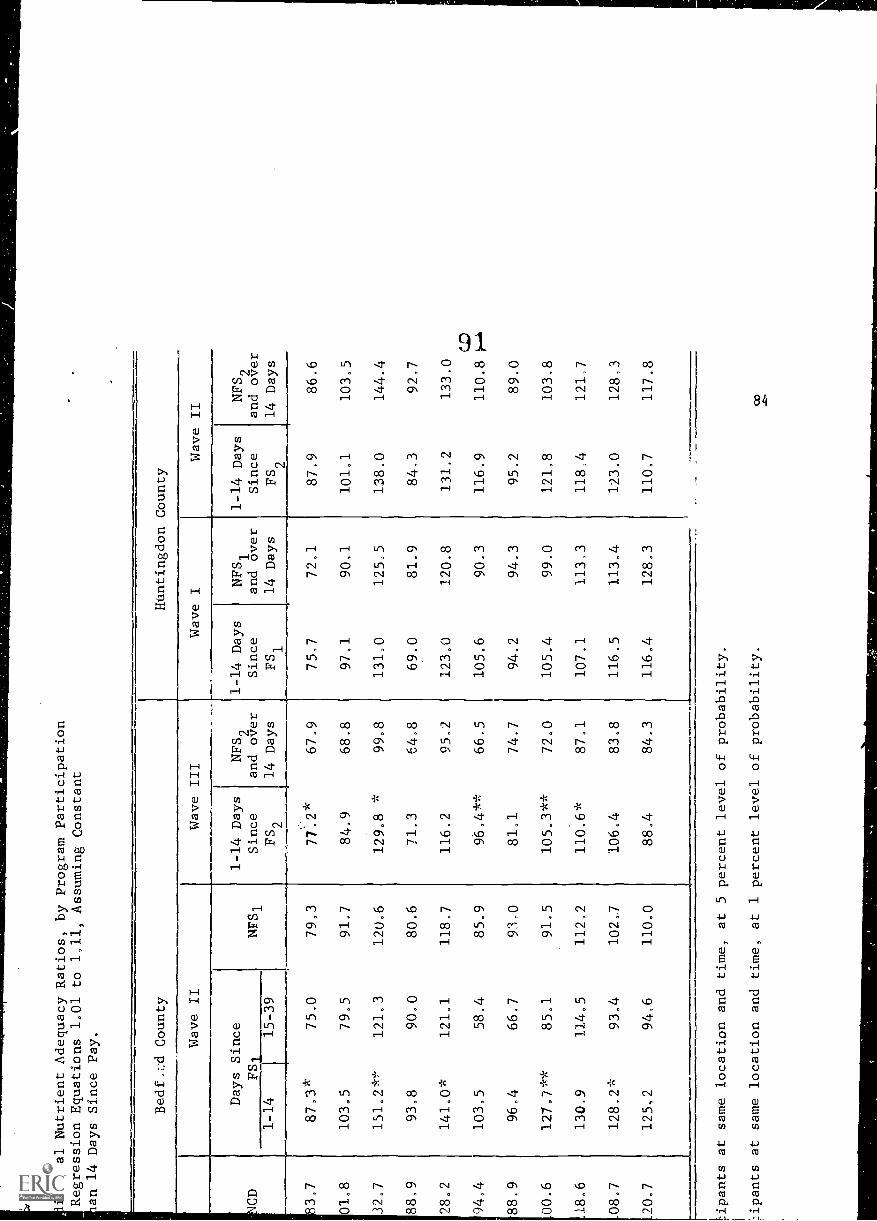
ividual Nutrient Adequacy Ratios, by Program Participation
Regression Equations 1.01 to 1,11, Assuming Constant
an 14 Days Since Pay.
Bedf..;:d County
Huntingdon County
Wave II
Wave III
CD
Days Since
FSi
1-14
15-39
NFS1
1-14 Days
Since
FS2
83.7
87,3*
75.0
79.3
01.8
103.5
79.5
91.7
32.7
151.2*'-'
121.3
120.6
88.9
93.8
90..0
80.6
28,2
141.0*
121.1
118.7
94,4
103.5
58.4
85.9
88.9
96.4
66.7
93,0
00.6
127.7**
85,1
91.5
18.6
130,9
11405
112,2
08.7
128.2*
93.4
102.7
_20.7
125,2
94,6
110.0
77.2*
84.9
129.8 *
71.3
116,2
96,4**
81.1
105.3**
110.6*
106.4
88.4
Wave I
Wave II
NFS2
1-14 Days
NFS1
1-14 Days
NFS2
and over
Since
and over
Since
and over
14 Days
FS1
14 Days
FS2
14 Days
67.9
68.8
99,8
64.8
95.2
66.5
74.7
72.0
87.1
83.8
84.3
75.7
72.1
97.1
90,1
131,0
125,5
69.0
81.9
123.0
120.8
105.6
90.3
94.2
94.3
105.4
99.0
107.1
113,3
116.5
113.4
116.4
128.3
'ipants at same location and time, at 5 percent level of probability.
:Apants at same location and time, at 1 percent level of probability.
87.9
101.1
138.0
84,3
131.2
116.9
95.2
121,8
118,4
123.0
110,7
86.6
103.5
144.4
92,7
133.0
CD
110.8
89.0
103.8
121-7
128,3
117.8
CO

Table 12.
Estimated Values of MAR and Individual Nutrient Adequacy Ratios, by Program Participation
Status and by County, Based on Regression Equations 1.01 to 1,11, Assuming Constant
Family Characteristics-More Than 14 Days Since Pay.
Dietary
Adequacy
Ratio
MAR
Energy
Protein
Calcium
C0
Phosphorous
Iron
Vitamin A
Thiamin
Riboflavin
Niacin
Vitamin C
Bedford County
Wave I
Wave II
Days Since
CD
NCD
Days Since
FS1
1-14
1-14
15-39
82.3
78.8
83,7
87,3*
75.0
98.6
95,1
101,8
103,5
79,5
150.4
129,1
132,7
151.2*''
121,3
65.8*
89.0
88,9
93,8
90.0
120.0
127.0
128.2
141.0*
121.1
96.8
80.4
94.4
103,5
58.4
81.8
78.6
88.9
96.4
66.7
106.2
93.1
100.6
127.7**
85.1
111.5
116,8
118.6
130,9
114.5
123.0
99.8
108.7
128.2*
93,4
115.5
104 4
120.7
125,2
94,6
Huntingdon County
NFS1
79,3
91.7
120,6
80.6
118,7
85.9
9.-i-0
91.5
112,2
102-7
110,0
Wave III
1-14 Days
NFS2
Since
and over
FS2
14 Days
77,2*
67,9
84.9
68.8
129,8 *
99.8
71.3
64.8
116,2
93,2
96,4**
66.5
81.1
74.7
105,3**
72.0
110.6*
87,1
106.4
83.8
88.4
84.3
Wave I
1-14 Days
Since
FS1
NFS1
and over
14 Days
1-14 D
Sinc
FS
75.7
72.1
87
97.1
90.1
101
131,0
125:5
138
69.0
81.9
c,.
-,
123.0
120.8
131.
105.6
90.3
116
94.2
94.3
95
105.4
99,0
121
107.1
113.3
...18
116.5
113.4
123
116.4
128.3
J.10
* Significantly different from nonparticipants at same location and time,
at 5 percent le.- -1 of probability.
** Significantly different from nonparticipants at same location and time, at 1
percent level of probability.

R and Individual Nutrient Adequacy Ratios, by Program
nd by County, Based on Regression Equations 1.01 to 1,11,
ly Characteristics--Less Than 15 Days Since Pay.
Bedford County
Huntingdon County
Wave II
Wave III
Wave I
Wave II
1-14 Days
NFS2
1-14 Days
NFS1
1-14 Days
NFS2
NFS
1Since
and over
Since
and over
Since
and over
FS2
14 Eiys
FS1
14 Days
I
FS2
14 Days
684.5
102.9
9138.5
787.6
2134.4
98.2
086,3
1113.6
0117.9
7109.6
4120.7
82,5
75.1
80.1
90.7
80.8
92.9
140,1
127.1
126,5
84.7
88.8
79.4
130.6
127.3
125.0
84.7
62.2
89.6
91.5
64.3
90,6
114.0
98.1
104.4
118,8
113.9
111.5
115.8
94.2
103.6
117.0
94.8
110.2
..FS2, at0.05
level of probability.
72.5
68,6
72.1
70,0
118.7
105.6
62.2
63,7
105,8
101,5
77.6
70.3
76,2
72:2
91.6
84.9
98.5
86.5
94J
84.6
80.2
84,4
70.9
84,3
119.9
59.8
112,6
86.9
89.3
91.7
95,0
104,1
108.2
72.8
83,1
87.3
91,3
88.3
104,8
131,3
126.9*
156.2
80.7
75.1
91.5
127.0
120.9
139.2
94.0
98.2
114,6
CC.4.)0
91.9
90.3
86.5
111,9
108.1
116:7
112:7
106.3
121:0
114.2
110.7
1292
128,4
102 5
117.9
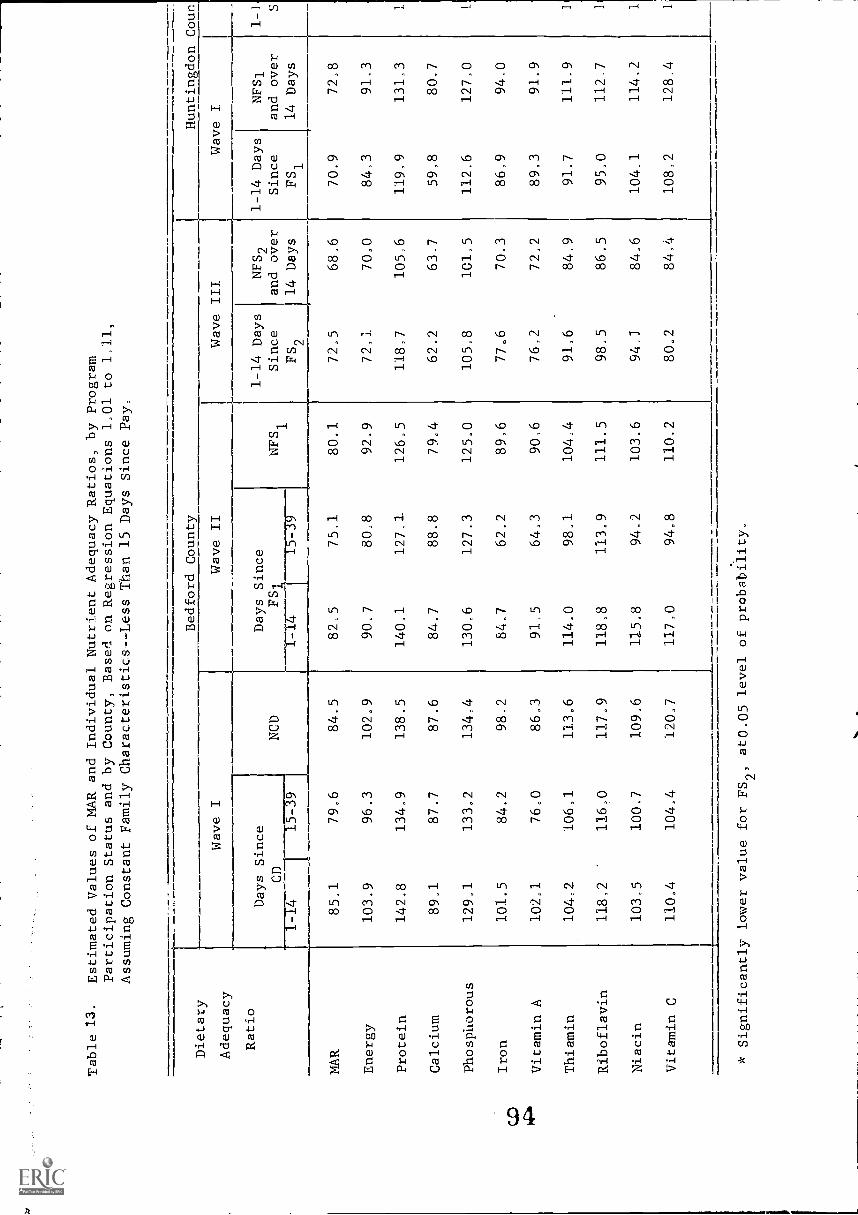
Table 13.
Estimated Values of MAR and Individual Nutrient Adequacy Ratios, by Program
Participation Status and by County, Based on Regression Equations 1.01 to 1.11,
Assuming Constant Family Characteristics--Less Than 15 Days Since Pay.
Dietary
Adequacy
Ratio
Bedford County
Wave I
Days Since
CD
4
NCD
Wave II
Wave III
Days Since
FS,
NFS1
Huntingdon Coun
Wave I
1-14 Days
NFS2
1-14 Days
NFS1
Since
and over
Since
and over
FS2
14 Days
FS1
14 Days
MAR
85:1
79.6
84.5
82:5
75,1
80.1
72,5
68.6
70.9
72,8
Energy
103.9
96,3
102.9
90.7
80.8
92.9
72,1
70.0
84,3
91,3
Protein
142.8
134.9
138.5
140.1
127,1
126,5
118.7
105,6
119,9
131,3
Calcium
89.1
87.7
87.6
84,7
88.8
79,4
62.2
63-7
59.8
80.7
Phosphorous
129.1
133.2
134 4
130 6
127 3
125.0
105,8
101.5
112,6
127,0
Iron
101.5
84.2
98,2
84.7
62.2
89.6
7706
70.3
86,9
94,0
Vitamin A
102,1
7600
86.3
91,5
64.3
90,6
76.2
72,2
89.3
91.9
Thiamin
104,2
106,1
113.6
114.0
98.1
104:4
91.6
84,9
91.7
111_9
Riboflavin
118,2
116,0
117.9
118,8
113.9
111.5
98.5
86,5
95,0
112.7
Niacin
103,5
100,7
109.6
115.8
94.2
103.6
94,1
84.6
104.1
114.2
Vitamin C
110.4
104.4
120.7
117.0
9408
110.2
8002
84.4
108.2
128.4
* Significantly lower value for FS2, at0.05 level of probability,

CZ
Table 14.
Estimated Effects of Food Programs on MAR and Ten Individual Nutrient Adequacy
Ratios
Based on Equations 1.01 to 1.11 by Type of Program and County)
For
Families Receiving Food Assistance Recently (1-14 days)--Assuming More than
14 Days Since
Dietary
Adequacy
Ratio
......
.,
Pay.
non participants
Estimated
amount by
at the samewhich program participants exceeded
location and time (percentage points)
Huntingdon County
FS1
FS2
FS
2
**
MAR
-1.5
(0.36)
7.9
(2.06)
9.4
(2,26)
3.6
(0.66)
1.3
(0.24)
NUTRIENTS:
ENERGY
-3,1
(0.32)
11.9
(1.30)
16.1
(1.63)
7.0
(0.53)
-2.5
(0.19)
* *
*PROTEIN
17.8
(1.51)
30.6
(2.76)
30.0
(2.51)
5.5
(0.35)
-6.3
(0.42)
*CALCIUM
-23.2
(2.20)
13.2
(1.33)
6.5
(0.61)
-12.9
(0.90)
-P.4
(0.61)
PHOSPHOROUS
-8.2
(0.70)
22.3
(2.01)*
20.9
(1.75)
2.2
(0.14)
-1.8
(0.12)
**
IRON
2.4
(0.23)
17.6
(1.78)
29.8
(2.80)
15.3
(1.08)
6.1
(0.45)
VITAMIN A
-7.1
(0.51)
3.3
(0.25)
6.4
(0.45)
-0.2
(0.01)
6.2
(0.35)
* *
**
THIAMIN
5.7
(0.48)
36.3
(3.25)
33.3
(2.77)
6.5
(0.40)
18.0
(1.18)
RIBOFLAVIN
-7.1
(0.62)
18.7
(1.74)
23.4
(2.02)*
-6.3
(0.40)
-3.3
(0.22)
NIACIN
14.3
(1.17)
25.4
(2.21)*
22.6
(1.82)
3.1
(0.19)
-5.3
(0.34)
VITAMIN C
-5.2
(0.32)
15.2
(1.00)
4.1
(0.25)
-11.8
(0.54)
-7.1
(0.34)
() Numbers in parenthesis are t values.
* Significant at the 5 percent level.
** Significant at the 1 percent level.

Table 15.
Estimated Effects of Food Programs on MAR and
Ten Individual Nutrient Adequacy
Ratios, (Based on equations 1,01 to 1.11) by Type of
Program and County, For
Families Receiving Food Assistance Recently (1-14days) Assuming Less Than 15
Days Since
Pay.
I
Estimated
nonparticipants
___
CD
1
Dietary
Adequacy
Ratio
amount by
at the same
Bedford
FS1
which program
location
County
participants
and time
FS2
exceeded
(percentage points)
Huntingdon County
FS1
FS2
MAR
0.7
(0.20)
2.4
(0.89)
3.9
(1.52)
-1.9
(0,39)
-4.2
(1.03)
NUTRIENTS:
ENERGY
1.0
(0.12)
-2.1
(0.33)
2.1
(0.35)
-7.0
(0.62)
16.5
(1.69)
PROTEIN
4.3
(0.46)
13.7
(1.73)
13.1
(1.77)
-11.4
(0.83)
-23_3
(1.97)
CALCIUM
1.3
(0.16)
-5.3
(0.74)
-1.5
(0.22)
-20,9
(1.69)
-16,3
(1.54)
PHOSPHOROUS
-5.3
(0.56)
5.7
(0.72)
4.4
(0.59)
-14.4
(1,05)
-18.3
(1.56)
IRON
3,3
(0.39)
-4.9
(0.70)
7..3
(1.12)
-7.2
(0,59)
-16,4
(1-56)
VITAMIN A
15.7
(1
41)
0.9
(0.09)
4.0
(0.46)
-2.6
(0,16)
3,7
(0.27)
THIAMIN
-9.4
(0.99)
9...6
(1.21)
6,7
(0,90)
-20.2
(1,46)
-8,6
(0.73)
RIBOFLAVIN
0.2
(0.02)
1.2
(0.94)
12.0
(1.69)
-17.7
(1.33)
-14,7
(1.29)
NIACIN
6,0
(0.62)
12.2
(1.49)
9.5
(1,23)
-10.1
(0.71)
-18 -5
(1.51)
VITAMIN C
-10,4
(0.80)
6.9
(0.63)
4.2
(0,41)
-20,1
(1,07)
15.4
(0,95)
() Numbers in parenthesis
are t values,
* Significant at the 5 percent level.
** Significant at the 1 percent level.
88
A
The Y values shown in Tables 12 and 13 are roughly the same magni-
tude as the Y (mean) values shown earlier in Table 7. The main advantageA
of the Y values is that other things are held constant (under the assump-
tions of the regression model) whereas this cannot be assumed in dealing
with averages of observed data. For example, a hypothetical Bedford County
family receiving FS1 within 2 weeks of the interview would have an MAR of 87,
Table 12. A similar family not using FS1 at the same location and time
(Fall 1969) would have an MAR of 79. The difference, 8 points, is signifi-
cant at the .05 level, as shown in Table 14. This latter quantity was com-
puted using a linear combination (LC) of the relevant variables (LC = bll
b30 - b13 - b27 = 7.94; t = 2.06.) The differences between the various
values were used as a check on the accuracy of the LC values, and vice
versa. The same comparison using 7 values, Table 7, shows difference of
only about 4 points in MAR.
Comparison of Tables 12 and 13 clearly reveals that the dietary
benefit of the CD and FS programs is definitely stronger late in the pay
month--when more than 2 weeks has elapsed since receipt of income. In fact,
no significant improvements in nutrient ratios or MAR are predicted for
families that received their income within 2 weeks prior to their interviews.
How important are the dietary benefits of CD and FS for families
who have not received income within the past 2 weeks? Several conclusions
are apparent from Table 12. First, it is clear that some nutrients, notably
protein, Vitamin C, phosphorus, and the three B vitamins (Thiamin, Ribo-
flavin, and Niacin) are predicted to be consumed at levels consistently well
above the deficiency line (2/3 of RDA) for program nonparticipants as well
as those who do participate in the food programs. Any contribution of the
programs toward higher levels of these nutrients would be of relatively
little value, as compared with enhancement in nutrients consumed,

89
at deficient levels. For example, in Bedford Wave II the hypothetical FS1
family more than 14 days since pay is estimated to have signieicantly
higher protein adequacy ratio than nonparticipants - -151 versus 121, Table
12. This 30.6 point differential is statistically significant at the .01
level Table 14. However, one might raise doubts as to the nutritional
significance of increasing protein further beyond an already adequate level.
Similar improvements within the adequate range were predicted in other
cases--phosphorus, thiamin, and niacin.
For an actual individual family, this would not be nutritionally
desirable, particularly in some nutrients where an excess can be detri-
mental. In the present analytical context, the implications are lessdetriraental
Recognizing that the findings relate to comparisons among groups of families,
it is apparent that the higher the predicted value of a nutrient ratio for
the "hypothetical family" representing that group, the less likely are
members of that group to have diets deficient in that nutrient. Therefore,
we should not completely discount the program benefits in the ranee way
beyond the deficiency level. At the same time, it seems realistic to
place greater emphasis upon improvements that bring families from the
deficient range into a more adequate level,
For example, in Bedford Wave III, it was predicted that the hypo-
thetical FS2 family would have iron intake 96.4 percent of RDA, compared
with 66.5 percent for a similar family not using food stamps ( cr raving not
bought FS2
for more than 14 days.)?
21Nearly all of the sample respondents purchased FS) every two
weeks. Consequently it was not statistically feasible to hav a separatecategory for those families receiving FS2 more than 2 weeks prior to theinterview, because of inadequate cell count. Analysis of CD and FS datafrom Bedford Countysupported ourapriori suggestion, that these observationsshould be grouped with nonparticipants and families getting FS
2more re-
cently than 2 weeks should be treated separately The same procedure wasfollowed in coding the Huntingdon data.
90
A similar improvement in energy adequacy ratio (86 versus 69) was statistically
significant at about the 10 percent level. The improvements in adequacy
ratios for calcium (from 65 to 71) and Vitamin A (75 to 81) were not sta-
tistically significant; there is at least a 40 percent chance that differ-
ences this large could occur by random chance.
In the case of both FS1and FS
2in Bedford County, the predicted
MAR was significantly higher (at the .05 level) for participants than for
nonparticipants. But CD recipients had a slightly lower predicted MAR than
did NCD families (82 vs. 84; t = 0.36). The only statistically significant
difference in individual nutrient ratios was calcium; CD families were pre-
dicted to have less adequate calcium intake than NCD families (66 vs. 89).
No significant differences in nutrient ratios were predicted be-
tween participants and nonparticipants in Huntingdon County, either with
FS1 or FS2. In the case of some nutrients (iron, Vitamin A, and riboflavin,
for example) participants exceeded nonparticipants slightly in both FS1 and
FS2. In other nutrients the opposite was true. The MAR was slightly
higher for participants in either program than for their respective com-
parison groups of nonparticipants. However, these differences are all so
small in relation to their variance that they cannot be considered signifi-
cant, and must be considered a chance occurrence. This lack of significance
probably stems from the relatively small number of FS users in the Huntingdon
County sample: 38 during Wave I, and 62 in Wave II. If a larger subsample
were available, the results may have been quite different, and more
statistically significant.
The nutritional adequacy of program participants declines sharply
with increasing time since receipt of food aid. For example, the adequacy
ratios for thiamin, riboflavin, and Vitamin C. were all predicted at levels
99

91
above 125 percent of RDA for Bedford FS1 recipients during their first 14
days since getting the food stamps. In each of these cases the predicted
ratios were below 95 percent of RDA when more that 2 weeks had elapsed
since purchasing the food stamps. Similar differences were noted in other
nutrients (e.g. iron and Vitamin A.) The predicted MAR drops sharply after
14 days since food stamps were purchased--from 87 to 75 (p <.05). A smaller
decline--from 82 to 79--is predicted in the case of CD.
100

92
b. Changes in Dietary Adequacx_As Families Changed Program Participation Status
Equations 1.01 through 1.11 tested the hypothesis that families on
food assistance programs are. nutritionally better off than nonparticipants by
analyzing their MAR at various points in time. A somewhat different approach
is used here.
Tracing the same families through time with the various surveys, it
is possible to detect the impact of joining versus not joining a food program.
For example, of the families who were on CD in 1969, did those who subsequently
used food stamps have significantly better diets than those who dropped out?
How did the dietary adequacy of these "dropout" families compare with that
of the totally nonparticipating families--those who used neither CD nor FS?
These questions are quite important, in view of the fact that the
majority of CD users drop out--fail to use FS. Thus, in assessing the change
in overall dietary adequacy of the poor as a result of a change in program,
it is not sufficient to look only at those who remained in the program. Those
who drop out should be considered as well. And if their diets became consider-
ably worse, one should question whether the county's decision to adopt the
food stamp program yielded a net improvement in dietary well-being of the poor,
at least in the short run. The effects of the recent revision in the cost of
food stamps should also be, considered; a large increase in participation
occurred, and presumably some of the short run effects were overcome.
Two general types of independent variables were introduced into the
equations as predictors of the change in MAR: (a) variables such as income
and program status, which are likely to change in a way that could signifi-
cantly affect the MAR, and (b) variables which are relatively stable but
which may influence the family's ability to improve its diet, such as educa-
tion of the homemaker, were introduced into the model as explanatory variables.
101

93
Equation 1,12 is based on the 241 families interviewed both in
Wave I and Wave II in Bedford County--just before and just after the county
switched from CD to FS, Table 16. Four dummy variables were introduced to
represent all possible changes in program status:
1. CD to FS1 (96 families participated in both CD and FS1.)
2. CD to NFS1 (67 families "dropped out.")
3. NCD to FS1 (21 families "joined" FS1 who were not in CD.)
4. NCD to NFS1
(57 families participated in neither programs.)
The latter group of 57 families remained nonparticipants. This
was the comparison group, and the dummy variable representing this group
was omitted from the regression equation.
Any change in MAR associated with seasonality or other exogenous
factors would be reflected in the trend in MAR of the comparison group. In
this way, the regression coefficients for the other program categories can
be interpreted directly, as follows. The coefficient for CD to FS1 (b81 =
-2.165) indicates that the MAR of those CD families that joined FS1 decreased
_slightly,.as compared with the trend in the comparison group. However, this
"relative change" in MAR was not significant (t = .70).
The CD families that dropped out (CD to NFS1) nca significantly
worse diets: -8.0 relative change in MAR. Thus it appears that CD families
were better off to have joined the FS1 program than to have dropped out. A
few (21) non-CD families joined FS1; their diets were not significantly im-
proved relative to other NCD families who did not begin using food stamps.
Perhaps this result reflects indirectly some factors related to the depen-
dency of CD families on food assistance.
Another relevant feature of equation 1.12 should be mentioned.
Families with a high MAR level in Wave I (September 1969) were much less
102

94
Table 16. Equation 1,12, Change an MAR (Dependent Variable) from CD (June 1969)to FS]. (September 1969), Bedford County? Pa, (n=241).
Variable CellCount
RegressionCoefficient
StandardError
Studentt ValuesName Number
Home Produced Food 9 122. 1.930 2.448 .79
(Omitted No HPF)MAR (Sept, 1969) 15 n -74.120 6.486 J1.43**Change in Size of HH 17 n -1.360 2,113 .64
Change from Weekend toWeekday Meals 33 26 0.974 3.702 .26
(Omitted Weekday to Weekday)Unit Vector (Constant) 52 n 54.235 6,330
Education of Homemaker:6-8 Years 57 82 1.248 3,832 ,33
9-11 Years 58 88 7,465 3 871 1.9312+ Years 59 42 90223 4.318 2.14*(Omitted 0-5 Years)
Income/Poverty Threshold:Change in In./Po. 19 n 0.017 0.027 0.611n./Po. 1-1.25 91 14 4,233 4.964 .85
In./Po. 1.26+ 92 16 6.304 ii.829 1.31(Omitted In./Po. 0-0.99)
Food Program Status:CD to FS1 81 96 -2.165 3,077 0.70
CD to NFS1 82 67 -8.021 3.235 2.48*NCD to FS1 83 21 0.592 4,599 0.13(Omitted No Program to No Program) 57
R2= 0.387
F = 10.23***p < 0.05
*rp < 0.01

95
likely (t = 11.43) to have a big improvement in MAR between Wave t and
Wave II.-1/
This is a reasonable result, given the fact that MAR is truncated
at 100, so that a family with a high MAK initially could not possibly have
a big increase subsequently. Also, this result probably reflects the fact
that in many cases a low MAR in Wave I could have been a "fluke' due to
exceptionally low dietary intake on the day covered by the interview.
Equation 1.13 is based on data from 234 families observed in
Waves I and III (in June 1969 and June 1970) covering periods when Bedford
County had CD and then FS2, Table 17. Again the comparison group dummy
variable representing nonparticipants (NCD to NFS2) is omitted. In this
case the findings are somewhat different, however, Joiners (NCD to FS2)
had a 14 point relative change in MAR (t = 2.35; p < .05), implying that
their change in nutritional status during the year was significantly more
favorable than that of the low income families that did not join the FS2
program. Families that went from CD to FS2also had more favorable change
in MAR than the comparison group (5.3 points), but this was statistically
significant only at about the 10 percent level (t = 1.58), indicating
there is more than a 1 in 10 chance that this Large a c,hange, in MAR could
occur due to chance rather than due to the 1..ogram.
A comparison of the results of equations 1.12 and 1.13 indicates
the change from CD to FSz had more favorable effects on the nutritional
intake of the poor than did the change from CD to FS1. Equation 1.14 yields
1/A two-stage least squares regression model would have been
preferable here, introducing the value of MAR predicted from equation 1,rather than the observed MAR, as the independent variable. This procedurewould comply with the regression assumption that the independent variablesare measured without error. It seems doubtful that the results would begreatly different using that method.
104

96
Table 17, Equation L13, Change in MAR. (Dependent Variable) fiom CU (June 1969)to FS
2(June 1970), Bedford County, Pa. (n=234).
VariableNumber
CellCount
RegressionCoefficient
Sv.andard
errorStudenttName
Home Produced Food 9 114 -3.637 2.568 1,42
(Omitted No HPF)MAR (June 1969) 15 n -77.571 6.962 11.14*Change in Size of HH 17 n -0.858 1.860 0,46Change from Weekend
to Weekday Meals 33 26 -8.273 3.988 2.07+
Unit Vector (Constant) 52 n 46.972 6.667
Education of Homemaker6-8 Years 57 83 0.669 4.091 0.169-11 Years 58 87 1.685 4.123 0.4112+ Years 59 14 -1.178 4.928 0.24(Omitted 0-5 Years) 28
Income/Poverty ThresholdzChange in In./Po. 1.9 n 00035 00029 1.19
In./Po, 1-1.25 91 12 0.036 5.796 0.01In./Po. 1,26+ 92 15 30814 5,640 1.92(Omitted In./Po. 0 0.99) 207
Food Prbgram StatusCD to FS2 81 75 5.318 3.368 1.58
CD to NFS2 82 82 3,481 3,175 1.10
NCD to FS2 83 12 14.089 5.990 2.35*
(Omitted NCD to NFS2)
R2= 0.413
F = 11.06*k*p < 0.05
**p < 0.01

97
a somewhat similar conclusion, Table 18. Joiners (NFS1 to FS2) again showed
an improvement, 9.5 points, which is significant at about the 5 percent
level. Families who stayed in the FS program (FS1 to FS2) between September
1969 and the following June had a significantly more favorable change in
MAR (6.7 points; t = 1.97, p .05) than did the comparison group (NFS1 to
NFS2). However, the findings are not entirely unequivocal, for dropouts
(FS1 to NFS2) had a similar change in MAR--7.5 points. This is not signifi-
cantly different from the change in MAR of those who stayed in the program,
and it does not support the hypothesis that FS2 is superior to FS1. The
reason for this result being out of line with the others is not known.
Equation 1.15 is similar to the preceding three equations, based
on Huntingdon Count; data reflecting changes from Wave I and Wave II, Table.
19. In this case, none of the program change categories is significant.
Factors that seem most conducive to an improved MAR in these surveys are
(a) a low initial MAR, (b) education beyond the 5th grade, and (c) relatively
high initial income, above 125 percent of the poverty line duffing Wave I
(b92 = 13.4; p <.05).
These findings are consistent with those of equation 1,01, which
showed the FS program to be much less beneficial in Huntingdon than in
Bedford County.
Differing results for both FS1 and FS2 in the two counties raised
the question whether some influential factors unique to one county might be
involved, Examination of a nomber of geographic characteristics such as
topography, type of population and employment revealed no real difference.
The counties are adjacent, both being predominately rural with a relatively
high incidence of poverty. Reasons for these differences in program effects
remain unclear at this point. The possibility that the Huntingdon County

98
results are due to random variation should be recognized, however, in view
of the fact that only 38 and 62 of the sample families were participating
in FS during Waves I and II, respectively, Table 2.
107
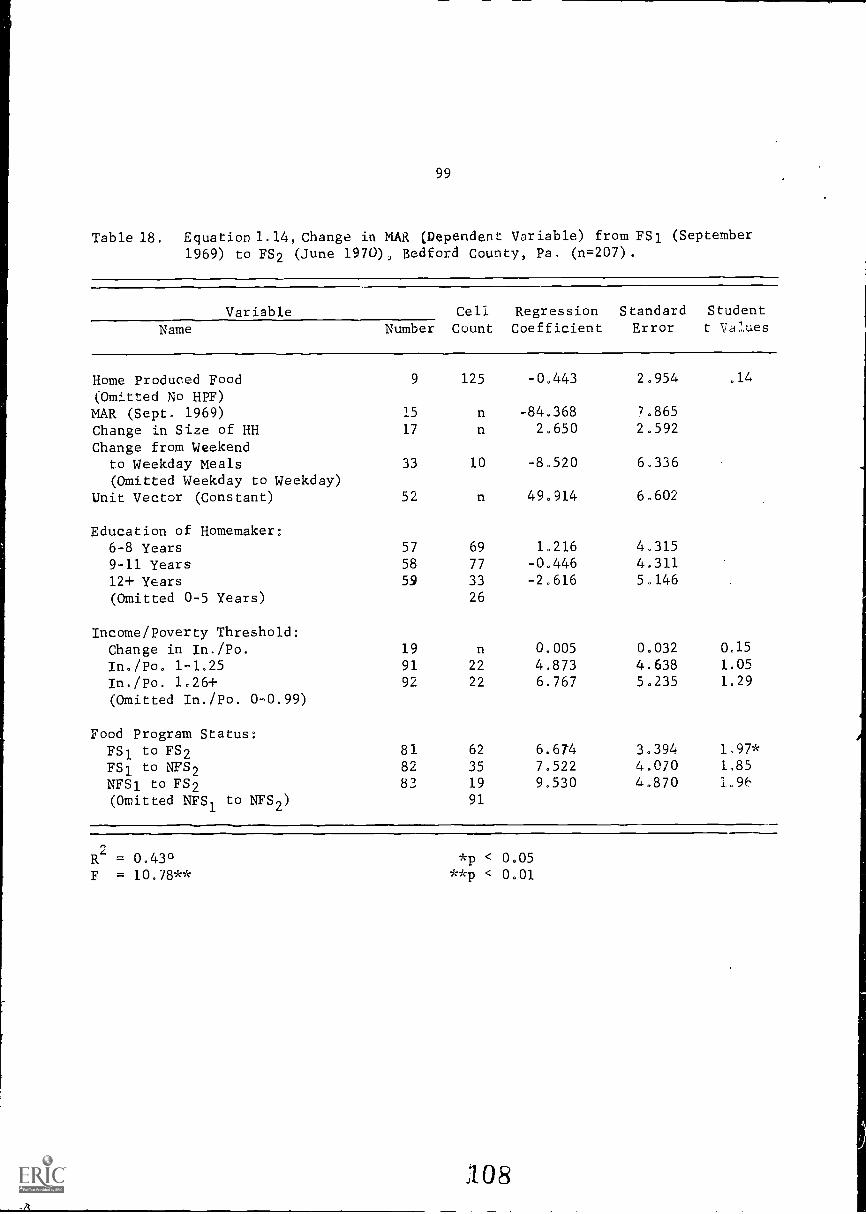
99
Table 18. Equation 1.14, Change in MAR (Dependent Variable) from FS1 (September1969) to FS2 (June 1970), Bedford County, Pa, (n=207).
Variable Cell Regression Standard Student
Name Number Count Coefficient Error t Values
Home Produced Food(Omitted No HPF)MAR (Sept. 1969)Change in Size of HHChange from Weekend
to Weekday Meals(Omitted Weekday to Weekday)
Unit Vector (constant)
9
15
17
33
52
125
n
n
10
n
-0.443
-84.3682.650
-8 520
49.914
2.954
7.8652.592
6.336
6.602
.14
Education of Homemaker:6-8 Years 57 69 1.216 4.315
9-11 Years 58 77 -0.446 4.31112+ Years 59 33 -2 616 5.146(Omitted 0-5 Years) 26
Income/Poverty Threshold:Change in In./Po. 19 n 0.005 0.032 0,15
In./Po, 1-1.25 91 22 4.873 4.638 1.05
In./Po. 1.26+ 92 22 6.767 50235 1.29
(Omitted In./Po. 0-0.99)
Food Program Status:FS1 to FS2 81 62 6.674 3.394 1.97*
FS1 to NFS2 82 35 7.522 4.070 1.85
NFS1 to FS2 83 19 9.530 4.870 1.9h
(Omitted NFS1 to NFS2) 91
R2 = 0.43° *p < 0.05
F = 10.78** **/) < 0.01
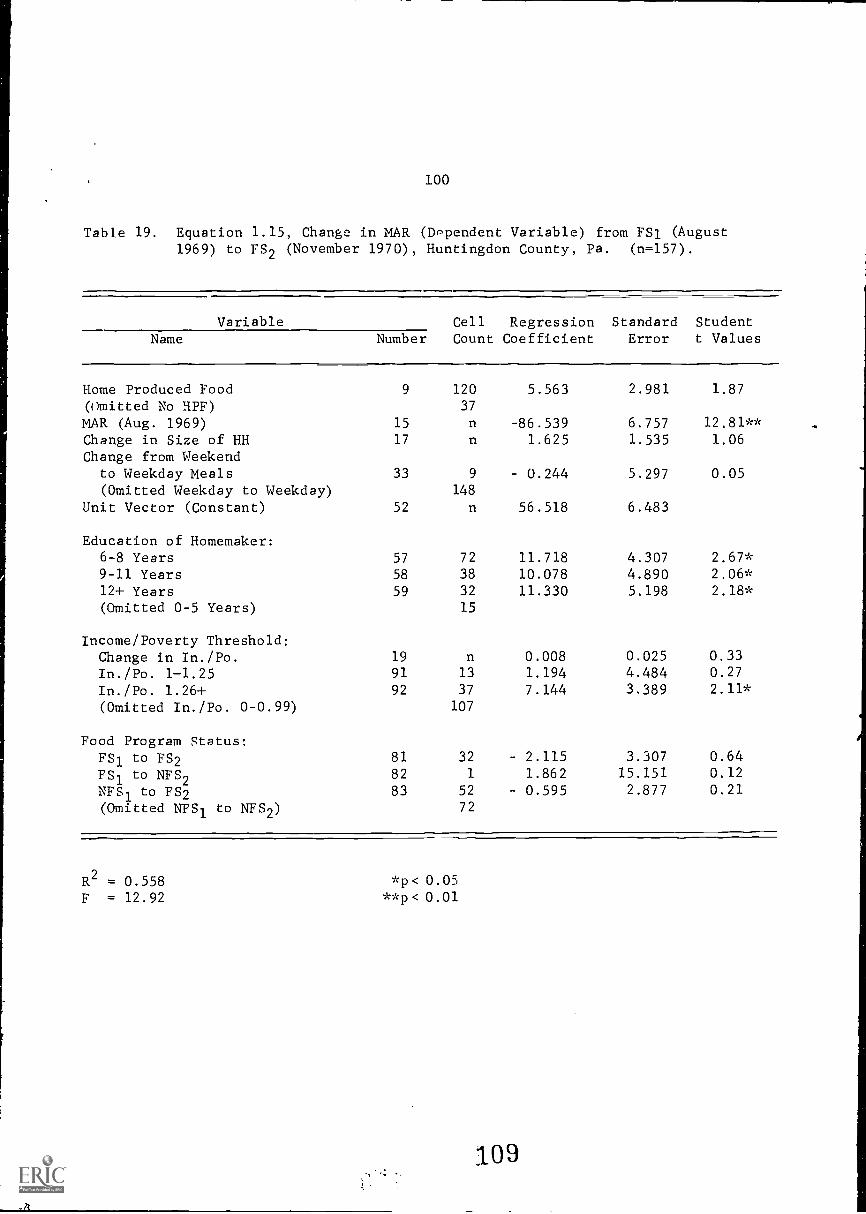
100
Table 19. Equation 1.15, Change in MAR (Dependent Variable) from FS1 (August1969) to FS2 (November 1970), Huntingdon County, Pa. (n=157).
Variable Cell Regression Standard Student
Name Number Count Coefficient Error t Values
Home Produced Food 9 120 5.563 2.981 1.87
(Omitted No HPF) 37
MAR (Aug. 1969) 15 n -86.539 6.757 12.81**Change in Size of HH 17 n 1.625 1.535 1.06
Change from Weekendto Weekday Meals 33 9 0.244 5.297 0.05(Omitted Weekday to Weekday) 148
Unit Vector (Constant) 52 n 56.518 6.483
Education of Homemaker:6-8 Years 57 72 11.718 4.307 2.67*9-11 Years 58 38 10.078 4.890 2.06*12+ Years 59 32 11.330 5.198 2.18*(Omitted 0-5 Years) 15
Income/Poverty Threshold:Change in In./Po. 19 n 0.008 0.025 0.33
In./Po. 1-1.25 91 13 1.194 4.484 0.27
In./Po. 1.26+ 92 37 7.144 3.389 2.11*
(Omitted In./Po. 0-0.99) 107
Food Program Status:FS1 to FS2 81 32 - 2.115 3.307 0.64
FS1 to NFS2 82 1 1.862 15.151 0.12
NFS1 to FS2 83 52 0.595 2.877 0.21
(Omitted NFS1 to NFS2) 72
R2 = 0.558F = 12.92
*p< 0.05**p< 0.01

101
c. Cost-Effectiveness and Nutritioral Efficiency of the Programs
The various family food aid programs may be compared in terms
of (a) relative attractiveness to potential participants, or (b) dif-
ferences among those families who actually participate in one program
versus another in terms of dietary and other characteristics. As noted
earlier, participation has historically declined whenever CD was replaced
by FS, but participation in the FS program increased sharply after the
1970 modifications became effective (FS2). The purpose of the present
section is to focus on a comparison of the programs in terms of their
cost-effectiveness and nutritional efficiency, based on participating
families.
Comparing families using FS1 with those using FS2, little if
any difference in dietary benefit could be perceived. Yet the public
cost of the FS2program is substantially higher, due to the reduced
purchase price and larger bonus value for most families. Table 20 shows
a comparison of the three food programs (CD, FS1, and FS2) under assumed
conditions that would yield the highest level of dietary benefits and,
consequently, the lowest cost per point of increase in MAR. The FS1
program succeeded in raising the dietary adequacy of participating families
at a cost of about 11c per point increase in MAR (ignoring administrative
costs) in Bedford County; 22C in Huntingdon County. In contrast, the
cost of raising the MAR by a point with FS2 was 20C in Bedford County,
and $1.04 in Huntingdon County.
Under less favorable conditions, the programs had an even higher
cost-effectiveness ratio. For example, in Bedford County, when the families
had received pay within the past two weeks, the dietary benefit from FS2
was much smaller, and the cost per point proportionately higher, Table 210
The cost per point increase in MAR was 48C,compared with 20C later in the
110

102
pay month. Comparisons like those in Table 20 could not be made with reli-
ability for the other food programs, because the denominator of the ratio
(the increase in MAR) is so small and statistically nonsignificant. But
the implication is clear: the cost-effectiveness ratios would be very
high.
These cost-effectiveness data take on additional meaning when
placed in perspective with the examples presented earlier in the discus-
sion of the sensitivity of the MAR index. The cost per point of increase in
MAR
111
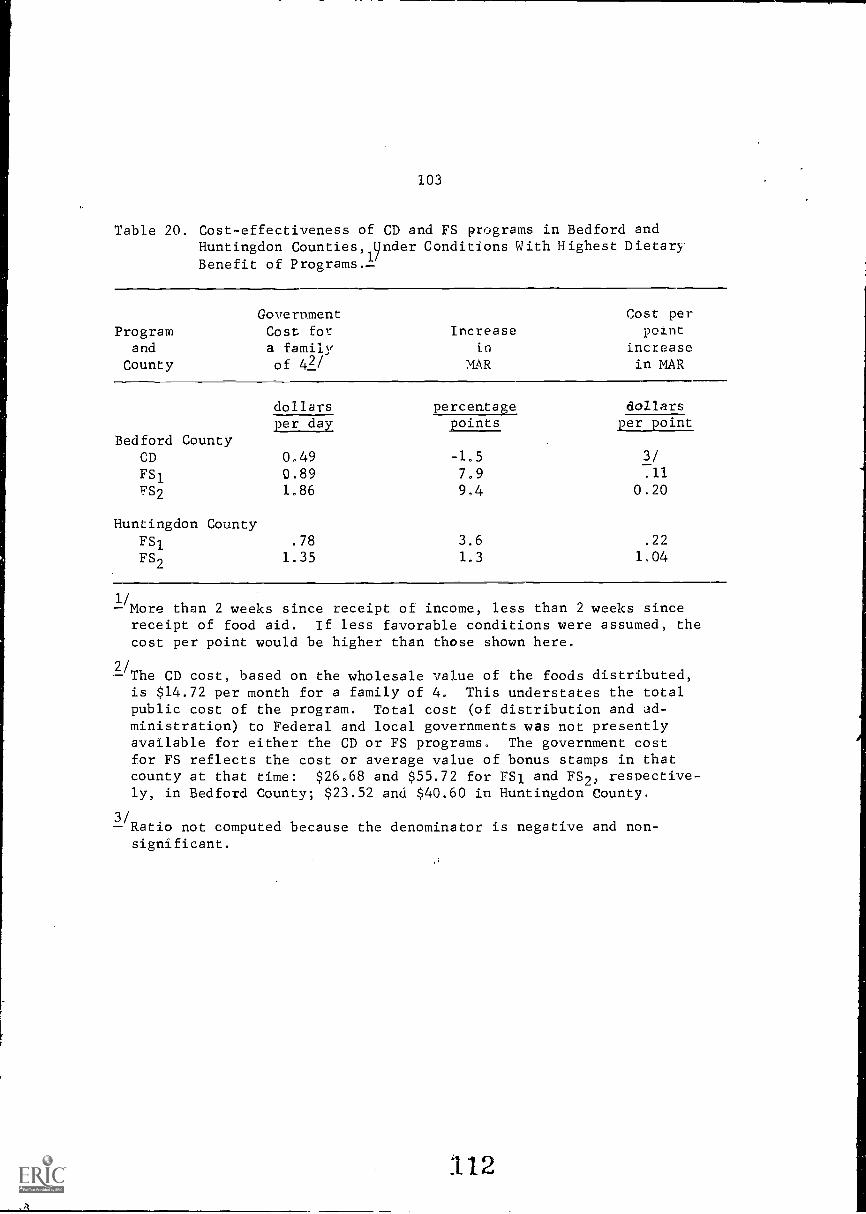
103
Table 20. Cost-effectiveness of CD and FS programs in Bedford andHuntingdon Counties,
1
Qnder Conditions With Highest DietaryBenefit of Programs.
Government Cost per
Program Cost for Increase pointand a family in increase
County of 42/ MAR in MAR
Bedford County
dollars percentage dollarsper day points per point
CD 0.49 -1.5 3/
FS1 0.89 7.9 .11
FS2 1.86 9,4 0.20
Huntingdon CountyFS1 .78 3.6 .22
FS2
1.35 1.3 1.04
1/More than 2 weeks since receipt of income, less than 2 weeks sincereceipt of food aid. If less favorable conditions were assumed, thecost per point would be higher than those shown here.
/The CD cost, based on the wholesale value of the foods distributed,is $14.72 per month for a family of 4. This understates the totalpublic cost of the program. Total cost (of distribution and ad-ministration) to Federal and local governments was not presentlyavailable for either the CD or FS programs. The government costfor FS reflects the cost or average value of bonus stamps in thatcounty at that time: $26.68 and $55.72 for FS1 and FS2, respective-ly, in Bedford County; $23.52 and $40.60 in Huntingdon County.
2/Ratio not computed because the denominator is negative and non-significant.

104
was shown to be much lower--often less than lc per point of MAR for families
having very inadequate diets, when Foods providing needed nutrients are
added to the diet
Table 21 Comparison of Cost Effectivesness Early vs. Late in the PayMonth, FS2, Bedford County.
Time Since Pay
Cost perGovernment Increase pointcost for a in increasefamily of 4 MAR in MAR
dollars per percentage dollars perday points point
More than 2 weeks 1.86 9,4 0.202 weeks or less 1.86 3.9 .48
This result suggests that CD and FS families, as well as the
other poor families, are not getting optimum nutritional efficiency from
their food resources. Perhaps foods are purchased that have little
nutritional value, or that provide little of the nutrients most needed,
Analysis of the sample data bears out this point. An indication
of the nutritional efficiency (NE) with which tie food dollar (including FS)
is used, we computed the, ratio MAR per dollar food expenditure per person
per month. This indicator was then used as a dependent variable in
equation 2.1, Table 22. FS2users, during the first 2 weeks since receipt
of income, had significantly lower predicted NE values than did their
comparison group of nonparticipants, Table 23. This result supports the
hypothesis that program participants do not use their food dollar as
efficiently as other poor families,, during the. first several days after
getting the food stamps. The same relationship was found with FS1 users
113

1,
TABLE 22.
EQUATION 2.1,
NUTRIENT EFFICIENCY (NE = MAR PER DOLLAR
OF MONTHLY FOOD EXPENDITURE
PER PERSON) AS DEPENDENT VARIABLE (n
= 100) AS DEPENDENT VARIABLE (n = 1001)
Variable
i
Variable
Number
n. 1
Cell
Count
b, 1
Regression
Coefficient
sb. i
Standard
Error
Relevant
Student
t Values
F Ratio
Education of Homemaker (years):
3n
-0.002
0,010
0.22
Age of Homemaker (years):
6n
-0.014
0 006
2,29
Home Produced Food
(1=yes)
4523
0.671
0. 171
3,93
(omitted:
No HPF)
478
Size of Household:
15.78
Size 3
423
261
0.544
0 251
Size 5 - 6
24
231
1.242
0.286
Size 7 +
25
202
1.848
0.285
(omitted:
size < 3)
307
Nutr- Aide Visits:1./
NA,V. 3
537
37
-0.143
1-063
N.A.V. 6
12
38
57
-0.274
1.089
N.A.V. 13 - 60
39
29
-0.461
1.211
(omitted:
N.A.V. < 3)
878
Interactions:
N.A.V. < 3; HFS <
1..., days
33
32
1.037
1 888
N.A.V. 3+; HFS < 15 days
34
24
1.034
2.196
N.A.V. < 3; no F.S. or > 15 days
35
135
0.194
1.209
N.A.V. 3+; no F.S. or > 15 days
36
92
-0.073
1.601
(omitted:
HFS 15 + days)
718
Unit Vector (constant)
21
n3.092
0.685
Weekdays
22
932
-0.240
0.328
0.73
(omitted:
Sat. and Sun.)
69
11These variables include observations inHuntingdon County only, since the Nutrition
Education Program did not exist in Bedford
County.
*p < 0,05
**p < 0.01
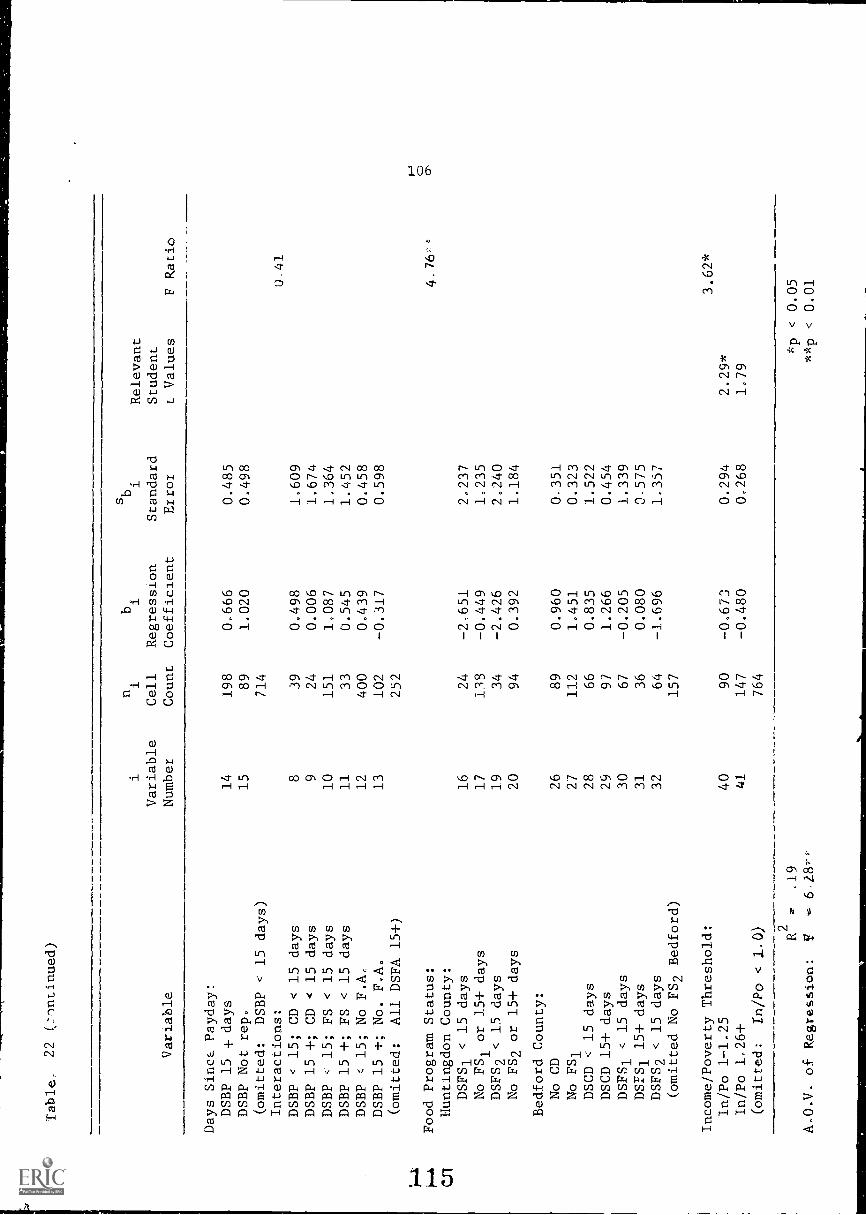
Table_
22 (.71ntinued)
Variable
Variable
Number
sb.
nb.
11
1
Cell
Regression
Standard
Count
Coefficient
Error
Relevant
Student
t Values
F Ratio
Days SineL Payday:
DSBP 15
-I- days
DSBP Not rep.
(omitted:
DSBP < 15 days)
Interactions:
14
15
198
89
714
0.666
1.020
0.485
0.498
0-41
DSBP < 15; CD < 15 days
839
0.498
1,609
DSBP 15 +; CD < 15 days
924
0.006
1.674
DSBP <
15; FS < 15 days
10
151
1.087
1.364
DSBP 15 +; FS < 15 days
11
33
0.545
1.452
DSBP < 15; No F.A,
12
400
0-439
0.458
DSBP 15 +; No. F.A.
13
102
-0.317
0.598
i--4
(omitted:
All DSFA 15+)
Food Program Status:
252
CJI
Huntingdon County:
DSFS1 < 15 days
16
24
-2,651
2.237
No FS1 or 15+ days
17
138
-0.449
1,235
DSFS2 < 15 days
19
34
-2.426
2.240
No FS2 or 15+ days
20
94
0.392
1.184
Bedford County:
No CD
26
89
0.960
0,351
No FS1
27
112
1.451
0.323
DSCD < 15 days
28
66
0.835
1.522
DSCD 15+ days
29
97
1.266
0.454
DSFS1 < 15 days
30
67
-0.205
1.339
DSFS1 15+ days
31
36
0.080
0 -575
DSFS2 < 15 days
32
64
-1.696
1.357
(omitted No FS2 Bedford)
157
Income/Poverty Threshold:
3.62*
In/Po 1-1.25
40
90
-0,673
0.294
2,29*
In/Po 1,26+
41
147
-0.480
0.268
1.79
(omitted:
In/Po < 1,U)
764
R2
=,19
A-0.V. of Regression:
V6.287*
*p < 0.05
**p < 0,01

by Prograr Status and Days Since Pay; Estimated as Predicted
ation 2.1,
Bedford County
Huntingdon County
IWave II
1
Wave III
Wave
IWave II
I
Days Since
1-14 Days
15-39
1-14 Days
15-39
1-14 Days
15-39
NCD
FS
NFS1
Since
Days or
Since.
Days or
Since
Days or
5-39
1-14
115-39
F52
NFS2
FS
NFS
FS
NFS
--I----
11
22
.1
_J9
4.89
4.36
4.00
5-37
2,87
3.92
2.95
3.67
3.18
4.51
(2,37)*
(2.65)**
(0.96)
(2.10)*
,10
4.79
4,49
3.(r.,
5.28
3.00
3.83
3,08
3.58
3.30
4,42
(1.33)
(1.30)
(0.58)
(1,37)
t tests for the difference between the NE of
respective comparison groups of nonpartici-
'iltat 5 percent level; ** implies 1 percent
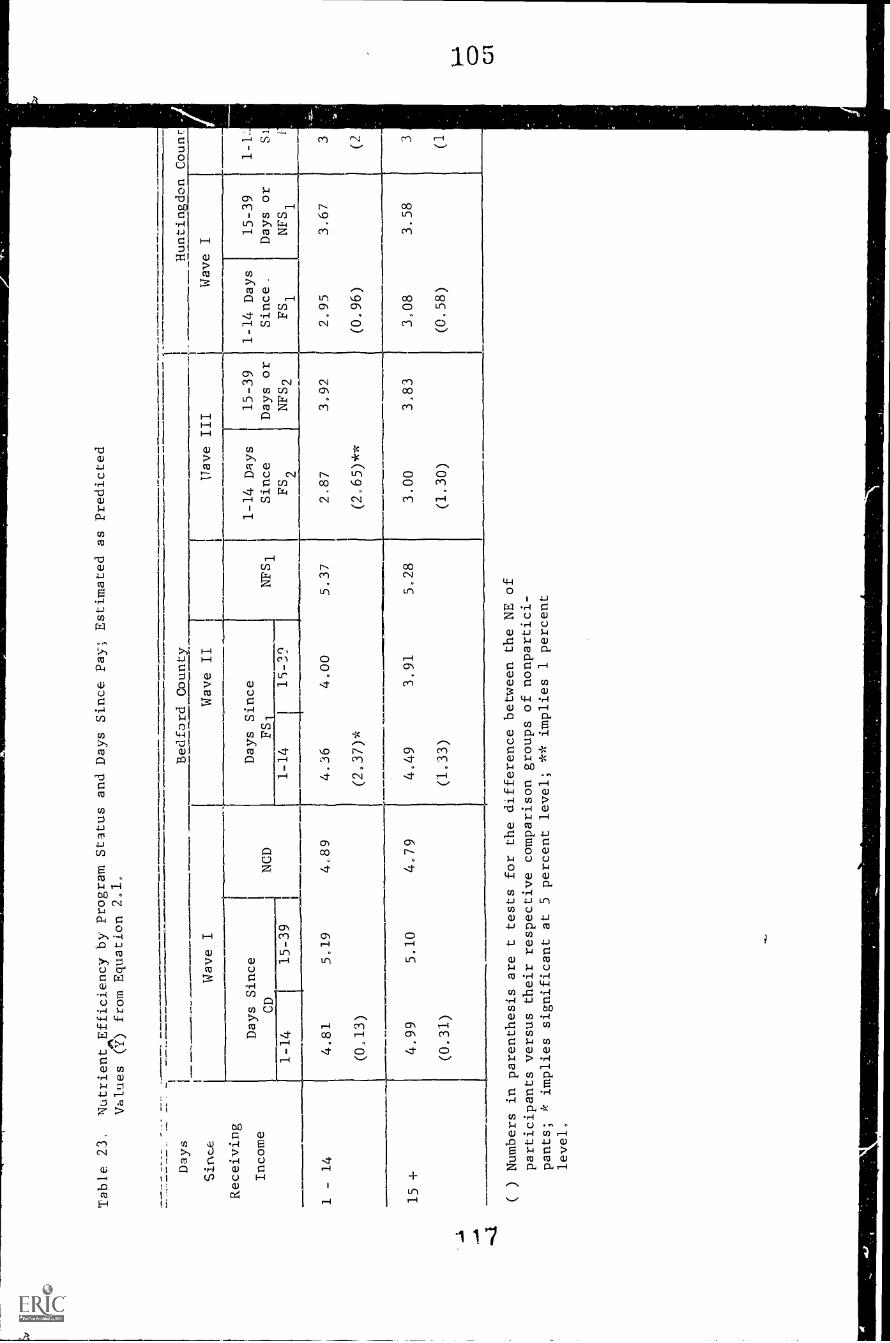
Table 23,
Nutrient Efficiency by Program Status and Days Since Pay; Estimated as Predicted
Values (Y) from Equation 2.1.
Days
Since
Wave I
Receiving
Income
Days Since
CD
NCD
1 - 14
Bedford County
Wave II
Wave III
Huntingdon Counr.
Wave I
Days Since
1-14 Days
FS
NFS1
Since
1-14
15-39
FS2
4.36
4.00
5.37
2.87
4.81
(0.13)
15+
5.19
4.89
(2.37)*
15-39
1-14 Days
Days or
Since
NFS2
FS1
15-39
1-1
Days or
SI
NFS1
(2,65)**
3.92
2,95
(0,96)
3.67
(
4.99
(0.31)
5,10
4.79
4,49
(1.33)
3.91
5.28
3.00
3.83
(1,30)
3,08
(0.58)
3.58
(
() Numbers in parenthesis are t tests for the difference between the NE of
participants versus their respective comparison groups of nonpartici-
pants;
implies significant at 5 percent level; ** implies 1 percent
level,
108
in Bedford County; but the difference between FS1and NFS
1was not significant
in Huntingdon County. Thus, the relationship is not uniform in all observed
situations.
Recent CD recipients should be expected to have much higher NE
values than NCD families, becaude of the free food. No difference was
found, however. Both CD and NCD families were predicted to have the same
MAR per food dollar per person per month.
Consistent with these results is the estimated effect of income
on nutritional efficiency. Families below the poverty line have a signif-
icantly higher predicted NE value than do those with incomes from 100 to
125 percent: of the poverty line (t = 2.29; p <.05).
All these findings support the "feast and famine" hypothesis --
that when food resources are plentiful, low-income families tend to get
less nutritional value for their food dollar. This is no surprise, of
course, since this relationship is widely known among higher income groups.
Food provides utility in ways other than nutrition. Non-nutritional
outputs include such things as (1) the pleasure associated with eating
highly paletable foods, (2) the recreational value of a "vacation" from
cooking through the use of convenience foods, and (3) the status-conferring
aspect of preparing and serving special foods. The results presented
above can be explained partly as a higher income elasticity of demand for
the non-nutritional than for the nutritional outputs of food use
When more than two weeks have elapsed since pay was received, the
program participants begin to get more nutritional value from their food
dollar. Consequently the difference in nutritional efficiency betwt,.an
participants and nonparticipants begins to fade. Differences significant
ax the 5 percent or lower level of probability during the first half of the
pay month are now significant only at the 20 percent level-
-4 ^-1
109
d. Food Expenditure
If program participants have somewhat more adequate dietary
intake, yet they have lower nutritional efficiency values (in terms of
MAR per food dollar), then it stands to reason that participants must spend
'oe for food than do nonparticipants. A regression equation was computed
to test this hypothesis, equation 3.1 (Table 24). Monthly food expenditure
per person is the dependant variablen
The relationship between family income and food expenditure in
equation 3.1 turned out as expecteth the higher the family income, the
more is spent on food. Families with incomes somewhat greater than 125
percent of the poverty line spend significantly more on food than do
families below the poverty line. And those families receiving income
infrequently (one time or less per month) have somewhat lower food ex-
penditure, though this is not statistically significant.
Food stamp users were predicted to have somewhat larger expendi-
tures, other things being equal, Table 25, That is, at a given level of
income, and with all other family characteristics held constant, families
spend more on food per person. This implies that food stamp users have
a somewhat higher average propensity to consume (APC), in view of the
fact: that: food expenditures are higher at a given level of income.
Two precautions should be noted in interpreting this result.
First the differences between participants and nonparticipants were not
significant in most cases -- the only exception being Huntingdon FS2, in
which participants were predicted to spend about $8 per person per month
more on food than do the nonparticipants. The second precaution has to
d3 with the dangers inherent in inferring causality from a self-stratifying
sample. Do food stamp users have a higher APC for food because they are
the program? Or did they join the program because they have a higher
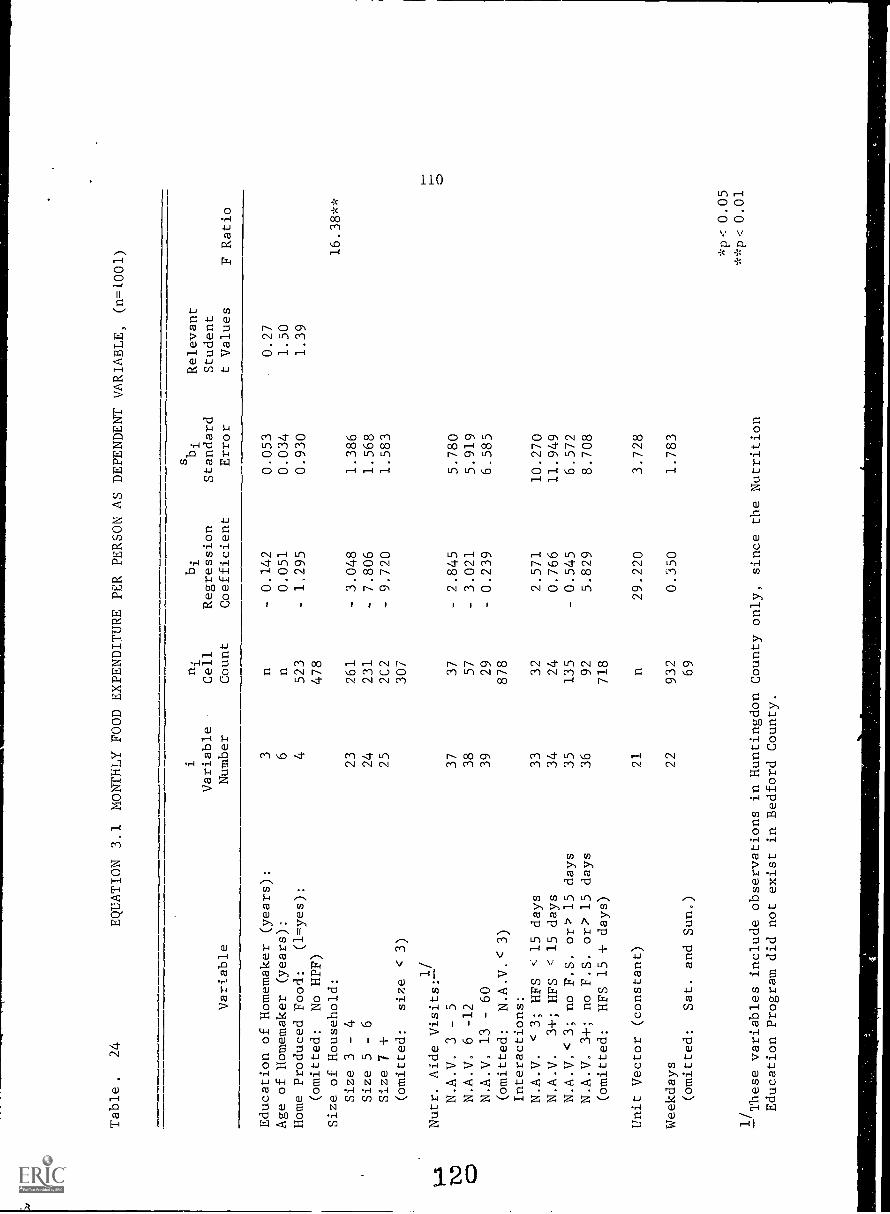
Table.
24
EQUATION 3.1 MONTHLY FOOD EXPENDITURE PER PERSON AS DEPENDENT VARIABLE, (n=1001)
Variable
i
Variable
Number
ni
Cell
Count
bi
Regression
Coefficient
sbi
Relevant
Standard
Student
Error
t Values
F Ratio
Education of Homemaker (years):
Age of Homemaker (years):
Home Produced Food:
(1=yes):
(omitted:
No HPF)
Size of Household:
Size 3 - 4
Size 5 - 6
Size 7 +
(omitted:
size < 3)
3 6 4
23
24
25
n n
523
478
261
231
2C2
307
- 0.142
0.051
- 1,295
- 3.048
- 7.806
- 9.720
0.053
0.27
0.034
1.50
0.930
1.39
16.38**
1.386
1.568
1.583
....1
Nutr. Aide Visits:1/
T\D
N.A.V, 3 - 5
37
37
- 2.845
5.780
CD
N.A.V. 6 -12
38
57
- 3.021
5.919
N.A.V. 13
60
39
29
- 0.239
6.585
(omitted:
N.A,V. 3)
878
Interactions:
N.A.V.
< 3; HFS < 15 days
33
32
2.571
10.270
N.A.V.
3+; HFS
= 15 days
34
24
0.766
11.949
N.A.V. < 3; no F.S. or> 15 days
35
135
0.545
6.572
N.A.V. 3+; no F.S. or
15 days
36
92
5.829
8.708
(omitted:
HFS 15 + days)
718
Unit Vector (constant)
21
n29.220
3.728
Weekdays
22
932
0.350
1.783
(omitted:
Sat. and Sun.)
69
'These
variables include observations in Huntingdon County only, since the Nutrition
Education Program did not exist in Bedford County.
*p< 0.05
**p< 0.01

Table 24
(continued)
Variable
i
Variable
Number
ni
Cell
Count
bi
Regression
Coefficient
sbi
Standard
Erlor
Relevant
Student
t Values
F Ratio
Days Since Payday:
DSBP 15+ days
14
198
- 0.926
2,654
DSBP Not rep,
15
89
- 3.187
2.705
(omitted:
DSBP .,'15 days)
714
Interactions:
0.16
DSBP <15; CD <15 days
839
0.604
8,742
DSBP 15+; CD <15 days
924
2.064
9.099
DSBP-:15; FS <15 days
10
151
6.713
7,419
DSBP 15+; FS <15 days
11
33
- 6.663
7.892
DSBP <15; No F.A.
12
400
- 1.099
2.491
DSBP 15+; No 1!.A.
13
102
- 0.876
3.252
(omitted:
All DSFA 15+)
252
Food Program Status:
Huntingdon County:
2.05
tr--1
DSFS1 <15 days
16
24
7.969
12.180
ND
No FS1 or 15+ days
17
138
0.523
6.711
ia."4
DSFS2 <15 days
19
34
10.800
12,192
No FS2
or 1.5+ days
20
94
0.025
6.432
Bedford County:
No CD
26
89
2,933
1.909
No F51
27
112
4.431
1.758
DSCD <15 days
28
66
- 2.848
8.270
DSCD 15+ days
29
97
4.812
2.469
DSFS1' 15 days
30
67
4.193
7.278
DSFS1 15+ days
31
36
- 2.012
3,128
DSFS2 <15 days
32
64
9.581
7.386
(omitted No FS2 Bedford)
157
Income/Poverty Threshold:
2.42
In/Po 1-1,25
40
90
1,245
1.602
0.78
In/Po 1.26+
41
147
3.545
1.467
2.42*
(omitted In/Po <1.0)
764
R2= 0.136
F= 4.118**
*p <0.05
**p <0.01
112
APC? IL could be that only that portion of the poor population which plac&s
higher emphasis on food would bother to sign. up for food stamps. Ii so,
then the dietary adequacy (or at least the food expenditure) of food stamp
users would naturally exceed that of non-users, This question of possible
bias is raised but cannot be answered rigorously on the basis of data
available in this study. However, the data do not contain any indication
of selfstatification bias,

113
Table 25. Estimated Monthly Food Expenditure per Person, by Program Participa-tion and Days Since Pay, Assuming Constant Household Characteristics(from equation 3.1).
Program ParticipationStatus and Survey
Days Since Pay1-14 15+
Bedford Countydollars dollars
23.6721.4423.32
24.6024.0121.59
21.2920.5122.39
23.7323.3120.89
Wave I
CD, 1-14 daysCD, 15-39 daysNCD
Wave II
FS1
1-14 daysFS1 15-39 daysNFS1
Wave IIIFS2 1-14 days 29.99 29.12FS2 15-39 or NFS2 26.03 25.32
Huntingdon County
Wave IFS
11-14 days 30.95 30.08
NFS1 15-39 or NFS1 26.00 25.30
Wave IIFS2 1-14 days 33.78 32.91NFS2 15-39 days or NFS2 25.51 24.80

114
G, PROCEDURAL SOMMAPS
The findings of this analysis are summarized in the first part
of this report, so the summary will not be repeated here. However, a few
comments on statistical procedure may be useful.
Multivariate analysis has been done to facilitate comparison of
food program participants versus nonparticipants under various assumptions,
while holding other factors constant. A number of different regression
equations were computed, to test program effects on each of 10 nutrients
as well as the overall index of nutritional well-being (MAR). Food Stamps
were associated with higher levels of nutritional adequacy in certain
situations. The nutritional efficiency with which the sample respondents
use their food dollar was also investigated using multiple regression
equation, with a model similar to that used to explain nutritional adequacy
variables. Food expenditure relationships with program status and other
variables were also analyzed in a regression equation.
Comparisons between participants and nonparticipants were made on
the basis of predicted values (Y) from the regression equation, or equiva-
lently, using linear combinations of variables crucial to the comparison.
The significance of difference was tested using the student t test on the
linear combinations. The significance of the overall regression model was
tested with an F test. In each case, the regression was significant, even
though the R2values were only around 20 percent. All the regressions
reported here are unweighted. That is, each observation was treated the
same, despite the fact that differential sampling rates were used in order
to obtain enough program participants, This is the approach usually taken
in studies of this kind. When weighted regression was tried, it was found
that the results were unduly vulnerable to the variation in weight values
124

115
for various subsamples, particularly certain program participants. It
appeared that the results from weighted regression would be seriously
biased in this manner. Therefore, it was the judgment of the authors
that conventional unweighted regression (ordinary least-squares, analysis
of covariance multiple regression) should be used.
The data were analyzed both in cross sectional form and longitu-
dinally, in first differences. In the latter equations, change in nutri-
tional adequacy was regressed against change in program status, income,
and other variables. Results obtained from this method were consistent
with those from the cross sectional approach.
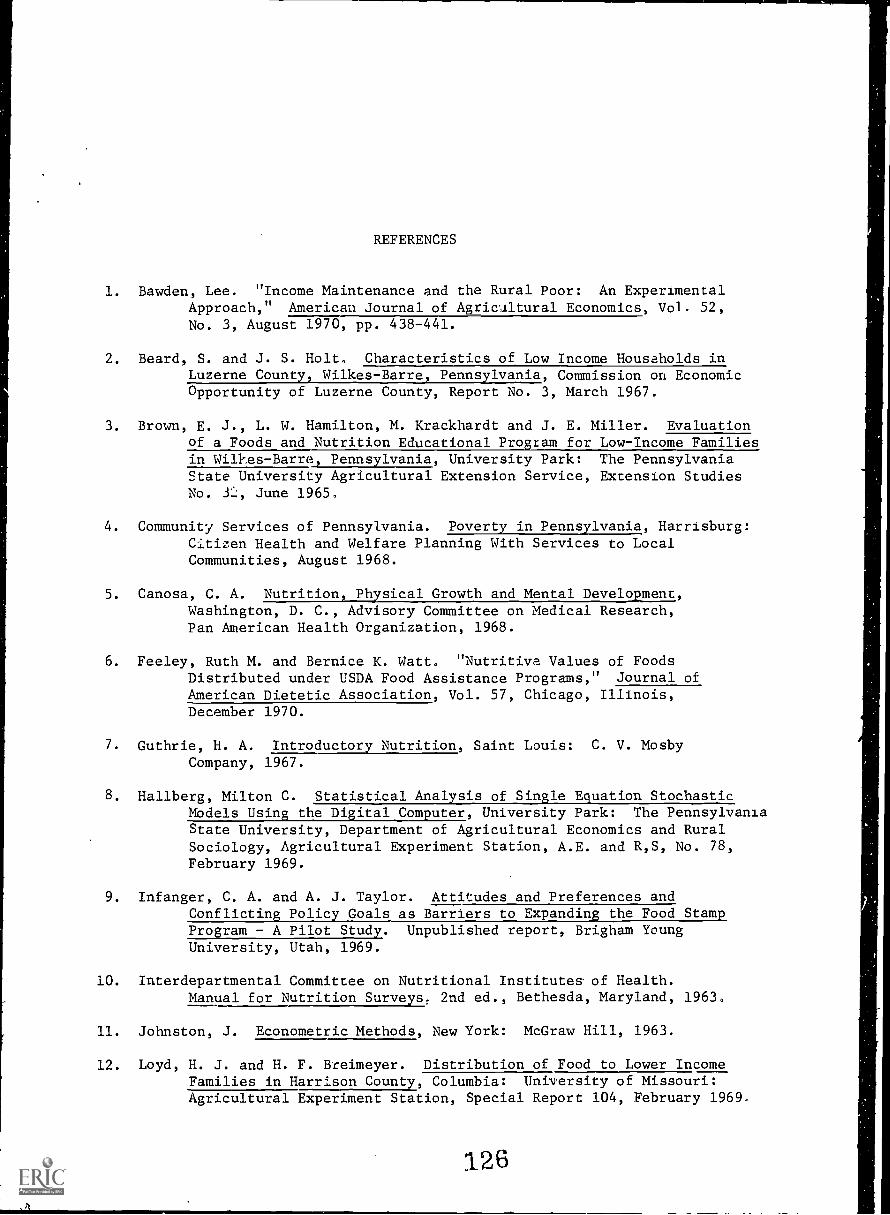
REFERENCES
1. Bawden, Lee. "Income Maintenance and the Rural Poor: An ExperimentalApproach," American Journal of Agricultural Economics, Vol. 52,No. 3, August 1970, pp. 438-441.
2. Beard, S. and J. S. Holt. Characteristics of Low Income Housaholds inLuzerne County, Wilkes-Barre, Pennsylvania, Commission on EconomicOpportunity of Luzerne County, Report No. 3, March 1967.
3. Brown, E. J., L. W. Hamilton, M. Krackhardt and J. E. Miller. Evaluationof a Foods and Nutrition Educational Program for Low-Income Familiesin Wilkes-Barre, Pennsylvania, University Park: The PennsylvaniaState University Agricultural Extension Service, Extension StudiesNo. 5.1:, June 1965.
4. Community Services of Pennsylvania. Poverty in Pennsylvania, Harrisburg:Citizen Health and Welfare Planning With Services to LocalCommunities, August 1968.
5. Canosa, C. A. Nutrition, Physical Growth and Mental Development,Washington, D. C., Advisory Committee on Medical Research,Pan American Health Organization, 1968.
6. Feeley, Ruth M. and Bernice K. Watt. "Nutritive Values of FoodsDistributed under USDA Food Assistance Programs," Journal ofAmerican Dietetic Association, Vol. 57, Chicago, Illinois,December 1970.
7. Guthrie, H. A. Introductory Nutrition, Saint Louis: C. V. MosbyCompany, 1967.
8. Hallberg, Milton C. Statistical Analysis of Single Equation StochasticModels Using the Digital Computer, University Park: The PennsylvaniaState University, Department of Agricultural Economics and RuralSociology, Agricultural Experiment Station, A.E. and R,S, No. 78,February 1969.
9. Infanger, C. A. and A. J. Taylor. Attitudes and Preferences andConflicting Policy Goals as Barriers to Expanding the Food StampProgram - A Pilot Study. Unpublished report, Brigham YoungUniversity, Utah, 1969.
10. Interdepartmental Committee on Nutritional Institutes- of Health.Manual for Nutrition Surveys, 2nd ed., Bethesda, Maryland, 1963.
11. Johnston, J. Econometric Methods, New York: McGraw Hill, 1963.
12. Loyd, H. J. and H. F. Breimeyer. Distribution of Food to Lower IncomeFamilies in Harrison County, Columbia: University of Missouri:Agricultural Experiment Station, Special Report 104, February 1969.
126
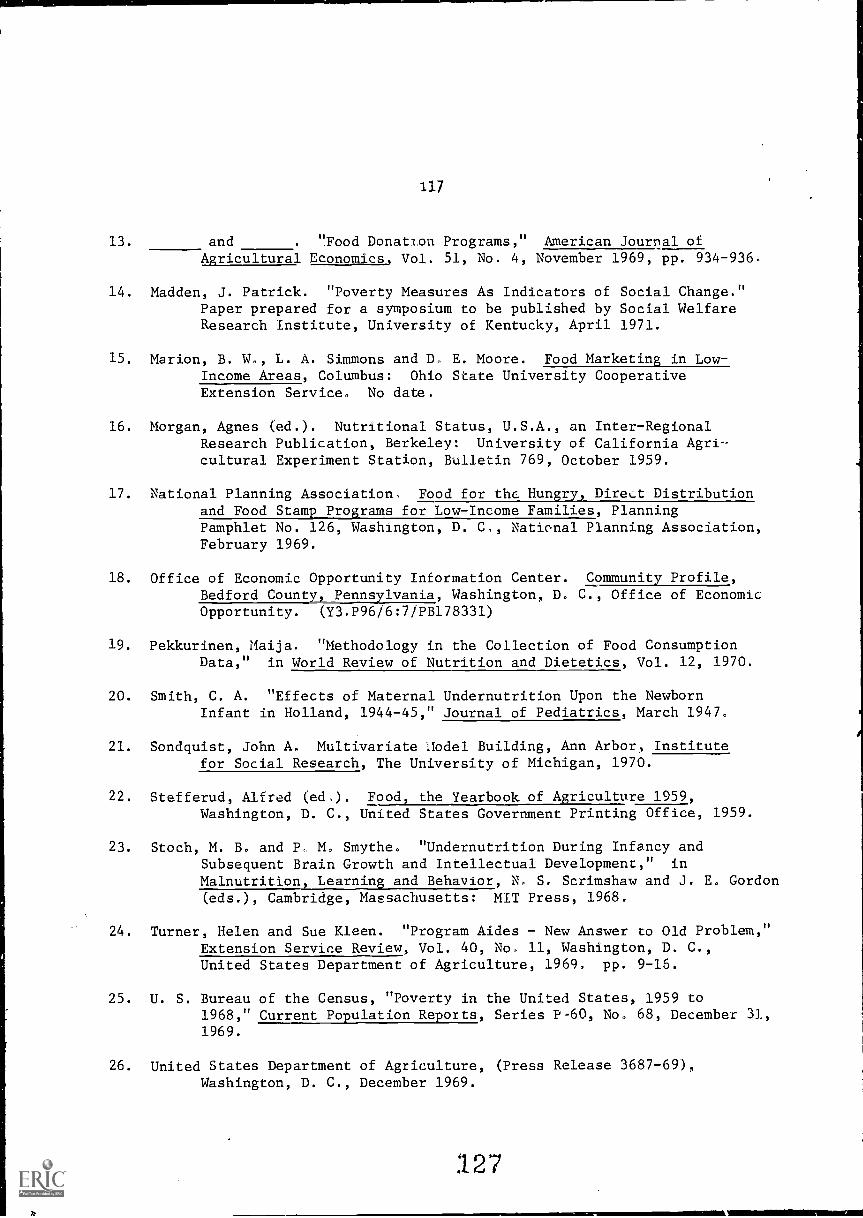
117
13. and . ':Food Donation. Programs," American Journal ofAgricultural Economics, Vol. 51, No. 4, November 1969, pp. 934-936.
14. Madden, J. Patrick. "Poverty Measures As Indicators of Social Change."Paper prepared for a symposium to be published by Social WelfareResearch Institute, University of Kentucky, April 1971.
15. Marion, B. W., L. A. Simmons and D. E. Moore. Food Marketing in Low-Income Areas, Columbus: Ohio State University CooperativeExtension Service. No date.
16. Morgan, Agnes (ed.). Nutritional Status, U.S.A., an Inter-RegionalResearch Publication, Berkeley: University of California Agri-cultural Experiment Station, Bulletin 769, October 1959.
17. National Planning Association, Food for the Hungry, Direst Distributionand Food Stamp Programs for Low-Income Families, PlanningPamphlet No. 126, Washington, D. C., National Planning Association,February 1969.
18. Office of Economic Opportunity Information Center. Community e,
Bedford County, Pennsylvania, Washington, D. C., Office of EconomicOpportunity. (Y3.P96/6:7/PB178331)
19. Pekkurinen, Maija. "Methodology in the Collection of Food ConsumptionData," in World Review of Nutrition and Dietetics, Vol. 12, 1970.
20. Smith, C. A. "Effects of Maternal Undernutrition Upon the NewbornInfant in Holland, 1944-45," Journal of Pediatrics, March 1947.
21. Sondquist, John A. Multivariate ilodel Building, Ann Arbor, Institutefor Social Research, The University of Michigan, 1970.
22. Stefferud, Alfred (ed,). Food, the Yearbook of Agriculture 1959,Washington, D. C., United States Government Printing Office, 1959.
23. Stoch, M. B. and P. M. Smythe. "Undernutrition During Infancy andSubsequent Brain Growth and Intellectual Development," in
Malnutrition, Learning and Behavior, N. S. Scrimshaw and J. E. Gordon(eds.), Cambridge, Massachusetts: MIT Press, 1968.
24. Turner, Helen and Sue Kleen. "Program Aides New Answer to Old Problem,"Extension Service Review, Vol. 40, No. 11, Washington, D. C.,United States Department of Agriculture, 1969. pp. 9 -15.
25. U. S. Bureau of the Census, "Poverty in the United States, 1959 to1968," Current Population Reports, Series P-60, No. 68, December 31,1969.
26. United States Department of Agriculture, (Press Release 3687-69),Washington, D. C., December 1969.
127

27.
118
Food Intake and Nutritive Value of Diets, of Men, Women andChildren in the United States, Spring 1965. Preliminary Report byAgricultural Research Service, Washington, D. C., United StatesGovernment Printing Office, 1969.
28. United States Senate, Hunger in America: Chronology and SelectedBackground Materials, Washington, D. C., Subcommittee on Employment,Manpower and Poverty of the Committee of Labor and Public Welfare,United States Government Printing Office, 1968.
29. . Nutrition and Human Needs, Part 2, USDA, HEW and 0E0Officials, and Part 3, National Nutrition Survey, Washington, D. C.,United States Government Printing Office, January 1969.
30. United States Senate. Poverty, Malnutrition, and Federal Food AssistancePrograms: A Statistical Summaa, Select Committee on Nutritionand Human Needs, Washington, D, C., United States GovernmentPrinting Office, 1969.
31. Yoder, Marion D., "Factors Affecting Dietary Adequacy of Low-IncomeHouseholds in a Rural County with the Commodity DistributionProgram Bedford County, Pennsylvania -- June 1969." UnpublishedM.S. Thesis, Pennsylvania State University, 1970.
APPEND IX A
RECORDING THE 24 -HOUR DIETARY RECALL
129
120
A. Purpose
The purpose is to obtain a record of food and beverage consumed
by the household members during the 24 hours previous to the interview.
The data will be processed to provide a record of the nutrient intake
of the household. The respondent is the person responsible for the
household's food preparation.
B. Instructions to Enumerators
The 24-hour dietary recall is taken on the entire household.
It is not necessary to allocate amounts consumed to specific
individuals. Neither is it necessary to secure and record information
on meals prepared or eaten outside of the home. It is important to
remember that the total amount consumed and not amount prepared
should be recorded. Be sure to indicate in the "description"
column whether or not the food contained refuse, e.g., unpeeled
potatoes, meat with bone, etc. In helping the respondent recall
amounts, keep in mind that pets may consume significant amounts of
leftover food. Amount of leftover subtracted from amount prepared
may not be amount coasumed by the household. Keep this in mind
where there are pets.
It is necessary to remind the respondent that you are
interested in the past 24 hours' intake not in what usually is
consumed. During the interview it will be helpful to use various
household members' names in probing intake such as, "Did Johnnie have
anything to eat or drink when he came home from school yesterday?"
When taking the recall it is usually easier for the
respondent to give the menu or name of the dishes eaten and then
130
121
afterward tell ingredients which were used to make the dish.
Stopping for details of the recipe becomes confusing to many
respondents.
It is necessary to record accurately whether an item is
RAW or COOKED so that the appropriate code number can be assigned.
At the end of the recall you may find it helpful to read it back
and ask if there was anything forgotten, candy, cocktails, etc.
Note at top of page if faddism, serious feeding problems,
drastic deviations from normal, etc. were observed.
C. Models for Estimating Quantities of Food
Food models designed for food intake surveys are common.
However, the models designed for the National Nutrition Survey
were unique in that they were designed in conjunction with a
program for data processing by an electronic computer. These
models and the principles of this data processing program were
adopted for this study with some modifications.
Nutritionists and dietitians are familiar with more con-
ventional survey methods which consist of (1) collecting dietary
information and recording it in household portions then
(2) converting the household portion to gram weights so that
(3) nutrient values may be determined. The conversion of intake
to gram weights is necessary because most tables of nutrient
values are based on gram weight of foods.
For this study, the Nutrient Intake Tabulator Evaluator
Program (NITE) was designed to determine the nutrient values of
food consumed. The program processing the data is based on a

122
food composition table which includes the 2,483 food items
ing in U. S. Department of Agriculture Handbook No. 8 (1963),
Table No. 1, plus additional foods as needed to comply with other
foods which respondents reported. The food table lists nutrients
based on the amount of each nutrient in 100 grams of the specific
food item.
The models have been designed to assist interviewers in
securing from the respondent the amounts of food consumed. They
have also been designed so that the computer can take the
alphabetic code assigned to each model, make necessary mathe-
matical computations based on the size of the model and arrive
at (1) the grams of a food consumed then (2) the nutrients from
the amount of food consumed. An oversimplified explanation of
what will occur is demonstrated by the following example:
1. A respondent may answer: "My family ate applesauce in the
amount of twice model 'S' this noon."
a. The interviewer will record as follows:
Food Code9-12
Food Item14-19
0029 Applesauce 2
II
2 0- 24
b. The computer will determine the gram weight of applesauce
based on the food code numbers recorded in Columns 9-12,
and convert model "S" to 3/4 cup and make necessary
calculations.
2. The respondent may have answered: "My family consumed
spaghetti in the amount of twice model 'S' this noon."
1_32
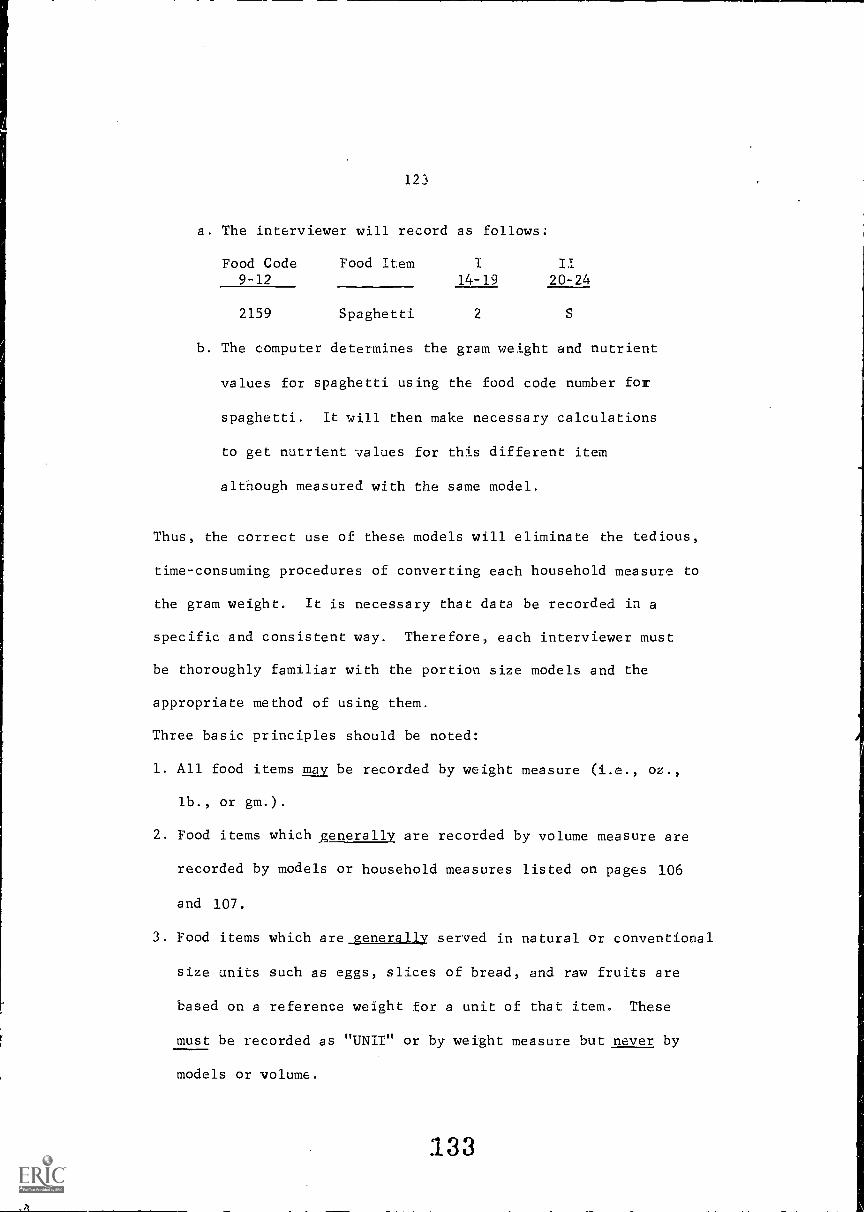
12.1
a. The interviewer will record as follows;
Food Code9-12
Food Item T II
14-19 20-24
2159 Spaghetti 2
b. The computer determines the gram weight and nutrient
values for spaghetti using the food code number for
spaghetti. It will then make necessary calculations
to get nutrient values for this different item
although measured with the same model.
Thus, the correct use of these models will eliminate the tedious,
time-consuming procedures of converting each household measure to
the gram weight. It is necessary that data be recorded in a
specific and consistent way. Therefore, each interviewer must
be thoroughly familiar with the portion size models and the
appropriate method of using them.
Three basic principles should be noted:
1. All food items may be recorded by weight measure (i.e., oz.,
lb., or gm.).
2. Food items which generally are recorded by volume measure are
recorded by models or household measures listed on pages 106
and 107.
3. Food items which are generally served in natural or conventional
size units such as eggs, slices of bread, and raw fruits are
based on a reference weight for a unit of that item. These
must be recorded as "UNIT" or by weight measure but never by
models or volume.
133

124
Now-- let us examine the model kit. It is important to
understand that the models are not intended to be models of any
one food. Rather, they are models designed to assess volume or
amount.
These are the models and the alphabetic codes accepted by
the computer program.

Model
125
ApproximateType Alphabetic Numeric Household
Measure Code Equivalent MeasurementEquivalent
(Equal tothe numberof 1/8 cups)
Cups Cup A 10.00 1 1/4 cups
S 06.00 3/4 cup
Glasses Cup B 11.00 1 3/8 cupsV 09,00 1 1/8 cups
Q 05.00 5/8 cup
Spoons Cup SS 00.70 1 1/2 tbls.
CC 00.50 1 tbls.
M 00.30 1/2 tbls.
E 00.20 1 tsp.
Mounds Cup C 16.00 2 cupsS 06.00 3/4 cupZ 02.50 1/3 cupJ 14.00 1 3/4 cupsS 06.00 3/4 cupZ 02.50 1/3 cup
Bottles/cans Cup A 10.00 1 1/4 cupsW 12.00 1 1/2 cupsC 16.00 2 cupsW 12.00 1 1/2 cupsA 10.00 1 1/4 cupsS 06.00 3/4 cup
Meat Mounds Cup H 01.50 3 tbls.
Y 03.00 3/8 cupS 06.00 3/4 cupC 16.00 2 cupsU 31.00 4 cups
French Bread Unit UNIT 34 gms.
Butter /Margarinepat Cup E 00.20 1 tsp.
Pie Cup D 04.00 1/2 cupQ 05.00 5/8 cup
:135

126
ModelType
MeasureAlphabetic
Code
NumericEquivalent
ApproximateHouseholdMeasurementEquivalent
Discs Cup E 00.20 1 tsp.
M 00.30 1/2 tbls.
CC 00.50 1 tbls.
MM 00.60 1 1/4 tbls.
G 01.00 2 cbls.
H 01.50 3 tbls.
Boxes Cup A 10 1 1/4 cups.35A 3.5 1/2 cup
0.5C 07.5 1 cup
Other standard measurements and the abbreviation codes accepted by the
computer program are:
Gram GMOunce OZ
Pint PT
Quart QTPound LBCup CUPUnit UNIT
These abbreviations and the model alphabetic codes are the
only acceptable ways that foods may be recorded. Do not use a period
after the abbreviation.
Reported intake will not always correspond to the exact size
of the model. Detailed, specific rules for recording intake appear in
part D. However, some general rules specifically related to the models
are:
1. Glasses (B, V, Q) Marks are placed at the 1/4, 1/2, and 3/4 volume
level. The top mark shows the full volume of the glass as
1Unlike all other models, the discs do not demonstrate thickness
or depth. YOU MUST USE THE RULER PROVIDED AND RECORD THE THICKNESS(see page 108 item 3).

127
it is considered by the computer. Example: Glass Model B at the full
level mark, is 1 3/8 cups, not if it is full "to the brim."
2. Meat (C, U) Lines appear on the sides of these models. They represent
1/4, 1/2, 3/4 and 4/4 of the thickness. These lines will be needed
should the respondent state amount consumed was different thickness
from the model.
3. Ruler for Discs - This model is to assist with dimensions or with
disc models should thickness of the food consumed--as estimated b7
the disc--be other than 1/8 inch. The three-inch ruler is marked in
inches and also 1/8 inch units. Along the side marked with inches,
there are 1/4, 1/2, and also 3/4 inch markings. Note that a "2" is
by the 1/4 inch marking. This implies 2 units of 1/8 inch, since the
disc is based on 1/8 inch thickness.
4. Boxes These models are for use in estimating quantities of foods
usually served in these dimensions, such as cakes, pies, etc.
D. RECORDING AND CODING THE 24-HOUR FOOD INTAKE
This section is reproduced below for easy referral:
(Numbers in parentheses refer to columns for card punching.)
Inges-tionPeriodCode
Food Codes Food and BeverageConsumed
Number and Size ofServings
Bone orotherrefuseincluded?1 = yesI- II III
(8) (9) (10) (11) (12)Food Item Descrip-tion
(14-19) (20-24) (25-30) (31)
..._

128
Step 1: Ingestion Period
Record ingestion period code each
time you move to a different meal.
1 = AM (breakfast)2 = Noon (lunch)3 = Between Meals4 = PM (dinner or
supper)
Step 2: The enumerator (interviewer) skips this item. The 4 digit food
code (from USDA Handbook 8) for each food item is inserted later
by a specially trained person.
Step 3: Food Item and Description Column
Record in these columns the exact food or beverage consumed.
a. Name of item
b. Description (raw, dry, frozen edible portion or as purchased)
c. Preparation method (fried, broiled)
d. Major ingredients (if a mixed dish)
Step 4: Work Area for Computations (if needed)
Use work area to enter any necessary information to describe the
item and the probable amount if the specific amount cannot be
entered in Item I immediately. For example, the food item is re-
ported to be the size of several different models; time consuming
calculation can be left until later--or--respondent cannot estimate
size by one of the "acceptable models," necessitating additional
later calculations.
Step 5: Size of Serving (Items I, II, and III)
These items determine the basis on which the nutrient intakes are
calculated.
a. Item I under size of serving
This column is to be used to record the number of units or
:138

129
portion of a unit consumed. This shall always be a numeric
entry. The numbers recorded here may be integers or decimal
fractions.
Examples: 1 (Integer)
0.50 (Decimal Fraction)
Coding the recorded numeric entry
(1) All integers must be recorded with a trailing
decimal.
Example: 1.0
(2) All decimal fractions must be recorded with leading
zero and decimal point clearly marked.
Example: 0.50
b, Item II Under size of serving
This space is used to record the model letter code or
abbreviation cLde which describes the measure of the food
item consumed. This should always be an alphabetic entry.
The possible acceptable entries are:
MODEL CODES
A. S (Cups)
B, V, Q (Glasses)
SS, CC, M, E (Spoons)
C, S, Z, J (Mounds)
A, W, C, S (Bottles/cans)
H, S, C, U, Y (Meat Mounds)
E (Butter)
D, Q (Pie)
E, M, G, H, CC, MM (Discs)
139

130
ABBREVIATION CODES OTHER CODES
GM = grams CUPOZ = ounce UNITPT = pintsQT = quartsLB = pounds
Examples of data which may be recorded in Item II:
RESPONSE RECORD
Serving was rice model Z
Serving was one apple UNIT
c. Item III under size of serving
This space is used to modify the number of units or portion
of a unit consumed which was recorded in Items I and II.
In general, Item III is not used frequently. If respondent
changes answer, rather than erasing in either Item I or II,
use Item III for modifications.
(1) Amount prepared to amount consumed (left-over).
Respondent indicates that 5 pound beef roast was put
on table but half of it (50%) was not consumed.
Modifications to be recorded in Item III:
0.50 for 1/2 the amount, etc.
(2) Thickness of disc model is greater than 1/8 inch.
If respondent indicates the thickness was 1/2 inch
thick or "4" on the ruler, record 4 in Item III.
(3) Household serving to individual amount when models
are not applicable.
Respondent states that about 1/2 of the beef stew
prepared for the household unit was eaten: Total
prepared was 1 QT. Record: 0.5 under Item III.
131
(4) When the food item contains some refuse (e.g. meat with
the bone in, apple core and seeds, etc.), a "1" is
written in the far right column of the table. This
code directs the program to automatically reduce the
amounts by the percent of refuse given in Handbook 8,
Table 2.
X41
APPENDIX B.
EQUATIONS (1.02 to 1.11) WITH NUTRIENT ADEQUACY RATIOS
AS DEPENDENT VARIABLE
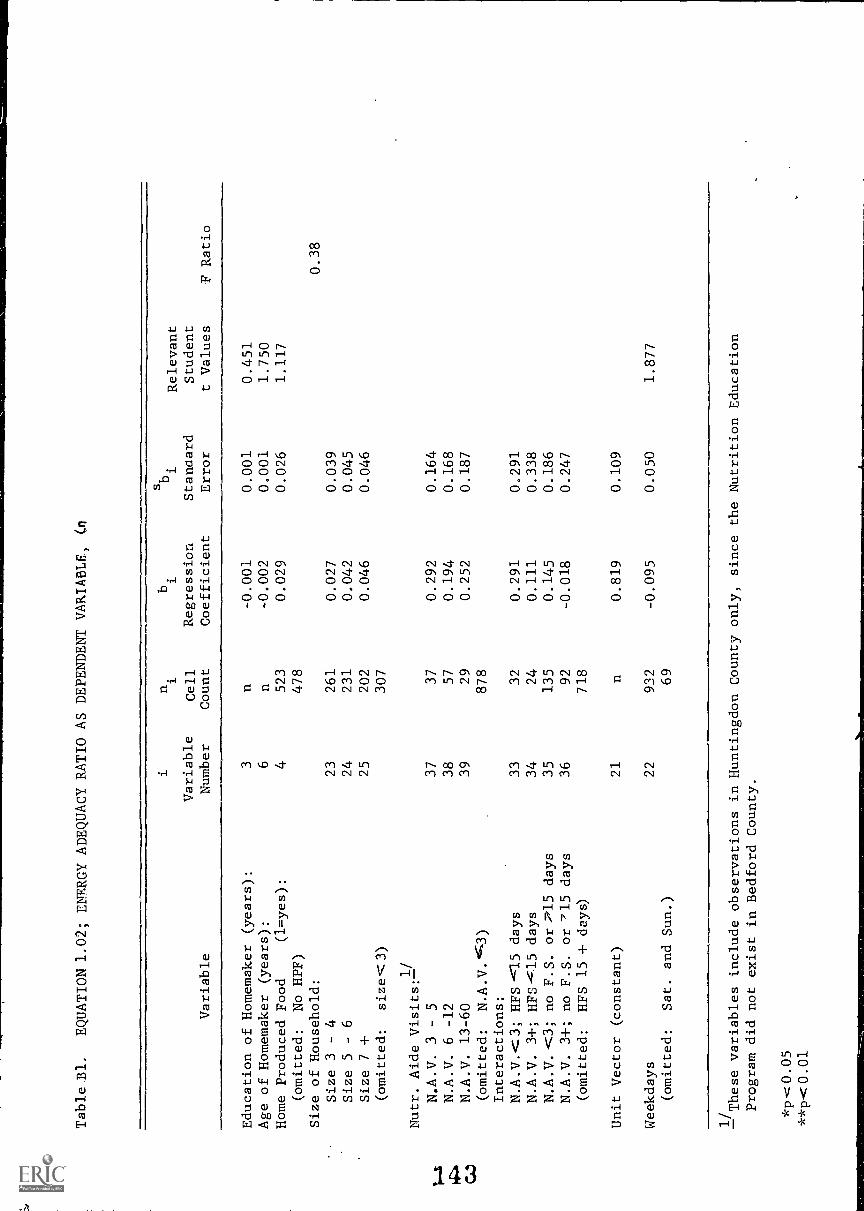
Table .B1.
EQUATION 1.02; ENERGY ADEQUACY RATIO AS DEPENDENT VARIABLE,
(n
Variable
i
Variable
Number
n. 1
Cell
Count
b1
Regression
Coefficient
s. 1
Standard
Error
Relevant
Student
t Values
F Ratio
Education of Homemaker (years):
Age of Homemaker (years):
Home Produced Food
(1=yes):
(omitted:
No HPF)
Size of Household:
Size 3 - 4
Size 5
- 6
Size 7 +
(omitted:
size
3)
3 6 4
23
24
25
523
478
261
231
202
307
-0.001
-0.002
0.029
0.027
0.042
0.046
0.001
0.001
0.026
0.039
0.045
0.046
0.451
1.750
1,117
0.38
Nutr. Aide Visits:1/
N.A.V. 3 - 5
37
37
0.292
0.164
N.A.V. 6 -12
38
57
0.194
0.168
N.A.V. 13-60
39
29
0.252
0.187
(omitted:
N.A.V.44.43)
878
Interactions:
N.A.V.<:3; HFS-<15 days
33
32
0.291
0,291
N.A.V. 3+; HFS x'.15 days
34
24
0.111
0.338
N.A.V.-<3; no F.S. or :15
days
35
135
0.145
0.186
N.A.V. 3+; no F.S. or X15
days
36
92
-0.018
0.247
(omitted:
HFS 15 + days)
718
Unit Vector (constant)
21
n0.819
0.109
Weekdays
22
932
-0.095
0.050
1.877
(omitted:
Sat. and Sun.)
69
1/These variables include observations in Huntingdon County only, since the Nutrition Education
Program did not exist in Bedford County.
**p<0.01
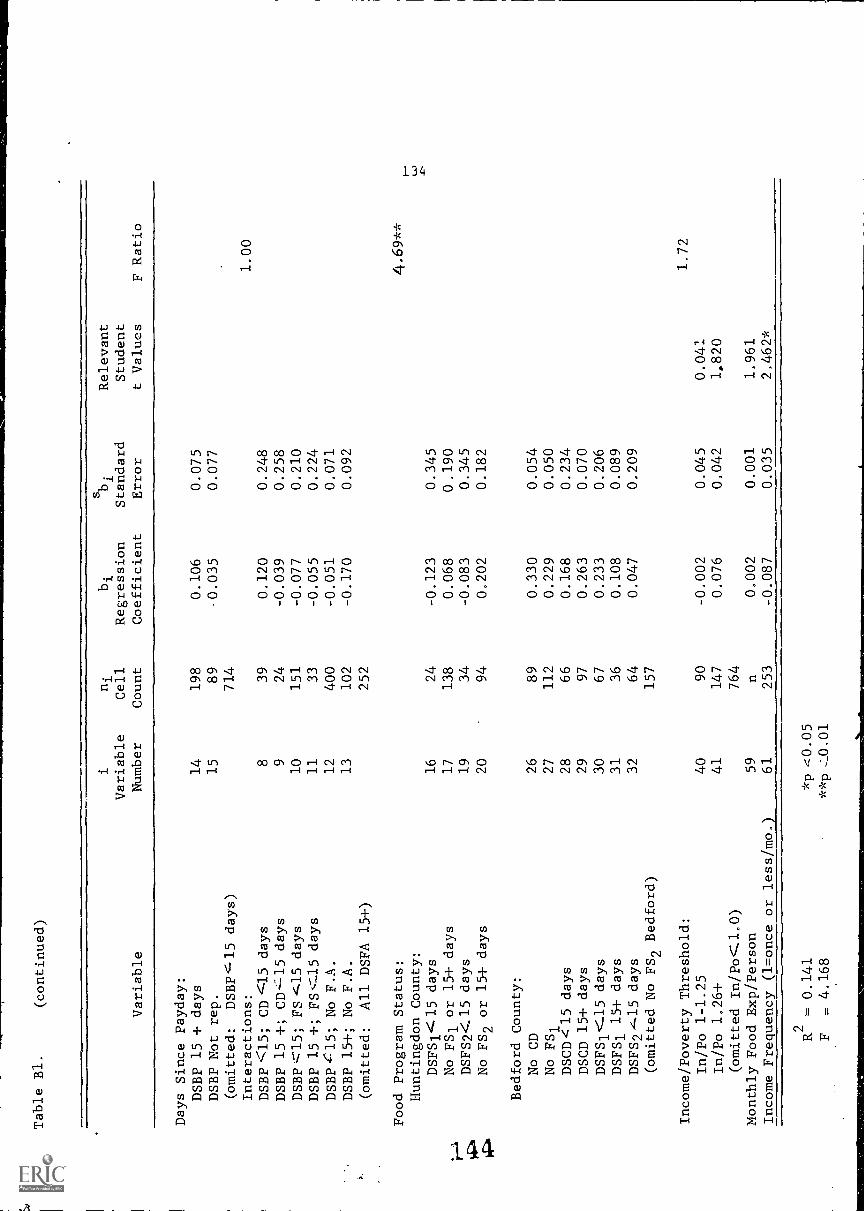
Table Bl.
(continued)
Variable
i
Variable
Number
ni
Cell
Count
bi
Regression
Coefficient
sb. 1
Standard
Error
Relevant
Student
t Values
F Ratio
Days Since Payday:
DSBP 15 + days
14
198
0.106
0.075
DSBP Not rep.
15
89
-0.035
0.077
(omitted:
DSBP<-15 days)
714
Interactions:
1.00
DSBP <15; CD '="15 days
839
0.120
0.248
DSBP 15 +; CD-=-15 days
924
-0.039
0.258
DSBP4:715; FS <15 days
10
151
-0.077
0.210
DSBP 15 +; FS.,-Z.15 days
11
33
-0.055
0.224
DSBP X15; No F.A.
12
400
-0.051
0.071
DSBP 15+; No F.A.
13
102
-0.170
0.092
(omitted:
All DSFA 15+)
252
Food Program Status:
4.69**
Huntingdon County:
DSFS14:15 days
16
24
-0.123
0.345
*r--'
No FS1 or 15+ days
17
138
0.068
0.190
14;g`
DSFS2<:15 days
19
34
-0.083
0.345
1,P
No FS2 or 15+ days
20
94
0.202
0,182
Bedford County:
No CD
26
89
0.330
0.054
No FS1
27
112
0.229
0.050
DSCD< 15 days
28
66
0.168
0.234
DSCD 15+ days
29
97
0.263
0.070
DSFS1<15 days
30
67
0.233
0.206
DSFS1 15+ days
31
36
0.108
0.089
DSFS24=15 days
32
64
0.047
0.209
(omitted No FS2 Bedford)
157
Income/Poverty Threshold:
1.72
In/Po 1-1.25
40
90
-0,002
0.045
0.041
In/Po 1.26+
41
147
0.076
0,042
1.820
(omitted In/Po.1.0)
764
Monthly Food Exp/Person
59
n0.002
0,001
1,961
Income Frequency (1=once or less/mo.)
61
253
-0,087
0.035
2,462*
R2= 0.141
F= 4.168
*p
**p
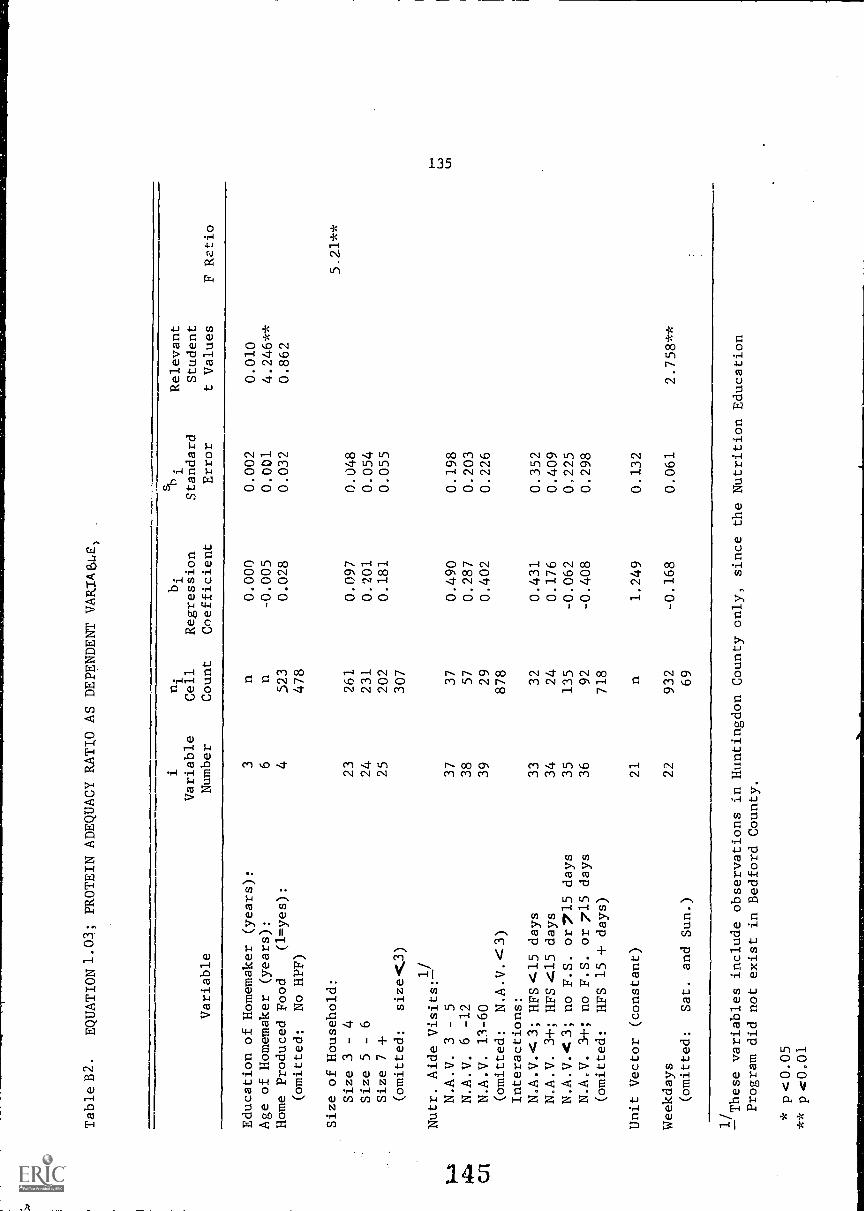
Table B2.
EQUATION 1.03; PROTEIN ADEQUACY RATIO AS DEPENDENT VARIABLE)
Variable
i
Variable
Number
ni
Cell
Count
bi
Regression
Coefficient
shi
Standard
Error
Relevant
Student
t Values
F Ratio
Education of Homemaker (years):
3n
0.000
0.002
0.010
Age of Homemaker (years):
6n
-0.005
0.001
4.246**
Home Produced Food
(1=yes):
4523
0.028
0.032
0.862
(omitted:
No HPF)
478
Size of Household:
5.21**
Size 3 - 4
23
261
0.097
0.048
Size 5 - 6
24
231
0.201
0.054
Size 7 +
25
202
0.181
0.055
(omitted:
size <.3)
307
Nutr. Aide Visits:lj
)....1
N.A.V. 3 - 5
37
37
0.490
0.198
WZI.
N.A.V. 6 -12
38
57
0.287
0.203
C.51
N.A.V. 13-60
39
29
0.402
0.226
(omitted:
N.A.V.4C3)
878
Interactions:
N.A.V.4:3; HFS <15 days
33
32
0.431
0.352
N.A.V. 3+; HFS <15 days
34
24
0.176
0.409
N.A.V.4:3; no F.S. or715 days
35
135
-0.062
0,225
N.A.V. 3 +; no F.S. or 715 days
36
92
-0.408
0.298
(omitted:
HFS 15 + days)
718
Unit Vector (constant)
21
n1.249
0,132
Weekdays
22
932
-0.168
0.061
2.758**
(omitted:
Sat. and Sun.)
69
'These
variables include observations in Huntingdon County only, since the Nutrition Education
Program did not exist in Bedford County.
* p <0.05
** p <0.01
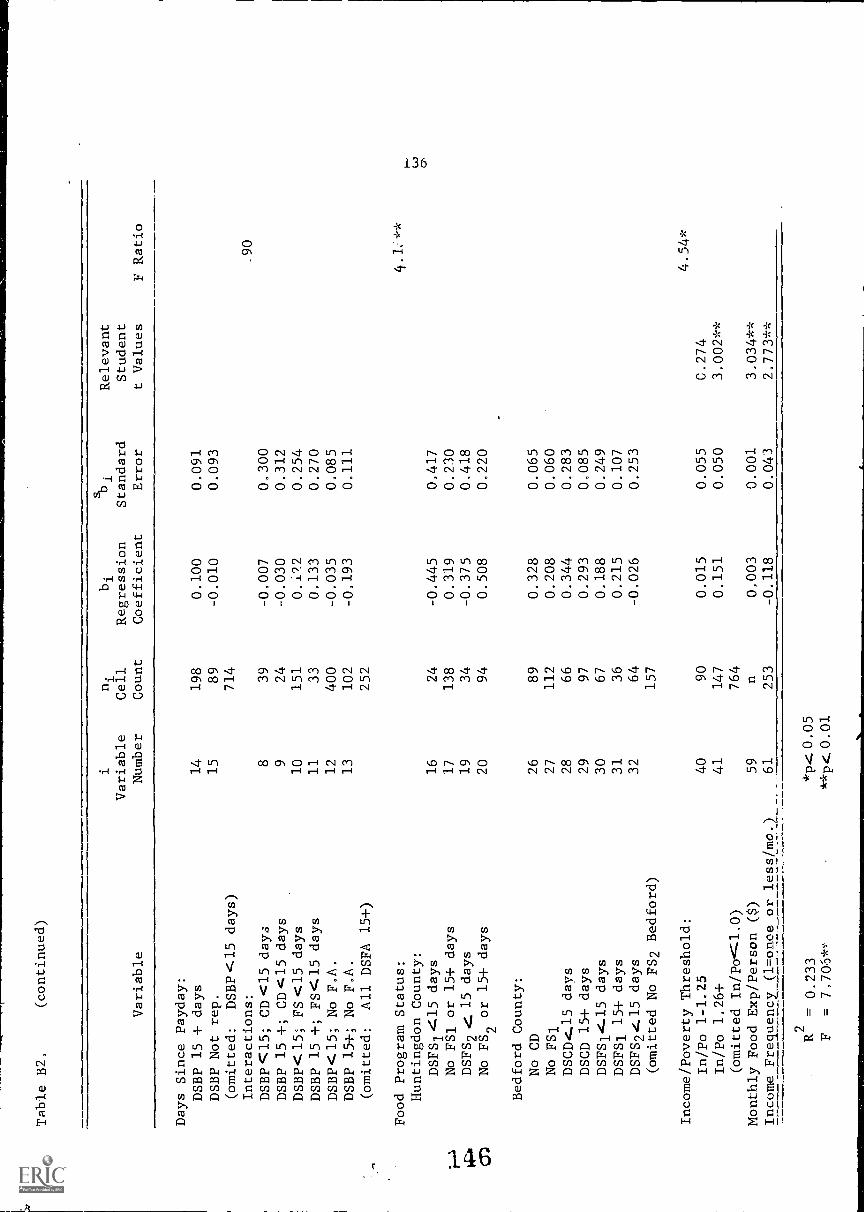
Table B2,
(continued)
Variable
iVariable
Number
ni
Cell
Count
bi
Regression
Coefficient
sbi
Standard
Error
Relevant
Student
t Values
F Ratio
Days Since Payday:
DSBP 15 + days
14
198
0.100
0,091
DSBP Not rep.
15
89
-0.010
0,093
(omitted:
DSBP<15 days)
714
Interactions:
.90
DSBP c15; CD <15 days
839
-0,007
0.300
DSBP 15 +; CD <15 days
924
-0.030
0.312
DSBP<:15; FS <15 days
10
151
0..02
0,254
DSBP 15 +; FS.15 days
11
33
0.133
0.270
DSBP4:15; No F.A.
12
400
-0.035
0.085
DSBP 15+; No F.A.
13
102
-0.193
0.111
(omitted:
All DSFA 15+)
252
Food Program Status:
Huntingdon County:
DSFS1 <15 days
16
24
-0,445
0,417
.r.-1
No FS1 or 15+ days
17
138
0.319
0.230
W-6
DSFS2 4: 15 days
19
34
-0.375
0,418
0")
No FS2or 15+ days
20
94
0.508
0.220
Bedford County:
No CD
26
89
0.328
0.065
No FSl
27
112
0.208
0.060
DSCD4:..15 days
28
66
0.344
0.283
DSCD 15+ days
29
97
0.293
0.085
D5F514-15 days
30
67
0.188
0.249
DSFS1 15+ days
31
36
0.215
0.107
DSFS24.15 days
32
64
-0.026
0.253
(omitted No FS2 Bedford)
157
Income/Poverty Threshold:
4.54
*In/Po 1-1.25
40
90
0.015
0.055
C.274
In/Po 1,26+
41
147
0.151
0.050
3.002**
(omitted In/Po.<-1,0)
764
Monthly Food Exp/Person ($)
59
n0,003
0.00
13.034**
Income Frequency, (1=onoe or less/mo.)
61
253
-0,118
0.043
2,773**
R2= 0.233
F= 7,70,5*='
*p<
0.0
5**
134.
0.0
1

Table B3.
EQUATION 1.04; CALCIUM ADEQUACY RATIO AS DEPENDENT VARZAgL46,
(17=2001)
Variable
i
Variable
Number
ni
Cell
Count
bi
Regression
Coefficient
sbli
Standard
Error
Relevant
Student
t Values
F Ratio
Education of Homemaker (years):
Age of Homemaker (years):
Home Produced Food
(1=yes):
(omitted:
No HPF)
Size of Household:
Size 3 - 4
Size 5 - 6
Size 7 +
(omitted:
size4:3)
3 6 4
23
24
25
n n 523
478
261
231
202
307
-0,001
-0.002
0.004
0.046
0.039
0.048
0,002
0,001
0.029
0.043
0.049
0.050
0.522
1,815
0,155
0,44
;.-.1
Nutr. Aide Visits:1/
14::t
N.A.V. 3 - 5
37
37
0,388
0.178
'"..i
N.A.V. 6 -12
38
57
0.322
0.182
N.A.V. 13-60
39
29
0,426
0.202
(omitted:
N.A.V.<3)
878
Interactions:
N.A.V.< 3; HFS <15 days
33
32
0.298
0.316
N.A.V. 3+; HFS <15 days
34
24
0.022
0.367
N.A.V.<3; no F.S. ori715
days
35
135
0.129
0,202
N.A.V. 3+; no F.S. or >15
days
36
92
-0.123
0.268
(omitted:
HFS 15 + days)
718
Unit Vector (constant)
21
n0.637
0.118
Weekdays
22
932
-0.080
0.055
1.462
(omitted:
Sat. and Sun.)
69
1/These variables include observation in Huntingdon County only, since the Nutrition Education
Program did not exist in Bedford County.
*p< 0.05
**p< 0.01

Table B3,
(continued)
Variable
Variable
Number
ni
Cell
Count
bi i
Regression
Coefficient
sbi
Standard
Error
Relevant
Student
t Values
F Ratio
Days Since Payday:
DSBP 15 + days
14
198
0.161
0,082
DSBP Not rep.
15
89
0.033
0,083
(omitted:
DSBP<15 days)
714
Interactions:
1.66
DSBP<15; CD<15 days
839
0.338
0,269
DSBP 15 +; CD4:15 days
924
-0,057
0.280
DSBP
15; FS <15 days
10
151
-0.063
0.228
DSBP 15 +; FS.4:15 days
11
33
-0.132
0.243
DSBP< 15; No F.A.
12
400
0.079
0.077
DSBP 15+; No F.A.
13
102
-0.071
0.100
(omitted:
All DSFA 15+)
252
Food Program Status:
3.26**
Huntingdon County:
DSFS14:15 days
16
24
-0.195
0.375
No FS' or 15+ days
17
138
0.041
0.206
DSFS24:15 days
19
34
-0.042
0.375
1....1
No FS2 or 15+ days
20
94
0.149
0,198
P' CC
Bedford County:
No CD
26
89
0.241
0.059
No FS1
27
112
0.158
0.054
DSCD...15 days
28
66
-0.005
0,254
DSCD 15+ days
29
97
0.242
0.076
DSFS1e-15 days
30
67
0.352
0,224
DSFS1 15+ days
31
36
0.252
0.096
DSFS2.<15 days
32
64
0.127
0.227
(omitted No FS2 Bedford)
157
Income/Poverty Threshold:
3.35*
In/Po 1-1.25
40
90
-0.013
0,049
0.258
In/Po 1.26+
41
147
0,113
0,045
2.489*
(omitted In/Po<1.0)
764
Monthly Food Exp./Person ($)
59
n0.001
0,001
1.401
Income Frequency (1=once or less/mo.)
61
253
-0.085
0,038
2.208*
R2
= 0,126
F= 3.660**
*p< 0,05
**p< 0,01

Table B4.
EQUATION 1.05; PHOSPHORUS ADEQUACY RATIO AS DEPENDENT VARIABLE (m=1Doi)
Variable
Variable
Number
ni
Cell
Count
bi
Regression
Coefficient
16i
Standard
Error
Relevant
Student
t Values
F Ratio
Education of Homemaker (years):
3n
-0.000
0.002
0.125
Age of Homemaker (years):
6n
-0.002
0.001
2.029*
Home Produced Food
(1=yes):
4523
0.030
0.032
0.942
(omitted:
No HPF)
478
Size of Household:
0.28
Size 3 - 4
23
261
-0.010
0.047
Size 5 - 6
24
231
-0.008
0.054
Size 7 +
25
202
-0.043
0.055
(omitted:
size<3)
307
Nutr. Aide
Vis
its:1
/
N.A.V. 3
- 5
37
37
0.435
0.197
N.A.V. 6 -12
38
57
0.196
0.202
N.A.V. 13-60
39
29
0.348
0.225
(omitted:
N.A.V. 4:3)
878
Interactions:
N.A.V.0 3; HFS4:15 days
33
32
0.364
0.351
N.A.V. 3+; HFS<15 days
34
24
0.199
0.408
N.A.V.4.3; no F.S. or715 days
35
135
-0.138
0.224
N.A.V. 3+; no F.S. or 715 days
36
92
-0.349
0.297
(omitted:
HFS 15 + days)
718
Unit Vector (constant)
21
n1.115
0.131
Weekdays
22
932
-0.158
0.061
2.601**
(omitted:
Sat. and Sun.)
69
'These
These variables include observations in Huntingdon County only, since the Nutrition Education
Program did not exist in Bedford County.
*p<
0.05
**p< 0.01
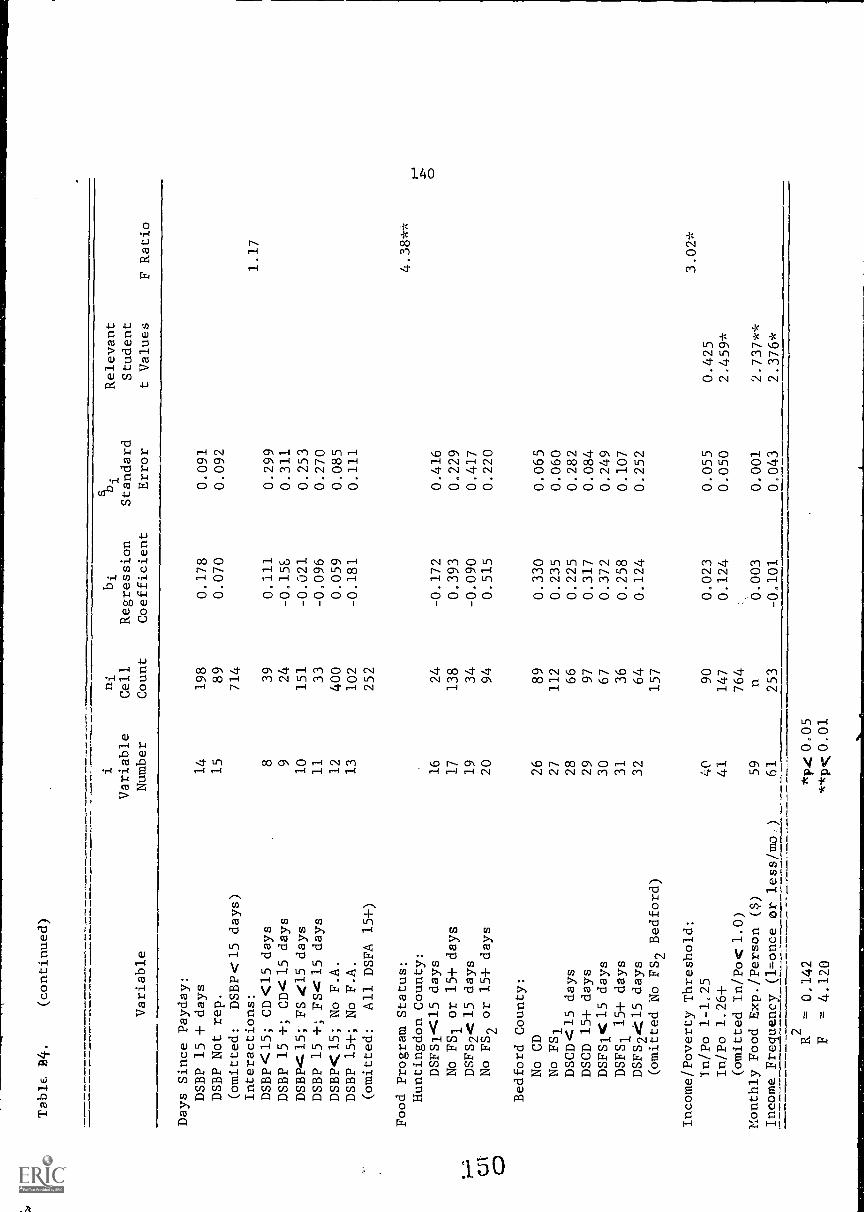
Table 134.
(continued)
Variable
i
Variable
Number
ni
Cell
Count
bi
Regression
Coefficient
9bi
Standard
Error
Relevant
Student
t Values
F Ratio
Days Since Payday:
DSBP 15 + days
14
198
0.178
0,091
DSBP Not rep.
15
89
0.070
0.092
(omitted:
DSBP.<15 days)
714
Interactions:
1.17
DSBP4C15; CD <15 days
839
0.111
0.299
DSBP 15 +; CD4:15 days
924
-0,158
0.311
DSBP47.15; FS <15 days
10
151
-0.021
0.253
DSBP 15 +; FS4:15 days
11
33
-0.096
0.270
DSBP4:15; No F.A.
12
400
0.059
0.085
DSBP 15+; No F.A.
13
102
-0.181
0.111
(omitted:
All DSFA 15+)
252
Food Program Status:
4.38**
Huntingdon County:
DSFS1 <15 days
16
24
-0.172
0.416
No FS1 or 15+ days
17
138
0.393
0,229
1---1
DSFS2< 15 days
19
34
-0.090
0.417
CJI
No FS2or 15+ days
20
94
0.515
0.220
0Bedford County:
No CD
26
89
0.330
0.065
No FS1
27
112
0.235
0.060
DSCD<C15 days
28
66
0.225
0.282
DSCD 15+ days
29
97
0.317
0.084
DSFS14:15 days
30
67
0.372
0.249
DSFS1 15+ days
31
36
0.258
0.107
DSFS2415 days
32
64
0.124
0.252
(omitted No FS2 Bedford)
157
Income/Poverty Threshold:
3.02*
In/Po 1-1.25
40
90
0.023
0.055
0.425
In/Po 1.26+
41
147
0.124
0.050
2.459*
(omitted In/Po<1.0)
764
Monthly Food Exp./Person ($)
59
n0,003
0,001
2.737**
Income Frequency (1=once or less/mo
61
253
-0,101
0,043
2.376*
R2= 0.142
F= 4.120
tcp.
<0:
05**km 0.01

Table B5.
EQUATION 1.06;'IRON ADEQUACY RATIO AS DEPENDENT VARIABLE, (n=-1001)
Variable
Variable
Number
ni
Cell
Count
bi
Regression
Coefficient
sbi
Standard
Error
Relevant
Student
t Values
F Ratio
Education of Homemaker (years):
Age of Homemaker (years):
Home Produced Food
(1=yes):
(omitted:
No HPF)
Size of Household:
Size 3 - 4
Size 5 - 6
Size 7 +
(omitted:
size4:3)
3 6 4
23
24
25
n n
523
478
261
231
202
307
-0.001
0.003
0.096
-0.058
-0.023
0.003
0.002
0.001
0.028
0.042
0.048
0.049
0.791
2.814**
3.371**
1.02
Nutr. Aide Visits:1/
N.A.V. 3 - 5
37
37
0.312
0.176
.:.s
N.A.V. 6 -12
38
57
-0.003
0.180
CA
N.A.V. 13-60
39
29
0.140
0.201
(omitted:
N.A.V.4=3)
878
°1
Interactions:
N.A.V.<3; HFS4.1:15 days
33
32
0.435
0.313
N.A.V. 3+; HFS .15 days
34
24
0.355
0.364
N.A.V.<3; no F.S. or715 days
35
135
-0.317
0.200
N.A.V. 3+; no F.S. or715 days
36
92
-0.456
0.265
(omitted:
HFS 15 + days)
718
Unit Vector (constant)
21
n0.761
0.117
Weekdays
22
932
-0.100
0.054
1.837
(omitted:
Sat. and Sun.)
69
'These
These variables include observations in Huntingdon County only, since the Nutrition Education
Program did not exist in Bedford County.
*p< 0.05
**p< 0.01

Table B5.
(continued)
Variable
Variable
Number
ni
Cell
Count
bi
Regression
Coefficient
sbi
Standard
Error
Relevant
Student
t Values
F Ratio
Days Since Payday:
DSBP 15 + days
14
198
0.080
0.081
DSBP Not rep.
15
89
-0.113
0.082
(omitted:
DSBP '15 days)
714
Interactions:
2.48*
DSBP< 15; CD <15 days
839
-0.005
0.266
DSBP 15 +; CD <15 days
924
-0.131
0.277
DSBP<:15; FS C15 days
10
151
-0.150
0.226
DSBP 15 +; FS4C15 days
11
33
-0.043
0.241
DSBP <15; No F.A.
12
400
-0.178
0.076
DSBP 15+; No F.A.
13
102
-0.297
0.099
(omitted:
All DSFA 15+)
252
Food Program Status:
4.54**
Huntingdon County:
DSFS
15 days
14:
16
24
-0.297
0.371
No FS1 or 15+ days
17
138
0.555
0.205
1-- 1
DSFS24:15 days
No FS2 or 15+ days
19
20
34
94
-0.183
0.760
0.372
0.196
CJI
Bedford County:
No CD
26
89
0.279
0.058
No FS1
27
112
0.194
0.054
DSCD <15 days
28
66
0.138
0.252
DSCD 15+ days
29
97
0.139
0.075
DSFS14:15 days
30
67
0.116
0.222
DSFS1 15+ days
1DSFS2dc15 days
31
32
36
64
-0.081
0.045
0.095
0.225
(omitted No FS2 Bedford)
157
Income/Poverty Threshold:
2 26
In/Po 1 -1,25
40
90
0.048
0.049
0.974
In/Po 1.26+
41
147
0.091
0.045
2.030*
(omitted In /Po< 1.0)
764
Monthly Food Exc./Person ($)
59
n0.003
0.001
3,204**
Income Frequency (1=once or less/m
61
253
-0.078
0.038
2.050*
R2=0,149
F=4.42**
*p
0.05
**pc 0.01

Table B6..
EQUATION 1-..07,;':VITAMIN A ADEQUACY RATIO..AS DEPENDENT
001
Variable
i
Variable
Number
ni
Cell
Count
b.;
Regression
Coefficient
bi
Standard
Error
Relevant
Student
t Values
F Ratio
Education of Homemaker (years):
3n
-0.001
0.002
0.555
Age of Homemaker (years):
6n
-0.004
0.001
2.854**
Home Produced Food
(1=yes):
4523
0.094
0.038
2.515*
(omitted:
No HPF)
478
Size of Household:
0.90
Size 3 - 4
23
261
-0.024
0.056
Size 5 - 6
24
231
0.023
0.064
Size 7 +
25
202
0.067
0.065
(omitted:
size< 3)
307
1Nutr. Aide
Visits:-I
N.A.V. 3 - 5
37
37
0.346
0.233
N.A.V. 6 - 12
38
57
0.382
0.239
N.A.V. 13-60
39
29
0.628
0.265
(omitted:
N.A.V.4:3)
878
Interactions:
N.A.V143; HFS4:15 days
33
32
0.586
0.414
N.A.V. 3+; HFS4:15 days
34
24
0.126
0.482
N.A.V.. 3; no F.S. or 715 days
35
135
-0.472
0.265
N.A.V. 3+; no F.S. or-715 days
36
92
-0.834
0.351
(omitted:
HFS 15 + days)
718
Unit Vector (constant)
21
n0.919
0.155
Weekdays
22
932
0.016
0.072
0.216
(omitted:
Sat, and Sun.)
69
11These variables include observations in Huntingdon County only, since the Nutrition Education
Program did not exist in Bedford County.
*p.0.05
**p<0.01

Table B6.
(continued)
Variable
Variable
Number
ni
Cell
Count
bi
Regression
Coefficient
sb.
Stajdard
Error
Relevant
Student
t Values
F Ratio
Days Since Payday:
DSBP 15 + days
DSBP Not rep.
(omitted:
DSBP< 15 days)
14
15
198
89
714
0.059
-0.070
0.107
0.109
Interactions:
1.17
DSBP4:15; CD4:15 days
839
0.352
0.352
DSBP 15 +; CD4L15 days
924
0.089
0.367
DSBP<:15; FS <15 days
10
151
0.011
0.299
DSBP 15 +; FS.c..15 days
11
33
0.000
0.318
DSBP4:15; No F.A.
12
400
-0.151
0.100
DSBP 15+; No F.A.
13
102
-0.186
0.131
(omitted:
All DSFA 15+)
252
Food Program Status:
1.76
Huntingdon County:
DSFS1..15 days
16
24
-0.577
0.491
No FS1 or 15+ days
17
138
0.669
0.270
i---1
DSFS24:15 days
19
34
-0.567
0.492
CJ1
)4Ze.
No FS2 or 15+ days
20
94
0.615
0.259
Bedford County:
No CD
26
89
0.142
0.077
No FS1
27
112
0.184
0.071
DSCD .15 days
28
66
-0.204
0.333
DSCD 15+ days
29
97
0.039
0.100
DSFS1<.15 days
30
67
0.031
0.293
DSFS1 15+ days
1ay
31
36
-0.079
0.126
DSFS24:15 days
32
64
-0.122
0.298
(omitted No FS2 Bedford)
157
Income/Poverty Threshold:
3.27**
In/Po 1-1.25
40
90
-0.143
0.065
2.207*
In/Po 1.26+
41
147
0.052
0.059
0.879
(omitted In/Po4:1,0)
764
Monthly Food Exp./Person
59
n0,001
0.001
1.104
Income Frequency (1=once or less/mo_l
61
253
-0.061
0.050
1.207
R2= 0.080
*p<-0,05
F= 2.205
**p< 0,01

Table B7.
EQUATION 1.08; THIAMIN ADEQUACY RATIO AS DEPENDENT VARIABLE, (n=1001)
Variable
i
Variable
Number
ni
Cell
Count
bi
Regression
Coefficient
sbi
Standard
Error
Relevant
Student
t Values
F Ratio
Education of Homemaker (years):
3n
-0.002
0.002
1.102
Age of Homemaker (years):
6n
-0.003
0.001
2.363*
Home Produced Food
(1=yes):
4523
0.053
0.032
1.665
(omitted:
No HPF)
478
Size of Household:
2.07
Size 3 - 4
23
261
0.030
0.048
Size 5 - 6
24
231
0.106
0.055
Size 7 +
25
202
0.115
0.056
(omitted:
sizes:3)
307
Nutr. Aide Visits: -1/
N.A.V. 3 - 5
37
37
0.350
0.199
N.A.V. 6 -12
38
57
0.075
0.204
N.A.V. 13-60
39
29
0.078
0.227
(omitted:
N.A.V.4:3)
878
Interactions:
N.A.V...4 3; HFSA:15 days
33
32
0.453
0.354
N.A.V. 3+; HFS4415 days
34
24
0.289
0.412
N.A.V.< 3; no F.S. or 715 days
35
135
-0.115
0.227
N.A.V. 3+; no F.S. or
days
36
92
-0.198
0.300
(omitted:
HFS 15 + days)
718
Unit Vector (constant)
21
n0.950
0.133
Weekdays
22
932
-0.092
0.061
1.504
(omitted:
Sat. and Sun.)
69
1 -/These
variables include observations in Huntingdon County only, since the Nutrition Education
Program did not exist in Bedford County.
*p<0.05
**p<0.01

Table B7.
(continued)
Variable
i
Variable
Number
n. 1
Cell
Count
bi
Regression
Coefficient
sbi
Standard
Error
Relevant
Student
t Values
F Ratio
Days Since Payday:
DSBP 15 + days
14
198
0.086
0.091
DSBP Not rep.
15
89
0.020
0.093
(omitted:
DSBP1t15 days)
714
Interactions:
1.57
DSBP<:15; CD<:15 days
839
-0.200
0.301
DSBP 15 +; CD4.15 days
924
-0.265
0.314
DSBP<15; FS <15 days
10
151
-0.098
0.256
DSBP 15 +; FS <15 days
11
33
-0.047
0.272
DSBP <15; No F.A.
12
400
-0.029
0.086
DSBP 15+; No F.A.
13
102
-0.245
0.112
(omitted:
All DSFA 15+)
252
Food Program Status:
2.85**
Huntingdon County:
DSFS14.15 days
16
24
-0.316
0.420
No FS1 or 15+ days
17
138
0.385
0.231
DSFS24.15 days
19
34
-0.152
0.421
No FS2 or 15+ days
20
94
0.433
0.222
Bedford County:
No CD
26
89
0.286
0.066
No FS1
27
112
0.195
0.061
DSCD<=15 days
28
66
0.363
0.285
DSCD 15+ days
29
97
0.211
0.085
DSFSi<7.15 days
30
67
0.360
0.251
DSFS1 15+ days
31
36
0.131
0.108
DSFS2<:15 days
32
64
0.136
0.255
(omitted No FS2 Bedford)
157
Income/Poverty Threshold:
1.51
In/Po 1-1.25
40
90
0.084
0.055
1.522
In/Po 1.26+
41
147
0.055
0.051
1.090
(omitted In/Poct1.0)
764
Monthly Food Exp./Person
59
n0.003
0.001
2.436*
Income Frequency (1=once or less/mo.)
61
253
-0.069
0.043
1.601
R2
= 0.134
*p< 0.05
F= 3.937**
-A-p
iC 0
.01
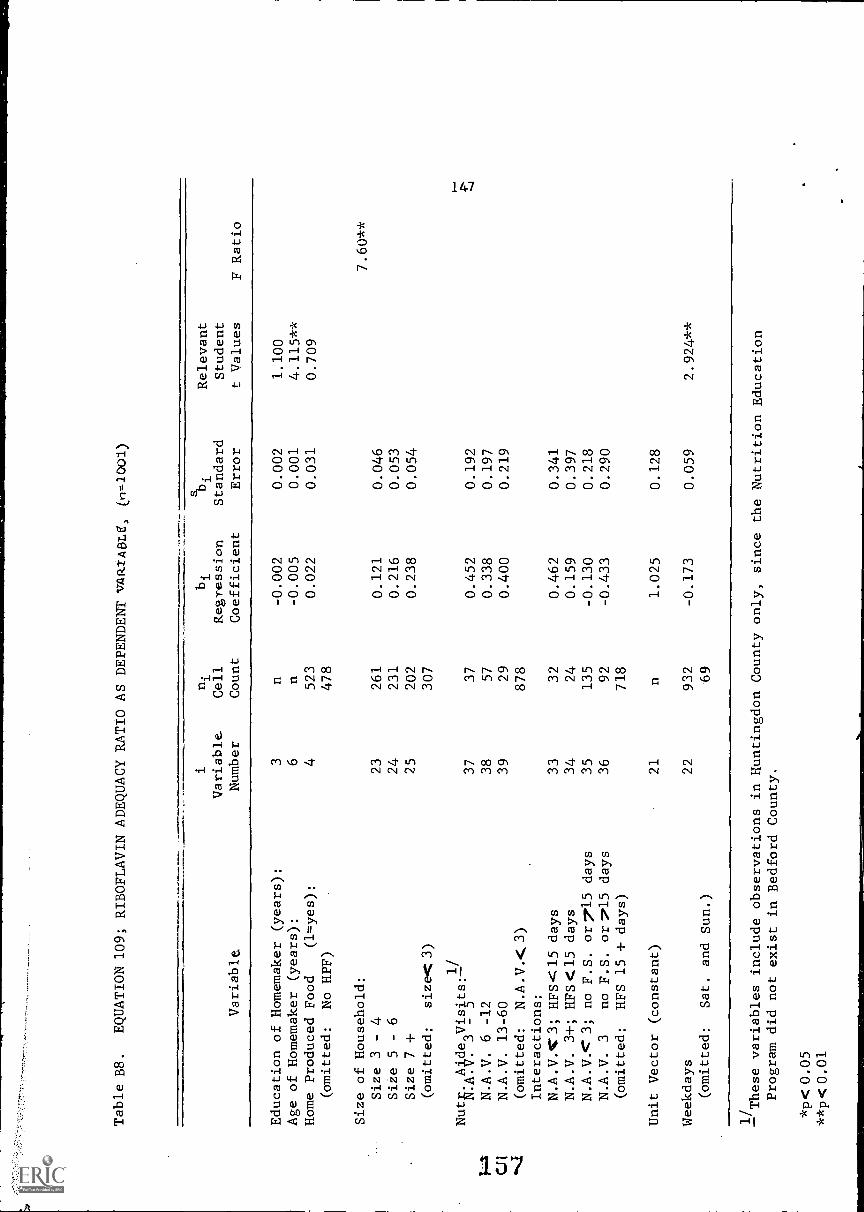
Table B8.
EQUATION 109; RIBOFLAVIN ADEQUACY RATIO AS DEPENDENT v4112)181.0,
(n=1001)
Variable
Education of Homemaker (years):
Age of Homemaker (years):
Home Produced Food
(1=yes):
(omitted:
No HPF)
Size of Household:
Size
3- 4
Size
5- 6
Size
7+
(omitted:
size<3)
.
NutE:AAee3Vists:-1/
).-1
N.A.V. 6 -12
Cu
IN.A.V. 13-60
"...I
(omitted:
N.A.V.<3)
Interactions:
N.A.V.V3; HFS.<15 days
N.A.V. 3+; HFS<15 days
N.A. V.<" 3; no F. S. or715 days
N.A.V. 3
no F.S. or 715 days
(omitted:
HFS 15 + days)
Unit Vector (constant)
Weekdays
(omitted:
Sat. and Sun.)
i
Variable
Number
ni
Cell
Count
bi
Regression
Coefficient
sbi
Standard
Error
Relevant
Student
t Values
F Ratio
3n
-0.002
0.002
1.100
6n
-0.005
0.001
4.115**
4523
0.022
0.031
0.709
478
7.60**
23
261
0.121
0.046
24
231
0.216
0.053
25
202
0.238
0.054
307
37
37
0.452
0.192
38
57
0.338
0.197
39
29
0.400
0.219
878
33
32
0.462
0.341
34
24
0.159
0.397
35
135
-0.130
0.218
36
92
-0.433
0.290
718
21
n1.025
0.128
22
932
-0.173
0.059
2.924**
69
1/These variables include observations in Huntingdon County only, since the Nutrition Education
Program did not exist in Bedford County.
*p< 0.05
**p< 0.01
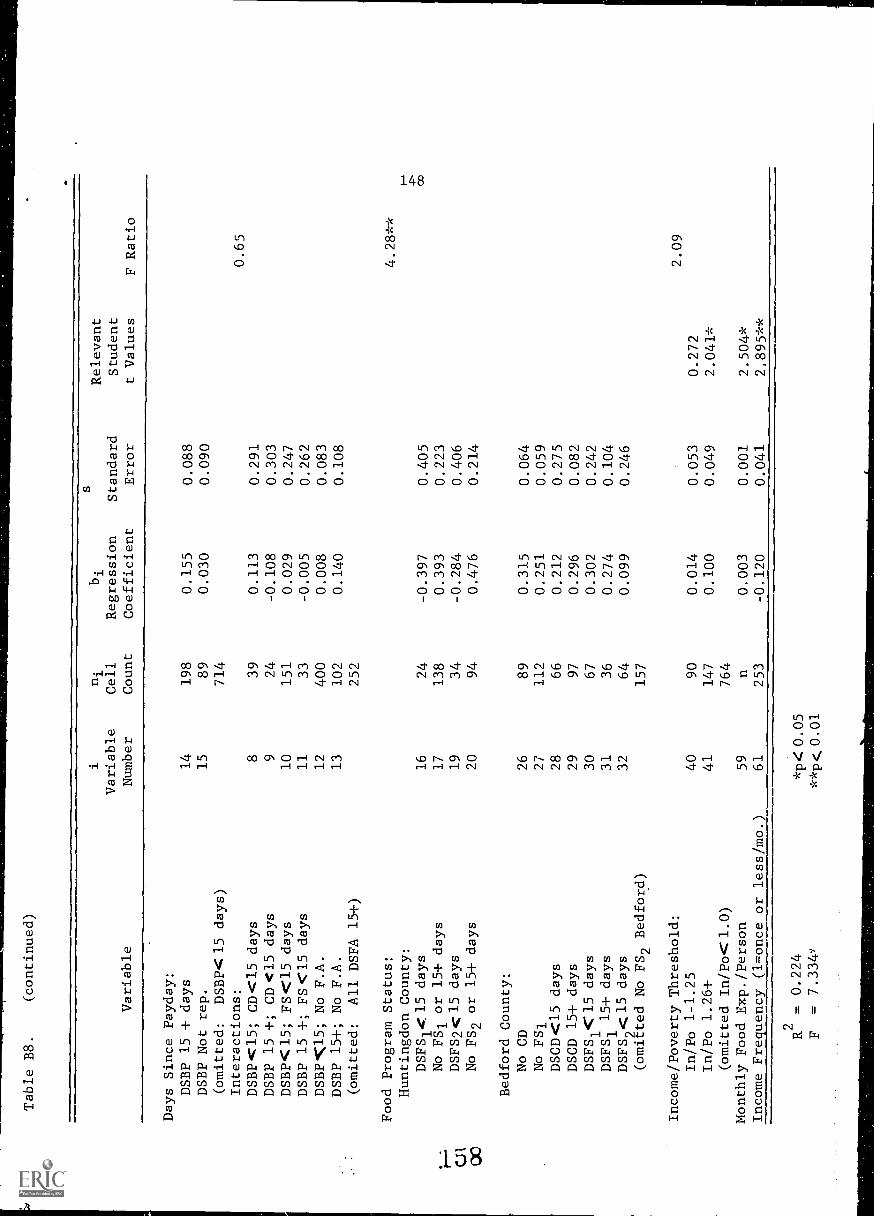
Table B8.
(continued)
Variable
i
Variable
Number
ni
Cell
Count
bi
Regression
Coefficient
s
Standard
Error
Relevant
Student
t Values
F Ratio
Days Since Payday:
DSBP 15 + days
14
198
0.155
0.088
DSBP Not rep.
15
89
0.030
0.090
(omitted:
DSBP4Z15 days)
714
Interactions:
0.65
DSBP4:15; CD<15 days
839
0.113
0.291
DSBP 15 +; CD <15 days
924
-0.108
0.303
DSBP4:15; FS <15 days
10
151
0.029
0.247
DSBP 15 +; FS <15 days
11
33
-0.005
0.262
DSBP 4c15; No F.A.
12
400
0,008
0.083
DSBP 15+; No F.A.
13
102
0.140
0.108
(omitted:
All DSFA 15+)
252
Food Program Status:
4.28**
Huntingdon County:
DSFS1415 days
16
24
-0.397
0.405
No FS1 or 15+ days
17
138
0.393
0.223
DSFS2<:15 days
19
34
-0.284
0.406
No FS2 or 15+ days
20
94
0.476
0.214
Bedford County:
No CD
26
89
0.315
0.064
No FS1
27
112
0.251
0.059
DSCD <15 days
28
66
0.212
0.275
DSCD 15+ days
29
97
0.296
0.082
DSFS1<15 days
30
67
0.302
0.242
DSFS115+ days
31
36
0.274
0.104
DSFS24:15 days
32
64
0.099
0.246
(omitted No FS2 Bedford)
157
Income/Poverty Threshold:
2.09
In/Po 1-1.25
40
90
0.014
0.053
0.272
In/Po 1.26+
41
147
0.100
0.049
2.041*
(omitted In/Po<1.0)
764
Monthly Food Exp./Person
59
n0.003
0.001
2.504*
Income Frequency (1=once or less/mo.)
61
253
-0.120
0.041
2,895**
R2= 0.224
F= 7.334/
*p< 0,05
**p< 0,01
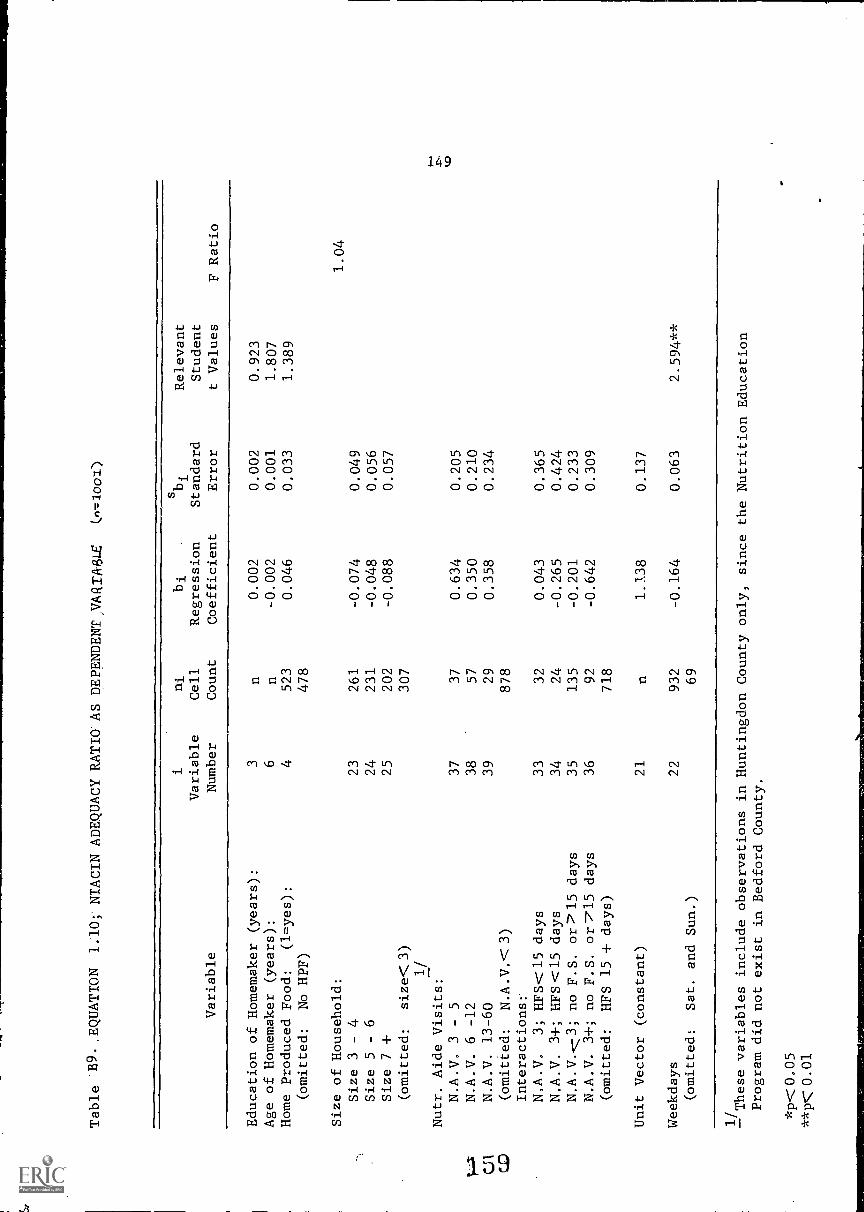
Table 139.. EQUATION
1.10;' NIACIN ADEQUACY RATIO' AS DEPENDENT VARIABLE
()=10o1)
i
Variable
Number
ni
Cell
Count
bi
.
Regression
Coefficient
sbi
Standard
Error
Relevant
Student
t Values
F Ratio
Education of Homemaker (years):
3n
0.002
0.002
0.923
Age of Homemaker (years):
6n
-0.002
0.001
1.807
Home Produced Food:
(1=yes):
4523
0.046
0.033
1.389
(omitted:
No HPF)
478
Size of Household:
1.04
Size 3 - 4
23
261
-0.074
0.049
Size 5 - 6
24
231
-0.048
0.056
Size 7 +
25
202
-0.088
0.057
(omitted:
size<Z3)
307
1/
Nutr. Aide Visits:
N.A.V. 3 - 5
37
37
0.634
0.205
1--...t
N.A.V. 6 -12
38
57
0.350
0.210
C.J1
N.A.V. 13-60
39
29
0.358
0.234
CO
(omitted:
N.A.V.<.:3)
878
Interactions:
N.A.V.
3; HFS<:15 days
33
32
0.043
0.365
N.A.V. 3+; HFS<-15 days
34
24
-0.265
0.424
N.A.V.` 3; no F.S. or%'15 days
35
135
-0.201
0.233
N.A.V. 3+; no F.S. or 715 days
36
92
-0.642
0.309
(omitted:
HFS 15 + days)
718
Unit Vector (constant)
21
n1.138
0.137
Weekdays
22
932
-0.164
0.063
2.594**
(omitted:
Sat. and Sun.)
69
1/These variables include observations in Huntingdon County only, since the Nutrition Education
Program did not exist in Bedford County.
*p< 0.05
**p< 0.01

1
Table B9.
(continued)
Variable
i
Variable
Number
ni
Cell
Count
bi
Regression
Coefficient
sbi
Standard
Error
Relevant
Student
t Values
F Ratio
Days Since Payday:
DSBP 15 + days
14
198
0.044
0.094
DSBP Not rep.
15
89
-0.024
0.096
(omitted:
DSBP7.15 days)
714
Interactions:
0.99
DSBP' 15; CD<:15 days
839
-0.340
0.310
DSBP 15 +; CD<15 days
924
-0.189
0.323
DSBP; 15; FS c15 days
10
151
0.013
0.264
DSBP 15 +; FS.C15 days
11
33
0,092
0.280
DSBP<Z15; No F.A.
12
400
-0.120
0.088
DSBP 15+;
No F.A.
13
102
-0.172
0.116
(omitted:
All DSFA 15+)
252
Food Program Status:
2.95**
Huntingdon County:
DSFSi< 15 days
16
24
0,019
0.433
.r--1
No FS1 or 15+ days
17
138
0.497
0.238
CD
DSFS2-15 days
19
34
0.085
0.433
CD
No
FS2or 15+ days
20
94
0.647
0.228
Bedford County:
No CD
26
89
0.249
0.068
No F51
27
112
0.189
0.063
DSCD 715 days
28
66
0.408
0.294
DSCD 15+ days
29
97
0.160
0.088
DSFS1'c:15 days
30
67
0.179
0.259
DSFS1
15+ days
31
36
0.096
0.111
DSFS2.<:15 days
32
64
-0.038
0.263
(omitted No FS2 Bedford)
157
Income/Poverty Thresh"ld:
1.24
In/Po 1-1.25
40
90
0.022
0.057
0.383
In/Po 1.26+
41
147
0.082
0.052
1.570
(omitted In/Pus-1.0)
764
Monthly Food Exp./Person
59
n0.004
0.001
3.173**
Income Frequency (1=once or less/mo,
61
253
-0.106
0.044
2.397*
R2= 0.121
F= 3.480**
*p< 0,05
**p< 0.01

Table E10.
EQUATION 1.11; VITAMIN C ADEQUACY RATIO AS DEPENDENT VA/U/18LE) CA)=11002)
Variable
i
Variable
Number
ni
Cell
Count
bi
Regression
Coefficient
sbi
Standard
Error
Relevant
Student
t Values
F Ratio
Education of Homemaker (years):
3n
-0.003
0.002
1.242
Age of Homemaker (years):
6n
-0.000
0.002
0.240
Home Produced Food:
(1=yes):
4523
0,175
0.044
3.984**
(omitted:
No HPF)
478
Size of Household:
1.69
Size 3 - 4
23
261
0.081
0.065
Size 5 - 6
24
231
0.163
0.075
Size 7 +
25
202
0.133
0.076
(om.._tted:
size<.)
307
Nutr. Aide Visits:
1/
N.A.V. 3 - 5
37
37
0.731
0.272
CZD
N.A.V. 6 -12
38
57
0.336
0.278
...a
N.A.V. 13-60
39
29
0.319
0.310
(omitted:
N.A.V.:3)
878
Interactions:
N.A.V:c.."3; HFS<Z15 days
33
32
0.098
0.483
N.A.V. 3+; HFS<:15 days
34
24
-0.262
0.562
N.A.V.
3; no F.S. or) 15 days
35
135
-0.554
0.309
N.A.V. 3+; no F.S. or X15 days
36
92
-0.886
0.410
(omitted:
HFS 15 + days)
718
Unit Vector (constant)
21
n0.489
0.181
Weekdays
22
932
0.047
0.084
0.565
(omitted:
Sat. and Sun.)
69
These variables include observations in Huntingdon County only, since the Nutrition Education
Program did not exist in Bedford County.
*P<0.05
**1).0.01

Table B10.
(continued)
Variable
sn
bi
bi
ii
Relevant
Variable
Cell
Regression
Standard
Student
Number
Count
Coefficient
Error
t Values
F Ratio
Days Since Payday:
DSBP 15 + days
ISBP Not rep.
(omitted:
DSBP -. 15 days)
1415
198
89
714
0.258
0.077
0.125
0.127
Interactions:
0.70
DSBP < 15; CD <
I., days
839
-0.307
0.411
DSBP 15 +; CD < 15 days
924
-0.515
0.428
DSBP < 15; FS < 35 days
10
151
0.014
0.349
DSBP 15 +; FS < 15 days
11
33
-0.162
0.371
DSBP < 15; No F.A.
12
400
0.007
0.117
DSBP 15+; No F.A.
13
102
-0.252
0.153
(omitted:
All DSFA 15+)
252
Food Program Status:
3.08**
Huntingdon County:
DSFS1 < 15 days
16
24
0.133
0.573
No FS1 or 15+ days
17
138
0.994
0.316
r-
DSFS2 < 15 days
19
34
0.076
0.574
(1;
No FS2 or 15+ days
20
94
0.889
0.303
L'\.
Bedford County:
No CD
26
89
0.364
0.090
No FS1
27
112
0.258
0.083
DSCD < 15 days
28
66
0.574
0.389
DSCD 15+ days
29
97
0.201
0.116
DSFS1 < 15 days
30
67
0.320
0.342
DSFS1 15+ days
31
36
0.104
0.147
DSFS2 < 15 days
32
64
-0.049
0.348
(omitted:
No FS2 Bedford)
157
Income/Poverty Threshold:
0.05
In/Po 1-1.25
40
90
0.024
0.075
0.322
In/Po 1.26+
41
147
-0.001
0.069
0.009
(omitted:
In/Po < 1.0)
764
Monthly Food Exp./Person
59
n0.004
0.002
2.415
Income Frequency (1=once or less/mo.)
61
253
-0.027
0.059
0.461
R2= 0.141
F= 4.168
*p < 0.05
**p - 0.01

APPENDIX C
SAMPLING PROCEDURE
:63
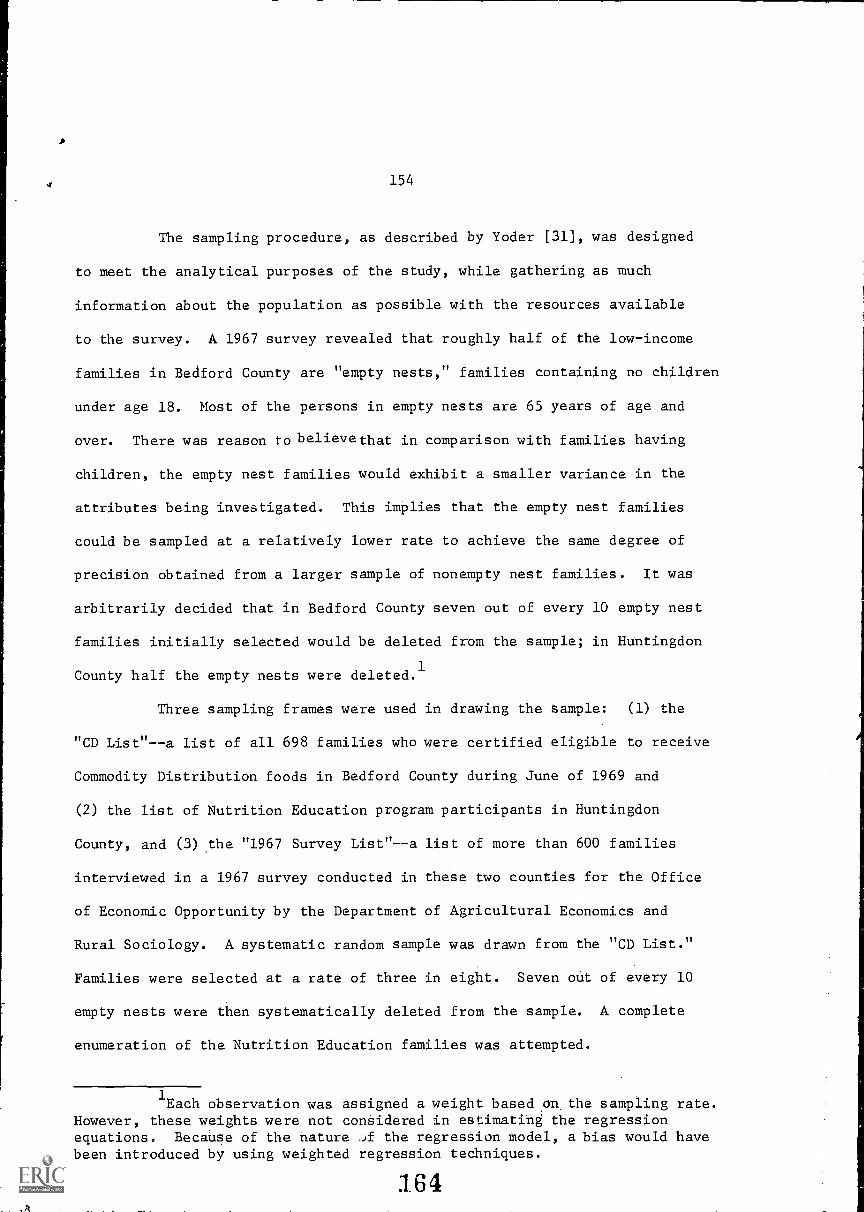
154
The sampling procedure, as described by Yoder [31], was designed
to meet the analytical purposes of the study, while gathering as much
information about the population as possible with the resources available
to the survey. A 1967 survey revealed that roughly half of the low-income
families in Bedford County are "empty nests," families containing no children
under age 18. Most of the persons in empty nests are 65 years of age and
over. There was reason to believe that in comparison with families having
children, the empty nest families would exhibit a smaller variance in the
attributes being investigated. This implies that the empty nest families
could be sampled at a relatively lower rate to achieve the same degree of
precision obtained from a larger sample of nonempty nest families. It was
arbitrarily decided that in Bedford County seven out of every 10 empty nest
families initially selected would be deleted from the sample; in Huntingdon
County half the empty nests were deleted.1
Three sampling frames were used in drawing the Sample: (1) the
"CD List"--a list of all 698 families who were certified eligible to receive
Commodity Distribution foods in Bedford County during June of 1969 and
(2) the list of Nutrition Education program participants in Huntingdon
County, and (3) the "1967 Survey List"--a list of more than 600 families
interviewed in a 1967 survey conducted in these two counties for the Office
of Economic Opportunity by the Department of Agricultural Economics and
Rural Sociology. A systematic random sample was drawn from the "CD List."
Families were selected at a rate of three in eight. Seven out of every 10
empty nests were then systematically deleted from the sample. A complete
enumeration of the Nutrition Education families was attempted.
1Each observation was assigned a weight based on, the sampling rate.
However, these weights were not considered in estimating the regressionequations. Because of the nature ,Jf the regression model, a bias would havebeen introduced by using weighted regression techniques.
:164
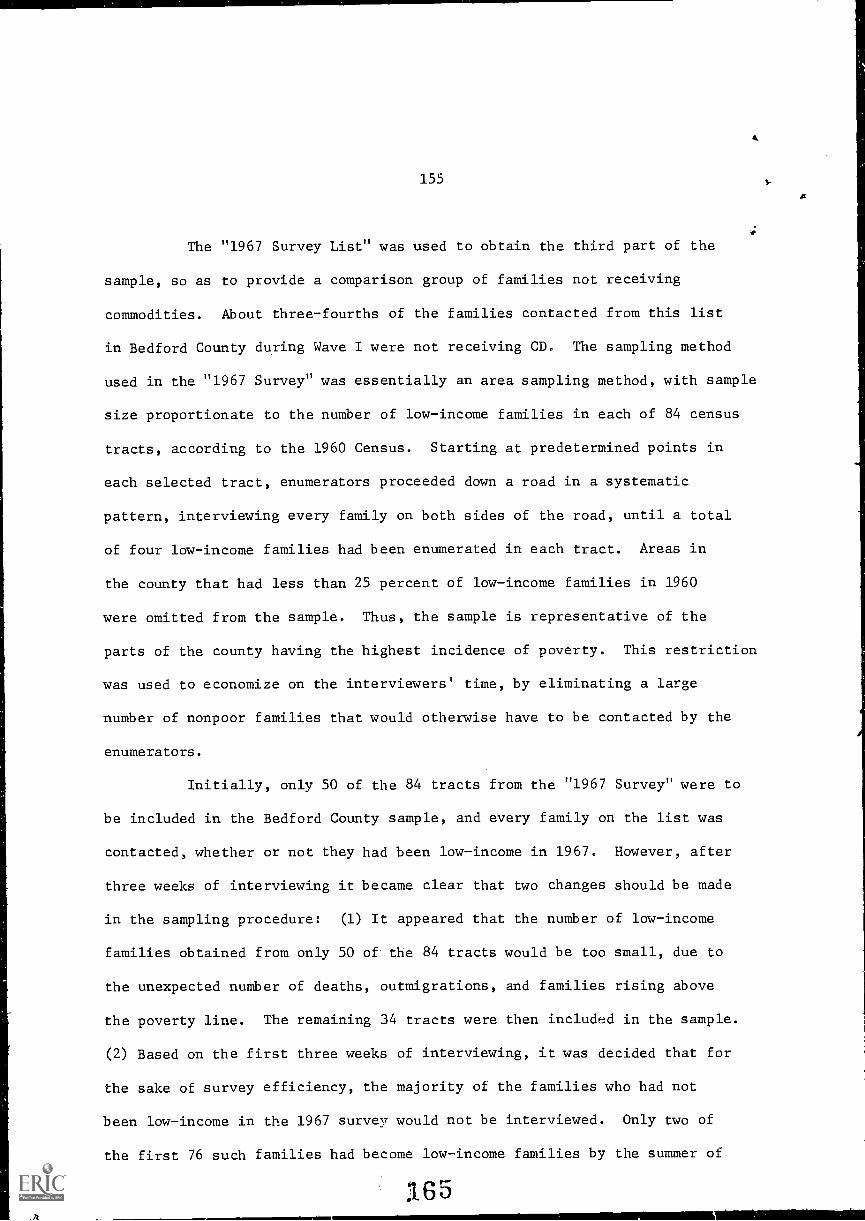
155
The "1967 Survey List" was used to obtain the third part of the
sample, so as to provide a comparison group of families not receiving
commodities. About three-fourths of the families contacted from this list
in Bedford County during Wave I were not receiving CD. The sampling method
used in the "1967 Survey" was essentially an area sampling method, with sample
size proportionate to the number of low-income families in each of 84 census
tracts, according to the 1960 Census. Starting at predetermined points in
each selected tract, enumerators proceeded down a road in a systematic
pattern, interviewing every family on both sides of the road, until a total
of four low-income families had been enumerated in each tract. Areas in
the county that had less than 25 percent of low-income families in 1960
were omitted from the sample. Thus, the sample is representative of the
parts of the county having the highest incidence of poverty. This restriction
was used to economize on the interviewers' time, by eliminating a large
number of nonpoor families that would otherwise have to be contacted by the
enumerators.
Initially, only 50 of the 84 tracts from the "1967 Survey" were to
be included in the Bedford County sample, and every family on the list was
contacted, whether or not they had been low-income in 1967. However, after
three weeks of interviewing it became clear that two changes should be made
in the sampling procedure: (1) It appeared that the number of low-income
families obtained from only 50 of the 84 tracts would be too small, due to
the unexpected number of deaths, outmigrations, and families rising above
the poverty line. The remaining 34 tracts were then included in the sample.
(2) Based on the first three weeks of interviewing, it was decided that for
the sake of survey efficiency, the majority of the families who had not
been low-income in the 1967 survey would not be interviewed. Only two of
the first 76 such families had become low-income families by the summer of
:165

156
1969. Thus, for the remainder of the survey, only the families that had
been "near poor"--those no more than $500 above the poverty line in 1967-
would be interviewed. In this category, only eight of 164 or 4.8 percent
were below the poverty line in the summer of 1969.
Each sample tract encompassed a certain segment of road between
the starting point and the point at which the fourth low-income family had
been found in the 1967 survey. During the Wave I surveys in the summer of
1969, the enumerators attempted to contact all the families along the road
between these two points, who had been interviewed in the 1967 Survey and
who had been found to have incomes below the poverty line, or at most not
more than $500 above the poverty line. In addition, enumerators also
visited any families residing along this strip of road who had not been
contacted in 1967 (including some families that had recently moved into
the area).
In Bedford County 274 families were interviewed; 189 were inter-
viewed in Huntingdon County. For the subsequent surveys (Waves II and III
in Bedford, and Wave II in Huntingdon County) the enumerators attempted to
contact each of these same families, regardless of their current income or
program participation status. Families that had moved out of the county
were deleted from the sample. Very few homemakers refused to be interviewed.
166