DOCUMENT RESUME ED 406 139 SE 057 480 … · classification system. ... Arlington, VA 22230. SRS...
112
ED 406 139 AUTHOR TITLE INSTITUTION REPORT NO PUB DATE NOTE AVAILABLE FROM PUB TYPE EDRS PRICE DESCRIPTORS ABSTRACT DOCUMENT RESUME SE 057 480 Hill, Susan T. Science and Engineering Degrees, by Race/Ethnicity of Recipients: 1985-93. Detailed Statistical Tables. National Science Foundation, Arlington, VA. Div. of Science Resources Studies. NSF-95-330 95 111p. National Science Foundation, Division of Science Resources Studies, 4201 Wilson Boulevard, Arlington, VA 22203-9966; E-mail: [email protected] (single copy free) . Statistical Data (110) MF01/PC05 Plus Postage. *Degrees (Academic); *Engineering Education; Higher Education; *Minority Groups; *Science Education; Surveys This publication is based on data from several federal surveys from all accredited institutions of higher education. Three of them are: the Completions Survey conducted by the National Center for Education Statistics; the U.S. Department of Education's Survey of Degrees and Other Formal Awards Conferred; and the Survey of Earned Doctorates. These data cover earned degrees conferred in the aggreate United States in science and engineering during the period from Earned Doctorates. These data cover earned degrees conferred in the aggregate United States in science and engineering during the period from June, 1985 through June, 1993. The first section contains data highlights for degrees awarded to underrepresented minorities by the following fields: psychology, social science, biological science, mathematics, physical sciences, engineering, agriculture, and computer Higher Education General Information Survey/Integrated Postsecondary Education Data S7-; classification system. The last two sections definitions of racial/ethnic categories and historical changes in the Higher Education General Information Survey/Integrated Postsecondary Education Data System classification system. The last two sections contain statistical charts and tables. (MU) *********************************************************************** Reproductions supplied by EDRS are the best that can be made from the original document. ***********************************************************************
Transcript of DOCUMENT RESUME ED 406 139 SE 057 480 … · classification system. ... Arlington, VA 22230. SRS...

ED 406 139
AUTHORTITLE
INSTITUTION
REPORT NOPUB DATENOTEAVAILABLE FROM
PUB TYPE
EDRS PRICEDESCRIPTORS
ABSTRACT
DOCUMENT RESUME
SE 057 480
Hill, Susan T.Science and Engineering Degrees, by Race/Ethnicity ofRecipients: 1985-93. Detailed Statistical Tables.National Science Foundation, Arlington, VA. Div. ofScience Resources Studies.NSF-95-33095
111p.National Science Foundation, Division of ScienceResources Studies, 4201 Wilson Boulevard, Arlington,VA 22203-9966; E-mail: [email protected] (single copyfree) .
Statistical Data (110)
MF01/PC05 Plus Postage.*Degrees (Academic); *Engineering Education; HigherEducation; *Minority Groups; *Science Education;Surveys
This publication is based on data from severalfederal surveys from all accredited institutions of higher education.Three of them are: the Completions Survey conducted by the NationalCenter for Education Statistics; the U.S. Department of Education'sSurvey of Degrees and Other Formal Awards Conferred; and the Surveyof Earned Doctorates. These data cover earned degrees conferred inthe aggreate United States in science and engineering during theperiod from Earned Doctorates. These data cover earned degreesconferred in the aggregate United States in science and engineeringduring the period from June, 1985 through June, 1993. The firstsection contains data highlights for degrees awarded tounderrepresented minorities by the following fields: psychology,social science, biological science, mathematics, physical sciences,engineering, agriculture, and computer Higher Education GeneralInformation Survey/Integrated Postsecondary Education Data S7-;classification system. The last two sections definitions ofracial/ethnic categories and historical changes in the HigherEducation General Information Survey/Integrated PostsecondaryEducation Data System classification system. The last two sectionscontain statistical charts and tables. (MU)
***********************************************************************
Reproductions supplied by EDRS are the best that can be madefrom the original document.
***********************************************************************

'7
Science and
Engineering
Degrees, by
Race/Ethnicity
of Recipients
1985-93
Detailed Statistical Tables
Division of Science Resources Studies
Directorate for Social, Behavioral and Economic Sciences
U.R. DEPARTMENT OF EDUCATIONOnce o Educational Research and Imprcrounent
EDUCATIONAL RESOURCES INFORMATIONkCENTER (ERIC)
'n.s document has been reproduCed asevened Prom the person Or Organization
originating it0 Minor changes have been made to improve
reproduction quality.
PCII me of view or opinions stated in this dot u.ment do not necessarily represent officialOERI position or policy.
National Science Foundation NSF 95-330

Science and
Engineering
Degrees, by
Race/Ethnicity
of Recipients
1985-93
Detailed Statistical Tables
Susan T. Hill, Author
Division of Science Resources Studies
Directorate for Social, Behavioral and Economic Sciences
National Science Foundation
3NSF 95-330

Suggested CitationNational Science Foundation, Science and Engineering Degrees,by Race/Ethnicity of Recipients: 1985-93, NSF 95-330(Arlington, VA, 1995).
Availability of PublicationsSingle copies are available free of charge from the Division of
Science Resources Studies, National Science Foundation,Arlington, VA 22230. SRS data are also available through theWorld Wide Web ( http: / /www.nsf.gov /sbe /srs /stats.htm) andthrough STIS (Science and Technology Information System),NSF's online publishing system, described on the following page.If you are a user of electronic mail and have access to Internet,you may order publications electronically. Send requests [email protected]. In your request include the NSF publicationnumber and title, your name, and a complete mailing address.Printed publications may also be ordered by fax (703-644-4278).Please allow 3 weeks for delivery.
Telephonic Device for the Deaf(703) 306-0090
ContributorsTabulations were performed by Quantum Research Corp. for theNational Science Foundation. The author for this report wasSusan T. Hill.
4
ii
GETTING NSF INFORMATION AND PUBLICATIONSThe National Science Foundation (NSF) has several ways for the public to receive informationand publications. Electronic or printed copies of the NSF telephone directory, abstracts ofawards made since 1989, and many NSF publications are available as described below. Toaccess information electronically, there is no cost to you except for possible phone and Internetaccess charges. Choose the method of access that matches your computer and network tools. Forgeneral information about Internet access and Internet tools, please contact your local computersupport organization.
WORLD WIDE WEBSNSF HOME PAGEThe World Wide Web (WWW) systemmakes it possible to view text materialas well as graphics, video, and sound.You will need special software (a "webbrowser") to access the NSF HomePage. The URL (Uniform ResourceLocator) is http://www.nsigovi.
INTERNET GOPHERThe Internet Gopher provides access toinformation on NSF's Science andTechnology Information System(STIS) through a series of menus. Toaccess the Gopher, you need Gopherclient software; the NSF Gopher serveris on port 70 of stis.nsfgov.
ANONYMOUS FTP (FILETRANSFER PROGRAM)Internet users who are familiar withFTP can easily transfer NSFdocuments to their local system forbrowsing and printing. The best wayto access NSF information is to firstlook at the index (file name:index.txt). From the index, you canselect the files you need. FTPinstructions are:
FTP to stis.nsfgov.Enter anonymous for the user name,and your e-mail address for thepassword.Retrieve the appropriate file (i.e.,filename.ext).
E-MAIL (ELECTRONIC-MAIL)To get documents via e-mail, send yourrequest to the Internet addressstisserve@nsigov. The best way tofind NSF information is to request theindex. Your e-mail message shouldread: get index.txt. An index with filenames will be sent to you. However ifyou know the file name of thedocument you want, your e-mailmessage should read:get <filename.ext>.
E-MAIL MAILING LISTSNSF maintains several mailing lists tokeep you automatically informed ofnew electronic publications. To getdescriptions of the mail lists andinstructions for subscribing, send yourrequest to: stisserve@nsigov. Yourmessage should read: get stisdirm.txt.
ON-LINE STISNSF's Science and TechnologyInformation System (STIS) is anelectronic publications disseminationsystem available via the Internet (telnetto stis.nsfgov); you will need a VT100emulator. The system features a full-text search and retrieval software(TOPIC) to help you locate thedocuments. Login as public and followthe instructions on the screen.
To get an electronic copy of the "STISUSERS GUIDE," NSF 94-10, send ane-mail request to: [email protected] message should read:get NSF9410.txt. For a printed copy ofthe "STIS USERS GUIDE," seeinstructions "How To Request PrintedNSF Publications."
NON-INTERNET ACCESSVIA MODEMIf you do not have an Internetconnection, you can use remote loginto access NSF publications on NSF'son-line system, STIS. You need aVT100 terminal emulator on yourcomputer and a modem.
Dial 703-306-0212,choose 1200, 2400, or 9600 baud,use settings 7-E-1, andlogin as public and follow the on-screen instructions.
5
NSF 95-64 (Replaces NSF 94-4)
HOW TO REQUEST PRINTEDNSF PUBUCATIONSYou may request printed publicationsin the following ways:
send e-mail request to:pubsOnsigovfax request to: 703-644-4278for phone request, call: 703 -306-1130 or Telephonic Device for theDeaf (TDD 703-306-0090)send written request to:
NSF Forms and Publications Unit4201 Wilson BoulevardRoom P-15Arlington, VA 22230
When making a request, please includethe following information:
NSF publication number;number of copies; andyour complete mailing address.
QUESTIONS ABOUT NSFPUBLICATIONS, PROGRAMS,ETC.
Contact the NSF Information Center ifyou have questions about publications,including publication availability,titles, and numbers. The NSFInformation Center maintains a supplyof many NSF publications for publicuse. You may:
visit the NSF Information Center,located on the second floor at 4201Wilson Blvd., Arlington, Virginia.;orcall the NSF Information Center at703-306-1234; or 703-306-0090 forTDD; orsend e-mail message toinfo@nsfgov.
QUESTIONS ABOUT THEELECTRONIC SYSTEM
Send specific, system-related questionsabout NSF electronic publicationservices that are not answered in thisflyer, to webmaster@nsigov or call703-306-0214 (voice mail).

ACKNOWLEDGMENTS
The preparation of Science and EngineeringDegrees, by Race/Ethnicity of Recipients: 1985-93,was overseen by Susan T. Hill, Analyst, Science andEngineering Education and Human ResourcesProgram (EDU), National Science Foundation (NSF),under the overall direction of Mary J. Golladay,Program Director, EDU, Division of ScienceResources Studies (SRS), NSF. David Saia, SRS
6
Publications Manager, conducted the editorial review.Additional support was provided by Kenneth M.Brown, Director, SRS. Quantum Research Corp.(QRC) of Bethesda, MD, prepared the tables andreport copy for printing under NSF contract numberSRS-94-23167. QRC staff members who worked onthis project were Barbara DePaul, JonathanFreedman, Teresa Grimes, George Nozicka, BetsyPeto, and Jennifer Ranwez.
v

X
NSF Division of Science Resources Studies NSF 95-330
Order FormPlease send me the following reports, free of charge:
Title NSF No.
Science and Engineering Degrees: 1966-93 95-312
Selected Data on Science and Engineering Doctorate Awards: 1993 94-318
Selected Data on Graduate Students and Postdoctorates in Science and
Engineering: Fall 1993 95-316
Women, Minorities, and Persons With Disabilities in Science and
Engineering: 1994 94-333
Undergraduate Origins of Recent Science and Engineering Doctorate
Recipients 92-332
Check here to receive the latest SRS Publications List.
Name
Address
City
State ZIP
Phone Fax
L
To order SRS publications, fill out order form, cut on dotted line,fold in half, tape, and drop in the mail. No postage is necessary.Form can also be sent via fax, at 703-306-0510.
7

NATIONAL SCIENCE FOUNDATIONARLINGTON, VA 22230
OFFICIAL BUSINESS
PENALTY FOR PRIVATE USE $300
BUSINESS REPLY CARDFIRST CLASS PERMIT NO. 12806 ARLINGTON, VA
National Science FoundationDivision of Science Resources StudiesPublications Unit4201 Wilson Blvd., Suite 965Arlington, VA 22203-9966
1..1.1..1.1..1.111 11.1.1..I.I...1 Ind I III
NO POSTAGENECESSARY
IF MAILEDIN THE
UNITED STATES
IIMI111111111111111
Fold here
Please tape here (do not staple)

CONTENTS
Section Page
General Notes xi
A. Data Highlights 1
B. Technical Notes 5
C. Statistical Charts 25
D. Detailed Statistical Tables 37
9ix

GENERAL NOTES
This publication is based on data obtained by theNational Center for Education Statistics, U.S.Department of Education, from all accreditedinstitutions of higher education. These data coverearned degrees conferred in the aggregate UnitedStates, which includes the 50 States, the District ofColumbia, and the U.S. Territories and OutlyingAreas (American Samoa, the former Canal Zone, theNorthern Mariana Islands, Puerto Rico, the U.S.Virgin Islands, and the Trust Territory of the PacificIslands). Degree data are compiled for a 12-monthperiod, July of one year through June of the followingyear. For convenience, degrees for such a given 12-month period will be referred to by the year in whichthe period ended, e.g., 1993 means the 12-monthperiod ending June 1993.
There were changes in the classification of fieldsbetween 1985-91 and 1992-93. See the TechnicalNotes for information on the field classifications used.Because racial/ethnic data were collected by broadfields of study only, the definition of science andengineering used by the National Science Foundation(NSF) for this report must include fields normally notincluded. There is one instance where this differencehas a large impactthe broad field of "Social
10
Sciences." The U.S. Department of Educationincludes the field of history in this broad category, sowhen it collects the racial/ethnic data, this field isincluded.
Before 1985, the broad category of "Engineering"included engineering technologies. This report isdifferent from earlier reports in that it excludesengineering technologies so that trend data by race/ethnicity are more consistent with the definition ofscience and engineering used in other NSF reports. Ifthe reader is interested in earlier data for science fields(that are consistent from 1977 to 1993), pleaserequest Science and Engineering Degrees, by Race/Ethnicity of Recipients: 1977-91, NSF 94-306.
For more information, please contact
Susan T. HillDivision of Science Resources StudiesNational Science Foundation4201 Wilson Boulevard, Suite 965Arlington, VA 22230
Telephone: (703) 306-1774, ext. 6915Internet: [email protected]
xi

SECTION A.
DATA HIGHLIGHTS

TRENDS IN BACHELOR'S DEGREES
AWARDED TO RACIAL/ETHNIC
MINORITIES IN SCIENCE AND
ENGINEERINGThe number of bachelor's degrees in science and
engineering (S&E) fields awarded to underrepresentedminority students showed robust growth in the early1990s, after a period of relatively slow growth from1985 to 1990. From 1990 to 1993, the number ofbaccalaureate recipients with degrees in S&Eincreased 34 percent for blacks, 32 percent forHispanics, and 43 percent for American Indians. Thepercentage increases for underrepresented minoritygroups were higher than the percentage increasesfound among white recipients (10 percent) and Asianrecipients (26 percent) (table A).
Table A. Science and engineering bachelor's degrees,by race/ethnicity of recipients: percentage change,
1985-90 and 1990-93
Race/ethnicity 1985-90 1990-93
White, non-Hispanics -4% 10%Asians or Pacific Islanders 46% 26%Underrepresented minorities,
total 10% 34%Black, non-Hispanics 7% 34%Hispanics 16% 32%American Indians or
Alaskan Natives -8% 43%
SOURCE: NSF/SRS tabulations of National Center forEducation Statistics Completions Survey data
In 1993 there were similar numbers of blackbachelor's degree recipients in S&E (24,421) andAsian recipients (24,504). The number of Hispanicsearning bachelor's degrees in S&E fields hit an all-time high of 18,442, as did American Indians, 1,819.
Among underrepresented minority groups, theincreases in baccalaureate degrees vary by field ofscience or engineering. From 1990 to 1993 thepercentage changes in baccalaureates awarded tounderrepresented groups ranged from a 1-percentdecrease in computer science degrees to an increaseof 48 percent in psychology degrees (chart A).
Underrepresented minorities comprised 28percent of the "college-age" population (18-24 yearsold) in 1993, whereas baccalaureates earned byunderrepresented minority students accounted foronly 12 percent of the total S&E degrees in 1993.
Degree awards have increased more in the socialsciences, fields in which there is a slightly higherconcentration of S&E bachelor's degree recipientsamong underrepresented minorities (59 percent)than among whites (56 percent).
Among S&E baccalaureate recipients in 1993, aslightly lower percentage of underrepresentedminorities majored in engineering (13 percent) thandid whites (15 percent), and the percentages of thesegroups choosing natural sciences were even moresimilar (table B).
Chart A. Science and engineering degrees awarded to underrepresented minorities,by field: percentage change, 1990-93
Psychology
Social science
Biological science
Mathematics
Physical sciences
Engineering
Agriculture
Computer science I
-20 0
1
20 40
Percentage changeSOURCE: NSF/SRS tabulations of National Center for Education Statistics Completions Survey data
1
60 80
12
100

Table B. S&E bachelor's degree recipients, by broadfield: percentage distribution, 1993
Race/ethnicity Engineering Naturalsciences
Socialsciences
Underrepresentedminorities
WhitesAsians
131526
282939
595635
4
Although these slight differences exist, the gaps oncefound between the field choices of underrepresentedminorities and whites have virtually disappeared.One-third of all bachelor's degree recipients of allracial/ethnic groups (except Asians, at 49 percent)chose S&E fields in 1993.
13

SECTION B.
TECHNICAL NOTES
14

INTRODUCTIONThis report is based on final data from several
Federal surveys. Two of them are the U.S.Department of Education's Survey of Degrees andOther Formal Awards Conferred, and theCompletions Survey conducted annually by theNational Center for Education Statistics (NCES) aspart of the Higher Education General InformationSurvey (HEGIS), later renamed the IntegratedPostsecondary Education Data System (IPEDS). Thethird is the Survey of Earned Doctorates, conductedannually for the National Science Foundation (NSF)and four other Federal agencies by the NationalResearch Council. Each source is described in moredetail in the following sections.
Data from the Survey of Degrees and OtherFormal Awards Conferred and from the CompletionsSurvey were used to report the number of bachelor'sand master's degrees. The data on doctoral degreesin this report were derived from the Survey of EarnedDoctorates, which surveyed all individuals earningresearch doctorates, rather than from the Com-pletions Survey, which surveyed the institutionsawarding the doctorates. The Earned Doctorate datawere preferred because the data provided byindividuals are more specific with respect to the fieldof specialization and are less prone to errors in datareporting and data entry than are the data provided byinstitutions. Furthermore, doctorate data provide 100percent coverage for data by field and sex of individ-ual recipients, whereas institutional data are subjectto imputation for nonresponse. For a comparison ofreporting on doctoral degrees in the CompletionsSurvey and the Survey of Earned Doctorates, seeNational Science Foundation, Science andEngineering Doctorates: 1960-91, NSF 93-301,Detailed Statistical Tables (Washington, DC, 1993).
In this report the racial and ethnic categoriesamong U.S. citizens who were degree recipientsduring the 1985-93 period are charted and tabulated.It is recognized that the concept of race/ethnicity isas much a socially constructed characteristic as abiological one. Scholars such as Farley and Allenhave noted that "the sociological reality of race ismore important than its biological reality. Race
15
exerts a profound influence over the lives of peoplein this society."1
The following five racial/ethnic categories arerequired in Federal Government surveys ofinstitutions:
Black, non-HispanicAmerican Indian or Alaskan NativeAsian or Pacific IslanderHispanicWhite, non-Hispanic
Persons who are U.S. citizens or foreign citizensadmitted for permanent residence are classified intothe above categories. The ethnic category ofHispanic took precedence over the racial categoriesin the data collection. In addition, nonresident aliens,i.e., those admitted to the United States for temporaryresidence, are separately identified as a sixthcategory in the survey. The nonresident aliens arenot to be reported in the aforementioned racial/ethnicgroups.
The definitions for the racial/ethnic categoriesused in the survey are as follows:
Nonresident alienA person who is not acitizen or national of the United States and whois in this country on a temporary basis and doesnot have the right to remain indefinitely.Resident aliens who are not citizens of theUnited States and who have been lawfullyadmitted for permanent residence (and who holdalien registration receipt cardsForm 1-551/155)are to be reported in the appropriate racial/ethniccategories along with U.S. citizens.
Black, non-HispanicA person having originsin any of the black racial groups of Africa(except those of Hispanic origin).
American Indian or Alaskan NativeA personhaving origins in any of the original peoples ofNorth America and who maintains culturalidentification through tribal affiliation orcommunity recognition.
Richard Farley and Walter R. Allen, The Color Line andthe Quality of Life in America (New York: Russell SageFoundation, 1987), p. 6.

Asian or Pacific IslanderA person havingorigins in any of the original peoples of the FarEast, Southeast Asia, the Indian Subcontinent, orthe Pacific Islands. These areas include, forexample, China, Japan, Korea, the PhilippineIslands, and Samoa.
HispanicA person of Mexican, Puerto Rican,Cuban, Central or South American, or otherSpanish culture or origin, regardless of race.
White, non-HispanicA person having originsin any of the original peoples of Europe, NorthAfrica, or the Middle East (except those ofHispanic origin).
For the bachelor's and master's degree data, themanner of collecting racial and ethnic data is left tothe discretion of the institution, provided that thesystem established results in reasonably accuratedata. The information is gathered by NCES for theOffice of Civil Rights, U.S. Department ofEducation, in compliance with title I of the CivilRights Act of 1964 and title IX of the EducationAmendments of 1972.
BACHELOR'S AND
MASTER'S DEGREE DATABachelor's and master's degree data presented in
this report were derived from two surveys conductedby NCES: the Survey of Degrees and Other FormalAwards Conferred and the Completions Survey. Datafor the year 1985 are from the Degrees Surveyconducted as part of REGIS. Data for 1987 to 1993are from the Completions Survey, which is a com-ponent of IPEDS. IPEDS has replaced HEGIS as thenew postsecondary education data collection systemfor NCES. Data from the HEGIS and IPEDS surveysare comparable for the variables used in this report.
These surveys requested data on the number ofassociate's, bachelor's, master's, doctoral, and first-professional degrees conferred by institutions ofhigher education. The data were requested accordingto sex of recipient and field of study for each degreelevel. Data on the race/ethnicity of degree recipientswere collected biennially by NCES for the Office ofCivil Rights from 1985 through 1989 and annuallysince then. A major limitation is that data are
8
collected only at the broad field level2 and accordingto the Federal racial/ethnic designations of degreerecipients.
The surveys were mailed to all accrediteduniversities and colleges in the United States,including the U.S. territories, for completion by theinstitution. Followup for nonresponse and editingwas conducted by letter and telephone. The overallresponse rate for institutions of higher educationranged between 94 and 96 percent between 1985 and1993.
Some institutions provided only the total numberof completions, by award level and by sex; othersprovided the number of completions by award level,sex, and field but did not provide racial/ethnic data.
Imputations for the years 1985 through 1993were computer generated. Imputations weredeveloped for institutions that did not providecomplete racial/ethnic data. Some of theseinstitutions had reported total degrees awarded butnot racial/ethnic data, and others had reported totalsthat were larger or smaller than the sum of the racial/ethnic components.
In the first case, wherein institutions did notreport any racial/ethnic data by field, NCES imputeddata on the basis of an earlier response for eachinstitution, if available.
The following table indicates the percentage ofimputed data in 1993, by award level and racial/ethnic category.
Race/ethnicity Bachelor's Master's
White, non-Hispanics 1.0 1.8Black, non-Hispanics 1.3 2.1Hispanics 1.3 2.6Asians or Pacific
Islanders 1.6 3.0American Indians or
Alaskan Natives 0.6 0.8Nonresident aliens 1.2 2.7Race/ethnicity unknown 1.7 7.0
2 Broad field level refers to the 2-digit program levels inU.S. Department of Education, National Center for EducationStatistics, Classification of Instructional Programs (Washington,DC: GPO, 1991).
1.6

In the second case, wherein raciaUethnic datawere reported but did not add to the total degreerecipients, NCES distributed the difference amongthe racial/ethnic groups for that institution. Note:This report, however, does not do that; unknowns areshown in the table.
In examining data on degrees awarded tominorities, it must be noted that 1 to 5 percent of allS&E degrees awarded in 1985-93 were awarded toindividuals whose race/ethnicity was unknown. Thisunknown category could affect trends and observablechanges in the number and share of awards receivedby minority students, particularly if there are shiftsfrom year to year in the number of degree recipientswith unknown race/ethnicity. As tables 1-3 indicate,the share of degrees awarded to individuals whoserace/ethnicity was unknown varied somewhat bydegree level.
This National Science Foundation report differsfrom those published by NCES in that data for theU.S. territories are included, whereas NCES excludesthem from most of its published reports.
DOCTORAL DEGREE DATAIn the Survey of Earned Doctorates, information
is collected during the period of July 1 of one year to
June 30 of the next from all persons who havefulfilled the requirements for a research doctorate.The survey is funded jointly by NSF and four otheragencies: the U.S. Department of Education, theNational Institutes of Health, the NationalEndowment for the Humanities, and the U.S.Department of Agriculture. The National ResearchCouncil sends the survey forms to all accrediteddoctorate-granting institutions for distribution by thegraduate deans to all research doctorate recipients asthey complete degree requirements. Informationcollected in the survey comprises demographic data,such as the student's sex, citizenship, and racial/ethnic group; education history, including field ofdegrees; sources of graduate student support;employment status during the year preceding receiptof the doctorate; postgraduation plans; andbackground on parents' education. Approximately92 to 95 percent of the doctorate recipients completeand return the survey forms. For nonrespondents,commencement programs constituted a source ofskeletal information that was added to the file. Thesevariables were sex, field of study, institution, year ofdoctorate, and educational background. Data areupdated annually from completed survey formssubmitted belatedly by previous nonrespondents, sonumbers may change slightly in the future updates.
9

Historical Changes in the Higher Education General Information Survey (HEGIS)/Integrated Postsecondary Education Data System (IPEDS)
Classification System
Fields of study collected inHEGIS/IPEDS, 1985-91
Fields of study from theIPEDS, 1992-93
Fields of study fromthe Survey of Earned Doctorates
classification
SCIENCE ANDENGINEERING (S&E)
ENGINEERING14 Engineering
SCIENCE ANDENGINEERING (S&E)
ENGINEERING14 Engineering
t 8
SCIENCE ANDENGINEERING (S&E)
ENGINEERING
Aeronautical/AstronauticalEngineering300 Aerospace, Aeronautical,
and AstronauticalEngineering
Chemical Engineering312 Chemical Engineering366 Petroleum Engineering369 Polymer and Plastics
Engineering547 Fuel Technology and
Petroleum Engineering
Civil Engineering315 Civil Engineering336 Environmental Health
Engineering
Electrical Engineering318 Communications
Engineering321 Computer Engineering322 Electrical Engineering323 Electronics Engineering324 Electrical and Electronics
Engineering
Industrial Engineering339 Industrial and
ManufacturingEngineering
Mechanical Engineering327 Engineering Mechanics345 Mechanical Engineering
11

Historical Changes in the Higher Education General Information Survey (HEGIS)/Integrated Postsecondary Education Data System (IPEDS)
Classification Systemcontinued
Fields of study collected inHEGIS/IPEDS, 1985-91
Fields of study from theIPEDS, 1992-93
Fields of study fromthe Survey of Earned Doctorates
classification
SCIENCES
NATURAL SCIENCESPhysical Science40 Physical Sciences (Includes
Earth/Atmospheric/OceanographicSciences)
12
SCIENCES
NATURAL SCIENCESPhysical Science40 Physical Sciences (Includes
Earth/Atmospheric/OceanographicSciences)
I9
Materials/MetallurgicalEngineering309 Ceramic Sciences342 Materials Science348 Metallurgical Engineering
Other Engineering303 Agricultural Engineering306 Bioengineering and
Biomedical Engineering330 Engineering Physics333 Engineering Science351 Mining and Mineral
Engineering354 Naval Architecture and
Marine Engineering357 Nuclear Engineering360 Ocean Engineering363 Operations Research372 Systems Engineering375 Textile Engineering398 Engineering, General399 Engineering, Other
SCIENCES
PHYSICAL SCIENCESAstronomy500505506
AstronomyAstrophysicsAstronomy and
Astrophysics
Chemistry520 Analytical Chemistry521 Agricultural and Food
Chemistry522 Inorganic Chemistry524 Nuclear Chemistry526 Organic Chemistry528 Pharmaceutical Chemistry530 Physical Chemistry
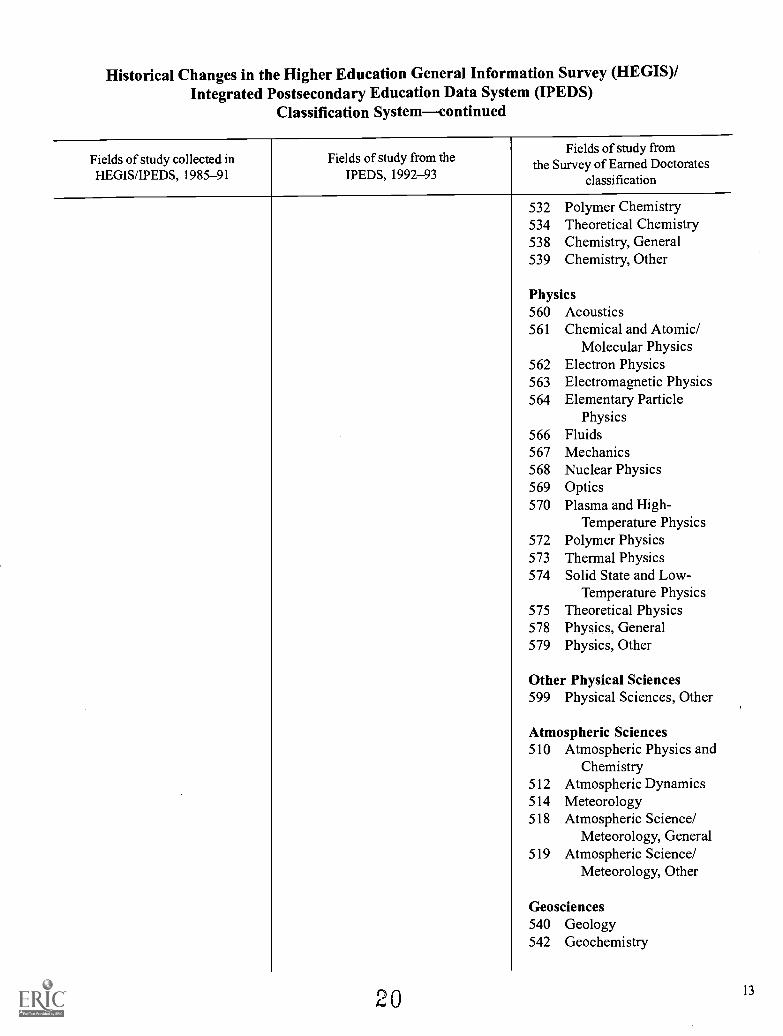
Historical Changes in the Higher Education General Information Survey (HEGIS)/Integrated Postsecondary Education Data System (IPEDS)
Classification Systemcontinued
Fields of study collected inHEGIS/IPEDS, 1985-91
Fields of study from theIPEDS, 1992-93
Fields of study fromthe Survey of Earned Doctorates
classification
532 Polymer Chemistry534 Theoretical Chemistry538 Chemistry, General539 Chemistry, Other
Physics560 Acoustics561 Chemical and Atomic/
Molecular Physics562 Electron Physics563 Electromagnetic Physics564 Elementary Particle
Physics566 Fluids567 Mechanics568 Nuclear Physics569 Optics570 Plasma and High-
Temperature Physics572 Polymer Physics573 Thermal Physics574 Solid State and Low-
Temperature Physics575 Theoretical Physics578 Physics, General579 Physics, Other
Other Physical Sciences599 Physical Sciences, Other
Atmospheric Sciences510 Atmospheric Physics and
Chemistry512 Atmospheric Dynamics514 Meteorology518 Atmospheric Science/
Meteorology, General519 Atmospheric Science/
Meteorology, Other
Geosciences540 Geology542 Geochemistry
20 13

Historical Changes in the Higher Education General Information Survey (HEGIS)/Integrated Postsecondary Education Data System (IPEDS)
Classification Systemcontinued
Fields of study collected inHEGIS/IPEDS, 1985-91
Fields of study from theIPEDS, 1992-93
Fields of study fromthe Survey of Earned Doctorates
classification
Mathematical Science27 Mathematics
14
Mathematical Science27 Mathematics
21
544 Geophysics andSeismology
545 Geophysics (Solid Earth)546 Paleontology548 Mineralogy and Petrology549 Mineralogy, Petrology, and
Geochemistry550 Stratigraphy and
Sedimentation552 Geomorphology and
Glacial Geology554 Applied Geology555 Applied Geology and
Geological Engineering558 Geological and Related
Sciences, General559 Geological and Related
Sciences, Other585 Hydrology and Water
Resources
Oceanography590 Oceanography595 Marine Sciences
Other Environmental Sciences580 Environmental Science
MATHEMATICAL/COMPUTERSCIENCESMathematics420 Applied Mathematics425 Algebra430 Analysis and Functional
Analysis435 Geometry440 Logic445 Number Theory450 Mathematical Statistics455 Topology460 Computing Theory and
Practice465 Operations Research

Historical Changes in the Higher Education General Information Survey (HEGIS)/Integrated Postsecondary Education Data System (IPEDS)
Classification Systemcontinued
Fields of study collected inHEGIS/IPEDS, 1985-91
Fields of study from theIPEDS, 1992-93
Fields of study fromthe Survey of Earned Doctorates
classification
Computer Science11 Computer and
Information Sciences
Agricultural Science
Computer Science11 Computer and
Information Sciences
Agricultural Science
498 Mathematics, General499 Mathematics, Other
Computer Science400 Computer Science410 Information Science and
Systems
BIOLOGICAL/AGRICULTURAL SCIENCESAgricultural Sciences
02 Agricultural Sciences 02 Agricultural Sciences 005 Animal Breeding and03 Renewable Natural 03 Conservation and Genetics
Resources Renewable Natural 007 Animal HusbandryResources 010 Animal Nutrition
012 Dairy Science014 Poultry Science019 Animal Sciences, Other020 Agronomy and Crop
Science025 Plant Breeding and
Genetics030 Plant Pathology032 Plant Protection/Pest
Management039 Plant Sciences, Other040 Food Sciences042 Food Distribution043 Food Engineering044 Food Sciences, Other045 Soil Sciences046 Soil Chemistry and
Microbiology049 Soil Sciences, Other050 Horticulture Science054 Fish and Wildlife055 Fisheries Science and
Management060 Wildlife Management065 Forestry Sciences066 Forest Biology068 Forest Engineering070 Forest Management
15

16
Historical Changes in the Higher Education General Information Survey (HEGIS)/Integrated Postsecondary Education Data System (IPEDS)
Classification Systemcontinued
Fields of study collected inHEGIS/IPEDS, 1985-91
Fields of study from theIPEDS, 1992-93
Fields of study fromthe Survey of Earned Doctorates
classification
Biological Science26 Biological Sciences/Life
Sciences
Biological Science26 Biological Sciences/Life
Sciences
072 Wood Science and Pulp/Paper Technology
074 Conservation andRenewable NaturalResources
079 Forestry and RelatedSciences
080 Wildlife and RangeManagement
098 Agricultural Science,General
099 Agricultural Science, Other
Biological Sciences100 Biochemistry105 Biophysics107 Biotechnology Research110 Bacteriology115 Plant Genetics120 Plant Pathology125 Plant Physiology129 Botany, Other130 Anatomy133 Biometrics and
Biostatistics136 Cell Biology139 Ecology140 Hydrobiology142 Embryology145 Endocrinology148 Entomology151 Biological Immunology154 Molecular Biology156 Microbiology and
Bacteriology157 Microbiology160 Neuroscience163 Nutritional Sciences166 Parasitology169 Toxicology170 Genetics, Human and
Animal171 Genetics
23

Historical Changes in the Higher Education General Information Survey (HEGIS)/Integrated Postsecondary Education Data System (IPEDS)
Classification Systemcontinued
Fields of study collected inHEGIS/IPEDS, 1985-91
Fields of study from theIPEDS, 1992-93
Fields of study fromthe Survey of Earned Doctorates
classification
SOCIAL SCIENCES
Social Science
SOCIAL SCIENCES
Social Science
175 Pathology, Human andAnimal
180 Pharmacology, Human andAnimal
185 Physiology, Human andAnimal
186 Animal and PlantPhysiology
189 Zoology, Other198 Biological Sciences,
General199 Biological Sciences, Other
SOCIAL SCIENCESEconomics000 Agricultural Economics666 Economics668 Econometrics
Political Science674 International Relations/
Affairs678 Political Science and
Government679 Political Science and
Public Administration682 Public Policy Analysis976 Public Administration
Sociology662 Demography and
Population Studies686 Sociology
Other Social Sciences05 Area and Ethnic Studies 05 Area, Ethnic, and Cultural 650 Anthropology45 Social Sciences Studies 652 Area Studies
45 Social Sciences and 658 CriminologyHistory 670 Geography
690 Statistics694 Urban Affairs/Studies698 Social Sciences, General699 Social Sciences, Other
17
24

18
Historical Changes in the Higher Education General Information Survey (HEGIS)/Integrated Postsecondary Education Data System (IPEDS)
Classification Systemcontinued
Fields of study collected inHEGIS/IPEDS, 1985-91
Fields of study from theIPEDS, 1992-93
Fields of study fromthe Survey of Earned Doctorates
classification
Psychology Psychology
710 History and Philosophy ofScience and Technology
729 Linguistics770 American Studies773 Archeology
Psychology42 Psychology 42 Psychology 600 Clinical Psychology
603 Cognitive Psychology andPsycholinguistics
606 Comparative Psychology609 Counseling Psychology612 Developmental and Child
Psychology615 Experimental Psychology616 Experimental,
Comparative, andPhysiologicalPsychology
618 Educational Psychology619 Human Engineering621 Industrial and
OrganizationalPsychology
624 Personality Psychology627 Physiological Psychology/
Psychobiology630 Psychometrics633 Quantitative Psychology636 School Psychology639 Social Psychology648 Psychology, General649 Psychology, Other
NON-S&E NON-S&E NON-S&E
01 Agribusiness and 01 Agricultural Business and MEDICAL SCIENCESAgricultural Production Production 205 Dentistry
04 Architecture and 04 Architecture and Related 210 Environmental HealthEnvironmental Design Programs 215 Public Health
06 Business and Management 219 Public Health andEpidemiology
25

Historical Changes in the Higher Education General Information Survey (HEGIS)/Integrated Postsecondary Education Data System (IPEDS)
Classification Systemcontinued
Fields of study collected inHEGIS/IPEDS, 1985-91
Fields of study from theIPEDS, 1992-93
Fields of study fromthe Survey of Earned Doctorates
classification
07 Business (Administrative 08 Marketing Operations/ 220 EpidemiologySupport), Other Marketing and 225 Medicine and Surgery
08 Marketing and Distribution Distribution 235 Optometry and
09 Communications 09 Communications Ophthalmology
12 Consumer, Personal, and 10 Communications 240 PharmacyMiscellaneous Services Technologies 250 Veterinary Science
13 Education 12 Personal and16 Foreign Languages Miscellaneous Services OTHER SCIENCES17 Allied Health 13 Education 200 Speech/Language
18 Health Sciences (Including 15 Engineering-Related Pathology andDentistry, Medicine,Optometry, Osteopathic 16
TechnologiesForeign Languages and
Audiology212 Health Systems/Services
Medicine, Pharmacy,Podiatry or Podiatric 17
LiteraturesAllied Health
Administration224 Hospital Administration
19
Medicine or Chiropody,Veterinary Medicine,Chiropractic)
Home Economics
18 Health Professions andRelated Sciences(Including Dentistry,Medicine, Optometry,
230 Nursing245 Rehabilitation/Therapeutic
Services298 Health Sciences, General
20 Vocational HomeEconomics
Osteopathic Medicine,Pharmacy, Podiatry or
299 Health Sciences, Other
22 Law Podiatric Medicine or HISTORY23 Letters Chiropody, Veterinary 700 History, American24 Liberal/General Studies Medicine, Chiropractic, 705 History, European25 Library and Archival Allied Health) 718 History, General
Sciences 19 Home Economics 719 History, Other28 Military Sciences 20 Vocational Home29 Military Technologies Economics ENGLISH AND30 Multi-/Interdisciplinary 22 Law and Legal Studies LITERATURE
Studies 23 English Language and 720 Classics31 Parks and Recreation Literature/Letters 723 Comparative Literature
38 Philosophy and Religion 24 Liberal/General Studies 725 English and American39 Theology 25 Library and Archival Literature41 Science Technologies Sciences 726 English Language44 Public Affairs (Does not 28 Reserve Officer Training 732 Literature, American
include Parks and Corps (ROTC) 733 Literature, EnglishRecreation Management, 29 Military Technologies 734 English Languageand Law Enforcement 30 Multi-/Interdisciplinary 736 Speech and Rhetoricaland Correction) Studies Studies
43 Protective Services 31 Parks, Recreation, Leisure, 738 Letters, General46 Construction Trades and Fitness Studies 739 Letters, Other47 Mechanics and Repairers 38 Philosophy and Religion48 Precision Production 39 Theological Studies and FOREIGN LANGUAGES
Religious Vocations 740 French41 Science Technologies 743 German
19
26

Historical Changes in the Higher Education General Information Survey (HEGIS)/Integrated Postsecondary Education Data System (IPEDS)
Classification Systemcontinued
Fields of study collected inHEGIS/IPEDS, 1985-91
Fields of study from theIPEDS, 1992-93
Fields of study fromthe Survey of Earned Doctorates
classification
49 Transportation andMaterial Moving
50 Visual and Performing Arts
20
43 Protective Services44 Public Administration and
Services (Does notinclude Parks andRecreation Management,and Law Enforcementand Correction)
46 Construction Trades47 Mechanics and Repairers48 Precision Production
Trades49 Transportation and
Materials MovingWorkers
50 Visual and Performing Arts52 Business Management and
Administrative Services
27
746 Italian749 Spanish752 Russian755 Slavic (Other than Russian)758 Chinese762 Japanese765 Hebrew768 Arabic769 Other Languages and
Literature
OTHER HUMANITIES785 Philosophy (See also 440)798 Humanities, General799 Humanities, Other
RELIGION AND THEOLOGY790 Religion (See also 984)791 Religion and Theology984 Theology/Religious
Education (See also 790)
ARTS AND MUSIC774 Art, Applied775 Art, Fine/Applied776 Art History/Criticism/
Conservation780 Music795 Drama/Theater Arts
ARCHITECTURE ANDENVIRONMENTAL DESIGN960 Architecture and
Environmental Design
SCIENCE EDUCATION884 Science Education
MATHEMATICSEDUCATION874 Mathematics Education

Historical Changes in the Higher Education General Information Survey (HEGIS)/Integrated Postsecondary Education Data System (IPEDS)
Classification Systemcontinued
Fields of study collected inHEGIS/IPEDS, 1985-91
Fields of study from theIPEDS, 1992-93
Fields of study fromthe Survey of Earned Doctorates
classification
SOCIAL SCIENCEEDUCATION885 Social Science Education
OTHER SCIENCE/TECHNICAL EDUCATION860 Agricultural Education868 Health Education872 Technical and Industrial
Arts Education878 Nursing Education887 Technical Education
NON-SCIENCE EDUCATION800 Curriculum and Instruction805 Education Administration
and Supervision807 Educational Leadership810 Educational/Instructional
Media Design812 Early Childhood Education814 Education Measurement
and Statistics815 Education Statistics/
Research Methods820 Education Assessment,
Testing, andMeasurement
822 Educational Psychology(See also 618)
825 School Psychology (Seealso 636)
830 Social/PhilosophicalFoundations ofEducation
835 Special Education840 Counseling Education/
Counseling andGuidance Services
845 Education Evaluation andResearch
850 Pre-elementary/EarlyChildhood TeacherEducation
2821

Historical Changes in the Higher Education General Information Survey (HEGIS)/Integrated Postsecondary Education Data System (IPEDS)
Classification Systemcontinued
Fields of study collected inHEGIS/IPEDS, 1985-91
Fields of study from theIPEDS, 1992-93
Fields of study fromthe Survey of Earned Doctorates
classification
2922
852 Elementary TeacherEducation
854 Junior High TeacherEducation
856 Secondary TeacherEducation
858 Adult and ContinuingTeacher Education
861 Art Education862 Business Education864 English Education866 Foreign Languages
Education867 Physical Education, Health,
and Recreation870 Home Economics
Education876 Music Education880 Physical Education and
Coaching882 Reading Education886 Speech Education888 Trade and Industrial
Education889 Teacher Education,
Specific Academic andVocational Programs,Other
898 Education, General899 Education, Other
BUSINESS ANDMANAGEMENT002 Agricultural Business and
Management900 Accounting905 Banking/Financial Support
Services910 Business Administration
and Management915 Business/Managerial
Economics

Historical Changes in the Higher Education General Information Survey (HEGIS)/Integrated Postsecondary Education Data System (IPEDS)
Classification Systemcontinued
Fields of study collected inHEGIS/IPEDS, 1985-91
Fields of study from theIPEDS, 1992-93
Fields of study fromthe Survey of Earned Doctorates
classification
917 Management InformationSystems/Business DataProcessing
920 Marketing Managementand Research
925 Business Statistics930 Operations Research (See
also 363, 465)935 Organizational Behavior
(See also 621)938 Business Management/
Administrative Services,General
939 Business Management/Administrative Services,Other
INFORMATION FIELDS(JOURNALISM,BROADCASTING,LIBRARIANSHIP)940 Communications Research945 Journalism947 Mass Communications950 Radio and Television957 Communication Theory958 Communications, General959 Communications, Other972 Library Science
LAW968 Law
SOCIAL SERVICEPROFESSIONS980 Social Service Professions
VOCATIONAL STUDIESAND HOME ECONOMICS964 Home Economics
3023

24
Historical Changes in the Higher Education General Information Survey (HEGIS)/Integrated Postsecondary Education Data System (IPEDS)
Classification Systemcontinued
Fields of study collected inHEGIS/IPEDS, 1985-91
Fields of study from theIPEDS, 1992-93
Fields of study fromthe Survey of Earned Doctorates
classification
31
OTHER NON-SCIENCEFIELDS974 Parks/Recreation/Leisure/
Fitness988 Professional Fields,
General989 Professional Fields, Other999 Other Fields

SECTION C.
STATISTICAL CHARTS
32

LIST OF CHARTS
Chart Page
1. Percentage change in science and engineering and non-S&Ebachelor's degrees, by race/ethnicity: 1985-93 29
2. Percentage change in science and engineering and non-S&Ebachelor's degrees awarded to men, by race/ethnicity: 1985-93 29
3. Percentage change in science and engineering and non-S&Ebachelor's degrees awarded to women, by race/ethnicity: 1985-93 30
4. Percentage change in science and engineering and non-S&Emaster's degrees, by race/ethnicity: 1985-93 30
5. Percentage change in science and engineering and non-S&Emaster's degrees awarded to men, by race/ethnicity: 1985-93 31
6. Percentage change in science and engineering and non-S&Emaster's degrees awarded to women, by race/ethnicity: 1985-93 31
7. Percentage change in science and engineering and non-S&Edoctoral degrees, by race/ethnicity: 1985-93 32
8. Percentage change in science and engineering and non-S&Edoctoral degrees awarded to men, by race/ethnicity: 1985-93 32
9. Percentage change in science and engineering and non-S&Edoctoral degrees awarded to women, by race/ethnicity: 1985-93 33
10. Number of earned science and engineering degreesawarded to whites, by degree level: 1985-93 33
11. Number of earned science and engineering bachelor's degreesawarded to minority groups: 1985-93 34
12. Number of earned science and engineering master's degreesawarded to minority groups: 1985-93 34
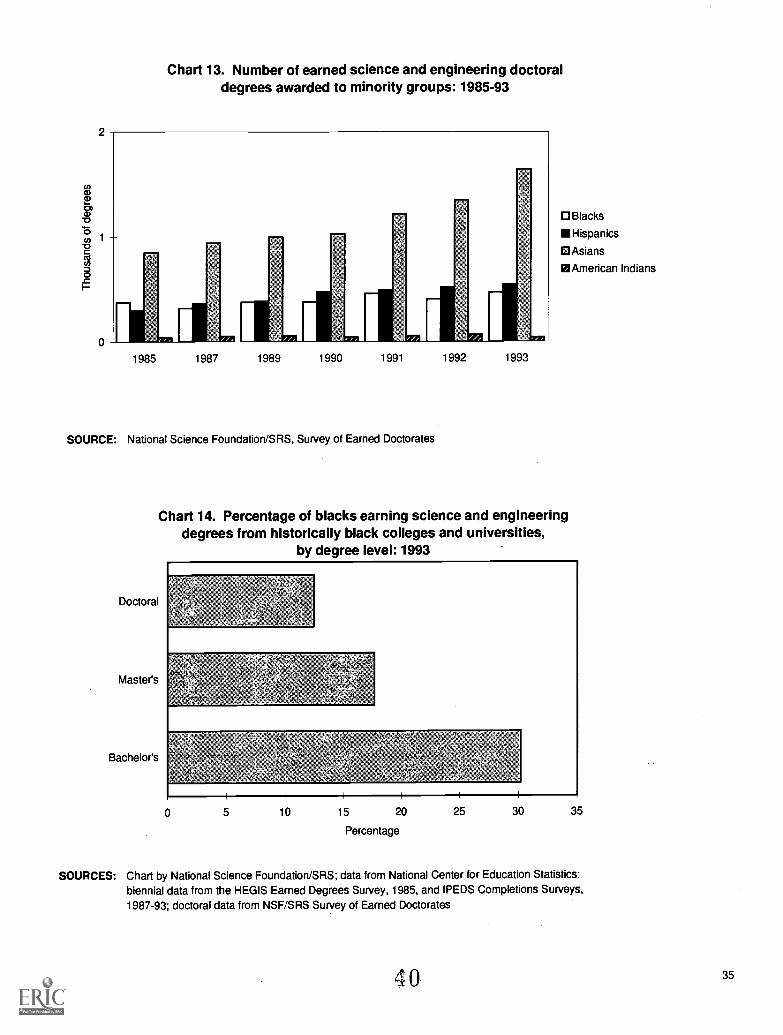
13. Number of earned science and engineering doctoral degreesawarded to minority groups: 1985-93 35
14. Percentage of blacks earning science and engineering degrees fromhistorically black colleges and universities, by degree level: 1993 35
15. Percentage of Hispanics earning science and engineering degrees frominstitutions in Puerto Rico, by degree level: 1993 36
33 27

Whites
Asians
Blacks
Hispanics
American Indians
Chart 1. Percentage change in science and engineering (S&E)and non-S&E bachelor's degrees, by race/ethnicity: 1985-93
-20 0
S&E recipients
1:1Non-S&E recipients
i I I i I ; 1 ;
20 40 60 80 100 120 140 160
Percentage change
180 200
SOURCES: Chart by National Science Foundation/SRS; data from National Center for Education Statistics:biennial data from the HEGIS Earned Degrees Survey, 1985, and IPEDS Completions Surveys, 1987-93
Whites
Asians
Blacks
Hispanics
American Indians
Chart 2. Percentage change in science and engineering (S&E)and non-S&E bachelor's degrees awarded to men,
by race/ethnicity: 1985-93
-20 0 20 40
S&E recipients
Non-S&E recipients
60 80 100 120 140 160 180
Percentage change
SOURCES: Chart by National Science Foundation/SRS; data from National Center for Education Statistics:biennial data from the HEGIS Earned Degrees Survey, 1985, and IPEDS Completions Surveys, 1987-93
3 4
200
29

Whites
Asians
Blacks
Hispanics
American Indians
Chart 3. Percentage change in science and engineering (S&E)and non-S&E bachelor's degrees awarded to women,
by race/ethnicity: 1985-93
1111111=EMEE_T
=EMMET!!MIIIIIIMI
-20 0
S&E recipients1:INon-S&E recipients
I I I 1 I I I I I
20 40 60 80 100 120
Percentage change
140 160 180 200
SOURCES: Chart by National Science Foundation/SRS; data from National Center for Education Statistics:biennial data from the HEGIS Earned Degrees Survey, 1985, and IPEDS Completions Surveys, 1987-93
Whites
Asians
Blacks
Hispanics
American Indians
Chart 4. Percentage change in science and engineering (S&E)and non-S&E master's degrees, by race/ethnicity: 1985-93
EIIIIM1111111911
IME1.7S&E recipients
O Non-S&E recipients
Tt I t 1 1 I I 1 I
-20 0 20 40 60 80 100 120 140 160 180 200
Percentage change
SOURCES: Chart by National Science Foundation/SRS; data from National Center for Education Statistics:biennial data from the HEGIS Earned Degrees Survey, 1985, and IPEDS Completions Surveys, 1987-93
30 35

Whites
Asians
Blacks
Hispanics
American Indians
Chart 5. Percentage change in science and engineering (S&E)and non-S&E master's degrees awarded to men,
by race/ethnicity: 1985-93
S&E recipients
Non-S&E recipients
-20 0 20 40 60 80 100 120 140 160 180 200
Percentage change
SOURCES: Chart by National Science Foundation/SRS; data from National Center for Education Statistics:biennial data from the HEGIS Earned Degrees Survey, 1985, and IPEDS Completions Surveys, 1987-93
Whites
Asians
Blacks
Hispanics
American Indians
Chart 6. Percentage change in science and engineering (S&E)and non-S&E master's degrees awarded to women,
by race/ethnicity: 1985-93
11111111=
-20 0
S&E recipients
o Non-S&E recipients
20 40 60 80 100 120 140 160 180 200
Percentage change
SOURCES: Chart by National Science Foundation/SRS; data from National Center for Education Statistics:biennial data from the HEGIS Earned Degrees Survey, 1985, and IPEDS Completions Surveys, 1987-93
31
26

32
Whites
Asians
Blacks
Hispanics
American Indians
Chart 7. Percentage change in science and engineering (S&E)and non-S&E doctoral degrees, by race/ethnicity: 1985-93
Nor
-20 0
S&E recipients
0 Non-S&E recipients
20 40 60 80 100 120 140 160 180 200
Percentage change
SOURCE: National Science Foundation/SRS, Survey of Earned Doctorates
Whites
Asians
Blacks
Hispanics
American Indians
Chart 8. Percentage change in science and engineering (S&E)and non-S&E doctoral degrees awarded to men,
by race/ethnicity: 1985-93
S&E recipients
Non-S&E recipients
-20 0 20 40 60 80 100 120 140 160 180 200
Percentage change
SOURCE: National Science Foundation/SRS, Survey of Earned Doctorates
3 7

Whites
Asians
Blacks
Hispanics
American Indians
Chart 9. Percentage change in science and engineering (S&E)and non-S&E doctoral degrees awarded to women,
by race/ethnicity: 1985-93
S&E recipients0 Non-S&E recipients
-20 0 20 40 60 80 100 120 140 160 180 200
Percentage change
SOURCE: National Science Foundation/SRS, Survey of Earned Doctorates
Chart 10. Number of earned science and engineering degreesawarded to whites, by degree level: 1985-93
300
250
200
150
100
50
0
0 Bachelors
Masters0 Doctoral
1985 1987 1989 1990 1991 1992 1993
SOURCES: Chart by National Science Foundation/SRS; data from National Center for Education Statistics:biennial data from the HEGIS Earned Degrees Survey, 1985, and IPEDS Completions Surveys,1987-93; doctoral data from NSF/SRS Survey of Earned Doctorates
3833

Chart 11. Number of earned science and engineering bachelor'sdegrees awarded to minority groups: 1985-93
1985 1987 1989 1990 1991 1992 1993
o Blacks
Hispanics
O Asians
12American Indians
SOURCES: Chart by National Science Foundation/SRS; data from National Center for Education Statistics:biennial data from the HEGIS Earned Degrees Survey, 1985, and IPEDS Completions Surveys,1987-93
5
4
cr,
30
2
0
1
0
Chart 12. Number of earned science and engineering master'sdegrees awarded to minority groups: 1985-93
1985 1987 1989 1990 1991 1992 1993
0 Blacks
Hispanics
DAsians
American Indians
SOURCES: Chart by National Science Foundation/SRS; data from National Center for Education Statistics:biennial data from the HEGIS Earned Degrees Survey, 1985, and IPEDS Completions Surveys,1987-93
34 3 9
2
1
0
Chart 13. Number of earned science and engineering doctoraldegrees awarded to minority groups: 1985-93
0 Blacks
Hispanics
Asians
El American Indians
1 1 711 1 11985 1987 1989 1990 1991 1992 1993
SOURCE: National Science Foundation/SRS, Survey of Earned Doctorates
Chart 14. Percentage of blacks earning science and engineeringdegrees from historically black colleges and universities,
by degree level: 1993
Doctoral
Masters
Bachelors
0 5 10 15 20
Percentage
25 30 35
SOURCES: Chart by National Science Foundation/SRS; data from National Center for Education Statistics:biennial data from the HEGIS Earned Degrees Survey, 1985, and IPEDS Completions Surveys,1987-93; doctoral data from NSF/SRS Survey of Earned Doctorates
40 35

Doctoral
Master's
Bachelor's
Chart 15. Percentage of Hispanics earning science andengineering degrees from institutions in Puerto Rico,
by degree level: 1993
0 5 10 15 20
Percentage
25 30 35
SOURCES: Chart by National Science Foundation/SRS; data from National Center for Education Statistics:biennial data from the HEGIS Earned Degrees Survey, 1985, and IPEDS Completions Surveys,1987-93; doctoral data from NSF/SRS Survey of Earned Doctorates
36 41

SECTION D.
DETAILED STATISTICAL TABLES
42

LIST OF TABLES
Table Page
1. Percentage distribution of earned bachelor's degreesin science and engineering, by citizenship, race/ethnicity,and sex of recipient: 1985-93, selected years 43
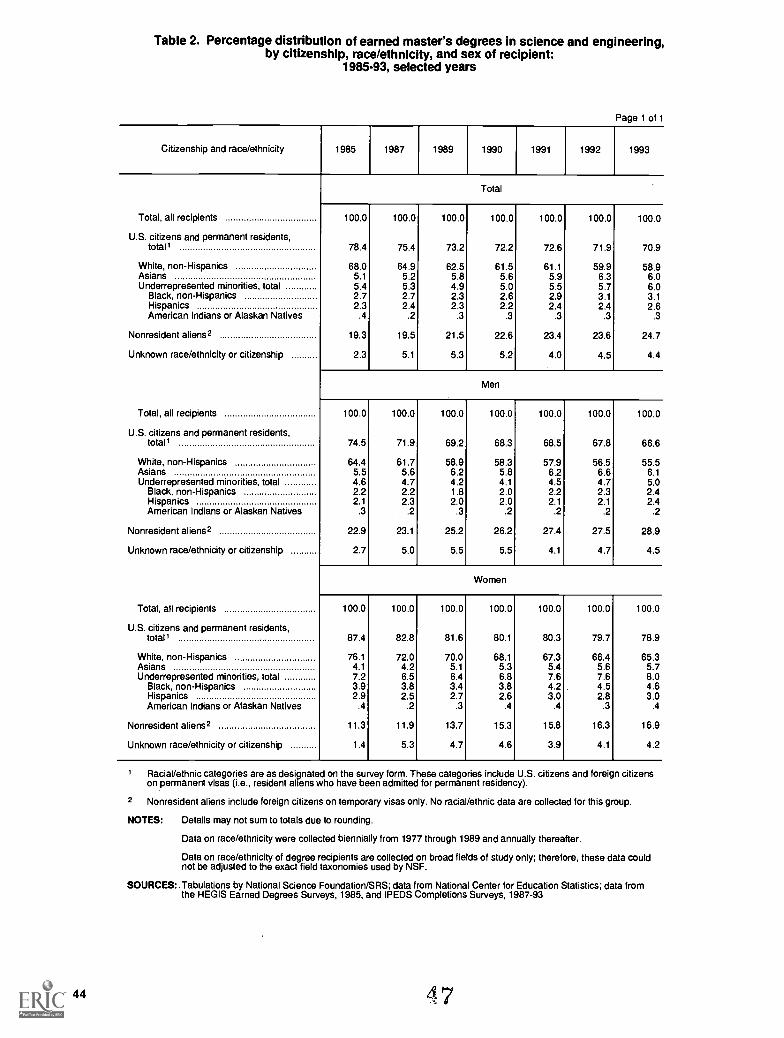
2. Percentage distribution of earned master's degreesin science and engineering, by citizenship, race/ethnicity,and sex of recipient: 1985-93, selected years 44
3. Percentage distribution of earned doctoral degreesin science and engineering, by citizenship, race/ethnicity,and sex of recipient: 1985-93, selected years 45
4. Number of earned bachelor's degrees, by fieldand by race/ethnicity of recipient: 1985-93, selected years 46
5. Number of earned bachelor's degrees, by fieldand by race/ethnicity of male recipients: 1985-93, selected years 50
6. Number of earned bachelor's degrees, by fieldand by race/ethnicity of female recipients: 1985-93, selected years 54
7. Number of earned master's degrees, by fieldand by race/ethnicity of recipient: 1985-93, selected years 58
8. Number of earned master's degrees, by fieldand by race/ethnicity of male recipients: 1985-93, selected years 62
9. Number of earned master's degrees, by fieldand by race/ethnicity of female recipients: 1985-93, selected years 66
10. Number of earned doctoral degrees, by fieldand by race/ethnicity of recipient: 1985-93, selected years 70
11. Number of earned doctoral degrees, by fieldand by race/ethnicity of male recipients: 1985-93, selected years 74
12. Number of earned doctoral degrees, by fieldand by race/ethnicity of female recipients: 1985-93, selected years 78
13. Number of earned bachelor's degrees conferredby historically black colleges and universities (HBCUs)to blacks, by field: 1985-93, selected years 82
14. Number of earned bachelor's degrees conferredby historically black colleges and universities (HBCUs)to black men, by field: 1985-93, selected years 83
39
43

40
LIST OF TABLESCONTINUED
Table Page
15. Number of earned bachelor's degrees conferredby historically black colleges and universities (HBCUs)to black women, by field: 1985-93, selected years 84
16. Number of earned master's degrees conferredby historically black colleges and universities (HBCUs)to blacks, by field: 1985-93, selected years 85
17. Number of earned master's degrees conferredby historically black colleges and universities (HBCUs)to black men, by field: 1985-93, selected years 86
18. Number of earned master's degrees conferredby historically black colleges and universities (HBCUs)to black women, by field: 1985-93, selected years 87
19. Number of earned doctoral degrees conferredby historically black colleges and universities (HBCUs)to blacks, by field: 1985-93, selected years 88
20. Number of earned doctoral degrees conferredby historically black colleges and universities (HBCUs)to black men, by field: 1985-93, selected years 89
21. Number of earned doctoral degrees conferredby historically black colleges and universities (HBCUs)to black women, by field: 1985-93, selected years 90
22. Number of earned bachelor's degrees conferred by institutionsin Puerto Rico to Hispanics, by field: 1985-93, selected years 91
23. Number of earned bachelor's degrees conferred by institutionsin Puerto Rico to Hispanic men, by field: 1985-93, selected years 92
24. Number of earned bachelor's degrees conferred by institutionsin Puerto Rico to Hispanic women, by field: 1985-93, selected years 93
25. Number of earned master's degrees conferred by institutionsin Puerto Rico to Hispanics, by field: 1985-93, selected years 94
26. Number of earned master's degrees conferred by institutionsin Puerto Rico to Hispanic men, by field: 1985-93, selected years 95
27. Number of earned master's degrees conferred by institutionsin Puerto Rico to Hispanic women, by field: 1985-93, selected years 96
44

LIST OF TABLESCONTINUED
Table Page
28. Number of earned doctoral degrees conferred by institutionsin Puerto Rico to Hispanics, by field: 1985-93, selected years 97
29. Number of earned doctoral degrees conferred by institutionsin Puerto Rico to Hispanic men, by field: 1985-93, selected years 98
30. Number of earned doctoral degrees conferred by institutionsin Puerto Rico to Hispanic women, by field: 1985-93, selected years 99
31. Number of earned bachelor's degrees awarded in engineering technologies,by race/ethnicity and sex of recipient: 1985-93 100
32. Number of earned master's degrees awarded in engineering technologies,by race/ethnicity and sex of recipient: 1985-93 101
33. Number of earned bachelor's degrees awarded in health fields,by race/ethnicity and sex of recipient: 1985-93 102
34. Number of earned master's degrees awarded in health fields,by race/ethnicity and sex of recipient: 1985-93 103
35. Number of earned doctoral degrees awarded in health fields,by race/ethnicity and sex of recipient: 1985-93 104
36. First-professional degrees awarded,by race/ethnicity and sex of recipient: 1985-93 105
37. First-professional degrees awarded in health fields,by race/ethnicity and sex of recipient: 1985-93 106
38. First-professional degrees awarded in non-health fields,by race/ethnicity and sex of recipient: 1985-93 107
4541

Table 1. Percentage distribution of earned bachelor's degrees in science and engineering,by citizenship, race/ethnicity, and sex of recipient:
1985-93, selected years
Page 1 of 1
Citizenship and race/ethnicity 1985 1987 1989 1990 1991 1992 1993
Total
Total, all recipients 100.0 100.0 100.0 100.0 100.0 100.0 100.0
U.S. citizens and permanent residents,total1 94.8 93.3 94.2 93.4 94.0 94.6 94.3
White, non-Hispanics 82.0 79.3 79.1 78.1 78.0 77.6 76.5Asians 3.9 4.9 5.7 5.6 5.8 6.0 6.3Underrepresented minorities, total 8.9 9.0 9.5 9.7 10.3 11.0 11.5
Black, non-Hispanics 5.0 5.0 5.2 5.3 5.6 6.0 6.3Hispanics 3.5 3.6 3.9 4.0 4.3 4.6 4.7American Indians or Alaskan Natives .4 .4 .4 .4 .4 .4 .5
Nonresident aliens2 4.1 4.0 3.7 3.6 3.6 3.2 3.6
Unknown race/ethnicity or citizenship 1.1 2.7 2.1 3.0 2.4 2.1 2.1
Men
Total, all recipients 100.0 100.0 100.0 100.0 100.0 100.0 100.0
U.S. citizens and permanent residents,total1 93.7 92.5 93.5 92.6 93.1 93.8 93.5
White, non-Hispanics 82.4 79.9 79.8 78.9 78.8 78.5 77.5Asians 3.9 5.0 5.8 5.8 5.9 6.3 6.6Underrepresented minorities, total 7.3 7.5 7.9 8.0 8.5 9.0 9.4
Black, non-Hispanics 3.8 3.8 3.9 3.9 4.2 4.5 4.7Hispanics 3.2 3.4 3.7 3.7 3.9 4.2 4.3American Indians or Alaskan Natives .4 .4 .3 .3 .3 .4 .4
Nonresident aliens2 5.1 4.9 4.6 4.5 4.5 4.0 4.4
Unknown race/ethnicity or citizenship 1.2 2.6 1.9 2.9 2.4 2.2 2.2
Women
Total, all recipients 100.0 100.0 100.0 100.0 100.0 100.0 100.0
U.S. citizens and permanent residents,total1 96.6 94.5 95.2 94.5 95.2 95.6 95.4
White, non-Hispanics 81.4 78.4 78.1 77.2 77.0 76.6 75.3Asians 3.8 4.8 5.5 5.4 5.5 5.6 6.0Underrepresented minorities, total 11.3 11.3 11.7 12.0 12.7 13.4 14.1
Black, non-Hispanics 6.9 6.9 7.0 7.1 7.4 7.8 8.2Hispanics 4.0 4.0 4.3 4.4 4.8 5.2 5.3American Indians or Alaskan Natives .5 .4 .4 .4 .4 .5 .5
Nonresident aliens2 2.5 2.5 2.4 2.3 2.4 2.3 2.5
Unknown race/ethnicity or citizenship .9 3.0 2.4 3.1 2.4 2.1 2.1
1 Racial/ethnic categories are as designated on the survey form. These categories include U.S. citizens and foreign citizenson permanent visas (i.e., resident aliens who have been admitted for permanent residency).
2 Nonresident aliens include foreign citizens on temporary visas only. No racial/ethnic data are collected for this group.
NOTES: Details may not sum to totals due to rounding.
Data on race/ethnicity were collected biennially from 1977 through 1989 and annually thereafter.
Data on race/ethnicity of degree recipients are collected on broad fields of study only; therefore, these data couldnot be adjusted to the exact field taxonomies used by NSF.
SOURCES: Tabulations by National Science Foundation/SRS; data from National Center for Education Statistics; data fromthe HEGIS Earned Degrees Surveys, 1985, and IPEDS Completions Surveys, 1987-93
BEST COPYAVAILABLE
46 43
44
Table 2. Percentage distribution of earned master's degrees in science and engineering,by citizenship, race/ethnicity, and sex of recipient:
1985-93, selected years
Page 1 of 1
Citizenship and race/ethnicity 1985 1987 1989 1990 1991 1992 1993
Total
Total, all recipients 100.0 100.0 100.0 100.0 100.0 100.0 100.0
U.S. citizens and permanent residents,total I 78.4 75.4 73.2 72.2 72.6 71.9 70.9
White, non-Hispanics 68.0 64.9 62.5 61.5 61.1 59.9 58.9Asians 5.1 5.2 5.8 5.6 5.9 6.3 6.0Underrepresented minorities, total 5.4 5.3 4.9 5.0 5.5 5.7 6.0
Black, non-Hispanics 2.7 2.7 2.3 2.6 2.9 3.1 3.1Hispanics 2.3 2.4 2.3 2.2 2.4 2.4 2.6American Indians or Alaskan Natives .4 .2 .3 .3 .3 .3 .3
Nonresident aliens2 19.3 19.5 21.5 22.6 23.4 23.6 24.7
Unknown race/ethnicity or citizenship 2.3 5.1 5.3 5.2 4.0 4.5 4.4
Men
Total, all recipients 100.0 100.0 100.0 100.0 100.0 100.0 100.0
U.S. citizens and permanent residents,total1 74.5 71.9 69.2 68.3 68.5 67.8 66.6
White, non-Hispanics 64.4 61.7 58.9 58.3 57.9 56.5 55.5Asians 5.5 5.6 6.2 5.8 6.2 6.6 6.1Underrepresented minorities, total 4.6 4.7 4.2 4.1 4.5 4.7 5.0
Black, non-Hispanics 2.2 2.2 1.8 2.0 2.2 2.3 2.4Hispanics 2.1 2.3 2.0 2.0 2.1 2.1 2.4American Indians or Alaskan Natives .3 .2 .3 .2 .2 .2 .2
Nonresident aliens2 22.9 23.1 25.2 26.2 27.4 27.5 28.9
Unknown race/ethnicity or citizenship 2.7 5.0 5.5 5.5 4.1 4.7 4.5
Women
Total, all recipients 100.0 100.0 100.0 100.0 100.0 100.0 100.0
U.S. citizens and permanent residents,total1 87.4 82.8 81.6 80.1 80.3 79.7 78.9
White, non-Hispanics 76.1 72.0 70.0 68.1 67.3 66.4 65.3Asians 4.1 4.2 5.1 5.3 5.4 5.6 5.7Underrepresented minorities, total 7.2 6.5 6.4 6.8 7.6 7.6 8.0
Black, non-Hispanics 3.9 3.8 3.4 3.8 4.2 4.5 4.6Hispanics 2.9 2.5 2.7 2.6 3.0 2.8 3.0American Indians or Alaskan Natives .4 .2 .3 .4 .4 .3 .4
Nonresident aliens2 11.3 11.9 13.7 15.3 15.8 16.3 16.9
Unknown race/ethnicity or citizenship 1.4 5.3 4.7 4.6 3.9 4.1 4.2
1 Racial/ethnic categories are as designated on the survey form. These categories include U.S. citizens and foreign citizenson permanent visas (i.e., resident aliens who have been admitted for permanent residency).
2 Nonresident aliens include foreign citizens on temporary visas only. No racial/ethnic data are collected for this group.
NOTES: Details may not sum to totals due to rounding.
Data on race/ethnicity were collected biennially from 1977 through 1989 and annually thereafter.
Data on race/ethnicity of degree recipients are collected on broad fields of study only; therefore, these data couldnot be adjusted to the exact field taxonomies used by NSF.
SOURCES: Tabulations by National Science Foundation/SRS; data from National Center for Education Statistics; data fromthe HEGIS Earned Degrees Surveys, 1985, and IPEDS Completions Surveys, 1987-93
47

Table 3. Percentage distribution of earned doctoral degrees in science and engineering,by citizenship, race/ethnicity, and sex of recipient:
1985-93, selected years
Page 1 of 1
Citizenship and race/ethnicity 1985 1987 1989 1990 1991 1992 1993
Total
Total, all recipients 100.0 100.0 100.0 100.0 100.0 100.0 100.0
U.S. citizens and permanent residents,total' 72.5 69.1 65.9 66.3 64.9 63.6 64.8
White, non-Hispanics 64.3 60.6 57.6 57.8 55.6 54.1 54.1
Asians 4.5 4.7 4.6 4.6 5.1 5.5 6.5Underrepresented minorities, total 3.8 3.7 3.7 3.9 4.2 4.0 4.2
Black, non-Hispanics 2.0 1.6 1.7 1.7 1.9 1.6 1.9Hispanics 1.6 1.8 1.8 2.1 2.1 2.1 2.1American Indians or Alaskan Natives .2 .3 .2 .2 .2 .3 .2
Nonresident aliens2 21.4 22.5 24.8 28.7 31.8 32.8 31.9
Unknown race/ethnicity or citizenship 6.1 8.5 9.3 5.0 3.3 3.6 3.4
Men
Total, all recipients 100.0 100.0 100.0 100.0 100.0 100.0 100.0
U.S. citizens and permanent residents,total' 68.5 64.3 60.6 60.8 58.8 57.8 58.8
White, non-Hispanics 60.7 56.4 52.7 52.7 50.3 49.1 49.1
Asians 4.7 4.8 4.8 4.8 4.9 5.3 6.2Underrepresented minorities, total 3.1 3.0 3.1 3.3 3.6 3.4 3.4
Black, non-Hispanics 1.7 1.3 1.4 1.4 1.6 1.4 1.5
Hispanics 1.3 1.5 1.5 1.8 1.8 1.8 1.8American Indians or Alaskan Natives .1 .2 .2 .2 .2 .2 .1
Nonresident aliens2 25.2 26.8 29.5 33.9 37.5 38.3 37.4
Unknown race/ethnicity or citizenship 6.2 8.9 9.9 5.3 3.6 3.8 3.8
Women
Total, all recipients 100.0 100.0 100.0 100.0 100.0 100.0 100.0
U.S. citizens and permanent residents,total1 84.0 82.1 79.6 80.6 79.8 78.0 78.7
White, non-Hispanics 74.5 72.2 70.3 71.1 68.5 66.5 65.7Asians 3.9 4.4 4.0 4.1 5.5 5.8 7.0
Underrepresented minorities, total 5.6 5.5 5.4 5.4 5.7 5.7 5.9
Black, non-Hispanics 2.8 2.5 2.5 2.3 2.8 2.3 2.7
Hispanics 2.3 2.7 2.5 2.8 2.7 3.0 3.0American Indians or Alaskan Natives .4 .4 .3 .3 .3 .4 .2
Nonresident aliens2 10.3 10.6 12.8 15.4 17.7 19.1 19.0
Unknown race/ethnicity or citizenship 5.7 7.3 7.6 4.0 2.5 2.9 2.3
1 Racial/ethnic categories are as designated on the survey form. These categories include U.S. citizens and foreign citizenson permanent visas (i.e., resident aliens who have been admitted for permanent residency).
2 Nonresident aliens include foreign citizens on temporary visas only.
NOTE: Details may not sum to totals due to rounding.
SOURCE: National Science Foundation/SRS, Survey of Earned Doctorates
48
BEST COPY AVAILABLE
45

Table 4. Number of earned bachelor's degrees, by field and by race/ethnicityof recipient: 1985-93, selected years
Page 1 of 4
Field 1985 1987 1989 1990 1991 1992 1993
Total, all recipients
Total science and engineering 342,970 343,070 337,431 345,793 356,785 376,933 388,435
Engineering 77,571 74,423 66,947 64,703 62,186 61,898 62,670
Sciences 265,399 268,647 270,484 281,090 294,599 315,035 325,765Natural sciences 130,058 125,371 109,350 105,234 105,595 111,108 116,742
Physical science1 23,847 20,155 17,329 16,203 16,407 17,076 17,691Mathematical science 15,267 16,515 15,314 14,674 14,784 14,851 14,870Computer science 39,121 39,927 30,963 27,695 25,410 24,854 24,477
Biological science 39,405 39,047 36,949 38,040 40,351 43,835 47,877Agricultural science 12,418 9,727 8,795 8,622 8,643 10,492 11,827
Social sciences 135,341 143,276 161,134 175,856 189,004 203,927 209,023Social science 95,104 100,081 112,180 121,838 130,111 139,884 141,772Psychology 40,237 43,195 48,954 54,018 58,893 64,043 67,251
Non-S&E 2 647,907 660,462 692,740 716,358 751,212 773,139 790,843
Grand total 990,877 1,003,532 1,030,171 1,062,151 1,107,997 1,150,072 1,179,278
White, non-Hispanics
Total science and engineering 281,394 272,090 266,862 270,225 278,190 292,614 297,171
Engineering 60,992 56,491 50,081 47,494 45,162 45,026 44,853
Sciences 220,402 215,599 216,781 222,731 233,028 247,588 252,318Natural sciences 107,076 98,344 84,578 80,210 80,111 84,133 87,401
Physical science1 20,541 16,653 14,238 13,055 13,145 13,678 13,941Mathematical science 12,163 13,265 12,287 11,765 11,649 11,723 11,669Computer science 31,321 29,181 21,711 18,918 17,349 16,844 16,155
Biological science 31,818 30,549 28,404 28,814 30,264 32,506 35,080Agricultural science 11,233 8,696 7,938 7,658 7,704 9,382 10,556
Social sciences 113,326 117,255 132,203 142,521 152,917 163,455 164,917Social science 79,367 81,494 91,697 98,385 104,783 111,389 111,154Psychology 33,959 35,761 40,506 44,136 48,134 52,066 53,763
Non-S&E 2 544,962 547,387 573,464 586,461 614,173 628,839 634,432
Grand total 826,356 819,477 840,326 856,686 892,363 921,453 931,603
Asians
Total science and engineering 13,323 16,934 19,138 19,437 20,552 22,635 24,504
Engineering 4,482 5,590 6,075 6,012 6,220 6,265 6,407
Sciences 8,841 11,344 13,063 13,425 14,332 16,370 18,097Natural sciences 5,809 7,130 7,260 7,326 7,595 8,496 9,524
Physical science1 763 894 922 937 983 1,001 1,098Mathematical science 885 1,034 1,019 874 915 857 915Computer science 2,044 2,455 2,268 2,144 2,010 2,082 2,245
Biological science 1,952 2,565 2,907 3,245 3,559 4,402 5,103Agricultural science 165 182 144 126 128 154 163
Social sciences 3,032 4,214 5,803 6,099 6,737 7,874 8,573Social science 2,187 3,060 4,228 4,469 4,852 5,724 6,035Psychology 845 1,154 1,575 1,630 1,885 2,150 2,538
Non-S&E2 12,239 14,987 18,435 18,590 21,173 23,981 26,083
Grand total 25,562 31,921 37,573 38,027 41,725 46,616 50,587
See explanatory information and SOURCES at end of table.
4649

Table 4. Number of earned bachelor's degrees, by field and by race/ethnicityof recipient: 1985-93, selected years
Page 2 of 4
Field 1985 1987 1989 1990 1991 1992 1993
Underrepresented minorities, total
Total science and engineering 30,455 30,939 31,950 33,419 36,682 41,383 44,682
Engineering 4,435 5,079 4,805 4,729 4,953 5,277 5,714
Sciences 26,020 25,860 27,145 28,690 31,729 36,106 38,968Natural sciences 10,879 11,607 10,830 10,530 10,960 11,722 12,510
Physical science1 1,588 1,480 1,322 1,245 1,355 1,425 1,528Mathematical science 1,164 1,207 1,218 1,178 1,334 1,432 1,490Computer science 3,327 4,307 3,742 3,416 3,292 3,342 3,390
Biological science 4,277 4,180 4,151 4,243 4,551 5,043 5,602Agricultural science 523 433 397 448 428 480 500
Social sciences 15,141 14,253 16,315 18,160 20,769 24,384 26,458Social science 10,539 9,920 11,212 12,394 14,100 16,647 17,918Psychology 4,602 4,333 5,103 5,766 6,669 7,737 8,540
Non-S&E 2 67,745 66,226 70,215 73,958 81,840 88,065 95,404
Grand total 98,200 97,165 102,165 107,377 118,522 129,448 140,086
Black, non-Hispanics
Total science and engineering 17,040 17,230 17,385 18,230 19,987 22,431 24,421
Engineering 2,039 2,315 2,067 2,072 2,229 2,362 2,577
Sciences 15,001 14,915 15,318 16,158 17,758 20,069 21,844Natural sciences 6,009 6,524 6,005 5,782 5,834 6,401 6,972
Physical science1 830 823 697 650 753 816 836Mathematical science 770 834 792 720 811 904 965Computer science 2,143 2,820 2,457 2,247 1,997 2,090 2,213
Biological science 2,047 1,890 1,916 1,994 2,111 2,385 2,739Agricultural science 219 157 143 171 162 206 219
Social sciences 8,992 8,391 9,313 10,376 11,924 13,668 14,872Social science 6,325 5,940 6,570 7,226 8,236 9,489 10,254Psychology 2,667 2,451 2,743 3,150 3,688 4,179 4,618
Non-S&E 2 40,523 37,873 39,452 41,071 45,022 48,880 52,246
Grand total 57,563 55,103 56,837 59,301 65,009 71,311 76,667
Hispanics
Total science and engineering 12,031 12,419 13,327 13,918 15,351 17,391 18,442
Engineering 2,187 2,554 2,561 2,511 2,566 2,733 2,961
Sciences 9,844 9,865 10,766 11,407 12,785 14,658 15,481Natural sciences 4,359 4,660 4,417 4,357 4,705 4,892 5,034
Physical science1 660 585 563 522 533 546 599Mathematical science 335 321 373 413 480 482 470Computer science 1,045 1,375 1,195 1,085 1,215 1,173 1,096
Biological science 2,069 2,146 2,090 2,119 2,264 2,477 2,652Agricultural science 250 233 196 218 213 214 217
Social sciences 5,485 5,205 6,349 7,050 8,080 9,766 10,447Social science 3,751 3,503 4,197 4,645 5,334 6,519 6,860Psychology 1,734 1,702 2,152 2,405 2,746 3,247 3,587
Non-S&E2 24,360 25,777 28,034 29,946 33,676 35,616 39,403
Grand total 36,391 38,196 41,361 43,864 49,027 53,007 57,845
See explanatory information and SOURCES at end of table.
47

Table 4. Number of earned bachelor's degrees, by field and by race/ethnicityof recipient: 1985-93, selected years
Page 3 of 4
Field 1985 1987 1989 1990 1991 1992 1993
American Indians or Alaskan Natives
Total science and engineering 1,384 1,290 1,238 1,271 1,344 1,561 1,819
Engineering 209 210 177 146 158 182 176
Sciences 1,175 1,080 1,061 1,125 1,186 1,379 1,643Natural sciences 511 423 408 391 421 429 504
Physical science1 98 72 62 73 69 63 93Mathematical science 59 52 53 45 43 46 55Computer science 139 112 90 84 80 79 81
Biological science 161 144 145 130 176 181 211Agricultural science 54 43 58 59 53 60 64
Social sciences 664 657 653 734 765 950 1,139Social science 463 477 445 523 530 639 804Psychology 201 180 208 211 235 311 335
Non-S&E 2 2,862 2,576 2,729 2,941 3,142 3,569 3,755
Grand total 4,246 3,866 3,967 4,212 4,486 5,130 5,574
U.S. citizens and permanent residents, total
Total science and engineering 325,172 319,963 317,950 323,081 335,424 356,632 366,357
Engineering 69,909 67,160 60,961 58,235 56,335 56,568 56,974
Sciences 255,263 252,803 256,989 264,846 279,089 300,064 309,383Natural sciences 123,764 117,081 102,668 98,066 98,666 104,351 109,435
Physical science 1 22,892 19,027 16,482 15,237 15,483 16,104 16,567Mathematical science 14,212 15,506 14,524 13,817 13,898 14,012 14,074Computer science 36,692 35,943 27,721 24,478 22,651 22,268 21,790
Biological science 38,047 37,294 35,462 36,302 38,374 41,951 45,785Agricultural science 11,921 9,311 8,479 8,232 8,260 10,016 11,219
Social sciences 131,499 135,722 154,321 166,780 180,423 195,713 199,948Social science 92,093 94,474 107,137 115,248 123,735 133,760 135,107Psychology 39,406 41,248 47,184 51,532 56,688 61,953 64,841
Non-S&E 2 624,946 628,600 662,114 679,009 717,186 740,885 755,919
Grand total 950,118 948,563 980,064 1,002,090 1,052,610 1,097,517 1,122,276
Nonresident aliens 3
Total science and engineering 14,071 13,677 12,323 12,318 12,724 12,238 13,802
Engineering 6,190 5,889 5,072 4,917 4,582 4,223 4,505
Sciences 7,881 7,788 7,251 7,401 8,142 8,015 9,297Natural sciences 5,011 5,019 4,422 4,326 4,556 4,369 5,086
Physical science I 780 635 605 595 608 607 764Mathematical science 763 655 543 524 578 592 552Computer science 2,116 2,578 2,135 2,066 2,037 1,974 2,204
Biological science 915 862 873 867 1,063 993 1,217Agricultural science 437 289 266 274 270 203 349
Social sciences 2,870 2,769 2,829 3,075 3,586 3,646 4,211Social science 2,327 2,275 2,318 2,550 2,895 2,982 3,381Psychology 543 494 511 525 691 664 830
Non-S&E2 15,187 14,915 14,134 14,235 16,933 16,309 18,569
Grand total 29,258 28,592 26,457 26,553 29,657 28,547 32,371
See explanatory information and SOURCES at end of table.
4851

Table 4. Number of earned bachelor's degrees, by field and by race/ethnicityof recipient: 1985-93, selected years
Page 4 of 4
Field 1985 1987 1989 1990 1991 1992 1993
Unknown race/ethnicity or citizenship
Total science and engineering 3,727 9,430 7,158 10,394 8,637 8,063 8,276
Engineering 1,472 1,374 914 1,551 1,269 1,107 1,191
Sciences 2,255 8,056 6,244 8,843 7,368 6,956 7,085Natural sciences 1,283 3,271 2,260 2,842 2,373 2,388 2,221
Physical science1 175 493 242 371 316 365 360Mathematical science 292 354 247 333 308 247 244Computer science 313 1,406 1,107 1,151 722 612 483
Biological science 443 891 614 871 914 891 875Agricultural science 60 127 50 116 113 273 259
Social sciences 972 4,785 3,984 6,001 4,995 4,568 4,864Social science 684 3,332 2,725 4,040 3,481 3,142 3,284Psychology 288 1,453 1,259 1,961 1,514 1,426 1,580
Non-S&E 2 7,774 16,947 16,492 23,114 17,093 15,945 16,355
Grand total 11,501 26,377 23,650 33,508 25,730 24,008 24,631
1 In this report, "Physical science" includes earth, atmospheric, and ocean sciences, as well as physics, astronomy, andchemistry.
2 Non-S&E refers to non-science and non-engineering.
3 Nonresident aliens include foreign citizens on temporary visas only. No racial/ethnic data are collected for this group.
NOTES: Data on race/ethnicity were collected biennially from 1977 through 1989 and annually thereafter.
Data on race/ethnicity of degree recipients are collected on broad fields of study only; therefore, these data couldnot be adjusted to the exact field taxonomies used by NSF.
Racial/ethnic categories are as designated on the survey form. These categories include U.S. citizens and foreigncitizens on permanent visas (i.e., resident aliens who have been admitted for permanent residency).
SOURCES: Tabulations by National Science Foundation/SRS; data from National Center for Education Statistics; data fromthe HEGIS Earned Degrees Surveys, 1985, and IPEDS Completions Surveys, 1987-93
`,2
49

Table 5. Number of earned bachelor's degrees, by field and by race/ethnicityof male recipients: 1985-93, selected years
Page 1 of 4
Field 1985 1987 1989 1990 1991 1992 1993
Total, all recipients
Total science and engineering 210,347 207,455 198,728 199,916 201,499 209,270 214,388
Engineering 66,326 63,020 56,759 54,730 52,522 52,270 52,696
Sciences 144,021 144,435 141,969 145,186 148,977 157,000 161,692Natural sciences 78,568 75,630 65,875 62,518 62,091 64,678 67,855
Physical sciencel 17,149 14,422 12,157 11,109 11,199 11,466 11,877Mathematical science 8,231 8,833 8,264 7,863 7,804 7,923 7,859Computer science 24,690 26,038 21,418 19,321 17,896 17,670 17,565
Biological science 20,435 20,039 18,295 18,631 19,715 21,107 23,111Agricultural science 8,063 6,298 5,741 5,594 5,477 6,512 7,443
Social sciences 65,453 68,805 76,094 82,668 86,886 92,322 93,837Social science 52,638 55,406 61,803 67,269 70,731 75,185 75,808Psychology 12,815 13,399 14,291 15,399 16,155 17,137 18,029
Non-S&E2 276,313 277,548 288,838 295,951 307,453 316,125 323,148
Grand total 486,660 485,003 487,566 495,867 508,952 525,395 537,536
White, non-Hispanics
Total science and engineering 173,396 165,825 158,590 157,675 158,687 164,220 166,063
Engineering 52,167 48,015 42,779 40,533 38,692 38,513 38,244
Sciences 121,229 117,810 115,811 117,142 119,995 125,707 127,819Natural sciences 65,695 60,575 52,132 48,848 48,304 50,126 52,048
Physical science1 14,980 12,139 10,173 9,179 9,203 9,430 9,614Mathematical science 6,509 7,050 6,598 6,253 6,119 6,255 6,131Computer science 20,188 19,793 15,799 13,974 12,916 12,571 12,329
Biological science 16,809 15,985 14,377 14,488 15,174 16,030 17,293Agricultural science 7,209 5,608 5,185 4,954 4,892 5,840 6,681
Social sciences 55,534 57,235 63,679 68,294 71,691 75,581 75,771Social science 44,665 46,066 51,766 55,662 58,414 61,574 61,269Psychology 10,869 11,169 11,913 12,632 13,277 14,007 14,502
Non-S&E 2 231,800 230,712 239,962 243,349 252,058 258,297 261,177
Grand total 405,196 396,537 398,552 401,024 410,745 422,517 427,240
Asians
Total science and engineering 8,229 10,445 11,578 11,528 11,942 13,198 14,132
Engineering 3,641 4,522 4,936 4,827 4,969 5,067 5,130
Sciences 4,588 5,923 6,642 6,701 6,973 8,131 9,002Natural sciences 3,245 4,029 4,073 4,054 4,149 4,783 5,380
Physical science I 504 598 626 592 606 615 675Mathematical science 474 532 527 491 482 486 502Computer science 1,158 1,490 1,420 1,335 1,268 1,373 1,492
Biological science 1,024 1,314 1,442 1,573 1,736 2,230 2,633Agricultural science 85 95 58 63 57 79 78
Social sciences 1,343 1,894 2,569 2,647 2,824 3,348 3,622Social science 1,058 1,489 2,065 2,156 2,260 2,728 2,884Psychology 285 405 504 491 564 620 738
Non-S&E 5,404 6,459 7,625 7,569 8,831 9,992 10,687
Grand total 13,633 16,904 19,203 19,097 20,773 23,190 24,819
See explanatory information and SOURCES at end of table.
50

Table 5. Number of earned bachelor's degrees, by field and by race/ethnicityof male recipients: 1985-93, selected years
Page 2 of 4
Field 1985 1987 1989 1990 1991 1992 1993
Underrepresented minorities, total
Total science and engineering 15,459 15,598 15,672 15,954 17,027 18,890 20,160
Engineering 3,511 3,886 3,638 3,574 3,654 3,952 4,261
Sciences 11,948 11,712 12,034 12,380 13,373 14,938 15,899Natural sciences 5,515 5,699 5,411 5,043 5,226 5,450 5,766
Physical science' 963 855 771 655 755 745 792Mathematical science 601 627 636 614 657 675 744Computer science 1,694 2,111 2,013 1,797 1,758 1,864 1,802
Biological science 1,892 1,818 1,734 1,685 1,799 1,885 2,130Agricultural science 365 288 257 292 257 281 298
Social sciences 6,433 6,013 6,623 7,337 8,147 9,488 10,133Social science 5,065 4,776 5,286 5,788 6,442 7,590 8,013Psychology 1,368 1,237 1,337 1,549 1,705 1,898 2,120
Non-S&E 2 25,728 24,756 25,978 27,093 29,887 31,805 34,440
Grand total 41,187 40,354 41,650 43,047 46,914 50,695 54,600
Black, non-Hispanics
Total science and engineering 7,926 7,886 7,685 7,830 8,448 9,375 10,099
Engineering 1,479 1,606 1,397 1,416 1,484 1,614 1,764
Sciences 6,447 6,280 6,288 6,414 6,964 7,761 8,335Natural sciences 2,833 2,939 2,732 2,476 2,538 2,709 2,872
Physical science' 457 433 365 292 391 381 370Mathematical science 376 399 374 342 380 374 444Computer science 1,036 1,284 1,205 1,074 971 1,092 1,049
Biological science 806 723 700 658 696 749 883Agricultural science 158 100 88 110 100 113 126
Social sciences 3,614 3,341 3,556 3,938 4,426 5,052 5,463Social science 2,863 2,680 2,911 3,144 3,547 4,070 4,364Psychology 751 661 645 794 879 982 1,099
Non-S&E2 15,114 14,056 14,228 14,760 15,790 17,143 18,275
Grand total 23,040 21,942 21,913 22,590 24,238 26,518 28,374
Hispanics
Total science and engineering 6,751 6,974 7,318 7,434 7,888 8,730 9,160
Engineering 1,863 2,100 2,100 2,035 2,039 2,187 2,355
Sciences 4,888 4,874 5,218 5,399 5,849 6,543 6,805Natural sciences 2,380 2,516 2,432 2,328 2,458 2,497 2,608
Physical science' 441 377 362 311 318 326 361Mathematical science 189 196 224 249 259 279 273Computer science 582 766 750 669 738 724 700
Biological science 997 1,018 965 955 1,019 1,043 1,144Agricultural science 171 159 131 144 124 125 130
Social sciences 2,508 2,358 2,786 3,071 3,391 4,046 4,197Social science 1,966 1,845 2,153 2,384 2,634 3,220 3,269Psychology 542 513 633 687 757 826 928
Non-S&E 2 9,398 9,664 10,684 11,249 12,893 13,296 14,665
Grand total 16,149 16,638 18,002 18,683 20,781 22,026 23,825
See explanatory information and SOURCES at end of table.
54 51

Table 5. Number of earned bachelor's degrees, by field and by race/ethnicityof male recipients: 1985-93, selected years
Page 3 of 4
Field 1985 1987 1989 1990 1991 1992 1993
American Indians or Alaskan Natives
Total science and engineering 782 738 669 690 691 785 901
Engineering 169 180 141 123 131 151 142
Sciences 613 558 528 567 560 634 759Natural sciences 302 244 247 239 230 244 286
Physical science1 65 45 44 52 46 38 61Mathematical science 36 32 38 23 18 22 27Computer science 76 61 58 54 49 48 53
Biological science 89 77 69 72 84 93 103Agricultural science 36 29 38 38 33 43 42
Social sciences 311 314 281 328 330 390 473Social science 236 251 222 260 261 300 380Psychology 75 63 59 68 69 90 93
Non-S&E 2 1,216 1,036 1,066 1,084 1,204 1,366 1,500
Grand total 1,998 1,774 1,735 1,774 1,895 2,151 2,401
U.S citizens and permanent residents, total
Total science and engineering 197,084 191,868 185,840 185,157 187,656 196,308 200,355
Engineering 59,319 56,423 51,353 48,934 47,315 47,532 47,635
Sciences 137,765 135,445 134,487 136,223 140,341 148,776 152,720Natural sciences 74,455 70,303 61,616 57,945 57,679 60,359 63,194
Physical science1 16,447 13,592 11,570 10,426 10,564 10,790 11,081Mathematical science 7,584 8,209 7,761 7,358 7,258 7,416 7,377Computer science 23,040 23,394 19,232 17,106 15,942 15,808 15,623
Biological science 19,725 19,117 17,553 17,746 18,709 20,145 22,056Agricultural science 7,659 5,991 5,500 5,309 5,206 6,200 7,057
Social sciences 63,310 65,142 72,871 78,278 82,662 88,417 89,526Social science 50,788 52,331 59,117 63,606 67,116 71,892 72,166Psychology 12,522 12,811 13,754 14,672 15,546 16,525 17,360
Non-S&E 2 262,932 261,927 273,565 278,011 290,776 300,094 306,304
Grand total 460,016 453,795 459,405 463,168 478,432 496,402 506,659
Nonresident aliens 3
Total science and engineering 10,733 10,266 9,043 8,936 8,983 8,341 9,394
Engineering 5,708 5,368 4,599 4,427 4,112 3,752 4,041
Sciences 5,025 4,898 4,444 4,509 4,871 4,589 5,353Natural sciences 3,371 3,320 2,902 2,856 2,995 2,806 3,271
Physical science1 580 461 406 415 411 417 525Mathematical science 476 421 347 324 374 358 345Computer science 1,444 1,776 1,517 1,472 1,463 1,419 1,601
Biological science 504 433 426 431 544 479 569Agricultural science 367 229 206 214 203 133 231
Social sciences 1,654 1,578 1,542 1,653 1,876 1,783 2,082Social science 1,459 1,419 1,372 1,493 1,698 1,608 1,862Psychology 195 159 170 160 178 175 220
Non-S&E 2 9,378 8,872 8,074 7,972 9,244 8,765 9,658
Grand total 20,111 19,138 17,117 16,908 18,227 17,106 19,052
See explanatory information and SOURCES at end of table.
52
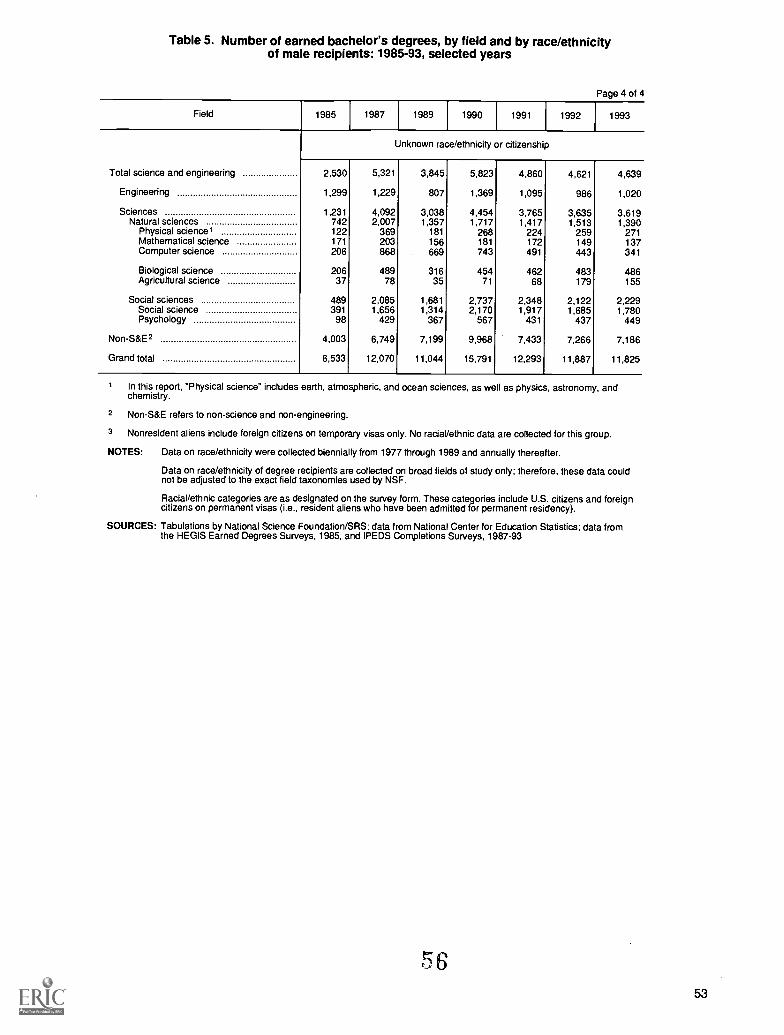
Table 5. Number of earned bachelor's degrees, by field and by race/ethnicityof male recipients: 1985-93, selected years
Page 4 of 4
Field 1985 1987 1989 1990 1991 1992 1993
Unknown race/ethnicity or citizenship
Total science and engineering 2,530 5,321 3,845 5,823 4,860 4,621 4,639
Engineering 1,299 1,229 807 1,369 1,095 986 1,020
Sciences 1,231 4,092 3,038 4,454 3,765 3,635 3,619Natural sciences 742 2,007 1,357 1,717 1,417 1,513 1,390
Physical science1 122 369 181 268 224 259 271Mathematical science 171 203 156 181 172 149 137Computer science 206 868 669 743 491 443 341
Biological science 206 489 316 454 462 483 486Agricultural science 37 78 35 71 68 179 155
Social sciences 489 2,085 1,681 2,737 2,348 2,122 2,229Social science 391 1,656 1,314 2,170 1,917 1,685 1,780Psychology 98 429 367 567 431 437 449
Non-S&E 2 4,003 6,749 7,199 9,968 7,433 7,266 7,186
Grand total 6,533 12,070 11,044 15,791 12,293 11,887 11,825
In this report, "Physical science" includes earth, atmospheric, and ocean sciences, as well as physics, astronomy, andchemistry.
2 Non-S&E refers to non-science and non-engineering.
3 Nonresident aliens include foreign citizens on temporary visas only. No racial/ethnic data are collected for this group.
NOTES: Data on race/ethnicity were collected biennially from 1977 through 1989 and annually thereafter.
Data on race/ethnicity of degree recipients are collected on broad fields of study only; therefore, these data couldnot be adjusted to the exact field taxonomies used by NSF.
Racial/ethnic categories are as designated on the survey form. These categories include U.S. citizens and foreigncitizens on permanent visas (i.e., resident aliens who have been admitted for permanent residency).
SOURCES: Tabulations by National Science Foundation/SRS; data from National Center for Education Statistics; data fromthe HEGIS Earned Degrees Surveys, 1985, and IPEDS Completions Surveys, 1987-93
,7653

Table 6. Number of earned bachelor's degrees, by field and by race/ethnicityof female recipients: 1985-93, selected years
Page 1 of 4
Field 1985 1987 1989 1990 1991 1992 1993
Total, all recipients
Total science and engineering 132,623 135,615 138,703 145,877 155,286 167,663 174,047
Engineering 11,245 11,403 10,188 9,973 9,664 9,628 9,974
Sciences 121,378 124,212 128,515 135,904 145,622 158,035 164,073Natural sciences 51,490 49,741 43,475 42,716 43,504 46,430 48,887
Physical science' 6,698 5,733 5,172 5,094 5,208 5,610 5,814Mathematical science 7,036 7,682 7,050 6,811 6,980 6,928 7,011Computer science 14,431 13,889 9,545 8,374 7,514 7,184 6,912
Biological science 18,970 19,008 18,654 19,409 20,636 22,728 24,766Agricultural science 4,355 3,429 3,054 3,028 3,166 3,980 4,384
Social sciences 69,888 74,471 85,040 93,188 102,118 111,605 115,186Social science 42,466 44,675 50,377 54,569 59,380 64,699 65,964Psychology 27,422 29,796 34,663 38,619 42,738 46,906 49,222
Non-S&E2 371,594 382,914 403,902 420,407 443,759 457,014 467,695
Grand total 504,217 518,529 542,605 566,284 599,045 624,677 641,742
White, non-Hispanics
Total science and engineering 107,998 106,265 108,272 112,550 119,503 128,394 131,108
Engineering 8,825 8,476 7,302 6,961 6,470 6,513 6,609
Sciences 99,173 97,789 100,970 105,589 113,033 121,881 124,499Natural sciences 41,381 37,769 32,446 31,362 31,807 34,007 35,353
Physical science' 5,561 4,514 4,065 3,876 3,942 4,248 4,327Mathematical science 5,654 6,215 5,689 5,512 5,530 5,468 5,538Computer science 11,133 9,388 5,912 4,944 4,433 4,273 3,826
Biological science 15,009 14,564 14,027 14,326 15,090 16,476 17,787Agricultural science 4,024 3,088 2,753 2,704 2,812 3,542 3,875
Social sciences 57,792 60,020 68,524 74,227 81,226 87,874 89,146Social science 34,702 35,428 39,931 42,723 46,369 49,815 49,885Psychology 23,090 24,592 28,593 31,504 34,857 38,059 39,261
Non-S&E2 313,162 316,675 333,502 343,112 362,115 370,542 373,255
Grand total 421,160 422,940 441,774 455,662 481,618 498,936 504,363
Asians
Total science and engineering 5,094 6,489 7,560 7,909 8,610 9,437 10,372
Engineering 841 1,068 1,139 1,185 1,251 1,198 1,277
Sciences 4,253 5,421 6,421 6,724 7,359 8,239 9,095Natural sciences 2,564 3,101 3,187 3,272 3,446 3,713 4,144
Physical science' 259 296 296 345 377 386 423Mathematical science 411 502 492 383 433 371 413Computer science 886 965 848 809 742 709 753
Biological science 928 1,251 1,465 1,672 1,823 2,172 2,470Agricultural science 80 87 86 63 71 75 85
Social sciences 1,689 2,320 3,234 3,452 3,913 4,526 4,951Social science 1,129 1,571 2,163 2,313 2,592 2,996 3,151Psychology 560 749 1,071 1,139 1,321 1,530 1,800
Non-S&E 2 6,835 8,528 10,810 11,021 12,342 13,989 15,396
Grand total 11,929 15,017 18,370 18,930 20,952 23,426 25,768
See explanatory information and SOURCES at end of table.
BEST COPY AVAILABLE
54

Table 6. Number of earned bachelor's degrees, by field and by race/ethnicityof female recipients: 1985-93, selected years
Page 2 of 4
Field 1985 1987 1989 1990 1991 1992 1993
Underrepresented minorities, total
Total science and engineering 14,996 15,341 16,278 17,465 19,655 22,493 24,522
Engineering 924 1,193 1,167 1,155 1,299 1,325 1,453
Sciences 14,072 14,148 15,111 16,310 18,356 21,168 23,069Natural sciences 5,364 5,908 5,419 5,487 5,734 6,272 6,744
Physical science1 625 625 551 590 600 680 736Mathematical science 563 580 582 564 677 757 746Computer science 1,633 2,196 1,729 1,619 1,534 1,478 1,588
Biological science 2,385 2,362 2,417 2,558 2,752 3,158 3,472Agricultural science 158 145 140 156 171 199 202
Social sciences 8,708 8,240 9,692 10,823 12,622 14,896 16,325Social science 5,474 5,144 5,926 6,606 7,658 9,057 9,905Psychology 3,234 3,096 3,766 4,217 4,964 5,839 6,420
Non-S&E 2 42,017 41,470 44,237 46,865 51,953 56,260 60,964
Grand total 57,013 56,811 60,515 64,330 71,608 78,753 85,486
Black, non-Hispanics
Total science and engineering 9,114 9,344 9,700 10,400 11,539 13,056 14,322
Engineering 560 709 670 656 745 748 813
Sciences 8,554 8,635 9,030 9,744 10,794 12,308 13,509Natural sciences 3,176 3,585 3,273 3,306 3,296 3,692 4,100
Physical science I 373 390 332 358 362 435 466Mathematical science 394 435 418 378 431 530 521Computer science 1,107 1,536 1,252 1,173 1,026 998 1,164
Biological science 1,241 1,167 1,216 1,336 1,415 1,636 1,856Agricultural science 61 57 55 61 62 93 93
Social sciences 5,378 5,050 5,757 6,438 7,498 8,616 9,409Social science 3,462 3,260 3,659 4,082 4,689 5,419 5,890Psychology 1,916 1,790 2,098 2,356 2,809 3,197 3,519
Non-S&E 2 25,409 23,817 25,224 26,311 29,232 31,737 33,971
Grand total 34,523 33,161 34,924 36,711 40,771 44,793 48,293
Hispanics
Total science and engineering 5,280 5,445 6,009 6,484 7,463 8,661 9,282
Engineering 324 454 461 476 527 546 606
Sciences 4,956 4,991 5,548 6,008 6,936 8,115 8,676Natural sciences 1,979 2,144 1,985 2,029 2,247 2,395 2,426
Physical science1 219 208 201 211 215 220 238Mathematical science 146 125 149 164 221 203 197Computer science 463 609 445 416 477 ,449 396
Biological science 1,072 1,128 1,125 1,164 1,245 1,434 1,508Agricultural science 79 74 65 74 89 89 87
Social sciences 2,977 2,847 3,563 3,979 4,689 5,720 6,250Social science 1,785 1,658 2,044 2,261 2,700 3,299 3,591Psychology 1,192 1,189 1,519 1,718 1,989 2,421 2,659
Non-S&E 2 14,962 16,113 17,350 18,697 20,783 22,320 24,738
Grand total 20,242 21,558 23,359 25,181 28,246 30,981 34,020
See explanatory information and SOURCES at end of table.
55

Table 6. Number of earned bachelor's degrees, by field and by race/ethnicityof female recipients: 1985-93, selected years
Page 3 of 4
Field 1985 1987 1989 1990 1991 1992 1993
American Indians or Alaskan Natives
Total science and engineering 602 552 569 581 653 776 918
Engineering 40 30 36 23 27 31 34
Sciences 562 522 533 558 626 745 884Natural sciences 209 179 161 152 191 185 218
Physical science1 33 27 18 21 23 25 32Mathematical science 23 20 15 22 25 24 28Computer science 63 51 32 30 31 31 28
Biological science 72 67 76 58 92 88 108Agricultural science 18 14 20 21 20 17 22
Social sciences 353 343 372 406 435 560 666Social science 227 226 223 263 269 339 424Psychology 126 117 149 143 166 221 242
Non-S&E 2 1,646 1,540 1,663 1,857 1,938 2,203 2,255
Grand total 2,248 2,092 2,232 2,438 2,591 2,979 3,173
U.S citizens and permanent residents, total
Total science and engineering 128,088 128,095 132,110 137,924 147,768 160,324 166,002
Engineering 10,590 10,737 9,608 9,301 9,020 9,036 9,339
Sciences 117,498 117,358 122,502 128,623 138,748 151,288 156,663Natural sciences 49,309 46,778 41,052 40,121 40,987 43,992 46,241
Physical science1 6,445 5,435 4,912 4,811 4,919 5,314 5,486Mathematical science 6,628 7,297 6,763 6,459 6,640 6,596 6,697Computer science 13,652 12,549 8,489 7,372 6,709 6,460 6,167
Biological science 18,322 18,177 17,909 18,556 19,665 21,806 23,729Agricultural science 4,262 3,320 2,979 2,923 3,054 3,816 4,162
Social sciences 68,189 70,580 81,450 88,502 97,761 107,296 110,422Social science 41,305 42,143 48,020 51,642 56,619 61,868 62,941Psychology 26,884 28,437 33,430 36,860 41,142 45,428 47,481
Non-S&E 2 362,014 366,673 388,549 400,998 426,410 440,791 449,615
Grand total 490,102 494,768 520,659 538,922 574,178 601,115 615,617
Nonresident aliens 3
Total science and engineering 3,338 3,411 3,280 3,382 3,741 3,897 4,408
Engineering 482 521 473 490 470 471 464
Sciences 2,856 2,890 2,807 2,892 3,271 3,426 3,944Natural sciences 1,640 1,699 1,520 1,470 1,561 1,563 1,815
Physical sciences 200 174 199 180 197 190 239Mathematical science 287 234 196 200 204 234 207Computer science 672 802 618 594 574 555 603
Biological science 411 429 447 436 519 514 648Agricultural science 70 60 60 60 67 70 118
Social sciences 1,216 1,191 1,287 1,422 1,710 1,863 2,129Social science 868 856 946 1,057 1,197 1,374 1,519Psychology 348 335 341 365 513 489 610
Non-S&E 2 5,809 6,043 6,060 6,263 7,689 7,544 8,911
Grand total 9,147 9,454 9,340 9,645 11,430 11,441 13,319
See explanatory information and SOURCES at end of table.
569

Table 6. Number of earned bachelor's degrees, by field and by race/ethnicityof female recipients: 1985-93, selected years
Page 4 of 4
Field 1985 1987 1989 1990 1991 1992 1993
Unknown race/ethnicity or citizenship
Total science and engineering 1,197 4,109 3,313 4,571 3,777 3,442 3,637
Engineering 173 145 107 182 174 121 171
Sciences 1,024 3,964 3,206 4,389 3,603 3,321 3,466Natural sciences 541 1,264 903 1,125 956 875 831
Physical science1 53 124 61 103 92 106 89Mathematical science 121 151 91 152 136 98 107Computer science 107 538 438 408 231 169 142
Biological science 237 402 298 417 452 408 389Agricultural science 23 49 15 45 45 94 104
Social sciences 483 2,700 2,303 3,264 2,647 2,446 2,635Social science 293 1,676 1,411 1,870 1,564 1,457 1,504Psychology 190 1,024 892 1,394 1,083 989 1,131
Non-S&E 2 3,771 10,198 9,293 13,146 9,660 8,679 9,169
Grand total 4,968 14,307 12,606 17,717 13,437 12,121 12,806
In this report, "Physical science" includes earth, atmospheric, and ocean sciences, as well as physics, astronomy, andchemistry.
2 Non-S&E refers to non-science and non-engineering.
3 Nonresident aliens include foreign citizens on temporary visas only. No racial/ethnic data are collected for this group.
NOTES: Data on race/ethnicity were collected biennially from 1977 through 1989 and annually thereafter.
Data on race/ethnicity of degree recipients are collected on broad fields of study only; therefore, these data couldnot be adjusted to the exact field taxonomies used by NSF.
Racial/ethnic categories are as designated on the survey form. These categories include U.S. citizens and foreigncitizens on permanent visas (i.e., resident aliens who have been admitted for permanent residency).
SOURCES: Tabulations by National Science Foundation/SRS; data from National Center for Education Statistics; data fromthe HEGIS Earned Degrees Surveys, 1985, and IPEDS Completions Surveys, 1987-93
6057

Table 7. Number of earned master's degrees, by field and by race/ethnicityof recipient: 1985-93, selected years
Page 1 of 4
Field 1985 1987 1989 1990 1991 1992 1993
Total, all recipients
Total science and engineering 64,726 66,774 70,333 72,228 72,828 76,184 81,415
Engineering 20,935 22,057 23,735 23,985 24,007 25,010 27,658
Sciences 43,791 44,717 46,598 48,243 48,821 51,174 53,757Natural sciences 24,034 25,269 26,089 26,293 25,669 26,775 27,713
Physical science' 5,802 5,638 5,703 5,411 5,282 5,352 5,365Mathematical science 2,888 3,327 3,430 3,684 3,632 4,019 4,084Computer science 7,101 8,481 9,399 9,643 9,324 9,530 10,167
Biological science 5,091 4,999 4,953 4,893 4,806 4,816 4,798Agricultural science 3,152 2,824 2,604 2,662 2,625 3,058 3,299
Social sciences 19,757 19,448 20,509 21,950 23,152 24,399 26,044Social science 11,276 11,283 11,857 12,642 13,350 14,119 15,024Psychology 8,481 8,165 8,652 9,308 9,802 10,280 11,020
Non-S&E 2 222,487 223,758 240,717 252,719 265,670 278,023 289,558
Grand total 287,213 290,532 311,050 324,947 338,498 354,207 370,973
White, non-Hispanics
Total science and engineering 43,982 43,360 43,945 44,450 44,513 45,649 47,975
Engineering 12,186 12,837 12,832 12,859 12,635 12,752 13,920
Sciences 31,796 30,523 31,113 31,591 31,878 32,897 34,055Natural sciences 16,735 16,352 16,080 15,742 15,005 15,136 15,322
Physical science' 4,133 3,834 3,766 3,401 3,129 3,067 3,078Mathematical science 1,873 2,012 2,032 2,169 2,068 2,336 2,354Computer science 4,303 4,717 4,786 4,851 4,637 4,407 4,464
Biological science 4,081 3,745 3,679 3,501 3,353 3,251 3,144Agricultural science 2,345 2,044 1,817 1,820 1,818 2,075 2,282
Social sciences 15,061 14,171 15,033 15,849 16,873 17,761 18,733Social science 7,841 7,473 7,958 8,360 8,900 9,523 9,923Psychology 7,220 6,698 7,075 7,489 7,973 8,238 8,810
Non-S&E 2 179,667 173,447 186,377 192,424 203,011 211,413 217,693
Grand total 223,649 216,807 230,322 236,874 247,524 257,062 265,668
Asians
Total science and engineering 3,285 3,455 4,100 4,055 4,310 4,763 4,846
Engineering 1,551 1,650 1,992 1,863 2,008 2,223 2,260
Sciences 1,734 1,805 2,108 2,192 2,302 2,540 2,586Natural sciences 1,229 1,426 1,617 1,629 1,735 1,916 1,918
Physical science' 213 227 278 234 251 295 249Mathematical science 164 183 178 184 189 201 197Computer science 615 779 894 941 1,014 1,105 1,106
Biological science 179 190 223 225 231 264 305Agricultural science 58 47 44 45 50 51 61
Social sciences 505 379 491 563 567 624 668Social science 376 266 360 404 397 441 477Psychology 129 113 131 159 170 183 191
Non-S&E2 4,520 4,674 6,074 5,939 6,760 7,530 8,323
Grand total 7,805 8,129 10,174 9,994 11,070 12,293 13,169
See explanatory information and SOURCES at end of table.
58 61

Table 7. Number of earned master's degrees, by field and by race/ethnicityof recipient: 1985-93, selected years
Page 2 of 4
Field 1985 1987 1989 1990 1991 1992 1993
Underrepresented minorities, total
Total science and engineering 3,484 3,515 3,446 3,615 4,026 4,360 4,899
Engineering 723 953 856 868 906 996 1,195
Sciences 2,761 2,562 2,590 2,747 3,120 3,364 3,704Natural sciences 1,097 1,122 1,025 1,002 1,195 1,258 1,358
Physical science I 237 210 188 194 182 209 231Mathematical science 115 136 99 127 194 147 184Computer science 315 352 381 357 425 480 484
Biological science 308 304 267 244 286 307 312Agricultural science 122 120 90 80 108 115 147
Social sciences 1,664 1,440 1,565 1,745 1,925 2,106 2,346Social science 857 758 777 868 1,031 1,118 1,282Psychology 807 682 788 877 894 988 1,064
Non-S&E 2 19,463 18,488 19,224 20,403 22,640 24,544 26,713
Grand total 22,947 22,003 22,670 24,018 26,666 28,904 31,612
Black, non-Hispanics
Total science and engineering 1,742 1,784 1,652 1,847 2,090 2,356 2,554
Engineering 330 403 355 387 398 466 564
Sciences 1,412 1,381 1,297 1,460 1,692 1,890 1,990Natural sciences 523 581 495 527 644 699 716
Physical science1 89 79 78 87 73 98 105Mathematical science 53 73 59 70 100 77 98Computer science 180 207 198 232 283 316 308
Biological science 151 167 124 110 137 149 135Agricultural science 50 55 36 28 51 59 70
Social sciences 889 800 802 933 1,048 1,191 1,274Social science 463 424 407 462 594 660 730Psychology 426 376 395 471 454 531 544
Non-S&E 2 12,218 11,389 11,803 12,626 13,767 15,064 16,343
Grand total 13,960 13,173 13,455 14,473 15,857 17,420 18,897
Hispanics
Total science and engineering 1,514 1,584 1,585 1,587 1,736 1,806 2,092
Engineering 346 512 468 446 468 488 581
Sciences 1,168 1,072 1,117 1,141 1,268 1,318 1,511Natural sciences 481 493 444 431 494 503 574
Physical sciences 127 122 92 98 96 93 114Mathematical science 55 60 34 51 85 66 78Computer science 94 123 144 118 128 149 162
Biological science 139 126 126 120 136 146 151Agricultural science 66 62 48 44 49 49 69
Social sciences 687 579 673 710 774 815 937Social science 343 308 313 341 383 396 474Psychology 344 271 360 369 391 419 463
Non-S&E 2 6,216 6,197 6,548 6,908 7,948 8,450 9,279
Grand total 7,730 7,781 8,133 8,495 9,684 10,256 11,371
See explanatory information and SOURCES at end of table.
62
BEST COPY AVAILABLE
59

Table 7. Number of earned master's degrees, by field and by race/ethnicityof recipient: 1985-93, selected years
Page 3 of 4
Field 1985 1987 1989 1990 1991 1992 1993
American Indians or Alaskan Natives
Total science and engineering 228 147 209 181 200 198 253
Engineering 47 38 33 35 40 42 50
Sciences 181 109 176 146 160 156 203Natural sciences 93 48 86 44 57 56 68
Physical science' 21 9 18 9 13 18 12Mathematical science 7 3 6 6 9 4 8Computer science 41 22 39 7 14 15 14
Biological science 18 11 17 14 13 12 26Agricultural science 6 3 6 8 8 7 8
Social sciences 88 61 90 102 103 100 135Social science 51 26 57 65 54 62 78Psychology 37 35 33 37 49 38 57
Non-S&E 2 1,029 902 873 869 925 1,030 1,091
Grand total 1,257 1,049 1,082 1,050 1,125 1,228 1,344
U.S citizens and permanent residents, total
Total science and engineering 50,751 50,330 51,491 52,120 52,849 54,772 57,720
Engineering 14,460 15,440 15,680 15,590 15,549 15,971 17,375
Sciences 36,291 34,890 35,811 36,530 37,300 38,801 40,345Natural sciences 19,061 18,900 18,722 18,373 17,935 18,310 18,598
Physical science' 4,583 4,271 4,232 3,829 3,562 3,571 3,558Mathematical science 2,152 2,331 2,309 2,480 2,451 2,684 2,735Computer science 5,233 5,848 6,061 6,149 6,076 5,992 6,054
Biological science 4,568 4,239 4,169 3,970 3,870 3,822 3,761Agricultural science 2,525 2,211 1,951 1,945 1,976 2,241 2,490
Social sciences 17,230 15,990 17,089 18,157 19,365 20,491 21,747Social science 9,074 8,497 9,095 9,632 10,328 11,082 11,682Psychology 8,156 7,493 7,994 8,525 9,037 9,409 10,065
Non-S&E 2 203,650 196,609 211,675 218,766 232,411 243,487 252,729
Grand total 254,401 246,939 263,166 270,886 285,260 298,259 310,449
Nonresident aliens 3
Total science and engineering 12,506 13,045 15,143 16,338 17,049 18,007 20,150
Engineering 5,694 5,781 6,747 7,239 7,520 7,899 9,119
Sciences 6,812 7,264 8,396 9,099 9,529 10,108 11,031Natural sciences 4,572 5,035 5,922 6,330 6,734 7,316 8,062
Physical science' 1,098 1,056 1,238 1,364 1,504 1,538 1,602Mathematical science 685 836 976 1,035 1,059 1,112 1,138Computer science 1,709 2,067 2,442 2,563 2,819 3,169 3,779
Biological science 474 509 636 729 749 795 849Agricultural science 606 567 630 639 603 702 694
Social sciences 2,240 2,229 2,474 2,769 2,795 2,792 2,969Social science 1,944 2,009 2,215 2,384 2,478 2,490 2,637Psychology 296 220 259 385 317 302 332
Non-S&E 2 14,446 15,219 16,980 18,264 20,562 21,645 23,959
Grand total 26,952 28,264 32,123 34,602 37,611 39,652 44,109
See explanatory information and SOURCES at end of table.
60
63

Table 7. Number of earned master's degrees, by field and by race/ethnicityof recipient: 1985-93, selected years
Page 4 of 4
Field 1985 1987 1989 1990 1991 1992 1993
Unknown race/ethnicity or citizenship
Total science and engineering 1,469 3,399 3,699 3,770 2,930 3,405 3,545
Engineering 781 836 1,308 1,156 938 1,140 1,164
Sciences 688 2,563 2,391 2,614 1,992 2,265 2,381Natural sciences 401 1,334 1,445 1,590 1,000 1,149 1,053
Physical science1 121 311 233 218 216 243 205Mathematical science 51 160 145 169 122 223 211Computer science 159 566 896 931 429 369 334
Biological science 49 251 148 194 187 199 188Agricultural science 21 46 23 78 46 115 115
Social sciences 287 1,229 946 1,024 992 1,116 1,328Social science 258 777 547 626 544 547 705Psychology 29 452 399 398 448 569 623
Non-S&E 2 4,391 11,930 12,062 15,689 12,697 12,891 12,870
Grand total 5,860 15,329 15,761 19,459 15,627 16,296 16,415
I In this report, "Physical science" includes earth, atmospheric, and ocean sciences, as well as physics, astronomy, andchemistry.
2 Non-S&E refers to non-science and non-engineering.
3 Nonresident aliens include foreign citizens on temporary visas only. No racial/ethnic data are collected for this group.
NOTES: Data on race/ethnicity were collected biennially from 1977 through 1989 and annually thereafter.
Data on race/ethnicity of degree recipients are collected on broad fields of study only; therefore, these data couldnot be adjusted to the exact field taxonomies used by NSF.
Racial/ethnic categories are as designated on the survey form. These categories include U.S. citizens and foreigncitizens on permanent visas (i.e., resident aliens who have been admitted for permanent residency).
SOURCES: Tabulations by National Science Foundation/SRS; data from National Center for Education Statistics; data fromthe HEGIS Earned Degrees Surveys, 1985, and IPEDS Completions Surveys, 1987-93
6 461

Table 8. Number of earned master's degrees, by field and by race/ethnicityof male recipients: 1985-93, selected years
Page 1 of 4
Field 1985 1987 1989 1990 1991 1992 1993
Total, all recipients
Total science and engineering 44,928 45,611 47,724 48,424 47,748 49,768 53,102
Engineering 18,692 19,290 20,654 20,717 20,650 21,345 23,565
Sciences 26,236 26,321 27,070 27,707 27,098 28,423 29,537Natural sciences 16,300 16,714 17,250 17,258 16,530 17,480 18,076
Physical science1 4,450 4,225 4,180 3,981 3,825 3,895 3,803Mathematical science 1,877 2,026 2,060 2,208 2,146 2,457 2,468Computer science 5,064 5,985 6,773 6,968 6,563 6,884 7,411
Biological science 2,662 2,555 2,491 2,393 2,315 2,316 2,365Agricultural science 2,247 1,923 1,746 1,708 1,681 1,928 2,029
Social sciences 9,936 9,607 9,820 10,449 10,568 10,943 11,461Social science 6,872 6,769 7,006 7,424 7,574 7,939 8,419Psychology 3,064 2,838 2,814 3,025 2,994 3,004 3,042
Non-S&E 2 98,788 96,044 101,675 105,601 109,147 112,531 116,651
Grand total 143,716 141,655 149,399 154,025 156,895 162,299 169,753
White, non-Hispanics
Total science and engineering 28,918 28,120 28,115 28,250 27,634 28,113 29,493
Engineering 10,646 10,963 10,874 10,922 10,742 10,775 11,777
Sciences 18,272 17,157 17,241 17,328 16,892 17,338 17,716Natural sciences 11,096 10,523 10,357 10,116 9,491 9,675 9,837
Physical science1 3,135 2,855 2,750 2,518 2,299 2,234 2,229Mathematical science 1,170 1,187 1,173 1,275 1,169 1,389 1,332Computer science 3,052 3,229 3,430 3,474 3,260 3,236 3,326
Biological science 2,126 1,932 1,830 1,711 1,629 1,566 1,593Agricultural science 1,613 1,320 1,174 1,138 1,134 1,250 1,357
Social sciences 7,176 6,634 6,884 7,212 7,401 7,663 7,879Social science 4,575 4,309 4,592 4,781 4,981 5,276 5,453Psychology 2,601 2,325 2,292 2,431 2,420 2,387 2,426
Non-S&E2 77,149 71,939 75,927 77,825 80,283 82,684 84,224
Grand total 106,067 100,059 104,042 106,075 107,917 110,797 113,717
Asians
Total science and engineering 2,475 2,559 2,939 2,799 2,959 3,276 3,237
Engineering 1,374 1,455 1,699 1,557 1,685 1,816 1,819
Sciences 1,101 1,104 1,240 1,242 1,274 1,460 1,418Natural sciences 804 908 990 976 1,031 1,169 1,149
Physical science1 154 164 179 140 165 206 150Mathematical science 108 110 117 106 108 103 121Computer science 414 522 565 609 627 705 710
Biological science 86 85 105 97 104 125 136Agricultural science 42 27 24 24 27 30 32
Social sciences 297 196 250 266 243 291 269Social science 249 163 206 224 196 229 219Psychology 48 33 44 42 47 62 50
Non-S&E 2 2,377 2,419 2,978 2,871 3,261 3,547 3,888
Grand total 4,852 4,978 5,917 5,670 6,220 6,823 7,125
See explanatory information and SOURCES at end of table.
62 65

Table 8. Number of earned master's degrees, by field and by race/ethnicityof male recipients: 1985-93, selected years
Page 2 of 4
Field 1985 1987 1989 1990 1991 1992 1993
Underrepresented minorities, total
Total science and engineering 2,064 2,130 1,990 2,005 2,129 2,340 2,637
Engineering 621 791 685 687 711 775 924
Sciences 1,443 1,339 1,305 1,318 1,418 1,565 1,713Natural sciences 670 688 639 610 664 728 764
Physical science' 175 140 133 130 124 144 142Mathematical science 69 87 58 74 112 92 102Computer science 201 236 255 238 244 283 308
Biological science 137 137 129 120 116 137 132Agricultural science 88 88 64 48 68 72 80
Social sciences 773 651 666 708 754 837 949Social science 478 427 416 429 482 556 672Psychology 295 224 250 279 272 281 277
Non-S&E2 7,072 6,768 7,049 7,316 8,078 8,336 9,266
Grand total 9,136 8,898 9,039 9,321 10,207 10,676 11,903
Black, non-Hispanics
Total science and engineering 973 990 878 950 1,028 1,166 1,253
Engineering 274 315 262 287 299 332 407
Sciences 699 675 616 663 729 834 846Natural sciences 300 338 290 307 338 382 386
Physical science' 61 45 56 61 43 66 58Mathematical science 34 45 32 37 53 44 48Computer science 108 126 119 140 150 175 193
Biological science 67 80 59 51 58 61 47Agricultural science 30 42 24 18 34 36 40
Social sciences 399 337 326 356 391 452 460Social science 253 221 206 223 262 315 345Psychology 146 116 120 133 129 137 115
Non-S&E 2 4,238 3,895 4,086 4,219 4,591 4,628 5,219
Grand total 5,211 4,885 4,964 5,169 5,619 5,794 6,472
Hispanics
Total science and engineering 939 1,045 970 959 992 1,066 1,255
Engineering 304 444 394 373 378 408 480
Sciences 635 601 576 586 614 658 775Natural sciences 307 318 282 275 294 309 341
Physical science' 95 88 65 63 73 64 76Mathematical science 31 41 21 33 52 47 50Computer science 65 91 100 93 84 98 104
Biological science 62 53 62 61 54 69 76Agricultural science 54 45 34 25 31 31 35
Social sciences 328 283 294 311 320 349 434Social science 195 187 176 178 196 218 282Psychology 133 96 118 133 124 131 152
Non-S&E 2 2,403 2,476 2,627 2,754 3,132 3,315 3,620
Grand total 3,342 3,521 3,597 3,713 4,124 4,381 4,875
See explanatory information and SOURCES at end of table.
6663

Table 8. Number of earned master's degrees, by field and by race/ethnicityof male recipients: 1985-93, selected years
Page 3 of 4
Field 1985 1987 1989 1990 1991 1992 1993
American Indians or Alaskan Natives
Total science and engineering 152 95 142 96 109 108 129
Engineering 43 32 29 27 34 35 37
Sciences 109 63 113 69 75 73 92Natural sciences 63 32 67 28 32 37 37
Physical science' 19 7 12 6 8 14 8Mathematical science 4 1 5 4 7 1 4Computer science 28 19 36 5 10 10 11
Biological science 8 4 8 8 4 7 9Agricultural science 4 1 6 5 3 5 5
Social sciences 46 31 46 41 43 36 55Social science 30 19 34 28 24 23 45Psychology 16 12 12 13 19 13 10
Non-S&E2 431 397 336 343 355 393 427
Grand total 583 492 478 439 464 501 556
U.S citizens and permanent residents, total
Total science and engineering 33,457 32,809 33,044 33,054 32,722 33,729 35,367
Engineering 12,641 13,209 13,258 13,166 13,138 13,366 14,520
Sciences 20,816 19,600 19,786 19,888 19,584 20,363 20,847Natural sciences 12,570 12,119 11,986 11,702 11,186 11,572 11,750
Physical science' 3,464 3,159 3,062 2,788 2,588 2,584 2,521Mathematical science 1,347 1,384 1,348 1,455 1,389 1,584 1,555Computer science 3,667 3,987 4,250 4,321 4,131 4,224 4,344
Biological science 2,349 2,154 2,064 1,928 1,849 1,828 1,861Agricultural science 1,743 1,435 1,262 1,210 1,229 1,352 1,469
Social sciences 8,246 7,481 7,800 8,186 8,398 8,791 9,097Social science 5,302 4,899 5,214 5,434 5,659 6,061 6,344Psychology 2,944 2,582 2,586 2,752 2,739 2,730 2,753
Non-S&E 2 86,598 81,126 85,954 88,012 91,622 94,567 97,378
Grand total 120,055 113,935 118,998 121,066 124,344 128,296 132,745
Nonresident aliens 3
Total science and engineering 10,278 10,518 12,043 12,702 13,081 13,705 15,365
Engineering 5,342 5,344 6,208 6,543 6,673 6,995 8,023
Sciences 4,936 5,174 5,835 6,159 6,408 6,710 7,342Natural sciences 3,434 3,678 4,265 4,439 4,691 5,087 5,572
Physical science' 889 834 954 1,028 1,070 1,111 1,118Mathematical science 499 544 632 649 683 712 751Computer science 1,269 1,575 1,848 1,933 2,144 2,380 2,811
Biological science 286 268 357 379 370 385 406Agricultural science 491 457 474 450 424 499 486
Social sciences 1,502 1,496 1,570 1,720 1,717 1,623 1,770Social science 1,384 1,407 1,471 1,584 1,613 1,528 1,659Psychology 118 89 99 136 104 95 111
Non-S&E 2 9,396 9,801 10,579 10,997 12,069 12,532 13,456
Grand total 19,674 20,319 22,622 23,699 25,150 26,237 28,821
See explanatory information and SOURCES at end of table.
64
67

Table 8. Number of earned master's degrees, by field and by race/ethnicityof male recipients: 1985-93, selected years
Page 4 of 4
Field 1985 1987 1989 1990 1991 1992 1993
Unknown race/ethnicity or citizenship
Total science and engineering 1,193 2,284 2,637 2,668 1,945 2,334 2,370
Engineering 709 737 1,188 1,008 839 984 1,022
Sciences 484 1,547 1,449 1,660 1,106 1,350 1,348Natural sciences 296 917 999 1,117 653 821 754
Physical science1 97 232 164 165 167 200 164Mathematical science 31 98 80 104 74 161 162Computer science 128 423 675 714 288 280 256
Biological science 27 133 70 86 96 103 98Agricultural science 13 31 10 48 28 77 74
Social sciences 188 630 450 543 453 529 594Social science 186 463 321 406 302 350 416Psychology 2 167 129 137 151 179 178
Non-S&E 2 2,794 5,117 5,142 6,592 5,456 5,432 5,817
Grand total 3,987 7,401 7,779 9,260 7,401 7,766 8,187
In this report, "Physical science" includes earth, atmospheric, and ocean sciences, as well as physics, astronomy, andchemistry.
2 Non-S&E refers to non-science and non-engineering.
3 Nonresident aliens include foreign citizens on temporary visas only. No racial/ethnic data are collected for this group.
NOTES: Data on race/ethnicity were collected biennially from 1977 through 1989 and annually thereafter.
Data on race/ethnicity of degree recipients are collected on broad fields of study only; therefore, these data couldnot be adjusted to the exact field taxonomies used by NSF.
Racial/ethnic categories are as designated on the survey form. These categories include U.S. citizens and foreigncitizens on permanent visas (i.e., resident aliens who have been admitted for permanent residency).
SOURCES: Tabulations by National Science Foundation/SRS; data from National Center for Education Statistics; data fromthe HEGIS Earned Degrees Surveys, 1985, and IPEDS Completions Surveys, 1987-93
(1 0
65
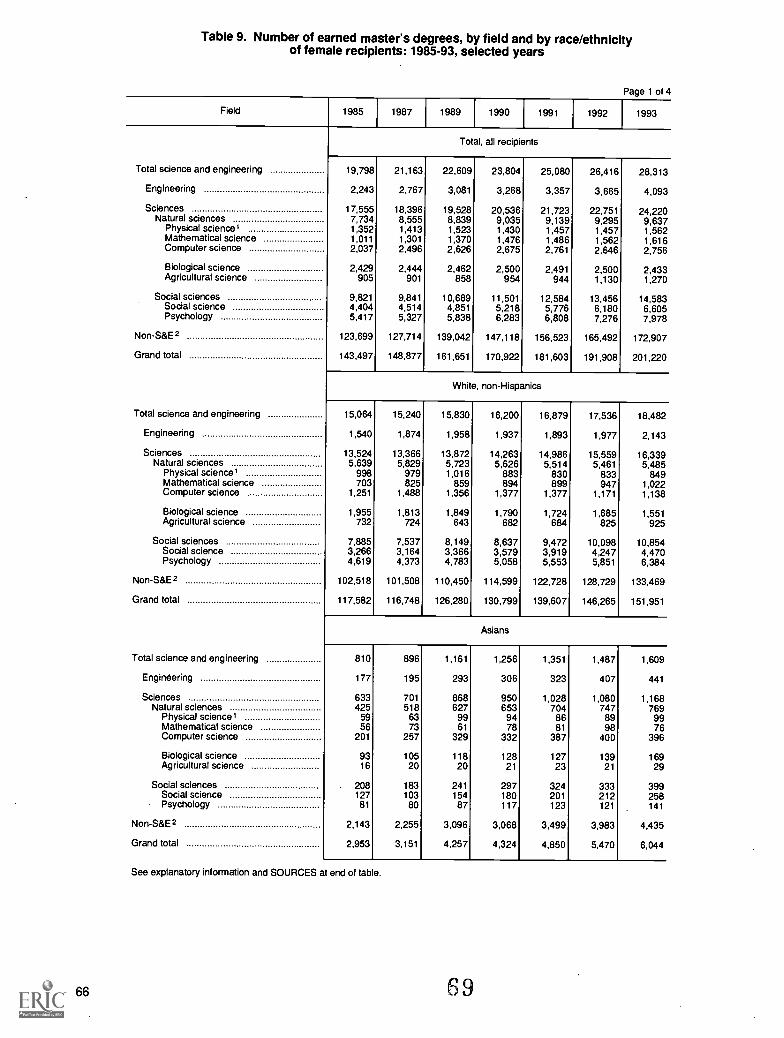
Table 9. Number of earned master's degrees, by field and by race/ethnicityof female recipients: 1985-93, selected years
Page 1 of 4
Field 1985 1987 1989 1990 1991 1992 1993
Total, all recipients
Total science and engineering 19,798 21,163 22,609 23,804 25,080 26,416 28,313
Engineering 2,243 2,767 3,081 3,268 3,357 3,665 4,093
Sciences 17,555 18,396 19,528 20,536 21,723 22,751 24,220Natural sciences 7,734 8,555 8,839 9,035 9,139 9,295 9,637
Physical science' 1,352 1,413 1,523 1,430 1,457 1,457 1,562Mathematical science 1,011 1,301 1,370 1,476 1,486 1,562 1,616Computer science 2,037 2,496 2,626 2,675 2,761 2,646 2,756
Biological science 2,429 2,444 2,462 2,500 2,491 2,500 2,433Agricultural science 905 901 858 954 944 1,130 1,270
Social sciences 9,821 9,841 10,689 11,501 12,584 13,456 14,583Social science 4,404 4,514 4,851 5,218 5,776 6,180 6,605Psychology 5,417 5,327 5,838 6,283 6,808 7,276 7,978
Non-S&E 2 123,699 127,714 139,042 147,118 156,523 165,492 172,907
Grand total 143,497 148,877 161,651 170,922 181,603 191,908 201,220
White, non-Hispanics
Total science and engineering 15,064 15,240 15,830 16,200 16,879 17,536 18,482
Engineering 1,540 1,874 1,958 1,937 1,893 1,977 2,143
Sciences 13,524 13,366 13,872 14,263 14,986 15,559 16,339Natural sciences 5,639 5,829 5,723 5,626 5,514 5,461 5,485
Physical science' 998 979 1,016 883 830 833 849Mathematical science 703 825 859 894 899 947 1,022Computer science 1,251 1,488 1,356 1,377 1,377 1,171 1,138
Biological science 1,955 1,813 1,849 1,790 1,724 1,685 1,551Agricultural science 732 724 643 682 684 825 925
Social sciences 7,885 7,537 8,149 8,637 9,472 10,098 10,854Social science 3,266 3,164 3,366 3,579 3,919 4,247 4,470Psychology 4,619 4,373 4,783 5,058 5,553 5,851 6,384
Non-S&E2 102,518 101,508 110,450 114,599 122,728 128,729 133,469
Grand total 117,582 116,748 126,280 130,799 139,607 146,265 151,951
Asians
Total science and engineering 810 896 1,161 1,256 1,351 1,487 1,609
Engineering 177 195 293 306 323 407 441
Sciences 633 701 868 950 1,028 1,080 1,168Natural sciences 425 518 627 653 704 747 769
Physical science' 59 63 99 94 86 89 99Mathematical science 56 73 61 78 81 98 76Computer science 201 257 329 332 387 400 396
Biological science 93 105 118 128 127 139 169Agricultural science 16 20 20 21 23 21 29
Social sciences 208 183 241 297 324 333 399Social science 127 103 154 180 201 212 258Psychology 81 80 87 117 123 121 141
Non-S&E 2 2,143 2,255 3,096 3,068 3,499 3,983 4,435
Grand total 2,953 3,151 4,257 4,324 4,850 5,470 6,044
See explanatory information and SOURCES at end of table.
66 69

Table 9. Number of earned master's degrees, by field and by race/ethnicityof female recipients: 1985-93, selected years
Page 2 of 4
Field 1985 1987 1989 1990 1991 1992 1993
Underrepresented minorities, total
Total science and engineering 1,420 1,385 1,456 1,610 1,897 2,020 2,262
Engineering 102 162 171 181 195 221 271
Sciences 1,318 1,223 1,285 1,429 1,702 1,799 1,991Natural sciences 427 434 386 392 531 530 594
Physical science I 62 70 55 64 58 65 89Mathematical science 46 49 41 53 82 55 82Computer science 114 116 126 119 181 197 176
Biological science 171 167 138 124 170 170 180Agricultural science 34 32 26 32 40 43 67
Social sciences 891 789 899 1,037 1,171 1,269 1,397Social science 379 331 361 439 549 562 610Psychology 512 458 538 598 622 707 787
Non-S&E 12,391 11,720 12,175 13,087 14,562 16,208 17,447
Grand total 13,811 13;105 13,631 14,697 16,459 18,228 19,709
Black, non-Hispanics
Total science and engineering 769 794 774 897 1,062 1,190 1,301
Engineering 56 88 93 100 99 134 157
Sciences 713 706 681 797 963 1,056 1,144Natural sciences 223 243 205 220 306 317 330
Physical science1 28 34 22 26 30 32 47Mathematical science 19 28 27 33 47 33 50Computer science 72 81 79 92 133 141 115
Biological science 84 87 65 59 79 88 88Agricultural science 20 13 12 10 17 23 30
Social sciences 490 463 476 577 657 739 814Social science 210 203 201 239 332 345 385Psychology 280 260 275 338 325 394 429
Non-S&E2 7,980 7,494 7,717 8,407 9,176 10,436 11,124
Grand total 8,749 8,288 8,491 9,304 10,238 11,626 12,425
Hispanics
Total science and engineering 575 539 615 628 744 740 837
Engineering 42 68 74 73 90 80 101
Sciences 533 471 541 555 654 660 736Natural sciences 174 175 162 156 200 194 233
Physical science1 32 34 27 35 23 29 38Mathematical science 24 19 13 18 33 19 28Computer science 29 32 44 25 44 51 58
Biological science 77 73 64 59 82 77 75Agricultural science 12 17 14 19 18 18 34
Social sciences 359 296 379 399 454 466 503Social science 148 121 137 163 187 178 192Psychology 211 175 242 236 267 288 311
Non-S&E 2 3,813 3,721 3,921 4,154 4,816 5,135 5,659
Grand total 4,388 4,260 4,536 4,782 5,560 5,875 6,496
See explanatory information and SOURCES at end of table.
7067

Table 9. Number of earned master's degrees, by field and by race/ethnicityof female recipients: 1985-93, selected years
Page 3 of 4
Field 1985 1987 1989 1990 1991 1992 1993
American Indians or Alaskan Natives
Total science and engineering 76 52 67 85 91 90 124
Engineering 4 6 4 8 6 7 13
Sciences 72 46 63 77 85 83 111Natural sciences 30 16 19 16 25 19 31
Physical science1 2 2 6 3 5 4 4Mathematical science 3 2 1 2 2 3 4Computer science 13 3 3 2 4 5 3
Biological science 10 7 9 6 9 5 17Agricultural science 2 2 0 3 5 2 3
Social sciences 42 30 44 61 60 64 80Social science 21 7 23 37 30 39 33Psychology 21 23 21 24 30 25 47
Non-S&E 2 598 505 537 526 570 637 664
Grand total 674 557 604 611 661 727 788
U.S. citizens and permanent residents, total
Total science and engineering 17,294 17,521 18,447 19,066 20,127 21,043 22,353
Engineering 1,819 2,231 2,422 2,424 2,411 2,605 2,855
Sciences 15,475 15,290 16,025 16,642 17,716 18,438 19,498Natural sciences 6,491 6,781 6,736 6,671 6,749 6,738 6,848
Physical science1 1,119 1,112 1,170 1,041 974 987 1,037Mathematical science 805 947 961 1,025 1,062 1,100 1,180Computer science 1,566 1,861 1,811 1,828 1,945 1,768 1,710
Biological science 2,219 2,085 2,105 2,042 2,021 1,994 1,900Agricultural science 782 776 689 735 747 889 1,021
Social sciences 8,984 8,509 9,289 9,971 10,967 11,700 12,650Social science 3,772 3,598 3,881 4,198 4,669 5,021 5,338Psychology 5,212 4,911 5,408 5,773 6,298 6,679 7,312
Non-S&E2 117,052 115,483 125,721 130,754 140,789 148,920 155,351
Grand total 134,346 133,004 144,168 149,820 160,916 169,963 177,704
Nonresident aliens 3
Total science and engineering 2,228 2,527 3,100 3,636 3,968 4,302 4,785
Engineering 352 437 539 696 847 904 1,096
Sciences 1,876 2,090 2,561 2,940 3,121 3,398 3,689Natural sciences 1,138 1,357 1,657 1,891 2,043 2,229 2,490
Physical science I 209 222 284 336 434 427 484Mathematical science 186 292 344 386 376 400 387Computer science 440 492 594 630 675 789 968
Biological science 188 241 279 350 379 410 443Agricultural science 115 110 156 189 179 203 208
Social sciences 738 733 904 1,049 1,078 1,169 1,199Social science 560 602 744 800 865 962 978Psychology 178 131 160 249 213 207 221
Non-S&E2 5,050 5,418 6,401 7,267 8,493 9,113 10,503
Grand total 7,278 7,945 9,501 10,903 12,461 13,415 15,288
See explanatory information and SOURCES at end of table.
68
71

Table 9. Number of earned master's degrees, by field and by race/ethnicityof female recipients: 1985-93, selected years
Page 4 of 4
Field 1985 1987 1989 1990 1991 1992 1993
Unknown race/ethnicity or citizenship
Total science and engineering 276 1,115 1,062 1,102 985 1,071 1,175
Engineering 72 99 120 148 99 156 142
Sciences 204 1,016 942 954 886 915 1,033Natural sciences 105 417 446 473 347 328 299
Physical science1 24 79 69 53 49 43 41Mathematical science 20 62 65 65 48 62 49Computer science 31 143 221 217 141 89 78
Biological science 22 118 78 108 91 96 90Agricultural science 8 15 13 30 18 38 41
Social sciences 99 599 496 481 539 587 734Social science 72 314 226 220 242 197 289Psychology 27 285 270 261 297 390 445
Non-S&E2 1,597 6,813 6,920 9,097 7,241 7,459 7,053
Grand total 1,873 7,928 7,982 10,199 8,226 8,530 8,228
In this report, "Physical science" includes earth, atmospheric, and ocean sciences, as well as physics, astronomy, andchemistry.
2 Non-S&E refers to non-science and non-engineering.
3 Nonresident aliens include foreign citizens on temporary visas only. No racial/ethnic data are collected for this group.
NOTES: Data on race/ethnicity were collected biennially from 1977 through 1989 and annually thereafter.
Data on race/ethnicity of degree recipients are collected on broad fields of study only; therefore, these data couldnot be adjusted to the exact field taxonomies used by NSF.
Racial/ethnic categories are as designated on the survey form. These categories include U.S. citizens and foreigncitizens on permanent visas (i.e., resident aliens who have been admitted for permanent residency).
SOURCES: Tabulations by National Science Foundation/SRS; data from National Center for Education Statistics; data fromthe HEGIS Earned Degrees Surveys, 1985, and IPEDS Completions Surveys, 1987-93
69

Table 10. Number of earned doctoral degrees, by field and by race/ethnicityof recipient: 1985-93, selected years
Page 1 of 4
Field 1985 1987 1989 1990 1991 1992 1993
Total, all recipients
Total science and engineering 18,936 19,894 21,731 22,868 24,018 24,676 25,438
Engineering 3,166 3,712 4,543 4,894 5,215 5,439 5,696
Sciences 15,770 16,182 17,188 17,974 18,803 19,237 19,742Natural sciences 9,435 9,845 10,656 11,360 11,997 12,363 12,554
Physical science1 3,533 3,840 3,984 4,262 4,440 4,575 4,472Mathematical science 688 740 859 892 1,039 1,058 1,146Computer science 310 450 612 705 800 869 878
Biological science 3,793 3,839 4,115 4,327 4,645 4,798 5,090Agricultural science 1,111 976 1,086 1,174 1,073 1,063 968
Social sciences 6,335 6,337 6,532 6,614 6,806 6,874 7,188Social science 3,217 3,164 3,324 3,332 3,556 3,610 3,769Psychology 3,118 3,173 3,208 3,282 3,250 3,264 3,419
Non-S&E 2 12,362 12,473 12,593 13,200 13,499 14,177 14,316
Grand total 31,298 32,367 34,324 36,068 37,517 38,853 39,754
White, non-Hispanics
Total science and engineering 12,172 12,064 12,517 13,218 13,352 13,353 13,767
Engineering 1,188 1,460 1,730 1,847 1,843 1,885 2,030
Sciences 10,984 10,604 10,787 11,371 11,509 11,468 11,737Natural sciences 6,433 6,218 6,492 6,817 6,893 6,830 6,846
Physical science1 2,331 2,353 2,327 2,509 2,526 2,463 2,372Mathematical science 350 319 369 375 422 425 479Computer science 177 230 320 343 355 379 411
Biological science 2,915 2,761 2,906 2,980 3,044 3,070 3,146Agricultural science 660 555 570 610 546 493 438
Social sciences 4,551 4,386 4,295 4,554 4,616 4,638 4,891Social science 1,961 1,868 1,836 1,902 1,950 1,993 2,068Psychology 2,590 2,518 2,459 2,652 2,666 2,645 2,823
Non-S&E 2 9,141 9,074 9,086 9,737 9,871 10,292 10,326
Grand total 21,313 21,138 21,603 22,955 23,223 23,645 24,093
Asians
Total science and engineering 849 940 994 1,052 1,218 1,352 1,646
Engineering 306 331 362 375 416 455 542
Sciences 543 609 632 677 802 897 1,104Natural sciences 403 445 484 506 614 705 855
Physical science1 174 166 182 184 200 258 293Mathematical science 34 41 24 28 57 51 79Computer science 17 27 53 52 66 86 81
Biological science 152 173 200 207 262 272 372Agricultural science 26 38 25 35 29 38 30
Social sciences 140 164 148 171 188 192 249Social science 96 116 93 118 126 136 175Psychology 44 48 55 53 62 56 74
Non-S&E 2 267 253 284 309 357 420 412
Grand total 1,116 1,193 1,278 1,361 1,575 1,772 2,058
See explanatory information and SOURCES at end of table.
70
73

Table 10. Number of earned doctoral degrees, by field and by race/ethnicityof recipient: 1985-93, selected years
Page 2 of 4
Field 1985 1987 1989 1990 1991 1992 1993
Underrepresented minorities, total
Total science and engineering 713 736 814 892 1,011 997 1,061
Engineering 57 67 89 98 122 131 118
Sciences 656 669 725 794 889 866 943Natural sciences 256 289 316 333 374 379 420
Physical science1 71 91 120 123 128 134 148Mathematical science 19 22 19 16 20 18 25Computer science 9 9 7 6 21 15 14
Biological science 125 135 135 144 167 176 195Agricultural science 32 32 35 44 38 36 38
Social sciences 400 380 409 461 515 487 523Social science 216 176 208 218 251 233 256Psychology 184 204 201 243 264 254 267
Non-S&E 2 1,068 1,008 952 1,105 1,159 1,183 1,321
Grand total 1,781 1,744 1,766 1,997 2,170 2,180 2,382
Black, non-Hispanics
Total science and engineering 375 320 376 379 459 406 472
Engineering 34 25 35 40 55 49 51
Sciences 341 295 341 339 404 357 421Natural sciences 110 109 115 106 131 117 150
Physical science1 31 22 35 33 34 32 45Mathematical science 7 11 8 4 11 4 8Computer science 3 2 1 1 8 5 6
Biological science 53 60 57 51 60 61 74Agricultural science 16 14 14 17 18 15 17
Social sciences 231 186 226 233 273 240 271Social science 126 93 129 117 144 137 152Psychology 105 93 97 116 129 103 119
Non-S&E 2 670 593 597 680 706 705 815
Grand total 1,045 913 973 1,059 1,165 1,111 1,287
Hispanics
Total science and engineering 297 363 385 471 496 522 546
Engineering 22 35 47 54 61 71 65
Sciences 275 328 338 417 435 451 481Natural sciences 125 157 174 214 215 232 251
Physical science1 36 62 69 86 81 89 94Mathematical science 12 11 11 11 9 12 16Computer science 6 4 4 5 12 8 7
Biological science 59 64 71 89 97 102 114Agricultural science 12 16 19 23 16 21 20
Social sciences 150 171 164 203 220 219 230Social science 81 76 71 94 98 83 97Psychology 69 95 93 109 122 136 133
Non-S&E 2 343 353 314 371 377 397 430
Grand total 640 716 699 842 873 919 976
See explanatory information and SOURCES at end of table.
71
BEST COPY AVAILABLE

Table 10. Number of earned doctoral degrees, by field and by race/ethnicityof recipient: 1985-93, selected years
Page 3 of 4
Field 1985 1987 1989 1990 1991 1992 1993
American Indians or Alaskan Natives
Total science and engineering 41 53 53 42 56 69 43
Engineering 7 7 4 6 11 2
Sciences 40 46 46 38 50 58 41Natural sciences 21 23 27 13 28 30 19
Physical sciencel 4 7 16 4 13 13 9Mathematical science 0 0 0 1 0 2 1
Computer science 0 3 2 0 1 2
Biological science 13 11 7 4 10 13 7Agricultural science 4 2 2 4 4 0
Social sciences 19 23 19 25 22 28 22Social science 9 7 8 7 9 13 7Psychology 10 16 11 18 13 15 15
Non-S&E 2 55 62 41 54 76 81 76
Grand total 96 115 94 96 132 150 119
U.S citizens and permanent residents, total
Total science and engineering 13,734 13,740 14,325 15,162 15,581 15,702 16,474
Engineering 1,551 1,858 2,181 2,320 2,381 2,471 2,690
Sciences 12,183 11,882 12,144 12,842 13,200 13,231 13,784Natural sciences 7,092 6,952 7,292 7,656 7,881 7,914 8,121
Physical science1 2,576 2,610 2,629 2,816 2,854 2,855 2,813Mathematical science 403 382 412 419 499 494 583Computer science 203 266 380 401 442 480 506
Biological science 3,192 3,069 3,241 3,331 3,473 3,518 3,713Agricultural science 718 625 630 689 613 567 506
Social sciences 5,091 4,930 4,852 5,186 5,319 5,317 5,663Social science 2,273 2,160 2,137 2,238 2,327 2,362 2,499Psychology 2,818 2,770 2,715 2,948 2,992 2,955 3,164
Non-S&E2 10,476 10,335 10,322 11,151 11,387 11,895 12,059
Grand total 24,210 24,075 24,647 26,313 26,968 27,597 28,533
Nonresident aliens 3
Total science and engineering 4,048 4,468 5,391 6,571 7,642 8,092 8,111
Engineering 1,419 1,532 1,940 2,277 2,634 2,743 2,783
Sciences 2,629 2,936 3,451 4,294 5,008 5,349 5,328Natural sciences 1,845 2,149 2,499 3,232 3,782 4,089 4,056
Physical science1 739 923 1,012 1,244 1,442 1,582 1,497Mathematical science 238 302 346 424 506 511 517Computer science 89 143 178 271 340 365 349
Biological science 424 492 608 853 1,059 1,159 1,246Agricultural science 355 289 355 440 435 472 447
Social sciences 784 787 952 1,062 1,226 1,260 1,272Social science 703 702 846 945 1,093 1,104 1,124Psychology 81 85 106 117 133 156 148
Non-S&E2 1,180 1,142 1,255 1,522 1,667 1,858 1,812
Grand total 5,228 5,610 6,646 8,093 9,309 9,950 9,923
See explanatory information and SOURCES at end of table.
72 75

Table 10. Number of earned doctoral degrees, by field and by race/ethnicityof recipient: 1985-93, selected years
Page 4 of 4
Field 1985 1987 1989 1990 1991 1992 1993
Unknown race/ethnicity or citizenship
Total science and engineering 1,154 1,686 2,015 1,135 795 882 853
Engineering 196 322 422 297 200 225 223
Sciences 958 1,364 1,593 838 595 657 630Natural sciences 498 744 865 472 334 360 377
Physical science1 218 307 343 202 144 138 162Mathematical science 47 56 101 49 34 53 46Computer science 18 41 54 33 18 24 23
Biological science 177 278 266 143 113 121 131
Agricultural science 38 62 101 45 25 24 15
Social sciences 460 620 728 366 261 297 253Social science 241 302 341 149 136 144 146Psychology 219 318 387 217 125 153 107
Non-S&E 2 706 996 1,016 527 445 424 445
Grand total 1,860 2,682 3,031 1,662 1,240 1,306 1,298
1 In this report, "Physical science" includes earth, atmospheric, and ocean sciences, as well as physics, astronomy, andchemistry.
2 Non-S&E refers to non-science and non-engineering.
3 Nonresident aliens include foreign citizens on temporary visas only.
SOURCE: National Science Foundation/SRS, Survey of Earned Doctorates
7673

Table 11. Number of earned doctoral degrees, by field and by race/ethnicityof male recipients: 1985-93, selected years
Page 1 of 4
Field 1985 1987 1989 1990 1991 1992 1993
Total, all recipients
Total science and engineering 14,045 14,582 15,622 16,498 17,087 17,594 17,786
Engineering 2,968 3,470 4,168 4,479 4,748 4,933 5,175
Sciences 11,077 11,112 11,454 12,019 12,339 12,661 12,611Natural sciences 7,312 7,484 7,857 8,430 8,842 9,015 8,932
Physical science' 2,958 3,200 3,217 3,460 3,582 3,616 3,529Mathematical science 582 615 704 734 840 853 882Computer science 277 385 504 595 683 749 741
Biological science 2,555 2,479 2,573 2,713 2,873 2,967 3,040Agricultural science 940 805 859 928 864 830 740
Social sciences 3,765 3,628 3,597 3,589 3,497 3,646 3,679Social science 2,188 2,153 2,189 2,221 2,243 2,311 2,349Psychology 1,577 1,475 1,408 1,368 1,254 1,335 1,330
Non-S&E 2 6,509 6,357 6,190 6,464 6,560 6,839 6,860
Grand total 20,554 20,939 21,812 22,962 23,647 24,433 24,646
White, non-Hispanics
Total science and engineering 8,528 8,231 8,225 8,692 8,602 8,642 8,739
Engineering 1,082 1,316 1,506 1,621 1,608 1,645 1,767
Sciences 7,446 6,915 6,719 7,071 6,994 6,997 6,972Natural sciences 4,907 4,588 4,583 4,861 4,916 4,783 4,713
Physical science' 1,960 1,935 1,843 2,014 2,000 1,929 1,872Mathematical science 280 258 281 296 337 332 354Computer science 156 184 253 263 282 310 328
Biological science 1,964 1,765 1,785 1,825 1,874 1,848 1,836Agricultural science 547 446 421 463 423 364 323
Social sciences 2,539 2,327 2,136 2,210 2,078 2,214 2,259Social science 1,237 1,156 1,068 1,132 1,081 1,130 1,160Psychology 1,302 1,171 1,068 1,078 997 1,084 1,099
Non-S&E 2 4,662 4,394 4,228 4,526 4,572 4,650 4,628
Grand total 13,190 12,625 12,453 13,218 13,174 13,292 13,367
Asians
Total science and engineering 657 707 750 790 836 939 1,107
Engineering 284 309 328 340 367 394 481
Sciences 373 398 422 450 469 545 626Natural sciences 293 303 334 349 388 443 510
Physical science' 132 126 141 141 145 171 187Mathematical science 28 30 21 21 39 33 43Computer science 17 21 43 44 51 74 62
Biological science 95 95 110 115 133 139 198Agricultural science 21 31 19 28 20 26 20
Social sciences 80 95 88 101 81 102 116Social science 57 78 60 79 66 83 94Psychology 23 17 28 22 15 19 22
Non-S&E 2 151 137 163 164 169 210 211
Grand total 808 844 913 954 1,005 1,149 1,318
See explanatory information and SOURCES at end of table.
7477

Table 11. Number of earned doctoral degrees, by field and by race/ethnicityof male recipients: 1985-93, selected years
Page 2 of 4
Field 1985 1987 1989 1990 1991 1992 1993
Underrepresented minorities, total
Total science and engineering 441 443 485 548 614 595 609
Engineering 53 61 76 83 102 107 95
Sciences 388 382 409 465 512 488 514Natural sciences 176 198 220 225 260 258 275
Physical science1 56 67 89 83 106 99 112Mathematical science 14 18 12 11 12 14 22Computer science 7 7 2 5 16 13 8
Biological science 72 82 87 89 92 104 104Agricultural science 27 24 30 37 34 28 29
Social sciences 212 184 189 240 252 230 239Social science 137 114 120 138 151 140 144Psychology 75 70 69 102 101 90 95
Non-S&E 2 448 448 405 444 474 495 556
Grand total 889 891 890 992 1,088 1,090 1,165
Black, non-Hispanics
Total science and engineering 237 189 222 231 268 240 265
Engineering 30 24 32 34 47 43 40
Sciences 207 165 190 197 221 197 225Natural sciences 81 73 78 74 85 82 99
Physical science1 24 18 27 24 28 25 35Mathematical science 7 9 5 3 7 4 7Computer science 3 1 0 1 4 4 2
Biological science 32 35 33 30 29 37 42Agricultural science 15 10 13 16 17 12 13
Social sciences 126 92 112 123 136 115 126Social science 84 58 76 79 92 87 82Psychology 42 34 36 44 44 28 44
Non-S&E 2 260 251 240 258 284 280 324
Grand total 497 440 462 489 552 520 589
Hispanics
Total science and engineering 183 222 230 292 309 313 319
Engineering 22 30 39 45 51 56 53
Sciences 161 192 191 247 258 257 266Natural sciences 83 109 122 140 154 154 162
Physical science1 28 44 48 56 68 63 70Mathematical science 7 9 7 7 5 9 14Computer science 4 4 1 4 11 7 6
Biological science 36 40 50 56 57 59 57Agricultural science 8 12 16 17 13 16 15
Social sciences 78 83 69 107 104 103 104Social science 50 51 39 55 52 47 59Psychology 28 32 30 52 52 56 45
Non-S&E 2 169 167 149 159 153 175 197
Grand total 352 389 379 451 462 488 516
See explanatory information and SOURCES at end of table.
78 75

76
Table 11. Number of earned doctoral degrees, by field and by race/ethnicityof male recipients: 1985-93, selected years
Page 3 of 4
Field 1985 1987 1989 1990 1991 1992 1993
American Indians or Alaskan Natives
Total science and engineering 21 32 33 25 37 42 25
Engineering 1 7 5 4 4 8 2
Sciences 20 25 28 21 33 34 23Natural sciences 12 16 20 11 21 22 14
Physical sciencel 4 5 14 3 10 11 7Mathematical science 0 0 0 1 0 1 1
Computer science 0 2 1 0 1 2 0
Biological science 4 7 4 3 6 8 5Agricultural science 4 2 1 4 4 0 1
Social sciences 8 9 8 10 12 12 9Social science 3 5 5 4 7 6 3Psychology 5 4 3 6 5 6 6
Non-S&E 2 19 30 16 27 37 40 35
Grand total 40 62 49 52 74 82 60
U.S citizens and permanent residents, total
Total science and engineering 9,626 9,381 9,460 10,030 10,052 10,176 10,455
Engineering 1,419 1,686 1,910 2,044 2,077 2,146 2,343
Sciences 8,207 7,695 7,550 7,986 7,975 8,030 8,112Natural sciences 5,376 5,089 5,137 5,435 5,564 5,484 5,498
Physical science1 2,148 2,128 2,073 2,238 2,251 2,199 2,171Mathematical science 322 306 314 328 388 379 419Computer science 180 212 298 312 349 397 398
Biological science 2,131 1,942 1,982 2,029 2,099 2,091 2,138Agricultural science 595 501 470 528 477 418 372
Social sciences 2,831 2,606 2,413 2,551 2,411 2,546 2,614Social science 1,431 1,348 1,248 1,349 1,298 1,353 1,398Psychology 1,400 1,258 1,165 1,202 1,113 1,193 1,216
Non-S&E 2 5,261 4,979 4,796 5,134 5,215 5,355 5,395
Grand total 14,887 14,360 14,256 15,164 15,267 15,531 15,850
Nonresident aliens 3
Total science and engineering 3,542 3,904 4,609 5,590 6,413 6,741 6,657
Engineering 1,363 1,478 1,850 2,157 2,485 2,574 2,622
Sciences 2,179 2,426 2,759 3,433 3,928 4,167 4,035Natural sciences 1,536 1,794 2,011 2,608 3,003 3,230 3,127
Physical science1 631 815 852 1,048 1,206 1,296 1,216Mathematical science 216 260 299 363 420 427 422Computer science 81 138 160 256 317 329 323
Biological science 293 333 400 582 694 787 809Agricultural science 315 248 300 359 366 391 357
Social sciences 643 632 748 825 925 937 908Social science 590 584 688 763 848 856 844Psychology 53 48 60 62 77 81 64
Non-S&E 2 853 818 833 1,042 1,103 1,219 1,200
Grand total 4,395 4,722 5,442 6,632 7,516 7,960 7,857
See explanatory information and SOURCES at end of table.
'79
BEST COPY AVAILABLE

Table 11. Number of earned doctoral degrees, by field and by race/ethnicityof male recipients: 1985-93, selected years
Page 4 of 4
Field 1985 1987 1989 1990 1991 1992 1993
Unknown race/ethnicity or citizenship
Total science and engineering 877 1,297 1,553 878 622 677 674
Engineering 186 306 408 278 186 213 210
Sciences 691 991 1,145 600 436 464 464Natural sciences 400 601 709 387 275 301 307
Physical science I 179 257 292 174 125 121 142Mathematical science 44 49 91 43 32 47 41
Computer science 16 35 46 27 17 23 20
Biological science 131 204 191 102 80 89 93Agricultural science 30 56 89 41 21 21 11
Social sciences 291 390 436 213 161 163 157Social science 167 221 253 109 97 102 107Psychology 124 169 183 104 64 61 50
Non-S&E 2 395 560 561 288 242 265 265
Grand total 1,272 1,857 2,114 1,166 864 942 939
In this report, "Physical science" includes earth, atmospheric, and ocean sciences, as well as physics, astronomy, andchemistry.
2 Non-S&E refers to non-science and non-engineering.
3 Nonresident aliens include foreign citizens on temporary visas only.
SOURCE: National Science Foundation/SRS, Survey of Earned Doctorates
8077

Table 12. Number of earned doctoral degrees, by field and by race/ethnicityof female recipients: 1985-93, selected years
Page 1 of 4
Field 1985 1987 1989 1990 1991 1992 1993
Total, all recipients
Total science and engineering 4,891 5,312 6,109 6,370 6,931 7,082 7,652
Engineering 198 242 375 415 467 506 521
Sciences 4,693 5,070 5,734 5,955 6,464 6,576 7,131Natural sciences 2,123 2,361 2,799 2,930 3,155 3,348 3,622
Physical science1 575 640 767 802 858 959 943Mathematical science 106 125 155 158 199 205 264Computer science 33 65 108 110 117 120 137
Biological science 1,238 1,360 1,542 1,614 1,772 1,831 2,050Agricultural science 171 171 227 246 209 233 228
Social sciences 2,570 2,709 2,935 3,025 3,309 3,228 3,509Social science 1,029 1,011 1,135 1,111 1,313 1,299 1,420Psychology 1,541 1,698 1,800 1,914 1,996 1,929 2,089
Non-S&E 2 5,853 6,116 6,403 6,736 6,939 7,338 7,456
Grand total 10,744 11,428 12,512 13,106 13,870 14,420 15,108
White, non-Hispanics
Total science and engineering 3,644 3,833 4,292 4,526 4,750 4,711 5,028
Engineering 106 144 224 226 235 240 263
Sciences 3,538 3,689 4,068 4,300 4,515 4,471 4,765Natural sciences 1,526 1,630 1,909 1,956 1,977 2,047 2,133
Physical science1 371 418 484 495 526 534 500Mathematical science 70 61 88 79 85 93 125Computer science 21 46 67 80 73 69 83
Biological science 951 996 1,121 1,155 1,170 1,222 1,310Agricultural science 113 109 149 147 123 129 115
Social sciences 2,012 2,059 2,159 2,344 2,538 2,424 2,632Social science 724 712 768 770 869 863 908Psychology 1,288 1,347 1,391 1,574 1,669 1,561 1,724
Non-S&E 2 4,479 4,680 4,858 5,211 5,299 5,642 5,698
Grand total 8,123 8,513 9,150 9,737 10,049 10,353 10,726
Asians
Total science and engineering 192 233 244 262 382 413 539
Engineering 22 22 34 35 49 61 61
Sciences 170 211 210 227 333 352 478Natural sciences 110 142 150 157 226 262 345
Physical science' 42 40 41 43 55 87 106Mathematical science 6 11 3 7 18 18 36Computer science 0 6 10 8 15 12 19
Biological science 57 78 90 92 129 133 174Agricultural science 5 7 6 7 9 12 10
Social sciences 60 69 60 70 107 90 133Social science 39 38 33 39 60 53 81Psychology 21 31 27 31 47 37 52
Non-S&E 2 116 116 121 145 188 210 201
Grand total 308 349 365 407 570 623 740
See explanatory information and SOURCES at end of table.
78 81

Table 12. Number of earned doctoral degrees, by field and by race/ethnicityof female recipients: 1985-93, selected years
Page 2 of 4
Field 1985 1987 1989 1990 1991 1992 1993
Underrepresented minorities, total
Total science and engineering 272 293 329 344 397 402 452
Engineering 4 6 13 15 20 24 23
Sciences 268 287 316 329 377 378 429Natural sciences 80 91 96 108 114 121 145
Physical science' 15 24 31 40 22 35 36Mathematical science 5 4 7 5 8 4 3Computer science 2 2 5 1 5 2 6
Biological science 53 53 48 55 75 72 91Agricultural science 5 8 5 7 4 8 9
Social sciences 188 196 220 221 263 257 284Social science 79 62 88 80 100 93 112Psychology 109 134 132 141 163 164 172
Non-S&E 2 620 560 547 661 685 688 765
Grand total 892 853 876 1,005 1,082 1,090 1,217
Black, non-Hispanics
Total science and engineering 138 131 154 148 191 166 207
Engineering 4 3 6 8 6 11
Sciences 134 130 151 142 183 160 196Natural sciences 29 36 37 32 46 35 51
Physical science' 7 4 8 9 6 7 10Mathematical science 0 2 3 1 4 0 1
Computer science 0 1 1 0 4 1 4
Biological science 21 25 24 21 31 24 32Agricultural science 1 4 1 1 1 3 4
Social sciences 105 94 114 110 137 125 145Social science 42 35 53 38 52 50 70Psychology 63 59 61 72 85 75 75
Non-S&E 2 410 342 357 422 422 425 491
Grand total 548 473 511 570 613 591 698
Hispanics
Total science and engineering 114 141 155 179 187 209 227
Engineering 0 5 8 9 10 15 12
Sciences 114 136 147 170 177 194 215Natural sciences 42 48 52 74 61 78 89
Physical science' 8 18 21 30 13 26 24Mathematical science 5 2 4 4 4 3 2Computer science 2 0 3 1 1 1 1
Biological science 23 24 21 33 40 43 57Agricultural science 4 4 3 6 3 5 5
Social sciences 72 88 95 96 116 116 126Social science 31 25 32 39 46 36 38Psychology 41 63 63 57 70 80 88
Non-S&E 2 174 186 165 212 224 222 233
Grand total 288 327 320 391 411 431 460
See explanatory information and SOURCES at end of table.
8279

Table 12. Number of earned doctoral degrees, by field and by race/ethnicityof female recipients: 1985-93, selected years
Page 3 of 4
Field 1985 1987 1989 1990 1991 1992 1993
American Indians or Alaskan Natives
Total science and engineering 20 21 20 17 19 27 18
Engineering 0 0 2 0 2 3 0
Sciences 20 21 18 17 17 24 18Natural sciences 9 7 7 2 7 8 5
Physical science1 0 2 2 1 3 2 2Mathematical science 0 0 0 0 0 0Computer science 0 1 0 0 0
Biological science 9 4 3 4 5 2Agricultural science 0 0 1 0 0 0 0
Social sciences 11 14 11 15 10 16 13Social science 6 2 3 3 2 7 4Psychology 5 12 8 12 8 9 9
Non-S&E 2 36 32 25 27 39 41 41
Grand total 56 53 45 44 58 68 59
U.S. citizens and permanent residents, total
Total science and engineering 4,108 4,359 4,865 5,132 5,529 5,526 6,019
Engineering 132 172 271 276 304 325 347
Sciences 3,976 4,187 4,594 4,856 5,225 5,201 5,672Natural sciences 1,716 1,863 2,155 2,221 2,317 2,430 2,623
Physical science1 428 482 556 578 603 656 642Mathematical science 81 76 98 91 111 115 164Computer science 23 54 82 89 93 83 108
Biological science 1,061 1,127 1,259 1,302 1,374 1,427 1,575Agricultural science 123 124 160 161 136 149 134
Social sciences 2,260 2,324 2,439 2,635 2,908 2,771 3,049Social science 842 812 889 889 1,029 1,009 1,101Psychology 1,418 1,512 1,550 1,746 1,879 1,762 1,948
Non-S&E 2 5,215 5,356 5,526 6,017 6,172 6,540 6,664
Grand total 9,323 9,715 10,391 11,149 11,701 12,066 12,683
Nonresident aliens 3
Total science and engineering 506 564 782 981 1,229 1,351 1,454
Engineering 56 54 90 120 149 169 161
Sciences 450 510 692 861 1,080 1,182 1,293Natural sciences 309 355 488 624 779 859 929
Physical sciences 108 108 160 196 236 286 281Mathematical science 22 42 47 61 86 84 95Computer science 8 5 18 15 23 36 26
Biological science 131 159 208 271 365 372 437Agricultural science 40 41 55 81 69 81 90
Social sciences 141 155 204 237 301 323 364Social science 113 118 158 182 245 248 280Psychology 28 37 46 55 56 75 84
Non-S&E 2 327 324 422 480 564 639 612
Grand total 833 888 1,204 1,461 1,793 1,990 2,066
See explanatory information and SOURCES at end of table.
80
3

Table 12. Number of earned doctoral degrees, by field and by race/ethnicityof female recipients: 1985-93, selected years
Page 4 of 4
Field 1985 1987 1989 1990 1991 1992 1993
Unknown race/ethnicity or citizenship
Total science and engineering 277 389 462 257 173 205 179
Engineering 10 16 14 19 14 12 13
Sciences 267 373 448 238 159 193 166Natural sciences 98 143 156 85 59 59 70
Physical science1 39 50 51 28 19 17 20Mathematical science 3 7 10 6 2 6 5Computer science 2 6 8 6 1 1 3
Biological science 46 74 75 41 33 32 38Agricultural science 8 6 12 4 4 3 4
Social sciences 169 230 292 153 100 134 96Social science 74 81 88 40 39 42 39Psychology 95 149 204 113 61 92 57
Non-S&E 2 311 436 455 239 203 159 180
Grand total 588 825 917 496 376 364 359
2
3
In this report, "Physical science" includes earth, atmospheric, and ocean sciences, as well as physics, astronomy, andchemistry.
Non-S&E refers to non-science and non-engineering.
Nonresident aliens include foreign citizens on temporary visas only.
SOURCE: National Science Foundation/SRS, Survey of Earned Doctorates
84 81

82
Table 13. Number of earned bachelor's degrees conferred by historically black colleges and universities(HBCUs) to blacks, by field: 1985-93, selected years
Page 1 of 1
Field 1985 1987 1989 1990 1991 1992 1993
Total, all black recipients
Total science and engineering 17,040 17,230 17,385 18,230 19,987 22,431 24,421
Engineering 2,039 2,315 2,067 2,072 2,229 2,362 2,577
Sciences 15,001 14,915 15,318 16,158 17,758 20,069 21,844Natural sciences 6,009 6,524 6,005 5,782 5,834 6,401 6,972
Physical sciences 830 823 697 650 753 816 836Mathematical science 770 834 792 720 811 904 965Computer science 2,143 2,820 2,457 2,247 1,997 2,090 2,213
Biological science 2,047 1,890 1,916 1,994 2,111 2,385 2,739Agricultural science 219 157 143 171 162 206 219
Social sciences 8,992 8,391 9,313 10,376 11,924 13,668 14,872Social science 6,325 5,940 6,570 7,226 8,236 9,489 10,254Psychology 2,667 2,451 2,743 3,150 3,688 4,179 4,618
Non-S&E 2 39,246 36,604 38,244 39,871 43,795 47,641 51,114
Grand total 56,286 53,834 55,629 58,101 63,782 70,072 75,535
Black recipients from HBCUs
Total science and engineering 4,933 5,229 5,054 5,190 5,679 6,363 7,368
Engineering 438 557 474 524 589 594 700
Sciences 4,495 4,672 4,580 4,666 5,090 5,769 6,668Natural sciences 2,369 2,750 2,513 2,353 2,363 2,599 3,021
Physical sciences 363 346 320 296 358 376 390Mathematical science 382 425 381 307 369 420 463Computer science 740 1,187 1,048 899 748 780 904
Biological science 783 714 693 764 792 906 1,155Agricultural science 101 78 71 87 96 117 109
Social sciences 2,126 1,922 2,067 2,313 2,727 3,170 3,647Social science 1,581 1,457 1,517 1,651 1,886 2,201 2,507Psychology 545 465 550 662 841 969 1,140
Non-S&E 2 11,808 10,853 10,435 10,744 11,910 12,899 14,073
Grand total 16,741 16,082 15,489 15,934 17,589 19,262 21,441
Percent from HBCUs
Total science and engineering 28.9 30.3 29.1 28.5 28.4 28.4 30.2
Engineering 21.5 24.1 22.9 25.3 26.4 25.1 27.2
Sciences 30.0 31.3 29.9 28.9 28.7 28.7 30.5Natural sciences 39.4 42.2 41.8 40.7 40.5 40.6 43.3
Physical sciences 43.7 42.0 45.9 45.5 47.5 46.1 46.7Mathematical science 49.6 51.0 48.1 42.6 45.5 46.5 48.0Computer science 34.5 42.1 42.7 40.0 37.5 37.3 40.8
Biological science 38.3 37.8 36.2 38.3 37.5 38.0 42.2Agricultural science 46.1 49.7 49.7 50.9 59.3 56.8 49.8
Social sciences 23.6 22.9 22.2 22.3 22.9 23.2 24.5Social science 25.0 24.5 23.1 22.8 22.9 23.2 24.4Psychology 20.4 19.0 20.1 21.0 22.8 23.2 24.7
Non-S&E2 30.1 29.6 27.3 26.9 27.2 27.1 27.5
Grand total 29.7 29.9 27.8 27.4 27.6 27.5 28.4
2
In this report, Physical science" includes earth, atmospheric, and ocean sciences, as well as physics, astronomy, andchemistry.
Non-S&E refers to non-science and non-engineering.
NOTES: Data on race/ethnicity were collected biennially from 1977 through 1989 and annually thereafter. Data onrace/ethnicity of degree recipients are collected on broad fields of study only; therefore, these data could not beadjusted to the exact field taxonomies used by NSF.
Racial/ethnic categories are as designated on the survey form. These categories include U.S. citizens and foreigncitizens on permanent visas (i.e., resident aliens who have been admitted for permanent residency).
SOURCES: Tabulations by National Science Foundation/SRS; data from National Center for Education Statistics; data fromthe HEGIS Earned Degrees Surveys, 1985, and IPEDS Completions Surveys, 1987-93
BEST COPY AVAILABLE85

Table 14. Number of earned bachelor's degrees conferred by historically black colleges and universities(HBCUs) to black men, by field: 1985-93, selected years
Page 1 of 1
Field 1985 1987 1989 1990 1991 1992 1993
Total, all black recipients
Total science and engineering 7,926 7,886 7,685 7,830 8,448 9,375 10,099
Engineering 1,479 1,606 1,397 1,416 1,484 1,614 1,764
Sciences 6,447 6,280 6,288 6,414 6,964 7,761 8,335Natural sciences 2,833 2,939 2,732 2,476 2,538 2,709 2,872
Physical science1 457 433 365 292 391 381 370Mathematical science 376 399 374 342 380 374 444Computer science 1,036 1,284 1,205 1,074 971 1,092 1,049
Biological science 806 723 700 658 696 749 883Agricultural science 158 100 88 110 100 113 126
Social sciences 3,614 3,341 3,556 3,938 4,426 5,052 5,463Social science 2,863 2,680 2,911 3,144 3,547 4,070 4,364Psychology 751 661 645 794 879 982 1,099
Non-S&E 2 14,105 13,073 13,287 13,807 14,822 16,194 17,383
Grand total 22,031 20,959 20,972 21,637 23,270 25,569 27,482
Black recipients from HBCUs
Total science and engineering 2,240 2,337 2,112 2,086 2,211 2,450 2,761
Engineering 310 371 308 331 359 380 430
Sciences 1,930 1,966 1,804 1,755 1,852 2,070 2,331Natural sciences 1,081 1,193 1,056 935 951 972 1,089
Physical science1 190 156 160 127 163 145 150Mathematical science 184 213 179 134 164 150 196Computer science 328 502 460 377 333 364 361
Biological science 299 264 206 231 231 238 317Agricultural science 80 58 51 66 60 75 65
Social sciences 849 773 748 820 901 1,098 1,242Social science 682 661 621 657 720 868 989Psychology 167 112 127 163 181 230 253
Non-S&E 2 4,168 3,833 3,532 3,668 3,945 4,316 4,798
Grand total 6,408 6,170 5,644 5,754 6,156 6,766 7,559
Percent from HBCUs
Total science and engineering 28.3 29.6 27.5 26.6 26.2 26.1 27.3
Engineering 21.0 23.1 22.0 23.4 24.2 23.5 24.4
Sciences 29.9 31.3 28.7 27.4 26.6 26.7 28.0Natural sciences 38.2 40.6 38.7 37.8 37.5 35.9 37.9
Physical science1 41.6 36.0 43.8 43.5 41.7 38.1 40.5Mathematical science 48.9 53.4 47.9 39.2 43.2 40.1 44.1Computer science 31.7 39.1 38.2 35.1 34.3 33.3 34.4
Biological science 37.1 36.5 29.4 35.1 33.2 31.8 35.9Agricultural science 50.6 58.0 58.0 60.0 60.0 66.4 51.6
Social sciences 23.5 23.1 21.0 20.8 20.4 21.7 22.7Social science 23.8 24.7 21.3 20.9 20.3 21.3 22.7Psychology 22.2 16.9 19.7 20.5 20.6 23.4 23.0
Non-S&E 2 29.5 29.3 26.6 26.6 26.6 26.7 27.6
Grand total 29.1 29.4 26.9 26.6 26:5 26.5 27.5
1 In this report, 'Physical science" includes earth, atmospheric, and ocean sciences, as well as physics, astronomy, andchemistry.
2 Non-S&E refers to non-science and non-engineering.
NOTES: Data on race/ethnicity were collected biennially from 1977 through 1989 and annually thereafter. Data onrace/ethnicity of degree recipients are collected on broad fields of study only; therefore, these data could not beadjusted to the exact field taxonomies used by NSF.
Racial/ethnic categories are as designated on the survey form. These categories include U.S. citizens and foreigncitizens on permanent visas (i.e., resident aliens who have been admitted for permanent residency).
SOURCES: Tabulations by National Science Foundation/SRS; data from National Center for Education Statistics; data fromthe HEGIS Earned Degrees Surveys, 1985, and IPEDS Completions Surveys, 1987-93
83
8 6 BEST COPY AVAILABLE

84
Table 15. Number of earned bachelor's degrees conferred by historically black colleges and universities(HBCUs) to black women, by field: 1985-93, selected years
Page 1 of 1
Field 1985 1987 1989 1990 1991 1992 1993
Total, all black recipients
Total science and engineering 9,114 9,344 9,700 10,400 11,539 13,056 14,322
Engineering 560 709 670 656 745 748 813
Sciences 8,554 8,635 9,030 9,744 10,794 12,308 13,509Natural sciences 3,176 3,585 3,273 3,306 3,296 3,692 4,100
Physical science1 373 390 332 358 362 435 466Mathematical science 394 435 418 378 431 530 521Computer science 1,107 1,536 1,252 1,173 1,026 998 1,164
Biological science 1,241 1,167 1,216 1,336 1,415 1,636 1,856Agricultural science 61 57 55 61 62 93 93
Social sciences 5,378 5,050 5,757 6,438 7,498 8,616 9,409Social science 3,462 3,260 3,659 4,082 4,689 5,419 5,890Psychology 1,916 1,790 2,098 2,356 2,809 3,197 3,519
Non-S&E 2 25,141 23,531 24,957 26,064 28,973 31,447 33,731
Grand total 34,255 32,875 34,657 36,464 40,512 44,503 48,053
Black recipients from HBCUs
Total science and engineering 2,693 2,892 2,942 3,104 3,468 3,913 4,607
Engineering 128 186 166 193 230 214 270
Sciences 2,565 2,706 2,776 2,911 3,238 3,699 4,337Natural sciences 1,288 1,557 1,457 1,418 1,412 1,627 1,932
Physical science1 173 190 160 169 195 231 240Mathematical science 198 212 202 173 205 270 267Computer science 412 685 588 522 415 416 543
Biological science 484 450 487 533 561 668 838Agricultural science 21 20 20 21 36 42 44
Social sciences 1,277 1,149 1,319 1,493 1,826 2,072 2,405Social science 899 796 896 994 1,166 1,333 1,518Psychology 378 353 423 499 660 739 887
Non-S&E 2 7,640 7,020 6,903 7,076 7,965 8,583 9,275
Grand total 10,333 9,912 9,845 10,180 11,433 12,496 13,882
Percent from HBCUs
Total science and engineering 29.5 31.0 30.3 29.8 30.1 30.0 32.2
Engineering 22.9 26.2 24.8 29.4 30.9 28.6 33.2
Sciences 30.0 31.3 30.7 29.9 30.0 30.1 32.1Natural sciences 40.6 43.4 44.5 42.9 42.8 44.1 47.1
Physical science1 46.4 48.7 48.2 47.2 53.9 53.1 51.5Mathematical science 50.3 48.7 48.3 45.8 47.6 50.9 51.2Computer science 37.2 44.6 47.0 44.5 40.4 41.7 46.6
Biological science 39.0 38.6 40.0 39.9 39.6 40.8 45.2Agricultural science 34.4 35.1 36.4 34.4 58.1 45.2 47.3
Social sciences 23.7 22.8 22.9 23.2 24.4 24.0 25.6Social science 26.0 24.4 24.5 24.4 24.9 24.6 25.8Psychology 19.7 19.7 20.2 21.2 23.5 23.1 25.2
Non-S&E2 30.4 29.8 27.7 27.1 27.5 27.3 27.5
Grand total 30.2 30.2 28.4 27.9 28.2 28.1 28.9
1 In this report, "Physical science" includes earth, atmospheric, and ocean sciences, as well as physics, astronomy, andchemistry.
2 Non-S&E refers to non-science and non-engineering.
NOTES: Data on race/ethnicity were collected biennially from 1977 through 1989 and annually thereafter. Data onrace/ethnicity of degree recipients are collected on broad fields of study only; therefore, these data could not beadjusted to the exact field taxonomies used by NSF.
Racial/ethnic categories are as designated on the survey form. These categories include U.S. citizens and foreigncitizens on permanent visas (i.e., resident aliens who have been admitted for permanent residency).
SOURCES: Tabulations by National Science Foundation/SRS; data from National Center for Education Statistics; data fromthe HEGIS Earned Degrees Surveys, 1985, and IPEDS Completions Surveys, 1987-93

Table 16. Number of earned master's degrees conferred by historically black colleges and universities(HBCUs) to blacks, by field: 1985-93, selected years
Page 1 of 1
Field 1985 1987 1989 1990 1991 1992 1993
Total, all black recipients
Total science and engineering 1,742 1,784 1,652 1,847 2,090 2,356 2,554
Engineering 330 403 355 387 398 466 564
Sciences 1,412 1,381 1,297 1,460 1,692 1,890 1,990Natural sciences 523 581 495 527 644 699 716
Physical science1 89 79 78 87 73 98 105Mathematical science 53 73 59 70 100 77 98Computer science 180 207 198 232 283 316 308
Biological science 151 167 124 110 137 149 135Agricultural science 50 55 36 28 51 59 70
Social sciences 889 800 802 933 1,048 1,191 1,274Social science 463 424 407 462 594 660 730Psychology 426 376 395 471 454 531 544
Non-S&E 2 12,181 11,347 11,748 12,582 13,720 15,000 16,282
Grand total 13,923 13,131 13,400 14,429 15,810 17,356 18,836
Black recipients from HBCUs
Total science and engineering 284 318 314 339 391 426 453
Engineering 34 27 38 42 37 41 41
Sciences 250 291 276 297 354 385 412Natural sciences 157 177 143 153 180 188 204
Physical science1 28 23 23 24 24 21 36Mathematical science 16 17 13 17 21 17 23Computer science 32 39 42 63 59 76 75
Biological science 58 67 47 37 46 47 38Agricultural science 23 31 18 12 30 27 32
Social sciences 93 114 133 144 174 197 208Social science 56 67 78 69 114 125 107Psychology 37 47 55 75 60 72 101
Non-S&E 2 2,316 2,115 2,047 2,016 2,127 2,199 2,324
Grand total 2,600 2,433 2,361 2,355 2,518 2,625 2,777
Percent from HBCUs
Total science and engineering 16.3 17.8 19.0 18.4 18.7 18.1 17.7
Engineering 10.3 6.7 10.7 10.9 9.3 8.8 7.3
Sciences 17.7 21.1 21.3 20.3 20.9 20.4 20.7Natural sciences 30.0 30.5 28.9 29.0 28.0 26.9 28.5
Physical science' 31.5 29.1 29.5 27.6 32.9 21.4 34.3Mathematical science 30.2 23.3 22.0 24.3 21.0 22.1 23.5Computer science 17.8 18.8 21.2 27.2 20.8 24.1 24.4
Biological science 38.4 40.1 37.9 33.6 33.6 31.5 28.1Agricultural science 46.0 56.4 50.0 42.9 58.8 45.8 45.7
Social sciences 10.5 14.2 16.6 15.4 16.6 16.5 16.3Social science 12.1 15.8 19.2 14.9 19.2 18.9 14.7Psychology 8.7 12.5 13.9 15.9 13.2 13.6 18.6
Non-S&E 2 19.0 18.6 17.4 16.0 15.5 14.7 14.3
Grand total 18.7 18.5 17.6 16.3 15.9 15.1 14.7
I In this report, "Physical science" includes earth, atmospheric, and ocean sciences, as well as physics, astronomy, andchemistry.
2 Non-S&E refers to non-science and non-engineering.
NOTES: Data on race/ethnicity were collected biennially from 1977 through 1989 and annually thereafter. Data onrace/ethnicity of degree recipients are collected on broad fields of study only; therefore, these data could not beadjusted to the exact field taxonomies used by NSF.
Racial/ethnic categories are as designated on the survey form. These categories include U.S. citizens and foreigncitizens on permanent visas (i.e., resident aliens who have been admitted for permanent residency).
SOURCES: Tabulations by National Science Foundation/SRS; data from National Center for Education Statistics; data fromthe HEGIS Earned Degrees Surveys, 1985, and IPEDS Completions Surveys, 1987-93
8885

86
Table 17. Number of earned master's degrees conferred by historically black colleges and universities(HBCUs) to black men, by field: 1985-93, selected years
Page 1 of 1
Field 1985 1987 1989 1990 1991 1992 1993
Total, all black recipients
Total science and engineering 973 990 878 950 1,028 1,166 1,253
Engineering 274 315 262 287 299 332 407
Sciences 699 675 616 663 729 834 846Natural sciences 300 338 290 307 338 382 386
Physical science1 61 45 56 61 43 66 58Mathematical science 34 45 32 37 53 44 48Computer science 108 126 119 140 150 175 193
Biological science 67 80 59 51 58 61 47Agricultural science 30 42 24 18 34 36 40
Social sciences 399 337 326 356 391 452 460Social science 253 221 206 223 262 315 345Psychology 146 116 120 133 129 137 115
Non-S&E 2 4,210 3,860 4,046 4,187 4,562 4,582 5,187
Grand total 5,183 4,850 4,924 5,137 5,590 5,748 6,440
Black recipients from HBCUs
Total science and engineering 141 155 154 164 172 195 191
Engineering 30 15 26 32 29 27 23
Sciences 111 140 128 132 143 168 168Natural sciences 75 93 76 84 90 100 106
Physical science1 17 14 14 14 14 16 19
Mathematical science 10 10 8 9 7 7 9
Computer science 15 19 24 35 33 46 44
Biological science 22 28 19 17 15 15 11
Agricultural science 11 22 11 9 21 16 23
Social sciences 36 47 52 48 53 68 62Social science 26 36 39 28 39 47 40Psychology 10 11 13 20 14 21 22
Non-S&E 2 739 620 572 581 594 583 630
. Grand total 880 775 726 745 766 778 821
Percent from HBCUs
Total science and engineering 14.5 15.7 17.5 17.3 16.7 16.7 15.2
Engineering 10.9 4.8 9.9 11.1 9.7 8.1 5.7
Sciences 15.9 20.7 20.8 19.9 19.6 20.1 19.9
Natural sciences 25.0 27.5 26.2 27.4 26.6 26.2 27.5
Physical sciences 27.9 31.1 25.0 23.0 32.6 24.2 32.8Mathematical science 29.4 22.2 25.0 24.3 13.2 15.9 18.8
Computer science 13.9 15.1 20.2 25.0 22.0 26.3 22.8
Biological science 32.8 35.0 32.2 33.3 25.9 24.6 23.4Agricultural science 36.7 52.4 45.8 50.0 61.8 44.4 57.5
Social sciences 9.0 13.9 16.0 13.5 13.6 15.0 13.5Social science 10.3 16.3 18.9 12.6 14.9 14.9 11.6
Psychology 6.8 9.5 10.8 15.0 10.9 15.3 19.1
Non-S&E2 17.6 16.1 14.1 13.9 13.0 12.7 12.1
Grand total 17.0 16.0 14.7 14.5 13.7 13.5 12.7
1 In this report, 'Physical science" includes earth, atmospheric, and ocean sciences, as well as physics, astronomy, andchemistry.
2 Non-S&E refers to non-science and non-engineering.
NOTES: Data on race/ethnicity were collected biennially from 1977 through 1989 and annually thereafter. Data onrace/ethnicity of degree recipients are collected on broad fields of study only; therefore, these data could not beadjusted to the exact field taxonomies used by NSF.
Racial/ethnic categories are as designated on the survey form. These categories include U.S. citizens and foreigncitizens on permanent visas (i.e., resident aliens who have been admitted for permanent residency).
SOURCES: Tabulations by National Science Foundation/SRS; data from National Center for Education Statistics; data fromthe HEGIS Earned Degrees Surveys, 1985, and IPEDS Completions Surveys, 1987-93
89

Table 18. Number of earned master's degrees conferred by historically black colleges and universities(HBCUs) to black women, by field: 1985-93, selected years
Page 1 of 1
Field 1985 1987 1989 1990 1991 1992 1993
Total, all black recipients
Total science and engineering 769 794 774 897 1,062 1,190 1,301
Engineering 56 88 93 100 99 134 157
Sciences 713 706 681 797 963 1,056 1,144Natural sciences 223 243 205 220 306 317 330
Physical science1 28 34 22 26 30 32 47Mathematical science 19 28 27 33 47 33 50Computer science 72 81 79 92 133 141 115
Biological science 84 87 65 59 79 88 88Agricultural science 20 13 12 10 17 23 30
Social sciences 490 463 476 577 657 739 814Social science 210 203 201 239 332 345 385Psychology 280 260 275 338 325 394 429
Non-S&E2 7,971 7,487 7,702 8,395 9,158 10,418 11,095
Grand total 8,740 8,281 8,476 9,292 10,220 11,608 12,396
Black recipients from HBCUs
Total science and engineering 143 163 160 175 219 231 262
Engineering 4 12 12 10 8 14 18
Sciences 139 151 148 165 211 217 244Natural sciences 82 84 67 69 90 88 98
Physical sciences 11 9 9 10 10 5 17Mathematical science 6 7 5 8 14 10 14Computer science 17 20 18 28 26 30 31
Biological science 36 39 28 20 31 32 27Agricultural science 12 9 7 3 9 11 9
Social sciences 57 67 81 96 121 129 146Social science 30 31 39 41 75 78 67Psychology 27 36 42 55 46 51 79
Non-S&E 2 1,577 1,495 1,475 1,435 1,533 1,616 1,694
Grand total 1,720 1,658 1,635 1,610 1,752 1,847 1,956
Percent from HBCUs
Total science and engineering 18.6 20.5 20.7 19.5 20.6 19.4 20.1
Engineering 7.1 13.6 12.9 10.0 8.1 10.4 11.5
Sciences 19.5 21.4 21.7 20.7 21.9 20.5 21.3Natural sciences 36.8 34.6 32.7 31.4 29.4 27.8 29.7
Physical science1 39.3 26.5 40.9 38.5 33.3 15.6 36.2Mathematical science 31.6 25.0 18.5 24.2 29.8 30.3 28.0Computer science 23.6 24.7 22.8 30.4 19.5 21.3 27.0
Biological science 42.9 44.8 43.1 33.9 39.2 36.4 30.7Agricultural science 60.0 69.2 58.3 30.0 52.9 47.8 30.0
Social sciences 11.6 14.5 17.0 16.6 18.4 17.5 17.9Social science 14.3 15.3 19.4 17.2 22.6 22.6 17.4Psychology 9.6 13.8 15.3 16.3 14.2 12.9 18.4
Non-S&E 2 19.8 20.0 19.2 17.1 16.7 15.5 15.3
Grand total 19.7 20.0 19.3 17.3 17.1 15.9 15.8
1 In this report, "Physical science" includes earth, atmospheric, and ocean sciences, as well as physics, astronomy, andchemistry.
2 Non-S&E refers to non-science and non-engineering.
NOTES: Data on race/ethnicity were collected biennially from 1977 through 1989 and annually thereafter. Data onrace/ethnicity of degree recipients are collected on broad fields of study only; therefore, these data could not beadjusted to the exact field taxonomies used by NSF.
Racial/ethnic categories are as designated on the survey form. These categories include U.S. citizens and foreigncitizens on permanent visas (i.e., resident aliens who have been admitted for permanent residency).
SOURCES: Tabulations by National Science Foundation/SRS; data from National Center for Education Statistics; data fromthe HEGIS Earned Degrees Surveys, 1985, and IPEDS Completions Surveys, 1987-93
9087

88
Table 19. Number of earned doctoral degrees conferred by historically black colleges and universities(HBCUs) to blacks, by field: 1985-93, selected years
Page 1 of 1
Field 1985 1987 1989 1990 1991 1992 1993
Total, all black recipients
Total science and engineering 375 320 376 379 459 406 472
Engineering 34 25 35 40 55 49 51
Sciences 341 295 341 339 404 357 421Natural sciences 110 109 115 106 131 117 150
Physical sciences 31 22 35 33 34 32 45Mathematical science 7 11 8 4 11 4 8Computer science 3 2 1 1 8 5 6
Biological science 53 60 57 51 60 61 74Agricultural science 16 14 14 17 18 15 17
Social sciences 231 186 226 233 273 240 271Social science 126 93 129 117 144 137 152Psychology 105 93 97 116 129 103 119
Non-S&E 2 670 593 597 680 706 705 815
Grand total 1,045 913 973 1,059 1,165 1,111 1,287
Black recipients from HBCUs
Total science and engineering 38 35 35 37 48 42 59
Engineering 0 0 1 0 3 2 0
Sciences 38 35 34 37 45 40 59Natural sciences 20 15 15 15 16 11 25
Physical sciences 5 1 3 4 5 0 6Mathematical science 0 0 3 0 0 0 0Computer science 0 0 0 0 0 0 0
Biological science 15 14 9 11 11 11 18Agricultural science 0 0 0 0 0 0
Social sciences 18 20 19 22 29 29 34Social science 11 11 13 14 10 19 22Psychology 7 9 6 8 19 10 12
Non-S&E 2 40 43 52 106 63 62 75
Grand total 78 78 87 143 111 104 134
Percent from HBCUs
Total science and engineering 10.1 10.9 9.3 9.8 10.5 10.3 12.5
Engineering .0 .0 2.9 .0 5.5 4.1 .0
Sciences 11.1 11.9 10.0 10.9 11.1 11.2 14.0Natural sciences 18.2 13.8 13.0 14.2 12.2 9.4 16.7
Physical sciences 16.1 4.5 8.6 12.1 14.7 .0 13.3Mathematical science .0 .0 37.5 .0 .0 .0 .0Computer science .0 .0 .0 .0 .0 .0 .0
Biological science 28.3 23.3 15.8 21.6 18.3 18.0 24.3Agricultural science .0 .0 .0 .0 .0 .0 5.9
Social sciences 7.8 10.8 8.4 9.4 10.6 12.1 12.5Social science 8.7 11.8 10.1 12.0 6.9 13.9 14.5Psychology 6.7 9.7 6.2 6.9 14.7 9.7 10.1
Non-S&E 2 6.0 7.3 8.7 15.6 8.9 8.8 9.2
Grand total 7.5 8.5 8.9 13.5 9.5 9.4 10.4
In this report, 'Physical science" includes earth, atmospheric, and ocean sciences, as well as physics, astronomy, andchemistry.
2 Non-S&E refers to non-science and non-engineering.
SOURCE: National Science Foundation/SRS, Survey of Earned Doctorates
91

Table 20. Number of earned doctoral degrees conferred by historically black colleges and universities(HBCUs) to black men, by field: 1985-93, selected years
Page 1 of 1
Field 1985 1987 1989 1990 1991 1992 1993
Total, all black recipients
Total science and engineering 237 189 222 231 268 240 265
Engineering 30 24 32 34 47 43 40
Sciences 207 165 190 197 221 197 225Natural sciences 81 73 78 74 85 82 99
Physical science' 24 18 27 24 28 25 35Mathematical science 7 9 5 3 7 4 7Computer science 3 1 0 1 4 4 2
Biological science 32 35 33 30 29 37 42Agricultural science 15 10 13 16 17 12 13
Social sciences 126 92 112 123 136 115 126Social science 84 58 76 79 92 87 82Psychology 42 34 36 44 44 28 44
Non-S&E 2 260 251 240 258 284 280 324
Grand total 497 440 462 489 552 520 589
Black recipients from HBCUs
Total science and engineering 25 20 20 23 28 22 29
Engineering 0 0 0 3 2 0
Sciences 25 20 19 23 25 20 29Natural sciences 14 8 9 8 11 4 14
Physical science' 5 1 2 2 4 0 5Mathematical science 0 0 2 0 0 0 0Computer science 0 0 0 0 0 0 0
Biological science 9 7 5 6 7 4 8Agricultural science 0 0 0 0 0 0
Social sciences 11 12 10 15 14 16 15Social science 7 9 9 11 8 14 12Psychology 4 3 1 4 6 2 3
Non-S&E 2 15 18 20 40 27 25 26
Grand total 40 38 40 63 55 47 55
Percent from HBCUs
Total science and engineering 10.5 10.6 9.0 10.0 10.4 9.2 10.9
Engineering .0 .0 3.1 .0 6.4 4.7 .0
Sciences 12.1 12.1 10.0 11.7 11.3 10.2 12.9Natural sciences 17.3 11.0 11.5 10.8 12.9 4.9 14.1
Physical science' 20.8 5.6 7.4 8.3 14.3 .0 14.3Mathematical scienceComputer science
.0
.0.0.0
40.00
.0
.0.0.0
.0
.0.0.0
Biological scienceAgricultural science
28.1.0
20.0.0
15.2.0
20.0.0
24.1.0
10.8.0
19.07.7
Social sciences 8.7 13.0 8.9 12.2 10.3 13.9 11.9Social science 8.3 15.5 11.8 13.9 8.7 16.1 14.6Psychology 9.5 8.8 2.8 9.1 13.6 7.1 6.8
Non-S&E 2 5.8 7.2 8.3 15.5 9.5 8.9 8.0
Grand total 8.0 8.6 8.7 12.9 10.0 9.0 9.3
1 In this report, "Physical science" includes earth, atmospheric, and ocean sciences, as well as physics, astronomy, andchemistry.
2 Non-S&E refers to non-science and non-engineering.
SOURCE: National Science Foundation/SRS, Survey of Earned Doctorates
92 89

Table 21. Number of earned doctoral degrees conferred by historically black colleges and universities(HBCUs) to black women, by field: 1985-93, selected years
Page 1 of 1
Field 1985 1987 1989 1990 1991 1992 1993
Total, all black recipients
Total science and engineering 138 131 154 148 191 166 207
Engineering 4 1 3 6 8 6 11
Sciences 134 130 151 142 183 160 196Natural sciences 29 36 37 32 46 35 51
Physical sciences 7 4 8 9 6 7 10Mathematical science 0 2 3 1 4 0 1
Computer science 0 1 1 0 4 1 4
Biological science 21 25 24 21 31 24 32Agricultural science 1 4 1 3 4
Social sciences 105 94 114 110 137 125 145Social science 42 35 53 38 52 50 70Psychology 63 59 61 72 85 75 75
Non-S&E2 410 342 357 422 422 425 491
Grand total 548 473 511 570 613 591 698
Black recipients from HBCUs
Total science and engineering 13 15 15 14 20 20 30
Engineering 0 0 0 0 0 0 0
Sciences 13 15 15 14 20 20 30Natural sciences 6 7 6 7 5 7 11
Physical sciences 0 0 1 2 1 0 1
Mathematical science 0 0 1 0 0 0 0Computer science 0 0 0 0 0 0 0
Biological science 6 7 4 5 4 7 10Agricultural science 0 0 0 0 0 0 0
Social sciences 7 8 9 7 15 13 19Social science 4 2 4 3 2 5 10Psychology 3 6 5 4 13 8 9
Non-S&E 2 25 25 32 66 36 37 49
Grand total 38 40 47 80 56 57 79
Percent from HBCUs
Total science and engineering 9.4 11.5 9.7 9.5 10.5 12.0 14.5
Engineering .0 .0 .0 .0 .0 .0 .0
Sciences 9.7 11.5 9.9 9.9 10.9 12.5 15.3Natural sciences 20.7 19.4 16.2 21.9 10.9 20.0 21.6
Physical sciences .0 .0 12.5 22.2 16.7 .0 10.0Mathematical science 0 .0 33.3 .0 .0 0 .0Computer science 0 .0 .0 0 .0 .0 .0
Biological science 28.6 28.0 16.7 23.8 12.9 29.2 31.3Agricultural science .0 .0 .0 .0 .0 .0 .0
Social sciences 6.7 8.5 7.9 6.4 10.9 10.4 13.1Social science 9.5 5.7 7.5 7.9 3.8 10.0 14.3Psychology 4.8 10.2 8.2 5.6 15.3 10.7 12.0
Non-S&E 2 6.1 7.3 9.0 15.6 8.5 8.7 10.0
Grand total 6.9 8.5 9.2 14.0 9.1 9.6 11.3
2
In this report, "Physical science" includes earth, atmospheric, and ocean sciences, as well as physics, astronomy, andchemistry.
Non-S&E refers to non-science and non-engineering.
SOURCE: National Science Foundation/SRS, Survey of Earned Doctorates
90
93

Table 22. Number of earned bachelor's degrees conferred by institutions in Puerto Ricoto Hispanics, by field: 1985-93, selected years
Page 1 of 1
Field 1985 1987 1989 1990 1991 1992 1993
Total, all Hispanic recipients
Total science and engineering 12,031 12,419 13,327 13,918 15,351 17,391 18,442
Engineering 2,187 2,554 2,561 2,511 2,566 2,733 2,961
Sciences 9,844 9,865 10,766 11,407 12,785 14,658 15,481Natural sciences 4,359 4,660 4,417 4,357 4,705 4,892 5,034
Physical science1 660 585 563 522 533 546 599Mathematical science 335 321 373 413 480 482 470Computer science 1,045 1,375 1,195 1,085 1,215 1,173 1,096
Biological science 2,069 2,146 2,090 2,119 2,264 2,477 2,652Agricultural science 250 233 196 218 213 214 217
Social sciences 5,485 5,205 6,349 7,050 8,080 9,766 10,447Social science 3,751 3,503 4,197 4,645 5,334 6,519 6,860Psychology 1,734 1,702 2,152 2,405 2,746 3,247 3,587
Non-S&E 2 23,835 25,113 27,400 29,162 32,945 34,869 38,550
Grand total 35,866 37,532 40,727 43,080 48,296 52,260 56,992
Hispanic recipients from institutions in Puerto Rico
Total science and engineering 2,994 3,065 3,056 2,983 2,952 3,007 3,001
Engineering 412 584 651 626 554 686 697
Sciences 2,582 2,481 2,405 2,357 2,398 2,321 2,304Natural sciences 1,442 1,556 1,479 1,447 1,446 1,339 1,300
Physical science1 244 173 184 184 154 172 172Mathematical science 78 58 69 69 108 34 41Computer science 219 337 326 261 327 296 254
Biological science 828 916 858 862 797 837 833Agricultural science 73 72 42 71 60 0 0
Social sciences 1,140 925 926 910 952 982 1,004Social science 737 576 501 495 523 496 508Psychology 403 349 425 415 429 486 496
Non-S&E 2 7,483 8,776 9,038 9,074 9,421 9,557 10,137
Grand total 10,477 11,841 12,094 12,057 12,373 12,564 13,138
Percent from institutions in Puerto Rico
Total science and engineering 24.9 24.7 22.9 21.4 19.2 17.3 16.3
Engineering 18.8 22.9 25.4 24.9 21.6 25.1 23.5
Sciences 26.2 25.1 22.3 20.7 18.8 15.8 14.9Natural sciences 33.1 33.4 33.5 33.2 30.7 27.4 25.8
Physical science' 37.0 29.6 32.7 35.2 28.9 31.5 28.7Mathematical science 23.3 18.1 18.5 16.7 22.5 7.1 8.7Computer science 21.0 24.5 27.3 24.1 26.9 25.2 23.2
Biological science 40.0 42.7 41.1 40.7 35.2 33.8 31.4Agricultural science 29.2 30.9 21.4 32.6 28.2 .0 .0
Social sciences 20.8 17.8 14.6 12.9 11.8 10.1 9.6Social science 19.6 16.4 11.9 10.7 9.8 7.6 7.4Psychology 23.2 20.5 19.7 17.3 15.6 15.0 13.8
Non-S&E 2 31.4 34.9 33.0 31.1 28.6 27.4 26.3
Grand total 29.2 31.5 29.7 28.0 25.6 24.0 23.1
2
In this report, Physical science" includes earth, atmospheric, and ocean sciences, as well as physics, astronomy, andchemistry.
Non-S&E refers to non-science and non-engineering.
NOTES: Data on race/ethnicity were collected biennially from 1977 through 1989 and annually thereafter. Data onrace/ethnicity of degree recipients are collected on broad fields of study only; therefore, these data could not beadjusted to the exact field taxonomies used by NSF.
Racial/ethnic categories are as designated on the survey form. These categories include U.S. citizens and foreigncitizens on permanent visas (i.e., resident aliens who have been admitted for permanent residency).
SOURCES: Tabulations by National Science Foundation/SRS; data from National Center for Education Statistics; data fromthe HEGIS Earned Degrees Surveys, 1985, and IPEDS Completions Surveys, 1987-93
9491

92
Table 23. Number of earned bachelor's degrees conferred by institutions in Puerto Ricoto Hispanic men, by field: 1985-93, selected years
Page 1 of 1
Field 1985 1987 1989 1990 1991 1992 1993
Total, al Hispanic recipients
Total science and engineering 6,751 6,974 7,318 7,434 7,888 8,730 9,160
Engineering 1,863 2,100 2,100 2,035 2,039 2,187 2,355
Sciences 4,888 4,874 5,218 5,399 5,849 6,543 6,805Natural sciences 2,380 2,516 2,432 2,328 2,458 2,497 2,608
Physical science' 441 377 362 311 318 326 361Mathematical science 189 196 224 249 259 279 273Computer science 582 766 750 669 738 724 700
Biological science 997 1,018 965 955 1,019 1,043 1,144Agricultural science 171 159 131 144 124 125 130
Social sciences 2,508 2,358 2,786 3,071 3,391 4,046 4,197Social science 1,966 1,845 2,153 2,384 2,634 3,220 3,269Psychology 542 513 633 687 757 826 928
Non-S&E 2 8,923 9,070 10,117 10,527 12,238 12,667 13,955
Grand total 15,674 16,044 17,435 17,961 20,126 21,397 23,115
Hispanic recipients from institutions in Puerto Rico
Total science and engineering 1,457 1,524 1,559 1,462 1,365 1,362 1,339
Engineering 362 453 525 481 398 498 511
Sciences 1,095 1,071 1,034 981 967 864 828Natural sciences 644 730 671 626 612 520 496
Physical science' 132 98 91 90 70 78 70Mathematical science 41 30 39 47 50 20 24Computer science 98 172 197 143 170 159 147
Biological science 316 377 322 302 293 263 255Agricultural science 57 53 22 44 29 0 0
Social sciences 451 341 363 355 355 344 332Social science 341 272 257 252 245 243 211Psychology 110 69 106 103 110 101 121
Non-S&E2 2,255 2,492 2,710 2,689 3,073 2,746 2,869
Grand total 3,712 4,016 4,269 4,151 4,438 4,108 4,208
Percent from institutions in Puerto Rico
Total science and engineering 21.6 21.9 21.3 19.7 17.3 15.6 14.6
Engineering 19.4 21.6 25.0 23.6 19.5 22.8 21.7
Sciences 22.4 22.0 19.8 18.2 16.5 13.2 12.2Natural sciences 27.1 29.0 27.6 26.9 24.9 20.8 19.0
Physical science' 29.9 26.0 25.1 28.9 22.0 23.9 19.4Mathematical science 21.7 15.3 17.4 18.9 19.3 7.2 8.8Computer science 16.8 22.5 26.3 21.4 23.0 22.0 21.0
Biological science 31.7 37.0 33.4 31.6 28.8 25.2 22.3Agricultural science 33.3 33.3 16.8 30.6 23.4 .0 .0
Social sciences 18.0 14.5 13.0 11.6 10.5 8.5 7.9Social science 17.3 14.7 11.9 10.6 9.3 7.5 6.5Psychology 20.3 13.5 16.7 15.0 14.5 12.2 13.0
Non-S&E 2 25.3 27.5 26.8 25.5 25.1 21.7 20.6
Grand total 23.7 25.0 24.5 23.1 22.1 19.2 18.2
In this report, "Physical science" includes earth, atmospheric, and ocean sciences, as well as physics, astronomy, andchemistry.
2 Non-S&E refers to non-science and non-engineering.
NOTES: Data on race/ethnicity were collected biennially from 1977 through 1989 and annually thereafter. Data onrace/ethnicity of degree recipients are collected on broad fields of study only; therefore, these data could not beadjusted to the exact field taxonomies used by NSF.
Racial/ethnic categories are as designated on the survey form. These categories include U.S. citizens and foreigncitizens on permanent visas (i.e., resident aliens who have been admitted for permanent residency).
SOURCES: Tabulations by National Science Foundation/SRS; data from National Center for Education Statistics; data fromthe HEGIS Earned Degrees Surveys, 1985, and IPEDS Completions Surveys, 1987-93
BEST COPY AVAILABLE95

Table 24. Number of earned bachelor's degrees conferred by institutions in Puerto Ricoto Hispanic women, by field: 1985-93, selected years
Page 1 of 1
Field 1985 1987 1989 1990 1991 1992 1993
Total, al Hispanic recipients
Total science and engineering 5,280 5,445 6,009 6,484 7,463 8,661 9,282
Engineering 324 454 461 476 527 546 606
Sciences 4,956 4,991 5,548 6,008 6,936 8,115 8,676Natural sciences 1,979 2,144 1,985 2,029 2,247 2,395 2,426
Physical science' 219 208 201 211 215 220 238Mathematical science 146 125 149 164 221 203 197Computer science 463 609 445 416 477 449 396
Biological science 1,072 1,128 1,125 1,164 1,245 1,434 1,508Agricultural science 79 74 65 74 89 89 87
Social sciences 2,977 2,847 3,563 3,979 4,689 5,720 6,250Social science 1,785 1,658 2,044 2,261 2,700 3,299 3,591Psychology 1,192 1,189 1,519 1,718 1,989 2,421 2,659
Non-S&E 2 14,912 16,043 17,283 18,635 20,707 22,202 24,595
Grand total 20,192 21,488 23,292 25,119 28,170 30,863 33,877
Hispanic recipients from institutions in Puerto Rico
Total science and engineering 1,537 1,541 1,497 1,521 1,587 1,645 1,662
Engineering 50 131 126 145 156 188 186
Sciences 1,487 1,410 1,371 1,376 1,431 1,457 1,476Natural sciences 798 826 808 821 834 819 804
Physical science' 112 75 93 94 84 94 102Mathematical science 37 28 30 22 58 14 17Computer science 121 165 129 118 157 137 107
Biological science 512 539 536 560 504 574 578Agricultural science 16 19 20 27 31 0 0
Social sciences 689 584 563 555 597 638 672Social science 396 304 244 243 278 253 297Psychology 293 280 319 312 319 385 375
Non-S&E 2 5,228 6,284 6,328 6,385 6,348 6,811 7,268
Grand total 6,765 7,825 7,825 7,906 7,935 8,456 8,930
Percent from institutions in Puerto Rico
Total science and engineering 29.1 28.3 24.9 23.5 21.3 19.0 17.9
Engineering 15.4 28.9 27.3 30.5 29.6 34.4 30.7
Sciences 30.0 28.3 24.7 22.9 20.6 18.0 17.0Natural sciences 40.3 38.5 40.7 40.5 37.1 34.2 33.1
Physical science' 51.1 36.1 46.3 44.5 39.1 42.7 42.9Mathematical science 25.3 22.4 20.1 13.4 26.2 6.9 8.6Computer science 26.1 27.1 29.0 28.4 32.9 30.5 27.0
Biological science 47.8 47.8 47.6 48.1 40.5 40.0 38.3Agricultural science 20.3 25.7 30.8 36.5 34.8 .0 .0
Social sciences 23.1 20.5 15.8 13.9 12.7 11.2 10.8Social science 22.2 18.3 11.9 10.7 10.3 7.7 8.3Psychology 24.6 23.5 21.0 18.2 16.0 15.9 14.1
Non-S&E 2 35.1 39.2 36.6 34.3 30.7 30.7 29.6
Grand total 33.5 36.4 33.6 31.5 28.2 27.4 26.4
I In this report, Physical science" includes earth, atmospheric, and ocean sciences, as well as physics, astronomy, andchemistry.
2 Non-S&E refers to non-science and non-engineering.
NOTES: Data on race/ethnicity were collected biennially from 1977 through 1989 and annually thereafter. Data onrace/ethnicity of degree recipients are collected on broad fields of study only; therefore, these data could not beadjusted to the exact field taxonomies used by NSF.
Racial/ethnic categories are as designated on the survey form. These categories include U.S. citizens and foreigncitizens on permanent visas (i.e., resident aliens who have been admitted for permanent residency).
SOURCES: Tabulations by National Science Foundation/SRS; data from National Center for Education Statistics; data fromthe HEGIS Earned Degrees Surveys, 1985, and IPEDS Completions Surveys, 1987-93
93
96

94
Table 25. Number of earned master's degrees conferred by institutions in Puerto Ricoto Hispanics, by field: 1985-93, selected years
Page 1 of 1
Field 1985 1987 1989 1990 1991 1992 1993
Total, all Hispanic recipients
Total science and engineering 1,514 1,584 1,585 1,587 1,736 1,806 2,092
Engineering 346 512 468 446 468 488 581
Sciences 1,168 1,072 1,117 1,141 1,268 1,318 1,511
Natural sciences 481 493 444 431 494 503 574Physical science1 127 122 92 98 96 93 114Mathematical science 55 60 34 51 85 66 78Computer science 94 123 144 118 128 149 162
Biological science 139 126 126 120 136 146 151
Agricultural science 66 62 48 44 49 49 69
Social sciences 687 579 673 710 774 815 937Social science 343 308 313 341 383 396 474Psychology 344 271 360 369 391 419 463
Non-S&E2 6,210 6,180 6,538 6,899 7,929 8,427 9,254
Grand total 7,724 7,764 8,123 8,486 9,665 10,233 11,346
Hispanic recipients from institutions in Puerto Rico
Total science and engineering 169 184 214 207 214 140 160
Engineering 9 11 22 32 23 0
Sciences 160 173 192 175 191 140 159Natural sciences 72 99 62 65 83 27 47
Physical science1 20 13 19 21 16 9 12Mathematical science 6 8 6 7 17 7 14Computer science 0 0 7 0 0 0 4
Biological science 30 44 17 30 39 11 17Agricultural science 16 34 13 7 11 0 0
Social sciences 88 74 130 110 108 113 112Social science 17 33 25 25 31 32 30Psychology 71 41 105 85 77 81 82
Non-S&E 2 696 936 1,033 855 1,009 1,084 1,081
Grand total 865 1,120 1,247 1,062 1,223 1,224 1,241
Percent from institutions in Puerto Rico
Total science and engineering 11.2 11.6 13.5 13.0 12.3 7.8 7.6
Engineering 2.6 2.1 4.7 7.2 4.9 .0 .2
Sciences 13.7 16.1 17.2 15.3 15.1 10.6 10.5Natural sciences 15.0 20.1 14.0 15.1 16.8 5.4 8.2
Physical science1 15.7 10.7 20.7 21.4 16.7 9.7 10.5Mathematical science 10.9 13.3 17.6 13.7 20.0 10.6 17.9
Computer science .0 .0 4.9 .0 .0 .0 2.5
Biological science 21.6 34.9 13.5 25.0 28.7 7.5 11.3Agricultural science 24.2 54.8 27.1 15.9 22.4 .0 .0
Social sciences 12.8 12.8 19.3 15.5 14.0 13.9 12.0Social science 5.0 10.7 8.0 7.3 8.1 8.1 6.3Psychology 20.6 15.1 29.2 23.0 19.7 19.3 17.7
Non-S&E2 11.2 15.1 15.8 12.4 12.7 12.9 11.7
Grand total 11.2 14.4 15.4 12.5 12.7 12.0 10.9
1 In this report, "Physical science" includes earth, atmospheric, and ocean sciences, as well as physics, astronomy, andchemistry.
2 Non-S&E refers to non-science and non-engineering.
NOTES: Data on race/ethnicity were collected biennially from 1977 through 1989 and annually thereafter. Data onrace/ethnicity of degree recipients are collected on broad fields of study only; therefore, these data could not beadjusted to the exact field taxonomies used by NSF.
Racial/ethnic categories are as designated on the survey form. These categories include U.S. citizens and foreigncitizens on permanent visas (i.e., resident aliens who have been admitted for permanent residency).
SOURCES: Tabulations by National Science Foundation/SRS; data from National Center for Education Statistics; data fromthe HEGIS Earned Degrees Surveys, 1985, and IPEDS Completions Surveys, 1987-93
7

Table 26. Number of earned master's degrees conferred by institutions in Puerto Ricoto Hispanic men, by field: 1985-93, selected years
Page 1 of 1
Field 1985 1987 1989 1990 1991 1992 1993
Total, al Hispanic recipients
Total science and engineering 939 1,045 970 959 992 1,066 1,255
Engineering 304 444 394 373 378 408 480
Sciences 635 601 576 586 614 658 775Natural sciences 307 318 282 275 294 309 341
Physical sciences 95 88 65 63 73 64 76Mathematical science 31 41 21 33 52 47 50Computer science 65 91 100 93 84 98 104
Biological science 62 53 62 61 54 69 76Agricultural science 54 45 34 25 31 31 35
Social sciences 328 283 294 311 320 349 434Social science 195 187 176 178 196 218 282Psychology 133 96 118 133 124 131 152
Non-S&E 2 2,398 2,465 2,620 2,747 3,115 3,299 3,602
Grand total 3,337 3,510 3,590 3,706 4,107 4,365 4,857
Hispanic recipients from institutions in Puerto Rico
Total science and engineering 75 93 103 103 80 48 56
Engineering 8 11 21 26 15 0
Sciences 67 82 82 77 65 48 55Natural sciences 40 54 35 33 39 12 23
Physical sciences 8 8 14 11 9 4 6Mathematical science 3 4 2 3 9 4 11Computer science 0 0 4 0 0 0 1
Biological science 14 15 5 14 13 4 5Agricultural science 15 27 10 5 8 0 0
Social sciences 27 28 47 44 26 36 32Social science 8 18 16 10 8 14 16Psychology 19 10 31 34 18 22 16
Non-S&E 2 208 276 313 262 306 350 346
Grand total 283 369 416 365 386 398 402
Percent from institutions in Puerto Rico
Total science and engineering 8.0 8.9 10.6 10.7 8.1 4.5 4.5
Engineering 2.6 2.5 5.3 7.0 4.0 .0 .2
Sciences 10.6 13.6 14.2 13.1 10.6 7.3 7.1Natural sciences 13.0 17.0 12.4 12.0 13.3 3.9 6.7
Physical sciencel 8.4 9.1 21.5 17.5 12.3 6.3 7.9Mathematical science 9.7 9.8 9.5 9.1 17.3 8.5 22.0Computer science .0 .0 4.0 .0 .0 .0 1.0
Biological science 22.6 28.3 8.1 23.0 24.1 5.8 6.6Agricultural science 27.8 60.0 29.4 20.0 25.8 .0 .0
Social sciences 8.2 9.9 16.0 14.1 8.1 10.3 7.4Social science 4.1 9.6 9.1 5.6 4.1 6.4 5.7Psychology 14.3 10.4 26.3 25.6 14.5 16.8 10.5
Non-S&E 2 8.7 11.2 11.9 9.5 9.8 10.6 9.6
Grand total 8.5 10.5 11.6 9.8 9.4 9.1 8.3
I In this report, 'Physical science" includes earth, atmospheric, and ocean sciences, as well as physics, astronomy, andchemistry.
2 Non-S&E refers to non-science and non-engineering.
NOTES: Data on race/ethnicity were collected biennially from 1977 through 1989 and annually thereafter. Data onrace/ethnicity of degree recipients are collected on broad fields of study only; therefore, these data could not beadjusted to the exact field taxonomies used by NSF.
Racial/ethnic categories are as designated on the survey form. These categories include U.S. citizens and foreigncitizens on permanent visas (i.e., resident aliens who have been admitted for permanent residency).
SOURCES: Tabulations by National Science Foundation/SRS; data from National Center for Education Statistics; data fromthe HEGIS Earned Degrees Surveys, 1985, and IPEDS Completions Surveys, 1987-93
9 895

96
Table 27. Number of earned master's degrees conferred by institutions in Puerto Ricoto Hispanic women, by field: 1985-93, selected years
Page 1 of 1
Field 1985 1987 1989 1990 1991 1992 1993
Total, al Hispanic recipients
Total science and engineering 575 539 615 628 744 740 837
Engineering 42 68 74 73 90 80 101
Sciences 533 471 541 555 654 660 736Natural sciences 174 175 162 156 200 194 233
Physical science1 32 34 27 35 23 29 38Mathematical science 24 19 13 18 33 19 28Computer science 29 32 44 25 44 51 58
Biological science 77 73 64 59 82 77 75Agricultural science 12 17 14 19 18 18 34
Social sciences 359 296 379 399 454 466 503Social science 148 121 137 163 187 178 192Psychology 211 175 242 236 267 288 311
Non-S&E 2 3,812 3,715 3,918 4,152 4,814 5,128 5,652
Grand total 4,387 4,254 4,533 4,780 5,558 5,868 6,489
Hispanic recipients from institutions in Puerto Rico
Total science and engineering 94 91 111 104 134 92 104
Engineering 0 1 6 8 0 0
Sciences 93 91 110 98 126 92 104Natural sciences 32 45 27 32 44 15 24
Physical science1 12 5 5 10 7 5 6Mathematical science 3 4 4 4 8 3 3Computer science 0 0 3 0 0 0 3
Biological science 16 29 12 16 26 7 12Agricultural science 1 7 3 2 3 0 0
Social sciences 61 46 83 66 82 77 80Social science 9 15 9 15 23 18 14Psychology 52 31 74 51 59 59 66
Non-S&E2 488 660 720 593 703 734 735
Grand total 582 751 831 697 837 826 839
Percent from institutions in Puerto Rico
Total science and engineering 16.3 16.9 18.0 16.6 18.0 12.4 12.4
Engineering 2.4 .0 1.4 8.2 8.9 .0 .0
Sciences 17.4 19.3 20.3 17.7 19.3 13.9 14.1Natural sciences 18.4 25.7 16.7 20.5 22.0 7.7 10.3
Physical science1 37.5 14.7 18.5 28.6 30.4 17.2 15.8Mathematical science 12.5 21.1 30.8 22.2 24.2 15.8 10.7Computer science .0 .0 6.8 .0 .0 .0 5.2
Biological science 20.8 39.7 18.8 27.1 31.7 9.1 16.0Agricultural science 8.3 41.2 21.4 10.5 16.7 .0 .0
Social sciences 17.0 15.5 21.9 16.5 18.1 16.5 15.9Social science 6.1 12.4 6.6 9.2 12.3 10.1 7.3Psychology 24.6 17.7 30.6 21.6 22.1 20.5 21.2
Non-S&E 2 12.8 17.8 18.4 14.3 14.6 14.3 13.0
Grand total 13.3 17.7 18.3 14.6 15.1 14.1 12.9
1 In this report, "Physical science" includes earth, atmospheric, and ocean sciences, as well as physics, astronomy, andchemistry.
2 Non-S&E refers to non-science and non-engineering.
NOTES: Data on race/ethnicity were collected biennially from 1977 through 1989 and annually thereafter. Data onrace/ethnicity of degree recipients are collected on broad fields of study only; therefore, these data could not beadjusted to the exact field taxonomies used by NSF.
Racial/ethnic categories are as designated on the survey form. These categories include U.S. citizens and foreigncitizens on permanent visas (i.e., resident aliens who have been admitted for permanent residency).
SOURCES: Tabulations by National Science Foundation/SRS; data from National Center for Education Statistics; data fromthe HEGIS Earned Degrees Surveys, 1985, and IPEDS Completions Surveys, 1987-93
9

Table 28. Number of earned doctoral degrees conferred by institutions in Puerto Ricoto Hispanics, by field: 1985-93, selected years
Page 1 of 1
Field 1985 1987 1989 1990 1991 1992 1993
Total, all Hispanic recipients
Total science and engineering 297 363 385 471 496 522 546
Engineering 22 35 47 54 61 71 65
Sciences 275 328 338 417 435 451 481Natural sciences 125 157 174 214 215 232 251
Physical science1 36 62 69 86 81 89 94Mathematical science 12 11 11 11 9 12 16Computer science 6 4 4 5 12 8 7
Biological science 59 64 71 89 97 102 114Agricultural science 12 16 19 23 16 21 20
Social sciences 150 171 164 203 220 219 230Social science 81 76 71 94 98 83 97Psychology 69 95 93 109 122 136 133
Non-S&E2 343 353 314 371 377 397 430
Grand total 640 716 699 842 873 919 976
Hispanic recipients from institutions in Puerto Rico
Total science and engineering 5 6 12 18 12 29 16
Engineering 0 0 0 0 0 0 0
Sciences 5 6 12 18 12 29 16
Natural sciences 4 5 5 8 5 5 8Physical sciences 3 4 4 6 3 4 6Mathematical science 0 0 0 0 0 0 0Computer science 0 0 0 0 0 0 0
Biological science 1 2 2 2Agricultural science 0 0 0 0 0 0 0
Social sciences 1 7 10 7 24 8Social science 1 1 0 1 5 0Psychology 0 0 6 10 6 19 8
Non-S&E 2 4 7 5 16 13 24 24
Grand total 9 13 17 34 25 53 40
Percent from institutions in Puerto Rico
Total science and engineering 1.7 1.7 3.1 3.8 2.4 5.6 2.9
Engineering .0 .0 .0 .0 .0 .0 .0
Sciences 1.8 1.8 3.6 4.3 2.8 6.4 3.3Natural sciences 3.2 3.2 2.9 3.7 2.3 2.2 3.2
Physical science1 8.3 6.5 5.8 7.0 3.7 4.5 6.4Mathematical science .0 .0 .0 .0 .0 .0 .0
Computer science .0 .0 .0 .0 .0 .0 .0
Biological science 1.7 1.6 1.4 2.2 2.1 1.0 1.8Agricultural science .0 .0 .0 .0 .0 .0 .0
Social sciences .7 .6 4.3 4.9 3.2 11.0 3.5Social science 1.2 1.3 1.4 .0 1.0 6.0 .0Psychology .0 .0 6.5 9.2 4.9 14.0 6.0
Non-S&E2 1.2 2.0 1.6 4.3 3.4 6.0 5.6
Grand total 1.4 1.8 2.4 4.0 2.9 5.8 4.1
In this report, "Physical science" includes earth, atmospheric, and ocean sciences, as well as physics, astronomy, andchemistry.
2 Non-S&E refers to non-science and non-engineering.
SOURCE: National Science Foundation/SRS, Survey of Earned Doctorates
BEST COPY AVAILABLE
100 97

98
Table 29. Number of earned doctoral degrees conferred by institutions in Puerto Ricoto Hispanic men, by field: 1985-93, selected years
Page 1 of 1
Field 1985 1987 1989 1990 1991 1992 1993
Total, al Hispanic recipients
Total science and engineering 183 222 230 292 309 313 319
Engineering 22 30 39 45 51 56 53
Sciences 161 192 191 247 258 257 266Natural sciences 83 109 122 140 154 154 162
Physical science1 28 44 48 56 68 63 70Mathematical science 7 9 7 7 5 9 14Computer science 4 4 1 4 11 7 6
Biological science 36 40 50 56 57 59 57Agricultural science 8 12 16 17 13 16 15
Social sciences 78 83 69 107 104 103 104Social science 50 51 39 55 52 47 59Psychology 28 32 30 52 52 56 45
Non-S&E 2 169 167 149 159 153 175 197
Grand total 352 389 379 451 462 488 516
Hispanic recipients from institutions in Puerto Rico
Total science and engineering 4 3 6 3 12 7
Engineering 0 0 0 0 0 0 0
Sciences 4 3 6 3 12 7Natural sciences 4 2 2 2 4 4
Physical science1 0 3 2 1 2 3 2Mathematical science 0 0 0 0 0 0 0Computer science 0 0 0 0 0 0 0
Biological science 0 0 2Agricultural science 0 0 0 0 0 0 0
Social sciences 0 0 4 8 3Social science 0 0 0 0 0 0 0Psychology 0 0 4 8 3
Non-S&E 2 0 2 2 3 4 3 5
Grand total 6 5 9 7 15 12
Percent from institutions in Puerto Rico
Total science and engineering 0.5 1.8 1.3 2.1 1.0 3.8 2.2
Engineering .0 .0 .0 .0 .0 .0 .0
Sciences .6 2.1 1.6 2.4 1.2 4.7 2.6Natural sciences 1.2 3.7 1.6 1.4 1.3 2.6 2.5
Physical science1Mathematical science
.0.0
6.8.0
4.2.0
1.8.0
2.9.0
4.8.0
2.9
Computer science .0 .0 .0 .0 .0 .0.0.0
Biological science 2.8 2.5 .0 1.8 .0 1.7 3.5Agricultural science .0 .0 .0 .0 .0 .0 .0
Social sciencesSocial sciencePsychology
.0
.0
.0
.0
.0
.0
1.4.0
3.3
3.7.0
7.7
1.0.0
1.9
7.8.0
14.3
2.9.0
6.7
Non-S&E 2 .0 1.2 1.3 1.9 2.6 1.7 2.5
Grand total .3 1.5 1.3 2.0 1.5 3.1 2.3
1 In this report, "Physical science" includes earth, atmospheric, and ocean sciences, as well as physics, astronomy, andchemistry.
2 Non-S&E refers to non-science and non-engineering.
SOURCE: National Science Foundation/SRS, Survey of Earned Doctorates
101

Table 30. Number of earned doctoral degrees conferred by institutions in Puerto Ricoto Hispanic women, by field: 1985-93, selected years
Page 1 of 1
Field 1985 1987 1989 1990 1991 1992 1993
Total, al Hispanic recipients
Total science and engineering 114 141 155 179 187 209 227
Engineering 0 5 8 9 10 15 12
Sciences 114 136 147 170 177 194 215Natural sciences 42 48 52 74 61 78 89
Physical science I 8 18 21 30 13 26 24Mathematical science 5 2 4 4 4 3 2Computer science 2 0 3 1 1 1 1
Biological science 23 24 21 33 40 43 57Agricultural science 4 4 3 6 3 5 5
Social sciences 72 88 95 96 116 116 126Social science 31 25 32 39 46 36 38Psychology 41 63 63 57 70 80 88
Non-S&E2 174 186 165 212 224 222 233
Grand total 288 327 320 391 411 431 460
Hispanic recipients from institutions in Puerto Rico
Total science and engineering 4 2 9 12 9 17 9
Engineering 0 0 0 0 0 0 0
Sciences 4 2 9 12 9 17 9
Natural sciences 3 1 3 6 3 4
Physical sciences 3 1 2 5 1 4Mathematical science 0 0 0 0 0 0 0
Computer science 0 0 0 0 0 0 0
Biological science 0 0 1 1 2 0 0
Agricultural science 0 0 0 0 0 0 0
Social sciences 1 6 6 6 16 5
Social science 1 1 0 1 5 0
Psychology 0 0 5 6 5 11 5
Non-S&E2 4 5 3 13 9 21 19
Grand total 8 7 12 25 18 38 28
Percent from institutions in Puerto Rico
Total science and engineering 3.5 1.4 5.8 6.7 4.8 8.1 4.0
Engineering 0 .0 .0 .0 .0 .0 .0
Sciences 3.5 1.5 6.1 7.1 5.1 8.8 4.2
Natural sciences 7.1 2.1 5.8 8.1 4.9 1.3 4.5
Physical sciencel 37.5 5.6 9.5 16.7 7.7 3.8 16.7
Mathematical science .0 .0 .0 .0 .0 .0 .0
Computer science .0 0 .0 .0 .0 .0 .0
Biological science .0 .0 4.8 3.0 5.0 .0 .0
Agricultural science .0 .0 .0 .0 .0 .0 .0
Social sciences 1.4 1.1 6.3 6.3 5.2 13.8 4.0
Social science 3.2 4.0 3.1 .0 2.2 13.9 .0
Psychology .0 .0 7.9 10.5 7.1 13.7 5.7
Non-S&E 2 2.3 2.7 1.8 6.1 4.0 9.5 8.2
Grand total 2.8 2.1 3.7 6.4 4.4 8.8 6.1
In this report, 'Physical science" includes earth, atmospheric, and ocean sciences, as well as physics, astronomy, andchemistry.
2 Non-S&E refers to non-science and non-engineering.
SOURCE: National Science Foundation/SRS, Survey of Earned Doctorates
102 99

100
Table 31. Number of earned bachelor's degrees awarded in engineering technologies,by race/ethnicity and sex of recipient: 1985-93
Page 1 of 1
Citizenship and race/ethnicity 1985 1987 1989 1990 1991 1992 1993
Total
Total, all recipients 20,533 20,577 20,098 19,150 18,294 17,113 16,987
U.S. citizens and permanent residents,total1 19,120 19,359 18,942 18,059 17,080 16,138 16,109
White, non-Hispanics 16,673 16,541 16,156 15,251 14,279 13,286 13,245Asians 542 807 839 755 768 778 768Underrepresented minorities, total 1,905 2,011 1,947 2,053 2,033 2,074 2,096
Black, non-Hispanics 1,277 1,269 1,208 1,200 1,227 1,239 1,132Hispanics 525 664 634 784 731 747 853American Indians or Alaskan Natives 103 78 105 69 75 88 111
Nonresident aliens2 1,277 986 659 727 712 516 441
Unknown race/ethnicity or citizenship 136 232 497 364 502 459 437
Men
Total, all recipients 18,278 18,429 17,999 17,113 16,329 15,309 15,089
U.S. citizens and permanent residents,total1 16,979 17,301 16,922 16,091 15,211 14,418 14,280
White, non-Hispanics 14,911 14,933 14,578 13,679 12,819 12,069 11,908Asians 492 727 743 679 700 690 678Underrepresented minorities, total 1,576 1,641 1,601 1,733 1,692 1,659 1,694
Black, non-Hispanics 1,009 983 941 953 968 949 892Hispanics 475 594 567 722 655 629 710American Indians or Alaskan Natives 92 64 93 58 69 81 92
Nonresident aliens2 1,194 920 616 682 669 468 402
Unknown race/ethnicity or citizenship 105 208 461 340 449 423 407
Women
Total, all recipients 2,255 2,148 2,099 2,037 1,965 1,804 1,898
U.S. citizens and permanent residents,total1 2,141 2,058 2,020 1,968 1,869 1,720 1,829
White, non-Hispanics 1,762 1,608 1,576 1,572 1,460 1,217 1,337Asians 50 80 96 76 68 88 90Underrepresented minorities, total 329 370 346 320 341 415 402
Black, non-Hispanics 268 286 267 247 259 290 240Hispanics 50 70 67 62 76 118 143American Indians or Alaskan Natives 11 14 12 11 6 7 19
Nonresident aliens2 83 66 43 45 43 48 39
Unknown race/ethnicity or citizenship 31 24 36 24 53 36 30
1 Racial/ethnic categories are as designated on the survey form. These categories include U.S. citizens and foreign citizenson permanent visas (i.e., resident aliens who have been admitted for permanent residency).
2 Nonresident aliens include foreign citizens on temporary visas only.
NOTES: Data on race/ethnicity were collected biennially from 1977 through 1989 and annually thereafter.
Data on race/ethnicity of degree recipients are collected on broad fields of study only; therefore, these data couldnot be adjusted to the exact field taxonomies used by NSF.
Engineering technologies are a summary of instructional programs that prepare individuals to support and assistengineering and related professionals or to independently provide such services. Programs stress specialized,practical knowledge related to the mathematical, scientific, or technical aspects of engineering and relatedsciences.
SOURCES: Tabulations by National Science Foundation/SRS; data from National Center for Education Statistics; data fromthe HEGIS Earned Degrees Surveys, 1985, and IPEDS Completions Surveys, 1987-93
103

Table 32. Number of earned master's degrees awarded In engineering technologies,by race/ethnicity and sex of recipient: 1985-93
Page 1 of 1
Citizenship and race/ethnicity 1985 1987 1989 1990 1991 1992 1993
Total
Total, all recipients 816 883 1,135 1,194 1,188 1,278 1,555
U.S. citizens and permanent residents,total1 596 712 909 960 959 967 1,175
White, non-Hispanics 526 581 802 823 830 817 1,041Asians 25 46 40 79 60 58 40Underrepresented minorities, total 45 85 67 58 69 92 94
Black, non-Hispanics 37 42 55 44 47 64 61
Hispanics 6 17 10 9 19 23 25American Indians or Alaskan Natives 2 26 2 5 3 5 8
Nonresident aliens2 124 127 131 162 172 215 279
Unknown race/ethnicity or citizenship 96 44 95 72 57 96 101
Men
Total, all recipients 674 678 892 888 888 971 1,172
U.S. citizens and permanent residents,totall 481 549 715 690 705 730 868
White, non-Hispanics 423 436 631 607 619 619 783Asians 23 41 36 40 39 45 28Underrepresented minorities, total 35 72 48 43 47 66 57
Black, non-Hispanics 28 35 40 32 29 46 32Hispanics 5 11 7 7 17 16 18American Indians or Alaskan Natives 2 26 1 4 1 4 7
Nonresident aliens2 115 105 103 131 131 156 211
Unknown race/ethnicity or citizenship 78 24 74 67 52 85 93
Women
Total, all recipients 142 205 243 306 300 307 383
U.S. citizens and permanent residents,total1 115 163 194 270 254 237 307
White, non-Hispanics 103 145 171 216 211 198 258Asians 2 5 4 39 21 13 12Underrepresented minorities, total 10 13 19 15 22 26 37
Black, non-Hispanics 9 7 15 12 18 18 29Hispanics 1 6 3 2 2 7 7American Indians or Alaskan Natives 0 0 1 1 2 1 1
Nonresident aliens2 9 22 28 31 41 59 68
Unknown race/ethnicity or citizenship 18 20 21 5 5 11 8
Racial/ethnic categories are as designated on the survey form. These categories include U.S. citizens and foreign citizenson permanent visas (i.e., resident aliens who have been admitted for permanent residency).
2 Nonresident aliens include foreign citizens on temporary visas only.
NOTES: Data on race/ethnicity were collected biennially from 1977 through 1989 and annually thereafter.
Data on race/ethnicity of degree recipients are collected on broad fields of study only; therefore, these data couldnot be adjusted to the exact field taxonomies used by NSF.
Engineering technologies are a summary of instructional programs that prepare individuals to support and assistengineering and related professionals or to independently provide such services. Programs stress specialized,practical knowledge related to the mathematical, scientific, or technical aspects of engineering and relatedsciences.
SOURCES: Tabulations by National Science Foundation/SRS; data from National Center for Education Statistics; data fromthe HEGIS Earned Degrees Surveys, 1985, and IPEDS Completions Surveys, 1987-93
104101
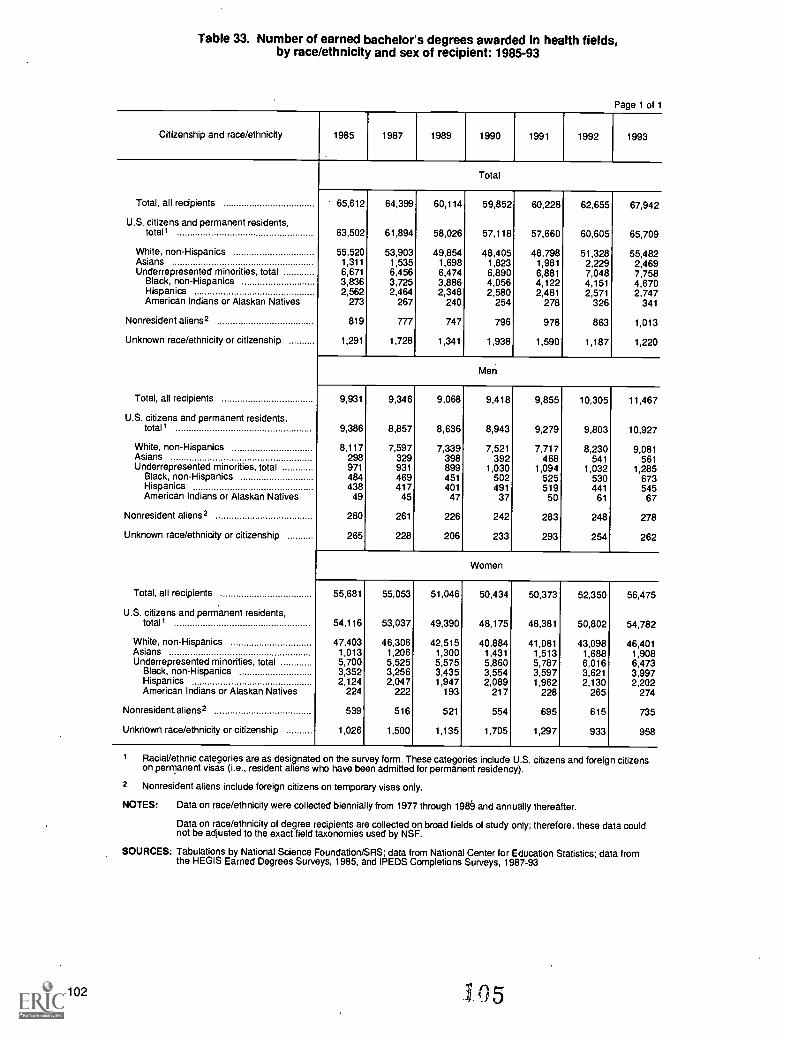
Table 33. Number of earned bachelor's degrees awarded in health fields,by race/ethnicity and sex of recipient: 1985-93
Page 1 of 1
Citizenship and race/ethnicity 1985 1987 1989 1990 1991 1992 1993
Total
Total, all recipients 65,612 64,399 60,114 59,852 60,228 62,655 67,942
U.S. citizens and permanent residents,total 63,502 61,894 58,026 57,118 57,660 60,605 65,709
White, non-Hispanics 55,520 53,903 49,854 48,405 48,798 51,328 55,482Asians 1,311 1,535 1,698 1,823 1,981 2,229 2,469Underrepresented minorities, total 6,671 6,456 6,474 6,890 6,881 7,048 7,758
Black, non-Hispanics 3,836 3,725 3,886 4,056 4,122 4,151 4,670Hispanics 2,562 2,464 2,348 2,580 2,481 2,571 2,747American Indians or Alaskan Natives 273 267 240 254 278 326 341
Nonresident aliens2 819 777 747 796 978 863 1,013
Unknown race/ethnicity or citizenship 1,291 1,728 1,341 1,938 1,590 1,187 1,220
Men
Total, all recipients 9,931 9,346 9,068 9,418 9,855 10,305 11,467
U.S. citizens and permanent residents,total1 9,386 8,857 8,636 8,943 9,279 9,803 10,927
White, non-Hispanics 8,117 7,597 7,339 7,521 7,717 8,230 9,081Asians 298 329 398 392 468 541 561Underrepresented minorities, total 971 931 899 1,030 1,094 1,032 1,285
Black, non-Hispanics 484 469 451 502 525 530 673Hispanics 438 417 401 491 519 441 545American Indians or Alaskan Natives 49 45 47 37 50 61 67
Nonresident aliens2 280 261 226 242 283 248 278
Unknown race/ethnicity or citizenship 265 228 206 233 293 254 262
Women
Total, all recipients 55,681 55,053 51,046 50,434 50,373 52,350 56,475
U.S. citizens and permanent residents,total1 54,116 53,037 49,390 48,175 48,381 50,802 54,782
White, non-Hispanics 47,403 46,306 42,515 40,884 41,081 43,098 46,401Asians 1,013 1,206 1,300 1,431 1,513 1,688 1,908Underrepresented minorities, total 5,700 5,525 5,575 5,860 5,787 6,016 6,473
Black, non-Hispanics 3,352 3,256 3,435 3,554 3,597 3,621 3,997Hispanics 2,124 2,047 1,947 2,089 1,962 2,130 2,202American Indians or Alaskan Natives 224 222 193 217 228 265 274
Nonresident aliens2 539 516 521 554 695 615 735
Unknown race/ethnicity or citizenship 1,026 1,500 1,135 1,705 1,297 933 958
1 Racial/ethnic categories are as designated on the survey form. These categories include U.S. citizens and foreign citizenson permanent visas (i.e., resident aliens who have been admitted for permanent residency).
2 Nonresident aliens include foreign citizens on temporary visas only.
NOTES: Data on race/ethnicity were collected biennially from 1977 through 1984 and annually thereafter.
Data on race/ethnicity of degree recipients are collected on broad fields of study only; therefore, these data couldnot be adjusted to the exact field taxonomies used by NSF.
SOURCES: Tabulations by National Science Foundation/SRS; data from National Center for Education Statistics; data fromthe HEGIS Earned Degrees Surveys, 1985, and IPEDS Completions Surveys, 1987-93
102

Table 34. Number of earned master's degrees awarded in health fields,by race/ethnicity and sex of recipient: 1985-93
Page 1 of 1
Citizenship and race/ethnicity 1985 1987 1989 1990 1991 1992 1993
Total
Total, all recipients 17,525 18,580 19,410 20,482 21,398 23,213 25,823
U.S. citizens and permanent residents,total1 16,359 16,754 17,441 18,407 19,269 21,040 23,423
White, non-Hispanics 14,565 14,902 15,474 16,284 17,002 18,464 20,509Asians 476 464 537 600 600 709 830Underrepresented minorities, total 1,318 1,388 1,430 1,523 1,667 1,867 2,084
Black, non-Hispanics 819 811 814 886 1,004 1,092 1,251Hispanics 438 518 535 558 572 685 718American Indians or Alaskan Natives 61 59 81 79 91 90 115
Nonresident aliens2 845 869 1,073 1,082 1,238 1,310 1,466
Unknown race/ethnicity or citizenship 321 957 896 993 891 863 934
Men
Total, all recipients 4,155 3,915 4,239 4,554 4,499 4,714 5,248
U.S. citizens and permanent residents,total1 3,646 3,322 3,577 3,803 3,747 3,966 4,428
White, non-Hispanics 3,170 2,931 3,094 3,309 3,215 3,399 3,807Asians 174 146 162 181 170 215 222Underrepresented minorities, total 302 245 321 313 362 352 399
Black, non-Hispanics 179 134 173 158 194 171 207Hispanics 109 99 128 135 146 158 172American Indians or Alaskan Natives 14 12 20 20 22 23 20
Nonresident aliens2 426 444 519 474 543 539 610
Unknown race/ethnicity or citizenship 83 149 143 277 209 209 210
Women
Total, all recipients 13,370 14,665 15,171 15,928 16,899 18,499 20,575
U.S. citizens and permanent residents,total1 12,713 13,432 13,864 14,604 15,522 17,074 18,995
White, non-Hispanics 11,395 11,971 12,380 12,975 13,787 15,065 16,702Asians 302 318 375 419 430 494 608Underrepresented minorities, total 1,016 1,143 1,109 1,210 1,305 1,515 1,685
Black, non-Hispanics 640 677 641 728 810 921 1,044Hispanics 329 419 407 423 426 527 546American Indians or Alaskan Natives 47 47 61 59 69 67 95
Nonresident aliens2 419 425 554 608 695 771 856
Unknown race/ethnicity or citizenship 238 808 753 716 682 654 724
1 Racial/ethnic categories are as designated on the survey form. These categories include U.S. citizens and foreign citizenson permanent visas (i.e., resident aliens who have been admitted for permanent residency).
2 Nonresident aliens include foreign citizens on temporary visas only.
NOTES: Data on race/ethnicity were collected biennially from 1977 through 1989 and annually thereafter.
Data on race/ethnicity of degree recipients are collected on broad fields of study only; therefore, these data couldnot be adjusted to the exact field taxonomies used by NSF.
SOURCES: Tabulations by National Science Foundation/SRS; data from National Center for EduCation Statistics; data fromthe HEGIS Earned Degrees Surveys, 1985, and IPEDS Completions Surveys, 1987-93
106103

Table 35. Number of earned doctoral degrees awarded in health fields,by race/ethnicity and sex of recipient: 1985-93
Page 1 of 1
Citizenship and race/ethnicity 1985 1987 1989 1990 1991 1992 1993
Total
Total, all recipients 729 800 974 956 1,042 1,112 1,201
U.S. citizens and permanent residents,total1 575 635 751 756 828 844 943
White, non-Hispanics 502 554 685 667 722 735 806Asians 34 36 23 39 45 53 48Underrepresented minorities, total 39 45 43 50 61 56 89
Black, non-Hispanics 23 31 29 32 40 38 59Hispanics 14 11 11 17 16 13 24American Indians or Alaskan Natives 2 3 3 1 5 5 6
Nonresident aliens2 99 96 134 166 171 226 214
Unknown race/ethnicity or citizenship 55 69 89 34 43 42 44
Men
Total, all recipients 289 325 345 364 373 402 424
U.S. citizens and permanent residents,total1 190 226 221 239 248 221 260
White, non-Hispanics 152 191 195 205 200 177 209Asians 20 19 13 17 21 23 25Underrepresented minorities, total 18 16 13 17 27 21 26
Black, non-Hispanics 11 12 9 14 17 14 18Hispanics 6 3 4 2 7 4 8American Indians or Alaskan Natives 1 1 0 1 3 3 0
Nonresident aliens2 63 61 87 101 101 159 138
Unknown race/ethnicity or citizenship 36 38 37 24 24 22 26
Women
Total, all recipients 440 475 629 592 669 710 777
U.S. citizens and permanent residents,total1 385 409 530 517 580 623 683
White, non-Hispanics 350 363 490 462 522 558 597Asians 14 17 10 22 24 30 23Underrepresented minorities, total 21 29 30 33 34 35 63
Black, non-Hispanics 12 19 20 18 23 24 41Hispanics 8 8 7 15 9 9 16American Indians or Alaskan Natives 1 2 3 0 2 2 6
Nonresident aliens2 36 35 47 65 70 67 76
Unknown race/ethnicity or citizenship 19 31 52 10 19 20 18
1 Racial/ethnic categories are as designated on the survey form. These categories include U.S. citizens and foreign citizenson permanent visas (i.e., resident aliens who have been admitted for permanent residency).
2 Nonresident aliens include foreign citizens on temporary visas only.
SOURCE: National Science Foundation/SRS, Survey of Earned Doctorates
107104

Table 36. First-professional degrees awarded, by race/ethnicity and sex of recipient: 1985-93
Page 1 of 1
Citizenship and race/ethnicity 1985
Total, all recipients 75,562
U.S. citizens and permanent residents,total' 70,677
White, non-Hispanics 63,225Asians 1,816Underrepresented minorities, total 5,636
Black, non-Hispanics 3,029Hispanics 2,359American Indians or Alaskan Natives 248
Nonresident aliens2 862
Unknown race/ethnicity 4,023
Total, all recipients 50,780
U.S. citizens and permanent residents,total' 47,138
White, non-Hispanics 42,635Asians 1,152Underrepresented minorities, total 3,351
Black, non-Hispanics 1,623Hispanics 1,552American Indians or Alaskan Natives 176
Nonresident aliens2 681
Unknown race/ethnicity 2,961
Total, all recipients 24,782
U.S. citizens and permanent residents,total' 23,539
White, non-Hispanics 20,590Asians 664Underrepresented minorities, total 2,285
Black, non-Hispanics 1,406Hispanics 807American Indians or Alaskan Natives 72
Nonresident aliens2 181
Unknown race/ethnicity 1,062
1987 1989 1990 1991 1992 1993
Total
72,120
69,643
61,2912,2226,1303,3412,491
298
872
1,605
71,318
68,525
59,5972,9036,0253,0172,746
262
960
1,833
71,551
69,224
59,3763,2996,5493,3372,959
253
1,036
1,291
72,636
70,448
59,6923,7726,9843,5353,191
258
1,086
1,102
74,801
71,960
59,8694,7577,3343,5683,472
294
1,342
1,499
76,068
73,520
60,3385,1078,0754,0783,632
365
1,548
1,000
Men
46,841
45,266
40,3141,3913,5611,7981,583
180
624
951
45,399
43,646
38,4991,7723,3751,5681,661
146
671
1,082
44,309
42,814
37,3671,9463,5011,6271,738
136
702
793
44,226
42,760
36,9262,1713,6631,6531,868
142
762
704
45,459
43,648
37,0892,7283,8311,6202,054
157
948
863
45,565
43,849
36,8962,8314,1221,7772,156
189
1,103
613
Women
25,279.
24,377
20,977831
2,5691,543
908118
248
654
25,919
24,879
21,0981,1312,6501,4491,085
116
289
751
27,242
26,410
22,0091,3533,0481,7101,221
117
334
498
28,410
27,688
22,7661,6013,3211,8821,323
116
324
398
29,342
28,312
22,7802,0293,5031,9481,418
137
394
636
30,503
29,671
23,4422,2763,9532,3011,476
176
445
387
1 Racial/ethnic categories are as designated on the survey form. These categories include U.S. citizens and foreign citizenson permanent visas (i.e., resident aliens who have been admitted for permanent residency).
2 Nonresident aliens include foreign citizens on temporary visas only.
NOTE: First-professional degrees are defined as those that require at least 6 years of college work for completion and 2years of preprofessional training.
SOURCES: Tabulations by National Science Foundation/SRS; data from National Center for Education Statistics; data fromthe HEGIS Earned Degrees Surveys, 1985, and IPEDS Completions Surveys, 1987-93
1. 8105

Table 37. First-professional degrees awarded in health fields,by race/ethnicity and sex of recipient: 1985-93
Page 1 of 1
Citizenship and race/ethnicity 1985 1987 1989 1990 1991 1992 1993
Total
Total, all recipients 30,601 29,400 29,518 28,787 28,183 28,303 29,475
U.S. citizens and permanent residents,total1 28,273 28,484 28,663 28,041 27,207 27,082 28,308
White, non-Hispanics 24,856 24,467 24,094 23,027 21,958 21,333 22,076Asians 1,142 1,394 1,978 2,290 2,472 2,909 3,317Underrepresented minorities, total 2,275 2,623 2,591 2,724 2,777 2,840 2,915
Black, non-Hispanics 1,073 1,269 1,159 1,251 1,285 1,288 1,350Hispanics 1,057 1,217 1,323 1,373 1,381 1,417 1,426American Indians or Alaskan Natives 145 137 109 100 111 135 139
Nonresident aliens2 420 462 482 535 506 703 782
Unknown race/ethnicity 1,908 454 373 211 470 518 385
Men
Total, all recipients 21,675 20,011 19,596 18,562 17,777 17,694 17,704
U.S. citizens and permanent residents,total1 19,963 19,394 19,021 18,105 17,126 16,912 16,957
White, non-Hispanics 17,796 16,925 16,298 15,232 14,207 13,607 13,608Asians 749 870 1,217 1,363 1,440 1,718 1,859Underrepresented minorities, total 1,418 1,599 1,506 1,510 1,479 1,587 1,490
Black, non-Hispanics 585 691 581 606 573 604 556Hispanics 728 822 861 847 841 907 858American Indians or Alaskan Natives 105 86 64 57 65 76 76
Nonresident aliens2 311 303 313 327 328 474 510
Unknown race/ethnicity 1,401 314 262 130 323 308 237
Women
Total, all recipients 8,926 9,389 9,922 10,225 10,406 10,609 11,771
U.S. citizens and permanent residents,total1 8,310 9,090 9,642 9,936 10,081 10,170 11,351
White, non-Hispanics 7,060 7,542 7,796 7,795 7,751 7,726 8,468Asians 393 524 761 927 1,032 1,191 1,458Underrepresented minorities, total ....... 857 1,024 1,085 1,214 1,298 1,253 1,425
Black, non-Hispanics 488 578 578 645 712 684 794Hispanics 329 395 462 526 540 510 568American Indians or Alaskan Natives 40 51 45 43 46 59 63
Nonresident aliens2 109 159 169 208 178 229 272
Unknown race/ethnicity 507 140 111 81 147 210 148
1 Racial/ethnic categories are as designated on the survey form. These categories include U.S. citizens and foreign citizenson permanent visas (i.e., resident aliens who have been admitted for permanent residency).
2 Nonresident aliens include foreign citizens on temporary visas only.
NOTES: First-professional degrees are defined as those that require at least 6 years of college work for completion and 2years of preprofessional training.
Health fields include: Chiropractic, Dentistry, Medicine, Optometry, Osteopathic Medicine, Pharmacy, Podiatry,and Veterinary Medicine.
SOURCES: Tabulations by National Science Foundation/SRS; data from National Center for Education Statistics; data fromthe HEGIS Earned Degrees Surveys, 1985, and IPEDS Completions Surveys, 1987-93
106 apt ng

Table 38. First-professional degrees awarded in non-health fields,by race/ethnicity and sex of recipient: 1985-93
Page 1 of 1
Citizenship and race/ethnicity 1985 1987 1989 1990 1991 1992 1993
Total
Total, all recipients 44,961 42,720 41,800 42,764 44,453 46,498 46,593
U.S. citizens and permanent residents,total' 42,404 41,159 39,862 41,183 43,241 44,878 45,212
White, non-Hispanics 38,369 36,824 35,503 36,349 37,734 38,536 38,262Asians 674 828 925 1,009 1,300 1,848 1,790Underrepresented minorities, total 3,361 3,507 3,434 3,825 4,207 4,494 5,160
Black, non-Hispanics 1,956 2,072 1,858 2,086 2,250 2,280 2,728Hispanics 1,302 1,274 1,423 1,586 1,810 2,055 2,206American Indians or Alaskan Natives 103 161 153 153 147 159 226
Nonresident aliens2 442 410 478 501 580 639 766
Unknown race/ethnicity 2,115 1,151 1,460 1,080 632 981 615
Men
Total, all recipients 29,105 26,830 25,803 25,747 26,449 27,765 27,861
U.S. citizens and permanent residents,total1 27,175 25,872 24,625 24,709 25,634 26,736 26,892
White, non-Hispanics 24,839 23,389 22,201 22,135 22,719 23,482 23,288Asians 403 521 555 583 731 1,010 972Underrepresented minorities, total 1,933 1,962 1,869 1,991 2,184 2,244 2,632
Black, non-Hispanics 1,038 1,107 987 1,021 1,080 1,016 1,221Hispanics 824 761 800 891 1,027 1,147 1,298American Indians or Alaskan Natives 71 94 82 79 77 81 113
Nonresident aliens2 370 321 358 375 434 474, 593
Unknown race/ethnicity 1,560 637 820 663 381 5551 376
Women
Total, all recipients 15,856 15,890 15,997 17,017 18,004 18,733 18,732
U.S. citizens and permanent residents,total' 15,229 15,287 15,237 16,474 17,607 18,142 18,320
White, non-Hispanics 13,530 13,435 13,302 14,214 15,015 15,054 14,974Asians 271 307 370 426 569 838 818Underrepresented minorities, total 1,428 1,545 1,565 1,834 2,023 2,250 2,528
Black, non-Hispanics 918 965 871 1,065 1,170 1,264 1,507Hispanics 478 513 623 695 783 908 908American Indians or Alaskan Natives 32 67 71 74 70 78 113
Nonresident aliens2 72 89 120 126 146 165 173
Unknown race/ethnicity 555 514 640 417 251 426 239
Racial/ethnic categories are as designated on the survey form. These categories include U.S. citizens and foreign citizenson permanent visas (i.e., resident aliens who have been admitted for permanent residency).
2 Nonresident aliens include foreign citizens on temporary visas only.
NOTES: First-professional degrees are defined as those that require at least 6 years of college work for completion and 2years of preprofessional training.
Non-health fields include: Law, Divinity/Ministry, and Rabbinical and Talmudic Studies.
SOURCES: Tabulations by National Science Foundation/SRS; data from National Center for Education Statistics; data fromthe HEGIS Earned Degrees Surveys, 1985, and IPEDS Completions Surveys, 1987-93
110107

NATIONAL SCIENCE FOUNDATIONARLINGTON, VA 22230
OFFICIAL BUSINESS
PENALTY FOR PRIVATE USE $300
RETURN THIS COVER SHEET TO ROOM P35 IF YOU DONOT WISH TO RECEIVE THIS MATERIAL 0 , OR IFCHANGE OF ADDRESS IS NEEDED 0 , INDICATECHANGE INCLUDING ZIP CODE ON THE LABEL (DO NOTREMOVE LABEL).
00034068 MIS505MR JONATHAN FIFEASSOCHIGHER EDUCSTUDY OFONE DUPONT CIRCLE: NW #630
WASHINGTON DC 20036-1110
s p y
SPECIAL FOURTH-CLASS RATEPOSTAGE & FEES PAID
National Science FoundationPermit No. G-69
NSF 95-330

(9/92)
U.S. DEPARTMENT OF EDUCATIONOffice of Educational Research and Improvement (OERI)
Educational Resources Information Center (ERIC)
NOTICE
REPRODUCTION BASIS
ERIC
This document is covered by a signed "Reproduction Release(Blanket)" form (on file within the ERIC system), encompassing allor classes of documents from its source organization and, therefore,does not require a "Specific Document" Release form.
This document is Federally-funded, or carries its own permission toreproduce, or is otherwise in the public domain and, therefore, maybe reproduced by ERIC without a signed Reproduction Releaseform (either "Specific Document" or "Blanket").