DOCUMENT RESUME ED 371 038 AUTHOR … RESUME ED 371 038 TM 021 742 AUTHOR Nandakumar, Ratna TITLE...
25
DOCUMENT RESUME ED 371 038 TM 021 742 AUTHOR Nandakumar, Ratna TITLE Development of a Valid Subtest for Assessment of DIF/Bias. PUB DATE Apr 94 NOTE 25p.; Paper presented at the Annual Meeting of the American Educational Research Association (New Orleaus, LA, April 4-8, 1994). PUB TYPE Reports Evaluative/Feasibility (142) Speeches/Conference Papers (150) EDRS PRICE MF01/PC01 Plus Postage. DESCRIPTORS *Ability; Computer Simulation; Construct Validity; *Educational Assessment; Equal Education; *Item Bias; Research Methodology; *Test Construction; Test Items; Test Results IDENTIFIERS *DIMTEST (Computer Program); *Multidimensionality (Tests) ABSTRACT By definition, differential item functioning (DIF) refers to unequal probabilities of a correct response to a test item by examinees from two groups when controlled for their ability differences. Simulation results are presented for an attempt to purify a test by separating out multidimensional items under the assumption that the intent of the test constructors was to construct a unidimensional test for a given population. The procedure used to arrive at the purified and essentially unidimensional subtest used the multidimensional theory of DIF/bias proposed by Shealy and Stout (1993) and the statistical procedure DIMTEST for assessing essential unidimensionality. When applicable, the proposed methodology leads to a statistically validated construct valid subtest that can be used in the matching criterion for DIF/bias analysis. This methodology can be applied to an internal or external matching criterion. It is only applicable when the majority of test items are tapping the intended ability for a given population, while a few items are tapping other major abilities in addition to the intended ability. This method is not applicable when DIF/bias is pervasive. Ten tables summarize analysis results. (Contains 28 references.) (SLD) *********************************************************************** Reproductions supplied by EDRS are the best that can be made from the original document. ***********************************************************************
Transcript of DOCUMENT RESUME ED 371 038 AUTHOR … RESUME ED 371 038 TM 021 742 AUTHOR Nandakumar, Ratna TITLE...

DOCUMENT RESUME
ED 371 038 TM 021 742
AUTHOR Nandakumar, RatnaTITLE Development of a Valid Subtest for Assessment of
DIF/Bias.PUB DATE Apr 94NOTE 25p.; Paper presented at the Annual Meeting of the
American Educational Research Association (NewOrleaus, LA, April 4-8, 1994).
PUB TYPE Reports Evaluative/Feasibility (142)Speeches/Conference Papers (150)
EDRS PRICE MF01/PC01 Plus Postage.DESCRIPTORS *Ability; Computer Simulation; Construct Validity;
*Educational Assessment; Equal Education; *Item Bias;Research Methodology; *Test Construction; Test Items;Test Results
IDENTIFIERS *DIMTEST (Computer Program); *Multidimensionality(Tests)
ABSTRACT
By definition, differential item functioning (DIF)refers to unequal probabilities of a correct response to a test itemby examinees from two groups when controlled for their abilitydifferences. Simulation results are presented for an attempt topurify a test by separating out multidimensional items under theassumption that the intent of the test constructors was to constructa unidimensional test for a given population. The procedure used toarrive at the purified and essentially unidimensional subtest usedthe multidimensional theory of DIF/bias proposed by Shealy and Stout(1993) and the statistical procedure DIMTEST for assessing essentialunidimensionality. When applicable, the proposed methodology leads toa statistically validated construct valid subtest that can be used inthe matching criterion for DIF/bias analysis. This methodology can beapplied to an internal or external matching criterion. It is onlyapplicable when the majority of test items are tapping the intendedability for a given population, while a few items are tapping othermajor abilities in addition to the intended ability. This method isnot applicable when DIF/bias is pervasive. Ten tables summarizeanalysis results. (Contains 28 references.) (SLD)
***********************************************************************
Reproductions supplied by EDRS are the best that can be madefrom the original document.
***********************************************************************

Ns(c
Development of a Valid Subtest for Assessment of DIF/Bias
U S. DEPARTMENT OP EDUCATIONOnce of Education& Research and ImrX0ymonl
EDUCATIONAL RESOURCES INFORMATIONCENTER (ERIC)
dhis document has been reproduced asreceived from the person or organizationorionsting it
CI Minor changes his,* teen made to impfouereproduction Quality
Points of view o' oGsnIons staled In th'idacu.merit do not rieceSilanly represent 01'km!OERI pOirtion or policy
-PERMISSION TO REPRODUCE THIS
MATERIAL HAS BEEN GRANTED BY
RRTAJA) AM-Agg___11/ 94
TO THE EDUCATIONAL RESOURCESINFORMATION CENTER (ERIC)
Ratna NandakumaiDepartment of Educational Studies
University of Delaware
Paper presented at the annual meeting of the American Educational Research Associa-tion, New Orleans, April 7, 1994.
2
BEST COPY AVAILABLE

Development of a Valid Subtest for Assessment of DIF/Bias
Presently study of differential item functioning (DIF) or item bias is one of the majorareas of research in educational measurement. In recent years nt aerous DIF studies havebeen conducted. By definition, DIF refers to unequal probabilities of correct response toan item by examinees from two groups when controlled for their ability differences. Theterm DIF therefore refers to different statistical properties of an item in the two groupsof interest after controlling for the group differences in their ability. DIF in this senseis linked to the construct of the test items. The term bias on the other hand cannotbe so simply explained. More often it is linked to the fairness of the test. According toAngoff (1993), bias conveys a social meaning that goes beyond the statistical differencesbetween the group performance. Many definitions of bias, both historical and modern,and their implications are described in detail by Camilli (1993). Of these definitions,one proposed by Jensen (1980) states:
In mathematical statistics, "bias" refers to a systematic under or overesti-mation of a population parameter by a statistic based on samples drawnfrom the population. In psychometrics, bias refers to systematic errors inthe predictive validity or construct validity of test scores of individuals thatare associated with the individual's group membership. "Bias" is a gen-eral term and is not limited to "culture bias." It can involve any type ofgroup membershiprace, social class, nationality, sex, religion, age. Theassessment of bias is purely objective, empirical, statistical and quantitativematter entirely independent of subjective value judgements and ethical is-sues concerning fairness or unfairness of tests and uses to which they are put.Psychometric bias is a set of statistical attributes conjointly of a given testand two or more specific subpopulations. (p. 375)
Jensen's definition of bias is consistent with the meaning of DIF that is currently inuse. In other words, the psychometric definition of bias according to Jensen refersto the objective, empirical, and statistical matter that is independent of subjectivevalue judgements about the use of tests and factors influencing test scores that areoutside of test construct. Stout (Shealy & Stout, 1993b), however, differentiates betweenpsychometric definitions of DIF and bias. According to Stout, DIF refers to a situationwhere the matching subtest used for matching examinees in the two groups of interest(in order to control for their ability differences) could be the total test score or anyother valid test score where no strong claim is made about the construct validity of thismatching criterion. Bias on the other hand, according to Stout, refers to a situation
2
3

where a claim is made about the construct validity of the matching criterion in the senseof it not contaminated by items measuring traits other than the content of interest. Thatis, the matching subtest is measuring exactly what the test is supposed to be measuring.In this sense bias is a special case of DIF.
In doing DIF studies, most often, the groups are controlled for the ability differencesby matching examinees in the two groups using the total test score. Although thetotal test score provides a practical and convenient method for matching examinees, theserious shortcoming of using the total test score is that it could include DIF items, thuscontaminating the matching criterion. Linn (1993) describes the best matching criterionas follows
The ideal matching variable would be a perfectly valid and reliable, unbiasedmeasure of the developed ability the test is intended to measure. Such ameasure is obviously unavailable and test scores are generally the closestapproximation that is available.
He goes on to say
. unidimensionality should be added to the list of characteristics for theideal matching criterion. Otherwise, DIF may be associated with valid dif-ferences along different dimensions.
Some researchers in the past have attempted to obtain an unbiased matching crite-rion (Clauser, Mazor, & Hambleton, 1993; Williams, 1993). Clauser et. al used a two-step process proposed by Holland and Thayer (1988) to "purify" the matching criterioninternal to the test. Williams on the other hand, used an unbiased matching criterionexternal to the test in her study. Douglas, Li, and Stout (1994) have used hierarchicalcluster analyses combined with expert opinion to select items that are potentially biasedfor DIF/bias analyses.
Shealy and Stout (1993a, 1993b) argue that bias can only manifest itself throughmultidimensional abilities being present. In other words, if item responses aro essen-tially unidimensional, there is no bias. Consistent with this viewpoint, the purpose ofthe proposed research is to develop a methodology to establish a bias free matchingsubtest through the use of DIMTEST, a statistical procedure for assessing essential uni-dimensionality. Throughout, it is assumed that the intention of the test is to measure
3
4

a unidimensional construct, but possibly some item responses are also influenced byother abilities which could lead to differential performance among groups. The purposeof tlris study is to identify, through unidimensionality analysis, items that are influ-enced by other major abilities and remove them from the test. The remaining items areagain assessed for unidimensionality. In addition, the degree of DIF/bias contributed bymultidimensional items is assessed.
Throughout the paper we will be using the terminology of DIF/bias. If one agreeswith Stout's notion of bias and DIF, the proposed methodology would lead to bias anal-yses because the matching subtest will be free of multidimensional items. On the otherhand, if one believes that the term bias refers to factors beyond statistical differencesbetween the groups on the item(s) of interest, the proposed methodology would lead toDIF analyses with a statistically and psychometrically valid matching criterion that isessentially unidimensional.
In what follows, the description of DIMTEST procedure for assessing essential uni-dimensionality, and the SIBTEST procedure for assessing DIF/bias will be described.The proposed methodology to develop a valid subtest that is free of DIF/bias usingDIMTEST will then be described, followed by the simulation details and the results ofsimulation study and real data study.
The DIMTEST Procedure
The hypothesis to test for essential unidimensionality can be stated as
Ho : dE = 1 vs. Hl : dE > 1
where dE denotes essential dimensionality.
DIMTEST (Stout, Nandakumar, Junker, Chang, Sz Steidinger, 1993) assesses essen-tial unidimensionality of a given set of item responses (found as a result of administeringa set of items to a group of examinees) by splitting the it s into three subtests: twoshort subtests AT1 and AT2, and a large subtest PT. Items of AT1 are first selectedso that they are dimensionally homogeneous. Items of AT2 are matched in difficultyto the items of AT1 and the rest of the items form the subtest PT. There are severalmethods to select AT1 items. Simple factor analysis can be used to select AT] items.Usirg factor analysis, a small set of items with highest loadings of the same sign on thesecond factor are selected (Nandakumar (gz Stout, 1993; Stout, 1987). Expert opinion
4
5

is another method to select AT1 items. Based on experience, one can select a small setof items (not more than one-quarter of total items) believed to be measuring the sametrait (Nandakumar, 1993a). Alternatively, one can use hierarchical cluster analysis toselect AT1 items (Roussos, Stout, & Marden, 1993). In the present study factor analysiswas used to select AT1 items.
If item responses were driven by an essentially unidimensional model, items of allthe subtests AT2, and PT) would be of similar dimension. On the contrary, if itemresponses were driven by a multidimensional model, items of AT1 will be dimensionallyhomogeneous and differ from the rest of the items in the dimensional structure.
Item responses of the subtest PT are used to group examinees into K subgroups.Item responses of the subtest AT1 are used to compute two variance estimates al and"6.17,k within each subgroup and their difference is appropriately standardized and summedacross subgroups to arrive at the statistic T1 given by
K= Ev K k=1 S k
The 14 is the variance estimate of the AT1 subtest among examinees in the subgroup
k, and Oli,k is the estimate of the "unidimensional" variance computed by summing theitem variances of the subtest AT1. Sk is the appropriate standard error computed forthe subgroup k (for details see Nandakumar & Stout, 1993).
Similarly item responses of AT2 are used to compute variance estimates withinsubgroups and their difference is standardized and summed across subgroups to arriveat the statistic T2 . Stout's statistic T to assess for essential unidimensionality is thengiven by
T T 2
(1)
which follows the standard normal distribution when the null hypothesis of essential
unidimensionality holds.
When the null hypothesis of essential unidimensionality holds, the two varianceestimates &/2, and Ofj,k should be approximately equal resulting in a small value for T1.Although this is generally true,- in certain situations T1 could be inflated under 1/0 dueto difficulty of items in AT1 or due to shortness of the subtest PT (Nandakumar, (SzStout, 1993; Stout, 1987). In such situations the statistic T2 was designed to correct T1
5
for inflation due to statistical biases. Consequently, under 1/0, T will be small leadingto the tenability of Ho. On the other hand when H1 holds, the difference in the varianceestimates will be large leading to the rejection of 1/0.
The performance of DIMTEST has been studied extensively through Monte Carlosimulations in various test settings by varying parameters such as test length, sam-ple size, ICC type, correlation between abilities, and the degree of multidimensionality(Nandakumar and Stout, 1993; Nandakumar, 1991; Stout, 1987). It has also been stud-ied for its performance on various real tests (Nandakumar, 1993a). It has been foundthat DIMTEST has maintained desirable type-I error with high power even when thecorrelation between abilities is as large as 0.7.
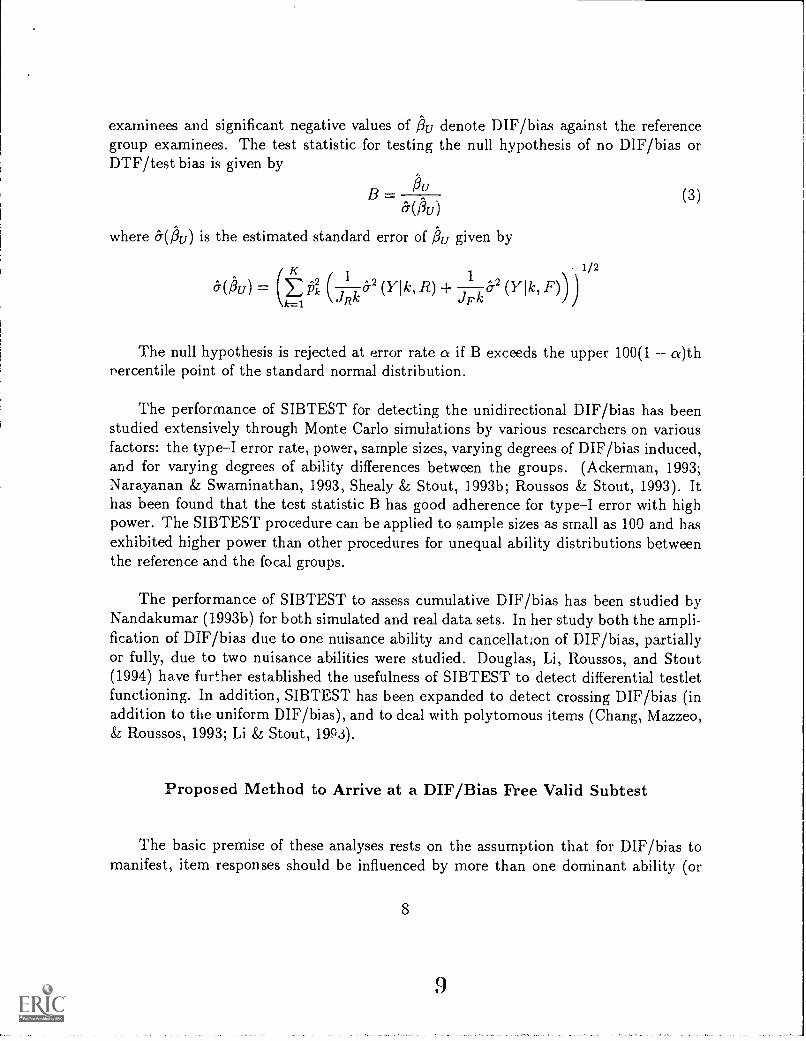
The SIBTEST Procedure
It is assumed that two groups of examinees, the reference group (R), and the focalgroup (F) are administered a given set of items. These items are assumed to be mea-suring an intended ability (proficiency) denoted by 0, also known as the target ability.Unintended abilities that influence item responses are denoted by n s, and are known asnuisance abilities. It is also assumed that most items are influenced by one dominantability, namely the target ability, and that a few items are influenced by more than onedominant ability, namely the target ability and the nuisance ability (or abilities) Itemsinfluenced by more than one dominant ability are considered to be potentially causingDIF/bias. For example, in a mathematics reasoning test, some items could be tappingthe knowledge or familiarity with the baseball game, while some other items could betapping the knowledge of the chess game in addition to knowledge in mathematics. Inthis instance, there are two nuisance abilities, the knowledge of baseball game (771), andthe knowledge of chess game (712), and the knowledge of mathematics is the target ability(0).
The SIBTEST (Stout 86 Roussos, 1992) has the unique capability of assessing cu-mulative DIF/bias of several items. That is, it can assess the amount of DIF/biascontributed by several items and its impact on the total test score, as opposed to singleitem DIF/bias which is due to one item at a time. The cumulative DIF/bias will bereferred to as the different:d.I test functioning (DTF) or the test bias.
The statistical hypothesis for testing the absence of pH- 1.)ias can be stated as
is possible that there could be one or more minor abilities influencing relatively few items to asmall degree. These minor abilities, however, are not counted in assessing dimensionality.
6
7

Ho : Pu = 0 vs. H1 : Ou 0 0
where fiu is the parameter denoting the amount of unidirectional DIF/bias when a single
item is considered or DTF/test bias when more than one item is considered.
The procedure to test for DIF/bias using SIBTEST involves splitting of test itemsinto two subtests: a "valid subtest" and a "studied subtest". The studied subtestcontains potentially biased item(s) while the valid subtest, often but not always, containsthe rest of the items. The valid subtest functions as the matching criterion.
If one is testing for DIF/DTF, without claiming the construct validity of the match-ing subtest, then the studied subtest would contain one item(s) for which DIF is beinginvestigated with the rest of the items constituting the valid subtest (as is usually donewith the Mantel-Haenszel test). On the other hand, if one is testing for DIF/biasclaiming the valid subtest to be unidimensional, then the studied subtest would containpotentially biased item(s) while the valid subtest contains items judged to be free ofDIF/bias, and is also essentially unidimensional.
Let N denote the total number of items. Let items 1 n denote valid subtest items,and items n+1 N denote studied subtest items. Let Ui denote the resnonse to theitem i taking values 0 or 1. For each examinee, let X = Ui denote the total scoreon the valid subtest and Y = n+i Ui denote the total score on the studied subtest.Examinees within the reference and the focal groups are grouped into K subgroups(maximum K=n+1) according to their score on the valid subtest. Examinees with thesame score on the valid subtest are compared across the reference and the focal groups ontheir performance on the studied subtest items. The weighted mean difference (betweenthe reference and the focal groups) on the studied subtest score across K subgroups isthen given by
13U = Ei3k(YRk F k) (2)k=0
where 13k denotes the proportion of focal group examinees in the subgroup k 2 Herethe YRk and YFk denote the adjusted means of the studied subtest (adjusted for meandifferences between the reference and focal groups) for examinees in the reference andthe focal groups respectively for subgroup k. fir' can also be used as a statistic thatestimates the amount of unidirectional DIF/bias or DTF/test bias. For example a Ouvalue of .1 denotes that the average difference between the focal and the reference groupson the studied subtest item(s) is one tenth of a point when controlled for their abilitydifferences. Significant positive values of iju denote DIF/bias against the focal group
2one could also pool examinees from both groups of the kth subgroup.
7
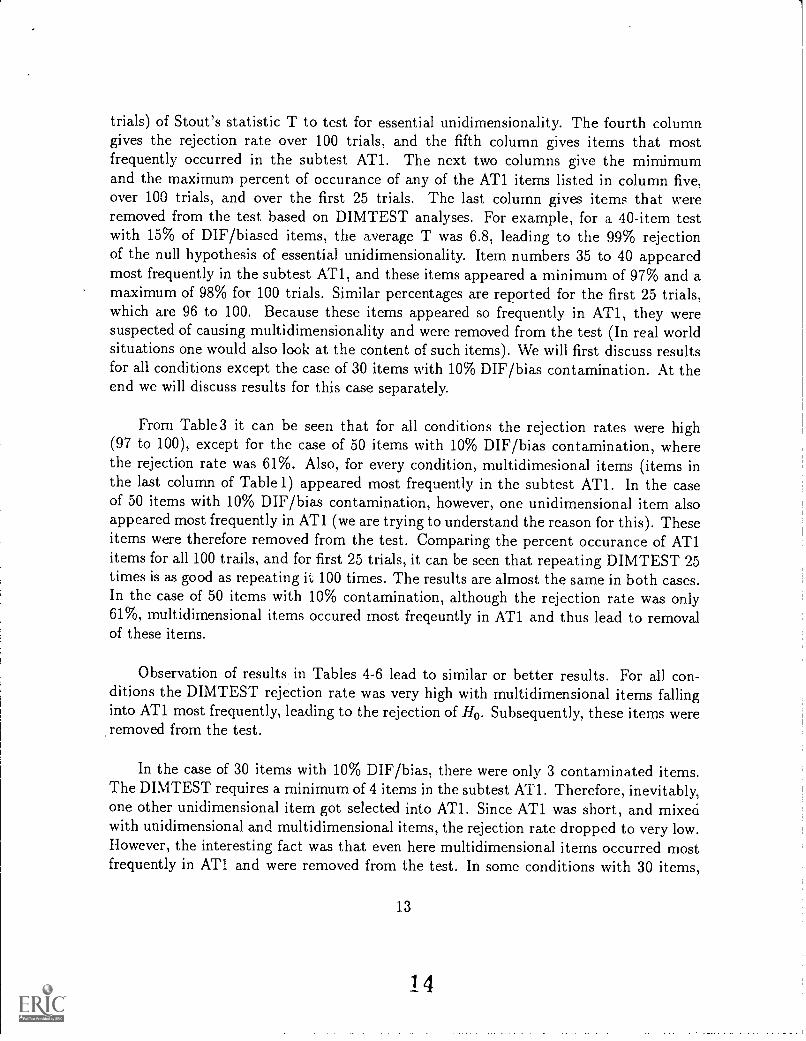
exarninees and significant negative values of .1(j denote DIF/bias against the referencegroup examinees. The test statistic for testing the null hypothesis of no DIF/bias orDTF/test bias is given by
B -esi(Ou)
where :3"(fu) is the estimated standard error of :6'Ll given by
1 /2
&C161u) (E 151c (-7 7:6.2 (Yak, R) (Ylk, F)))k=1 Rh; J
(3)
The null hypothesis is rejected at error rate a if B exceeds the upper 100(1 a)thrercentile point of the standard normal distribution.
The performance of SIBTEST for detecting the unidirectional DM/bias has beenstudied extensively through Monte Carlo simulations by various researchers on variousfactors: the type-I error rate, power, sample sizes, varying degrees of DIF/bias induced,and for varying degrees of ability differences between the groups. (Ackerman, 1993;Narayanan & Swaminathan, 1993, Shealy Sz Stout, 1993b; Roussos & Stout, 1993). Ithas been found that the test statistic B has good adherence for type-I error with highpower. The SIBTEST procedure can be applied to sample sizes as small as 100 and hasexhibited higher power than other procedures for unequal ability distributions betweenthe reference and the focal groups.
The performance of SIBTEST to assess cumulative DIF/bias has been studied byNandakumar (1993b) for both simulated and real data sets. In her study both the ampli-fication of DIF/bias due to one nuisance ability and cancellatIon of DIF/bias, partiallyor fully, due to two nuisance abilities were studied. Douglas, Li, Roussos, and Stout(1994) have further established the usefulness of SIBTEST to detect differential testletfunctioning. In addition, SIBTEST has been expanded to detect crossing DIF/bias (inaddition to the uniform DIF/bias), and to deal with polytomous items (Chang, Mazzeo,Sz Roussos, 1993; Li & Stout, 1903).
Proposed Method to Arrive at a DIF/Bias Free Valid Subtest
The basic premise of these analyses rests on the assumption that for DIF/bias tomanifest, item responses should be influenced by more than one dominant ability (or
8
9

proficiency). If the item responses can be approximated by an essentially unidimen-sional model (hopefully this is the intended dimension), then there is no room for eitherDIF/bias or DTF/test bias. When data exhibits more than one dominant dimension,then an attempt can be made as described below to possibly identify these items andremove them from the test. If the remaining items are essentially imidimensional, thenthese items can be used as the matching subtest for DIF/bias analyses. We have pro-posed below several steps to arrive at a DIF/bias free matching subtest if it is possibleto obtain one.
The first step is to test for essential unidimensionality of item responses. If thenull hypothesis of essential unidimensionalityone dominant dimension is rejected, itmeans that multidimensionality is present in the data. That is, more than one dominantability influences at least some items. The second step is to identify items contribut-ing to multidimensionality. Recall that in this study it is assumed that most items areinfluenced by the intended ability and that a few items are also influenced by otherdominant abilities. In order to identify items contributing to multidimensionality, againDIMTEST can be used. When DIMTEST rejects the null hypothesis, it means thatitems of the subtest AT1 differ in dimensionality structure from the rest of the items.In addition, these items would have high second factor loadings (relative to others) andtherefore would be part of AT1. It is also true that items of the subtest ATI couldcontain essentially unidimensional items in addition to multidimensional items (Nan-dakumar, 1993a). Therefore by examining the items of the subtest AT1 one could finditems potentially causing multidimensionality. In order to separate out items that aretruly multidimensional, DIMTEST has be run repeatedly on the given sample ofitem responses, each time randomly splitting the examinee sample into two subsamples,one for selecting items for the subtest AT1 through factor analyses, and the other forcomputing Stout's unidimensionality statistic T. Items that consistently appear in AT1across different repetitions of DIMTEST are considered as multidimensional items andare removed from the test items (see Nandakumar, 1993a for examples). In the presentstudy DIMTEST was repeated 100 times and items that occured most frequently inAT1 were removed from the test. The third step is to assess the remaining items foressential unidimensionality. If the test statistic T is not statistically significant, it isconcluded that the remaining items are essentially unidimensional, otherwise step twohas to be repeated. The fourth step is to assess the direction and the degree of DIF/biascontributed by each of the items identified as multidimensional using essentially uni-dimensional items for the matching criterion. Following DIF/bias analyses, one couldalso do DTF/test bias analyses to study the cumulative impact (either amplification ofDIF/bias due to one nuisance ability or cancellation of DIF/bias, partially or fully, dueto more than one nuisance ability) of several multidimensional items at the total testscore.
9
1 0

It is possible that at step two, one cannot find a consistent pattern of ATI itemsacross repeated use of DIMTEST, in spite of the null hypotheses of essential unidimen-sionality being rejected. Several conclusions can be drawn when this happens. First ofall, the assumption that only a few items are influenced by multidimensionality is notvalid. Either multidimensionality is pervasive in the test, or there arc could be manymajor nuisance dimensions influencing different sets of items, or one major nuisai di-mension could be influencing many items, etc. In such a situation serious investigationof item content has to be sought by experts.
Details about Simulation Study
The simulation program SIBSIM developed by Stout and Roussos (1992) was used togenerate examinee responses for the reference and the focal groups in the present study.The simulations were designed to reflect the real world test and examinee charactcristicsas closely as possible.
Three test lengths were considered: 30, 40, and 50. For each test length, three levelsof DIF/bias contaminations were used: 10%, 15%, and 20%. The first three columns ofTable 1 display, for each test length, the percentages and the number of DIF/bias items.For example, in a 40-item test with 15% DIF/bias items, there are 6 contaminated items.For each test length, Table I also displays, in the last two columns, the item numbers forthe valid subtest and for the studied subtest. As can be seen, for all tests, the DIF/biasitems arc included at the end of the test. These levels of DIF/bias contamination wexchosen because it has been found in applications that it is not uncommon to find upto 30% of DIF items (Clauser, Mazor, & Hambleton, 1993; Oshima & Miller, 1992;Hambleton & Rogers, 1989).
The valid subtest consists of unidimensional items, and the studied subtest consistsof two-dimesional items. In the present study only one nuisance ability is considered,therefore all studied subtest items are influenced by the target ability (0) and the samenuisance ability (y) (see Nandakumar, 1993b for examples where there could be twonuisance abilities). Estimates of item parameters for the SAT-Verbal test (Drasgow,1987) were used for the valid subtest. The SAT-Verbal test consists of 80 items. Thedesired number of items, for ech test length, were randomly selected from the 80 itemsfor the valid subtest. The item parameters of the studied subtest were obtained asfollows.
From Table 1 it can be seen that the maximum number of studied subtest itemsneeded were 10. Therefore, 10 items were randomly selected from the 80 SAT-Verbal
10
I_ 1

items and the discrimination and the difficulty parameters of these 10 items were treatedas the parameters associated with the target ability, 0. The discrimination and thedifficulty parameters associated with the nuisance ability, 77 were manipulated so thatthey are about 80% of the strength of the parameters associated with the target ability.The difficulty and the discrimination parameters for the 10 studied subtest items aredisplayed in Table 2 for both the 0 and the R. The desired number of items for thestudied subtest in each case were randomly selected from Table 2, except in the case of50 items with 20% DIF/bias, where all 10 items were used.
Two ability distributions were used. In the first case, the distance between themeans of the ability distributions of the groups (focal and reference), which is denotedby dT, is set to 0. In the second case the dT is set to 0.5. That is, in the secondcase the means fo -.. the two groups differed by 0.5 of a standard deviation. Both thetarget and the nuisance ability distributions were normally distributed. The standarddeviations of abilty distributions for both groups were set to 1. The nuisance ability wasgenerated independent of the target ability and the standard deviation of the nuisanceability distribution was also set to 1.
The amount of induced DIF/bias was specified through the difference between themeans of the conditional distribution of the nuisance ability for the two groups and isdenoted by km which was set to 0.5. In other words, the conditional distributions of thenuisance ability for the focal and the reference groups differ by 0.5 standard deviationsat all levels of the target abilitiy. Positive values of ko denote DT/bias against the focalgroup and negative values of ko denote DIF/bias against the reference group. Two levelsof guessing were considered, c=0 and c=0.2.
In summary, four factors were used in this study: three levels of test length (30,40, and 50); three levels of DIF/bias contamination (10%, 15%, and 20%); two abilitydistributions ( dT=0 and 0.5); and two levels of guessing (c=0, and 0.2). There were atotal of 36 conditions. For all 36 conditions, the amount of induced DIF/bias (k-0) wasset 0.5, and the sample size was fixed to 1000 examinees.
Item responses for the focal and the reference group examinees were simulated as fol-lows. The responses for the valid subtest items were generated using the unidimensionalthree-parameter logistic model given by
1- ciP1(0). ++ exp(-1.7a1(0 bi))'i = 1,...,n (4)
where a, b, and c denote respectively the item discrimination, item difficulty, and itemguessing level. The responses for the studied subtest items were generated using the two-
11
12

dimensional three-parameter logistic model with compensatory abilities due to Reckaseand McKinley (1983) given by
1 - ciP1(O,71) = ei + - n 1, . . . , N (5)
1 + exp(-1.7(ai,o(O - bi,o) aim(n bim)))'
For each simulated examinee, the probability of correct response for each item wascomputed using either Equation 4 (for a valid subtest item), or Equation 5 (for a studiedsubtest item). If the computed probability was greater than the uniform random variablegenerated from the interval (0,1), the item was considered answered correctly and a scoreof 1 was assigned. Otherwise a score of 0 was assigned.
After generating item responses for the reference and the focal group examineeswith the specified amount of induced DIF/bias, item responses on all items for the twogroups were combined to form a single data set. At this stage we pretend that weknow nothing about the data set. First we do dimensionality analyses using DIMTEST.If the null hypothesis of essential unidimensionality is rejected, we follow the steps asoutlined earlier to separate out items causing multidimensionality. The remaining itemswere again tested for unidimensionality. If the associated p-value is greater than .05it is concluded that the item response data are essentially unidimensional. Using thisas the valid subtest that is free of DIF/bias contamination, multidimensional items aretested each separately and collectively for DIF/bias or DTF/test b'as using the programSIBTEST.
Results
The details of dimensionality analyses are shown in Tables 3-6. Table 3 containsresults for all test lengths and for different percentages of DIF/bias contaminations forthe case of c=0 and dT = 0; Table 4 contains results for the case of c=0.2 and dT = 0;Table 5 contains results for the case of c=0 and di, = 0.5; and Table 6 contains resultsfor the case of c=0.2 and dT = 0.5. The first two columns of Table 3 contains the testlength and the percent of DIF/biased items for each test legth. For each condition,DIMTEST rejected the null hupothesis of essetial unidimensionality when applied onthe item responses of the combined sample of the reference and the focal groups (withan exception for the case of 30 items with 10% DIF/bias contamination), which impliedthat multidimensionality was present in the data. In order to identify items causingmultidimensionality, DIMTEST was repeated 100 times and items that consistentlyappeared in the subtest ATI were noted. The third column gives the mean (over 100
12
trials) of Stout's statistic T to test for essential unidimensionality. The fourth columngives the rejection rate over 100 trials, and the fifth column gives items that mostfrequently occurred in the subtest AT1. The next two columns give the mimimumand the maximum percent of occurance of any of the AT1 items listed in column five,over 100 trials, and over the first 25 trials. The last column gives items that wereremoved from the test based on DIMTEST analyses. For example, for a 40-item testwith 15% of DIF/biased items, the average T was 6.8, leading to the 99% rejectionof the null hypothesis of essential unidimensionality. Item numbers 35 to 40 appearedmost frequently in the subtest AT1, and these items appeared a minimum of 97% and amaximum of 98% for 100 trials. Similar percentages are reported for the first 25 trials,which are 96 to 100. Because these items appeared so frequently in ATI, they weresuspected of causing multidimensionality and were removed from the test (In real worldsituations one would also look at the content of such items). We will first discuss resultsfor all conditions except the case of 30 items with 10% DIF/bias contamination. At theend we will discuss results for this case separately.
From Table 3 it can be seen that for all conditions the rejection rates were high(97 to 100), except for the case of 50 items with 10% DIF/bias contamination, wherethe rejection rate was 61%. Also, for every condition, multidimesional items (items inthe last column of Table 1) appeared most frequently in the subtest ATI. In the caseof 50 items with 10% DIF/bias contamination, however, one unidimensional item alsoappeared most frequently in AT1 (we are trying to understand the reason for this). Theseitems were therefore removed from the test. Comparing the percent occurance of AT1items for all 100 trails, and for first 25 trials, it can be seen that repeating DIMTEST 25times is as good as repeating it 100 times. The results are almost the same in both cases.In the case of 50 items with 10% contamination, although the rejection rate was only61%, multidimensional items occured most freqeuntly in AT1 and thus lead to removalof these items.
Observation of results in Tables 4-6 lead to similar or better results. For all con-ditions the DIMTEST rejection rate was very high with multidimensional items fallinginto AT1 most frequently, leading to the rejection of Ho. Subsequently, these items wereremoved from the test.
In the case of 30 items with 10% DIF/bias, there were only 3 contaminated items.The DIMTEST requires a minimum of 4 items in the subtest AT1. Therefore, inevitably,one other unidimensional item got selected into AT1. Since AT1 was short, and mixeiwith unidimensional and multidimensional items, the rejection rate dropped to very low.However, the interesting fact was that even here multidimensional items occurred mostfrequently in ATI and were removed from the test. In some conditions with 30 items,
13
14

one unidimensional item also got deleted (item #5).
In summary, the results displayed in Tables 3-6 reveal that dimensionality analysesof multidimensional data most often lead to high rejection rates over repeated trials ofDIMTEST. Moreover, multidimensional items formed part of the subtest AT1 so thatthese items could be separated from the test. This was also true in cases of low (34%)or moderate (61%) rejection rates. That is, even in these cases multidimensional itemswere the most frequently occurring items of AT1 and lead to removal of these items fromthe test (although one additional unidimensional item was also removed in these twocases).
After removing multidimensional items from the test, the remaining items, in all 36conditions, were again assessed for essential unidimensionality. If the remainining itemsare essentially unidimensional, then this subtest is used as the matching criterion forassessing DTF/test bias contributed by multidimensional items in SIBTEST analyses.The results of these analyses are displayed in Tables 7-10. The conditions of these tablesare analgous to Tables 3-6. For example, Table 7, analgous to Table 3, displays results forthe case of c=0 and d2- = 0. The first half of Table 7 displays results for dimensionalityanalyses, and the second half of Table 7 displays results for DTF/test bias analyses.
Under dimensionality analyses, in Table 7, the first two columns denote the value ofStout's T-statistic and the associated p-value for initial dimensionality analyses. Thethird column denotes the items deleted from the test following initial dimensionalityanalyses. The fourth and the fifth columns denote the value of Stout's T-statistic andthe associated p-value for dimensionality analyses after removing items causing multi-dimensionality. As can be seen, in all cases, after removing multidimensional items theremaining item responses do conform to unidirnensional modeling as evidenced by the T-and p-values. That is, the remaining items can be treated as essentially unidimensional.The same is true for conditions presented in Tables 8 through 10.
Using the essentially unidimensional items as the matching criterion, DTF/test biasanalyses were perfor .-ed using SIBTEST. The results for all conditions are displayed inthe second half of Taoles 7-10. The multidimensional items (that were removed) formedthe studied subtest, while the remaining items, confirmed by DIMTEST as unidimen-sional, formed the valid subtest. The third column, under DTF/test bias analyes inTable 7, denotes the cumulative amount of estimated DTF/test bias caused by multidi-mensional items together. For example, a fiu value of 0.55 denotes that multidimensionalitems together contribute to a difference of about a five tenths of a point in the expectedtest scores between the focal and the reference groups. In other words, the referencegroup on the average, scores .55 of a point higher than the focal group after adjusting
14
15

for their ability differences. The last two columns give the value of the statistic B, andthe p-value associated with the null hypothesis of no DTF/test bias. It can be seenin Tables 7-10 that for all conditions, multidimensional items contributed to significantDTF/test bias as evidenced by the B- and the p-values. We also performed the singleitem DIF/bias analyses, in addition to DTF/test bias analuses, (not reported here) fora random sample of cases and found that they were statistically significant.
In summary, after removing items causing multidimensionality, the remaining itemswere found to be unidimensional. The unidimensional items were then used as thematching crit orion for DTF/Test bias analyses. For all conditions, multidimensionalitems contributed to a significant amount of DTF/test bias.
Summary and Discussion
The results presented here are preliminary findings, in an attempt to purify a testby separating out multidimensional items under the assumption that the intention ofthe test was to construct a unidimensional test for a given population. The proceduresuggested in this article to arrive at a purified, essentially unidimensional subtest usesthe multidimensional theory of DIF/bias proposed by Shealy and Stout (1993a), and thestatistical procedure DIMTEST for assessing essential unidimensionality. When appli-cable, the proposed methodology leads to a statistically validated construct valid subtestthat can be used as the matching criterion for DIF/bias analyses. This methodology canbe applied on either an internal matching criterion or on an external matching criterion.
Within the context of the simulation study presented, the results look optimistic.For most DIF/bias conditions studied, we were able to identify multidimensional itemsthat were concributing to DIF/hias, through unidimensional analyses. After removingthe multidimensional items, the remaining items when confirmed as essentially unidi-mensional, were used as the matching subtest to assess the degree of DIF/DTF or itembias/test bias of the multidimensional items.
The simulation study presented here is limited in scope. It could be further improvedon several factors. For example, the data generated in this study was either strictlyunidimensional (for the valid subtest item responses), or strictly two-dimensional (for thestudied subtest item responses). It would be interesting to introduce minor dimensions,in addition to major dimensions, that affect a few items to a small degree (that is,making the data essentially unidimensional or essentially multidimensional) and studytheir impact on DIF/bias as well as on DTF/test bias. Another improvement is the
16
16

strength of item parameters of the nuisance ability in relation to the strength of itemparameters of the target ability, which can be made a factor in the study. Also thecorrelation between the target and the nuisance abilities could be a factor. In addition,it will be interesting to have more than one nuisance ability to examine the cancellationeffect of DIF/bias either partially or fully.
As emphasized throughout this article, the proposed methodology is only applicablein a situation where the majority of test items are tapping the intended ability for a givenpopulation, and that a few items are tapping other major abilities in addition to theintended ability. If the DIF/bias is pervasive in test items, the proposed methodologyis not applicable. In this regard Linn's (1993) quote is very appropriate:
We should recognize that DIF techniques, whether based on Mantel-Haenszel,the standardization, or an item response theory (IRT) procedure, all sufferfrom the serious limitation that they can detect only items that show largedifferences in one direction or the other relative to the total set of items. Onecannot expect DIF procedures to detect "pervasive bias."
He goes on to say
The fact that DIF procedures cannot be expected to detect pervasive biasshould not be interpreted to mean that the procedures are of no value.Rather, it suggests that alone they are insufficient.
16
17

References
Ackerman. T. (1993, April). A didactic example of the influence of conditioning on thecomplete latent ability space when performing DIF analyses. Paper presented at theannual meeting of the National Council on Measurement in Education, Atlanta.
Angoff, W. (1993). Perspectives on differenLial item functioning methodology. In P. W.Holland and H.Wainer (Eds.), Differential item functioning (pp. 3-23). Hillsdale,NJ: Lawrence Erlbaum Associates.
Camilli, G. (1993). The case against item bias detection technique based on internalcriteria: Do item bias procedures obscure test fairness issues? In P. W. Hollandand H.Wainer (Eds.), Differential item functioning (pp. 397-413). Hillsdale, NJ:Lawrence Erlbaum Associates.
Chang, H., Mazzeo, J., 8z Roussos, L. (1993, April). Extension of Shealy-Stout's DIFprocedure to polytomous scored items. Paper presented at the annual meeting of theNational Council on Measurement in Education, Atlanta.
Clauser, B., Mazor, K., & Hambleton, R. (1993). The effects of purification of thematching criterion on the identification of DIF using the Mantel-Haenszel procedure.Applied Measurement in Education, 6, 269-279.
Douglas, J., Li, H., Roussos, L., & Stout, W. (1994). Test let bias: Identifying suspecttestlets and assessing testle, bias. Paper submitted for publication.
Drasgow, F. (1987). A study of measurement bias of two standard psychological tests.Journal of Applied Psychology, 72, 19-30.
Hambleton, R., & Rogers, H. J. (1989). Detecting potentially biased items: Comparisonof IRT area and Mantel-Haenszel methods. Applied Measurement in Education, 2,313-334.
Holland, P. W., & Thayer, D. T. (1988). Differential item performance and the Mantel-haenszel procedure. In H. Wainer & H. I. Braun (Eds.), Test Validity (pp 129-145).Hillsdale, NJ: Lawrence Erlbaum Associates, Inc.
Jensen, A. R. (1980). Bias in mental testing. New York: Free Press.
17
18
Li, H., & Stout, W. (1993, June). A new procedure for detection of crossing DIF/bias.Paper presented at the annual meeting of the AERA, Atlanta, Georgia.
Linn, R. (1993). The use of differential item functioning statistic: A discussion of currentpractice and future implications. In P. W. Holland and H.Wainer (Eds.), Differentialitem functioning (pp. 349-364). Hillsdale, NJ: Lawrence Erlbaum Associates.
Nandakumar, R. (1993a). Assessing dimensionality of real data. Applied PsychologicalMeasurement, 17, 29-38.
Nandakurnar, R. (1993b). Simualtaneous DIF amplification and cancellation: Shealy-Stout's test for DIF. Journal of Educational Measurement, 30, 293-311.
Nandakumar, R. (1991). Traditional dimensionality vs. essential dimensionality. Jour-nal of Educational Measurement, 28, 99-117.
Nandakumar, R., & Stout, W. (1993). Refinements of Stouts's procedure for assessinglatent trait unidimensionality. Journal of Educational Statistics, 18, 41-68.
Narayanan, P., 8z Swaminathan, H. (1993, April). Performance of the Mantel-Haenszeland simultaneous item bias procedure for detecting differential item funtioning. Pa-per presented at the annual meeting of the AERA, Atlanta, Georgia.
Oshima, T. C., Sz Miller, M. D. (1992). Multidimensionality and item bias in itemresponse theory. Apllied Psychological Measurement, 16, 237-248.
Reckase, M. D., & McKinley, R. L. (1983, April). The definition of difficulty and dis-c,iminatim for multidimensional item response theory models. Paper presented atthe amn _neeting of the American Educational Research Association, Montreal.
Roussos, L., Sz Stout, W.(1993, June). Simulation studies of effects of small sample sizeand studied item parameters on SIBTEST and Mantel-Haenszel type I error perfor-mance. Paper presented at the annual meeting of the AERA, Atlanta, Georgia.
Roussos, L., Stout, W., & Marden, J. (1994). Analysis of the multidimensional struc-ture of standardized tests using DIMTEST with hierarchical cluster analysis. Papersubmitted for publication.
18
9

Shealy, R., 8./ Stout, W. (1993b). A model-based standardization approach that separatestrue bias/DIF from group ability differences and detects test bias/DTF as well asitem bias/DIF. Psychometrika, 58, 159-194.
Shealy, R., & Stout, W. (1993a). An item response theory model for test bias. InP. W. Holland and H.Wainer (Eds.), Differential item functioning. Hillsdale, NJ:Lawrence Erlbaum Associates, 197-239.
Stout, W., & Roussos, L. (1992). SIBTEST User Manual.
Stout, W., & Roussos, L. (1992). SIMTEST Program.
Stout, W. (1987). A nonparametric approach for assessing latent trait unidimesionality.Psychometrika, 52, 589-617.
Stout, W., Nandakumar, R., Junker, B., Chang, H., Sz Steidinger, D. (1993). DIMTEST:A Fortran program for assessing latent trait essential unidimensionality. AppliedPsychological Measurement, 16, 236.
Williams, V. (1993, April). Bridging gap between DIF and item bias. Paper presentedat the annual meeting of the American Educational Research Association, Atlanta.
19
20

Table 1Percentages and Item Numbers of Valid and Studied Subtests
Used in Simulations
TestLength
Percent ofDIF/Bias
Items
Number ofDIF/Bias
Items
ValidSubtest
ItemNumbers
StudiedSubtest
ItemNumbers
10 3 1 to 27 28 to 3030 15 5 1 to 25 26 to 30
20 6 1 to 24 25 to 3010 4 1 to 36 37 to 40
40 15 6 1 to 34 35 to 4020 8 1 to 32 33 to 4010 5 1 to 45 46 to 50
50 15 8 1 to 42 43 to 5020 10 1 to 40 41 to 50
Table 2Parameters of Studied Subtests
Used in SimulationsItem
Number a° 1)9bn
1 1.10 -0.70 0.88 -0.562 0.70 -0.60 0.56 -0.483 0.90 -0.40 0.72 -0.324 1.40 0.10 1.10 0.085 0.90 0.90 0.72 0.726 1.20 0.70 0.96 0.567 0.90 0.30 0.72 0.248 1.00 0.80 0.80 0.649 1.60 1.10 1.28 0.88
10 2.00 1.10 1.60 0.88

Table 3Details of Dimensionality Analyses for 100 Trialsc = 0, dT = 0, JF = 1000, JR = 1000, ko = 0.5
TestLength
Percent ofDIF/Bias
ItemsT
RejectionRate
Most FrequentAT1 Items
Percent Occurance ofAT1 Items
ItemsRemoved
100 Trials 25 Trials10 1.0 34 5, 28 to 30 38-50 40-52 28 to 30
30 15 6.3 100 26 to 30 96-100 96-100 26 to 3020 7.4 100 25 to 30 96-100 100 25 to 3010 3.9 97 37 to 40 96-100 100 37 to 40
40 15 6.8 99 35 to 40 97-98 96-100 35 to 4020 7.9 100 33 to 40 97-100 96-100 33 to 4010 2.8 61 25, 46 to 50 48-64 48-64 25, 46 to 50
50 15 8.1 100 43 to 50 76-100 88-100 43 to 5020 9.5 100 41 to 50 61-91 76-100 41 to 50
c = Guessing leveldT = The mean difference between focal and reference groups on the target abilityJF = The sample size for the focal groupJR = The sample size for the reference groupko = The degree of potential for bias (the mean difference between the two groups on thenuisance ability)Ou = The estimated DTF/Test Bias
Table 4Details of Dimensionality Analyses for 100 Trialsc = 0.2, d2, = 0, JF = 1000, JR = 1000, ko = 0.5
TestLength
Percent ofDIF/Bias
ItemsT
RejectionRate
Most FrequentAT1 Items
Percent Occurance ofAT1 Items
ItemsRemoved
100 Trials 25 Trials10 1.1 34 5, 28 to 30 33-52 20-68 28 to 30
30 15 4.6 98 26 to 30 97-100 96-100 26 to 3020 5.5 100 25 to 30 95-100 100 25 to 3010 3.8 97 37 to 40 94-96 100 37 to 40
40 15 7.0 100 35 to 40 98-100 100 35 to 4020 7.7 100 33 to 40 96-100 100 33 to 4010 8.3 100 46 to 50 100 100 46 to 50
50 15 10.0 100 43 to 50 99-100 100 43 to 5020 9.7 100 41 to 50 96-100 96-100 41 to 50
22

Table 5Details of Dimensionality Analyses for 100 Trialsc = 0, dT = 0.5, ./F = 1000, ./R = 1000, /co = 0.5
TestLength
PPrcent ofDIF/Bias
Items
RejectionRate
Most FrequentAT1 Items
Percent Occurance ofAT1 Items
ItemsRemoved
100 Trials 25 Trials10 33 28 to 30 42 48 28 to 30
30 15 100 26 to 30 91-100 92-100 26 to 3020 100 25 to 30 85-99 80-100 25 to 3010 93 37 to 40 88-98 92-100 37 to 40
40 15 98 35 to 40 87-97 84-100 35 to 4020 100 33 to 40 71-100 72-100 33 to 4010 100 46 to 50 100 100 46 to 50
50 15 100 43 to 50 99-100 96-100 43 to 5020 100 41 to 50 96-100 80-100 41 to 50
Table 6Details of Dimensionality Analyses for 100 Trialsc = 0.2, dT = 0.5, JF = 1000, JR = 1000, ko = 0.5
TestLength
Percent ofDIF/Bias
Items
RejectionRate
Most FrequentAT1 Items
Percent Occurance ofAT1 Items
ItemsRemoved
100 Trials 25 Trials10 35 28 to 30 47-48 40-44 28 to 30
30 15 99 26 to 30 92-99 92-100 26 to 3020 100 25 to 30 93-100 96-100 25 to 3010 98 37 to 40 95-99 96 37 to 40
40 15 100 35 to 40 75-100 72-100 35 to 4020 100 33 to 40 77-100 68-100 33 to 4010 100 46 to 50 99-100 100 46 to 50
50 15 100 43 to 50 96-100 96-100 43 to 5020 100 41 to 50 96-100 92-100 41 to 50

Table 7Summary of Dimensionality and DTF/Test Bias Analyses
c = 0, dT = 0, Jp = 1000, JR = ko = 0.5
TestLength
Dimensionality Analyses DTP/Test[Studied
Length
Bias Analysts
fiu B pT pItems
Removed T p
ValidSubtestiSubtestLength
1.0 < .16 28-30 1.2 < .11 27 3 0.24 6.8 < 0030 6.3 < 00 26-30 0.4 < .32 25 5 0.55 10.3 < 00
7.4 < 00 25-30 0.9 < .17 24 6 0.62 9.8 < 003.9 < 00 37-40 0.4 < .33 36 4 0.25 5.7 < 00
40 6.8 < 00 35-40 -1.5 < .94 34 6 0.41 7.2 < 007.9 < 00 33-40 -0.3 < .63 32 8 0.59 7.9 < 002.8 < 00 25, 46-50 -1.4 < .91 45 6 0.40 7.9 < 00
50 8.7 < 00 43-50 0.3 < .38 42 8 0.63 8.7 < 009.5 < 00 41-50 -1.6 < .95 40 10 0.78 8.5 < 00
c = Guessing leveldT = The mean difference between focal and reference groups on the target ability
= The sample size for the focal groupJR = The sample size for the reference group
= the degree of potential for bias (the mean difference between the two groups on thenuisance ability)13u = the estimated DTF/Test Bias
Table 8Summary of Dimensionality and DTF/Test Bias Analyses
c = 0.2, dT = 0, Jp- = 1000, JR = 1000, ko = 0.5
TestLength
Dimensionality Analyses DTF/Test Bias Analyses
T pItems
Removed T p
ValidSubtestLength
StudiedSubtestLength Ou B p
1.1 < .14 28-30 -1.6 < .95 27 3 0.27 6.9 , < 0030 4.6 < 00 26-30 0.2 < .41 25 5 0.36 6.2 < 00
5.5 < 00 25-30 0.5 < .30 24 6 0.46 6.8 < 003.8 < 00 37-40 -0.0 < .50 36 4 0.26 5.7 < 00
40 7.0 < 00 35-40 -1.9 < .97 34 6 0.42 7.0 < 007.7 < 00 33-40 -0.3 < .63 32 8 0.64 7.6 < 008.3 < 00 46-50 -0.2 < .58 45 5 0.59 9.1 < 00
50 10.0 < 00 43-50 0.2 < .41 42 8 0.84 8.5 < 009.7 < 00 41-50 1.8 < .04 40 10 0.86 7 9 < 00
0 4

Table 9Summary of Dimensionality and DIT/Test Bias Analyses
c = 0, dT = 0.5, JF = 1000, JR = 1000, ko = 0.5
TestLength
Dimensionality Analyses DTF/Test Bias Analyses
T pItems
Removed T p
ValidSubtestLength
StudiedSubtestLength Ou B p
0.9 < .18 28-30 -0.7 < .75 27 3 0.23 6.4 < 0030 4.7 < 00 26-30 -0.2 < .59 25 5 0.32 6.4 < 00
5.2 < 00 25-30 -0.4 < .64 24 6 0.43 7.3 < 003.7 < 00 37-40 -1.2 < .89 36 4 0.33 7.5 < 00
40 5.4 < 00 35-40 0.4 < .33 34 6 0.50 8.2 < 007.5 < 00 33-40 -0.9 < .82 32 8 0.72 9.7 < 008.6 < 00 46-50 -0.5 < .67 45 5 0.41 6.8 < 00
50 9.7 < 00 43-50 -0.3 < .63 42 8 0.63 7.3 < 009.5 < 00 41-50 -1.2 < .89 40 10 0.76 7.8 < 00
Table 10Summary of Dimensionality and DTF/Test Bias Analyses
c = 0.2, ch = 0.5, Jp = 1000, JR = 1000, ko = 0.5
TestLength
Dimensionality Analyses DTF/Test Bias Analyses
T pItems
Removed T p
ValidSubtestLength
StudiedSubtestLength au B p
1.9 < .00 28-30 -0.4 < .64 27 3 0.27 6.7 < 0030 4.6 < 00 26-30 -0.2 < .59 25 5 0.32 5.6 < 00
5.3 < 00 25-30 1.1 < .14 24 6 0.50 7.7 < 004.0 < 00 37-40 -0.9 < .82 36 4 0.17 3.7 < 00
40 6.4 < 00 35-40 -0.0 < .51 34 6 0.54 8.9 < 008.1 < 00 33-40 -0.9 < .81 32 8 0.80 9.1 < 008.1 < 00 46-50 -1.3 < .09 45 5 0.57 8.3 < 00
50 10.1 < 00 43-50 -0.4 < .67 42 8 0.80 8.5 < C',19.5 < 00 41-50 -1.2 < .89 40 10 0.97 8.5 < 00