DOCUMENT RESUME ED 305 975 JC 890 202 TITLE Statistical ... · This databook contains information...
142
DOCUMENT RESUME ED 305 975 JC 890 202 TITLE Statistical Supplement to the Long-Range Planning for Texas Higher Education Report: Fiscal Year 1988, September 1, 1987-August 31, 1988. INSTITUTION Texas Higher Education Coordinating Board, Austin. PUB DATE 88 NOTE 277p. PUB TYRE Statistical Data (110) EDRS PRICE MFO1 /PC12 Plus Postage. DESCRIPTORS College Faculty; College Progr 'is; *College Students; Community Colleges; Educationa.l. Facilities; Educational Finance; *Enrollment; Higher Education; Postsecondary Education; Private Colleges; Public Colleges; Space Utilization; *State Aid; State Surveys; Student Characteristics; Student Financial Aid; Teacher Characteristics; Teacher Salaries; Teacher Student Ratio; Two Year Colleges IDENTIFIERS *Texas ABSTRACT This databook contains information on student enrollments, faculty, semester credit hours, physical facilities, appropriations, and student loan and grant programs for Texas. institutions of higher education, including public and independent two- and four-year colleges. The enrollment section provides five-year (1983-87) summaries of headcount enrollment by type of institution; enrollment data by class standing, sex, and ethnicity; figures for resident and nonresident students; and tables showing county and state of origin of Texas college students. The section containing faculty data provides statistics by rank, ethnicity, sex, and tenure status, as well as information on faculty salaries and student-faculty ratios. The next section creaks down semester credit hours by program for undergraduate, masters, and doctoral levels for public universities; and by curriculum area for community and junior colleges. Tables focusing on physical facilities detail investment in the physical plant and net assignable facilities space by function by type of college. In the next section, legislative appropriations for fiscal years 1988 and 1989 are presented by college and agency, and biennial appropriations per full-time equivalent student are detailed for 1953-55 to 1987-89. Finally, the numbers of financial aid awards, grants, and scholarships are reported by type of institution. (ALB) *********************************************************************** Reproductions supplied by EDRS are the best that can be made from the original document. ***********************************************************************
Transcript of DOCUMENT RESUME ED 305 975 JC 890 202 TITLE Statistical ... · This databook contains information...

DOCUMENT RESUME
ED 305 975 JC 890 202
TITLE Statistical Supplement to the Long-Range Planning forTexas Higher Education Report: Fiscal Year 1988,September 1, 1987-August 31, 1988.
INSTITUTION Texas Higher Education Coordinating Board, Austin.PUB DATE 88NOTE 277p.
PUB TYRE Statistical Data (110)
EDRS PRICE MFO1 /PC12 Plus Postage.DESCRIPTORS College Faculty; College Progr 'is; *College Students;
Community Colleges; Educationa.l. Facilities;Educational Finance; *Enrollment; Higher Education;Postsecondary Education; Private Colleges; PublicColleges; Space Utilization; *State Aid; StateSurveys; Student Characteristics; Student FinancialAid; Teacher Characteristics; Teacher Salaries;Teacher Student Ratio; Two Year Colleges
IDENTIFIERS *Texas
ABSTRACTThis databook contains information on student
enrollments, faculty, semester credit hours, physical facilities,appropriations, and student loan and grant programs for Texas.institutions of higher education, including public and independenttwo- and four-year colleges. The enrollment section providesfive-year (1983-87) summaries of headcount enrollment by type ofinstitution; enrollment data by class standing, sex, and ethnicity;figures for resident and nonresident students; and tables showingcounty and state of origin of Texas college students. The sectioncontaining faculty data provides statistics by rank, ethnicity, sex,and tenure status, as well as information on faculty salaries andstudent-faculty ratios. The next section creaks down semester credithours by program for undergraduate, masters, and doctoral levels forpublic universities; and by curriculum area for community and juniorcolleges. Tables focusing on physical facilities detail investment inthe physical plant and net assignable facilities space by function bytype of college. In the next section, legislative appropriations forfiscal years 1988 and 1989 are presented by college and agency, andbiennial appropriations per full-time equivalent student are detailedfor 1953-55 to 1987-89. Finally, the numbers of financial aid awards,grants, and scholarships are reported by type of institution.(ALB)
***********************************************************************
Reproductions supplied by EDRS are the best that can be madefrom the original document.
***********************************************************************

Statistical Supplementto the Long-Range Planning for Texas Higher Education Report
"PERMISSION TO REPRODUCE THISMATERIAL HAS BEEN GRANTED BY
D. L. Ray
TO THE EDUCATIONAL RESOURCESINFORMATION CENTER (ERIC)"
U S DEPARTMENT OF EDUCATIONOnrce of Educational Research and improvement
EDUCATIONAL RESOURCES INFORMATIONCENTER (ERIC)
)1( ThiS document has been reproduced asrece.ved from the person or Organizationoriginating it
t fknor changes have been made to mprovereproduction quality
Points of view or OpinionS Stated in thiS dOCumen( do not necessarily represent officialOERI Dos.t,on or poky
Fiscal Year 1988September 1, 1987 August 31, 1988
Texas Higher Education Coordinating BoardKenneth H. Ashworth, Commissioner of Higher Education
t :I
BEST COPY AVAILABLE

Texas Institutions of Higher Education .
Student Enrollments
Five-Year Summaries of Headcount Enrollment,1983-1987Summary of Fall Headcount EnrollmentPublic Senior Universities . .. .
Public Community Junior Colleges .
Independent Senior Colleges and UniversitiesIndependent Junior Colleges .
Headcount Enrollment by Classification,Ethnic Origin, SexPublic Senior UniversitiesPublic Community Junior CollegesIndependent Senior Colleges and UniversitiesIndependent Junior CollegesProfessional Enrollments, Medical
and Dental SchoolsAcademic Enrollments, Health-Related Schools
Resident and Nonresident StudentsPublic Senior UniversitiesPublic Community Junior Colleges 48
County and State of Origin of Students inTexas CollegesTexas Resident Students by County of Origin . 50Out-of-State Enrollments
Table of Contents
1
78
101214
15243233
Faculty Salaries, A;I RanksPublic Senior Universities
Faculty Salaries by Rank and InstitutionPublic Senior Universities .
Student-Faculty RatiosPublic Senior Universities
Faculty SalariesPublic Community Junior Colleges
Semester Credit Hours
Public Senior UniversitiesSemester Credit Hours, by LevelUndergraduate Semester Credit Hours,
by Program . . .. .
Master's Level Semester Credit Hours,by Program . . . .. .
Doctoral Level Semester Credit Hours,by Program . .
34 Special /Professional Semester Credit Hours,39 by Program . .
Semester Credit Hours, Fall 1987Semester Credit Hours, Spring 1988
47 Semester Credit Hours, Summer 1988
Public Community Junior CollegesSemester Credit Hours Enrollments, by
Curriculum Area, Fall 1987
Faculty Data
Faculty by Rank, Ethnic Origin, SexPublic Senior Universities .
Faculty Headcount by Tenure, Ethnic Origin, SexPublic Senior Universities ..
Faculty by Rank, Ethnic Origin, SexPublic Community Junior Colleges
53 Physical Facilities
Investment in Physical PlantPublic Institutions of Higher EducationPublic Senior Universities . .
Other Agencies of Higher Education57 Public Community Junior Colleges .
Net Assignable Facilities Space by Function,66 In Square Feet
Public Senior Universities,71 As of Oct. 31, 1988 .
III
73
74
77
. 78
81
82
85
88
91929394
95
103. 104
105106
107

Public Community Junior Colleges, State Scholarships for EthnicAs of Oct. 31, 1988 . 108 Recruitment Program 127
Independent Senior Colleges and Universities,As of Oct. 31, 1988. . . 110 Texas Public Educational-State Student
Independent Junior Colleges,As of Oct. 31, 1988 . 111
Incentive Grant Program 128
Texas Public Educational RefundGrant Program . 129
Higher Education AppropriationsHinson-Hazlewood College Student Loan Act
Legislative Appropriations, General Revenue Hinson-Hazlewood College StudentAgencies of Higher Education . .. 115 Loan Program . 130
Analysis of Loan Transactions-Biennial Legislative Appropriations per Full-Time All Programs 131
Student Equivalent, General Revenue Institutional Status of All Loans 133Pubic Senior Universities . ... 120 Health Education Assistance Loans 135
Institutional Status of HealthBiennial Legislative Appropriations per Full-Time Education Assistance Loans 138
Student Equivalent, All Funds Supplemental Loans to Students 140Public Senior Universities. . 121
Paul Douglas Teacher Scholarship Program 144
State Loan and Grant Programs Future Teacher Loan Program 146
Tuition Equalization Grant Program 125 Teacher Education Loan Program 147
State Student Incentive Grant Program 126 Physician Student Loan Repayrr?nt Program 148
i
IV

1
TEXAS INSTITUTIONS OF HIGHER EDUCATION
Public Universities
InstitutionDate of
Founding,University System of South Texas
Corpus Chris: C:cfe University, Corpus Christi'Laredo State 1,;.. ,ersity, Laredo'
1971
1969East Texas Slate University, Commerce 1889 Texas A&I University. Kingsville 1925East Texas State University Center at Texarkana2 1971 West Texas State University, Canyon 1910Lamar University SystemLamar University, Ceaumont 1923Lamar University at Orange' 197iLamar University at Port Arthur'
Midwestern State University, Wichita Falls19751922 Public Medical, Dental and Allied Health Units
Pan American University, Edinburg 1927Pan American University at Brownsville2 1973 Date cfStephen F Austin State University. Nacogdoches 1923 Institution Founding'Texas A&M University SystemPrairie View A&M University, Prairie View 1876 Texas A&M University College of Medicine, College Station 1977Tarleton State University. Stephenville 1899 Texas College of Osteopathic Medicine, Fort Worth 1970Texas A&M University, College Station 1876 Texas Tech University Health Sciences Center, LubbockTexas A&M U.iiversity at Galveston 1962 School of Medicine 1969Texas Southern University, Houston 1947 School of Nursing
Texas State University System The University of Texas Health Science Center at DallasAngelo State University, San Angelr, 1928 Graduate School of Biomedical Sciences 1972Sam Houston State University, Huntsville 1879 School of Allied Health Sciences 1970Southwest Texas State University. San Marcos 1901 Southwestern Medical School 1943Sul Ross State University, Alpine 1919 The University of Texas Health Science Center at HoustonUvalde Study Center' 1973 Dental Branch 1943Texas Tech University, Lubbock 1923 Graduate School of Biomedical Sciences 1963Texas Woman's University, Denton 1901 Medical School 1969The University of Texas System School of Public Health 1947The University of Texas at Arlington 1895 School of Allied Health SciencesThe University of Texas at Austin 1883 School of NursingThe University of Texas at Dallas2 1969 The University of Texas Health Science Center at San AntonioThe University of Texas at El Paso 1913 Dental School 1969The University of Texas of the Permian Basin. Odessa2 1969 Graduate Schocl of Biomedical Sciences 1970The University of Texas at San Antonio 1969 Medical School 1959The University of Texas at Tyler' 1971 School of Allied Health Sciences 1975University of Houston System School of Nursing 1969University of Houston-Clear Lake2 1971 The University of Texas Medical Branch at GalvestonUniversity of Houston-Downtown, Houston 1948 Graduate School of Biomedical Sciences 1952University of Houston, Houston 1927 Medical School 1881University of Houston-Victoria2 1972 School of Allied Health Sciences 1968University of North Texas, Denton 1890 School of Nursing 1945
e/

2
Public Community Junior Colleges
InstitutionDate of
Founding'
Alamo Community College DistrictPalo Alto College, San Antonio 1985San Antonio College, San Antonio 1925St. Phillip's College, San Antonio 1898
Alvin Community College, Alvin 1949Amarillo College, Amarillo 1929Angelina College, Lufkin 1966Austin Community College, Austin 1972Bee County College, Beeville 1965Blinn College, Brenham 1883Brazosport College, Lake Jackson 1948Central Texas College, Killeen 1965Cisco Junior College, Cisco 1909Clarendon College, Clarendon 1898College of the Mainland, Texas City 1965Collin County Community College District, Plano 1985Cooke County College, Gainsville 1924Dallas County Community College District 1965
Brookhaven College, Farmers Branch 1978Cedar Valley College, Lancaster 1977Eastfield College, Mesquite 1966El Centro College, Dallas 1964Mountain View College, Dallas 1970North Lake College, Irving 1977Richland College, Dallas 1972
Del Mar College, Corpus Christi 1935El Paso County Community College, El Paso 1969Frank Phillips College, Borger 1948Galveston College, Galveston 1935Grayson County College, Denison 1963Hill Junior College, Hillsboro 1923Houston Community College. Houston 1971Howard County Junior College District, Big Spring
Howard College at Big Spring 1945Southwest Col leg:ate Institute for the Deaf, Big Spring 1981
Kilgore College, Kilgore 1935Laredo Junior College, Laredo 1947Lee College, Baytown 1934McLennan Community College, Waco 1965Midland College, Midland 1969Navarro College, Corsicana 1946
t
InstitutionDate of
Founding'
North Harris County College. Houston 1972
Northeast Texas Community College, Mt Pleasant 1984
Odessa College, Odessa 1946Panola Junior College, Carthage 1947Paris Junior College, Paris 1924Ranger Junior College, Ranger 1926San Jacinto College District
Central Campus, Pasadena 1961
North Campus, Houston 1974South Campus, Houston 1979
South Plains College, Level land 1957Southwest Texas Junior College, Uvalde 1946Tarrant County Junior College District 1965
Northeast Campus, Hurt 1968Northwest Campus, Fort Worth 1975South Campus, Fort Worth 1967
Temple Junior College, Temple 1926Texarkana Community College, Texarkana 1927Texas Southmost College, Brownsville 1926The Victoria College, Victoria 1925Trinity Valley Community College 1946Tyler Junior College, Tyler 1926Vernon Regional Junior College, Vernon 1970Weatherford College, Weatherford 1869Western Texas College, Snyder 1969Wharton County Junior College, Wharton 1946
Public Technical Institutes
InstitutionDate of
Founding'
Texas State Technical InstituteWaco Campus 1965Amarillo Campus 1969Harlingen Campus 1969Sweetwater Campus 1970

Independent Senior Colleges and Universities Independent Medical, Dental and Allied Health Units
lostiturionDate of
Fouiding'
Abilene Christian University, Abilene 1906Amber University, Garland 1962American Technological University, Killeen 1S73Austin College, Sherman 1849Baylor University, Waco 1845Bishop College Dallas's 1880Concordia Lutheran College, Austin 1926Dallas Baptist University, Dallas 1897East Texas Baptist University, Marshall 1914Gulf-Coast Bible College, Houston' 1953Hardin-Simmons University, Abilene 1891Houston Baptist University, Houston 1°50Howard Paine University, Brownwood .89Huston-Tillotson College, Austin 1877Incarnate Word College, San Antonio 1900Jarvis Christian College, Hawkins 1912LeTourneau College, Longview 1946Lubbock Christian College, Lubbock 1957Mc Murry College, Abilene 1922Our Lady of the Lake University, San Antonio 1912Paul Quinn College, Waco 1872St. Edward's University, Austin 1885St. Mary's University, San Antonio 1852Schreiner Cs' lege, Ke ' 'le 1923.outhern Methodist University, Dallas 1911South Texas College of Law, Houston 1923Southwestern Adventist College, Keene 1894Southwestern Christian College, Terrell 1949Southwestern University, Georgetown 1840Texas Christian University, Fort Worth 1873Texas College, Tyler 1894Texas Lutheran College, Seguin 1891Texas W.-.-...leyan College, Fort Worth 1891Trinity Ur.versity, San Antonio 1869Univets.ry of Dallas, Irving 1956Unive say of Mary Hardin-Baylor, Belton 1845Univ(asity of St. Thomas, Houstc . 1947Wayland Baptist University, Plainview 1908Wiley College, Marshall 1873Wiliiam Marsh Rice University, Houston 1912
InstitutionDate of
Founding'
Baylor College of Dentistry, DallasCaruth School of Dental HygieneGraduate Division
Baylor Co liege of Medicine, HoustonBaylor College of Medicine/AcademicsSchool of Graduate Sciences
1905
1903
Independent Junior Colleges
Institution
Jacksonville Coll,ge, JacksonvilleLon Morris College, JacksonvilleSouthwestern Assemblies of God Junior College,
Waxahachie
Date ofFounding'
18991873
1946
'Date or original founding, spo. sorship, designation, and level of instructionmay have changed, and the institution may not have been in continuousoperation
'An upper-level ceni.:, -:ollege or university offering work beyond thesophomore level3A lower-division center offering freshman- and sophomore-level work.'Moved to Oklahoma City, OK in June 1985.5Closed fall 1988.
3

STUDENT ENROLLMENTS

7
SUMMARY OF FALL HEADCOUNT ENROLLMENTTexas Institutions of Higher Education, 1983-1987
Institution 1983 1984 1985 198L 1987
Public Univf, /sales 369,799 372,326 361,052 359,343 365,882Independent Senior Colleges and Universities 78,185 77,277 77,894 78,755 78,900Public Community Junior Co lieges' 302,102 300,652 289,532 302,085 321,025Public Technical Institutes' 8,785 8,548 8,667 9,062 8,896Independent Junior Colleges 1,379 1.238 1,151 1,192 1,224
Subtotals 760,250 760,041 738,296 750,437 775,927
Medical and Dental SchoolsPublic Institutions 9,228 9,459 10,652 10,802 10,825Indepeodent Institutions 1,515 1,499 1,484 1,444 1,413
Subtotals 10,743 10,958 12,136 12,246 12,238
Totals 770,993 770,999 750,432 762,683 738,165
'Headcount enrollments in public technical institutes and public community colleges include only students enrolled in semester-length courses

8
FALL HEADCOUNT ENROLLMENTTexas Public Universities, 1983-1987
Institution 1983 1984 1985 1986 1987
East Texas State University 7,569 7,139 6,864 6,921 6,763East Texas State University Center at Texarkana' 1.111 1,283 1,162 1,142 1,114
Lamar University SystemLamar University at Beaumont 13,277 13,161 11,787 11,592 11,371Lamar University at Orange' 1,061 1,065 909 933Lamar University at Port Arthur2 1,435 1,563 1,453 1,448
M;dwestern State University 5,032 4,857 4,681 4,382 4,723Pan American University 8,594 8,921 8,329 8,903 9,632Pan American University at Brownsville' 1,079 1,207 1,244 1,183 1,240Stephen F. Austin State University 12,397 12,446 12,296 12,138 12,111Texas A&M University SystemPrairie View A&M University 4,452 4,436 4,626 4,499 5,307Tarleton State University 4,606 4,624 4,627 4,636 5,242Texas A&M University 36,697 36,669 34,056 34,940 37,383Texas A&M University at Galveston 552 586 585 524 551Texas Southern University 8,972 8,834 8,057 6,983 7,006Texas State University SystemAngelo State University 6,336 6,156 5,875 5,801 5,802Sam Houston State University 10,580 10,472 10,345 10,486 10,685Southwest Texas State University 18,314 19,202 19,267 19,775 20,039SW Ross State University 1,917 1,757 1,667 1,831 1,703Uvalde Study Center' 531 484 460 483 403Texas Tech University 23,704 23,433 23,456 23,470 23,564Texas Woman's University 8,453 8,159 8,119 7,950 8,308The University of Texas SystemThe University of Texas at Arlington 23,175 23,397 23,109 23,245 22,760The University cf exas at Austin 47,631 47,973 47,838 46,14C 47,743The University of Texas at Dallas' 7,450 7,442 7,177 7,324 7,735The University of Texas at El Paso 15,268 15,322 14,110 13,753 14,056The University of Texas of the Permian Basin' 1,975 2,003 1,895 1,822 1,956The University of Texas at San Antonio 11,890 12,612 12.137 12,413 12,879The University of Texas at Tylei' 3,142 3,541 3,618 3,642 3,681University of Houston SystemUniversity of Houston 31,068 31,095 29,944 29,042 28,907University of Houston-Clear Lake' 6,498 6,392 6,534 6,691 6,823University of Houston-Downtown 7,140 7.339 7,110 7,255 7,230University of Houston-Victoria' 918 921 962 937 1,066University of North Texas 20,234 21,414 20,996 21,271 22,379University System of South TexasCorpus Christi State University' 3,469 3,512 3,59' 3,813 3,670Laredo State University' 932 928 866 935 915Texas A&I University 5,517 5,507 5,115 5,012 5,393West Texas State University 6,823 6,474 6,179 6,028 5,742
Subtotals: Public Universities 359,799 372,326 361.052 359,343 365,882
'An upper-level center offering work beyond the sophomore year2A lower- division center offering freshman- and sophomore-level work.'See Public Junior College section, pages 10-11.
i °.4- I

9
Fall Headcount EnrollmentTexas Public Universities, 1983-1987
Institution 1983 1984 1985 1986 1987
Puo lic Medical, Dental, Nursing, and Allied Health UnitsTexas A&M University
College of Medicine 149 164 183 193 195College of Medicine/Academics --- --- 2 6College of Veterinary Medicine (Professional) 544 525 512College of Veterinary Medicine (Academic) 892 903 982
Texas College of Osteopathic Medicine 387 395 382 376 385Texas Tech University Health Sciences Center
School of Allied Health 19 46 77 80 100School of Medicine 388 401 403 410 405School of Medicine/Academics 35 31 33School of Nursing 165 20: 180 242 244
The University of Texas Health Science Center at DallasGraduate School of Biomedical Sciences 299 318 329 357 308School of Allied Health Sciences 21..3 265 304 341 301Southwestern Medical School 801 815 803 823 798
The University of Texas Health Science Center at HoustonDental Branch/Academics 122 125 109 106 94Dental School 465 448 420 393 381Graduate School of Biomedical Sciences 211 250 237 250 235School of Allied Health Sciences 227 213 216 184 161Medical School 806 809 789 799 792School of Public Health 494 503 467 500 532School of Nursing 354 443 437 429 472
The University of Texas Health Science Center at San AntonioDental School 515 471 419 392 373Dental School/Academics --- 34 36 37Graduate School of Biomedical Sciences 177 189 142 148 155Medical School 802 798 800 786 799School of Allied Health Sciences 200 227 9.48 236 256School of Nursing 624 347 562 566 577
The University of Texas Medical Branch at GalvestonGraduate School of Biomedical Sciences 147 169 151 162 173Medical School 795 789 791 782 786School of Allied Health Sciences 396 351 290 287 304School of Nursing 417 420 408 453 429
subtotals- Public Medical, Dental, Nursing and Allied Health Units 9,228 9,459 10 652 10,802 10 ..,
Totals. Public Universities 379,027 381,785 371,704 370,145 376 j7
1. mss,

10
FALL HEADCOUNT ENROLLMENTTexas Public Community Junior Colleges and Technical Institutes, 1983-1987
(Semester-Length Courses Only)
Institution 1983 1984 1985 1986 1987
Alamo Community College DistrictPalo Alto College 230 1,131
221,512367 081
8San Antonio College 22.146 22.257 21.188 79St Philip's College 6.125
250..6105
48,928433Alvin Community College 4,034
53:034257
5 0493.918
Amarillo College 6.0993.9215,843
2,618Austin Community College
5,236Angelina College Z694 2,415,1042,527
16,674 17,807172:544104
18.340 19.905Bee County College 1.881 1.847 1,719
2:1142 5,1781
2,201Blinn College 3.380 3.499 3.700 43Brazosport College 3,606 3.603 3,458
4,7313,269 3,352Central Texas College 5,132
1,65041..576655
1.5005,452 5,048Cisco Junior College1,531
Clarendon College 735 739 653 671
43,837992690
College of the Mari land 2,883 2,865 3,076 3,243Collin County Community College District ...
1,673 1,6811,326 3,836Cooke County College 1,635 2.240 2,443Dallas County Community College District
6.951Brookhaven College 6.659 6,547 7,021 7,156Cedar Val' 2,22'4ey College 2,323 2,174 2,386 2,806Eastfield College 8.759 8.668 8,304 8,370 8,9355,745El Centro College 6.585 5,570 5,279
4,9425,415Mountain View College 5,790 5,244
5,1654,863 5,347
4,882North Lake College 5.309 5,462 5,624Richland College 14,147 13 ,468 13,073 12,634 12,930Del Mar Col:ege 8.330 8.400 8,665 8,927 9,394El Paso County Community College 12,674 13,604 13,084 13,572 14,040Frank Phillips College 913 920 819 8441,740 1,956 1,736 1,889723
Galveston College2,020Grayson County College 4,601 4:15635
1,101 1,356 1,2283,117 3,151 3,140Hill Junior College 958
19,57518,653 21,025Houston Community College 18.792
1,069
19,339Howard County Junior College District1,168 1,121
Howard College at Big Spring1,325Southwest Collegiate Institute for the Deaf 133 93 96 122
4,543Kilgore College3,886 3,937 4,305Lamar University System
Lamar University at Orange'
1,487Lamar University at Port Arthur'
A l

11
Fall Headcount EnrollmentTexas Public Community Junior Colleges and Technical Institutes, 1983-1987
Institution 1983 1984 1985 1986 1987
Laredo Junior College 4,179 4,038 4,005 4,106 4,463Lee College 4.925 4,581 4,313 4,312 4,755McLennan Community College 4,296 4,509 4,282 4,664 5,158Midland College 3,350 3,501 3,491 3,659 3,744Navarro College 2,359 2,816 1,664 2,053 1,999Northeast Texas Community College ___ --- 1,347 1,614 1,558North Harris County College 10.222 10,954 11,286 11,342 11,719Odessa College 4,486 4,827 4,306 4,408 4,760Panola Junior College 1,099 1,140 1,017 1,158 1,281Paris Junior College 2,220 2,102 1,875 2,017 2,20Ranger Junior College 566 672 521 654 596San Jacinto College District
Central Campus 9.278 9,321 9,018 9,209 9,147North Campus 3,622 3,542 3,435 3,336 3,392South Campus 3,461 3,780 3,993 4,180 4,298South Plains College 3,451 3,532 3,405 3,517 4,044Southwest Texas Junior College 2,301 2,452 2,208 2,378 2,297Tarrant County Junior College DistrictNortheast Campus 11,535 11,009 10,029 10,178 10,445Northwest Campus 4,983 4,752 4,337 4,294 4,665South Campus 11,398 10,604 9,768 10,n68 9,822Temple Junior College 2,280 2,333 2,180 2,031 2,260Texarkana Community College 3,720 3,585 3,297 3,380 3,659Texas Southmost College 4,764 4,893 4,761 5,101 5,224Texas State Technical InstituteAmarillo Campus
1,051 973Harlingen Campus2,586 2,599Sweetwater Campus
657 816Waco Campus4,768 4,508The Victoria College 2,729 2,828 2,873 2,879 3,077Trinity Valley Community College 3,518 3,795 3,414 3,498 3,490Tyler Junior College 7,735 6,966 6,353 7,186 7,416Vernon Regional Junior College 1,413 1,484 1,339 1,459 1,705Weatherford College 1,607 1,564 1,388 1,522 1,695Western Texas College 1,213 1,263 946 1,135 1,111Wharton County Junior College 2,574 2,526 2,141 2,350 2,391
Totals Public Community Junior Collegesand Technical Institutes 302,102 300,652 1R9,532 311,147
'For funding purposes, these two lower-division centers are reported under community colleges
t

12
FALL HEADCOUNT ENROLLMENTTexas independent Senior Colleges and Universities, 1983-1987
Institution 1983 1984 1985 19d6 1987
Abilene Christian University 4,562 4,617 4,505 4,302 4,133Amber University 901 866 858 925 1,130American Technological University 522 492 518 568 518Austin College 1,162 1,173 1,198 1,175 1,231Baylor University 10,666 10,939 11,442 11,556 11,656Bishop College 1,189 1,107 987 946 301Concordia Lutheran College 465 463 444 455 465Dallas Baptist University 1,443 1,551 1,626 1,738 1,840East Texas Baptist University 806 714 705 691 716Gulf-Coast Bible College' --- 290 - --
Hardin- Simmons University 1,927 1,834 1,817 1,804 1,866Houston Baptist University 2,738 2,632 2,775 2,621 2,538Howard Payne University 1,067 818 851 980 1,105Huston-Tillotson College 502 569 524 520 502Incarnate Word College 1,416 1,350 1,296 1,575 1,906Jarvis Christian College 588 533 472 468 466LeTourneau College 1,038 89? 787 763 753Lubbock Christian College 1,000 1,038 1,030 1,041 1,048Mc Murry College 1,578 1,482 1,657 1,690 1,617Our Lady of the Lake University 1,758 1,685 1,695 1,780 ?,045Paul Quinn College 364 355 410 4164 509St. Edward's University 2,165 2,355 2,502 2,536 ? 668St. Mary's University 3,232 3,296 3,298 3,560 3, '11 8Schreiner College 488 48r 518 308 !)1'4Southern Methodist University 9,333 9,264 9,049 9,019 S,7E4Southwestern Adventist College 708 683 683 795 846Southwestern Christian College, --- 222 250 282Southwestern University 998 1,001 1,081 1,117 1,041Texas Christian University 6,878 6,747 6,925 6,916 7,105Texas College 619 573 512 47E, 450Texas Lutheran College 1,:. 8 1,376 1,296 1,340 1,346Texas Wesleyan College 1,629 1,310 1,413 1,495 1,504Trinity University 3,027 2,850 2,759 2,772 2,380University of Dallas 2,594 2,466 2,553 2,540 2,555University of Mary Nardi, 3aylo, 1,230 1,178 1,334 1,331 1,337University of St. Thomas 2,068 1,983 1,311 1.679 1,625Wayland Baptist University 1,685 1.(07 1,799 1,827 1,945Wiley College 557 546 481 435 418William Marsh Rice University 4,004 4,048 4,061 4,095 3,867
Subtotals: Independent Senior Colleges and Universities 78,185 77,277 77,894 78,755 78,900
'Ceased operation in 1985'Became a senior institution in fall 1985
t, 0

13
Fall Headcount EnrollmentTexas Independent Senior Colleges and Universities, 1983-1987
Institution 1983 1984 1985 1986 1987
Independent Medical, Dental, Nursing, and Allied Health UnitsBaylor College of Dentistry (Dallas)
Dental School 512 490 463 420 396Advanced Education 56 58 52 55 59School of Dental Hygiene 63 58 57 48 43
Baylor College of Medicine (Houston)Medical School 672 674 671 662 651School of Graduate Sciences 138 144 163 183 200Academics 74 75 78 76 64
Subtotals. Independent Medical, Dental, Nursing,and Allied Health Units 1,515 1,499 1,484 1,444 1,413
Totals. Indeper.dent Senior Institutions 79,700 78,776 79,378 80,199 80,313

14
FALL HEADCOUNT ENROLLMENTTexas Independent Junior Colleges, 19831987
Institution 1983 1984 1985 1986 1987
Jacksonville College 322 240 235 209 249Lon Morris College 325 300 281 282 353Southwestern Assemblies of God Junior College 435 426 635 701 622Southwestern Christian College' 297 272 --- --- ---
Totals: independent Junior Colleges 1,379 1,238 1,151 1,192 1,224
'Became r senior institution in fall 1985.

15
HEADCOUNT ENROLLMENT BY CLASSIFICATION, ETHNIC ORIGIN, SEXTexas Public Universities, Fall 1987
TOTAL
White Black Hispanic Asian Indian Alien Total
Institution Male Female Male Female Male Female Male Female Male Female Male Female Male Female
East Texas State University 2,450 3,152 245 350 71 97 25 20 19 22 213 99 3,023 3,740East Texas State UniversityCenter at Texarkana 314 664 34 76 4 2 3 2 3 6 6 363 751
Lamar University SystemLamar University at Beaumont 4,099 4,444 760 1,233 157 129 122 70 18 17 254 o8 5,410 5,961
Midwestern State University 1,882 2,320 85 113 87 86 55 37 9 13 29 7 2,147 2,576Pan American University 707 949 30 45 3,268 4,538 27 17 1G 10 23 8 4,065 5,567
Pan American University atBrownsville 129 218 5 6 334 540 1 1 2 1 3 472 768
Stephen F. Austin State University 5,197 5,995 253 269 110 133 36 45 12 9 34 18 5,642 6,469Texas A&M University System
Prairie View A&M University 201 285 2,001 2,345 49 28 33 10 --- 1 260 94 2,544 2,763Tarleton State University 2,542 2,430 70 40 66 48 7 6 3 8 13 9 2,701 2,541Texas A&M University 18,445 13,187 506 443 1,367 922 556 267 24 26 1,342 298 22,240 15,143Texas A&M University at Galveston 304 186 2 . 16 11 8 1 --- 1 18 4 348 203
Texas Southern University 134 116 2,040 3,185 169 172 42 20 6 6 846 270 3,237 3,769Texas State University System
Angelo State University 2,265 2,507 145 104 315 339 25 16 6 5 47 28 2,803 2,999Sam Houston State University 4,412 4,655 389 486 257 206 28 33 10 13 125 71 5,221 5,464Southwest Texas State University 7,898 8,540 406 439 1,173 1,165 84 65 22 24 169 54 9,752 10,287Sul Ross State University 580 501 68 17 257 252 1 1 3 2 16 5 925 778
Uvalde Study Center 61 110 3 4 81 139 --- 1 1 1 2 --- 148 255Texas Tech University 11,002 9,433 297 274 803 669 198 98 23 24 569 174 12,892 10,672Texas Woman's University 430 5,768 43 1,052 31 471 6 88 5 26 61 327 576 7,732The University of Texas System
The University of Texas at Arlington 9,585 7,876 677 823 587 470 1,010 536 49 48 873 226 12,781 9,979The University of Texas at Austin 18,914 17,185 677 967 2,372 2,126 1,277 1,008 51 39 2,289 838 25,580 22,163The University of Texas at Dallas 3,171 3,136 209 13...s 111 124 275 183 8 11 262 92 4,036 3,699The University of Texas at El Paso 2,451 2,736 206 - 78 3,460 3,952 87 61 25 15 661 224 6,890 7,166The University of Texasof the Permian Basin 725 989 15 25 67 98 9 10 2 1 8 7 826 1,130
The University of Texas atSan Antonio 4,113 4.641 194 222 1,591 1,673 184 135 9 16 71 30 6,162 6,717
The University of Texas e.t Tyler 1,235 2,092 64 170 11 19 14 5 5 14 35 17 1,364 2,317University of Houston System
University of Houston 10,370 9,972 844 1,303 1,022 1,023 1,259 1, ^83 60 35 1,376 560 14,931 13,976University of Houston-Clear Lake 2,343 3,368 163 180 175 224 136 120 8 10 66 30 2,891 3,932University of Houston-Downtown 1,701 1,277 687 1,150 607 609 522 338 9 10 220 100 3,746 3,484University of HoustoVictoria 275 659 11 31 28 51 2 2 3 --- 2 2 321 745
University of North Texas 8,395 9,903 517 834 384 371 60 77 37 29 1,142 630 10,535 11,844University System of South Texas
Corpus Christi State University 879 1,584 30 43 448 610 23 18 8 11 8 8 1,390 2,274Laredo State University 51 71 13 ... 250 464 2 1 --- 1 42 20 358 557Texas A&I University 952 1,065 i 18 82 1,351 1,529 86 22 4 3 158 23 2,669 2,724
West Texas Staie University 2,257 2,815 105 68 158 170 28 31 7 18 54 31 2,609 3,133
Totals 130,469 134,829 11,912 16,710 21,237 23.460 6,231 4,426 460 472 11,295 4,381 181,604 184,278

I
16
Headcount Enrollment by Classification, Ethnic Origin, SexTexas Public Universities, Fall 1987
FRESHMAN
White Black Hispanic Asian Indian Alien Total
Institution Male Female Male Female Male Female Male Female Male Female Male Female Male F,-,1ale
East Texas State University 523 563 39 f,,6 12 14 3 2 3 2 25 9 605 646Lamar University System
Lamar University at Beaumont 1,629 1,671 371 607 68 48 38 24 5 9 21 15 2,132 2,374Midwestern State University 617 715 23 39 35 28 14 8 3 3 2 1 694 794Pan American Uni' 'rsity 250 291 9 12 1,519 1,967 5 4 4 4 6 2 1.793 2,280Stephen F. Austin State University 1,619 2,035 69 84 47 43 20 21 1 6 1 5 1,757 2,194Texas A&M University System
Prairie View A&M University 53 57 689 826 27 11 4 1 --- 51 28 824 923Tarleton State University 1,003 822 41 10 39 19 4 1 2 5 3 1,089 860Texas A&M University 4,183 3,409 164 156 410 291 154 72 5 7 83 21 4,999 3,956Texas A&W University at Galveston 102 75 2 6 3 2 1 --- --- 4 2 116 81-exas Southern University 16 10 770 1,112 40 36 12 7 1 1 84 35 923 1,201
Texas State University SystemAngelo State University 768 837 58 43 124 154 12 7 2 1 2 2 967 1,044Sam Houston State University 1,305 1,342 126 184 74 46 14 4 1 2 20 6 1,540 1,584Southwest Texas State University 2,171 2,406 98 114 313 299 16 11 11 5 9 12 2,618 2,847Sul Ross State University 177 126 31 8 119 78 1 1 1 329 213Texas Tec,ii University 3,428 3,099 132 146 335 273 54 31 6 9 28 15 3,983 3,573Texas Woman's University 14 617 2 275 2 104 4 --- 5 2 34 20 1,039The University of Texas SystemThe University of Texas a. Arlington 1,828 1 525 134 173 141 118 161 135 12 13 57 27 2,333 1,951The University of Texas at Austin 3,421 3,213 162 228 517 454 374 280 11 8 136 52 4,621 4,235The University of Texas at El Paso 641 658 76 57 1,233 1.418 28 12 6 6 136 80 2,120 2,231The University of Texas
of the Permian Basin 26 52 2 3 8 11 I 36 67The University of Texas atSan Antonio 1,063 1,131 50 61 430 462 47 32 1 6 12 8 1,603 1,700University of Houston System
University of Houston 1,580 1,403 228 331 261 244 268 257 11 6 128 56 2,476 2,297University of Houston-Downtown 552 448 301 589 310 344 245 178 1 6 66 40 1,475 1,605University of North Texas 1,664 1,950 122 262 89 79 9 21 12 8 87 72 1,983 2,392University System of South TexasTexas A8,1 University 237 269 51 39 437 524 11 6 1 2 8 745 840West Texas State University 590 686 39 21 64 65 7 4 2 5 8 2 710 783
Totals 29,460 29,410 3,789 5,436 6,660 7,133 1,503 1,123 102 120 977 528 42,491 43,750

17
Headcount Enrollment by Classification, Ethnic Origin, SexTexas Public Universities, Fall 1987
SOPHOMORE
White Black Hispanic Asian Indian Alien Total
Institution Male Female Male Female Male Female Male Female Male Female Male Female Male
East Texas State University 309 346 50 48 12 5 4 4 1 13 6 388Lamar University System
Lamar University at Beaumont 828 757 141 199 26 23 24 15 5 3 9 3 1,033Midwestern State University 359 437 19 25 13 21 9 10 1 2 6 3 407Pan American University 92 144 4 10 583 809 5 1 2 5 --- 690
Pan American University atBrownsville 1 - - - --- --- 1.-- 1
Stephen F. Austin State University 1,097 1,208 54 53 19 28 4 4 3 1 2 1,178Texas A&M University System
Prairie View A&M University 40 63 373 453 8 4 8 3 62 17 491Tarleton State University 451 462 6 2 11 11 1 2 1 2 1 471Texas A&M University 2,883 2,344 89 84 215 158 101 50 3 2 72 16 3,363Texas A&M Universty at Galveston 56 36 --- 8 5 -- 1 4 1 68
Texas Soutnern University 7 4 351 481 23 26 11 3 1 i 101 33 494Texas State University System
Angelo State Univeisity 468 525 24 12 63 73 4 4 1 4 5 5 565Sam Houston State University 952 782 69 91 51 39 6 11 2 2 11 9 1,091Southwest Texas State University 1,514 1,538 64 67 204 230 12 8 2 7 14 4 1,81CSul Ross State University 79 90 9 2 37 118 --- 1 --- - 1 --- 126
Uvalde Study Center --- 2 --- --- 2 1 .. --- --- ---Texas Tech University 1,968 1,788 53 31 145 130 36 22 4 4 36 11 2,242Texas Woman's University 17 471 2 152 59 8 2 3 28 22The University of Texas System
The University of Texas at Arlington 1,475 1,176 135 173 109 81 158 104 4 7 65 23 1,946The University of Texas at Austin 2,973 2,762 138 177 375 355 224 205 12 7 87 44 3,809The University of Texas at El Paso 374 415 31 23 629 701 8 13 2 2 70 35 1,114The University of Texasof the Permian Basin 46 106 1 2 6 16 2 1 53
The University of Texas atSan Antonio 681 790 37 41 275 338 25 33 1 3 9 4 1,028
University of Houston SystemUniversity of Houston 1,360 1,249 163 203 160 172 222 181 5 5 111 66 2,021University of Houston-Downtown 335 257 135 225 101 115 87 60 1 1 43 11 702University of HoustonVictoria 6 30 --- 2 --- --- --- 6
University of North Texas 1,502 1,560 130 163 76 76 13 13 6 5 100 64 1,827University System of South Texas
Corpus Christi State University 2 1 --- 1 1 1 --- .
Texas A&I University 160 168 22 14 203 258 6 1 14 2 405West Texas State University 372 402 14 6 26 30 7 8 2 1 3 3 424
Totals 20,407 19,913 2,114 2,737 3,379 3,816 976 766 56 63 847 397 27,779
, 0
Female
410
1,000498965
-.-1,295
540479
2,65443
553
623934
1,854141
5
1,986720
1,5643,5501,189
127
1,209
1,87666932
1,881
2
443450
27,692

18
Headcount Enrollment by Classification, Ethnic Origin, SexTexas Public Universities, Fall 1987
JUNIOR
White Black Hispanic Asian Indian Alien Total
Institution Male Female Male Female Male Female Male Female Male Female Male Female Male Female
East Texas State University 393 416 56 36 10 15 1 4 6 17 14 481 487East Texas State University Centerat Texarkana 102 227 10 20 1 2 1 1 114 250
Lamar University SystemLamar University at Beaumont 550 674 115 154 26 19 23 7 3 2 29 11 746 867
Midwestern State University 275 404 18 19 14 13 9 5 3 3 6 1 325 445Pan American University 100 122 6 5 453 602 3 2 1 1 5 1 568 733Pan American University at
Brownsville 19 31 1 1 80 156 1 101 188Stephen F. Austin State University 1,033 1,030 65 43 17 19 3 12 3 1 3 1 1,124 1,106Texas A&M University SystemPrairie View A&M University 33 60 350 399 8 6 2 2 32 17 425 484Tarleton State University 3/2 367 6 7 4 7 --- --- --- --- 382 381Texas A&M University 3,851 2,813 92 87 263 190 102 4' 5 4 85 29 4,398 3,167Texas A&M University at Galveston 57 39 --- -.- 3 3 --- 4 --- 64 42Texas Southern University 6 3 249 416 13 20 4 5 1 2 100 33 373 479Texas State University SystemAngelo State University 416 428 26 28 46 57 4 2 1 --- 5 3 498 518Sam Houston State University 720 725 95 77 55 29 2 4 3 12 8 884 846Southwest Texas State University 1,461 1,523 106 88 235 239 13 10 4 3 39 10 1,858 1,873Sul Ross State University 81 77 14 4 9 44 --- --- 1 --- 135 125Uvalde Study Center 8 14 --- 1 2:: 50 --- --- --- 30 65Texas Tech University 1,779 1,410 48 37 121 102 22 10 3 5 43 13 2,016 1,577Texas Woman's University 18 641 1 141 3 49 11 3 2 27 24 872The University of Texas SystemThe University of Texas at Arlington 1,664 1,429 139 194 120 107 173 83 11 12 50 18 2,157 1,843The University of Texas at Austin 3,120 2,970 120 182 432 359 229 178 6 3 118 57 4,025 3,749The University of Texas at Dallas 1,091 1,159 98 83 46 64 80 67 3 27 15 1,342 1,391The University of Texas at El Paso 363 392 33 37 515 579 13 12 2 2 63 25 989 1,047The University of Texasof the Permian Basin 180 27D 5 6 18 31 2 2 1 2 1 208 315The University of Texas atSan Antonio 783 953 43 48 321 308 34 25 3 4 12 2 1,196 1,340The University of Texas at Tyler 663 1,129 35 101 4 10 5 2 3 4 14 10 724 1,256University of Houston System
University of Houston 1,563 1,510 142 207 176 185 215 209 12 1 155 95 2,263 2,207University of Houston-Clear Lake 437 704 30 33 32 52 11 27 1 2 10 4 521 822University of Houston-Downtown 380 277 122 162 95 73 78 40 3 1 44 25 722 578University of Houston-Victoria 57 142 4 8 12 16 1 --- 1 --- --- 75 166University of North Texas 1,435 1,719 89 153 74 67 10 16 8 5 133 65 1,749 2,025University System of South TexasCorpus Christi State University 210 358 9 11 151 174 6 2 2 3 2 3 380 551Laredo State University 5 7 --- --- 52 121 - --- 2 5 59 133Texas AEI University 140 132 15 7 221 204 14 4 17 1 407 348West Texas State University 447 583 19 15 28 33 3 4 3 8 6 505 644
Totals 23,812 24,743 2,161 2,810 3,707 4,003 1,065 785 82 78 1,041 501 31,868 32,920

19
Headcount Enrollment by Classification, Ethnic Origin, SexTexas Public Universities, Fall 1987
institution
SENIOR
White Black Hispanic Asian Indian Alien Total
Male Female Male Female Male Female Male Female Male Female Male Female Male Female
East Texas State University 431 440 59 70 13 8 4 3 2 4 24 8 533 533East Texas State UniversityCenter at TP,,arkana 74 182 12 16 1 1 1 1 1 2 90 201Lamar University System
Lamar University at Beaumont 706 734 104 189 25 24 26 18 4 1 53 11 918 977Midwestern State University 366 453 13 20 15 13 13 9 1 4 6 1 414 500Pan American University 118 145 7 4 438 715 2 3 2 3 5 3 572 873Pan American University atBrownsville 27 33 2 98 171 1 3 128 207Stephen F. Austin State University 965 944 40 52 15 19 4 7 2 2 5 1,031 1,024Texas A&M University System
Prairie Vth. A&M University 23 15 428 385 3 3 10 1 1 92 24 556 429Tarleton State University 434 404 7 7 9 7 1 3 1 --- 451 422Texas A&M University 4,645 2,916 71 70 325 182 128 63 7 8 156 44 5,332 3,283Texas A&M University at Galveston 83 33 --- --- 2 -- 2 5 --- 92 33Texas Southern University 9 5 332 494 15 21 6 4 1 223 84 586 608Texas State University SystemAngelo State University 420 445 22 17 59 42 1 2 2 --- 4 3 508 509Sam Houston State University 948 912 77 87 45 42 3 6 -,. 2 29 19 1,105 1,068Southwest Texas State University 2,069 1,998 104 119 340 304 19 9 2 5 60 18 2,594 2,453Sul Ross State University 112 77 11 1 45 46 --- --- 2 --- 170 124Uvalde Study Center 6 21 --- 15 40 --- --- --- --- 21 63Texas Tech University 2,157 1 539 50 39 149 85 47 22 6 1 85 3S 2,494 1,781Texas Woman's University 36 d68 6 170 3 96 16 4 3 57 48 1,211The University of Texas SystemThe University of Texas. at Arlington 2.586 1,986 189 198 152 114 314 133 14 10 148 29 3,403 2,470The University of Texas at Austin 4,739 4,541 148 231 694 654 308 275 10 12 419 175 6,318 5,888The University of Texas at Dallas 572 609 34 23 18 22 50 36 2 5 19 9 695 704The University of Texas at El Paso 587 593 46 32 740 845 18 12 10 4 160 42 1,561 1,528The Um% sity of Texasof the F -man Basin 167 181 3 4 17 18 3 3 1 190 207The University of TexasSan Antonio 1,154 1,113 54 48 454 401 71 35 2 3 24 6 1,759 1,606The University of Texas at Tyler 58 105 6 4 --- 1 1 --- 4 --- 2 65 116University of Houston System
University of Houston 2,039 1,847 172 245 212 191 340 270 14 13 297 123 3,074 2,689University of Houston-Clear Lake 634 875 39 41 53 52 20 32 2 3 10 4 758 1,007University of Houston-Downtown 319 204 102 165 86 66 91 49 1 2 61 23 660 509University of Houston-Victoria 66 162 --- 7 7 12 1 --- --- --- --- 1 74 182University of North Texas 1,876 1,943 113 167 85 86 21 14 4 6 221 99 2,320 2,315University System of South TexasCorpus Christi State University 223 381 9 15 135 180 6 7 2 2 2 2 377 587Laredo State Unive sity 11 14 --- - 94 130 --- --- 3 2 108 146Texas A &l University 205 156 22 15 322 263 30 5 2 57 4 638 443West Texas State University 449 564 19 20 27 30 5 10 2 5 10 10 512 639
Totals 29,344 27,498 2,301 2,957 4 711 4,883 1,546 1,047 98 106 2,185 844 40,155 37,335
' ik U
20
Headcount Enrollment by Classification, Ethnic Origin, SexTexas Public Universities, Fall 1987
POST-BACCALAUREATE
White Black Hispanic Asian Indian Alien Total
Institution Male Female Male Female Male Female Male Female Male Female Male Female Male Female
Lamar University SystemLamar University at Beaumont 243 390 24 69 10 10 6 2 1 1 12 4 296 476Midwestern State University 68 130 4 6 --- 4 3 1 1 73 144Pan American University 64 119 8 154 219 3 3 1 2 224 34E'Pan American University atBrownsville . 42 64 1 3 77 96 1 1 122 163Stephen F. Austin State University 76 92 1 6 2 1 1 1 80 100Texas A&M University System
Prairie View A&M University 16 37 38 68 1 2 57 105Texas A&M University 300 365 17 15 19 18 4 7 15 4 355 409Texas A&M University c Galveston 6 3 1 1 1 8 4Texas Southern University 1 1 19 48 1 1 19 6 40 56Texas State University SystemAngelo State UnkvIrsity z" 58 2 2 4 3 1 --- 48 63Sam Houston State University 187 330 7 23 13 14 1 2 1 5 2 213 372Southwest Texas State University 199 373 8 18 22 29 6 2 1 5 1 240 424Sul Ross State University 54 57 --- 1 4 11 --- 1 59 69Uvalde Study Center 25 45 1 1 25 29 2 53 75Texas Tech University 365 632 8 10 16 47 4 1 1 18 12 411 703Texas Wor .an's University 14 137 3 15 1 11 3 4 16 22 182The University of Texas SystemThe University of Texas at Arlington 683 619 59 53 31 25 65 27 2 3 15 9 855 736The University of Texas at Dallas 696 743 49 32 25 24 85 r, I 5 1 9 4 869 855The University of Texas at El Paso 42 31 1 36 24 2 2 4 1 84 59The University of Texasof the Permian Basin 114 143 3 5 8 2 1 1 3 1 124 157The University of Texas atSan Antonio . 121 256 4 12 34 72 3 5 162 345The University of Texas at :"yler 437 691 21 56 6 8 7 3 2 4 14 3 487 765University of Houston System
University of Houston 1,076 1,202 73 152 68 78 89 63 7 2 18 20 1,331 1,517University of Houston-Clear Lake 71 58 5 2 8 5 '1 13 --- 2 95 80University of Houston-Downtown 115 91 27 9 15 11 21 11 3 6 1 187 123University of HoustonVictolia 87 189 2 12 6 16 --- 1 2 2 1 99 219University System of South TexasCorpus Christi State University 31 31 10 10 1 42 41Laredo State University 4 1 16 16
1 21 17West Texas ,state University 72 105 4 2 3 2 2 1 80 111
Totals 5,250 6,993 377 625 609 793 315 200 26 17 160 91 6,737 8,719
4
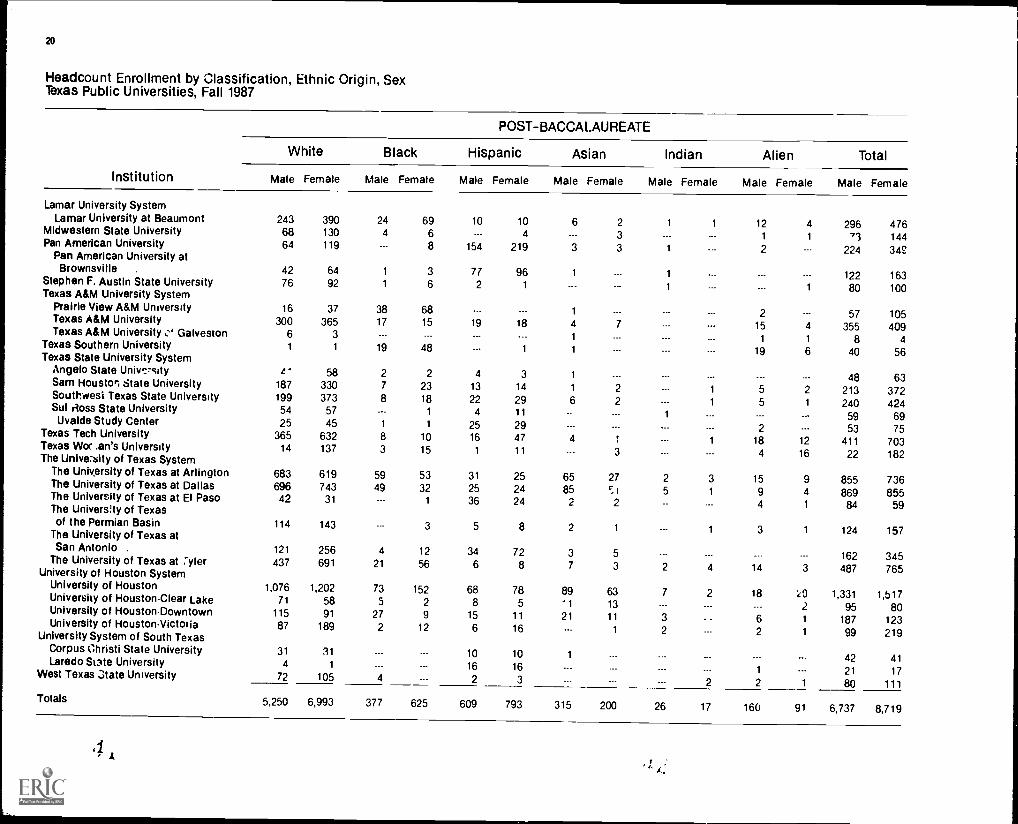
21
Headcount Enrollment by Classification, Ethnic Origin, SexTexas Public Universities, Fall 1987
MASTER'S
White Black Hispanic Asian Indian Alien Total
Institution Male Female Male Female Male Female Male Female Male Female Male Female Male Female
East Texas State University 625 1,216 33 131 23 52 11 10 10 6 122 58 824 1,473East Texas State UniversityCenter at Texarkana 138 255 12 40 2 2 2 1 4 3 159 300Lamar University System
Lamar University at Beaumont 139 218 5 15 2 5 5 4 1 113 23 264 266Midwestern State University 188 174 7 4 10 7 10 2 1 1 7 -- 223 188Pan American University 83 128 4 6 121 226 9 5 1 2 218 367Fan American University atBrownsville 40 90 1 2 79 117 1 --- 120 210Stephen F. Austin State University 404 684 24 31 10 23 4 1 2 23 8 467 747Texas A&M University System
Prairie View A&M University 36 53 123 214 3 4 8 3 21 8 191 282Tarleton State University 282 375 10 14 3 4 1 --- 1 1 11 5 308 399Texas A&M University 1,528 830 36 14 79 46 38 22 2 2 391 95 2,074 1,009Texas Southern Unimrsity 34 74 182 485 12 47 4 1 1 261 60 494 667Texas State University SystemAngelo State University 152 214 13 2 19 10 ..."' 1 --- --- 31 15 217 242Sam Houston State University 279 558 15 23 19 36 2 6 4 3 42 27 361 653Southwest Texas State University 484 702 26 33 59 64 18 25 3 3 42 9 632 836Sul Ross State University 77 74 3 1 13 25 1 --- 1 1 11 5 106 106Uvalde Study Center 22 28 2 --- 19 18 --- --- 1 1 --- --- 44 47Texas Tech University 608 497 5 6 15 20 20 9 1 1 193 58 842 591Texas Woman's University 264 2,560 23 247 19 136 3 39 5 11 26 1,6 340 3,119The University of Texas SystemThe University of Texas at Arlington 1,163 1,017 13 26 29 24 102 46 5 3 341 106 1,653 1,222The University of Texas at Austin 2,374 1,913 54 69 149 139 71 35 7 5 719 276 3,374 2,437The University of Texas at Dallas 631 501 11 14 14 10 48 24 1 1 86 38 791 588The University of Texas at El Paso 436 645 20 28 307 385 18 10 5 1 222 41 1.008 1,110The University of Texasof the Permian Basin 192 232 4 7 13 14 2 2 1 3 2 215 257The University of Texas atSan Antonio 311 398 6 12 77 92 4 5 2 14 10 414 517The University of Texas at Tyler 77 167 2 9 1 --- 1 2 7 2 88 180University of Houston System
University of Houston 1,637 1,811 32 113 52 84 89 63 7 5 373 135 2,190 2,211University of HoustonClear Lake 1,201 1,731 89 104 82 115 94 48 5 5 ,46 20 1,517 2,023Universil of Houston-Victoria 59 136 r 4 3 5 --- 1 --- --- --- 67 146University of North Texas ;,300 2,001 48 63 53 49 5 6 5 2 320 229 1,731 2,350University System of South TexasCorpus Christi State University 413 813 12 17 151 245 9 9 4 6 4 3 593 1,093Laredo State Universe y 31 49 13 88 197 2 1 -- 1 36 13 170 261Texas A&I University 208 339 8 7 157 259 25 6 1 1 62 13 461 625West Texas State University 327 475 10 6 11 9 6 5 1 2 23 9 378 506
Totals 15,743 20,958 851 1,747 1,694 2,469 614 390 78 65 3,554 1,399 22,534 27,028
.13

22
Headclunt Enrollment by Classification, Ethnic Origin, SexTexas Public Universities, Fall 1987
DOCTORAL
White Rack Hispanic Asian Indian Alien Total
Institution Male Fema::: Male Female Male Female Male Female Male Female Male Female Male Female
East Texas State University 169 171 8 9 1 3 2 1 3 12 4 192 191Lamar University SystemLamar University at Beaumont 4 --- 17 1 21 1flodydetten ....'...rie University 9 7 1
1 11 7Stephen F. Austin State University 3 2 1 1 1 5 3Texas A&M University SystemTexas A&M University 1,055 510 37 17 56 37 29 9 2 3 540 89 1,719 665Texas Southern University 7 8 42 59 2 1 2 36 9 89 77Texas State University SystemSam Houston State University 21 6 1 --- 6 27 7Texas Tech University 329 237 2 13 8 1 ' 1 166 30 523 280Texas Woman's University 67 474 6 52 3 16 3 7 1 21 39 100 589The University of Texas SystemThe University of Texas at Arlington 186 124 8 6 5 1 37 8 1 197 14 434 153Tne University of Texas at Austin 1,509 1,242 29 44 93 91 62 27 4 2 801 227 2,498 1,633The University of Texas at Dallas 181 124 17 1 8 4 12 5 1 121 26 339 161The University of Texas at El Paso
iniversity of Houston System8 2 --- --- 5.- --- 6 --- 14 2
University of Houston 400 366 10 19 22 14 12 15 2 2 281 61 727 477University of North Texas 618 730 15 26 7 14 2 7 2 3 281 101 925 881University System of South TexasTexas A &l University 2 1 11 21 3 13 25
Totals 4,568 4,004 173 236 221 210 176 82 12 15 2,487 605 7,637 5,152

23
Headcount Enrollment by Classification, Ethnic Origin, SexTexas Public Universities, Fall 1987
SPECIAL-PROFESSIONAL
Ins 'ution
White Black Hispanic Asian Indian Alien Total
Male Female Male Female Male Female Male Female Male Female Male Female Male Female
Texas Southern University 54 11 95 90 64 20 2 1 2 22 5 238 128Texas Tech University 368 171 1 3 9 4 1 2 3 --- 381 181The University of Texas System
The University of Texas at Austin 778 544 26 36 112 74 9 8 1 2 9 7 935 671University of Houston SystemUniversity of Houston 715 584 24 33 71 55 24 25 2 1 13 A 849 702
Totals 1.915 1,310 146 162 256 153 36 33 6 8 44 16 2,403 1,682
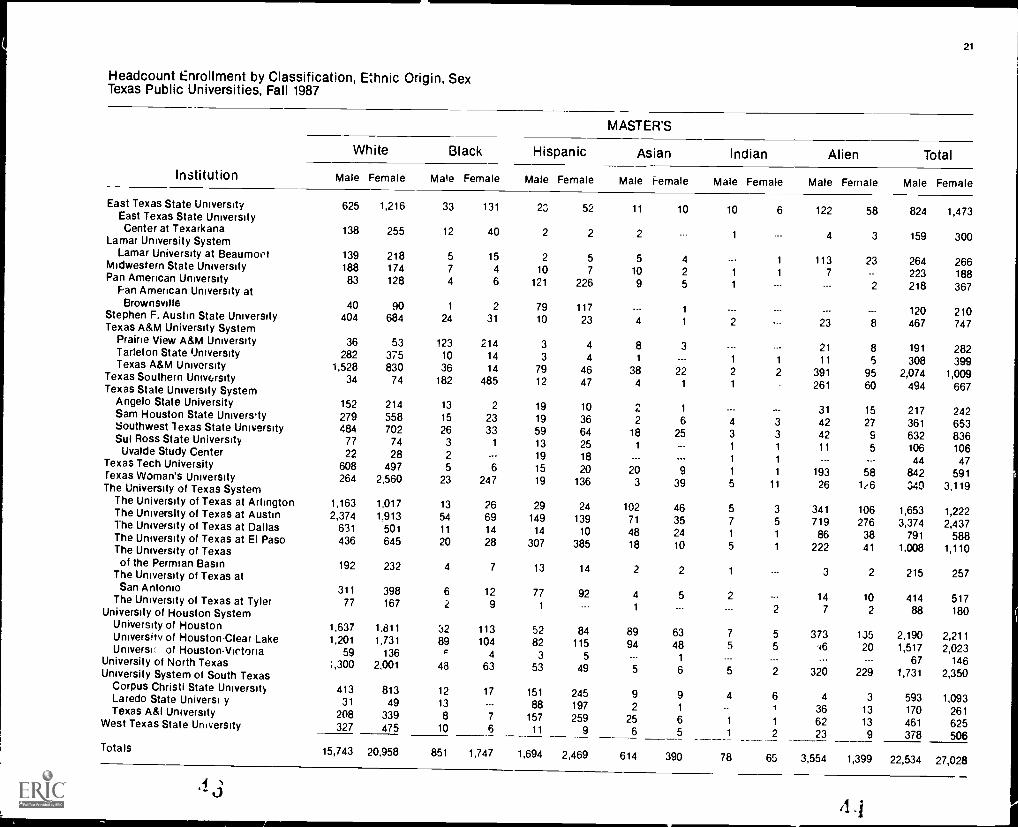
24
HEADCOUNT ENROLLMENT BY CLASSIFICATION, ETHNIC ORIGIN, SEXTexas Public Community Junior Colleges and Technical Institutes, Fall 1987
TOTAL.
White Black Hibpanic Asian Indian Alien Total
Institution Male Female Male Female Male Female Male Female Male Female Male Female Male Female
Alamo Community College DistrictPalo Alto College 383 494 67 63 532 967 16 9 4 2 - 1 1,002 1,536
San Antonio College 4,656 5,642 543 696 3.929 5 139 147 182 40 41 64 47 9,379 11,747
St. Philip's College 1,407 732 726 807 1,421 819 46 34 27 9 26 9 3,653 2,410
Alvin Community College 1,493 1,803 349 91 268 178 19 16 7 6 11 2 2,147 2,096
Amarillo College 1,729 2,724 55 105 153 272 101 55 16 13 7 6 2,061 3,175
Angelina College 819 1,364 109 250 21 29 8 12 4 2 961 1,657
Austin Community College 6,988 7,735 615 795 1,425 1.430 348 294 39 40 129 67 9,544 10,361
Bee County CollegeBlinn College
4092,235
6062,096
20191
36157
414210
684146
3
16
17
1568
64
--.
72 28 7322,7321,3492,446
Brazosport College 1,354 1,C 19 135 122 165 169 20 21 4 4 4 5 1,682 1,670
Central Texas College 1,550 1,914 389 533 215 213 60 76 13 20 43 22 2,270 2.778
Cisco Junior College 728 689 89 43 81 47 4 6 --- 2 --- 1 902 788
Clarendon College 269 392 15 13 10 15 1 1 3 1 298 422
College of the Mainland 975 1,413 139 355 150 180 22 24 7 7 19 18 1,312 1,997
Collin County Community CollegeDistrict 1,842 2,695 32 58 48 112 39 42 7 12 5 4 1,973 2,923
Cooke County 0-!'ege 849 1.351 43 40 33 29 9 12 9 9 42 17 985 1,458
Dallas County Community CollegeDistrictBrookhaven College 2,392 3,413 179 237 233 224 209 160 15 16 38 40 3,066 4,090
Cedar Valley College 690 814 445 683 64 77 13 11 3 5 --- 1 1,215 1,591
Eastfield College 3,235 3,722 321 500 317 322 141 68 150 86 45 28 4.209 4,726
El Centro College 818 1,493 721 1,643 206 288 54 75 8 18 41 50 1,848 3,567
Mountain View College 1,691 1,587 448 674 355 357 115 63 12 23 18 4 2,639 2.708
North Lake College 2,155 2,337 214 244 213 156 151 82 13 15 29 15 2.775 2,849
Richland College 4.945 5,613 376 474 287 358 403 316 22 31 63 42 6.096 6,834
Del Mar College 1,911 2,749 92 193 1,835 2,478 37 39 14 23 12 11 3,901 5,493
El Paso County Community College 1,378 1.708 343 264 4,092 5,950 54 64 26 43 78 40 5,971 8,069
Frank Phillirs College 304 496 13 12 5 22 3 5 --- 13 325 548
Galveston College 397 772 83 251 120 196 22 28 1 10 12 632 1.260
Grayson County College 1,318 1,596 66 77 19 26 4 10 14 10 . 1,421 1,719
Hill Junior College 433 636 57 45 25 21 1 2 2 1 3 2 521 707
Houston Community College 5,025 7,750 1,145 2,808 919 1,386 762 813 13 22 199 183 8,063 12,962Howard County Junior College District
Howard College at Big Spring 429 564 36 41 91 139 6 11 2 5 1 565 760
Southwest Collegiate Institutefor the Deaf 47 30 6 9 19 7 3 1 76 46
Kilgore College 1,546 2,173 201 310 21 29 10 9 1 3 1 1 1,780 2,525Lamar University System
Lamar University at Orange 298 550 19 78 7 14 2 1 1 3 2 327 648Lamar University at Port Arthur 347 604 99 315 34 51 14 13 1 4 5 500 987
41J

25
Headcount Enrollment by C'assification, Ethnic Origin, SexTexas Public Community Junior Colleges and Technical Institutes, Fall 1987
TOTAL
White Black Hispanic Asian Indian Alien Total
Institution Male Female Male Female Male Female Male Female Male Female Male Female Male Female
Laredo Junior College 128 171 3 6 1,596 2,378 5 5 --- 1 86 84 1,818 2,645Lee College 1,785 1,632 562 213 322 179 12 16 13 4 10 7 2,704 2,051McLennan Community College 1,566 2,561 178 489 126 172 14 29 2 5 12 4 1,898 3,260Midland College 1,301 1,694 72 102 224 270 18 23 3 5 18 14 1,636 2,108Navarro College 598 903 184 156 33 29 60 31 3 1 --- 1 878 1,121Northeast Texas Community College 466 967 19 83 6 7 --- --- 2 8 --- --- 493 1,065North Harris County College 3,982 5,743 193 431 398 498 208 176 11 18 32 29 4,824 6,895Odessa College 1,606 1,992 110 140 387 445 33 22 5 13 6 1 2,147 2,613Panola Junior College 418 681 70 95 5 5 2 1 1 1 --- 2 496 785Paris Junior College 794 1,140 76 151 14 12 6 4 6 16 25 25 921 1,348Ranger Junior College 198 156 139 28 58 12 --- --- --- 1 2 2 397 199San Jacinto Junior College DistrictCentral Campus 3,231 3,794 129 314 437 493 121 105 10 17 349 147 4,277 4,870North Campus 1,125 1,301 173 264 191 201 47 46 9 7 17 11 1,562 1,830South Campus 1,498 1,825 108 141 217 257 98 109 7 3 21 14 1,949 2,349South Plains College 1,391 1,612 101 168 326 371 18 14 5 8 22 8 1,863 2,181Southwest Texas Junior College 430 487 19 23 493 820 8 5 1 --- 9 2 960 1,337Tarrant County Junior College DistrictNortheast Campus 3,986 5,245 154 233 236 261 143 122 18 27 14 6 4,551 5,894Northwest Camous 1,951 1,907 109 80 255 240 47 43 6 14 11 2 2,379 2,286South Campus 3,570 3,912 545 858 325 300 164 99 13 14 14 8 4,631 5,191Temple Junior College 766 1,052 78 145 94 101 4 6 --- 4 6 4 948 1,312Texarkana Community College 1,269 1,971 119 245 19 11 4 1 4 3 8 5 1,423 2,236Texas Southmost College 242 380 3 2 1,792 2,642 6 11 3 3 74 66 2,120 3,104Texas State Technical InstituteAmarillo Campus 580 207 20 16 81 28 29 2 7 3 717 256Harlingen Campus 240 171 3 3 1,365 810 3 3 --- 1 1,611 988Sweetwater Campus 425 211 21 19 87 37 7 6 3 --- 543 273Waco Campus 3,197 475 340 89 323 36 30 2 13 3 --- --- 3,903 605The Victoria College 808 1,582 38 74 204 338 9 11 4 4 2 3 1,065 2,012Trinity Valley Community College 1,158 1,594 384 156 96 43 7 6 7 4 28 7 1,600 1,810Tyler Junior College 2,694 3,478 344 668 47 47 5 15 4 16 62 36 3,156 4,260Vernon Regional Junior College 597 807 67 93 56 52 9 8 6 7 1 2 736 969Weatherford College 621 902 40 27 24 13 1 3 7 6 37 14 730 965Western Texas College 426 545 20 17 43 50 1 2 4 1 2 --- 496 615Wharton County Junior College 675 1,032 91 183 151 231 6 11 --- 1 9 1 932 1,459
Totals 100,767 123,736 12,893 18,734 27,968 33,919 3,985 3,518 672 711 1,842 1,176 148,127 181,794
26
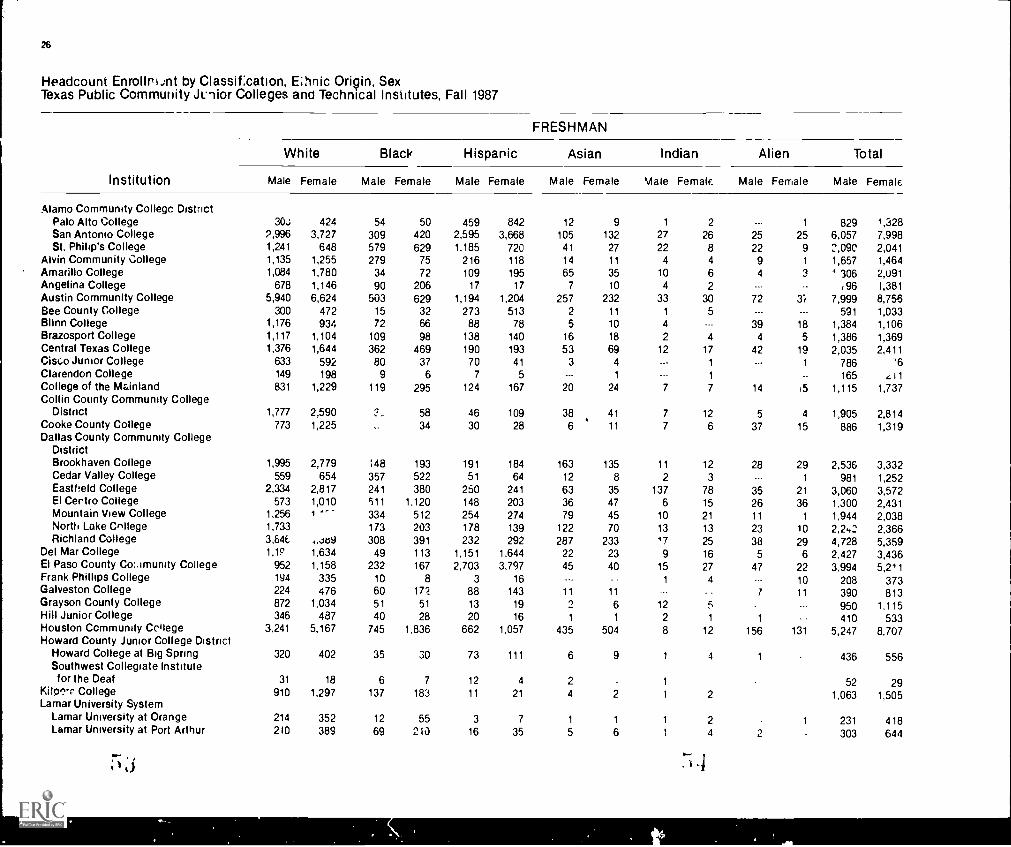
Headcount Enrol IriAt by Classification, Ethnic Origin, SexTexas Public Community Junior Colleges and Technical Institutes, Fall 1987
FRESHMAN
White Black Hispanic Asian Indian Alien Total
Institution Male Female Male Female Male Female Male Female Male Female Male Female Male Female
Alamo Community College DistrictPalo Alto College 30,i 424 54 50 459 842 12 9 1 2 --- 1 829 1,328San Antonio College 2,996 3,727 309 420 2,595 3,668 105 132 27 26 25 25 6,057 7,998St. Philip's College 1,241 648 579 629 1,185 720 41 27 22 8 22 9 2,09C 2,041
Alvin Community College 1,135 1,255 279 75 216 118 14 11 4 4 9 1 1,657 1,464Amarillo College 1,084 1,780 34 72 109 195 65 35 10 6 4 3 4 306 2,u91Angelina College 678 1,146 90 206 17 17 7 10 4 2 --- -- ,96 1,381Austin Community College 5,940 6,624 503 629 1,194 1,204 257 232 33 30 72 3; 7,999 8,756Bee County College 300 472 15 32 273 513 2 11 1 5 --- 591 1,033Blinn College 1,176 934 72 66 88 78 5 10 4 --- 39 18 1,384 1,106Brazosport College 1,117 1,104 109 98 138 140 16 18 2 4 4 5 1,386 1,369Central Texas College 1,376 1,644 362 469 190 193 53 69 12 17 42 19 2,035 2,411Cisco Junior College 633 592 80 37 70 41 3 4 --. 1 --- 1 786 '6Clarendon College 149 198 9 6 7 5 1 1 165 , I1College of the Mainland 831 1,229 119 295 124 167 20 24 7 7 14 15 1,115 1,737Collin County Community College
District 1,777 2,590 2_ 58 46 109 38 41 7 12 5 4 1,905 2,814Cooke County College 773 1,225 34 30 28 6 11 7 6 37 15 886 1,319Dallas County Community College
DistrictBrookhaven College 1,995 2,779 148 193 191 184 163 135 11 12 28 29 2,536 3,332Cedar Valley College 559 654 357 522 51 64 12 8 2 3 ... 1 981 1,252Eastfield College 2,334 2,817 241 380 250 241 63 35 137 78 35 21 3,060 3,572El Certro College 573 1,010 511 1,120 148 203 36 47 6 15 26 36 1,300 2,431Mountain View College 1,256 1 334 512 254 274 79 45 10 21 11 1 1,944 2,038North Lake CsIllege 1,733 173 203 178 139 122 70 13 13 23 10 2,2i,2 2,366Richland College 3,84 ...5o9 308 391 232 292 287 233 17 25 38 29 4,728 5,359
Del Mar College 1,19 1,634 49 113 1,151 1,644 22 23 9 16 5 6 2,427 3,436El Paso County Community College 952 1,158 232 167 2,703 3,797 45 40 15 27 47 22 3,994 5,211Frank Phillips College 194 335 10 8 3 16 ... 1 4 10 208 373Galveston College 224 476 60 172 88 143 11 11 --- 1 11 390 813Grayson County College 872 1,034 51 51 13 19 2 6 12 5 --- 950 1,115Hill Junior College 346 487 40 28 20 16 1 1 2 1 1 410 533Houston Community College 3,241 5,167 745 1,836 662 1,057 435 504 8 12 156 131 5,247 8,707Howard County Junior College District
Howard College at Big Spring 320 402 35 30 73 111 6 9 1 4 1 436 556Southwest Collegiate Institutefor the Deaf 31 18 6 7 12 4 2 1 52 29
KiIpe_vr College 910 1,297 137 183 11 21 4 2 1 2 1,063 1,505Lamar University System
Lamar University at Orange 214 352 12 55 3 7 1 1 1 2 1 231 418Lamar University at Port Arthur 2W 389 69 210 16 35 5 6 1 4 2 303 644

27
Headcount Enrollment by Classification, Ethnic Origin, SexTexas Public Community Junior Colleges and Technical Institutes, Fall 1987
FRESHMAN
White Black Hispanic Asian Indian Alien Total
Institution Male Female Male Female Male Female Male Female Male Female Male Female Male Female
Laredo Junior College 64 114 2 5 982 1,384 5 4 --- 1 66 63 1,119 1,5 1
Lee College 1,235 1,182 399 151 241 141 5 9 11 3 7 4 1,898 1,490McLennan Community College 1,194 1,932 133 313 96 117 12 21 2 4 8 3 1,445 2,390Midland College 860 1,123 60 88 178 218 8 16 2 2 14 11 1,122 158Navarro College 470 693 153 123 26 21 42 21 1 --- --- --- 692 6..?Northeast Texas Community College 367 800 17 72 6 7 --- 2 5 --- --. 392 884North Harris County College 2,690 3,922 128 291 281 364 133 118 6 11 21 19 3,259 4,725Odessa Cciiege 1,213 1,561 91 113 317 381 23 14 4 11 1 --- 1,649 2,080Panola Junior College 333 529 55 82 4 3 2 1 1 1 --- 2 395 618Paris Junior College 597 887 60 109 10 12 4 3 4 10 20 17 695 1,038Ranger Junior College 164 120 119 17 48 9 --- --- 1 2 332 148San Jacinto Junior College District
Central Campus 1,950 2,385 83 221 273 338 60 51 6 8 187 8.3 2,559 3,0, ,North Campus 734 909 123 176 113 136 28 26 I 6 14 9 1,016 1,262South Campus 826 1,090 56 81 131 166 50 50 4 3 18 9 1,088 1,399
South Plains College 1,003 1,173 79 136 266 291 13 11 5 7 20 6 1,386 1,624Southwest Texas Junior College 309 357 15 14 329 558 6 5 --- --- 4 2 663 936Tarrant County Junior College District
Northeast Campus 2,432 3,259 87 114 134 165 1U0 87 12 17 8 3 2,773 3,645Northwest Campus 1,195 1,229 56 49 176 175 28 31 4 7 5 1 1.464 1,492South Campus 2,049 2,318 305 564 201 209 87 63 9 5 8 4 2,659 3,163
Temple Junior College 512 702 44 104 61 66 2 4 --- 3 6 4 625 883Texarkana Community College 681 1,073 118 10 1 2 1 2 1 4 5 766 1,199Texas Southmost College 106 152 1 2 880 1.232 4 4 1 1 31 35 1,023 1,426Texas State Technical Institute
Amarillo Campus 515 175 16 15 62 24 22 1 7 3 622 218Harlingen Campus 231 169 3 3 1.285 784 3 3 1 1,522 960Sweetwater Campus 361 192 18 19 76 33 4 6 3 --- 462 250Waco Campus 2,736 420 290 80 273 33 24 2 10 2 --- 3,333 537
The Vicloria College 468 920 27 42 128 236 4 6 3 1 2 2 632 1207Trinity Valley Community College 860 1,224 275 110 79 29 6 4 6 3 19 6 1,245 1,376Tyler Junior College 2.046 2,382 298 541 36 39 2 11 3 11 44 29 2,429 3,213Vernon Regional Junior College 380 587 32 62 34 43 8 8 6 6 1 2 461 708Weatherford College 176 30 8 6 6 8 1 2 4 2 13 7 208 328Western Texas College 329 435 17 15 38 36 1 2 2 1 --- 387 489Wharton County Junior College 467 709 70 141 109 172 4 6 1 6 656 1,029
Totals 72,063 88,332 9,384 13,334 19,692 23,736 2,633 2,412 513 512 1,181 789 105,466 129,115

W.
28
Headcount Enrollment by Classification, Ethnic Origin, SexTexe.s Public Community Junior Colleges and Technical institutes, Fall 1987
1
SOPHOMORE
White Black Hispanic Asian Indian Alien Total
Institution Male Female Male Female Male Female Male Female Male Female Male Perrale Male Female
Alamo Community College DistrictPalo Alto College 40 46 6 10 46 99 2 --- 1 ... 95 155San Antonio College 870 1,026 120 153 740 837 21 21 3 10 23 14 1,777 2,061St. Philip's College 97 50 78 116 129 61 4 6 2 1 4 .. 314 234Alvin Community College 243 394 50 11 41 42 4 4 3 2 2 1 343 454Amarillo College 392 580 8 17 27 54 2' 14 4 5 3 452 673Angelina College 104 166 17 33 4 10 1 1 --- .. 126 210Austin Community College 852 891 83 123 182 175 68 45 6 9 39 21 1,230 1,264Bee County College 88 100 4 3 107 128 1 4 2 --- --- 202 235Blinn College 286 248 13 10 24 12 --- 1 2 14 6 337 279Brazosport College 96 131 12 13 11 20 1 3 1 --- --- 121 167Central Texar, College 80 100 16 31 10 9 3 1 1 1 109 143Cisco Junior College 51 41 3 2 6 3 1 1 --- 61 47Clarendon Colle;:- 103 184 6 7 2 9 1 1 113 200College of the Mainland 49 68 9 33 7 3 --- 65 104Collin County Community Collegeuistrict 63 103 2 3 1 1 66 107Cooke County College 42 71 7 1 1 3 1 2 2 4 2 59 77Dallas County Cr-,-.munity CollegeDistrictBrookhaven College 294 485 21 35 29 23 32 19 1 3 9 9 386 574Cedai Valley College 93 109 63 116 8 11 2 --- 1 164 239Eastfieid L.u.:ege 607 659 55 85 46 57 45 22 12 7 7 5 772 835El Centro Cairene 151 312 141 315 40 54 12 18 1 1 11 12 356 712Mountain Vie 7;ollege 307 276 65 99 59 60 16 12 2 4 2 453 449North Lake College 308 ' 77 22 30 25 12 22 10 --- 1 4 5 381 335Richland College 327 921 42 55 37 46 80 54 3 3 18 9 1,007 1,088Del Mar College 394 681 28 55 424 547 8 8 1 5 2 1 857 1,297El Paso County Community College 23._ 332 72 50 856 1,323 7 15 8 P 23 14 1,198 1,742Frank Phillips College 57 93 2 4 4 --- --- 1 1 3 62 105Galveston College 80 141 15 62 26 34 7 7 --- 122 244Grayson County College 265 352 12 15 5 4 2 3 1 3 --- 285 377Hill Junior College 74 116 16 17 3 4 --- 1 2 2 95 140Houston Community College 747 1,242 211 551 136 187 148 124 2 8 25 29 1,269 2,141Howard County Junior College DistrictHoward Collegc at Big Spring 64 89 1 10 13 19 1 78 119Southwest Collegiate Institutefor the Deaf 13 6 7 2 1 21 8Kilgore College 374 512 47 81 7 6 5 5 1 1 434 605Lamar University System
Lamar University at Orange 56 132 3 18 3 6 1 62 157Lamar University at Port Arthur 83 140 16 67 10 13 3 4 112 224
1 1 .......)

29
Headcount Enrollment by Classification, Ethnic Origin, SexTexas Public Community Junior Colleges and Technical Institutes, Fall 1987
SOPHOMORE
White Black Hispanic Asian Indian Alien Total
Institution Male Female Male Female Male Female I. de Female Male Female Male Female Male Female
Laredo Junior College 32 23 1 327 535 1 17 15 377 624Lee College 289 257 83 31 48 28 1 5 1 1 3 2 425 324McLennan Community College 275 429 24 109 15 38 2 3 1 1 317 580Midland Collet.e 116 l22 4 7 22 36 2 3 1 1 2 1 147 270Navarro College 99 170 27 28 6 6 16 5 1 1 149 210Northeast Texas Community College 33 66 2 6 - - 35 72North Harris County College 705 1,067 32 81 72 85 43 39 5 2 7 7 864 1,281Odessa College 171 221 10 22 47 44 5 5 1 2 1 236 293Panola Junior College 66 125 11 12 --- 2 --- --- --- --- 77 139Paris Junior College 148 186 13 31 3 2 1 2 4 5 7 173 229Ranger Junior College 29 24 20 10 10 2 -- --- 1 1 --- 60 37San Jacinto Junior College District
Central Campus 100 819 22 52 88 107 34 28 2 3 119 44 965 1,053North Campus 239 258 30 59 53 46 9 12 --- 1 3 2 334 378South Campus 341 422 22 33 45 49 22 26 2 --. 4 432 534
South Plains College 200 198 12 18 36 35 3 2 1 1 252 254Southwest Texas Junior College 85 95 3 6 106 178 2 --- 4 --- 200 279Tarrant County Junior College District
Northeast :.",'ams 811 1,128 39 62 55 55 23 20 1 3 3 1 932 1,269Northwest Campus 349 392 19 11 43 47 12 6 6 2 1 425 463South Campus 752 844 104 162 65 57 32 19 2 5 3 1 958 1,088
Temple Junior College 153 225 21 23 19 22 1 --- 1 --- 194 271Texarkana Community College 205 363 16 41 2 3 2 --- 1 226 407Texas Southmost Cr liege 60 101 1 -- 497 729 2 1 2 16 13 576 846Texas State Technical Institute
Amarillo Campus 65 32 4 1 19 4 7 1 95 38Harlingen Campus 9 2 --- 80 26 --- 89 28Sweetwater Campus 64 19 3 --- 11 4 3 81 23Waco Campus 461 55 50 9 50 3 6 --- 3 1 570 68
The Victoria College 190 332 6 15 46 61 1 2 1 --- 1 243 412Trinity Valley Community College 202 256 89 36 13 10 1 2 1 1 9 1 315 306Tyler Junior College 310 443 30 68 5 4 1 3 2 11 4 357 524Vernon Regional Junior Co.lege 145 117 25 20 19 7 1 1 --- 190 145Weatherford College 44 89 --- 1 4 1 1 5 54 91Western Texas College 69 79 2 1 4 12 2 2 79 92Wharton County Junior College 185 270 21 41 37 55 2 3 2 1 247 370
Totals 16,u84 20,403 2,010 3,224 4,916 6,218 755 595 82 111 411 248 24,258 30,799
30
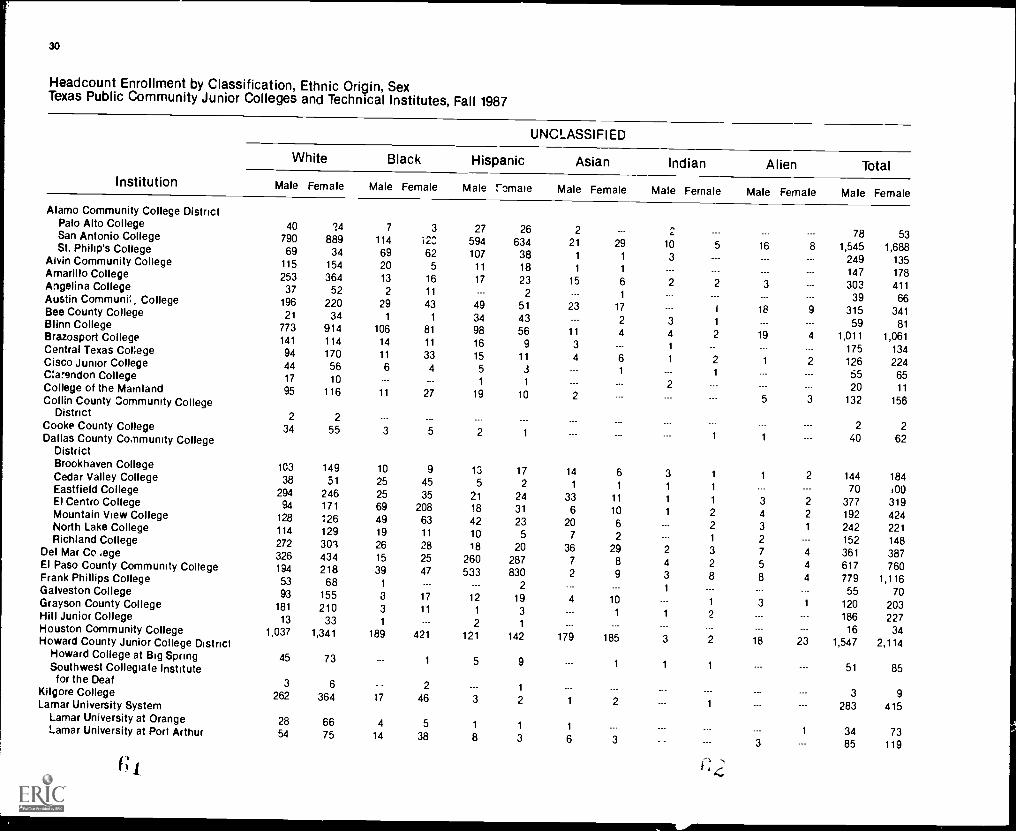
Headcount Enrollment by Classification, Ethnic Origin, SexTexas Public Community Junior Colleges and Technical Institutes, Fall 1987
UNCLASSIFIED
White Black Hispanic Asian Indian Alien TotalInstitution Male Female Male Female Male romaie Male Female Male Fernale Male Female Male Female
Alamo Community College DistrictPalo Alto College 40 ?4 7 3 27 26 2 --- 2 78 53San Antonio College 790 889 114 IC., 594 634 21 29 10 5 16 8 1,545 1,688St. Philip's College 69 34 69 62 107 38 1 1 3 249 135Alvin Community College 115 154 20 5 11 18 1 1 147 178Amarillo College 253 364 13 16 17 23 15 6 2 2 3 303 411Angelina College 37 52 2 11 2 --- 1 39 66Austin Communil, College 196 220 29 43 49 51 23 17 --- I 18 9 315 341Bee County College 21 34 1 1 34 43 --- 2 3 1 --- 59 81Blinn College 773 914 106 81 98 56 11 4 4 2 19 4 1,011 1,061Brazosport College 141 114 14 11 16 9 3 --- 1 175 134Central Texas College 94 170 11 33 15 11 4 6 1 2 1 2 126 224Cisco Junior College 44 56 6 4 5 3 --- 1 --- 1 55 65C:arendon College 17 10 --- 1 1 -- 2 20 11College of the Mainland 95 116 11 27 19 10 2 --- 5 3 132 156Collin County Community CollegeDistrict 2 2
2 2Cooke County College 34 55 3 5 2 1 1 1 40 62Dallas County Community CollegeDistrictBrookhaven College 1C3 149 10 9 13 17 14 6 3 1 1 2 144 184Cedar Valley College 38 51 25 45 5 2 1 1 1 1 -- 70 100Eastfield College 294 246 25 35 21 24 33 11 1 1 3 2 377 319El Centro College 94 171 69 208 18 31 6 10 1 2 4 2 192 424Mountain View College 128 126 49 63 42 23 20 6 2 3 1 242 221North Lake College 114 129 19 11 10 5 7 2 --- 1 2 152 148Richland College 272 301 26 28 18 20 36 29 2 3 7 4 361 387Del Mar Co ,ege 326 434 15 25 260 287 7 8 4 2 5 4 617 760El Paso County Community College 194 218 39 47 533 830 2 9 3 8 8 4 779 1,116Frank Phillips College 53 68 1 --- 2 1 -- --- 55 70Galveston College 93 155 3 17 12 19 4 10 1 3 1 120 203Grayson County College 181 210 3 11 1 3 --- 1 1 2 --- 186 227Hill Junior College 13 33 1 2 1 -- 16 34Houston Community College 1,037 1,341 189 421 121 142 179 185 3 2 18 23 1,547 2,114Howard County Junior College DistrictHoward College at Big Spring 45 73 1 5 9 1 1 1 51 85Southwest Collegiate Institutefor the Deaf 3 6 2 1
3 9Kilgore College 262 364 17 46 3 2 1 2 1 283 415Lamar University SystemLamar University at Orange 28 66 4 5 1 1 1
1 34 73Lamar University at Port Arthur 54 75 14 38 8 3 6 3 3 85 119

Headcount Enro anent by Classification, Ethnic Origin, SexTexas Public Co' mLnity Junior Colleges and Technical Institutes, Fall 1987
31
anent
UNCLASSIFIED
White Black Hispanic Asian Indian Alien Total
Institution Male Female Male Female Male Female Male Female Male Female Male Female Male Female
Laredo Junior College 32 34 --- 1 287 409 -- --- 3 6 322 450Lee College 261 193 80 31 33 10 6 2 1 --- --- 1 381 237McLennan Community College 97 200 21 67 15 17 --- 5 1 3 --- 136 290Midland College 325 349 8 7 24 16 8 4 2 2 2 367 380Navarro College 29 40 4 5 1 2 2 5 1 --- --- 1 37 53Northeast Texas Community College 66 101 --- 5 --- ... . 3 --- --- 66 109North Harris County College 587 754 33 59 45 49 32 19 5 4 3 701 889Odessa College 222 210 9 5 23 20 5 3 2 3 --- 262 240Panola Junior College 19 27 4 1 1 --- --- . 24 28Paris Junior College 49 67 3 11 1 2 1 53 81Ranger Junior College 5 12 ... 1 1 ___ 5 14San Jacinto Junior College District
Central Campus 581 590 24 41 76 48 27 26 2 6 43 20 753 731North Campus 152 134 20 29 25 19 10 8 5 212 190South Campus 331 313 ?.' 27 38 42 26 33 1 3 1 429 416
South Plains College 188 241 10 14 24 45 2 1 1 1 1 225 303Sou.hwest Texas Junior College 36 35 1 3 58 84 --- 1 1 97 122Tarrant County Junior College District
Northeast Campus 743 858 28 57 47 41 20 15 5 7 3 2 846 980Northwest Campus 407 286 34 20 36 18 7 6 2 1 4 --- 490 331South campus 769 750 136 132 59 34 45 17 2 4 3 3 1,014 940
Temple Junior College 101 125 13 18 14 13 1 2 129 158Texarkana Community College 383 535 36 86 7 7 --- --- 2 2 3 431 630Texas Southmost College 76 127 1 --- 415 681 --- 6 2 27 18 521 832The Victoria College 150 330 5 17 30 41 4 3 1 2 190 393Trinity Valley Community College 96 114 20 10 4 4 --- --- --- 120 128Tyler Junior College 338 453 16 59 6 4 2 1 1 3 7 3 370 523Vernon Regional Junior College 72 103 10 11 3 2 85 116Weatherford College 401 510 32 20 14 4 1 2 4 19 7 468 '16Western Texas College 28 31 1 1 1 2 30 34Wharton County Junior College 23 53 1 5 4 2 1 29 60
Totals 12.620 15,001 1.499 2,176 3.:,50 3.965 597 511 77 88 250 139 18,403 21,880
i '.;

3:
HEADCOUNT ENROLLMENT BY CLASSIFICATION, ETHNIC ORIGIN, SEXTexas Independent Senior Colleges and Universities, Fall 1987
Ethnicity Sex Total
Institution White Black Hispanic Asian Indian Alien Male Female Total
Abilene Christian University 3,831 190 12 39 8 53 2,098 2,035 4,133Amber University 858 195 39 8 4 26 60C.', 521 1,130American Technological University 375 91 32 8 2 10 288 230 518Austin College 1,094 35 51 44 2 5 600 631 1,231Baylor University 10,717 204 263 229 47 196 5.560 6,096 11,656Bishop College --- --- --- --- --- --- ... --- (301)'Concordia Lutheran College 397 27 37 4 --- --- 231 234 465Dallas Baptist University 1,291 340 13 41 88 67 959 881 1,840East Texas Baptist University 621 70 5 4 --. 16 335 381 716Hardin-Simmons University 1,632 53 94 18 3 --- 849 1,017 1,866Houston Baptist University 1,770 222 206 209 3 128 --- --- (2,538)2Howard Payne University 964 54 82 1 2 2 596 509 1,105HustnTillotson College 10 341 12 6 --- 133 27, 225 502Incarnate Word College 955 147 710 25 14 55 526 1,380 1,906Jarvis Christian Colic--; --- 466 --- --- 220 246 466LeTourneau College 690 8 4 2 1 48 638 115 753Lubbock Christian College 914 37 46 7 4 40 488 560 1,048Mc Murry College 1,290 152 130 13 5 27 885 732 1,617Our Lady of the Lake University 927 185 899 5 8 21 624 1,421 2,045Paul Quinn College 21 477 5 --- 6 256 253 509St. Edward's University 1,658 134 556 28 6 286 1,340 1,328 2,668St. Mary's University 2,108 171 1,366 77 17 79 1,927 1,891 3,818Schreiner College 485 15 56 4 3 11 301 273 574Southern Methodist University 7,590 247 299 265 13 374 4,924 3,870 8,794Southwestern Adventist College 571 67 118 14 7 69 343 503 846Southwestern Christian College 5 245 --- --- --- 32 158 124 282Southwe 4rn University 904 17 64 18 2 36 460 581 1,041Texas Christian University 6,367 264 203 60 11 200 3,061 4,044 7,105Texas College1 376 1 8 --- 64 217 233 450Texas Lutheran College 1,088 105 132 17 ... 4 708 63o 1,346Texas Wesleyan College 1,254 100 71 4 4 71 623 881 1,504Trinity University 2,056 28 157 78 11 50 1,125 1,255 2,380University of Dallas 2,000 73 99 85 12 286 1,492 1,063 2,555University of Mary Hardin-Baylor 1,003 99 124 24 5 82 539 798 1,337University of St. Thomas 1,162 72 196 53 6 136 749 876 1,625Wayland Baptist University 1,522 135 216 44 2 26 1,187 758 1,945Wiley College 2 402 1 --- --- 13 176 242 418William Marsh Rice University 3,012 133 140 196 5 381 --- --- (3,867)2
Totals 61,145 5,977 6,439 1,638 301 3,03: 35,369 36,825 72,194
'Breakdown by ethnicity and sex not available'Breakdown by sex not available.
fj

43
HEADCOUNT ENh)LLMENT BY CLASSIFICATION, ETHNIC ORIGIN, SEXtexas Independent Junior Colleges, Fall 1987
Ethnicity Sex Total
Institution White Jack Hispanic Asian Indian Alien Male Female Total
Jacksonville College 179 17 4 1 1 47 134 115 249Lon Morris College 247 63 11 4 4 24 215 138 353Southwestern Assemblies of Gu .
Junior College . 554 12 45 5 6 370 252 622
Totals 980 92 60 5 10 77 719 505 1,224

34
HEADCOUNT ENROLLMEAT BY CLASSIFICATION, ETHNIC ORIGIN, SEXProfessional Enrollments Medical and Dental Schools, Fall 1987
TOTAL
White Black Hispanic Asian Indian Alien Total
Institution Male Female Male Female Male Female Male Female Male Female Male Female Male Female
Public Medical and Dental SchoolsTexas A&M University
College sr Medicine 93 60 5 6 11 4 10 5 1 120 75College of Veterinary Medicine 239 239 2 1 16 9 6 257 255Texas College of OsteopathicMedicine 234 87 2 3 16 9 24 5 3 1 1 280 105Texas Tech University Health SciencesCenter School of Medicine 232 102 2 1 20 9 26 12 1 280 125The University of Texas Health Science:enter at DallasSouthwestern Medical School 449 198 13 11 52 25 39 11 553 245The Univc.sity of Texas Health ScienceCenter at HoustonDental School 14r 74 11 12 30 30 33 30 2 2 4 5 228 153Medical School 38F 223 13 15 38 28 62 27 1 499 293The University of Texas Health ScienceCenter at San AntonioDental School 222 73 4 1 37 21 9 5 1 273 100Medical School 386 198 10 15 65 25 75 19 2 3 1 541 258The University of Texas MedicalBranch at lialvestonMedical School 405 154 21 20 50 24 73 33 2 4 551 235
Totals ?,793 1,408 83 85 235 184 351 153 9 8 11 6 3,582 1,844
Independent Medical and Dental Schools:Jay lor College of Dentistry
Dental School V3 84 6 4 17 7 13 16 5 1 284 112Baylor College of MedicineMedical School 378 160 6 2 33 14 32 24 2 449 202
Totals 621 244 12 6 50 21 45 40 2 5 1 733 314

35
Headcount Enrollment by Classification, Ethnic Origin, SexProfessional Enrollments, Medical and Dental Schools, Fall 1987
FIRST YEAR
White Black Hispanic Asian Indian Alien Total
Institution Male Female Male Female Male Female Male Female Male Female Male Female Male Female
Public Medical and Dental SchoolsTexas A&M University
College of Medicine 22 17 1 3 2 1 3 2 28 23College of Veterinary Medicine 56 58 2 1 6 1 3 64 63
Texas College of OsteopathicMedicine 57 22 4 3 14 3 75 28
Texas Tech University Health SciencesCenter School of Medicine 67 20 1 4 2 9 3 80 26
The University of Texas Health ScienceCenter at DallasSouthwestern Medical School 97 53 7 4 14 6 18 6 136 69
The University of Texas Health ScienceCenter at HoustonDental School 24 15 5 7 9 11 8 1 2 2 3 45 42Medical School 95 61 5 3 11 6 29 9 140 79
The University of Texas Health ScienceCenter at San AntonioDental School 49 25 3 12 6 2 3 1 67 34Medical School 97 49 4 4 16 7 26 12 2 145 72
The University of Texas MedicalBranch at GalvestonMedical School 103 33 8 5 15 14 25 13 2 151 67
Totals 617 353 30 26 91 55 137 62 1 4 5 3 931 503
Independent Medical and Dental ^choolsBaylor College of Dentistry
Del dal School 54 22 1 5 4 4 5 53 32Baylor College of Medicine
Medical School 100 44 10 4 4 6 114 54
Totals 154 66 1 15 8 8 11 177 86

36
Headcount Enrollment by Classification, Ethnic Origin, SexProfessional Enrollments, Medical and Dental Schools, Fall 1987
SECOND YEAR
White Black Hispanic Asian Indian Alien Total
Institution Male Female Male Female Male Female Male Female Male Female Male Female Male Female
Publ:c Medical and Dental SchoolsTexas A&M University
College of Medicine 22 15 1 1 3 1 3 1 1 30 18College of Veterinary Medicine 52 65 3 3 1 55 69Texas College of OsteoprthicMedicine 69 21 1 3 3 4 76 25Texas Tech University Health SciencesCenter School of Medicine 61 29 4 2 5 3 1 70 35The University of Texas Health ScienceCenter at DallasSouthwestern Medical School 110 51 2 2 14 6 12 138 59The University o. Texas Health ScienceCenter at HoustonDenti.' School 41 16 2 4 6 6 9 12 58 38Medical School 105 49 6 1 7 4 15 8 133 62The University G: Texas Health ScienceCenter at San AntonioDental School 53 16 1 11 5 3 1 68 22Medica' School 91 49 4 5 16 11 23 4 1 1 135 70The University of Texas MedicalBranch at GalvestonMedical School 100 38 7 5 14 5 14 8 1 136 56
Totals 704 349 23 19 81 46 BB 38 1 1 2 1 899 454
Independent Medical and Dental School::Baylor College of Dentistry
Dental School 51 18 3 2 6 1 4 7 2 66 28Baylor College of MedicineMedical School 189 74 4 1 12 6 22 14 1 227 96
Totals 240 92 7 3 18 7 26 21 1 2 293 124
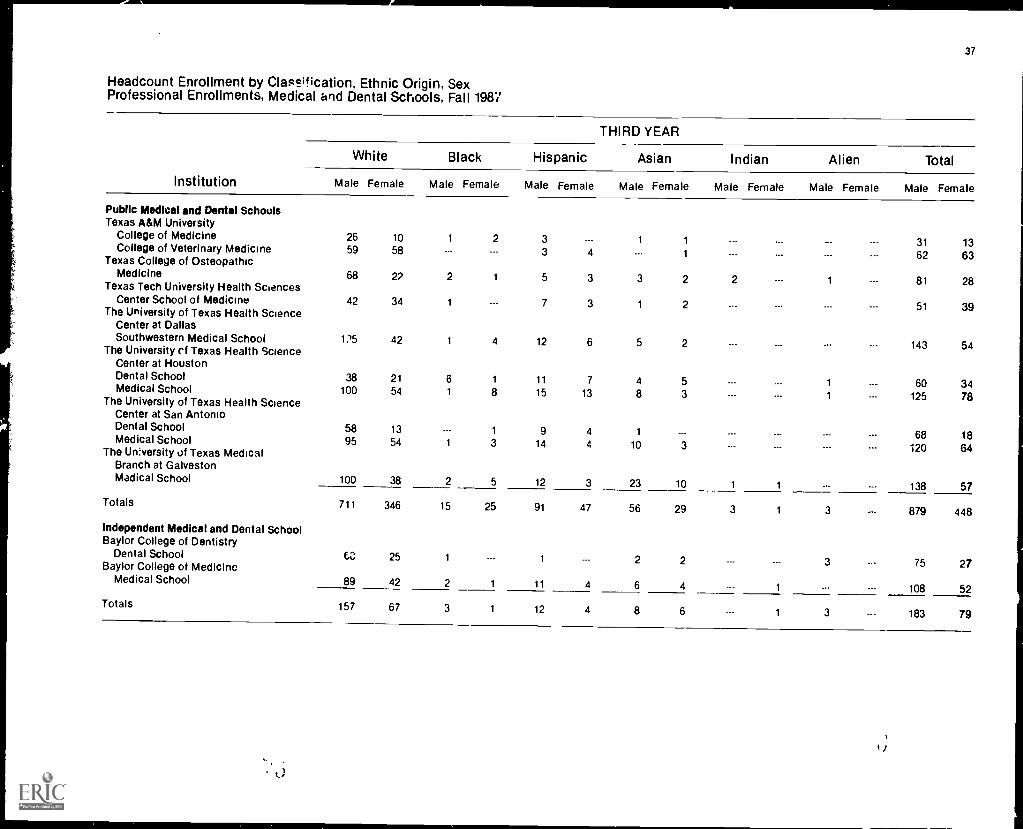
37
Headcount Enrollment by Classification, Ethnic Origin, SexProfessional Enrollments, Medical and Dental Schools, Fall 1987
THIRD YEAR
White Black Hispanic Asian Indian Alien Total
Institution Male Female Male Female Male Female Male Female Male Female Male Female Male Female
Public Medical and Dental SchoolsTexas ABM University
College of Medicine 26 10 1 2 3 1 1 31 13College of Veterinary Medicine 59 58 3 4 1 62 63Texas College of OsteopathicMedicine 68 22 2 1 5 3 3 2 2 1 81 28Texas Tech University Health SciencesCenter School of Medicine 42 34 1 7 3 1 2 51 39The University of Texas Health ScienceCenter at DallasSouthwestern Medical School 125 42 1 4 12 6 5 2 143 54The University cf Texas Health ScienceCenter at HoustonDental School 38 21 6 1 11 7 4 5 1 60 34Medical School 100 54 1 8 15 13 8 3 1 125 78The University of Texas Health ScienceCenter at San AntonioDental School 58 13 1 9 4 1 68 18Medical School 95 54 1 3 14 4 10 3 120 64The University of Texas MedicalBranch at GalvestonMadical School 100 38 2 5 12 3 23 10 1 1 138 57
Totals 711 346 15 25 91 47 56 29 3 1 3 879 448
Independent Medical and Dental SchoolBaylor College of Dentistry
Dental School 60 25 1 1 2 2 3 75 27Baylor College of MedicineMedical School 89 42 2 1 11 4 6 4 1 108 52
Totals 157 67 3 1 12 4 8 6 1 3 183 79

38
Headcount Enrollment by Classification, Ethnic Origin, SexProfessional Enrollments, Medical and Dental Schools, Fall 1987
FOURTH YEAR
White Black Hispanic Asian Indian Alien Total
Institution Male Female Male Female Male Female Male Female Male Female Male Female Male Female
Public Med:cal and Dental SchoolsTexas ABM University
College of Medicine . 23 18 2 3 2 3 1 31 21College of Veterinary Medicine 72 58 4 1 1 76 60
Texas College of OsteopathicMedicine . .... 40 22 1 4 3 1 1 48 24
Texas Tach University Health SciencesCenter School of Medicine . 62 19 1 5 2 11 4 79 25
The University of Texas Health ScienceCenter at DallasSouthwestern Medical School 117 52 3 1 12 7 4 3 136 63
The University of Texas Health ScienceCenter at HoustonDental School . 45 22 3 2 6 8 9 5 1 1 2 65 39Medical School . 85 59 1 3 5 5 10 7 101 74
The University of Tiaras Health ScienceCenter at San AntonioDental School 62 19 5 6 3 1 70 26Medical School . 103 46 1 3 19 3 16 2 141 52
The University of Texas MedicalBranch At GalvestonMedical School 102 45 4 5 9 2 11 2 1 126 55
Totals 711 360 15 15 72 36 70 24 4 2 1 2 873 439
Independent Medical and Dental SchoolsBaylor College of Dentistry
Dental School 70 19 2 1 5 2 3 2 1 80 25
Totals . 70 19 2 1 5 2 3 2 1 80 25

39
HEADCOUNT ENROLLMENT BY CLASSIFICATION, ETHNIC ORIGIN, SEXAcademic Enrollments, Health-Related Schools, Fall 1987
TOTAL
White Black Hispanic Asian Indian Aiien Total
Instituton Male Female Male Female Male Female Male Female Male Female Male Fernale Male Female
Pubic Health-Related SchoolsTexas ABM University
College of Medicine/Academics 1 3 1 1 2 4College of Veterinary
Medicine/Academics 351 520 6 5 23 43 5 3 1 16 9 401 581Texas Tech University Health Sciences
CenterSchool of Medicine/Academics 14 11 2 4 2 18 15School of Allied Health 20 69 1 7 1 1 1 23 77School of Nursing .. 15 189 10 4 21 1 4 20 224
The University of Texas Health ScienceCenter at DallasGraduate School of BiomedilalSciences . 108 144 1 3 9 1 29 13 147 161
School of Allied Health Science, 57 207 1 13 5 11 1 5 1 65 236The University of Texas Health F,:ience
Center at HoustonDental Branch/Academics 21 59 1 3 4 2 1 2 1 26 68Graduate School of BiomedicalSciences 79 78 --- 6 4 1 10 17 1 26 13 119 116
School of Allied Health Sciences 51 65 6 7 5 6 9 9 1 1 1 72 89School of Nursing 26 316 5 71 1 22 1 22 1 1 6 35 437School of Public Health 127 225 16 31 14 25 14 20 1 33 26 204 328The University of Texas Health Scier.Center at San AntonioDental School/Academics 26 7 1 1 1 27 10Graduate School of BiomedicalScience 74 48 1 6 4 n 6 9 5 92 63School of Allied Health Sciences 36 153 1 3 17 38 1 5 1 1 56 200School of Nursing 44 379 6 28 23 86 9 2 73 504The University of Texas Medical
Branch at GalvestonGraauate School of BiomedicalSciences 67 47 2 2 --- 1 9 4 1 23 17 101 72School of Allied Health Sciences 54 178 4 13 20 18 8 7 1 1 87 217School of Nursing 21 340 1 31 1 21 11 1 1 1 25 404
Totals 1,192 3,038 51 226 133 312 95 139 4 8 118 83 1,593 3,806
Indepe-dent Health-Related SchoolsBaylor College of Dentistry
Advanced Education 38 12 2 1 1 1 2 1 1 43 16Caruth School of Dental Hygiene --- 43--- 43Baylor College of Medicine
Baylor College ofMedicine/Academics 11 46 --- 1 1 1 1 2 --- 1 13 51School of Graduate Sciences 73 42 1 5 1 6 3 43 26 128 72
Totals 122 143 3 2 7 3 9 6 43 28 184 182
J (J

40
Headcount Enrollment by Classification, Ethnic Origin, SexAcademic Enrollments, Health-Related Schools, Fall 1987
FRESHMAN
White Black Hispanic Asian Indian Piian Total
Institution Ma Ir, Female Male Female Male Female Male Female Male Female Male Female Male Female
Public HoulthPllated SchoolsTexas A&M University College of
Veterinary Medicine/Academics 82 149 2 1 9 43 1 1 94 164Texas Tech University Health SciencesCenter School cf Nursing 5 42 3 3 3 1 3 49The University of Texas Health ScienceCenter at HoustonDental Branch/Academics 27 2 3 1 1 1 1 34School of Allied Health Sciences 10 V' 4 2 4 1 1f 17The University of Texas Health ScienceCenter at San Alter ioSchool of AI 11,- ' 4E.3ith Sciences 5 43 1 1 6 12 1 1 13 59
fotals 102 271 5 11 18 33 6 6 1 2 132 323
SOPHOMORE
White Black Hispanic Asian Indian Alien TotalInstitution Male Female Male Female Male Female Male Female Male Female Male Female Male Female
Public Healthlielated Schuo:sTexas A&M University College of
Veterinary Medicine/Academics 66 113 11 7 9 1 1 1 76 124Texas Tech University Health Sc.encer;
Center School of Nursing 5 51 4 7 2 5 64The University of Texas Health ScienceCenter at HoustonDental Branch/Academics 27 1 1 29School of Allied Health Scieni es 7 6 1 1 8 7The University of Te, Is Health ScienceCenter at San AntonioSchool of AI lieo Health Sciences 13 32 2 11 15 43
Totals 91 229 1 6 9 28 2 3 1 1 104 267

41
Headcount EnrollmP7t by Classification, Ethnic Origin, SexAcademic Enrollme,..s, Health-Related Schools, Fall 1987
JUNIOR
White Black Hispanic Asian Indian Alien Total
Institution Male Female Male Female Male Female Male Female Male Female Male Female Male Female
Pui..ic HealthRelated SchoolsTexas A&M University College of
Veterinary MedicinelArailemics 65 92 1 3 14 1 1 70 107Texas Tech University Heelth Sciences
CenterSchool of Allied He Alth 10 38 1 5 1 1 12 44School of Nursing 2 58 3 5 1 1 3 67
The University of Texas Health ScienceCenter at DallasSchool of Allied Health Sciences 26 77 1 5 2 2 1 30 87
The University of Texas Health ScienceCenter at HtistonSchool of Allied Health. Sciences 11 12 1 12 12School of Nursing 9 82 2 33 8 1 12 1 2 13 137
The University of Texas Health ScienceCenter at San AntonioSchool of Allied Health Sciences 10 41 1 5 10 1 3 16 55School of Nursing 13 122 1 11 15 46 6 1 29 186
The University of Tex Is MedicalBranch at GalvestonSchool of Allied Health Sciences 30 97 3 7 15 13 5 6 53 123School of Nursing 11 137 1 20 13 7 1 1 13 178
Totals 187 755 9 80 42 117 10 39 2 2 1 2 251 996
Independent HealthRelated SchoolsBaylor College of Dentistry
Caruth School of Dental Hygiene 23 23Paylor College of Medicine
Baylor College ofMrdicine/Acaderrics 3 20 1 3 21
Totals 3 43 1 3 44
1
1 i

42
Headcount Enrollment by Classification, Ethnic Origin, SexAcademic Enrollments, Health-Related Schools, Fall 1987
SENIOR
White Slack Hispanic Asian Indian Alien Total
Institution Male Female Male Female Male Female Male Female Male Female Male Female Male Female
Public HealthRelated SchoolsTexas ABM University College of
Veterinary Medicine /Academics 69 97 1 4 3 1 73 102Texas Tech University Health SciencesCenterSchool of Allied Health 10 31 2 1 11 33Schoo of Nursing 3 38 1 6 4 44The University of Texas Health ScienceCenter at DallasSchool of Allied Health Sciences 23 109 6 2 6 i 1 26 124The University of Texas Health ScienceCenter at HoustonSchool of Allied Health Sciences 20 22 3 1 4 4 3 7 1 30 35School of Nursing 2 71 2 17 1 7 5 1 6 100The University of Texas Health ScienceCenter at San AntonioSchool of Allied Health Science 8 37 1 4 5 12 43School of Nursing 17 108 5 13 7 35 1 1 29 158The University of Texas MedicalBranch at GalvestonSchool of Allier Health ociences 24 81 1 6 5 5 3 1 1 1 34 94School of Nursing 4 104 7 1 5 3 1 6 119
Totals 180 698 11 52 29 78 7 21 2 1 2 2 231 852
Independent HealthRelated SchoolsBaylor College of Dentistry
Cauth School of Dental Hygiene 2020Baylor College of
Medicine/Academics 8 26 1 1 1 1 1 1 10 30Totals 8 46 1 1 1 1 -,
1 10 50

43
Headcount Enrollment by Classification, Ethnic Origin, SexAcademic Enrollments, Health-Related Schools, Fa li 1987
POST-BACCALAUREATE
White Black Hispanic Asian Indian Alien Totai
Institution Male Female Male Female Male Female Male Female Male Female Male Female Male Female
Public Healthrelated SchoolsTexas A&M University College of
Veterinary Medo:nne/Academics 15 18 1 1 17 18The University of Texas Health Science
Center at DallasGraduate School of BiomedicalSciences 8 7 1 1 8 d
School of Allied Health Sciences 8 21 2 1 2 9 25The University of Texas Health Science
Center at HoustonGraduate School of BiomedicalSciences 9 13 3 4 5 13 21
School of Allied Health Sciences 3 15 1 2 1 - -- 1 5 18School of Nursing 3 16 1 2 1 3 4 22School of Public Health 6 12 2 1 4 1 2 9 r
The University of Texas Health ScienceCenter at San AntonioGraduate School of BiomedicalScience 4 12 1 2 1 2 7 15
The University of Texas MedicalBrP.rci- ct Ga;:aston3raduate Schooi of BiomedicalSciences 4 10 2 1 1 1 6 13
School of Nursing 19 2 1 22
Totals 60 143 8 14 3 9 7 14 2 78 182

44
Headcount Enrollment by Classification, Ethnic Origin, SexAcademic Enrollments, Health-Related Schools, Fall 1987
MASTER'S
White Black Hispanic Asian Indian Alien Tot?'
Institution Male Female Male Female Male Female Male Female Male Female Male Female Male Female
Public Health-Related SchoolsTexas A&M University College of
Veterinary Medicine/Academics 33 30 2 4 1 6 4 40 40Texas Tech University School of
Medicine/Academics 1 1 2The University of Texas Health Science
CeAter at DallasGraduate School of Biomedical
Sciences 8 38 1 4 12 39The University of Texas Health Science
Center at HoustonDental Branch/Academics 2
1 3Graduate School of BiomedicalSciences 6 9 1 1 1 7 11School of Nursing 12 147 19 6 2 4 12 178School of Public Health 42 124 1C 20 7 10 4 10 1 7 7 70 172The University of Texas Health Science
Center at San AntonioGraduate School of Biomedical
Science 26 3 1 3 1 30 4School of Nursing 14 149 4 1 5 2 15 160The University of Texas MedicalBranch at GalvestonGraduate School of BiomedicalSciences 3 / 1
1 1 1 5 9School of Nursing 6 80 2 2 1 6 85
Totals 152 588 10 50 9 28 10 17 1 19 16 200 700
Independent Health-Related SchoolsBaylor College of Dentistry
Advanced Education 3 1 1 3Baylor College of Medic r cSchool of Gradua.9 Scences 6 9 1 7 9
Totals 6 12 1 8 12

45
Headcount Enrollment by Classification, Ethnic Origin, SexAcademic Enrollments, Health-Related Schools, Fall 1987
DOCTORAL
White Back Hispb Asian Indian Alien Total
Institution Male Female Male Female Male Female Male Female Male Female Male Female Male Female
Public HealthRelated Sc`oolsTexas A&M University
College of Medicine/Academics 1 3 1 1 2 4
College of VeterinaryMedicine/Academics 21 21 1 9 5 31 26
Texas Tech UniversityHealth Sciences CenterSchool of Medicine/Academics 14 10 1 4 2 18 13
The University of Texas Health ScienceCenter at DallasGraduate School of 6.:;r:ndicalSciences 92 99 1 1 9 1 25 12 127 113
The University of Texas Health ScienceCenter at HoustonGraduate School of BiomedicalSciences 61 56 2 4 1 6 10 1 21 11 92 81
School of Public Health 44 64 2 6 2 6 1 6 10 11 59 92
The University of Texas Health ScienceCenter at San AntonioGraduate School of Biomedical
Science 44 33 3 :i 2 4 6 4 55 44
The University of Texas MedicalBranch at GalvestonGraduate School of BiomedicalSciences 60 30 1 8 2 22 17 90 50
Totals 337 316 A 9 18 13 43 34 1 72 50 474 423
Independent HealthRelated SchoolsBaylor College of Medicine
School of Graduate Sciences 67 33 1 4 1 E 3 43 26 121 63
Totals 67 33 1 4 1 6 43 26 121 63
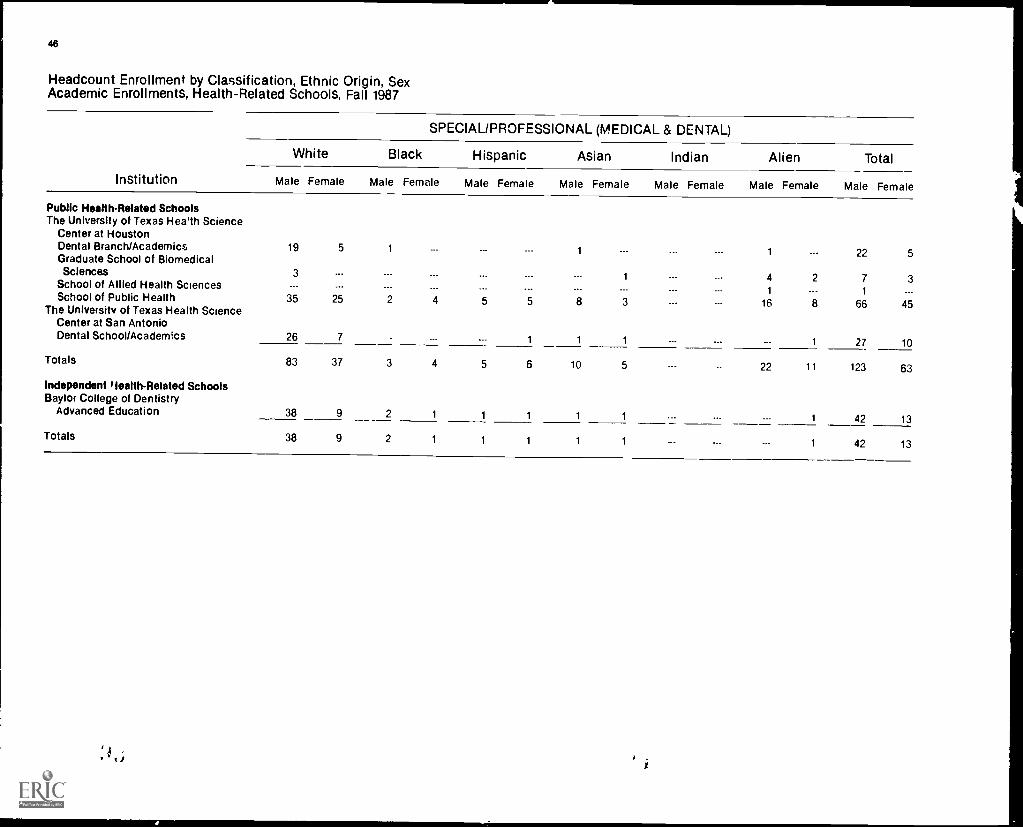
46
Headcount Enrollment by Classification, Ethnic Origin, SexAcademic Enrollments, Health-Related Schools, Fall 1987
SPECIAL/PROFESSIONAL (MEDICAL & DENTAL)
White Black Hispanic Asian Indian Alien Total
Institution Male Female Male Female Male Female Male Female Male Female Male Female Male Female
Public HealthRelated SchoolsThe University of Texas Hea'th Science
Center at HoustonDental Branch/Academics 19 5 1 1 1 22 5Graduate School of BiomedicalSciences 3
1 4 2 7 3School of Allied Health Sciences --- ---1 --- 1 ---School of Public Health 35 25 2 4 5 5 8 3 16 8 66 45The University of Texas Health Science
Center at San AntonioDental School /Academics 26 7 1 1 1 1 27 10
Totals 83 37 3 4 5 6 10 5 22 11 123 63
Independent P lealth-Related SchoolsBaylor College of Dentistry
Advanced Education 38 9 2 1 1 1 1 1 1 42 13
Totals 38 9 2 1 1 1 1 1 1 42 13

47
RESIDENT AND NONRESIDENT STUDENTSPublic Universities, Fall 1987
Resident Out-of-State Foreign
Institution Number Percent Number Percent Number Percent Total
East Texas State University 6,344 93 80 194 2 86 225 3 32 6,763East Texas State University Center at Texarkana 781 70 10 325 29 17 P 71 1,114
Lamar University SystemLamar University at Beaumont 10.949 96 28 129 1 13 293 2 57 11,371
Midwestern State University 4.359 92 29 307 6 50 57 1 20 4,723Pan American University 9,474 98 35 58 .60 100 1 03 9,632
Pan American University at Brownsville 1,219 98 30 12 96 9 72 1,240Stephen F Austin State University 11.94- 98 64 111 91 53 43 12,111Texas A&M University System
Prairie View A&M University 4,094 77 14 668 12 58 545 10 26 5,307Tarleton State University 5,177 98 76 45 85 20 38 5,242Texas A&M University 32,269 86 31 3,502 9 36 1,612 4 31 37,383Texas A&M University at Galveston 370 67 15 162 29 40 19 3 44 551
Texas Southern University 5,388 76 90 738 10 53 880 12.56 7,006Texas State University System
Angelo State University 5,539 95 46 187 3 22 76 1 30 5,802Sam Houston State University 10,280 96 20 197 1 84 208 1.94 10,685Southwest Texas State University 1r,362 96 62 384 1 91 293 1 46 20,039Sul Ross State University 1,618 96 77 34 1.99 21 1 23 1,703Uvalde Study Center 393 97 51 9 2 23 1 24 403
Texas Tech University 21,042 89 29 1,537 6 52 985 4 18 23,564Texas Woman's University 7,349 88 45 557 6 70 402 4 83 8,308The University of Texas System
The University of Texas at Arlington 21,067 92 56 595 2 61 1,098 4 82 22,760The University of Texas at Austin 39.247 82 20 5,369 11 24 3,127 6 54 47,743The University of Texas at Dallas 7,155 92 50 226 2 92 354 4 57 7,735The U 'versity of Texas at El Paso 12,379 38 06 621 4 41 1,056 7 51 14,056The Univcisity of Texas of the Permian Basin 1.910 97 64 23 1 17 23 1 17 1,956The University of Texas at San Antonio 12.563 97 54 209 1 62 107 8.3 12,879The University of Texas at Tyler 3.581 9i 28 49 1 33 51 1 38 3,681University of Houston SystemUniversity of Houston 25.447 88 03 1.517 5 24 1,943 6 72 28,907University of HoustonClea; Lake 6.420 94 09 91 1 33 312 4 57 6,823Univers.ty of HoustonDowntown 6.443 89 11 2.30 3 45 537 7 42 7,230University of HoustonVictoria 1,056 99 06 6 56 4 37 1,066University of North Texas 19.255 86 04 1,352 C 04 1.772 7 91 22,379University System of South TexasCorpus Christi State University 3,568 97 22 89 2 42 13 35 3,670Laredo State University 832 90 92 21 2 29 62 6 77 915Texas A&1 University 5.094 94 45 62 1 14 237 4 39 5,393West Texas State University 5.371 93 53 302 5 25 69 1 20 5
,742
Totals 329,372 90 02 19,938 5 44 16,572 4 52
___..
365,882

48
RESIDENT AND NONRESIDENT STUDENTS'Public Community Junior Colleges and Technical Institutes, Fall 1987
Institution
Resident Out-of-State Foreign
Number Percent Number Percent Number
Alamo Community College DistrictPalo Alto College 2,098 82.66 379
1,02814 93 61San Antonio College 19,105 90 43 4 86 993St. Philip's College 5,420 89 39 516 8.51 127Alvin Community College
35 82 154,193Amarillo College 98.82
8 .15 190Angelina College5,0382,590 25 .95 398.93Austin Community College
133 .66 30919,463 97.77Bee County College 2,200 99.959702
1 .04 ---Blinn College .66 1.27 88Brazosport College
5,024 0230 .89 10Central Texas College
3,312 98.804,452 88.19 532 10.53 64Cisco Junior College 1,690 .00 --- --- ---Clarendon College 652 90 55
996949.437966
66 9.16 2College of the Mainland 3,288 11 .33 10Collin County Community College District97 1.9J 75Cooke County College
4,7242,315 68 2.78 60Dallas County Community College District
Brookhaven College 6,942 97.00 123 1.71 91Cedar Valley College24 .85 3Eastfield College 2,779 99.0367 .74 42El Centro College 8,826 98.78
97 67 56 1 03 70Mountain View College5,289
60 1.12 6North Lake College5,281 985,498
97.7756
85 1.51 41Richland College 12,580 97 29 182 1.40 168Del Mar College9,086 96 72 147 1,56 161El Paso County Community College
1413,560 96 58 323 2.30 157 1 12Frank Phillips College 842 96 44 25 2.86 6 68Galveston College 1,834 96.93 32 1.69 26 1.37 1,892Grayson County College 3,022 96 24 117 3 72 1 03 31:Hill Junior Cf,ilege 1,194 97.23 25 2.03 9 .73
212480
Houston Community College 18,571 88 32 126 .59 2,328 11 07 21,025Howard County Junior College DistrictHoward College at Big Spring 1,231 92 90 89 6.71 5 37 1,325Southwest Collegiate Institute for the Deaf 94 77 04 28
12298 7222 95 --- ---Kilgore College
4,250 52 1 20 3 06 4,305Lamar University SystemLamar University at Orange 971 99 58 4 41 9751,482Lamar University at Port Arthur
99 66 2 13 3 20 1,487
Percent Total
2.404 702.09
.353.62
.111 55
---
1.69.29
1 26---
.27
.301.532 45
1 271047
1.29.1172
1.291.71
221,512368
6,063
5,236
19,9052,2015,1783,3525,0481,690
720
34,8391
2,443
81062,8068,9355,4155,347
5612,93204
9,394

49
Resident and Nonresid t StudentsPublic Community Jun Colleges and Technical Institutes, Fall 1987
Institution
Resident Out-of-State Foreign
Number Percent Number Percent Number Percent Total
Laredo Junior College 4,137 92 69 29 .64 297 6.65 4,463Lee College 4,731 99 49 10 21 14 29 4,755McLennan Community College 5,100 9C 87 39 75 19 36 5,158Midland College 3,632 97 00 73 1.94 39 1 04 3,744Navarro College 1,879 93 99 116 5 80 4 20 1,999Northeast Texas Community College 1,549 99 42 8 51 1 .06 1,558North Harris County College 11.057 94 35 160 1 36 502 428 11,719Odessa College 4,654 97 77 75 1 57 31 65 4,750Panola Junior College 1,192 93 05 89 6 94 1,281Paris Junior College 1,981 87 30 241 10 62 47 2 07 2,269Ranger Junior College 562 94 ;9 29 4 86 5 83 596Sar Jacinto College District
Central Campus 8,360 91 39 49 .53 738 8 06 9,147North Campus 3,266 96 28 13 38 113 3 33 3,392South Campus 4,051 94 25 44 1 02 203 4 72 4,298
South Plains College 3,827 94 63 174 4.30 43 1 06 4,044Southwest Texas Junior College 2,250 97.95 30 1 30 17 74 2,297Tarrant County Junior College District
Northeast Campus 10,438 99 93 3 02 4 03 10,445Northwest Campus 4,663 99.95 2 04 4,665South Campus 9,818 99 95 --- --- 4 04 9,822
Temple Junior College 2,223 98 36 28 1 23 9 39 2,260Texarkana Community College 2,465 67.36 1,194 32 63 3,659Texas Southmost College 5,156 98 69 --- ... 68 1 30 5,224Texas State Technical Institute
Amarillo Campus 958 98 45 14 1 43 1 10 973Harlingen Campus 2,595 99.84 1 03 3 11 2,599Sweetwater Campus 815 99 87 1 12 --- 816Waco Campus 4,463 99 00 30 66 15 33 4,508The Victoria College 3,032 98.53 16 51 29 94 3,077Trinity Valley Community College 3,424 98 10 31 88 35 1 00 3,490Tyler Junior College 7,207 97 18 131 1 76 78 1 05 7,416
Vernon Regional Junior College 1,471 86.27 232 13 60 2 11 1,705Weatherford College 1,635 96 46 10 58 50 2.94 1,695Western Texas College 1,069 96 21 40 3 60 2 18 1,111Wharton County Junior College 2,355 98 49 21 87 15 .62 2,391
Totals 314,911 95 45 7,493 2 27 7,517 2 28 329,921
'In semester-length courses

50
TEXAS RESIDENT STUDENTS BY COUNTY OF ORIGINFall 1987
Public InstitutionsCounty Senior Junior Total County
Public InstitutionsSenior Junior Total
Anderson 527 1,405 1,932 Corye'l 400 1,136 1,E36Andrews 205 350 555 Cottle 79 38 117Angelina 991 1,496 2,487 Crane 77 77 154Aransas 267 169 436 Crockett 88 19 107Archer 207 44 251 Crosby 141 53 194Arms:rong 45 51 96 Culberson 55 4 59Atascosa 289 221 510 Dallam 116 63 179Austin 405 384 789 Dallas 32,972 44,174 77,146Bailey 119 77 196 Dawson 166 147 313Bandera 138 33 171 Deaf Smith 395 175 570Bastrop 370 435 805 Delta 102 51 153Baylor 111 74 185 Denton 7,223 3,050 10,273Bee . 332 875 1,207 DeWitt 225 223 448Bell 1,785 4,431 6,216 Dickens 45 40 85Bexar 20,701 25,861 46,562 Dimmitt 124 190 314Blanco 112 50 162 Donley 49 83 132Borden 22 14 36 Duval 358 126 484Bosque 154 274 428 Eastland 245 331 576Bowie 1,129 2,101 3,230 Ector 1,882 3,605 5,487Brazoria 2,976 6,580 9,556 Edwards 27 14 41Brazos . 3,571 1,364 4,93E Ellis 892 942 1,834Brewster 546 17 563 El Paso 14,197 13,691 27,888Briscoe 52 24 76 Erath 963 48 1,011Brooks 266 69 335 Falls 113 197 310Brown 465 101 566 Fannin 297 393 690Burleson 197 154 351 Fayette 297 232 529Burnet 259 192 451 Fisher 66 69 135Caldwell 378 98 476 Floyd 129 55 184Calhoun 258 351 609 Foard 41 25 66Callahan 147 145 292 Fort Bend 3,546 2,691 6,237Cameron 3,588 6,022 9,610 Franklin 76 149 225Camp 108 266 374 Freestone 163 313 476Carson 191 119 310 Frio 128 104 232Cass 311 547 858 Gaines 174 87 261Castro 209 60 269 Galveston 3,997 6,444 10,441Chambers 365 265 630 Garza 99 47 146Cherokee 458 428 886 Gillespie 320 55 375Childress 67 90 157 Glasscock 47 33 80Clay 184 41 225 Goliad 89 133 222Cochran 56 88 144 Gonzales 207 104 311Coke 97 20 117 Gray 308 435 743Coleman 146 36 182 Grayson ,205 2,729 3,934Collin 6,295 5,794 12,089 Gregg ,702 2,568 4,270Collinsworth 44 52 96 Grimes 234 148 582Colorado 252 226 478 Guadalupe 1,017 417 1,434Comal 1,198 309 1,507 Hale 510 138 648Comanche 241 55 296 Hall 70 57 127Concho 66 6 72 Hamilton 162 43 205Cooke 439 864 1,303 Hansford 124 44 168

51
Texas Resident Students By County of Origin, Fall 1987
CountyPublic Institutions
Senior Junior Total CountyPublic Institutions
Senior Junior Total
Hardeman 68 16092 Lipsct -lb 67 22 891,136Hardin 97 1,233
112,522Live C-5:, 127 188 315
Harris 66.385 46,137 Llano 105 72 1771,372Harrison 603 769 Loving 2 7 9
Hartley 119 61 180 Lubbock 6,899 2,299 9,198Haskell 98 45 143 Lynn 107 57 164Hays 1,955 330 Madison 189 192 281Hemphill 88 55 Marion 71 86 157Henderson 469 1,130 Martin 72 68 140Hidalgo 9,696 1,529 11,225 Mason
45517
617103
1,072Hill 222 528 7501.081
MatagordaHockey 361 720
1,44158286741
522 1,006Hood 437 272 709
Maverick'25 146McCulloch
Hopkins 496 214 710 5,409Houston 445 4 ,6
1,826632
McLennanMcMullen 16 14
6,86630
Howard 402 860 Medina 379 225 604Hudspeth 26
1,6898 34 Menard 50 14 64
1Hunt 325 2,014 Midland 2,120 3,217Hutchinson 359 620 979 Milam 280 243 6'352337Irion 40 6 46 Mills 103
1,910311678
113114Jack 123 65 188 Mitchell 106 220
Jackson 230 284 514 Montague 359 596Jasper 548 276 824 Montgomery 3,370Jeff Davis 71 7 78 Moore 239 173 692412Jefferson 8,273 Morris 191 397 588Jim Hogg 126
1,58468
91,281595547
Motley1,665
14 48Jim Wells 868 387 Nacogdoches 338Johnson 966 1,359 2,325 444 823Jones 166 141 307
NavarroNewton 138 92
Karnes 176 232 3781,341
Nolan 259 274Kaufman 435 906 5,646 8,238Nueces 13,884Kendall 353 106 459 Ochiltree 142 82 224Kenedy 10 9 19 Oldham
471
2727
74Kent 20 21 41 Orange 1,84Palo Pinto 291
1,002 2,843Kerr 425 89 514 569Kimble 53 12 65 PanolaParker
2361,158 1,821
Parmer28
758King 17 4 21 663Kinney 34 34 68 200 55
1,654255Kleberg 1,430 224 Pecos 282 275 557Kno: 87 47 134
1,783Polk
1,329994
246 545Lamar 519 1,264 PotterLamb 234 181 415 Presidio 139
2,54 130 3,934152Lampasas 205 245 450 Rains 59 35 94Lasalle 58 51 109 Randall 2,52,982 5,496
ReaganLavaca 329 376 705 413154
76Lee 150 161 311 Real 28 63 91Leon 147 116 2631,289
Red River 122 220 342Liberty 665 624 162 210 372ReevesLimestone 168 469 637 Refugio 136 169 305
f , 3f ; ,i

52
Texas Resident Students By County of Origin, Fall 1987
CountyPublic Institutions
Senior Junior TotalPublic Institutions
County Senior Junior TotalRoberts 14 18 32 Travis 14,139 15,086 29,225Robertson 180 97 277 T "nity 147 98 245Rockwall 485 374 859 1 yler 285 121 406Runnels 250 32 282 Upshur 309 558 867Rusk 449 845 1,294 Upton 56 46 102Sabine 92 49 141 Uvalde 311 607 918San Augustine 115 64 179 Val Verde 543 593 1,136San Jacinto 164 43 207 Van Zandt 332 554 BB6San Patricio 927 962 1,889 Victoria 1,271 2,163 3,434San Saba 84 85 169 Walker 1,539 891 2,430Schleicher 64 10 74 Waller 573 142 715Scurry 233 579 812 Ward 211 236 447Shackelfora 48 33 81 Washington 348 399 747Shelby 293 306 599 Webb 1,741 3,895 5,636Sherman 67 23 90 Wharton 623 888 1,511Smith 2,829 4,580 7,409 Wheeler 113 69 182Somervell 87 41 128 Wir''.;,? 3,814 850 4,664Starr 713 191 904 Wilt agar 207 319 526Stephens 121 81 202 Wiilacy 410 166 576Sterling 24 6 30 Williamson 2,141 2,143 4,284Stonewall 21 25 46 Wilson 269 183 452Sutton . 103 15 11B Winkler 124 118 242Swisher 193 72 265 Wise 403 327 730Tarrant 22,048 24,576 46,624 Wood 322 432 754Taylor 1,267 1,359 2,626 Yoakum 134 53 167Terrell 38 16 54 Young 362 154 516Terry 176 154 330 Zapata 94 135 229Throckmorton 50 28 78 Zavala 118 226 344Titus 277 673 950Tom Green 3,055 322 3,377 Totals 329,372 314,911 644,283

53
OUT-OF-STATE ENROLLMENTSFall 1987
StatePublic Institutions
Senior Junior Total State SeniorPublic Institutions
Junior Total
Alabama 314 158 472 Nevada 102 20 122Alaska 126 24 150 New Hampshire 79 21 100Arizona 292 97 389 New Jersey 460 91 551Arkansas 853 1,396 2,249 New Mexico 961 321 1,282California 1.521 482 2,003 New York 1,279 304 1,583Colorado 633 169 802 North Carolina 244 101 345Connecticut 206 49 255 North rakota 59 17 76Delaware 43 15 58 Ohio 532 184 716District of Columbia 76 15 91 Oklahoma 947 564 1,511Floriaa 862 315 1,177 Oregun 179 46 225Georgia 357 104 461 Pennsylvania 539 164 703Hawaii 108 37 145 Rhode Island 55 8 63Idaho 76 18 94 South Carolina 132 71 203Illinois 1,206 219 1,425 Souti Dakota 103 19 122Indiana 356 127 483 Tennessee 330 135 465Iowa 273 78 351 Utah 141 30 171Kansas 460 83 543 Vermont 30 9 39Kentucky 153 69 222 Virginia 548 119 667Louisiana 1,583 491 2,074 Washington 276 85 361Maine 68 24 92 West Virginia 75 29 104Maryland 338 76 414 Wisconsin 305 80 385Massachusetts 297 71 368 Wyoming 71 15 86Michigan 518 203 721 Canal Zone 4 1 5Minnesota 276 103 379 Guam 11 9 20Mississippi 340 74 414 Puerto Rico 164 52 216Missouri 591 140 731 Pacific Trust icI1ory 3 79 82Montana 100 25 125 Virgin Islands 43 20 63Nebraska 240 61 301 American Samoa --- --- -_-
Not Reported 176 176
Totals 19,938 7,493 27,431

FACULTY DATA

57
FACULTY HEADCOUNT BY RANK, ETHNIC ORIGIN, SEXTexas Public Universities, Fall 1987
TOTAL
White Black Hispanic Asian Indian Alien Total
Institution Male Female Male Female Male Fer .ale Male Female Male Female Male Female Male Female
East Texas State L niversity 266 111 6 3 4 5 7 2 1 285 120East Texas State UniversityCenter at Texas- cana 31 18 2 1 33 19Lamar University System
Lamar University at Beaumon' 342 162 10 10 4 2 18 2 1 374 177Midwestern State University 147 70 1 2 2 1 --- 1 152 72Pan American University . 180 90 2 1 70 43 10 5 2 266 139Pan Aial.:ican University atBrownsville . 31 13 1 --- 21 6 --- 1 53 20Stephen F. Austin State University 388 169 4 2 4 6 5 2 3 2 406 179Texas A&M University System
Prairie View A&M University 22 8 136 67 --- 2 35 5 1 194 82Tarleton State University 160 79 5 2 2 2 4 --- 1 172 83Texas A&M University 1,950 467 37 17 79 28 170 29 10 1 1 2,247 542Texas A&M University at Galveston 47 10 --- --- --- 5 --- 52 10Texas Southern University 38 18 184 107 3 2 11 4 12 5 248 136Texas State `Jniversity SystemAngelo State Univel -lty 123 72 3 --- 6 2 1 1 1 --- --- 134 75Sam Houston State University 301 128 2 3 3 1 1 --. 4 3 311 135Southwest Texas State University 580 324 5 2 18 13 12 6 5 9 3 629 348Sul Ross State University 75 25 --- --- 4 1 ,. 1 2 --- 83 27Uvalde Study Cer .ar 12 4 ..... 7 3 i --- --- --- 20 7Texas Tech University 991 381 11 6 75 11 27 7 1 1 99 23 1,204 429Texas Woman's University 163 413 2 26 8 9 4 6 1 2 5 2 183 458The University of Texas SystemThe University of Texas at Arlington 659 288 11 5 22 10 90 22 7 2 2 --- 791 327The University of Texas at Austin 1,634 643 21 11 39 27 34 11 5 2 262 92 1,995 786The University of Texas at Dallas 276 83 6 1 7 1 17 8 --- --- 2 --- 308 93The University of Texas at El Paso 341 140 2 3 61 24 13 2 2 2 7 3 426 183The University of Texasof the Permian Basin 75 '29 1 4 4 84 29The University of Texas atSan Antonio 310 138 4 2 33 14 12 6 1 360 160The University of Texas at Tyle 122 83 4 2 --- 126 85University of Houston System
University of Houston 1,104 369 23 10 38 21 116 35 7 2 --- 1,288 437University of Houston-Clear Lake 212 120 5 1 3 7 19 7 1 1 3 --- 243 136University of Houston-Downtown 140 97 16 10 11 6 16 2 2 5 2 190 117University of Houston-Victoria 30 22 --- 1 --- 3 --- --- --- --- 34 22University of North Texas 958 351 16 7 24 11 68 24 5 3 25 3 1,096 399University System of South TexasCorpus Christi State University 1,:3 58 1 11 6 --- 115 64Laredo State University 5 --- 20 8 3 --- 40 13Texas A&I University 1h6 .49 3 2 15 12 4 1 33 1 222 64West Texas State University 190 1.2 2 5 1 5 1 1 2 213 105
Totals . '1 ij3 ,,148 526 301 604 286 718 185 57 19 479 139 14,577 6,078

58
Faculty Headcount by Rank, Ethnic Origin, SexTexas Public Universities, Fall 1987
PROFESSOR
White Black Hispanic Asian Indian Alien Total
Institution Male Female Male Female Mate Female Male Female Male Female Male Female Male Female
East Texas State UniversityEast Texas State UniversityCenter at Texarkana
Lamar University SystemLamar University at Beaumont
Midwestern State UniversityPan American University
Pan American University atBrownsville
Stephen F. Austin State UniversityTexas A&M University System
Prairie View A&M UniversityTarleon State UniversityTexas A&M UniversityTexas A&M University at Galveston
Texas Southern UniversityTexas State University System
Angelo State UniversitySam Houston State UniversitySouthwest Texas State UniversitySul Ross State University
Uvalde Study CenterTexas Tech UniversityTexas Woman's UniversityThe University of Texas System
The University of Texas at ArlingtonThe University of Texas at AustinThe University of Texas at DallasThe University of Texas at El PasoThe University of Texasof the Permian Basin
The University of Texas atSan Antonio
The University of Texas at TylerUniversity of Houston System
University of HoustonUniversity of Houston-Clear LakeUniversity of Houston-DowntownUniversity of Houston-Victoria
University of North TexasUniversity System of South Texas
Corpus Chri3tl State UniversityLaredo State UniversityTexas A&I University
West Texas State University
Totals
113
12
1234143
6121
537
6004
8
5212714320
328243
139697
7981
26
3227
31544134
204
316
7258
14
2
231
6
1
12
1
214---
5
72223
1
---
1942
1059
1
6
1
87
264
---
---
22
7---
42
1
2
1
22---
2---
49
2321
1
21
2
6---
2---
7
1
4
1
8
1
5
1
21
1
1
62
211
5
3
8
6
2
324
---
1
2
1
1
1
1
3
4
1
2
2- --
2024
1
1
21
2
186
---
2
1
3
122
--.
1
3
1
1
1
1
1
5
1
32
1
3
1
1
7
---62
1
3
1
7
118
12
12541
7125
2937
6336
62
55129147
223
29745
164781
8189
30
4527
33547134
213
348
8258
15
2
231
1
14
72
16--14
72323
1
---
1946
11
681
7
1
87
2651
23
7---
73
3,611 352 91 21 74 10 90 4 18 1 74 8 3,958 396
IL 1 ' 1

59
Faculty Headcount by Rank, Ethnic Origin, SexTexas Public Universities, Fall 1987
ASSOCIATE PROFESSOR
White Black Hispanic Asian Indian Alien Total
Institution Male Female Male Female Male Female Male Female Male Female Male Female Male Female
East Texas State University 46 15 2 1 3 2 2 1 54 18East Texas State UniversityCenter at Texan', ana 9 2 1 10 2
Lamar University SystemLamar University at Beaumont 55 15 2 1 1 3 61 16
Midwestern State University 37 9 1 1 39 9Pan American University 48 7 1 15 2 2 66 9
Pan American University atBrownsville 3 2 3 6 2
Stephen F. Austin State University 71 19 2 73 19Texas A&M University System
Prairie View A&M University 5 3 26 19 6 1 1 40 23Tarleton State University 35 7 --- --- 1 1 37 7Texas A&M University 374 35 2 3 11 1 15 1 402 40Texas A&M University at Galveston 17 --- 1 18 --
Texas Southern University 12 5 42 24 2 3 1 1 2 60 3?Texas State University System
Angelo State University 25 2 1 30 2Sam Houston State University 62 16 1 1 63 17Southwest Texas State University 111 39 2 1 1 113 41Sul Ross State University 22 3 1 23 3Uvalde Study Centei 2 1 3 - --
Texas Tech University 207 46 2 3 2 3 2 215 50Texas Woman's University 52 71 1 1 3 1 1 53 77The University of Texas System
The University of Texas at Arlington 174 37 1 1 5 1 9 1 2 1 191 41The University of Texas at Austin 301 111 9 1 8 4 7 2 1 32 3 359 120the University of Texas at Dallas 39 13 1 4 4 48 13The University of Texas at El Paso 81 17 18 4 5 1 1 1 105 23The University of Texasof the Permian Basin 16 3 1 1 18 3
The University of Texas atSan Antonio 61 17 1 3 3 2 1 67 21
The University of Texas at Tyler 30 7 30 7University of Houston SystemJniversity of Houston 231 47 9 1 4 1 4 2 a 249 51University of Houston-Clear Lake 52 24 1 3 53 27University of Houston-Downtown 26 11 1 1 1 28 12University of Houston-Victoria 4 5 1 5 5North Texas State University 155 35 3 2 3 1 5 1 1 4 111 39
University System of South TexasCorpus Christi State University 25 11 1 3 1 --- 29 12Laredo State University 1 1 6 2 1 8 3Texas A&I University 38 13 1 2 1 1 2 44 14
West Texas State University 35 8 2 2 39 8
Totals 2,466 656 106 57 101 31 83 13 12 4 42 5 2,810 766

60
Faculty Headcount by Rank, Ethnic Origin, SexTexas Public Universities, Fall 1987
ASSISTANT PROFESSOR
White Black Hispanic Asian Indian Alien Total
Institution Male Female Male Female Male Female Male Female Male Female Male Female Male Female
East Texas State University 31 15 2 2 1 2 1 1 36 19East Texas State UniversityCenter at Texarkana 2 2 1 2 3Lamar University System
Lamar University at Beaumont 49 42 1 4 2 5 1 57 47Midwestern State University 22 16 1 --- 23 16Pan American University 35 27 9 10 1 45 37Pan American University atBrownsville . . . 7 1 3 3 10 4Stephen F. Austin State University 62 21 1 1 2 1 66 22Texas A&M University System
Prairie View A&M University 2 3 39 19 --- 1 10 3 51 26Tarleton State University 33 16 2 1 2 1 1 --- 38 18Texas A&M University . 218 62 10 5 16 4 26 5 1 271 76Texas A&M University at Galveston 9 3 --- --- --- 2 11 3Texas Southern University .. . 7 4 47 43 2 3 2 2 59 51Texas State University SystemAngelo State University. . . 16 26 2 1 2 1 19 29Sam Houston State University 36 14 1 --- 37 14Southwest Texas State University 82 52 2 1 3 3 5 1 92 57Sul Ross State University . 11 7 --- --- 1 1 13 7Uvalde Study Center 2 1 --- 1 3 1Texas Tech University . 128 58 2 2 7 4 7 1 13 3 157 68Texas Woman's University . 10 63 6 1 1 1 12 70The University of Texas SystemThe University of Texas at Arlington 85 37 3 --- 3 1 17 1 108 39The University of Texas at Austin 194 100 4 3 2 5 2 1 1 41 14 244 123The University of Texas at Dallas 28 9 --- --- 4 2 32 11The University of Texas at El Paso 71 37 2 14 3 5 1 1 1 91 44The University of Texas
of the Permian Basin 6 2 2 8 2The University of Texas atSan Antonio . .. . 53 18 8 1 5 1 66 20The University of Texas at Tyler 21 19 1
22 19University of Houston SystemUniversity of Houston 111 47 1 3 9 4 17 2 138 56University of Houston-Clear Lake 21 13 1 --- 1 3 1 24 16University of Houston-Downtown 23 12 2 1 2 7 1 1 1 1 36 15University of Houston-Victoria 7 2 --- -1 8 2University of North Texas . 112 55 1 1 1 7 1 2 4 124 60University System of South TexasCorpus Christi State University 6 16 1 1 --- 7 17Laredo State University 1 3 '.: 1 4 3Texas A8,1 University 19 8 1 --- 3 22 9West Texas State University . 25 22 1 2 1 28 23
Totals . . 1,545 833 117 97 91 48 139 26 6 4 66 19 1,964 1,027
i 1
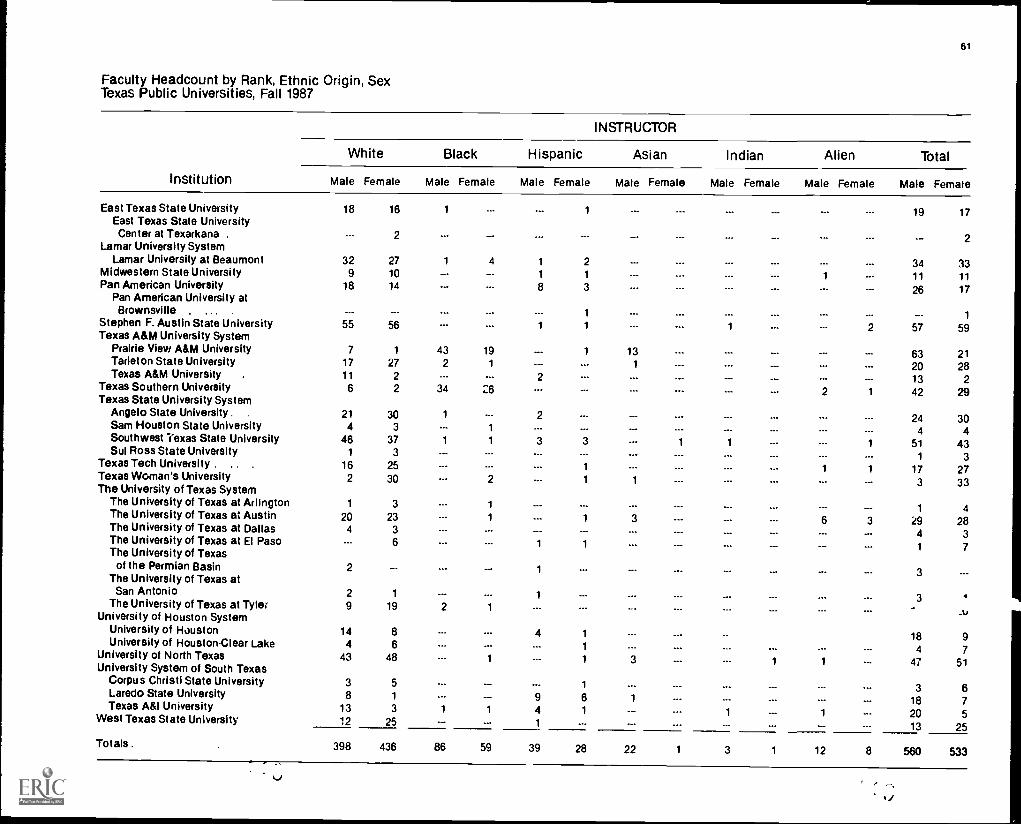
61
Faculty Headcount by Rank, Ethnic Origin, SexTexas Public Universities, Fall 1987
INSTRUCTOR
White Black Hispanic Asian Indian Alien
Institution Male Female Male Female Male Female Male Female Male Female Male Female
East Texas State UniversityEast Texas State UniversityCenter at Texarkana .
Lamar University System
18 16
2
1 1
Lamar University at Beaumont 32 27 1 4 1 2Midwestern State University 9 10 1 1 1
Pan American University 18 14 8 3Pan American University at
Brownsville . ... , --- --- 1
Stephen F. Austin State University 55 56 1 1 1 2Texas A&M University System
Prairie View A&M University 7 1 43 19 1 13Tarleton State University 17 27 2 1 1
Texas A&M University 11 2 --- 2Texas Southern University 6 2 34 26 2 1
Texas State University SystemAngelo State University . . 21 30 1 2Sam Houston State University 4 3 1 ---Southwest Texas State University 46 37 1 1 3 3 1 1 1Sul Ross State University 1 3 ---
Texas Tech University . .. 16 25 1 1 1Texas Woman's University 2 30 2 1 1
The University of Texas SystemThe University of Texas at Arlington 1 3 1
The University of Texas at Austin 20 23 1 1 3 6 3The University of Texas at Dallas 4 3The University of Texas at El Paso 6 1 1The University of Texas
of the Permian Basin 2 1
The University of Texas atSan Antonio 2 1 1
The University of Texas at Tyler 9 19 2 1
University of Houston SystemUniversity of Houston 14 8 4 1
University of HoustonClear Lake 4 6 1University of North Texas 43 48 1 1 3 1 1University System of South Texas
Corpus Christi State University 3 5 --- 1
Laredo State University 8 1 9 6 1Texas A&I University 13 3 1 1 4 1 1 1West Texas State University 12 25 1
Totals. 398 436 86 59 39 28 22 1 3 1 12 8
Total
Male Female
' e .--,
If
19 17
2
34 3311 11
26 17
--- 1
57 59
63 2120 2813 242 29
24 304 4
51 431 3
17 273 33
1 4
29 284 31 7
3
3 ,..t.,
18 94 7
47 51
3 618 720 513 25
560 533
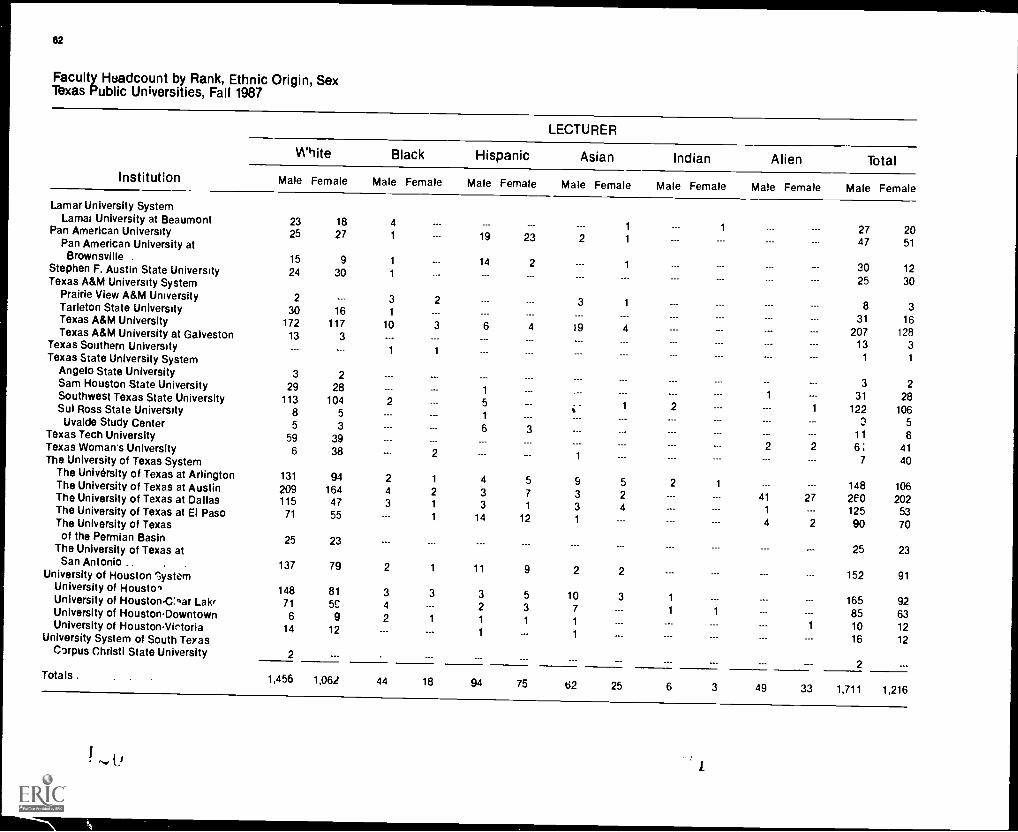
62
Faculty Headcount by Rank, Ethnic Origin, SexTexas Public Universities, Fall 1987
LECTURER
White Black Hispanic Asian Indian Alien TotalInstitution Male Female Male Female Male Female Male Female Male Female Male Female Male Female
Lamar University SystemLama( University at Beaumont 23 18 4 --- 1 1 27 20Pan American University 25 27 1 19 23 2 1 47 51Pan American University atBrownsville . 15 9 1 14 2 1 30 12Stephen F. Austin State University 24 30 1
25 30Texas A&M University SystemPrairie View A&M University 2 --- 3 2 3 1 8 3Tarleton State University 30 16 1
31 16Texas A&M University 172 117 10 3 6 4 19 4 207 128Texas A&M University at Galveston 13 3 --- 13 3Texas Southern University --- --- 1 11 1Texas State University System
Angelo State University 3 23 2Sam Houston State University 29 28 1
1 31 28Southwest Texas State University 113 104 2 5 1 2 1 122 106Sul Ross State University 8 5 12 5Uvalde Study Center 5 3 6 3
11 6Texas Tech University 59 392 2 6: 41Texas Woman's University 6 38 2 1 7 40The University of Texas System
The University of Texas at Arlington 131 94 2 1 4 5 9 5 2 1 --- 148 106The University of Texas at Austin 209 164 4 2 3 7 3 2 41 27 2e0 202The University of Texas at Dallas 115 47 3 1 3 1 3 4 1 --- 125 53The University of Texas at El Paso 71 55 --- 1 14 12 1 4 2 90 70The University of Texasof the Permian Basin 25 23
25 23The University of Texas atSan Antonio .. . . 137 79 2 1 11 9 2 2 152 91University of Houston system
University of Houstol 148 81 3 3 3 5 10 3 1 165 92University of Houston -Car Lakc 71 5C 4 2 3 7 1 1 85 63University of Houston-Downtown 6 9 2 1 1 1 11 10 12University of Houston-Victoria 14 12 --- 1 1 16 12University System of South Texas
Carpus Christi State University 22
Totals . 1,456 1,062 44 18 94 75 62 25 6 3 49 33 1,711 1,216

63
Faculty Headcount by Rank, Ethnic Origin, SexTexas Public Universities, Fall 1987
TEACHING AS SfANT
White Black Hispanic Asian Indian Alien Total
Institution Male Female Male Female Male Female Male Female Male Female Male Female Male Female
East Texas State UniversityEast Texas State UniversityCenter at Texarkana
Lamar University System
34 38
3
34 38
3
Lamar University at Beaumont 18 15 8 26 15Midwestern State University 12 1212 12Pan American University 9 9 1 u 4 5 4 1 23 18Stephen F. Austin State University 46 30 1 1 3 - 3 50 34Texas A&M University System
Prairie View A&M University --- -- 1 11 1Tarleton SW./ University 8 10 1 1 9 11Texas A&M University 395 202 9 3 31 17 73 16 3 1 511 239Texas A&M University at Galveston 4 4 - -- 4 4Texas Southern University __, - -- 4 3 4 1 8 4Texas State University System
Angelo State University 2 5 1 - -- --- 3 5Sam Houston State University 23 34 1 1 2 3 26 38Southwest Texas State University 85 69 6 5 4 3 9 1 104 78Sul Ross Sta'n University 13 4 1 1 - -- 1 1 - -- 15 6Texas Tech University 258 185 9 2 56 4 i5 6 1 1 72 17 411 215Texas Woman's University 12 108 2 8 1 3 .., 5 1 5 2 20 127The University of Texas SystemThe University of Texas at Arlington 79 62 1 6 2 37 13 2 - -- 125 77The University of Texas at Austin 153 171 5 2 14 12 10 7 66 37 248 229The University of Texas at Dallas 6 4 .., 6 2 1 .. 13 6The University of Texas at El Paso 7 15 5 --- - -- 1 1 13 16The University of Texas atSan Antonio 6 8 2 1 2 8 11University of Houston System
University of Houston 96 71 3 3 4 3 53 21 2 158 103University of Houston-Clear Lake 13 9 -- 1 1 6 3 3 23 13University of North Texa , 305 134 10 3 14 7 50 22 1 13 1 393 167University System of South TexasCorpus Christi State University --- 1
--- 1Laredo State University 1-- 1 --Texas A&I University 8 9 3 5 21 1 32 15West Texas State University 14 17
1 2 17 17Totals 1,607 1,229 44 28 155 74 269 105 7 4 206 63 2,288 1,503

64
Faculty Headcount by Rank, Ethnic Origin, SexTexas Public Universities, Fall 1987
VISITING TEACHER
White Back Hispanic Asian Indian Alien Total
Institution Male Female Male Female Male Female Male Female Male Female Male Female Male Female
East Texas State University 1 1 1 1
Lamar University SystemLamar University at Beaumont 4 4
Texas A&M University SystemPrairie View A&M University 1 --- 1 1 2 1
Tarleton State University --- 1 . -- --- 1
Texas A&M Jniversity 92 32 2 6 2 12 3 112 37Texas Southern University 3 2 7 3 --- 1 3 14 5Texas Tech University 14 3 2 2 18 3The University of Texas System
The University of Texas at Arlington 13 4 13 4The University of Texas at Austin . 16 4 10 1 26 5The University of Texas at Dallas 3 --- 3 - --
The University of Texas at El Paso 6 1 1 7 1
The University of Texas atSan Antonio 7 5 1 7 6
University of Houston SystemUniversity of Houston 43 16 4 1 6 2 53 19University of Houston-Clear Lake 3 4 6 4University of Houston-Downtown 3 5 3 5University of Houston-Victoria --- 1 --- 1
University System of South TexasCorpus Christi State University 4 4Laredo State U,V"arsity 1 1Texas A&I University 11 12 1 1 2 1 3 17 14
Totals . 227 91 10 6 15 4 20 5 19 1 291 107

65
Faculty Headcount by Rank, Ethnic Origin, SexTexas Public Universities, Fall 1987
ADJUNCT/SPECIAL
White Black Hispanic Asian Indian Alien Total
Institution Male Female Male Female Male Female Male Female Male Female Male Female Male Female
East Texas State UniversityEast Texas State University
23 12 23 12
Center at Texarkana 8 7 1 9 7Lamar University System
Lamar University at Beaumont 38 22 1 2 40 23Midwestern State University 26 22 1 26 23Pan American University 2 --- 3 5 - --
Stephen F. Austin State University 9 1 1 10 1
Texas A&M University SystemTexas A&M University 88 3 2 1 2 5 1 98 4
Texas Southern University 2 2Texas State University System
Sam Houston State University 20 11 1 21 11Sul Ross State University --- 2 --- 2
Texas Tech University 27 6 1 28 6lexas Woman's University 38 61 3 3 1 2 43 65The University of Texas System
The University of Texas at Arlington 37 41 2 2 2 1 1 41 45The University of Texas at Austin 44 11 4 48 11The University of Texas at Dallas 2 6 2 6The University of Texas at El Paso 24 12 1 4 3 1 30 15The University of Texas at
San Antonio 12 2 12 2The University of Texas at Tyler 35 31 1 1 36 32
University of Houston SystemUniversity of Houston 146 73 5 4 1 14 5 3 2 172 81University of Houstor. Clear Lake 1 1 -.- --- --- 1 1
University of Houston-Downtown 69 60 12 7 7 5 8 1 3 100 72University of Houston-Victoria 1 2 --- --- --- 1 2
University of North Texas 139 57 1 4 :' 2 2 148 59University System of South Texas
Corpus Christi State University 32 18 4 3 36 21Texas A&I University 5 - --- 5 --
West Texas State University 55 28 2 1 1 58 29
Totals 883 489 28 15 35 16 33 6 5 2 11 2 995 530

66
FACULTY HEADCOUNT BY TENURE, ETHNIC ORIGIN, SEXTexas Public Universities, Fall 1987
TOTAL
White Black Hispanic Asian Indian Alien Total
Institution Male Female Male Female Male Female Male Female Male Female Male Female Male Female
East Texas State University 150 38 1 1 3 1 5 2 1 161 41East Texas State UniversityCenter at Texarkana 18 3 1
19 3Lamar University SystemLamar University at Beaumont 166 46 3 4 4 1 2 1 175 52Midwestern State University 79 9 1 1 81 9Pan American University 127 32 1 30 11 3 2 1 164 43Pan American University atBrownsville 14 3 --- 5 2 19 5Stephen F. Austin State University 212 40 1 1 2 2 4 1 220 43Texas A&M University System
Prairie View A&M University 7 1 56 26 6 1 69 28Tarleton State University 77 12 --- --- 1 78 121 'is A&M University 930 50 4 4 12 1 27 1 5 1 979 56Itaas A&M University at Galveston 18 --- 2 20Texas Southern University 20 13 115 49 2 2 10 4 147 68Texas State University SystemAngelo State University 78 16 1 2 1 1 1 83 17Sam Houston State University 194 43 1 2 1 1 1 197 46Southwest T'xas State University 263 76 2 1 2 1 2 269 78Sul Ross State University 35 7 --- 1 1 37 7Uvalde Study Center 4 --- 4 ---Texas Tech University 441 75 1 6 2 4 7 458 78Texas Woman's University 69 123 7 3 5 --- 1 1 72 137The University of Texas SystemThe University of Texas at Arlington 319 54 3 1 7 1 26 2 5 1 360 59The University of Texas at Austin 995 170 12 2 19 5 13 4 1 94 10 1,137 188The University of Texas ..t Dallas 116 13 3 --- 4 4 127 13The University of Texas at El Paso 181 36 1 2 25 5 6 2 215 43The University of Texasof the Permian Basin 37 4 1 3 1 42 4The University of Texas atSan Antonio 89 25 2 11 3 4 1 1 107 29The University of Texas at Tyler 48 15 --- 48 15University of Houston System
University of Houston 366 44 7 1 4 2 11 1 389 47University of Houston-Clear Lake 93 27 1 --- 3 2 97 30University of HoustonDowntown 37 11 2 1 --- 1 1 41 12University of HoustonVictoria 5 5 --- 1 6 5University of North Texas 360 69 4 2 2 2 6 1 4 1 5 381 75University System of South TexasCorpus Christi State University 51 19 1 6 1 58 20Laredo State University 4 5 --- 9Texas A&I University 92 20 1 7 4 4 3 107 24West Texas State University 98 24 2 2 1 1 102 26
Totals 5,793 1,123 224 103 169 55 149 16 31 6 112 10 6,478 1,313
I 0 i
' c 1

67
Faculty Headcount by Tenure, Ethnic Origin, SexTexas Public Universities, Fall 1987
PROFESSOR
White Black Hispanic Asian Indian Alien Total
Institution Male Female Male Female Male Female Male Female Male Female Male Female Male Female
East Texas State UniversityEast Texas State UniversityCenter at Texarkana
Lamar University SystemLamar University at Beaumont
Midwestern State UniversityPan American University
Pan American University atBrownsville
Stephen F. Austin State UniversityTexas A&M University System
Prairie View A&M UniversityTarleton State UniversityTexas A&M UniversityTexas A&M University at Galveston
Texas Southern UniversityTexas State University System
Angelo State UniversitySam Houston State UniversitySouthwest Texas State UniversitySul Ross State University .
Uvalde Study CenterTexas Tech University .
Texas Woman's UniversityThe University of Texas System
The University of Texas at ArlingtonThe University of Texas at AustinThe University of Texas at DallasThe University of Texas at El PasoThe University of Texasof the Permian Basin
The University of Texas atSan Antonio ..
The 'Jniversity of Texas at TylerUniver: ty of Houston System
University of HoustonUniversity of Houston-Clear LakeUniversity of Houston-DowntownUniversity of Houston-Victoria
University of North TexasUniversity System of South Texas
Corpus Christi State UniversityLaredo State UniversityTexas A&I University
West Texas State University
Totals
101
12
933742
4115
435
58648
5011513517
2262
37
136697
7979
23
3225
2314410
4193
304
6051
13
2
11
1
6
1
12
214
4
72122
1
1938
1059
1
6
1
87
164
---
21
7---22
1
1
---1
21---2
45
2321
1
1
1
2
6---
2
5
1
4
1
8
1
4
1
21
---
1
---42
211
5
3
8
2
2
324
---
1
2
1
1
1
1
2
3
1
2
2---
1724
1
1
1
1
2
176
2
1
3
92
---
1
3
1
1
1
1
2
1
5
1
32
1
3
1
1
6
---
62
1
2
7
105
12
943753
5119
2735
6156
58
53117137
192
27439
160781
8187
27
4525
24347104
202
336
6951
14
2
11
1
7
1
14
62
16- --
10
72222
1
- --
1942
11
681
7
1
87
1651
- --
In
7- --
43
3,357 318 84 19 66 9 81 4 18 1 72 7 3,678 358
! Uj1 :q

611
Faculty Headcount by Tenure, Ethnic Origin, SexTexas Public Universities, Fall 1987
ASSOCIATE PROFESSOR
White Black Hispanic Asian Indian Alien Total
Institution Male Female Male Female Male Female Male Female Male Female Male Female Male Female
East Texas State University 31 12 2 2 1 36 12East Texas State UniversityCenter at Texarkana 6 1 1 7 1Lamar University System
Lamar University at Beaumont 39 11 1 1 1 2 43 12Midwestern State University 31 5 1 1 33 5Pan American University . 48 7 1 13 2 2 64 9Pan American University atBrownsville .. 3 2 2 5 2Stephen F. Austin State University 63 16 2 65 16Texas A&M University System
Prairie View A&M University . 3 1 22 15 3 1 28 17Tarleton State University 28 7 --- --- 1 29 7Texas A&M University . 330 32 2 2 7 1 10 1 349 36Texas A&M University at Galveston 14 -- --- --- 14 - --Texas Southern University 9 4 38 17 1 3 1 51 22Texas State University SystemAngelo State University 24 2
1 25 2Sam Houston State University 60 15 1 1 61 16Southwest Texas State University 98 38 2 1 99 40Sul Ross State University 15 115 1Uvalde Study Center 2 ---
2 ---Texas Tech University 165 44 1 2 1 2 1 170 46Texas Woman's University 31 51 1 3 1 i 32 56The University of Texas SystemThe University of Texas at Arlington 167 36 1 1 4 1 9 1 2 1 --- 183 40The University of Texas at Austin 298 111 9 1 8 4 7 2 1 32 3 356 120The University of Texas at Dallas 37 12 1 4 --- 4 --- --- 46 12The University of Texas at El Paso 76 15 18 4 4 1 99 191 he University of Texasof the Permian Basin 14 3 1
15 3The University of Texas atSan Antonio . 57 17 1 3 3 1 1 62 21The University of Texas at Tyler 23 6
23 6University of Houston SystemUniversity of Houston . 127 19 6 1 2 1 2 1 138 21University of Houston-Clear Lake 49 23
1 e 50 25University of Houston-Downtown 16 8 11 18 8University of Houston-Victoria 1 5
1 2 5University of North Texas 134 32 4 2 1 5 1 1 4 146 36Universl'j System of South TexasCo ' ow Christi State University 21 10 1 3 1 25 11Lar..do State University --- --- 3
3 ..Texas AEI University 23 12 1 2 1 1 1 28 13West Texas State University 29 7 2 2 33 7Totals 2,072 565 89 41 80 26 64 9 11 3 39 3 2,355 647
3

69
Faculty Headcount by Tenure, Ethnic Origin, SaxTexas Public Universities, Fall 1987
ASSISTANT PROFESSOR
White Mack Hispanic Asian Indian Alien Total
Institution Male Female Male Female Male Female Mate Female ale Female Male Female Male Female
East Texas State University 15 8 1 1 1 1 17 10Lamar University System
Lamar University at Beaumont 19 21 1 2 2 1 22 24Midwestern State University 11 3 11 3Pan American University . 33 17 7 8 1 41 25
Pan American Uniy-Jrsity atBrownsville 7 2 2 9 2
Stsphen F. Austin State University 31 11 1 2 33 12Texas A&M University System
Prairie View A&M University --- --- 13 5 1 14 5Tarleton State University 13 2 13 2Texas A&M University 14 4 - - 1 15 4
Texas Southern University . 3 4 25 25 2 3 2 31 33.exas State University System
Angelo State Ul, versity 4 7 1 1 5 8Sam Houston State University 16 6 16 6Southwest Texas State University 29 14 1 1 31 14Sul Ross State University 3 3 3 3
Texas Tech University 14 12 1 14 13Texas Woman's University 1 2' 3 1 1 33The University of Texas System
The University of rexas at Arlington 16 8 1 17 8Tha University of Texas at El Paso 26 15 2 2 1 29 17The University of Texas at Tyler --- 2 --- 2
University of Houston SystemUniversity of Houston 8 7 1 1 8University of Houston-Downtown 11 3 2 13 3
University of North Texas 27 15 1 27 16University System of South Texas
Corpus Christi State University --- 2 --- 2Texas A&I University 7 6 1 7 7We-t TeYas SU. University 16 14 ---1 16 15
Totals 324 213 43 39 19 18 4 3 2 2 1 393 275

70
Faculty Headcount by Tenure, Ethnic Origin, SexTexas Public Universities, Fall 1987
INSTRUCTOR
White Black Hispanic Asian Indian Alien Total
Institution Male Female Male Female Male Female Male Female Male Female Male Female Male Female
East Texas State University 3 5 3 5Lamar University SystemLamar University at Beaumont 15 3 1 1 1 16 5Pan American University 4 2 2 6 2Stephen F. Austin State University 3 1 3 1Texas A&M University SystemTarleton State University 1 1
1 1Texas Southern University . 1 7 2 7 3Texas State University SystemSam Houston State University 3 1 1 3 2Southwest Texas State University 1 2 1 2 2Sul Ros- State University . 2
2Texas Woman's University 5 1 6University of Houston SystemUniversity of Houston . 2
2University of North Texas 6 1 6 1University System rsf :t.,:th TexasTexas Adel University 2 1 3West Texas State University 2 1
2 1
Totals 40 27 8 4 4 2 52 33

71
FACULTY HEADCOUNT BY ETHNIC ORIGIN, SEXTexas Public Community Junior Colleges and Technical Institutes, Fall 1987
White Black Hispanic Asian Indian Alien Total
Institution Male Female Male Female Male Female Male Female Male Female Male Female Male Female
Alamo Community College DistrictPalo Alto College 49 27 2 4 27 21 1 --- 1 80 52San Antonio College 458 233 4 6 87 26 4 2 4 1 3 1 560 269St. Philip's College 129 53 41 33 58 25 3 2 2 2 233 115
Al'iin Community College 118 66 4 1 7 1 -- 129 68Amarillo CollegeAngelina College
14377
11354
-
1
23
21
1
1
1
---
1
1
2---
14679
11959
Austin Community College 534 300 22 29 40 24 20 10 5 1 622 363Bee County College 50 44 1 2 15 11 --- 1 66 58Blinn College 123 77 4 2 2 --- 1 1 131 79Brazosport College 100 43 1 1 3 2 2 106 46Central Texas College 141 62 3 14 2 2 --- 2 148 78Cisco Junior College 66 27 2 3 --- 2 1 69 32Clarendon College 38 22 --- --- 2 40 22College of the Mainland 81 6A 5 8 4 6 1 1 90 80Collin County Community College
District . 103 115 3 4 2 4 2 2 1 1 111 126Cooke County College 61 50 1 1 1 1 65 50Uallas County Community College
DistrictBrookhaven CollegeCedar Valley College
14079
15441
510
1314
65
2 92
21 --- 1
1609660 17571
Eastfield College 211 125 11 13 7 3 3 2 234 141El Centro College 124 129 15 30 4 3 1 3 1 147 163Mountain View College 130 62 3 9 4 2 2 2 --- 141 73North Lake College 168 105 2 4 3 1 3 --- 1 176 111Richland College 273 258 9 11 5 11 4 3 3 2 294 285
Del Mar Col'egeEl Paso County Community CollegeFrank Phillips College
19826134
14421029
57
1
1
1620
1831
26114
3
7
---
1
....
221
23
---
2:37
46037
173344
29Galveston College 72 55 4 9 3 7 5 3 --- 84 74Grayson County College 80 37 --- 1 --- --- 1 81 38Hill Junior College 42 26 1 1 1 44 27Houston Community College 431 317 97 92 28 26 31 8 2 6 1 595 444Howard County Junior College District
Howard College at Big Spring 50 52 1 4 1 55 54Southwest Collegiate Institutefor the Deaf 8 12 1 1 9 13
Kilgore College 100 82 2 1 101 84Lamar University ystem
Lamar University at Orange 19 29 2 1 19 32Lamar University at Port Arthw 31 45 2 1 32 47
L111111MMIIMillmlw

72
Faculty Headcount by Ethnic Origin, .AsxTexas Public Community Junior Co Ileoos and Technical Institutes, Fall 1987
White Black Hispanic Asian Indian Alien TotalIntitution Male Female Male Female Male Female Male remale Male Female Male Female Male Female
Laredo Junior College . 35 21 1 --- 62 42 2 1 1 100 65Lee College . . . . 162 68 3 3 2 167 71McLennan Community College 107 103 6 8 3 2 116 113Midland College . 111 58 4 1 3 1 1 119 60Navarro College . 70 45 1 1 1 --- 72 46Northeast Texas Community College 40 30 1 --- --- 41 30North Harri° Cwinty College 220 249 2 13 5 7 7 2 234 271Odessa College . 152 78 3 2 2 1 1 158 82Panola Junior College . 32 29 1 --- 33 29Paris Junior College . 57 47 2 1 1 59 49Ranger Junior CollegeSan Jacinto College District - 20 12 i 1 --- --- 21 13Central Campus . .. 198 144 4 10 4 6 2 208 160North Campus . 86 64 3 5 2 1 1 i 93 70South Campus .. 82 91 4 2 5 3 2 93 96South Plains College . 136 83 --- 1 5 2 1 1 143 86Southwest Texas Junior College 46 38 1 --- 27 16 74 54Tarrant County Junior College District
Northeast Campus . 112 128 5 2 7 10 6 11 3 193 151Northwest Campus . 85 54 1 . -- 5 3 5 4 2 98 61South Campus . . 152 98 4 1 4 1 8 9 2 1 170 110Ter 'pie Junibr College 52 45 --- 3 1 --- 1 54 48Texarkana Comr :unity College 81 71 3 1 --- --- --- 84 72Texas Southmost College 73 50 3 1 61 27 2 2 4 3 143 83Texas State Technical le otauteAmarillo Campus . 107 22 1 2 3 2 1 112 26Harlingen Campus 91 40 4 3 81 41 2 1 178 85Sweetwater Campus . 69 27 1 --- 2 1 3 75 28Waco Campus . . . 351 76 16 10 11 3 2 1 1 382 89Trinity Valley Community College 92 55 1 1 --- --- 93 56Tyler Junior College 163 169 4 5 2 3 1 2 172 177Vernon Regional Junior College 37 49 --- 2 --- --- 1 39 50Victoria College . - . 73 39 2 2 73 43Weatherford College 51 36 . -- --
51 36Western Texas College 38 17 --- --- 1 38 18Wharton County Junior College 63 49 1 1 5 1 69 51Totals . . 8,026 5,447 345 412
_840 499 155 71 50 20 16 6 9,432 6,455

FACULTY SALARIES, ALL RANKSPublic Universities, 1983 - 1988 (Nine Months)
Institution 1983 - 84 1984 - 85 1985 - 86 1986 - 87 1987 - 88
East Texas State University $25,647 $26,234 $27,801 $27,087 $27,979East Texas State University at Texarkana 27,430 28,774 31,740 30,571 33,217
Lamar University SystemLamar University at Beaumont 23,870 24,854 26,283 26,202 28,279Midwestern State University 24,803 26,077 26,945 28,204 29,835Pan American University . 24,670 25,171 27,120 27,979 29,699Pan American University at Brownsville 23,694 25,199 25,968 26,520 28,768
Stephen F. Austin State University 24,781 25,206 26,474 26,909 28,351Texas A & M University SystemPrairie View A&M University . 25,091 26,097 27,931 28,405 30,321Tarleton State University 25,057 26,059 26,100 26,018 27,623Texas A&M University 27,144 27,950 29,271 30,924 34,220Texas A&M University at Galveston 22,394 22,941 23,254 24,130 27,162Texas Southern University .... 25,688 27,053 28,434 28,354 2C,704Texas State University SystemAngelo State University 26,903 27,850 28,843 28,675 31,344Sam Houston State University 27,775 28,176 :'.),297 30,073 30,411Southwest Texas State University 25,413 26,070 26,632 26,582 30,760Sul Ross State University 24,141 24,820 24,142 23,570 24,159Uvalde Study Center 19,238 20,792 23,781 23,499 23,952Texas Tech University 27,488 28,119 29,224 28,982 30,716Texas Woman's University 25,827 27,220 27,463 26,595 27,876The University of Texas SystemThe University of Texas at Arlington 25,512 25,986 26,900 26,608 30,796The University of Texas at Austin 29,490 30,770 33,023 34 395 39,688The University of Texas at Dallas 23,851 26,038 26,950 26,571 29,411The University of Texas at El Paso 24,848 25,503 26,383 25,303 29,696The University of Texas of the Permian Basin 27,658 28,848 35,546 32,483 32,896The University of Texas at San Antonio 25,267 25,455 26,388 27,186 29,701The University of Texas at Tyler 26,176 26,767 30,942 30,719 32,599University of Houston SystemUniversity of Houston 27,533 28,771 29,533 30,294 32,785University of Houston-Clear Lake 27,046 27,745 33,674 30,332 31,350University of Houston-Downtown 21,785 23,584 22,796 23,985 25,088University of Houston-Victoria 23,929 24,837 27,246 26,983 28,953University of North Texas 25,147 25,856 26,375 26,293 28,066University System of South TexasCorpus Christi State University 27,097 27,230 28,012 26,622 29,392Laredo State University 28,701 30,461 30,893 30,610 31,517Texas A&I University . 26,496 26,978 27,851 27,422 28,429West Texas State University 23,267 24,249 25,669 25,850 27,183
Average: All Institutions Combined $26,497 $27,412 $28,670 $29,057 $31,929
Note- These data include part-time faculty members, teaching assistants and lecturers

AVERAGE BUDGETED FACULTY SALARIES AND RANGES, BY RANK AND INSTITUTIONPublic Universities, Nine Months: 1987 - 88
Inc../itution
Professors Associate Professors
No. FTEFaculty
AverageSalaries
HighestSalaries
LowestSalaries
No. FTEFaculty
AverageSalaries
HighestSalaries
LowestSalaries
East Texas State University 127.38 $38,104 $47,417 $29,860 65.75 $30,431 $40,495 $22,884East Texas State University at Texarkana 14.50 38,634 43,848 31,194 10.50 37,251 38,952 28,611Lamar University SystemLamar University at Beaumont 99.55 38,897 50,108 30,595 80 38 30,960 43,608 24,000Midwestern State University 38.26 40,232 46,710 31,617 43.51 33,270 42,048 24,912Pan American University 58.58 41,058 58,332 31,944 75 88 32,847 45,672 25,260Pan American University at Brownsville 7.67 39,859 40,788 38,712 7.50 34,085 36,936 30,528Stephen F. Austin State University 127.93 38,607 49,707 29,914 93.84 31,324 39,000 24,082Texas A&M University SystemPrairie View A&M University 28.90 38,042 51,000 24,680 64 95 33,715 47,609 21,793Tarleton State University 33.15 36,524 44,123 30,342 43.91 31,784 40,039 23,427Texas A&M University . 541.97 51,415 129,789 28,332 411.60 38,828 61,470 23,643Texas A&M University at Galveston 5.25 35,399 40,087 32,733 15.50 30,425 38,067 25,085Texas Southern University.
86.12 37,311 59,108 30,000 90.90 31,588 51,908 22,106Texas State University SystemAngelo State University . 57.38 39,697 48,905 36,615 31.00 34,690 39,940 27,900Sam Houston State University 138.50 38,235 45,072 33,300 81.50 32,548 41,274 25,758Southwest Texas State University 149.91 41,641 48,132 33,111 154.16 34,574 43,128 28,3686ul Ross State University . . 21.75 34,904 38,484 30,240 23 75 28,937 33,903 24,075Uvalde Study Center . 2.25 34,287 35,271 33,138 3.00 29,316 30,906 27,774Texas Tech University.
309.91 46,487 79,560 25,974 265.90 34,124 57,200 23,140Texas Woman's University . 81 41 40,730 52,440 30,540 130.05 31,487 43,840 24,870The University of Texas SystemThe University of Texas at Arlington 165.39 47,361 74,900 27,800 228.07 35,371 52,400 24,300The University of Texas at Austin 872.50 58,077 155,870 24,243 501.56 38,296 63,000 22,000The University of Texas at Dallas 81.04 52,498 102,000 38,900 63.59 38,249 55,000 30,100The University of Texas at El Paso 99.21 43,790 62,108 32,454 138 25 35,827 49,719 28,087The University of Texas of Permian Basin 31.00 38,603 44,520 30,925 20.10 31,856 41,351 26,366The University of Texas at San Antonio 58.00 42,497 53,798 34,443 101.00 34,536 4C,100 23,600The University of Texas at Tyler 30.75 42,818 51,988 33,000 37 25 35,291 45,158 30,328University of Ncuston SystemUniversity of Houston .. 372.04 52,972 108,274 25,500 340.38 36,969 59,2E0 20,137University of Houston-Downtown
15.25 42,709 54,000 34,844 44 96 34,194 56,542 26,000University of Houston-Clear Lake 46.92 42,691 59,100 32,306 78 74 35,702 40,653 21,359University of Houston-Victoria 4.00 34,756 36,580 32,301 9.00 33,299 39,088 27,629University of North Texas240.55 43,003 74,000 23,000 211.00 34,452 54,000 21,000Universay System of South Texas
Corpus Christi State University 40.13 38,821 47,943 32,068 40 25 30,195 36,945 24,000Laredo State University9.50 37,364 42,702 32,670 11.50 28,293 38,668 25,601Texas AEI University . 87.80 34,190 44,680 29,473 58.10 30,350 43,500 22,566West Texas State University 55.00 38,097 50,000 32,167 48.00 30,295 37,605 23.965
Total . .4139.45
3625.33Wei &Med Average .
$47,437$35,111
14 4
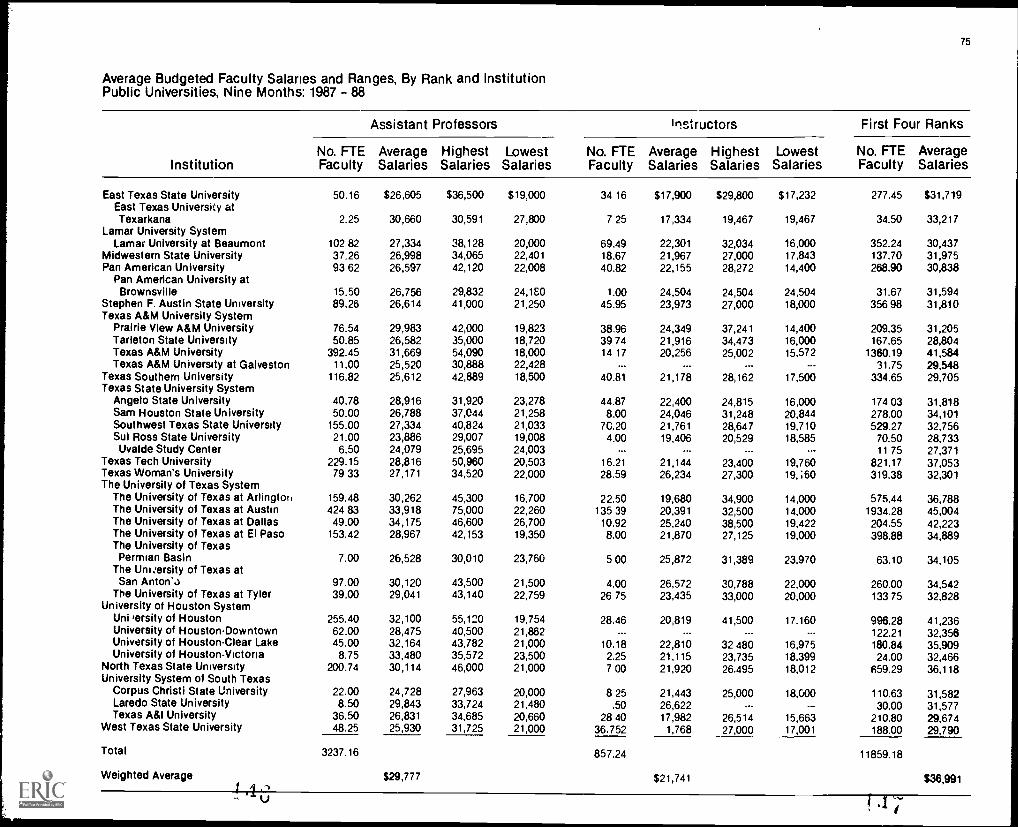
75
Average Budgeted Faculty Salaries and Ranges, By Rank and InstitutionPublic Universities, Nine Months: 1987 - 88
Institution
Assistant Professors Instructors First Four Ranks
No. FTEFaculty
AverageSalaries
HighestSalaries
LowestSalaries
No. FTEFaculty
AverageSalaries
HighestSalaries
LowestSalaries
No. FTEFaculty
AverageSalaries
East Texas State University 50.16 $26,605 $36,500 $19,000 34 16 $17,900 $29,800 $17,232 277.45 $31,719East Texas University atTexarkana 2.25 30,660 30,591 27,800 7 25 17,334 19,467 19,467 34.50 33,217
Lamar University SystemLamar University at Beaumont 102 82 27,334 38,128 20,000 69.49 22,301 32,034 16,000 352.24 30,437
Midwestern State University 37.26 26,998 34,065 22,401 18.67 21,967 27,000 17,843 137.70 31,975Pan American University 93 62 26,597 42,120 22,008 40.82 22,155 28,272 14,400 268.90 30,838
Pan American University atBrownsville 15.50 26,756 29,832 24,180 1.00 24,504 24,504 24,504 31.67 31,594
Stephen F. Austin State University 89.26 26,614 41,000 21,250 45.95 23,973 27,000 18,000 356 98 31,810Texas A&M University System
Prairie View A&M University 76.54 29,983 42,000 19,823 38.96 24,349 37,241 14,400 209.35 31,205Tarleton State University 50.85 26,582 35,000 18,720 39 74 21,916 34,473 16,000 167.65 28,804Texas A&M University 392.45 31,669 54,090 18,000 14 17 20,256 25,002 15,572 1360.19 41,584Texas A&M University at Galveston 11.00 25,520 30,888 22,428 --- 31.75 29,548
Texas Southern University 116.82 25,612 42,889 18,500 40.81 21,178 28,162 17,500 334.65 29,705Texas State University System
Angelo State University 40.78 28,916 31,920 23,278 44.87 22,400 24,815 16,000 174 03 31,818Sam Houston State University 50.00 26,788 37,044 21,258 8.00 24,046 31,248 20,844 278.00 34,101Southwest Texas State University 155.00 27,334 40,824 21,033 7C.20 21,761 28,647 19,710 529.27 32,756Sul Ross State University 21.00 23,886 29,007 19,008 4.00 19,406 20,529 18,585 70.50 28,733
Uvalde Study Center 6.50 24,079 25,695 24,003 11 75 27,371Texas Tech University 229.15 28,816 50,960 20,503 16.21 21,144 23,400 19,760 821.17 37,053Texas Woman's University 79 33 27,171 34,520 22,000 28.59 26,234 27,300 19, ;50 319.38 32,301The University of Texas System
The University of Texas at Arlington 159.48 30,262 45,300 16,700 22.50 19,680 34,900 14,000 575.44 36,788The University of Texas at Austin 424 83 33,918 75,000 22,260 135 39 20,391 32,500 14,000 1934.28 45,004The University of Texas at Dallas 49.00 34,175 46,600 26,700 10.92 25,240 38,500 19,422 204.55 42,223The University of Texas at El Paso 153.42 28,967 42,153 19,350 8.00 21,870 27,125 19,000 398.88 34,889The University of Texas
Permian Basin 7.00 26,528 30,010 23,760 500 25,872 31,389 23,970 63.10 34,105The University of Texas at
San Anton'o 97.00 30,120 43,500 21,500 4.00 26,572 30,788 22,000 260.00 34,542The University of Texas at Tyler 39.00 29,041 43,140 22,759 26 75 23,435 33,000 20,000 133 75 32,828
University of Houston SystemUni 'ersity of Houston 255.40 32,100 55,120 19,754 28.46 20,819 41,500 17.160 996.28 41,236University of Houston-Downtown 62.00 28,475 40,500 21,862 --- --- ... ... 122.21 32,356University of Houston-Clear Lake 45.00 32,164 43,782 21,000 10.18 22,810 32 480 16,975 180.84 35,909University of Houston - Victoria 8.75 33,480 35,572 23,500 2.25 21,115 23,735 18,399 24.00 32,466
North Texas State University 200.74 30,114 46,000 21,000 7 00 21,920 26,495 18,012 659.29 36,118University System of South Texas
Corpus Christi State University 22.00 24,728 27,963 20,000 8 25 21,443 25,000 18,000 110.63 31,582Laredo State University 8.50 29,843 33,724 21,480 .50 26,622 - --- 30.00 31,577Texas A8,1 University 36.50 26,831 34,685 20,660 28 40 17,982 26,514 15,663 210.80 29,674
West Texas State University 48.25 25,930 31,725 21,000 36.752 1,768 27,000 17,001 188.00 29,790
Total 3237.16 857.24 11859.18
Weighted Average $29,777 $21,741 $36,991I
V

7S
Average Budgeted Faculty Salaries and Ranges, By Rank and institutionPublic Universities, Nine Months: 1987 - 88
Institution
Lecturers Teaching Assistants All RanksNo. FTEFaculty
AverageSalaries
No. FTEFaculty
AverageSalaries
No. FTEFaculty
t,verageSalaries
East Texas State University . .
$ 59.55 $10,551 337.00 $27,979East Texas State University at Texarkana...
34.50 33,217Lerner University SystemLamar University at Beaumont
31.85 18,009 20.42 7,076 404.51 28,279Midwestern State University . 7.57 12,059 8.30 10,550 153.57 29,835Fan American University .5.80 13,229 13.22 13,770 287.92 29,699Pan American University at Brownsville6.90 15,800 ... --- 38.57 28,768Stephen F. Austin State University
25.13 19,014 52.91 9,450 435.02 28,331Texas A&M University SystemPrairie View A&M University
--- --- 22.34 22,0.32 231.69 30,321Tarleton State University10 92 14,710 3.75 12,417 182.32 27,323Texas A&M University . .
229 68 21,987 345.67 13,370 1935.54 34,220Texas A&M University at Galveston10.91 20,217 - -- --- 42.66 27,162Texa- Southern University .
.50 28,960335.15 29,704Texas State University System
Angelo State University2 40 19,388 3.00 13,3'6 179 43 31,344Sam Houston State University
33.00 23,418 39 00 9,838 350.00 30,411Southwest Texas State University81.87 23,933 31.25 14,843 642.?" 30,760Sul Ross State University .
10.83 19,749 17.00 8,000 98. 1 24,159Uvalde Study Center3.00 10,560 .. . 14.. 23,952
Texas Tech University ..58.36 24,520 267.76 12,631 1147.29 30,716Texas Woman's University414.44 18,630 59.66 11,850 426.48 27,876The University of Texas System
The University of Texas at Arlington143.40 27,760 162.78 12,290 881 62 30,796The University of Texas at Austin63.57 30,804 410.22 16,000 2408.07 39,688The University of Texas at Dallas51.15 15,660 121 55 13 636 377 25 29,411The University of Texas at El Pasc28.81 12,356 82 88 10,733 510.57 29,696The University of Texas Permian Basin7.40 22,582 --- ... 70.50 32,896The University of Texas at San Antonio 107.55 18,000
367.55 29,701The University of Texas at Tyler11.05 29,824
144.80 32,599University of Houston System
University of Houston .
15,1.66 16,092 281 66 12,062 1432.60 32,785University of Houston-Downtown
74.50 13,167 --- - -- 196.71 25,088University of Houston-Clear Lake32.25 10,861 6.50 6,153 219.59 31,350
University of Houston-Victoria5.00 12,096 --- .. 29 00 28,953
University of North Text 339.05 24,429 321 57 12 000 1019 91 28,066
University System of South TexasCorpus Christi State University
17 92 15,875128.55 29,392
Laredo State University .--- --- -- --- 30.00 31,577
Texas A&I University15 00 10,956 225 80 28,429
West Texas State University21.31 18,000 16 75 9,600 226 06 27,18nTotal . ,
1325.78 2362.74 15547.70Weighted Average
$20,508 $12,929 $31,929Source: institutional data reported to the Coordinating Board.

77
STUDENT-FACULTY RATIOSPublic Universities, 1983 - 1988 (Nine Months)
Institution 1983 - 84 1984 - 85 1985 - 66 1986 - 87 1987 - 88
East Texas State University 12.9 12.1 12.4 13 1 13.0East Texas State University at -lexarkana 13 4 14.2 14.9 14.8 15.9
Lamar University-Beaumont 20.7 19.6 18.8 19.6 20.7Midwestern State University 20.4 20 4 19.9 20.8 21.4Pan American University 20.7 21.5 18.8 22.7 23.5
Pan American University at Brownsville 12.6 14.9 14.9 13.8 14.8Stephen F. Austin State University 22.8 23.5 22.2 24.2 23.9Texas A & M University System
Prairie View A & M University 18 4 16.5 16 9 18 4 19 9Tarleton State University 23.3 24.2 22.2 22 3 24.6Texas A & M University 15.2 15.0 15.6 '5 9 16.8Texas A & M University at Galveston 11 6 12.0 11.6 10.7 12.2
Texas Southern University 18 7 17.1 16.4 15.5 15.8Texas State Ur'versity System
Angelo State University 27.1 25.9 25.2 25.7 25.7Sam Houston State University 23 0 21.9 22.5 24.8 24.6Southwest Texas State University 24.4 25 0 23.7 23.4 25.4Sul Ross State University 19.0 1'.1 15.3 14.9 14.5Uvalde Study Center 11.4 10.2 11.1 11.1 9.6
Texas Tech University 17.7 16.9 17.1 17.7 16.9Texas Woman's University 12.0 11 3 10.6 10.4 11.5The University of Texas System
The University of Texas at Arlington 17.4 17.2 17 0 17.1 17.9The University of Texas at Austin 16 0 15.8 15.7 15 3 15.9The University of Texas at Dallas 96 9.5 93 94 99The University of Texas at El Paso 20 C 19 5 17 9 16.5 19.7The University of Texas of the Permian Basin 15.1 15.1 14 4 14.3 10.9The University of Texas at San Antonio 22 9 22.5 21 1 22.4 23.9The Ulliversity of Texas at Tyler 15.6 15 1 14 9 14 3 13.8
University of Houston SystemUniversity of Houston 14.1 14 0 13 5 13.8 14.2University of HoustonClear Lake 13 2 11 2 15 1 14M 15.4University of HoustonDowntown 22 4 24 3 21 2 22.7 21.8University of HoustonVictoria 13 2 12 7 12 8 13 6 16 3
University of North Texas 15.5 16.0 15 0 14 9 16.1University system of South Texas
Corpus Christi State University 15.3 14 3 14 5 13 8 14.3Laredo State University 14 7 15 4 13.5 14 1 14.1Texas A & I University 18 8 19 4 17 5 17 9 18.3
West Texas State University 18 5 17 6 18 1 19 5 18.6
All Institution,, Combined 17.2 169 166 168 175
Note. The Eluove data were computed. Each ratio represents fall semester full-time student equivalents divided by the number of full-time faculty equivalents budgeted for ninemonths as reported by the institutions. For purposes of these computations, institutional fall semester totals of student credit hours divided by 15 were used as themeasure of full time student equivalents
, - -
r) t.,1! '"
; ) j.

AVERAGE BUDGETED FACULTY SALARIES FOR FULL-TIME FACIJLTY INGENERAL ACADEMIC AND VOCATIONAL-TECHNICAL COURSES COMBINED
Public Community Junior Colleges, Nine Months: 1987 - 88
InstitutionHighest - --1st AverageSalaries Salaries Salaries Institution
Highest Lowest AverageSalaries Salaries Salaries
Alamo Community College District $42,570 $21,820 $31,801 Lee College $43,010 $24,361 $32,771Alvin Community College 36,525 22,275 31,372 McLennan Community College 41,568 21,419 31,614Amarillo College 40,831 21,059 30,031 Midland College 37,468 24,468 31,011American Educational Complex 43,600 22,500 30,024 Navarro College 38,217 23,420 30,916Angelina College 33,396 20,832 28,615 Nor'h Harris County College 38,715 23,990 32,166Austin Community College 35,722 21,072 24,324 Northeast Texas Community Colleg3 District 38,934 24,766 30,368Bee County College 35,414 16,471 25,4/7 Odessa College 41,106 23,052 31,803Blinn College 36,000 16,050 28,973 Panola Junior College 36,667 23,950 27,913Brazosport College 41,562 19,350 30,987 Paris Junior College 28,202 19,101 24,888Cisco Jurior College 30,348 21,348 24,277 Ranger Junior College 28,792 .3,672 22,504Clarendor, College 32,900 19,800 25,2P2 San Jacinto College 36,611 23,689 30,212College of the Mainland 39,752 15,635 28,992 South Plains College 36,836 20,000 27,455Collin County Community College District 34,815 19,988 25,651 Southwest Texas Junior College 37,500 22,130 31,320Cooke County College 28,774 16,922 24,262 Tarrant County Junior College District 40,008 23,108 31,956Dallas County Community College District 50,990 16,116 32,919 Temple Junior College 49,381 19,567 30,358Del Mar College 40,615 22,450 31,565 Texarkana College 32,949 21,621 28,638El Paso County Community College District 41,820 21,255 29,571 Texas Southmost College 36,603 21,200 27,780Frank Phillips College 33,986 20,025 29,423 The Victoria College 43,002 18,971 30,701Galveston College 36,423 21 100 29,085 Trinity Valley Community College 31,700 22,100 27,076Grayson. County College 34.322 22,625 27,022 Tyler Junior College 40,357 22,F28 29,237Hill College 37,016 21,We 25,61: "ernon Regional Junior College 33,708 17,870 25,303Houston Community College 33.750 20.052 25,449 Weatherford College 32,595 22,995 28,517Howard County Junior College District 34,379 19,Y9. 25,494 ' "stern Texas College 34,363 19,804 25,757Kilgore College 39,743 22 002 30,199 vilhon County Junior College 37,500 21,000 28,678Laredo Junior College 38,705 20,034 27,383 Statt, Veighted Average $29,673

SEMESTER CREDIT HOURS

81
SEMESTER CREDIT HOURS, BY LEVELPublic Universities, FY 1988
InstitutionUnder-
gradJate Master's DoctoralSpecial
Professional Total
RI II:TimeStudent
Equivalents'
East Texas State University 118,582 38,1306 5,316 162,504 5,417East Texas State University Center at Texarkana 15,424 6,621 --- 22,045 735
Lamar University SystemLamar University at Beaumont 269,147 13,555 511 283,213 9,440
Midwestern State University 108,121 6,839 114,960 3,832Pan American University 248,899 7,926 256,825 8,561
Pan American University at Brownsville 21,947 3,765 25,712 857Stephen F. Austin State University 326,391 22,352 107 348,850 11,628Texas A&M University System
Prairie View A&M University 137,468 12,777 150,245 5,008Tarleton State University 141,194 Q 973 . 149,467 4,982Texas A&M University . . 939,329 AO 55,174 1,067,493 35,583Texas A&M University at Galveston 16,834 --- 16,834 561
Texas Southern University 152,294. 21,367 2,432 11,349 187,44.2 5,04RTexas State University System
Angelo State University . 146,724 6,410 153,134 5,104Sam Houston State University 271,828 20,727 1,083 293,638 9,788Southwest Texas State University 514,497 30,749 545,246 18,175Sul Ross State University 44,617 6,326 50,943 1,698
Uva IL.. Study Center 4,269 2,256 - -- 6,525 218Texas Tech University . 556,289 44,235 19,420 16,649 636,593 21,220Texas Woman's 1:niversity 117,701 55,010 10,197 --- 182,908 6,097The University of Texas System
The University of Texas at Arlington 471,219 48,427 10,384 --- 530.030 17,668The University of Texas at Austin 1,023,752 119,358 74,479 45,991 1,263,580 42,119The University of Texas at Dallas 93,030 36,744 11,661 --- 141,435 4,715The University of Texas at El Paso 312,533 22,497 388 335,418 11,181The University of Texas of the Permian Basin 28,099 6,4v/ 34,596 1,153The University of Texas at San Antonio 281,990 16,730 298,720 9,957The University of Texas at Tyler 58,365 17,098 75,463 2,515
University of Houston SystemUniversity of Houston-Clear Lake 79,969 41,035 121,004 4,033University of Houston-Downtown a ^49 --- --- --- 142,649 4,755University of Houston ..x,144 96,010 32,272 46,711 688,237 22,941University of HoustonVictoria 14,171 5,368 --- --- 19,539 651
University of North Texas 471,092 62,566 28,010 561,668 18,722University System of South Texas
Corpus Christi State University 56,142 17,404 73,546 2,452Laredo State University 11,921 6,384 --- 18,305 610Texas A&I University 131,693 18,856 444 150,993 5,033
West Texas State University 131,180 10,845 --- 142,025 4,73.
Totals 7.972,504 906,61 251,978 120,700 9,251,785 308,393
'Total number of semester credit hours divided by 30.

82
UNDERGRADUATE SEMESTER CREDIT HOURS, BY PROGRAMPublic Univeisities, FY 1988
InstitutionLiberal
Arts ScienceFine.Arts
TeacherEducation Agriculture Engineering
East Texas State University 51,237 14,485 11,469 11,794 1,761 336East Texas State University Center at Texarkana 6,603 588 163 2,544 ---Lamar University System /Lamar Ur iversity at Beaumont 97,243 43,665 19,670 15,330 9,435Midwestern State University 53,129 14,931 5,905 4,883 39 ...Pan American University . 144,223 27,530 13,068 19,930 36Pan American University at Brownsville 6,597 686 420 9,153 - --Stephen F. Austin State University 135,643 42,126 24,887 23,579 6,037 621Texas A&M University SystemPrairie View A&M University 62,215 27,618 4 138 3,679 1,179 13,802Tarleton State University 57,384 23,380 3,227 10,402 11,001 236Texas A&M University. . 389,702 160,711 7,342 43,390 48,723 115,926Texas A&M University at Galveston 5,188 7,225 . -- --- 127 2,162Texas Southern University 69,611 23,393 7,975 9,621 30 177Texas State University SystemAngelo State University 71,702 23,780 6,314 9,687 1,920 326Sam Houston State University 124,637 35,755 27,042 13,915 4,623 582Southwest Teas State University 271,851 67,632 34,199 28,013 3,700 1,229Sul Ross State University 19,794 0,461 2,828 4,027 2,877 ---Uvalde Study Center 1,737 --- 1,377 --- ---Texas Tech University . 250,646 61,300 37,418 22,402 17,787 39,257Texas Woman's University 40,447 17,711 5,538 8,706 ...The University of Texas SystemThe University of Texas at Arlington 187,767 69,794 17,688 11,392 48,702The University of Texas at Austin 510,547 138,999 73,926 49,969 87,289The University of Texas at Dallas 44,968 13,464 3,603 2,063 2,646The University of Texas at El Paso 166,429 42,885 15,836 15,273 20,255The University of Texas of the Permian Basin 10,561 2,685 1,503 4,348 --- 503The University of Texas at San Antonio 139,932 35,182 14,031 15,632 138 12,607The University of Texas at Tyler 20,708 6,633 2,111 8,580 --- 309University of Houston SystemUniversity of Houston 255,052 65,040 35,955 14,479 29,692University of Houston-Clear Lake 28,953 10,473 3,126 7,627 704University of Houston Downtown 88,411 12,424 4,662 --- 726University of Houston-Victoria 5,596 1,190 --- 2,785 21University of North Texas 207,951 62,159 52,971 20,243 174 1,158University System of South TexasCorpus Christi State University 15,551 7,166 4,686 11,728 390Laredo State University 4,893 638 246 2,406 --- ...Texas AEI University 54,819 21,664 7,654 11,092 3,195 8,793West Texas State University 51,540 17,490 12,817 10,640 3,009 ---
Totals .3,653,207 1,106,863 462,418 430,689 106,320 397,920

83
Undergraduate Semester Credit Hours, By ProgramPublic Universities, FY 1988
InstitutionHome
Economics LawSocial
ScienceLibrary
ScienceVocational
TrainingPhysicalTraining
East Texas State University 1,894 594 2,829East Texas State University Center at Texarkana 453 ---
Lamar University SystemLamar University at Beaumont 6,032 1,745 4,176 9,788
Midwestern State University 789 889 . 3,836Pan American University 1,678 1,635 11,054
Pan American University at Brownswile 16R ... - --
Stephen F. Austin State University 7,960 3,634 79 8,975Texas A&M University System
Prairie View A&M University 1,888 1,119 177 4,570Tarleton State University 2,495 321 ... 6,472Texas A&M University ... 306 31,072Texas A&M University at Galveston ..-
Texas Southern Univern:ty 3,199 830 173 Z,UJJTexas State University System
Angelo State University 360 ... --- 3,211Sam Houston State University 1,495 1,035 876 ... 4,183Southwest Texas State University 9,203 2,723 --- 60 13,358Sul Ross State University - -- ... 202 1,355Uvalde Study Center --- ... --- ...
Texas Tech University 32,566 - -- 966 7,569Texas Woman's University 4,924 96 1,662 618 2,942The University of Texas System
The University of Texas at Arlington - -- 2,489 .-- 9,406The University of Texas at Austin 19,600 3,936 1,593 ...The University of Texas at Dallas ... ---The University of Texas at El Paso ... 2,351
--- ...
3,692The University of Texas of the Permian Basin 69 207 ...The University of Texas at San Antonio 1,404 ... 1,382The University of Texas at Tyler 237
University of Houston SystemUniversity of Houston 4,555 13 42 6,471Um, arsity of Houston -Clear Lake 3 9 ...University of Houston-Downtown 81 ...University of Houston-Victoria ... ... ___
University of North Texas 8,196 1,844 199 689 8,588University System of South Texas
Corpus Christi State University 159 30Laredo State University --- --- .-.Texas A&I University 1,210 349 5,664
West Texas State University 564 846 1,907
Totals 111,192 96 29,524 3,537 5,558 151,157
L:

84
Undergraduate Semester Credit Hours, By ProgramPublic Universities, FY 1988
InstitutionHealth
Services PharmacyELIsiness
AdministrationPractice
Teaching Technology TotalEast Texas State University 654 17,049 1,334 3,146 118,582East Texas State liniversity Center at Texarkana 48 4,797 228 15,424Lamar University System
Lamar University at Beaumont 9,172 39,401 1,405 12,085 269,147Midwestern State Un'srsity 6,199 15,654 694 1,173 108,121Pan American University 6,350 22,021 846 528 248,899Pan American University at Brownsville --- 4,566 333 24 21,947Stephen F. Austin State University 3,644 66,761 2,127 318 326,391Texas A&M University SystemPrairie View A&M University 3,209 10,272 68 3,534 137,468Tarleton State University 2,708 19,866 975 2,727 141,194Texas A&M University 574 113,638 5,130 22,815 939,329Texas A&M University at G4iveston --- 2,132 --- 16,834Texas Southern University 4,382 6,711 18,408 186 4,763 152,294Texas State University SystemAngelo State University 3,765 24,231 1,422 6 146,724Sam Houston State University 517 50,290 3,918 2,960 271,828Southwest Texas State University 10,628 63,315 1,854 6,732 514,497Sul Ross State University 761 4,875 468 969 44,617Uvalde Study Center
--- 975 180 --- 4,269Texas Tech University 1,315 74,935 3,652 6,476 556,289Texas Woman's University 26,408 7,587 1,062 117,701The University of Texas SystemThe University of Texas at Arlington 13,356 109,053 1,632 471,219The University of Texas at Austin 6,328 14,82i 111,979 4,759 1,023,752The University of Texas at Dallas 496 25,329 461 93,030The University of Texas at El Paso 8,162 36,012 1,638 312,533The University of Texas of the Permian Basin - 7,812 411 --- 28,099The University of Texas at San Antonio 72 60,025 1,524 61 281,990The University of Texas at Tyler 3,746 14,166 1,052 813 58,365University of Houston SystemUniversity of Houston 1,704 12,387 69,204 1,065 17,485 513,144University of HoustonClear Lake 659 23,507 1,770 3,138 79,969University of HoustonDowntown -.. 34,365 -.- 1,980 142,649University of Houston "ictc i ia --- 3,586 993 --. 14,171University of North Texas 3,551 97,008 1,950 4,211 471,092Universi'y System of South TexasCorpus Christ; State University 1,912 13,689 831 56,142Laredo State University
3,459 279 11,921Texas A&I University341 14,989 840 1,183 131,693West Texas State University
.3 35 25,174 1,719 1,509 131,180Totals
124,626
_33,925 1,210,030 46,816 98,636 7,972,504

85
MASTER'S LEVEL SEMESTER CREDIT HOURS, B't PROGRAMPublic Universities, FY 1988
nstitutionLiberal
Arts ScienceFineArts
TeacherEducation Agriculture Engineering
East Texas State University 7,346 4,310 1,191 21,100 132 1,164East Texas State University Center at Texarkana 1.956 510 2,484 12
Lamar University SystemLamar University at Beaumont 1,165 1,C";3 4G5 5,922 1,970
Midwestern State University 3,082 466 155 2,020 63Pan American University 1,524 299 69 5,279 - --
Pan American University at Brownsville 663 126 2,448 ---Stephen F. Austin State University 4 183 2,090 1,027 12,330 740 123Texas A&M University System
Prairie View A&M University 3,399 508 14; 6,198 557 201Tarleton State University 1,128 334 15 5,310 313 - --
Texas A&M University 12,604 14,313 3 6.238 9,736 17,723Texas Southern University 6,702 727 171 11,130 --- 522Texas State University System
Angelo State University 1,968 232 125 1,917 113 ---Sam Houston State University 6,015 1,115 1,180 7,593 363 216Southwest Texas State University 9,910 2,102 871 12,152 184 211Sul Ross State University ,2116 472 309 3,654 379 ---Uvalde Study Center 399 --- --- 1,521 ---
Texas Tech University 8,866 4,634 2,492 9,625 2,725 5,581Texas Woman's University 7,440 2,775 2,720 17,026 - --
The University of Teras SystemThe University o" Texas at Arlington 7,720 3,040 72 984 13,412The University of Texas at Austin 24,617 8,511 6,247 11,310 28,417The University of Texas at Dallas 6,319 7,145 432 1,670 2,957The University of Texas at El Paso 5,310 3,160 612 6,960 3,392The University of Texas of the Permian Basin 1,387 342 --- 3,397 --- 33The University of Texas at San Antonio 3,464 1,343 879 5,451 45 105The University of Texas at Tyler 4,743 2,203 747 6,036 159
University of Houston SystemUniversity of Houston 14,734 8,909 3,749 22,390 12,964University of Houston-Clear Lake 11,259 2.971 669 12,4P3 852University of Houston-Victoria 1,344 138 --- 2 931 - "-
University of North Texas 18,096 7,542 5,351 14,079 138University System of South Texas
Corpus Christi State University 3,879 1,807 211 R, 45 93Laredo State University 1,S08 --. --- 3,2& --- -Texas A&I University 4,425 1,062 473 10,955 449 850
West Tex; s State University 2,364 698 603 4,14? 528 ---
Totals 190,225 87,577 30,925 248,635 16,276 94,146

Se
Master's Level Semester Credit Hours, By ProgramPublic Universities, FY 1988
InstitutionHome
Economics LawSocial
ServicesLibrary
ScienceVocational
TrainingHealth
Services
East Texas State University 342 537 63 90East Texas State University Center at Texarkana 180 --- --- 27Lamar University SystemLamar University at Beaumont 246
366Midwestern State University .. --- 15 - --Pan American University251Pao American University at Brownsville ---
- --Stephen F. Austin State University 176138Texas A&M University System
Prairie View A&M University 189 51Tarieton State University 3---Texas A&M University . ---
120Texas Southern University 49935Texas State University System
Angelo State University 39 --- ---Sam Houston State University 147 2,337 72Southwest Texa. State University 12 . -. 3,099Sul Ross State University . ---- --Uvalde Study Center . --- --- ---Texas Tech University . 1,604 68 484 873Texas Woman's University 3,333 3,397 16,825The University of Texas System
The University of Texas at Arlington --- 7,815 2,430The University of Texas at AusEn 765 3,630 3,642 1,299The University of Texas at Dallas --- --- . 2,208The University of Texas at El Paso1,731The University of Texas of the Permian Basin ---
...The University of Texas at San Antonio 66 3 --The University of Texas at Tyler 177453University of Houston System
University of Houston --- 8,164 --- 933University of Houston-Clear Lake 441 522 1,137University of Houston-Victoria --- ... --- ...University of North Texas 40, 270 2,196 2,215University System of South TexasCorpus Christi State University
308Laredo State University ---Texas A&' University 156 21 ---West Texas State University ---
444Totals .. 8,836 68 17,900 13,184 63 35,054

87
Master's Level Semester Credit Hours, By ProgramPublic , FY 1988
Institution PharmacyBusiness
Administretion OptometryPracticeTeaching Technology Total
East Texas State University 1,689 642 38,606East Texas State University Center at Texarkana 1,452 6,621
Lamar University SystemLamar University at Beaumont 1,773 15 13,555
Midwestern State University 1,038 6,839Petri American University 504 7,926
Pan American University at Brownsville 528 3,765Ste-then F. Austin State University 1,545 22,352Texas A&M University System
Prairie View A&M Jniversity 1,521 6 12,777Tarleton State University 1,170 --- 8,273Texas A&M University 11,840 413 72,990
Texas Southern University 27 1,416 138 21,367Texas State University System
Angelo State University 2,016 --- 6,410Sam Houston State University 1,413 276 20,727Southwest Texas State University 2,109 99 30,749Sul Ross State University 606 --- 6,326
.' !aide Study Center 336 - -- 2,256Texas Tech University 7,280 3 44,235Texas Woman's University 1,461 33 55,010The University of Texas System
The University of Texas at Ar' ngton -- 10,954 48,427The University of Texas at Austiii 81_ 30,087 119,358The University of Texas at Dallas 16,013 36,744The University of Texas at El Paso 1,332 22,497The University of Texas of the Permian Basin 1,338 6,497The University of Texas at San Antonio 5,338 36 16,730The University of Texas at Tyler 2,019 561 17,098
University of Houston SystemUniversity of Houston 585 24,538 275 20 249 96,010University of Houston-Clear Lake --- 10,056 630 41,035University of Houston-Victoria 1,005 5,368
University of North Texas 11,908 310 62,566University System of South Texas
Corpus Christi State University 2,961 17,404Laredo State University 1,791 --- 6,384Texas A&I University 450 15 18,856
West Texas State University 1,974 87 10,845
Totals 1,445 161,461 275 20 3,513 906,603
l , ;

88
DOCTORAL LEVEL SEMESTER CREDIT HOURS, BY PROGRAMPublic Universities, FY 1988
InstitutionLiberal
Arts ScienceFineArts
TeacherEducation Agriculture Engineering
East Texas State University 1,321 24 3,917Lamar University SystemLamar University at Beaumont 12
499Stephen F. Austin State University107 ---Texas A&M University System
Texas A&M University 8,566 16,101 7,887 7,869 11,858Texas Southern University 6 2,250 --- ---Texas State University SystemSam Houston State University 975 108 --- - -- ---Texas Tech University 5,048 3,605 1,327 2,242 1,166 2,285Texas Woman's University 1,656 531 197 2,355 ...The University of Texas SystemThe University of Texas at Arlington 2,713 1,785 6 18 3,944The University of Texas at Austin 17,383 13,051 3,651 13,800 17,042The University of Texas at Dallas 2,862 5,830 105 --- 173The University of Texas at El Paso 388 ---II"iversity of Houston SystemJniversity of Houston .. 9,182 8,494 51 5,021 5,034University of North Texas 7,870 5,339 2,802 8,443 90University System of South TexasTexas A&I University 30 414
"Totals .. . 57,62. 55,256 8,139 46,347 9,142 40,925

89
Doctor. .vel Semester Credit Hours, By ProgramPublic Universities, FY 1988
InstitutionHome
EconomicsSocial
ServiceLibrary
ScienceHealth
Services PharmacyBusiness
Administration
East Texas State UniversityLamar University System
Lamar University at BeaumontStephen F. Austin State UniversityTexas A&M University System
42 12
Texas A&M University 30 --- 2,736Texas Southern University 3 173 ---
Texas State University Systt ,nSam Houston State University - -- ---
Texas TIPP', University 1,636 --- 15 2,096Texas 0-man's University 2,589 433 2.427 9The University of Texas System
The University of Texas at Arlington 24 483 --- 1,411The University of Texas at Austin 116 360 312 3,085 2,346 3,333The University of Texas at Dallas --- 983 --- 1,708The University of Texas at El Paso --- ---
University of Houston SystemUniversity of Houston --- 623 449 2,991
University of North Texas 12 21 741 70 -- 2,613University System of South Texas
Texas A&I University
Totals 4,419 864 1,486 7,236 2,968 16,909

90
Doctoral Level Semester Credit Hours, By ProgramPublic Universities, FY 1988
Institution OptometryPracticeTeaching Technology Total
East Texas State University .
Lamar University SystemLamar University at Beaumont .
Stephen F. Austin State University .
Texas A&M University System
5,316
511107
Texas A&M University .... . 127 55,174Texas Southern University . .. --- 2,432Texas State University System
Sam Houston State University1,083
Texas Tech University .. . ..19,420
Texas Woman's University10,197The University of Texas System
The University of Texas at Arlington10,384The University of Texas at Austin74,479The University of Texas at Dallas . 11,661
The University of Texas at El Paso388University of Houston System
University of Houston .. . 523 4 32,372University of North Texas .. . --- 9 28,010University System of South TexasTexas A&i University .
444
Totals .. 523 4 136 25 ,978

91
SPECIALIPROFESSI 'L SEMCJIER CREDIT HOURS, BY PROGRAMJublic Universities, FY 1988
InstitutionLiberal
Arts Lao,Business
Administration Optometry Total
Texas Southern Unsrsity11,349 11,349Texas Tech University16,649 16,649The University of Texas System
The University of Texas at Austin 1,881 44,002 108 45,991University of Houston SystemUniversity of How ton
31,427 15,2P 46,711Totals
1,881 103,427 108 15,, 14 120,700
l ;

92
SEMESTER CREDIT HOURS, FALL 1987Public Universities
InstitutionUnder-
graduate Master's DoctoralSpecial
Professional Total
Full:TimeStudent
Equivalents'
East Texas State University 52,172 11,692 1,874 65,738 4,383East. Texas State University Center at Texarkana 6,054 2,181 8,235 549Lamar University SystemLamar University at Beaumont 120,345 4,807 167 125,319 8,355Midwestern State 11- .rsity 47,401 1,988 49,389 3,293Pan Arr,erican Um .rsity 99,137 2,364 101,501 6,767Pan American University at Brownsville 7,268 1,265 8,533 569Stephen F. Austin State University 149,054 6,823 17 155,894 10,393Texas A&M University SystemPrairie View ABM University 65,147 4,091 69.238 4,616Tarleton State University 64,716 2,427 67,143 4,476Texas ek&M University 437,549 28,436 20,830 486,815 32,454Texas A&M University ..t Galveston 7,814 --- --- 7,814 521Texas Southern University 66,121 6,911 825 5,525 79,382 5,292Texas State University SystemAngelo State University 66,753 2,288 --- 69,041 4,603Sam Hot-ston State Univers,fy 122,475 6,228 492 129,195 8,613Southwest Texas State University 234,803 9,525 --- 244,328 16,289Sul Ross State University 20,192 1,243 21,435 1,429Uvalde Study Center 1,554 576 --- 2,130 142Texas Tech University 259,993 16,059 6,948 8,368 291,368 19,425Texas Woman's University 52,705 17,929 3,575 74,209 4,947The University of Texas SystemThe University of Texas at Arlingt, -1 212,671 19,767 4,048 236,486 15,766The University of Texas at Austin 469,674 51,207 31,822 22,095 574,798 38,320The University of Texas at Dallas 37,250 14,672 4,363 ... 56.285 3,752The University of Texas at El Paso 142 736 8,330 128 151,194 10,080The University of Texas of the Permian Basin 12,431 2,242 14,673 978The University of Texas at San Antonio 127,146 4,717 131,865 8,791The Universiti, of Texas at Tyler 2,1,551 5,418 29,969 1,998Univer. v of Houston SystemUniversity of Houston 233,298 38,426 12,183 21,911 305,818 20,388University of Houston -Clear Lake 34,865 15,698 50.563 3,371University of Houston-Downtown 64,325 64.325 4,288University of Houston-Victoria 5 484 1,632 7,116 474University of North Texas 214,215 22,163 9,982 246.360 16,424University System of South TexasCorpus Christi State University 21,702 5 914 27,616 1,841Laredo State University 4,398 1,326 6,324 422Texas A&I Um wersity 56,778 5,117 1E5 62 r r 0 4,12'West Texas State University 59,612 3,498 63,140 4,209
Totals 3,602,421 327,560 97,419 57,899 4,085,299 272,353
'Total number of semester credit hours divided by 15.

93
SEMESTER CREDIT HOURS, SPRING 1988Public Universities
InstitutionUnder-
graduate Master's DoctoralSpecial
Professional Total
East Texas State University 50,560 11,629 1,978 64,167East Texas State University Center at Texarkana 6,069 2,214 --- 8,283
Lamar University SystemLamar University at Beaumont 110,057 4,633 178 114,868
Midwestern State University 45.741 2,349 48,090Pan American University 101,359 2,398 103,757
Pan American University at Brownsville 7,714 1,349 9,063Stephen F. Austin State University 135,652 7,711 48 143,411Texas A&M University System
Prairie View A&M University 57,994 4,450 62,444Tarleton State University 60,469 2,331 --- 62,800Texas A&M University 404 527 28,420 21,166 454,113Texas A&M University at Galveston 7,174 --- 7,174
Texas Southern University 68,113 7,532 888 4,960 81,563Texas State University System
Angelo State University 61,724 2,230 --- 63,954Sam Houston State University 115,504 6.129 318 121,951Southwest Texas State University 213,519 9,986 223,505Sul Ross State University 18 943 1.378 20,321
Uvalde Study Center 1,560 804 2,364Texas Tech University 237,426 16,218 6,987 7,358 267,989Texas Woman's University 49,717 17,876 3,579 71,172The University of Texas System
The University of Texas at Arlingt:Ai 192,920 18,744 4,016 215,683The University of Texas at Austin 446,375 49,620 30,712 20,832 547,539The University of Texa, at Dallas 35,233 13.357 4,330 52,920The University of Texas at El Paso 133,959 8,657 194 142,810The University of Texas of the Permian Basin ,,463 2,181 13 644The Univc say of Texas at San Antonio 114,919 6,219 121 138The University of Texas at Tyler 24,256 5,252 29,508
University of Houston SystemUniversity of Houston 219,662 37,074 11,878 20,118 288,732University of Houston-Clear Lake 33,010 15,318 --- 48,328University of Houston-Downtown 59,687 59,687University of Houston-Victoria 5,502 1,827 --- 7,329
University of North Texas 199,616 22,246 10,453 232,315University System of South Texas
Corpus Christi State University 21,577 5,947 27,524Laredo State University 4,811 2,082 --- 6,893Texas A&I University 55,107 5,326 159 60,592
West Texas State University 57,181 3,658 60,839
Totals 3,369,103 327,215 96,884 53,268 3,846,470

94
SEMESTER CREDIT HOURS, SUMMER 1988Public Universities
InstitutionUnder-
graduate Master's DoctoralSpecial
Professional Total
East Texas State University 15,850 15,285 1,464 32,599East Texas State University Center at Texarkana 3,301 2.226 --- 5,527Lamar University SystemLamar University at Beaumont 33,745 4,115 166 43,026Midwestern State University 14,979 2,502 --- 17,481Pan American University 48,403 3,164 51,567Pan American University at Browrsville 6,965 1,151 8,116Stephen F. Austin State University 41,685 7,818 "1 49,545Texas A&M University SystemPrairie View A&M University 14,327 4,236 18,563Tarleton State University 16,009 3,515 19,524Texas A&M University 97.253 16,134 13,178 126,565Texas A&M University at Galveston 1,846 --- 1,846Texas Southern University 18,060 6,854 713 864 26,497Texts State University SystemAngelo State University 18 247 1,892 20.139Sam Houstor State University 33,2^9 8.370 273 42,492Southwest Texas State University 66, ) 11,238 - 77,413SW Ross State University 5,482 3,705 9,187Uvalde Study Center 1,155 876 - 2,031Texas Tech University 58 870 11,358 5.485 923 77,236Texas Woman's University 15,279 19,205 3,043 37,527The University of Texas SystemThe University of Texas at Arlington 65,625 9,916 2,320 --- 77,861The University of Texas at Austin 107,703 18,531 11,945 3,064 141,243The University of Texas at Dallas 20,547 8,715 2,969 32,230The University of Texas at El Paso 35,838 5,510 66 41,414The University of Texas of the Permian Basin 4,205 2,074 --- 6,279i he University of Texas at San Antonio 33 923 5,794 45,717The University of Texas at Tyler 9,558 6 428 15,986University of Houston SystemUniversity c' Houston-Clear '.ake 12,094 10,019 22,113University of Houston Downtown 18,637 --- 18,637University of Houston 60,184 20,510 8,311 4.682 93,687University of Houston-Victoria 3,185 1,909 - -- - -- 5,094University of North Texas 57,261 18,157 7,575 82,993University System of South TexasCorpus Christi State University 2,863 5,543 18,406Laredo State University 2,712 '2,376 5,088Texas A&I Univei ,ity 19,808 8,413 120 23,341West Texas State University 14,357 3,689 18,046
Totals1,000,980 251,828 57,675 9,533 1,320,016

95
SEMESTER CREDIT HOUR ENROLLMENTS, BY CURRICULUM AREA'Public Community Junior Uo lieges and Technical Institutes, Fall 1987
Institution
Agricultureand NaturalResources
Architechtureand
EnvironmentalDesign
BiologicalSciences
BusinessManagement
Communi-cations
Computerand
InformationSciences
Ala..io Community College DistrictPalo Alto College 62 1,072 1,426 1,704San Antonio College --- 1,365 6,247 6,690 1,563 1,008St. Philip's College 2,114 1,965 --- 309
Alvin Community College 1,742 1,560 709 267Amarillo College --- 98 2,452 2,169 514 159Angelina College . 36 72 1,376 1,503 74 198Austin Community College --- --- 5,681 --- 813 731Bee County College 201 772 969 ---Blinn College 577 4,384 3,012 62 864Brazosport College --- 1,004 638 17Central Texas College 87 1,628 1,821 60Cisco Junior College 274 1,268 452Clarendon College 276 512 825 372College of the Mainland --- 1,160 t,07 60 39Collin County Community College District 60 2,136 84 4,128Cooke County College 81 960 1 317 144Dallas County Community College District
Brookhaven College 2,252 1,290 283 444Cedar Valley College -.15 890 723 33Eastfield College 2,760 1,605 453 312El Centro College 1,924 750 63Mountain View College 1,716 879 216 207North Lake College 1,604 993 303 111Richland College 3,412 2,313 833 963
Del Mar College . 4,048 4,680 598 690El Paso County Community College 200 3,190 2,937 207Frank Phillips College 25 644 164 36 --Galveston College --- 956 316 717Grayson County College 1,604 2,092 ....Hill Junior College 95 544 ... 90Houston Community College --- 6,329 267Howard County Junior College District
Howard College at Big Spring 344 792 592 23 ---Southwest Collegiate Iri.it.iiite for ,ie Deaf --- 16 27 42 30
Kilgore College 36 2,496 1,654 411 771

96
Semester Credit Hour Enrollment, By Curriculum AreaPublic Community Junior Colleges and Technical Institutes, Fall 1987
Agricultureand Natural
Institution Resources
Architechtureand
EnvironmentalDesign
BiologicESciences
BusinessManagement
Communi-cations
Computerand
Info-mationSciences
Lamar University SystemLamar University at Orange
596 234 69 424Lamar University it Port Arthur460 132 --- 108Laredo Junior College
1,636 1,012 197Lee CM lege ... . --- 2,592 2,269 208 63McLennan Community College . 44 2,228 1,785 154 --Midland College . 201 1,696 147 333Navarro College .. 39 1,712 ___ 231Northeast Texas Community College --- 1,376 1,146 - --North Harris County College .3,976 b,365 212 --Odessa College ... .2,104 2,023 3, 56Panola Junior College1,036 358 10dParis Junior College . 57 1,814 793 67 36Ranger Junior College
San Jacinto College District960 108 :.7.9. ---Central Campus .
4,148 5,357 150 276North Campus .1,063 2,222 82 78South Campus..1,012 2,706 64 321South Plains College . . 525 4,896 696 260 42Southwest Texas Junior College 294 1,160 1,268 112 ---Tarrant County Junior College District
Northeast Campus3.984 5,460 345 441Northvfest Campus1,740 2,022 78 102South Campus3,652 4,419 186 168Temple Junior College1,212 1,1'9 48 --.exarkana Com.nunity College , 149 2,21'; 1,959 51 198Texas Southmost College . - -- 2,261 1,244 42 501Texas State Technical Institute
Harlingen Campus .
304Sweetwater Campus- --
--- ---Trinity Valley Community College 42 2,36 - - 215 --The Victoria College - 1, °60 2,205 48 1,522Tyler Junior College . . 141 4350 3,182 141 489Vernon 3egional Junior College 193 822 --- 674Weatherford College . . 19 6 1,172 -- 42 --Western Texas College .. 379 816 399 100 342Wharton Cour'y Junior College 245 2,240 1,589 --- 134Totals
4,396 1,942 133,840 97,174 11,356 20,143
'In academic courses approved by the Coordinating Board.

Semester Credit Hour Enrollment, By Curriculum AreaPublic Community Junior Colleges and Technical Institutes, Fall 1987
Institution Education EngineeringFine and
Applied ArtsForeign
Languages.-lome
Economics Letters
Alamo Community College DistrictPalo Alto College 164 91B 414 10,938San Antonio College 2,691 510 5,864 5,677 414 34,733St. Philip's College 462 456 386 162 6,909
Alvin Community College 1,219 1,045 628 --- 5,754Amarillo College 386 184 1,180 364 636 6,671Angelina College 759 141 699 132 --- 3,502Austin Community College 1,338 --- 2,977 7,174 384 17,202Bee County College 781 145 606 17' --- 2,267Blinn College 2,502 243 722 336 216 10,611Brazosport College 433 --- 430 329 3,147Central Texas College 497 150 640 386 5,767Cisco Junior College 617 --- 413 192 --- 2,730Clarendon College 292 219 39 1,227College of the Mainland 316 823 135 63 4,164Collin County Community College District 564 126 1,604 1,458 11,920Cooke County College 313 --- 233 371 3,18nDallas County Community College District
Brookhaven College 836 184 3,223 805 8,966Cedar Valley College 346 18 1,06 244 4,481Eastfield College 1,321 274 1,910 r .3 11,563El Centro College 215 --- 996 415 5,885Mountain View College 714 27 1,696 779 7,930North Lake College 871 39 1,509 763 7,449Richland College 1,519 830 3,345 2,150 --- 18,240Del Mar College 1,432 67 2,858 1 040 72 15,553El Paso County Com -unity College 1,663 52 1,897 1.710 --- 54,935Frank Phillips College 559 --- 295 16 36 951Galveston College 318 604 301 48 3,021Grayson County College 555 97 617 351 --- 3,556Hill Junior College 695 21 495 124 2,247Houston Community College 99 --- 2,241 2,495 360 24,068Howard County Junior College DistrictHoward College at Big Spring 642 406 44 1,437Southwest Collegiate Institute for the Deaf 38 73 ... 494Kilgore College 2,131 147 1,627 546 6,825

96
Semester Credit Hour Enrollment, By Curriculum AreaPublic Community Junior Colleges and Technical Institutes, Fall 1987
Institution Education EngineeringFine and
Applied ArtsForeign
LanguagesHome
Economics Letters
Lamar University SystemLamar University at Orange 313 5 119 --- 1,326Lamar University Pt Port Arthur 109 --- 51 102 1,416
Laredo Junior College 443 38 1,344 732 --- 10,440Lee College . 769 48 813 818 147 5,547McLennan Community College 1,349 120 2,316 375 --- 7,173Midland College 609 87 1,129 751 4,792Navarro College . 1,050 1,126 116 4,107Northeast Texas Community College 768 --- 1,110 66 --- 3,522North Harris County College 2,124 137 2,210 1,480 195 14,990Odessa College 1,480 72 1,232 490 --- 5,622Panola Junior College 901 39 560 136 2,492Paris Junior College 993 27 791 209 3,942Ranger Junior College 725 --- 433 56 1,950San Jacinto Junior College District
C6ntral Campus 2,040 78 2,205 775 345 11,933North Campus 729 --- 859 300 45 3,881South Campus 711 --- 729 560 --- 5,061
South Plains College . 1,233 219 1,641 546 396 5,319Southwest Texas Junior College 697 --- 325 742 --- 3,618Tarrant County Junior College District
Northeast Campus . 1,961 480 3,056 3,129 108 15,156Northwest Campus 730 11 735 599 39 5,883South Campus 1,754 530 1,963 1,4d5 297 13,027
Temple Junior College . 668 48 872 213 --- 3,755Texarkana Community College 1,161 259 923 433 108 4,824Texas Southmost College 2,788 6 1,582 1,986 --- 10,461Texas State Technical Institute
Harlingen Campus 738Sweetwater Campus --- --- --- 201
Trinity Valley Community College 1,051 --- 1,000 397 --- 6,051Tyler Junior College . 2,614 192 2,293 783 270 12,322Vernon Regional Junior College 386 --- 175 195 --- 1,746Victoria College. . 1,067 156 525 425 15 4,137Weatherford College 598 54 641 178 --- 2,730Western Texas College 591 --- 616 127 1,479Wharton County Juilior College 849 81 735 208 4,784
Totals . 60,599 5,942 77,741 49,016 4,497 492,749

99
Semester Credit Hour Enrollment, By Curriculum AreaPublic Community Junior Colleges and Technical Institutes, Fall 1987
Institution MathematicsPhysicalSciences Psychology
SocialSciences Total
Alamo Community College DistrictPalo Alto College 6,550 326 2,434 6,840 32,850San Antonio College 18,564 6,946 14,169 33.273 139,714St. Philip's College 4,071 838 2,813 4,986 25,471
Alvin Community College 4,427 989 1,587 6,963 26,890Amarillo College 2,443 1,361 1,640 5,160 25,417Angelina College 1,917 718 1,613 3,066 15,806Austin Community College 17,467 6,581 2,563 33,915 96,826Bee County College 1,088 536 567 2,445 10,548Blinn College 7,581 2,052 3,394 13,899 50,455Brazosport College 2,616 1,072 1,528 2,904 14,118Central Texas College 3,393 908 2,447 5,109 22,893Cisco Junior College 1,209 236 991 2,736 11,118Clarendon College 605 400 637 1,458 6,862College of the Mainland 3,182 788 786 3,570 15,593Collin County Community College District 8,290 1,264 3,222 16,710 51,566Cooke Cour,cy College 1,568 385 1,021 '3,909 13,482Dallas County Community College District
Brookhaven College 5,343 1,831 3,720 10,104 39,341Cedar Valley College 1,715 222 967 3,156 13,961Eastfield College 6,107 1,890 3,502 11,067 43,482El Centro College 2,921 764 2,081 3,528 19,532Mountain View College 4,749 1,247 1,824 6,111 28,095North Lake College 3,980 1,484 1,648 6,711 27,465Richland College 13,317 3,933 5,413 21,066 77,334
Del Mar College 7,392 2,400 2,988 11,702 55,520El Paso County Community College .0,112 2,207 5,140 14,826 99,076Frank Phillips College 465 240 443 1,209 5,083Galveston College 1,754 176 1,011 2,100 11,322Grayson County College 2,504 966 1,482 4,356 18,180Hill Junior College 768 340 742 2,139 8,300Houston Community College 13.414 3,684 8,073 23,028 84,058Howard County Junior College District
Howard College at Big Spring 633 328 517 1,578 7,336Southwest Collegiate Institute for the Deaf 204 20 62 72 1,078
Kilgore College 3,944 1,324 2,111 6,939 30,962

100
Semester Credit Hour Enrollmt By Curriculum AreaPublic Community Junior Colleges and Technical Institutes, Fall 1987
Institution MathematicsPhysicalSciences Psychology
SocialSciences Total
Lamar University SystemLamar University at Orange 834 296 432 1,851 6,499Lamar University at Port Arthur 648 196 528 2,100 5,850Laredo Junior College 4,986 1,060 2,267 4,995 29,150Lee College 3,350 920 2,249 5,544 25,337McLennan Community College 3,324 1,234 3,343 6,636 30,081Midland College 2,596 752 1,398 4,527 19,018Navarro College 2,214 360 1,521 3,231 15,707Northeast Texas Community College 2,094 632 1,280 3,924 15,918North Harris County College 11,195 3,000 4,810 17,301 66,995Odessa College 3,843 1,455 1,846 5,982 26,236Panola Junior College 1,591 444 881 2,385 10,932Paris Junior College 2,756 788 1,265 3,015 16,553Ranger Junior College 768 80 496 1,533 7,161San Jac5)to Junior College DistrictCentral Campus 8,613 3,420 4,139 11,280 54,759North Campus . 2,661 636 1,218 3,600 17,379South Campus 4,078 972 1,840 4,671 22,725South Plains College 3,271 2,546 2,347 4,140 28,077Southwest Texas Junior College 1,941 559 1,217 3.579 15,513Tarrant County Junior College DistrictNortheast Campus 7,250 2,962 5,082 15,516 64,930Northwest Campus 3,392 1,188 2,332 6,468 25,319South Campus 7,676 2,047 5,057 13,587 55,848Temple Junior College 1,347 548 993 3,219 14,042Texarkana Community College 3,327 1,704 1,985 6,747 26,044Texas Southmost College 6,333 1,380 2,403 7,770 38,757Texas State Technical InstituteHarlingen Campus 453 315 39 1,849Sweetwater Campus 393 2:17 78 --- 909The Victoria College
3,321 1,410 1,858 4,467 23,123Trinity Valley Community College 2,787 471 2,173 5,571 22,124Tyler Junior College 7,026 2,817 4,826 11,991 54,037Vernon Regional Junior College 1,196 172 571 2,187 8,317Weatherford College 1,656 693 998 2,985 11,772Western Texas College 798 292 429 1,794 8,162Wharton County Junior College 3,132 556 1,982 4,704 21,23PTotals 275,143 84,289 147,295 453,974 1,920,096
1


1
103
INVESTMENT IN PHYSICAL PLANTPublic Institutions of Higher Education, FY 1987
Universities $ 5,323,360,565Texas ABM University System Agriculture and Engineering Services 151,367,201Medical, Dental and Allied Health Units 1,515,104,019Community Junior Colleges 1,332,418,807Other Agencies 107,966,258
Totals $ 8,430,216,850
Source Financial reports Sent 1, 1987.

INVESTMENT IN PHYSICAL PLANTPublic Universities, FY 1987
InstitutionTotal
Investment Land ValueBuildingValue
ImprovementsOther ThanBuildings
Constructionin Progress Equipment
East Texas State University $ 64,505,217 $ 742,180 $ 52,680,728 $ 4,675,777 $ 3,852,698 $ 22,553,834East Texas State UniversityCenter at Texarkana 7,712,437 154,500 3,151,792 280,035 4,126,110Lamar University System
Lamar University 139,222,017 6,392,731 92,620,001 8,394,154 3,33707 28,477,244Lamar University at OrangeLamar University at Port Arthur
Midwestern State University 52,063,979 1,364,489 34,099,687 5,342,125 349,669 10,908,009Pan American University 67,100,127 637,297 46,919,792 2,149,598 --- 17,393,440Pan American University at Brownsville 2,003,790 40,000 288,387 --- 1,675,403Stephen F. Austin State University 131,218,247 2,135,209 95,330,264 7,986,'40 1,84C,162 23,926,472Texas A&M University System 1,888,7071,888,707Prairie View A&M University 121,796,325 959,156 60,309,520 21,254,138 18,591,711 22,581,750Tarleton State University 63,771,140 1,195,059 35,074,101 4,156,419 10,429,810 12,915,751Texas A&M University 808,863,601 7,025,118 392,430,302 108,388,187 99,620,412 201,399,582Texas A&M University at Galveston 32,963,303 139,375 16,473,048 5,236,066 6,665,030 4,449,784Texas Southern University 128,525,588 10,013,425 64,900,307 20,368,419 14,466,782 18,776,655Texas State University System 70,688
70,688Angelo State University 66,247,922 1,997,372 42,535,403 5,403,026 2,453,997 13,858,124Sam houston State University 143,821,526 7,266,862 93,261,940 14,790,618 318,516 28,183,590Southwest Texas State University 211,574,629 9,744,229 126,406,526 15,755,092 29,232,596 30,436,186Sul Ross State University 29,328,919 76,288 20,801,739 2,017,251 6,433,641Texas Tech University 353,758,535 1,724,149 228,607,043 37,891,350 85,535,993Texas Woman's University 102,811,186 667,192 67,829,348 9,472,000 3,212,900 21,629,746The University of Texas System 36,726,107 1,855,966 9,308,555 779,713 1,771,376 23,010.497The University of Texas at Arlington 229,638,578 11,501,031 105,224,458 9,830,721 53,790,185 49,312,183The University of Texas at Austin 1,202,261,978 35,931,465 612,959,922 78,418,758 46,679,467 428,272,366The University of Texas at Dallas 114,024,547 7,467,953 52,087,247 10,784,412 4,133,971 39,550,964The University of Texas at El Paso 154,992,144 4,960,407 93,937,146 12,268,348 7,186,594 36,639,649The University of Texas of the Permian Basin 31,091,588 1,268,400 16 ,361.799 4,311,146 9,150,243The University of Texas at San Antonio 121,6907 1,358,846 79,971,914 11,782,178 221,019 28,356,334The University of Texas at Tyler 29,82', 2 615,240 17,112,527 2,688,94 1,946,383 7,458,350University of Houston System 13,349,482 698,993 850,372 1,412,232 10,387,885University of Houston 371,282,714 28,867,895 198,166,280 28,116,965 18,242,345 97,889,229University of Houston-Clear Lake 62,011,343 7,402,722 37,424,202 3,368,730 13,815,689University of Houston-Downtown 34,210,706 1,359,532 16,636,232 3,022,442 6,327,882 6,864,618University of HOuston-Victoria 4,117,300 40,000 204,244 3,873,056University of North Texas 203,637,845 11,344,174 11b,703,610 10,747,522 8,192,370 56,650,169University System of South Texas 65,02865,028Corpus Christi State University 35,922,828 2,398,641 20,664,508 3,874,955 8,984,72aLaredo State University 4,493,783 181,200 1.524,755 2,787,828Texas Mil University 56,380,808 368,962 35,896,349 2,321,281 17,794,216West Texas State University 68,374,170 658,042 44,836,362 7,372,051 505,593 15,002,122
Totals $ 5,323,360,565 $ 170,554,100 $ 2,932,740,038 $ 464,098,981 $ 342,881,587 $ 1,413,085,859
'Excludes livestock.; (1'

105
INVESTMENT IN PHYSICAL PLANTOther Agencies of Higher Education, FY 1987
InstitutionTotal
Investment Land ValueBuilding
Value
ImprovementsOther ThanBuildings
Constructionin Progress Equipment
Szrvicas of Texas ARM University System
Texas Agriculture Experiment Station $ 86,563,339 $ 8,149,1,31 $ 19,971,034 $ 4,482,621 $ 7,391,957 $ 46,568,136TeAas Agriculture Extension Service 14,740,279 6,526,135 257,729 7,500 --- 7,948,915Texas Engineering Experiment Station 15,367,246 2,463 . 15,364,783Texas Engineering Extension Servic3 13,309,216 1,018,222 1,571,902 201,508 425,235 10,092,349Flodent cnd Predatory Animal Control 489,811 ... .. ... 489,811Texas Forest Service 13,440,676 850,854 2,108,942 897,291 553,362 9,030,227Texas Transportation Institute 3,543,070 --- --- --- --- 3,543,070Texas Veterinary Diagnostic Lab 3,913,564 10,000 2,308,875 83,298 1,511,391
Subtotals $ 151,367,201 $ 16,557,265 $ 26,218,482 $ 5,672,218 $ 8,370,554 $ 94,548,682
HealthRelated Units
Texas College of Osteopathic Medicine $ 60,950,57) $ 4,420,874 $ 35,741,697 $ 23,941 $ 48,473 $ 19,915.585Texas Tech University Health Sciences Center
School of Medicine 111,670,835 3,256,835 64,146,698 1,756,953 4,017,648 38,492,701The University of Texas M. D. Anderson
Cancer Center 315,975,878 15,690,299 185,183,524 3,387,236 6,578,174 105,136,645The University of Texas Southwestern Medical
Center at Dallas 235,294,182 1,916,965 109,086,640 5,617,376 25,871,458 92,801,743The University of Texas H .r "h Science Center
at Houston. 205,271,451 4,740,506 88,200,788 9,709,245 9,125,976 93,494,936The University of Texas Health Science Center
at San Antonio 162,596,128 1,019,328 65,923,588 1,651,884 5,267,365 68,733,963The University of Texas Medical Branch
at Galveston 368,990,181 5,811,881 218,700,361 8,606,421 10,215,301 125,656,217The University of Texas Health Center
at Tyler . 54,354,794 23,231 34,498,588 1,632,556 592,072 17,608,347
Subtotals . $ 1,515,104,019 $ 36,879,919 $ 821,481,884 $ 33,185,612 $ 61,716,467 $ 561,840,137
All Other Ar incies
Texas Sta,e Technical Institutes $ 104,897,463 $ 2,818,7e6 $ 64,894,727 $ 6,242,415 $ 1,218,562 $ 29,722,993Texas Hijhei Education Coordinatins,, Board 3,068,795 --- --- ... ... 3,068,795
Subtoti Is $ 107,966,258 $ 2,818,766 $ 64,894,727 $ 6,242,415 $ 1,218,562 $ 32,791,788

106
INVESTMENT IN PHYSICAL PLANTPublic Community Junior Colleges, FY 1987
InstitutionTotal
Investment Land ValueBuilding
Value
ImprovementsOther ThanBuildings
Constructionin Progress Equipment
Alamo Community College District $ 75,989,696 $ 7,067,639 $ 42,120,342 $ $ $ 26,801,715Alvin Community College 18,078,278 353,514 13,057,394 4,667,370Amarillo College 24,875,608 1,959,435 14,187,034 434,008 8,275,131Angelina College 9,454,130 1,393,138 5,404, 44 --- --- 2,656,848Austin Community College 17,466,247 7,274,573 1,241,128 1,541,371 784,495 6,624,680Bee County College 13,284,694 318,350 7,583,145 565,608 _ 4,817,591Blinn College . 13 080,417 1,121,567 7,242,811 540,235 5,075,804Brazosport College 16,940,651 2,150,858 9,922,002 1,062,909 _._ 3,804,882Central Texas College 40,492,090 1,201,436 22,260,835 1,094,701 15,935,118Cisco Junior College 5,192,602 60,457 2,958,208 --- 2,173,937Clarendon College 2,770,130 168,360 1,909,493 205,564 486,713College of the Mainland 15,852,587 300,049 12,618,598 --- 2,933,940Collin County Cr,mmunity College District 45,013,623 1,664,792 37,577,400 5,771,431Cooke County College 5,855,699 125,595 3,379,220 2,350,884Dallas County Community College District 206,079,778 23,844,599 135,391,756 --- 4,076,042 42,767,381Del Mar College 37,786,348 4,329,320 20,412,786 3,556,294 --- 9,487,948El Paso County Community College District 47,235,933 4,219,369 29,222,013 --- 224,825 13,569,726Frank Phillips College 8,596,145 121,230 5,441,883 643,046 --- 2,389,986Galveston College 9,579,141 --- 6,585,780 --- 2,993,361Grayson County College 11,234,115 626,925 5,726,296 --- 4,880,894Hill Junior College 4,367,521 89,490 2,861,791 364,499 1,051,741Houston Community College System 63,641,352 9,832,022 27,157.614 685,615 25,966,101Howard County Junior College District 14,535,497 266,87 10,827,544 531,345 --- 2,909,737Kilgore College 31,021,357 4,000,783 17,921,145 --- 209,329 8,890,100Laredo Junior College 19,430,330 2,134,834 11.386,099 238,507 ... 5,670,890Lee College 16,183,148 492,250 8,118,908 497,752 7,074,238McLennan Community College 24,682,440 1,857,825 16,322,162 1,573,624 4,928,829Midland College 21,972,496 809,320 16,292,792 --- 4,870,384Navarro College 21,548,528 813,078 14,467,442 985,633 --- 5,282,375North Harris County College District 50,566,295 5,741,519 30,344,109 --- 7,143,663 7,347,004Northeast Texas Community College 12,530,816 336,700 9,839,619 220,050 40,879 2,093,568Odessa College 33,110,319 1,168,709 20,252,956 2,366,415 9,322,239Panola Junior College 8,712,395 306,268 6,176,456 ....2,229,671Paris Junior College 15,806,270 1,377,500 11,521,132 --- 3,907,638Ranger Junior College 4,036,267 76,029 2,688,940 132,962 1,138,336San Jacinto College District 75,314,626 2,779,975 57,138,566 --- 1,090,029 14,306,056South Plains College 42,491,219 119,382 33,587,928 1,195,717 7,588,192Southwest Texas Junior College 10,329,950 6,476,534 149,816 3,703,600Tarrant County Junior College District 88,477,897 2,153,867 44,005,451 12,071,598 6,232,096 24,014,885Temple Junior College 10,244,052 440,000 6,109,716 417,343 --- 3,276,993Texarkana College . 17,247,720 379,166 10,026,251 1,750,167 5,092,136Texas Southmost College 13,858,518 653,633 7,520,204 817,500 4,867,181The Victoria College 12,249,614 616,507 8,653,841 358,159 2,621,107Trinity Valley Community College 13,360,762 467,281 8,437,087 236,820 4,219,574Tyler Junior College . 35,884,163 890,302 26,217,066 795,336 7,981,459Vernon Regional Junior College 7,455,115 325,959 4,610,661 304,608 2,213,887Weatherford College 11,287,182 623,699 7,930,433 264,777 2,468,273Western Texas College 11,054,735 868 7,926,882 570,699 2,556,286Wharton County Junior College 14,260,311 1,390,642 7,353,135 798,919 4,717,615
Totals .... .. $ 1,332,418,807 $ 98,445,685 $ 826,404,732 $ 36,451,362 $ 20,341,593 $ 350,775,435

107
NET ASSIGNABLE FACILITIES SPACE BY FUNCTION, IN SQUARE FEETPublic Universities, As of Oct. 31, 1988
InstitutionInstructionaland Library
Educationalanc Seneral Research Library Classroom Laboratory
TotalAssignable'
East Texas State University 740,878 850,873 105,047 122,021 194,976 1,498,993East Texas State UniversityCenter at Texarkana 37,093 49,051 67 20,524 8,211 49,780
Lamar University SystemLamar University at Beaumont 772,272 914,720 9,367 115,048 127,216 241,878 1,415,349
Lamar University at Orange . 39,794 55,115 - -- 1,824 10,477 10,185 69,986Lamar University at Port Arthur 66,575 69,287 - -- 11,202 12,434 29,454 74,709
Midwestern State University 360,389 431,195 5,756 69,886 74,111 96,963 597,391Pan American University . 478,303 674,515 5,313 81,615 94,659 100,878 801,696
Pan American University at Brownsville 16,143 16,143 - -- --- 16,143 --- 23,722Stephen F. Austin State University 772,761 896,061 5,867 113,921 173,288 193,751 1,774,091Texas A&M University System --- --- --- -- ---
Prairie view A&M University 433.496 532,959 29,030 43,787 58,598 150,571 1,013,813Tar leton State University 522,064 593,489 2,266 56,338 93,647 143,402 850,294Texas A&M University .. 2,252,041 3,674,417 657,627 335,215 287,106 1,043,532 6,054,003Texas A&M University at Galveston 62,158 135,244 29,716 25,604 7,304 48,910 246,103
Texas Southern University 610,256 773,387 18,228 96,430 110,373 211,342 1,086,297Texas State University System --- --- - -- --- --- -
Angelo State University .. .. 330,697 444,991 11,873 57,807 75,292 77,379 827,943Sam Houston State University 925,967 981,515 2,633 106,615 124,408 216,065 1,691,133Southwest Texas State University 787,854 1,176,495 32,956 114,848 150,301 240,008 2,148,189Sul Ross State University . 243,737 288,642 6,329 30,548 28,080 90,182 476,555
Uvalde Study Center . . 23,787 26,996 -- --- 23,787 --- 26,996axes Tech University. .. . 1,645,406 2,374,051 379,088 267,269 256,009 735,579 3,959,907
Texas Woman's University ... 677,699 805,990 24,451 120,368 124,530 203,595 1,419,886The University of Texas System 2,218 170,508 - -- --- 1,758 891 170,510
The University of Texas at Arlington 1,410,581 1,758,532 146,141 154,018 291,299 491,292 2,168,367The University of Texas at Austin 3,131,571 6,889,314 .,949,816 825,760 517,237 1,778,850 9,053,251The University of Texas at Dallas . 303,323 563,789 116,217 94,399 73,400 114,391 640,301The University of Texas at El Paso 1,006,236 1,203,161 35,002 258,455 188,064 231,932 1,626,690The University of Texas of the Permian Basin 132,253 224,145 5,664 20,869 25,674 48,420 269,634The University of Texas at San Antonio 400,742 572,837 43,262 91,264 90,204 154,380 707,724The University of Texas at Tyler 171,654 213,047 -- 26,895 37,336 41,690 225,055
University of Houston System . --- 86,770 - -- --- --- -- 97,502University of Houston-Clear Lake 189,723 314,851 30,654 75,394 47,402 58,061 408,048University of Houston-Downtown 217,455 359,455 - -- 46,005 59,533 56,429 504,949University of Houston ... 1,688,248 2,623,056 413,799 292,706 306,234 693,571 3,577,661University of Houston-yictoria 35,287 45,663 - -- 14,718 7,153 3,164 45,663
University of North Texas .. 1,187,387 1,678,163 123,373 185,327 148,621 384,670 2,434,809University System of South Texas --- --- - -- --- --- ... --
Corpus Christi State University 240,960 304,155 3,920 73,885 37,096 52,823 345,810Laredo State University .... . 38,015 60,842 - -- 11,187 13,669 4,224 61,949Texas A&I University .. ... 639,686 774,730 22,227 120,655 105,486 182,149 1,184,279
West Texas State University 670,705 815,227 34,439 113,845 106,395 151,213 1,399,198
Totals 23,285,414 34,423,381 4,145,081 4,179,278 4,034,556 8,476,800 51,028,238
'Not the sum of preceding columns.)

108
NET ASSIGNABLE FACILITIES SPACE BY FUNCTION, IN SQUARE FEETPublic Community Junior Colleges, As of Oct. 31, 1988
InstitutionInstructionaland Library
Educationaland General Research Library Classroom
TotalLaboratory Assignable'
Alamo Community College District 6,760 38,604 1,491 4,940 42,684Palo Alto College -- --- --- - --San Antonio College 339,637 373,118 56,173 109,892 78,204 420,987St. Philip's College 158,141 190,618 18,430 43,299 59,448 219,892Alvin Community College 148,138 189,003 9,857 35,975 58,804 205,915Amarillo College 319,076 357,533 40,314 54,073 132,682 415,940Angelina College 81,744 94,738 10,473 15,710 25,904 132,824Austin Community College 214,765 242,762 12,281 98,432 86,734 274,543Bee County College . 139,034 150,842 17,264 20,370 55,473 193,062Blinn College 187,931 202,836 26,160 44,399 51,730 337,404Brazosport College 158,855 168,294 10,266 33,469 87,476 192,691Central Texas College 204,012 251,889 9,408 34,007 102,369 323,871Cisco Junior College. 109,139 128,677 12,132 29,382 34,473 193,378Clarendon College . 33,454 34,494 3,219 6,960 9,407 71,420College of the Mainland 177,127 220,261 20,672 35,668 73,415 241,183Collin County Community College District --- --- --- --- --- ---Cooke County College .. 90,495 103,192 7,533 14,922 36,350 133,331Dallas County Community College District --- 72,076 --- --- -- 72,501Cedar Valley College 145,437 160,283 14,409 28,256 50,577 181,325Eastfield College 180,976 209,311 12,626 33,010 77,753 249,107El Centro College . 146,267 170,205 17,264 34,076 68,862 219,439Mountain View College 155,360 175,452 6,408 30,495 69,925 194,075North Lake College 173,980 194,513 11,294 22,843 75,266 214,547Richland College . . 211,658 246,092 14,420 42,157 86,770 270,069Del Mar College 375,717 446,179 61,884 83,575 149,354 486,416El Paso County Community College 264,302 381,521 31,248 55,665 134,523 459,708Frank Phillips College 60,910 80,131 13,153 14,124 17,654 106,412Galveston College 88,133 101,135 9,288 12,035 45,711 107,975Grayson County College 199,620 227,406 6,347 8,403 47,971 94,076 363,921Hill Jurhor College 50,174 58,262 518 5,128 8,103 17,226 88,193Houston Community College 1,978,459 2,010,870 71,683 1,257,312 417,310 2,190,168Howard County Junior College District --- --- ..._ --- --- - --Howard College at Big Spring 99,795 126,779 11,153 21,464 38,587 151,754Kilgore College 320,036 340,306 32,286 72,004 93,824 433,429
a in. , 0
) . .

109
Net Assignable Facilities Space by Function, in Square FeetPublic Community Junior Colleges, As of Oct. 31, 1988
InstitutionInstructionaland Library
Educationaland General Research Library Classroom Laboratory
TotalAssignable'
Laredo Juni Jr College 192,289 235,905 24,379 57,321 58,364 310,408Lee College 179,701 210,179 17,796 31,571 82,768 247,925McLennan Comni...ciliy CollegF 237,319 270,992 25,119 40,721 58,796 293,939Midland Coliege 137,110 152,234 15,176 67,288 40,743 218,536Navarro College 111,436 133,540 848 9,765 30,885 48,055 272,876North Harris County Calleve 86,122 92,321 21,421 23,859 32,631 114,105Northeast Texas Commaridy College --- --- ... --- --- - --
Odessa College 261,377 330,549 19,904 55,685 130,192 384,565Paliola Junior Col;ege 81,235 89,946 8,555 13,320 29,430 202,623Paris Junior College 131,946 145,331 19,203 17,851 57,212 194,021Ranger Junior College 22,739 36,588 --- 4,756 4,025 76,383San Jacinto College District --- --- --- -
Central Campus . 397,339 432,411 39,798 108,103 145,755 484,703North Campus 158,701 172,128 10,037 38,240 79,373 208,277South Campus 169,543 184,195 --- 2,597 74,679 52,777 187,515
South Plains College 209,209 201,198 76 24,912 36,722 55,257 295,662Southwest Texas Junior College 96,531 121,963 --- 16,989 23,763 33,343 159,377Tarrant County Junior College District 8,122 23,561 --- 4,443 3,753 28,640
Northeast Campus 265,754 294,391 37,050 55,328 73,458 329,403Northwest Campus 165,615 193,336 24,244 20,142 70,895 216,646South Campus .. 278,982 311,397 30,305 66,411 90,363 345,205
Temple Junior College 93,759 116,091 9,363 26,382 45,075 190,815Texarkana Community College 176,050 193,371 300 12,116 42,947 55,369 246,148Texas Southmost College 165,987 206,359 33,961 38,939 77,600 249,545Texas State Technical Institute --- 7,710 --- --- --- 7,710
Amarillo Campus 263,296 384,103 7,557 22,125 223,042 469,996Harlingen Campus 199,131 204,689 6,872 24,656 136,927 309,238Sweetwater Campus 93,372 116,738 --- 9,594 60,484 134,684
The Victoria College 110,384 122,648 22,540 34,811 22,112 152,444Waco Campus 483,508 569,617 10,894 67,814 349,998 1,371,275
Trinity Valley Community College 137,494 139,207 9,705 21,328 37,479 201,252Tyler Junior College 202,529 220,977 31,706 50,410 68,239 312,520Vernon Regional Junior College 56,391 66,481 11,291 12,469 24,597 87,298Weatherford College 160,693 166,853 27C 15,265 49,842 52,589 224,618Western Texas College 112,618 134,276 10,813 16,448 43,939 183,294Wharton County Junior College 160,414 183,147 27,156 27,532 68,512 228,766
Totals 12,583,021 14,394,860 L',359 1,141,040 3,589,528 4,800,262 18,330,708
'Not the sum of preceding columns

110
NET ASSIGNABLE FACILITIES SPACE BY FUNCTION, IN SQUARE FEETIndependent Senior Colleges and Universities, As of Oct. 31, 1988
InstitutionInstructionaland Library
Educationaland General Research Library Classroom
TotalLaboratory Assignable'
Abilene Christian University 349,620 384,599 971 70,672 77,820 93,719 856,460American Technological University 9,988 9,988 --- 8,589 1,399 --- 9,988Austin College 128,266 182,149 2,813 24,360 22,634 35 478 333,818Baylor University . 590,623 781,187 16,689 172,269 119,010 115,917 1,400,575Bishop College . . 106,568 159,951 602 23,953 25,897 23,888 344,726Concordia Lutheran College 23,752 40,675 110 2,990 6,048 4,765 73,333Dallas Baptist University 103,625 115,963 --- 16,180 10,637 34,655 190,747East Texas Baptist University 59,755 77,167 --- 7,442 13,920 11,028 200,509Hardin-Simmons University 209,1'16 258,916 971 39,248 43,473 42,467 484,392Houston Baptist University 97,299 114,387 --- 15,844 21,191 23,592 165,907Howard Payne University 121,- 33 150,420 1,915 11,529 27,740 29,048 255,150HustonTillotson College 57,0 i 9 75,382 --- 10,743 11,972 9,970 141,451Incarnate Word College . 120,551 169,280 2,451 14,228 30,031 36,634 228,697Jarvis Christian College 52,271 80,888 .. 11,283 10,558 18,081 172,111LeTourneau College 119,141 188,274 5,134 24,438 51,512 346,780Lubbock Christian College 118,852 143,046 --- 15,369, 30,005 20,609 240,792McMurry College . . 161,541 219,507 1,118 26,652 33,479 39,233 349,766Our Lady of the Lake University 124,241 180,790 1,86.. 15,920 35,846 27,608 256,357Paul Quinn College . 29,861 59,857 --- 7,483 13,213 3,908 113,744St. Edward's University 82,751 118,972 916 11,463 18,376 25,364 278,085St. Mary's University 225,709 279,461 62 89,660 43,287 36,581 389,893Schreiner College .. 46,468 90,427 --- 19,356 5,495 5,936 182,772Southern Methodist University 703,776 931,890 54,810 216,431 114,097 148,346 1,792,939South Texas College of Law 26,488 31,027 -.- 2,120 13,841 --- 31,446Southwestern Adventist College 68,149 87,976 1,095 6,626 12,434 32,936 144,687Southwestern University 127,672 175,355 --- 32,397 26,762 36,984 389,656Texas Christian University 432,857 639,694 71,959 62,717 86,396 128,482 1,275,732Texas College .. . 59,301 76,955 1,191 13,424 15,838 11,041 106,477Texas Lutheran College 117,376 169,271 2,299 34,827 24,965 27,853 299,574Texas Wesleyan College 137,017 176,011 1,056 18,569 25,905 32,302 267,938Trinity University 369,175 439,215 13,981 67,361 42,623 111,087 995,591University of Dallas . 91,072 120,551 --- 26,204 17,819 14,944 192,794University of Mary Hardin-Baylor . 91,420 132,644 --- 15,145 24,120 21,308 235,871University of St. Thomas 117,896 137,494 451 31,766 31,351 18,087 244,278Wayland Baptist University 93,915 153,828 --- 11,793 19,893 32,198 308,177Wiley College . 78,757 100,478 200 17,141 16,275 13,688 133,417William Marsh Rice University 453,940 805,994 152,936 226,628 61,721 208,798 1,523,813Totals 5,916,083 8,072,720 330,889 1,418,100 1,155,965 1,528,446 14,974,262
'Not the sum of preceding columns
)UU

111
NET ASSIGNABLE FACILITIES SPACE BY FUNCTION, IN SQUARE FEETIndependent Junior Colleges, As of Oct. 31, 1988
InstitutionInstructionaland Library
Educationaland General Research Library Classroom Laboratory
TotalAssignable'
Jacksonville College 21,177 22,447 3,227 6,063 3,094 48,087Lon Morris College 39,678 46,152 5,09 10,980 10,975 125,143Southwestern Assemblies of God Junior College 43,119 48,539 6,983 13,557 5,660 120,003Southwestern Christian College 23,648 25,666 2,449 6,329 1,842 78,620
Totals 127,622 142,804 18,158 36,929 21,571 371,853
'Not the sum of preceding columns.

HIGHER EDUCATION APPROPRIATIONS

115
LEGISLATIVE APPROPRIATIONS: GENERAL REVENUEAgencies of Higher Education
Agency
Senate Bill 1
Fiscal 1-88 Fiscal 1989
Texas Higher Education Coordinating Board
Administration and Coordination $ 7,860,890 $ 7,901,337Trusteed Funds 132,603,535 72,999,934
Public Junior Colleges
Alamo Community College District $ 34,076.808 $ 34,076,808Alvin Community College 7,243,003 7,243,003Amarillo College 7,872,270 7,872,270American Educational Complex 11,506,519 11,506,519Angelina College 3,070,452 3,070,452Austin Community College 17.993,174 17,993.174Bee County College 5,091,380 5,091,380Blinn College 6.063,424 6,063,424Brazosport College 4,037,727 4,037,727Cisco Junior College 2,699,690 2,699,690Clarendon College 1,490,250 1,490,250College of the Mainland 4,646,879 4,646,879Collin County Community College 3,722,045 3,722,045Cooke County College 2,521,702 2,521,702Dallas County Community College District 52,982,551 52,982,551Del Mar College 12,675,931 12,675,931El Paso County Community College District 18,446,727 18,446,727Frank Phillips College 1,752,158 1,752,158Galveston College 2,837.905 2,837,905Grayson County College 4.241,740 4,241,740Hill Junior College 2,477,453 2,477,453Houston Community College 32.024,737 3'4024,737Howard County Junior Co liege District 3,783,065 3,783,065Kilgore College 6,780,496 6,780,496Laredo Junior College 7,275,630 7,275,630Lee College 6,793,815 6, ,3,815McLennan Community College 7,692,227 7,692,227Midland College 4,752380 4,752,380

116
Legislative Appropriations: General RevenueAgencies of Higher Education
Senate Bill 1
Agency Fiscal 1988 Fiscal 1989
Public Junior Colleges (continued)
Navarro College $ 3,731,014 $ 3,731,014North Harris County College12,959,590 12,959,590Northeast Texas Community College 1,914,229 1,914,229Odessa College6,731,821 6,731,821Panola Junior College2,356,981 2,356,981Paris Junk); College .
4,466,564 4,466,564Ranger Junior College,622,413 1,622,413San Jacinto College .
20,502,487 20,502,487South Plains College .
6,023,601 6,023,601Southwest Texas Junior College 3,405,096 3,405,096Tarrant County Junior College District24,947,045 24,947,045Temple Junior College .
2,811,997 2,811,997Texarkana Community College 6,171,506 6,171,506Texas Southmost College .6,910,128 6,910,128The Victoria College3,672,175 3,672,175Trinity Valley Community College6,411,356 6,411,356Tyler Junior College ..
10,937,314 10,937,314Vernon Regional Junior College2,884,303 2,884,303Weatherford College .
2,309,242 2,309,242Western Texas College2,005,463 2,005,463Wharton County Jur ior Coll !ge4,257,318 4,257,318
Staff Group Insurance Premiums
Subtotal$ 413,583,781 $ 413,583,781
' ) ..'.1-^-
l,, I -;

117
Legislative Appropriations: General RevenueAgencies of Higher Education
Agency
Senate Bill 1
Fiscal 1988 Fiscal 1989
Public Universities
East Texas State UniversityEast Texas State University at TexarkanaLamar University-Beaumont
$ 17,306,3152,847,561
22,401,724
$ 18,566,6273,061,466
24 134,043Lamar University-Orange 1,888,274 1,898,220Lamar University-Pod Arthur 2,620,617 ; ,624,948Midwestern State University 8,232,559 3,618,139North Texas State University 48,498,010 : 3,344,984Pan American University 16,857,258 18,520,936Pan American University at Brownsville 2,806,818 3,002,497Stephen F. Austin State University 22,614,533 24,744,481Prairie View A & M University 12,785,386 13,832,077Tarleton State University 8,949,868 9,725,765Texas A & M University 145,204,216 158,228,184Tern b A & M University at Galveston 4,521,043 4,521,043Texas Southern University 17,861,365 19,323,911Angelo State University 9,812,293 10,618,924Sam Houston State University 20,070,531 21,833,412Southwest Texas State University 33,336,812 36,807,292Sul Ross State University 6,064,290 6,347,132Texas Tech University 64,426,470 69,143,472Texas Woman's University 26,601,590 28,236,287The University of Texas at Arlington 48,059,321 52,629,966The University of Texas at Austin 167,201,119 180,707,304The University of Texas at Dallas 22,941,036 25,242,874The University of Texas at El Paso 27,711,148 29,968,574The Jniversity of Texas of the Permian Basin 6,343,986 6,358,343The University of Texas at San Antomo 22,436,961 24,062,074The University of Texas at Tyler 7,405,312 7,954,489University of Houston 83,472,030 91,922,165University of Houston-Clear Lake 12,549,018 13,632,254University of Houston-Downtown 8,861,196 9,517,066'Jniversity of Houston-Victoria 2,761,325 2,926,064Corpus Christi State University 8,029,779 8,707,252Laredo State University 2,848,130 3,024,794Texas A & I University 12,343,980 13,122,872West Texas State University 12,232,536 12,779,528
Subtotal $ 940,909,460 $ 1,019,709,459

118
Legislative Appropriations: General RevenueAgencies of Higher Education
Agency
Senate Bill 1
Fiscal 1988 Fiscal 1989
System Offices
Lamar University SystemSystem OfficeTexas A & M University System-Administrative and General Offices $ $
1 1
Texas State University System-Central Office311,708, 312,781,The University of Texas SystemSystem Administration
The University of Houston system-System Administration2,126,504 1
University System of South Texas-System Administration332,334 334,122
Subtotal . .$ 2,77J,546 $ 646,903
Health-Related Units
The University of Texas Health Science Center at Dallas$ 58,839,725 $ 58,839,725The University of Texas Medical Branch at Galveston
164,167,048 164,167,048The University of Texas Health Science Center at Houston88.309,190 88,309,190The University of Texas Health Science Conner at San Antonio72,707,966 72,707,966The University of Texas System Cancer Center92,050,664 92,050,664The University of Texas Health Center at Tyler14,686,046 14,686,046Texas Tech University Health Sciences Center39,127,391 39,177,066Texas College of Osteopathic Medicine'1,036,341 21,036,341
Subtotal ...$ 550,924,371 $ 550,974,046
Services of the Texas A & M University System
Texas Agricultural Experiment Station$ 37,181,745 $ 37,181,745Texas Agricultural Extension Service
31,696,338 31,646,663Texas Engineering Experiment Station6,496,452 5,304,252Texas Engineering Extension Service2,757,255 2,757,255Texas Transportation Institute1,081,411 1,081,411Texas Forest Service8,381,091 8,381,091Rodent and Predatory Animal Control Service2,202,134 2,202,134Texas Veterinary Medical Diagnostic Laboratory1,889,029 89,029
Subtotal .$ 91,685,455 $ 90,443,580

119
Legislative Appropriations: General RevenueAgencies of Higher Education
Agency
Senate Bill 1
Fiscal 1988 Fiscal 1989
All Other Agencies
Natural Fibers and Food Protein Commission $ 1,397,543 $ 1,392,5751Sam Houston Memorial Museum 306,674Texas Tech University Museum 456,062 1
PanhandlePlains Historical Museum 487,661 1
Texas State Technical Institute 43,165,994 42,771,755State Rural Medical Education Board 134,123 37,753
Subtotal $ 45,948,057 $ 44,202,083
Higher Education Fund $ 100,000,000 $ 100,000,000
Grand Total, General Revenue $ 2,286,286,095 $ 2,300,461,123
Note: Amounts shown reflect a 65 of 1 % reduction per provisions of Article V, Section 101 in the appropriations bill.'Amounts vetoed by the governor

120
BIENNIAL LEGISLATIVE APPROPRIATIONSPER FULL-TIME STUDENT EQUIVALENT
GENERAL REVENUEPublic Universities
Biennium AppropriatedFTE
StudentsAppropriation
Per FTE
IncreasePer
FTE Student
1953-55 (18 Campuses) $ 50,354,515 124,619 $ 404 ---%195557 62,704,318 154,527 406 .501957.59 76,309,472 163,505 467 '5.02195961 . . 89,964,242 178,498 504 7.921961.63 (19 Campuses) 113,144,937 213,169 531 5 361963-65 (20 Campuses) 156,484,590 273,854 571 7.531965-67 (22 Campuses) 235,931,950 348,016 678 18.741967-69 . . 337,831,325 405,634 833 22.861969-71 (23 Campuses) 439,307,445 457,946 959 15.131971.73 (25 Campuses) 533,601,546 484,751 1,101 14.81197375 (31 Campuses) 684,623,597' 507,328 1,349 22.521975-77 (35 Campuses) 1,039,424,2072 563,783 1,844 36.691977-79 (36 Campuses) 1,255,926,7673 574,372 2,187 18.601979-81 (37 Campuses) 1,478,554,332' 585,262 2,526 25.501981-83 .. . 1,856,247,615 609,818 3,044 20.51198385 . 2,194,232,606 632,430 3,470 13.99198587 1,746,951,496 599,961 2,912 -16.081987-89 1,979,608,975 628,600 (est) 3,149 (est) 8.14
'Includes $171,500,000 federal revenue sharing funds.'Includes $135,095,638 federal revenue sharing funds.'Includes $304,311,625 federal revenue sharing funds.'Includes $144,287,929 federal revenue sharing funds.Notes: 1. The above amounts include supplemental appropriations to the Texas Commission on Higher Education or
Coordinating Board for allocation to the public senior colleges and universities.2. Excludes appropriations for new construction.3. Does not include salary increase funds provided by Article V of the Appropriations Bill for the 1985-87 biennium
.! iI.i
Revised

121
BIENNIAL LEGISLATIVE APPROPRIATIONSPER FULL-TIME STUDENT EQUIVALENT
ALL FUNDSPublic Universities
Bienniurr.FTE
Appropriated StudentsAppropriation
Per FTE
IncreasePer
FTE Student
1953-55 (18 Campuses) $ 62,446,749 124,619 $ 501 ---%1955.57 80,276,695 154,527 519 3.591957.59 103,648,933 163,505 634 22 161959-61 117,805,857 178,498 660 4.101961.63 (19 Campuses) 144 465,343 213,16Q 678 2.731963-65 (20 Campuses) 197,103,622 273,854 720 6.191965.67 (22 Campuses) 287,096,051 348,016 825 14.581967.69 403,832,265 405,634 996 20.731969-71 (23 Campuses) 513,901,105 457,946 1,122 12.651971.73 (25 Campuses) 609,375,522 484,751 1,257 12.031973.75 (31 Campuses) 757,418,042 507,328 1,493 18.771975-77 (35 Carr4. ises) 1,118,084,276 563,783 1,983 32.821977.79 (36 Campuses) 1,363,713,537 574,372 2,374 19.721979-81 (37 Campuses) 1,590,435,224 585,262 2,717 14 451981.83 2,009,689,302 609,818 3,296 21.311983-85 2,376,391,781 632,40 3,758 14 021985-87 2,288,809,745 599,961 3,t. 1 521987.89 (General Revenue Appropriations Only:,
RevisedNotes: 1. The above amounts include s..polemental appropriations to the Tex,- Commission on Higher Education or
Coordinating Board for allocatdv. to the public senior colleges an ... ...tIrsities2 Excludes appropriations for new construction.3 Does not include salary increase funds provided by Article V of the Appropriations Bill for the 198'-87 biennium.


125
Tuition Equalization Grant ProgramFiscal Year 1988
Type of InstitutionNumber ofInstitutions
Number ofStudents Funds Awarded
Public Universities
Independent Senior Colleges and Universities 43 14,847 $18,316,453
Public Junior Colleges
Independent Junior Colleges 3 231 230,326
Public Health Suence Centers
Texas State Technical Institutes
Total 46 15,078 $18,546,779
Average Award $1,230

126
State Student Incentive Grant ProgramFiscal Year 1988
Type of InstitutionNumber ofInstitutions
Number ofStudents Funds Awarded
Public Universities ..
Independent Senior Colleges and Universities 40 3,702 .:2,637,647
Public Junior Colleges . .
Independent Junior Colleges 3 72 ": I ,e-Z2
Public Health Science Centers
Texas State Technical Institutes
Total .. ... 43 3,774 $2,668,929
Average Award$707

127
State Scholarship for Ethnic Recruitment ProgramFiscal Year 1988
Type of InstitutionNumber ofInstitutions
Number ofStudents Funds Awarded
Public Universities
Independent Senior Colleges and Universities
Public Junior Colleges
Independent Junior Col leg s
Public Health Science Centers
Texas State Technical Institutes
Total
Average Award
25 514 $207,181
25 514 $207,181
$403

128
Texas Public Educational - State Student Incentive Grant ProgramFiscal Year 1988
Type of Institution Number ofInstitutions
Number ofStudents Funds Awarded
Public Universities30 2,545 $1,943,391
Independent Senior Colleges and Universities
Public Junior Colleges44 2,520 894,041
Independent Junior Colleges
Public Health Scien-e Centers6 147 142,378
Texas State Technical Institutes
Total ....80 5,211 $2,979,810
Average Award$572
Note: $1,487,985 of the reported funds were federal; $1,491,824 were provided through state appropriations from tuition revenues

Texas Public Educational Refund Grant ProgramFiscal Year 1988
129
Type of InstitutionNumber ofInstitutions
Number ofStudents Funds Awarded
Public Universities 2 64 $102,008
Independent Senior Colleges and Universities
Public Junior Colleges 5 119 32,640
Independent Junior Colleges
Public lik win Science Centers
Texas State Technical Institutes
Total 7 183 $134,648
Average Award $735
Note: Funded 50-50 from institutional deposits and excess Texas Public Educational Grant funds transferred to the Board by schools with excess TPEG funds. (56.033 ofthe Education Code indicates no school should have a TPEG balance exceeding 150% of the annual set-aside. Sclicolsexceeding the 150% limit must forward the excessfunds to the Board for use in this program

130
Hinson-Hazlewood Cu liege Student Loan ProgramFiscal Year 1988
Ty; a of Institution Number ofInstitutions
Numbe- ofStudents Funds Awarded
Public Universities22 1,375 $3,432,934
:ndependent Senior Colleges and Universities29 1,300 4,394,732
Public Junior Colleges10 64 105,474
Independent junior Colleges1 5 6,536
Public Health Science Centers7 1,745 9,/47,1180
Texas State Technical Institutes1 2 3,937
Totql70 4,691 $11,691,493
Average Award$3,771
Note: Includes old Noninsured Loans, Federal Insured Student Loans, Guaranteed Student Loans and Health Education Assistance Loans Does not include SupplementalLoans to Students, College Access Loans or Health Education Loans.

131
Hinson- Hazlewood College Student Loan ProgramAnalysis of Loan Transactions - All Programs
All Types of Particpating InstitutionsFiscal Year 1988
Type of Institution AmountNumber ofStudents
AverageBorrowed
Public Universities (32) $ 3,432,934 1,375 $2,497
Independent Senior Colleges and Universities (41) 4,394,732 1,500 2,930
Public Junior Colleges (49) 105,474 64 1,648
Independent Junior Colleges (5) 6,536 5 1,307
Public Health Science Centers (17) 9,747,880 1,745 5,586
Texas State Technical Institutes (4) 3,937 2 1,969
Total (144) $17,691,493 4,691 $3,771
Note: Includes old Noninsured Loans, Federal Insured Student Loans, Guaranteed Student Loans and Health Education Assistance Loans. Does not Include SupplementalLoans to Students, College Access Loans or Health Education Loans.

Hinson-Hazlewood College Student Loan ProgramAnalysis of Loan Transactions - All Programs
"II Types of Particpating InstitutionsFiscal Year 1988
Type of Institution
History to Date
4mountNumberof Notes
AverageLoaned
Numbe ofBorrowers
AverageBorrowed
Public Universities (32) $1"9,837,005 419,595 $476 107,004 $1,835
Independent Senior Colleges and Universities (41) 92,191,105 133,499 691 36,821 2,504
Public Junior Colleges (49) 13,705,477 40,072 342 16,773 817
Independent Junior Colleges (5) 735,603 1,263 582 515 1,428
t-ublic Health Science Centers (17) 53,403,201 23,376 -,9.85 6,766 7,894
Texas State Technical ,nstitutes (4) 3,738,692 10,249 365 3,294 1,135
Total (144) $361,611,0,13 628,054 $570 171,173 $2,124
Note Includes old Noninsured Loans, Federal Insured Student Loans, Guaranteed Student Loans and Health Education Assistance Loans. Does not include SupplementalLoans to Students, College Access Loans or Health Education Loans.

133
Hinson-Hazlewood College Student Loan ProgramInstitutional Status of All Loans
Total - All InstitutionsFiscal Year 1988
Number ofAccounts Principal Percent
Accounts in Interim StatusEnrolled 3,930 $ 17,698,965 51%Scholastic Deferment 448 2,943,026 8Payments Scheduled But Not Dila (2,403) 14,132,881 41Subtotal Interim Status 6,779 34,774,873 100%
Accounts in Repayment StatusCurrent Accounts 17,113 47,183,752 15Military Deferment 234 1,259,338Medical Deferment ---Unemployed Deferment 88 324,64UResidency Determent 322 4,265,841 1
Paid In Full 85,280 117,577,045 39Paid In Full Litigation Account 6,286 8,557,744 3Amount Paid On Accounts 48,539,296 16Bankrupt Accounts 829 1,152,859 -Death /Disability Claims Paid 1,109 1,879,600 1
Death;Disability Claims Pending 171 234,083 -Default /Bankrupt Claims Paid 16,585 26,048,397 9Default/Bankrupt Claims Pending 399 824,989 -Default /Bankrupt Claims Unpaid 7,495 61,760One Payment Past Due 1,562 4,803,296 2Two Payments Past Due 580 1,892,297 1
Three Payments Past Due 362 1,254,160Four Payment Past Due 218 719,157Five or More Payments Past Due 60 111,465Collection Assist Req Fr )m Attorney General (177) 557,625Accounts Referred To Attorney General/Suit (20,929) 37,780,450 12NonSuit Unable To Locate 12 17,282Subtotal Repayment Status 149,93a $305,045,091 100%
Grand Total, All Accounts 100%
Note: ( ) Indicates duplicated numbers of studentsIncludes old Non-insured Loans, Federal Insured Student Loans and Guaranteed Studen, Loans Does not include Supplemental Loans to Students, College Access Loans,Health Education Assis+ance Loans or Health Education Loans

134
Hinson-Hazlewood College Student Loan ProgramInstitutional Status of All LoansTotal All InstitutionsFiscal Year 1988
Number ofAccounts Principal Percent
Detail of Accounts Referred to Attorney GeneralSuits Requested But Not Filed 234 $ 506,308 1%Suits Filed .... .
--- --- --Service Pending .226 922,934 2No Service . i37 1,623,662 4Citation Served511 1,432,683 4Legal Action Suspended463 1,250,588 3Judgment Entered . 513 1,640,292 4Judgment Abstracted
18,245 30,403,980 80Total Accounts Referred To Attorney General20,929 $ 37,780,450 100%
Cash Reeelpts VolumeCurrent Month .
18,361 1,132,307riscal Year 1988 .32,576 13,448,C55History To Date
147,266 $210,263,246
Note: Includes old Non-insured Loans, Federal Insured Student Loans and Guaranteed Student Loans Does not include Supplemental Loans to Students, College AccessLoans, Health E& cation Assistance Loans or Hea'th Education Loans.

135
Hinson-Hazlewood College Student Loan ProgramHealth Education Assistance Loans
Fiscal Year 1988
Type of InstitutionNumber ofInstitutions
Number ofStudents Funds Awarded
Public Univeisities1 52 $ 270,732
Independent Senicr Colleges and Univeg sales 2 147 629,522
Public Junior Colleges
Independent Junior Colleges
Public Health Science Centers 6 1,116 6,586,769
Texas State Technical Institutes
Total 9 1,315 $7,487,023
Average Award$5,694
Note: These figures are not included on pages 133 and 134

136
Hinson-Hazlewood College Student Loan ProgramAnalysis of Loan Transactions - Health Education Assistance Loans
All Types of Particpating InstitutionsFiscal Year 1988
Type of Institution AmountNumber ofStudents.
AverageBorrowed
Public Universities (1) $ 270,732 52 $5,206
Independent Senior Colleges and Universities (2) 629,522 147 4,282
Public Junior Colleges
Independent Junior Colleges
Public Health Science Centt rs (6) 6,586,769 1,116 5,902
Texas State Technical Institutes
"iota! (9) $7,487,023 1,315 $5,694

137
Hinson-Ha'Iwood College Student Loan ProgramAnalysis of Loan Transactions - Health rJucation Assistance Loans
All Types of Particpating InstitutionsFiscal Year 1988
Type of Institution
History to Date
AmountNumberof Notes
AverageLoaned
Number ofBorrowers
AverageBorrowed
Public Universities (1) $ 418,292 128 $3.267 61 $6,857
Independent Senior Colleges and Universiiies (3) 904,018 213 4,244 178 5,079
Public Junior Colleges
Independent Junior Colleges
Public Health Science Centers (6) 21,313,190 5,904 3,610 2,427 3,610
Texas State Technical Institutes
Total (10) $22,638,500 6,245 $3.625 2,666 $3,685
, 1
3 i

138
Hinson-Hazlewood College Student Loan ProgramInstitutional Status of Health Education Assistance Loans
All InstitutionsFiscal Year 1988
Number ofAccounts Principal Percent
Accounts IA Interim StatusEnrolled . . 1,055 $ 8,861,951 60%Scholastic Deferment 28 323,937 2Paymente Scoeduled But Not Due 577 5,695,145 38Subtotal Interim Statu. 1,660 14,881,033 100%
Accounts In Repayment StatusCurrent Accounts 443 2,776,144 41%Military Deferment
6 56,939 1Medical Deferment1 8,000Unemployed Deferment1 3,000 - --P sidency Deferment 185 2,116,130 31Paid In Full
120 451,68 7Paid In F ill Litigation Account--. --- -.-Amount Paid On Accounts
414,820 6BrInkrupt Accounts--- --- --Death/Disability Claims Paid3 38,500 1Death/Disability Claims Pending1 --- ---Default/Bankrupt Claims Paid7 57,672 1Default/Bankrupt Claims 'ending 2 12,137 --Default/Bankrupt Claim._ Unpe:J1 -.- ---One Payment Past Due
27 248,466 4Two Payments Past Due5 57,759 1Three Payments Past Due
1 i 105,610 2Fo.ir Payment Pas Due2 24,000 ---Five or More Payments Past Due
--- --- ---Collection Assist. Req. From Attorney General21 196,096 3Accounts Referred To Attorney General/Suit19 1E2,702 2Non - Suit -- Unable To Locate
--. ---subtotal Repayment Stat,Js857 $6,72 1.733 100%
Grand Total. All Accounts2,517 $21 602,767 1O%

Hinson-Hazlewood College Student Loan ProgramInstitutional Status of Health Education Assistance LoansFiscal Year 1988
Number ofAccounts Principal Percent
Detail Of Accounts Referred e .., Attorney GeneralSuits Requested But Not Filed 3 $ 20,596 13%Suits Filed . ... ---
Service Pending 2 9,000 6No Service 3 15,341 10Citation Served 9 96,265 63Legal Action Suspended 2 11,500 8Judgment EnteredJudgment Abstracted ---
Total Accounts Referred To Attorney General 19 $152,702 100%
139

140
Hinson-Hazlewood College Student Loan ProgramSupplemental Loans to Students
Fiscal Year 1988
Type of InstitutionNumber ofInstitutions
Number ofStudents Funds Awarded
Public Universities . 11 81 $ 227,986
Independent Senior Colleges and Universities 17 274 095,374
Public Junior Colleges 11 46 140,831
Independent Junior Colleges .1 1 1,200
Public Health Science Centers 4 256 1,378,929
Texas State Technical Institutes1 1 3,925
Total 45 659 $2,748,245
Average Award $4,170
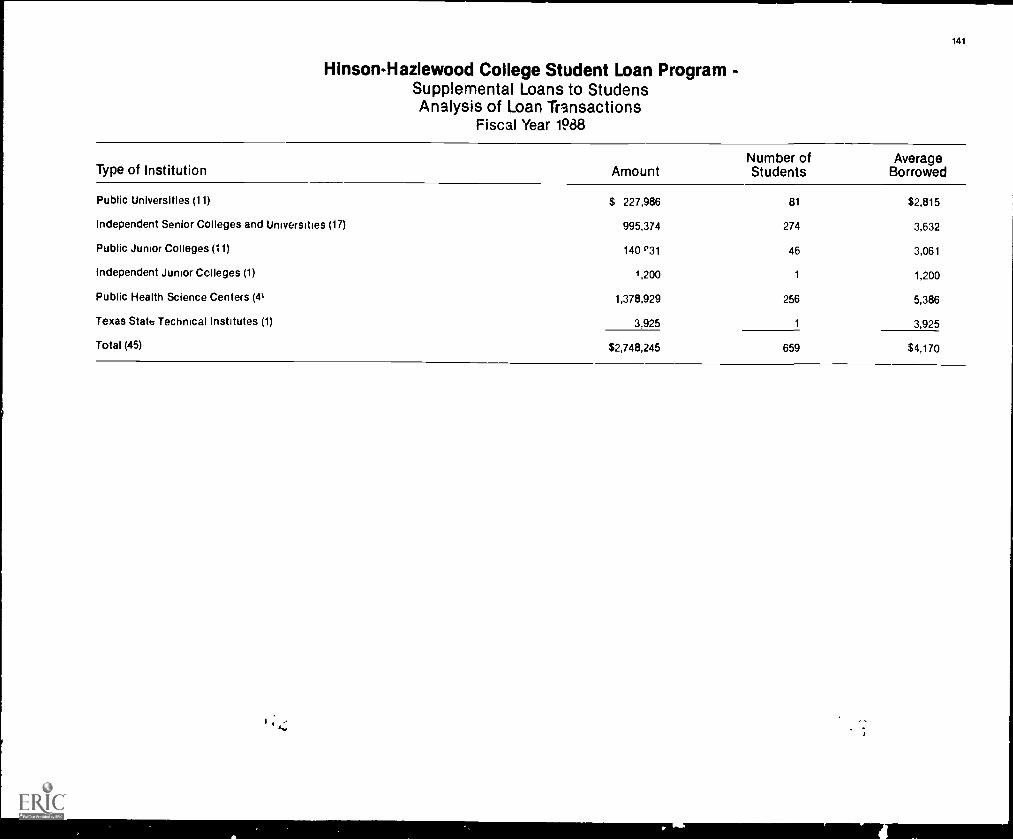
141
Hinson-HazIewood College Student Loan Program -Supplemental Loans to StudensAnalysis of Loan Transactions
Fiscal Year 1988
Type of Institution AmountNumber ofStudents
AverageBorrowed
Public Universities (11) $ 227,986 81 $2,815
Independent Senior Colleges and Universities (17) 995,374 274 3,632
Public Junior Colleges (11) 140''31 46 3,061
Independent Junior Cc lieges (1) 1,200 1 1,200
Public Health Science Centers (4, 1,378,929 256 5,386
Texas State Technic& Institutes (1) 3,925 1 3,925
Total (45) $2,748,245 659 $4,170

142
Hinson-Hazlewood College Student Loan Program -Supplemental Loans to Students
Analysis of Loan TransactionsFiscal Year 1988
Type'of Institution
History to Date
AmountNumberof Notes
AverageLoaned
Number ofBorrowers
AverageBorrowed
Public Universities (14) $ 305,210 123 $2,481 101 $3,022Independent Senior Colleges and Universities (20) 1,082,311 323 3,350 296 3,656Public Junior Colleges (11)
140,831 48 2,934 46 3,062Independent Junior Colleges (1) 1,200 1 1,200 1 1,200Public Health Science Centers (6) 2,217,815 704 3,150 431 5,145Texas State Technical Institutes (1) 3,925 1 3,925 1 3,925Total (53)
$3,751,292 1,200 $3,126 876 $4,282

143
Hinson-Hazlewood College Student Loan Program -Supplemental Loans to StudentsInstitutional Status of All Loans
Fiscal Year 1988
Number ofAccounts Principal Percent
Accounts in Interim StatusEnrolled 199 $ 741,704 30%Scholastic Deferment 241 1,268,8685Payments Scheduled But Not Due (132) 506,94620Subtotal Interirp Status 572 2,523,519100
Accounts in Repayment StatusCurrent Accounts 105 301,091 31Military Deferment _ --
Medical DefermentUnemployed Deferment ---Residency Deferment 51 271,5/2 28Paid In Full 19 56,291 6Paid In Full Litigation Account --- _-Amount Paid On Accounts 46,279 5Bankrupt Accounts --- --Death/Disability Claims PaidDeath/Disability Claims Pending 1
Default/Bankrupt Claims PaidDefault/Bankrupt Claims Unpaid ___ ... ....
One Payment Past Due 27 9b,?07 10Two Payment.; Past Due 49 178,388 18Three Payments Past Due --- ... ...Four Payment Past Due 3 15,000 2Five or More Payments Past Due ___ ...Collection Assist. Req From Attorney General (3) 9,000 1
Accounts Referred To Attorney General/Suit (3) 10,000 1
Non-Suit-Unable To Locate ... ...Subtotal Repayment Status 261 982,831 100%
Grand Total, All Accounts 833 $ 3,506,351 100%
Note ( ) Indicates duplicated numbers of students
c
0

144
Hinson-Halewood College Student Loan Program -Supplemental Loans to StudentsInstitutional Status of All LoansFiscal Year 1988
Number ofAccounts Principal Percent
Detail Of Accounts Referred To Attorney GeneralSuits Requested But Nct Filed
2 $ 7,000 77%Suits FiledService PendingNo Service
1 3,000 30Citation ServedLegal Action SuspendedJudgment EnteredJudgment AbstractedTotal Accounts Referred To Attorney General
3 $ 10,000 100%Cash Receipts Volume
Current Month105 $ 9,308Fiscal Year 1988183 63,201History To Data203 103,380

145
Paul Douglas Teacher Scholarship ProgramFiscal Year 1988
Type of Insti,JtionNumber ofInstitutions
Number ofStudents Funds Awarded
Public Universal(); 27 217 $ 781,460
Indepe-4 ' Senior Colleges and Universities 22 112 415,347
Public Junior Co IlAnes 10 13 36,890
Independent Junior Colleges
Public Health Science Centers
texas State- Tochnical Institutes
Total 49 342 $1,233,697
Average Award $3,607

146
Future Teacher Loan ProgramFiscal Year 1988
Type of InstitutionNumber ofInstitutions
Number ofSturlents Funds Awarded
Public Universities 14 83 $164,614
Independent Senior Colleges and Universities 10 33 73,841
Public Junior Colleges
Independent Junior Colleges
Public Health Science Centers
Texas State Technical Institutes
Totale4 116 $238,455
Average Award$2,"55

147
Teacher Education Loan ProgramFiscal Year 1988
Type of InstitutionNumber ofInstitutions
Number ofStudents Funds Awarded
Public Universities
Independent Senior Colleges and Universities 1 1 $1,000
Public Junior College:
IndepenCant Junior Colleges
Public Health Science Cen'ers
Texas State Technical Institutes
Total 1 1 $1,000
Average Award $1,000
4

Physician Student "..oan Repayment ProgramFiscal Year 1988
Type of Institution
Public Universities
Independent Senior Colleges and Universities
Public Junior Colleges
Independent Junior Colleges
Public Health Science Centers
TeAas State Technical Institutes
Total
Average Award
Number of Number ofInstitutions Students Funds Awarded
17 $86,955
$5,115
Note' Awards are made to practicing physicians after they complete th )ir schooling
K:44.401.C40+044+C401040C+0+:4440+C+0>K4CAPK40101.X,N):11~,14"
ERIC Cl earinghouse forJunior Col lege.s juN 16 1989
1010444404.14444.***1444:40304400444014+84W,0101404101.01.10