DOCUMENT RESUME ED 289 739 Grandy, Jerilee · PDF filecharacteristics of examinees planning to...
188
DOCUMENT RESUME ED 289 739 SE 048 824 AUTHOR Grandy, Jerilee TITLE Ten-Year Trends in SAT Scores and Other Characteristics of High School Seniors Taking the SAT and Planning To Study Mathematics, Science, or Engineering. Research Report. INSTITUTION Educational Testing Service, Princeton, N.J. SPONS AGENCY National Science Foundation, Washington, D.C. REPORT NO ETS-RR-87-49 PUB DATE Oct 87 NOTE 344p. PUB TYPE Reports - Research/Technical (143) Statistical Data (110) EDRS PRICE MFO1 /PC14 Plus Postage. DESCRIPTORS *Academic Achievement; *College Entrance Examinations; College Mathematics; College Science; Computer Science; Engineering Education; Higher Education; High Schools; Majors (Students); Mathematics Education; Minority Groups; *National Surveys; Science Education; *Secondary School Mathematics; *Secondary School Science; Sex Differences; Standardized Tests IDENTIFIERS *Scholastic Aptitude Test ABSTRACT This study analyzed data from the Scholastic Aptitude Test (SAT) taken by high school seniors between 1915 and 1986. Its purpose was to study trends in the numbers, test scores, and other characteristics of examinees planning to major in mathematics, science, and engineering, and to compare these data with comparable data from examinees planning to major in other areas. The major findings included: (1) the number of examinees planning to major in mathematics, science, and engineering increased until 1983 and has since declined; (2) examinees planning to major in mathematics, science, and engineering in 1986 obtained SAT Verbal scores averaging 19 points higher than the average for all examinees, although the means varied greatly depending upon the specific major field choice; (3) the average SAT Mathematics scores of examinees planning to major in mathematics, science, and engineering in 1986 were 38 points higher than the average for all test takers; (4) examinees intending to study pre-medicine, classics, comparative literature, philosophy, classical languages, Chinese, Latin, Russian, education of the gifted and talented, and mathematics education had higher means than those interested in mathematics, science, and engineering; (5) the Verbal and Mathematics scores of examinees interested in computer science have declined 26 and 40 points respectively in the last ten years; (6) there are still more males than females interested in mathematics, science, and engineering; (7) women planning to major in electrical, mechanical, and civil engineering have higher average SAT Mathematics scores than the men interested in these fields; and (8) mean SAT Mathematics scores of blacks planning to major in mathematics, science, and engineering have risen considerably over the past decade, especially among those planning to major in mathematics or statistics. (TW)
Transcript of DOCUMENT RESUME ED 289 739 Grandy, Jerilee · PDF filecharacteristics of examinees planning to...

DOCUMENT RESUME
ED 289 739 SE 048 824
AUTHOR Grandy, JerileeTITLE Ten-Year Trends in SAT Scores and Other
Characteristics of High School Seniors Taking the SATand Planning To Study Mathematics, Science, orEngineering. Research Report.
INSTITUTION Educational Testing Service, Princeton, N.J.SPONS AGENCY National Science Foundation, Washington, D.C.REPORT NO ETS-RR-87-49PUB DATE Oct 87NOTE 344p.PUB TYPE Reports - Research/Technical (143) Statistical
Data (110)
EDRS PRICE MFO1 /PC14 Plus Postage.DESCRIPTORS *Academic Achievement; *College Entrance
Examinations; College Mathematics; College Science;Computer Science; Engineering Education; HigherEducation; High Schools; Majors (Students);Mathematics Education; Minority Groups; *NationalSurveys; Science Education; *Secondary SchoolMathematics; *Secondary School Science; SexDifferences; Standardized Tests
IDENTIFIERS *Scholastic Aptitude Test
ABSTRACTThis study analyzed data from the Scholastic Aptitude
Test (SAT) taken by high school seniors between 1915 and 1986. Itspurpose was to study trends in the numbers, test scores, and othercharacteristics of examinees planning to major in mathematics,science, and engineering, and to compare these data with comparabledata from examinees planning to major in other areas. The majorfindings included: (1) the number of examinees planning to major inmathematics, science, and engineering increased until 1983 and hassince declined; (2) examinees planning to major in mathematics,science, and engineering in 1986 obtained SAT Verbal scores averaging19 points higher than the average for all examinees, although themeans varied greatly depending upon the specific major field choice;(3) the average SAT Mathematics scores of examinees planning to majorin mathematics, science, and engineering in 1986 were 38 pointshigher than the average for all test takers; (4) examinees intendingto study pre-medicine, classics, comparative literature, philosophy,classical languages, Chinese, Latin, Russian, education of the giftedand talented, and mathematics education had higher means than thoseinterested in mathematics, science, and engineering; (5) the Verbaland Mathematics scores of examinees interested in computer sciencehave declined 26 and 40 points respectively in the last ten years;(6) there are still more males than females interested inmathematics, science, and engineering; (7) women planning to major inelectrical, mechanical, and civil engineering have higher average SATMathematics scores than the men interested in these fields; and (8)mean SAT Mathematics scores of blacks planning to major inmathematics, science, and engineering have risen considerably overthe past decade, especially among those planning to major inmathematics or statistics. (TW)

00
1.-ri
RESEARCH R
EP0RT
RR-87-49
TEN-YEAR TRENDS IN SAT SCORES AND OTHERCHARACTERISTICS OF HIGH SCHOOL SENIORS TAKING
THE SAT AND PLANNING TO STUDY MATHEMATICS,SCIENCE, OR ENGINEERING
Ui BEST COPY AVAILABLEul
Jeri lee Grandy
"PERMISSION TO REPRODUCE THISMATERIAL HAS BEEN GRANTED BY
.r5
TO THE EDUCATIONAL RESOURCESINFORMATION CENTER (ERIC)"
Educational Tasting ServicePrinceton, New Jersey
October 1987
2
U S DEPARTMENTOF EDUCATIONOffice of Educational
Research and ImprovementEDUCATIONAL RESOURCES
INFORMATIONCENTER (ERIC)
Xinis document has been reproduced asreceived from the person or organizationoriginating itO Miner changes have
been made to improvereproduction quality
Points 01 view or opnronsstated in this docu-ment do not necessarily represent otlichaiOERI position or policy
TenYear Trends in SAT Scores and Other Characteristicsof High School Seniors Taking the SAT and
Planning to Study Mathematics, Science, or Engineering
Jerilee GrandyEducational Testing Service
October 1987
The research reported herein was funded by .:he National ScienceFoundation. Points of view or opinions stated do not necessarily representofficial opinions or policies of the National Science Foundation.
Copyright © 1987 by Educational Testing Service

CONTENTS
Page
SUMMARY 1
BACKGROUND 2
PURPOSE 2
METHOD 3
Major Field Definitions 3
Variables Analyzed 6
RESULTS 7
Results Based on All Examinees 7
Numbers selecting math, science, and engineering 7
Test scores of examinees planning to major inmath, science, and engineering 9
Other characteristics of examinees planning to majorin math, science, and engineering 14
Comparisons with examinees planning to major in.on science fields 15
Results for Subgroups 17
REFERENCES 27
TABLES 28
APPENDICES 185
4
SUMMARY
This study analyzed data from the Scholastic Aptitude Test (SAT) takenby high school seniors between 1975 and 1986. Its purpose was to studytrends in the numbers, test scores, and other characteristics of examineesplanning to major in math, science, and engineering, and to compare thesedata with comparable data from examinees planning to major in other areas.
The major findings were as follows:
1. The number of examinees planning to major in math, science, andengineering increased until 1982, and has since declined. Aerospace andelectrical engineering as well as international relations showed steadilyincreasing interest, while interest in majoring in computer science de-clined 49 percent in the past three years.
2. Examinees planning to major in math, science, and engineering in1986 obtained SAT Verbal scores averaging 19 points higher than the averagefor all examinees, although the means varied greatly depending upon thespecific major field choice.
3. The average SAT Mathematics scores of examinees planning to majorin math, science, and engineering in 1986 were 38 points higher than theaverage for all test takers. There is considerable variation in the mathaptitudes of examinees planning to study math, science, and engineering.The highest means have been obtained consistently by those planning tomajor in physics. Those planning to major in agriculture, child psycholo-gy, general psychology, social psychology, sociology, law enforcement, andmiscellaneous social sciences all have had averages consistently below thenean for all examinees.
4. Examinees intending to study pre-medicine, classics, comparativeliterature, philosophy, classical languages, Chinese, Latin, Russian, edu-cation of the gifted and talented, and mathematics education had highermeans than those interested in math, science, and engineering.
5. The Verbal and Math scores of examinees interested in computerscience have declined 26 and 40 points respectively in the last ten years.
6. There are still more males than females interested in math, sci-ence, and engineering, and the women do not seem to be catching up with themen in terms of majoring in these fields.
7. Women planning to major in electrical, mechanical, and civil engi-neering have higher average SAT Math scores than the men interested inthese fields.
8. Mean SAT Math scores of blacks planning to major in math, science,and engineering have risen considerably over the past decade, especiallyamong those planning to major in mathematics or statistics.
1

BACKGROUND
High school seniors who take the Scholastic Aptitude Test (SAT) com-
pose a large population, many of whom become college freshmen shortly
thereafter. While not all college students have taken the SAT and not all
SAT takers become college students, there is sufficient overlap between SAT
examinees and the college-going population to warrant serious study of the
approximately one million high school seniors who take the SAT each year.
One advantage to studying the population of SAT examinees is that
about 90 percent complete a background questionnaire entitled the Student
Descriptive Questionnaire (SDQ) in which they specif, the major field in
which they intend to major. This information enables the researcher to
follow trends in numbers of students planning to major in specific fields
as well as trends in their test scores and other background data.
While there is no guarantee that examinees will actually major in the
fields they specify, the choices they make when they take the SAT provide
an indication of their interests at that time and reflect the decisions
they have made thus far regarding their educational futures.
PURPOSE
The purpose of the present study was to answer the following kinds of
questions:
1. How have examinees' interests in majoring in math, science, and
engineering changed over the past ten years?
2. Which areas of math, science, and engineering have increased in
popularity and which have deLianed?
3. How have test scores and other characteristics of examinees plan-
ning to major in math, science, and engineering changed over the past
2
6

decade?
4. How do examinees planning to major in math, science, and en-
gineering compare with examinees planning to major in various other fields?
5. How do males and females differ in their interest in majoring in
math, science, arid engineering, and have these differences changed over the
past decade?
6. How do males and females planning to major in math, science, and
engineering differ in their test scores and other characteristics, and have
these differences changed over the past decade?
7. How have blacks changed over the past decade in their interest iL
majoring in math, science, and engineering and in their test scores and
background characteristics?
METHOD
The analyses included data on all high school seniors who took the SAT
from 1975 to 1986, excluding 1976.
Major Field Definitions
When examinees register to take the SAT, 90 percent of them fill out
the SDQ which asks, among ocher things, in what field they intend to major.
In 1976 and again in 1986, the College Board revised the SDQ and changed
many of the major fields. An unsuccessful attempt in 1976 to translate the
major field codes so that those prior to that year would be comparable to
those in subsequent years resulted in the major field odes for 1976 being
deleted from the files. By 1977, a reasonable translation was made, but it
is still clear that between 1975 and 1977, the definitions of many major
fields changed enough to make trend analyses based on those fields meaning-
less. In 1986, the College Board again revised the major fields, adding
many new ones and rewording old ones. Appendices A and B show the two
3 7

versions of the SDQ, one for 1977 to 1985, and the other for 1986. The
major field codes are listed at the end of each SDQ. A major task in this
project was to make the two versions of major field categories comparable
and to map them on to the fields recognized by the National Science Founda-
tion (NSF).
The major fields defining math, science, and engineering for this
study were consistent with those published by NSF (1983) in their Survey of
Graduate Science and Engineering Students and Postdoctorates. The analyses
broke down math, science, and engineering into ten different fields, with
some of these being further divided into more detailed subfields as
follows:
1. Mathematics and Statistics
2. Computer Science
3. Physical Sciences
a. Astronomyb. Chemistryc. Physics
4. Architecture and Environmental Engineering
5. Engineering
a. Aerospace Engineeringb. Electrical Engineeringc. Chemical Engineeringd. Me:hanical Engineeringe. Civil Engineeringf. Other Engineering
6. Life Sciences
a. Agricultureb. Biological Sciences
7. Earth and Environmental Sciences
8. Psychology
a. Child Psychologyb. General Psychologyc. Social Psychology
84
9. Social Sciences
a. Economicsb. International Relationsc. Law Enforcementd. Political Sciencee. Sociologyf. Other Social Sciences
10. Interdisciplinary and Other Sciences
The non-science categories consisted generally of major fields
attracting more than 3,000 examinees. Very small fields, such as philoso-
phy, were grouped with similar small fields composing larger categories,
such as "humanities." This study used the following non-science
categories:
1. Pre-medicine2. Other health fields3. Prelaw4. Humanities5. History and culture6. Foreign languages7. Studio and perfuming arts8. Cominun ications
9. Business10. Education11. Vocational Fields12. Other/missing/undecided
The reader may wish to combine the data for foreign languages with
humanities and possibly the data from history and culture as well. It was
not practical to break down each category into all of its constituents,
even though the results might have been of interest to specialists in those
areas.
The last category contained primarily those who did not respond to the
question on major field preference and those who marked "undecided." There
were a minute number of "other" major fields not included in the first
eleven categories.
Appendix C defines the correspondence between major fields listed in
5

the SDQ and the major field categories as they appear in the tables for
math, science, and engineering. Appendix D shows the correspondence for
non-science major fields.
Variables Analyzed
This study reports trends from 1975 to 1986 in seven different vari-
ables as well as standard deviations for SAT scores. The variables are as
follows:
1. Number selecting each major field;2. Percentage selecting each major field;3. Mean and standard deviation of SAT Verbal score;4. Mean and standard deviation SAT Mathematics score;5. Mean self-reported high school grade in mathematics;6. Mean self-reported rank in high school class;7. Percentage who intend eventually to receive a graduate degree.
Analyses included trends in all of these variables for white males,
white females, black males, black females, "other" students, and all exami-
nees combined. Analyses of the smaller ethnic groups would have produced
unstable results because the numbers were so small. The "other" group
simply contained all examinees who answered the major field question but
were either members of a smaller ethnic group or did not respond to the
ethnic identity question. As a group, their data are not especially
meaningful, but they are included so that the totals for all examinees "add
up."
In summary, the reader should note the following limitations in the
data:
1. 1:1kta were not available for 1976.
2. Data for 1975 were not always comparable to subsequent data
because of difficulties in translating major field categories.
3. Data for 1986 were not always comparable to previous data because
6 t0
6111W=MMINIPI.,..
of redefinitions of major field categories.
4. The designation "other students" refers to all students who either
omitted the questions on sex or race, or those who were not white or black.
5. The grade in math was not available for 1986.
RESULTS
The Tables section of this report contains the details of all
findings. Because some of the data for 1975 may not be comparable to
subsequent data, and because data for 1976 are not available, the discus-
sion below will focus on trends over the past decade: from 1977 to 1986.
Results based on all examinees
Numbers selecting math, science, and engineering
The number and percentage of examinees planning to major in math,
science, and engineering was lowest in 1977; it then rose to a maximum in
1983 and has since declined to what it was in 1981. The individual areas
dominating that pattern were computer science and engineering. Other areas
showed a rise followed by a decline, but the peak occurred earlier. These
fields were physical sciences, architecture and environmental design, and
earth and environmental sciences. Math/statistics and life sciences
steadily declined, though the life sciences rose slightly in 1986. The
trends for psychology and the social sciences were not clear.
Examining the individual science fields in closer detail, we find that
among the physical sciences, chemistry attracted over 4,700 examinees in
1978, but the numbers decreased to Just under 3,600 by 1986. Physics a.id
astronomy both peaked in 1980 and declined thereafter. The apparent rise
in astronomy and decline in physics in 1986 may be attributed to examinees
who indicated that they were planning to major in astrophysics, which this
study grouped with astronomy. Prior to 1986, astrophysics was not an
option on the SDQ, and apparently most examinee: regarded it as physics.
Among the engineering fields, aerospace and electrical have both shown
fairly steady increases in selection as major fields. Chemical, mechani-
cal, civil, and "other" engineering fields all showed increases followed by
declines. In 1986, computer engineering was added as a new field on the
SDQ, and this study included it under "other" engineering. A slight de-
cline in the number selecting electrical engineering in 1986 may be attri-
buted to these examinees.
It is worthwhile to make a special note about examinees interested in
computer science. Regardless of where prospective computer scientists and
engineers identify themselves--whether in computer science, computer
engineering, electrical engineering, or mathematics--their numbers have
decreased considerably over the past few years. The greatest decrease was
in the category labeled "computer science," which declined 49 percent in
only three years. E7 ctrical engineering rose until 1985 and then dropped
only slightly. "Other" engineering showed a decline from !982 to 1985,
then an increase in 1986, but because of the redesign of the SDQ, it is
unknown how much of the increase can be accounted for by those interested
in computers. The actual figure for 1986 was 6,296 examinees selecting
computer engineering. We cannot know how many examinees, prior to 1986,
marked "other" engineering when they had computer engineering in mind.
Within the life sciences, there was a 44 percent decrease in interest
in majoring in agriculture over the last decade. Interest in the biologi-
cal sciences declined by about 10 percent.
While it appears that there may have been an overall increase in
interest in psychology, the trend was quite erratic with social and child
psychology ending rather low in 10186, and general psychology (which in-
cludes experimental and clinical in very small numbers) ending higher than
128

in the past.
Interest in majoring in international relations increased steadily,
with numbers almost tripling over the past decade. No other major field
area within the sciences or engineering showed such an unequivocal rise.
The remaining social sciences showed an erratic trend. The numbers
interested in majoring in economics rose until 1981, declined until 1983,
and then rose again. Interest in law enforcement decreased to a minimum in
1982 then more than doubled by 1986.
sociology showed any particular pattern.
Test scores of examinees planning to m
engineering.
Th3 mean SAT Verbal scores of
students declined until 1983, rose
declined by one point in 1936. Many
Neither political science nor
a.or in math, science, and
all math, science, and engineering
slightly in the next two years, and
individual fields showed increases in
1986, namely, math/statistics, all of the physical sciences, mechanical
engineering, earth and environmental sciences, child psychology, social
psychology, economics, international relations, political science, and the
interdisciplinary and "other" sciences. The scores declined steadily,
however, for those planning to major in computer science.
The 1986 Verbal score average for all examinees planning to major in
math, science, and engineering was 450. Among all examinees who took the
SAT that year, the mean was only 431. Thus, examinees planning to major in
math, science, and engineering obtained average Verbal scores 19 points
higher than the average for all examinees. That year, the range in the
means among examinees planning to major in different areas of math,
science, and engineering was 177 points, which is about one and one half
standard deviations. This suggests that the population who plan to study
, 9
13

math, science, and engineering are quite heterogeneous with respect to
verbal ability. Those planning to major in law enforcement obtained the
lowest mean score, namely, 381; those interested in physics obtained the
highest mean, namely, 558.
The trends in SAT Math scores are very similar to the trends in Verbal
scores. The dec3ine in Math scores ended in 1979, and scores began rising
by 1982. For examinees planning to major in math, science, and engi-
neering, the average score reached a low of 507 then rose to 514 by 1985.
In 1986, the average was 513.
The means varied considerably among the specific science areas,
ranging from only 408 for law enforcement to 641 for physics in 1986. In
fact, the highest Math scores have always been obtained by those planning
to major in physics. The lowest scores have been earned by those planning
to study law enforcement; second lowest have been child psychology and
sociology. It is not surprising that the science fields demanding the
greatest quantitative skills attract examinees with the highest Math
scores, so it is important to realize that not all students interested in
the sciences are mathematically inclined. The population planning to study
math, science, and engineering is heterogeneous with respect to mathemati-
cal as well as verbal aptitude.
Figure 1 shows trends in SAT Math score averages over the past decade
for examinees planning to major in the four most quantitative areas:
physical sciences, mathematics and statistics, engineering, and computer
science. The lowest curve shows the trend for all SAT-takers.
1410

a)L00
(1)
.c
a ssoMI<(./)
31
Caa)
M
Mean SAT Math Scores By Intended Major Field(Most Quantitative Sciences)
1977 tina tan isaa 1951 1952
Test Year
1153 1956
klath/Stal
--- Convegtar Sd.
. Fitsysloi 9:1
....--- En9beceing
AI Testto:tars
Figure 1
Among all test takers, SAT Math scores reached a low in 1981, when
their mean was 466. It has since risen to 475, an increase of 9 points in
five years. Among examinees planning to major in math, science, and engi
neering, the increase was only 6 points. But among those intending to
major in physical sciences, math and statistic, and engineering, the in
crease has been far greater. For those interested in physical sciences,
scores rose 18 points in five years; for math and statistics, scores rose
24 points in only four years; and for engineering, scores rose 16 points in
five years.
ii 15
,..

What seem out of line are the scores and the trend line for examinees
interested in majoring in computer science. Over the past ten years, the
scores of examinees planning to study computer science have declined 40
points. Before computer science existed as a field of study, most students
interested in computers generally majored in math or in electrical engi-
neering. Some still do. But now that computer science exists as in inde-
pendent field, those selecting it appear to have much lower academic skills
than those selecting math or engineering. Just for comparison, it is worth
noting that in 1986, examinees planning to study computer science, computer
engineering, electrical engineering, and mathematics scored averages of
489, 538, 543, and 593 respectively on SAT Math. The rank orderings were
the same for their Verbal scores, which were 413, 432, 436, and 469 respec-
tively. Considering also that the Math scores of examinees interested in
electrical engineering increased 19 points in the past six years, the
scores of those interested in mathematics rose 24 points in the last four
years, and the scores of those interested in computer science declined, it
appears that those attracted to computer science constitute a population a
very different from the other two.
If we look at the trends for examinees planning to major in the less
quantitative sciences, we find that their SAT Math scores have followed
curves very similar to the trend for all test-takers (Figure 2).
/.6
12

6C0
Mean SAT Math Scores By Intended Major Field(Less Quantitative Sciences)
590-
An:h./Erre-Eng.
570-Ufa Selena'5e3-
550-Eorth/Enr.ScL
540-0
530V)
520Social Sal..0
46 510Teat takera5CO ----.I 490
400-.-
5 470-r0)2 460
ago .mm..450am...
44043°425
410
4001977 1978 1979 1980 1931 1982 1963 1984 1935 1965
Test Year
Figure 2
Notice that the Math scores for examinees planning to major in psy-
chology and in social sciences have been consistently lower than the scores
fc- test takers as a whole. If we look at the specific major fields within
these areas, we see that examinees planning to study quite a few science
fields have scored below the national average in SAT Math. Those planning
to major in agriculture, child psychology, general psychology, social
psychology, sociology, law enforcement, and "other" social sciences all
have had Math averages consistently below the mean for all test takers.
13
17

Other characteristics of examinees planning to major in math, science
and engineering
This study also analyzed the examinee's self-reported grade average in
mathematics, rank in class, and educational aspirations. These were fairly
consistent with patterns in test scores.
The mathematics grade averages were not recorded for 1986, and trends
are difficult to interpret because of grade inflation and deflation.
Overall, there was very little change in the average for all examinees
planning to major in math, science, and engineering, but those planning to
enter specific fields did show some patterns. The averages among those
interested in computer science paralleled their test scores; between 1977
and 1985, their math grade averages dropped from 3.25 to 3.04. The grade
averages, as well as the SAT Math scores, were highest for examinees plan-
ning to enter the most quar.titative sciences--math, physics, chemical
engineering and they were lowest for those entering the least quantitative
fields law enforcement, psychology, sociology, agriculture.
The mean rank in class gives a different perpective on achievement,
presumably integrating both tilt.. verbal and quantitative components of
learning. Furthermore, it is a measure that is not affected by grade
inflation. Among all examinees planning to major in math, science, and
engineering, the mean rank in class remained remarkably unchanged at about
the 75th percentile over the past decade. The highest ranks were main-
tained among those interested in the physical sciences, especially physics,
chemical engineering, mathematics, economics, and international relations.
These were all fields attracting examinees with high grades and test scores
as well.
Of those examinees planning to major in math, science, and engi-
neering, 60 to 63 percent each year over the past decade have indicated
14 18

--...1^/9.IMIIII,
that they intend to obtain more than a bachelor's degree. Among the spe-
cific fields of interest, those attracting examinees with the highest
aspirations tended to be the same fields that attracted examinees with the
highest test scores and grades. In 1986, 89 percent of the prospective
physics majors intended to obtain a graduate degree. On the other hand,
only 33 percent of those entering law enforcement and only 31 percent of
those interested in agriculture planned to attend graduate school.
It is again worthwhile to note that examinees interested in computer
science generally do not intend to go to graduate school. In 1986, 46
percent indicated that they planned to obtain a graduate degree compared
with 65 percent of those studying math and statistics and 57 percent of
those planning to major in electrical engineering.
Comparisons with examinees planning to major in non-science fields
The analyses discussed above indicated that the percentage of SAT
examinees planning to major in math, science, and engineering was highest
in 1983. At that time slightly more than 31.2 percent expressed an inter-
est in math, science, and engineering; since that time the figure has
dropped to 28.5 percent. Among the non-science fields there has been a
considerable increase in interest in majoring in business, where the fig-
ures have risen from 11 percent in 1977 to 20 percent in 1986. Other
fields, such as communications, have also increased in popularity, but
their numbers are too small to have any noticeable affect on the population
as a whole. Some other fields have shown a recent relative decline in
interest, including pre-medicine and other health fields, pre-law, humani-
ties, history, and vocational fields.
It is perhaps unexpected that the SAT Verbal scores of prospective
math, science, and engineering students should be higher than the average
154i9
for test-takers as a whole, but this is the case. As we noted earlier, the
mean Verbal score for all SAT examinees in 1986 was 431; for those planning
to major in math, science, and engineering, the mean was 450. The averages
for examinees planning to stud} math, physical sciences, aerospace or
chemical engineering, biological sciences, earth and environmental scien-
ces, economics, political science, or interdisciplinary sciences were all
above the national average on the SAT Verbal test.
On the SAT Math test, the mean in 1986 for math, science, and engi-
neering was 513. The average for examinees overall was 475. There were a
number of areas outside of the sciences, however, that attracted examinees
with high math aptitude. Specifically, those areas with means of 530 or
higher were pre-medicine (539), classics (530), comparative literature
(555), philosophy (559), classical languages (557), Chinese (546), Latin
(542), Russian (554), education of the gifted and talented (536), and
mathematics education (533).
Grades in math, as we might expect, were also higher among examinees
planning to major in math, science, and engineering. In 1986, the average
overall self-reported math grade was 2.85 (on a 4-point scale), while the
average for examinees planning to major in math, science, and engineering
was 3.02. Among the broad categories of non-sciences defined for this
study, pre-medicine showed a math grade average of 3.26. All other fields
studied were lower, but there may have been specific majors within the
broader fields that showed higher grades. These were not analyzed. Self-
reported mean rank in class was slightly lower than average for examinees
planning to major in math, science, and engineering, but the differences
were probably not large enough to be meaningful.
A greater than average percentage of examinees planning to study math,
16 20

science, and engineering intend to obtain a graduate degree. Overall, in
1986, 55 percent of all examinees plan to receive a graduate degree; this
compared with 63 percent of those planning to study math, science, and
engineering. Among the non-sciences, the majority who planned to major in
arts, communications, business, educaticn, or vocational fields did not
plan to do graduate work. On the other hand, 98 percent of those planning
to be pre-med students planned to go to medical school, and 85 percent of
the examinees headed for pre-law intended to go beyond their bachelor's
degree. Over 60 percent planning to study humanities, languages, and
history indicated that they planned to continue to graduate school, and
over 59 percent of those interested in other health fields also anticipated
doing graduate study.
Results for subgroups
All of the analyses reported thus fat were conducted separately for
white males, white females, black males, and black females. Because of the
extensive quantity of information that might be compared and the limited
extent of this report, only the major findings will be summarized here.
Details can be deduced from the tables.
We noted earlier an increasing trend in the number (and percentage) of
examinees planning to major in math, science, and engineering until about
1983, when the numbers began to decline. This same pattern occurred for
every race/sex group, though the number of black females increased again
slightly in 1986. Figure 3 below compares these trends for the four groups
studied.
17 21

1111.1111M11.."
Percent of SAT ExamineesPlonning to Major in
Moth, Science or Engineering
Cl)to-
Oa)
.c
a
X30"'I< 25-
0 2°-
4E'
eU14-
0_ 10
s -
01977 1978 1979 1950 1981 igai 1963 1964 1985 1986
Test Year
White Males
Block Moles
White Females
Black Females
Figure 3
We can see from the graph that among whites in particular, the women
do not seem to be "catching up" with the men in terms of their interest in
majoring in math, science, and engineering. Mite males are still the
group most attracted to the sciences; white females are the least. Gender
differences are large, but not quite so large, among the blacks.
Among whites planning to major in math, science, and engineering, the
trends in Sia Verbal scores between 1977 and 1986 were different for males
and females. The scores for white males dropped 5 points (1977-80) then
rose 11 points to a maximum in 1986. The scores foi. white women dropped 12
points (1977-83) and increased only 5 points by 1985. Prior to 1984, the
18
22

women planning to major in math, science, and engineering have obtained
higher Verbal scores than the men. Since /984, the men's scores have been
slightly higher.
Among whites planning to major in math, science, and engineering,
there has been over the past ten years between 38 and 50 points difference
in the SAT Math scores of males and females. The greatest difference (50
points) was in 1986; the least was in 1984. Perhaps most noticeable is the
rise in Math scores for men since 1981--an increase of 10 points. For
women. there was a 9-point increase from 1979 to 1985, followed by a 5-
point decline in the past year. These trends are evident in Figure 4
below.
Mean SAT Math Scores of WhitesPlanning to Major in
Math, Science or Engineering
1977 1970 1979 1900 tam
Test Year1943 1904 1965 1956
---- Males
--- Females
Figure 4
19 23
reiimmar

If we examine specific areas of math, science, and engineering, how-
ever, we find that among examinees planning to major in some fields, the
women's Math scores have been consistently higher than the men's. These
fields include architecture/environmental design and engineering. Among
the specific engineering fields, men have scored higher than women planning
to study aerospace and chemical engineering, but the women intending to
major in electrical, mechanical, civil, and "other" (i.e., smaller) engi-
neering fields have scored higher than the men planning to major in those
fields.
The gender differences noted among whites are very similar among
blacks. Figure 5 below shows that the women's scores appeared to be rising
until 1986, then then dropped 6 points in just one year.
430,
440
430
0 4200cn
s=mo
5M 403
(I) 390C0
yap-
370
31*
Mean SAT Math Scores of BlacksPlanning to Major in
Math, Science or Engineering
977 978 979 meo 901 9n ma mm wee mmTest Year
Males
Females
Figure 5
2420

While they are still a standard deviation lower than the scores for
whites, the mean SAT Math scores of blacks planning to major in math,
science, and engineering have risen considerably over the past decade.
Between 1977 and 1986, the means for black males rose steadily from 400 to
417; for black females, the means increased from 367 to 388 in 1985, then
dropped to 382 in 1986. The greatest increases occurred among blacks
planning to major in mathematics or statistics: the scores of males rose 64
points in only the last four years; the scores of females rose 55 points in
seven years.
While trends in grade average are not very useful, their relative rank
orderings within the same year generally are useful. Comparing males and
females, research generally shows that within the same population, males
tend to obtain higher test scores while females obtain higher grades (Clark
and Grandy, 1984). In fact, when test scores are held constant, women's
grades are higher than men's, whether at the high school or college level.
Conversely, if grades are held constant, men's test scores are higher than
women's. When we analyze the grades and SAT scores of examinees planning
to major in specific fields, however, these patterns do not seem to hold
consistently.
In 1985 (the most recent year for which we have the self-reported
grade in mathematics recorded on the examinee's record), the average of the
women's grades was higher than the average of the men's grades for every
intended field of study within math, science, and engineering. It should
be noted that the average grade for all math, science, and engineering was
slightly higher for men than for women. This is because the proportions of
men and women distribute differently over the science fields, with women
tending towards the less quantitative sciences, such as psychology, and men
21

tending towards engineering. Nevertheless, within each fi'id, such as
electrical engineering, the women report higher math grade averages than
the men.
The higher grade averages are consistent with prior research. But if
we also examine the SAT Math scores of students planning to enter each of
these fields, we find that for some fields, the score averages are also
higher for women. Figure 6 shows the ten-year trends in SATM scores for
white males and females planning to major in engineering. Females have had
consistently higher Math scores, although the two curves appear as if they
may converge by 1987.
Mean SAT Math Scores of WhitesPlanning to Major in Engineering
/ ------- --.00
MO"'
SM..'
50019774
t t I t t t I I t1975 1979 1900 1991 1962 MO MU MW MN
Test Year
Figure 6
2622
Will
rondo.

A similar pattern occurs for blacks (Figure 7). In 1986 the curves
did converge, and the scores of women appear to be dropping. Prior to
1986, however, the women consistently obtained higher SATM score averages
than the men.
Mean SAT Math Scores of BlacksPlanning to Major in Engineering
1977 1978 i979 1950 1481 1982
Test Year1965 1945
Make
Females
Figure 7
One additional variable worth comparing across subgroups is the educa
tional aspirations of math, science, and engineering examinees. Of the
four primary subgroups, the greatest proportion planning graduate study is
among black females. In 1986, 68 percent of the black women reported that
2327

they planned to receive a graduate degree. Among white women, the number
was 66 percent, and among men, the figures were 59 and 55 percent for
whites and blacks respectively.
There were differences, however, in the trends in educational aspira-
tio The trend for white males strongly resembled the trend in SAT
scores, first declining, then rising. The trend for white females was
fairly flat until 1984, then increased from 60 to 66 percent in just three
years. Blacks of both sexes have shown a steady decline since 1977 in the
percent planning to obtain a graduate degree.
One interesting observation is an apparent association between test
scores and educational aspirations. Such an association is not in itself
surprising, i.e., we would expect the more academically able students to
plan to do graduate work. What is interesting is that some fields attract
examinees with higher educational aspirations than other fields, and those
same fields attract examinee_ with high test scores. Consider the mean
test scores and the percentage of examinees planning to obtain a graduate
degree for each major field within math, science, and engineering. In
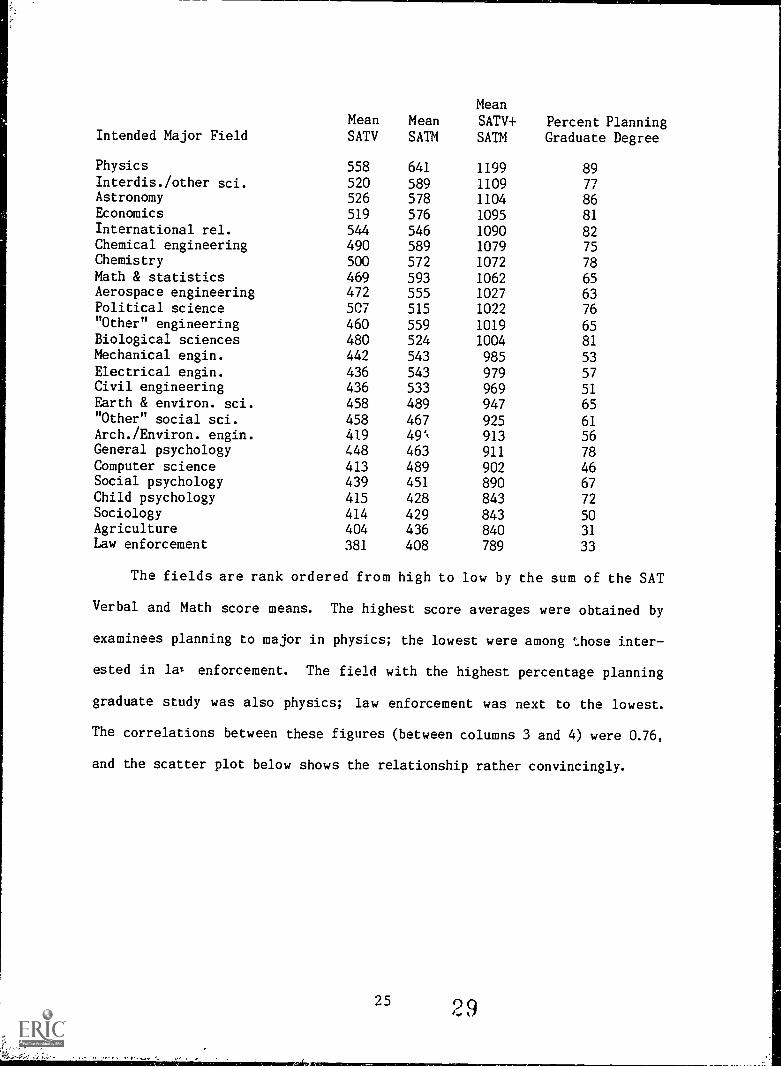
1986, they were as follows:
2824
-1low ..MMIMOIMDMP11.0.
Intended Major FieldMeanSATV
MeanSATM
Mean
SATV+SATM
Percent PlanningGraduate Degree
Physics 558 641 1199 89Interdis./other sci. 520 589 1109 77Astronomy 526 578 1104 86Economics 519 576 1095 81International rel. 544 546 1090 82Chemical engineering 490 589 1079 75Chemistry 500 572 1072 78Math & statistics 469 593 1062 65Aerospace engineering 472 555 1027 63Political science 507 515 1022 76"Other" engineering 460 559 1019 65Biological sciences 480 524 1004 81Mechanical engin. 442 543 985 53Electrical engin. 436 543 979 57Civil engineering 436 533 969 51Earth & environ. sci. 458 489 947 65"Other" social sci. 458 467 925 61Arch./Environ. engin. 419 49', 913 56General psychology 448 463 911 78Computer science 413 489 902 46Social psychology 439 451 890 67Child psychology 415 428 843 72Sociology 414 429 843 50Agriculture 404 436 840 31Law enforcement 381 408 789 33
The fields are rank ordered from high to low by the sum of the SAT
Verbal and Math score means. The highest score averages were obtained by
examinees planning to major in physics; the lowest were among those inter-
ested in lay, enforcement. The field with the highest percentage planning
graduate study was also physics; law enforcement was next to the lowest.
The correlations between these figures (between columns 3 and 4) were 0.76,
and the scatter plot below shows the relationship rather convincingly.
25 29

700
HS SENIOR INTENDED MAJOR FIELD GROUPSED. PLANS VS. SAT SCORES
.o o e
850 1000MEAN SATV + SATM
4.
oo
1150
0
1300
These relationships suggest that the various fields within math,
science, and engineering attract students with different levels of verbal
and mathematical ability, some emphasizing one more than the other. One of
the conclusions implied by these data is that high school seniors do have
some understanding of the relative difficulty of these major fields, and
they have some idea what their test scores will be at the time they answer
the questions regarding major field and educational plats. Otherwise, we
womld not expect to find such consistency amo:ig test scores, grades, educa-
tional plans, and major field choices. Just why these variables change
over time is a subject worthy of discussion, speculation, and further
research.
26 30

REFERENCES
Clark, M. J. and Grandy, J. (1984). Sex differences in the academicperformance of Scholastic Aptitude Test takers. College BoardReport No. 84-8. N.Y.: College Entrance Examination Board.
National Science Foundation (1983). Academic Science/Engineering: GraduateEnrollment and Support, Fall 1983. Surveys of Science ResourcesSeries, Detailed Statistical Tables. Washington, D. C.: NationalScience Foundation.
2731

TABLES
The tables for this report are numbered sequentially according to thevariable analyzed. For each table number there are six letters, A throughF, corresponding to the group analyzed. The letters define the groups asfollows:
A - All ExamineesB - White MalesC - White Females
D - Black MalesE - Black FemalesF - "Other" Examinees
Tables numbered 1 through 17 present statistics for examinees planningto major in math, science, and engineering. Tables numbered 18 through 26present the same statistics for all other examinees and for the total ofall examinees. The variables presented in the tables are as follows:
Examinees planning to major in math, science and engineering
1 - Number of examinees planning to major in math, science, andengineering (summary tables)
2 - Percentage planning to major in math, science, andengineering (summary tables)
3 Number of examinees planning to major in math, science, andengineering (detailed tables)
4 - Mean SAT Verbal Scores (summary tables)5 - Standard deviation of SAT Verbal Scores (summary tables)6 - Mean SAT Verbal Scores (detailed tables)7 Standard deviation of SAT Verbal Scores (detailed tables)8 - Mean SAT Math Scores (summary tables)9 - Standard deviation of SAT Math Scores (summa,-y tables)
10 - Mean SAT Math Scores (detailed tables)11 - Standard deviation of SAT Math Scores (detai'ed tables)12 - Mean grade in math (summary tables)13 - Mean grade in math (detailed tables)14 - Mean rank in class (summary tables)15 - Mean rank in class (detailed tables)16 - Percent who intend to receive a graduate degree (summary
tables)17 - Percent who intend to receive a graduate degree (detailed
tables)
Examinees planning to major in non-science fields
18 - Number planning to major in non-science fields19 - Percent planning to major in non-science fields20 - Mean SAT Verbal scor-21 - Standard deviation of SAT Verbal scores22 - Mean SAT Math scores
23 - Standard deviation of SAT !lath scores24 - Mean grade in math25 - Mean rank in class26 - Percent who intend to receive a graduate degree
28
32

NUMBER OF STUDENTS INTENDING TO MAJOR IN MATH, SCIENCE, AHD ENGINEERING FIELDS
(ALL STUDENTS)
i
INTENDEDTEST YEAR
1
MAJOR FIELD I 1975 1977 1978 1979 1980 1981 1982 1983 1984 1985 1986 1
MAW, & STATISTICS 18674 13139 12515 10977 9985 9601 9274 9006 9589 9739 7647
COMPUTER SCIENCE 9801 12754 17656 23848 29761 40956 56219 71866 69421 50613 36980
PHYSICAL SCIENCES 5709 8673 9222 9362 9424 8946 8581 8030 8222 8536 8062
ARCHITECTURE/ENVIR. ENG. 14866 14008 15289 15753 16878 16456 15329 13044 12734 13551 15592
ENGINEERING 49430 63492 75015 83196 90876 96194 102393 98892 94452 92935 98354
LIFE SCIENCES 73048 38740 38575 36283 33581 32537 30865 28724 28003 27356 30952
EARTH & ENVIRONMENTAL SCI. 8633 12434 12803 12470 10766 10046 9250 7784 6658 6707 8116
PSYCHOLOGY 27902 25329 28848 30037 29852 29122 28867 27493 28499 33707 35175
SOCIAL SCIENCES 35108 46013 46766 43251 38808 36002 33520 31520 32789 34680 41937
INTERDISCIPL./OTHER SCIENCES 12749 4839 5396 5328 4654 4099 3822 3511 3408 3195 2206
TOTAL OF SCIENCE,MATH & ENGINEERING 255920 239421 262085 270505 274585 283959 298120 299870 293775 281019 285021
34
1 - A
NUMBER OF STUDENTS INTENDING TO MAJOR IN MATH, SCIENCE, AND ENGINEERING FIELDS
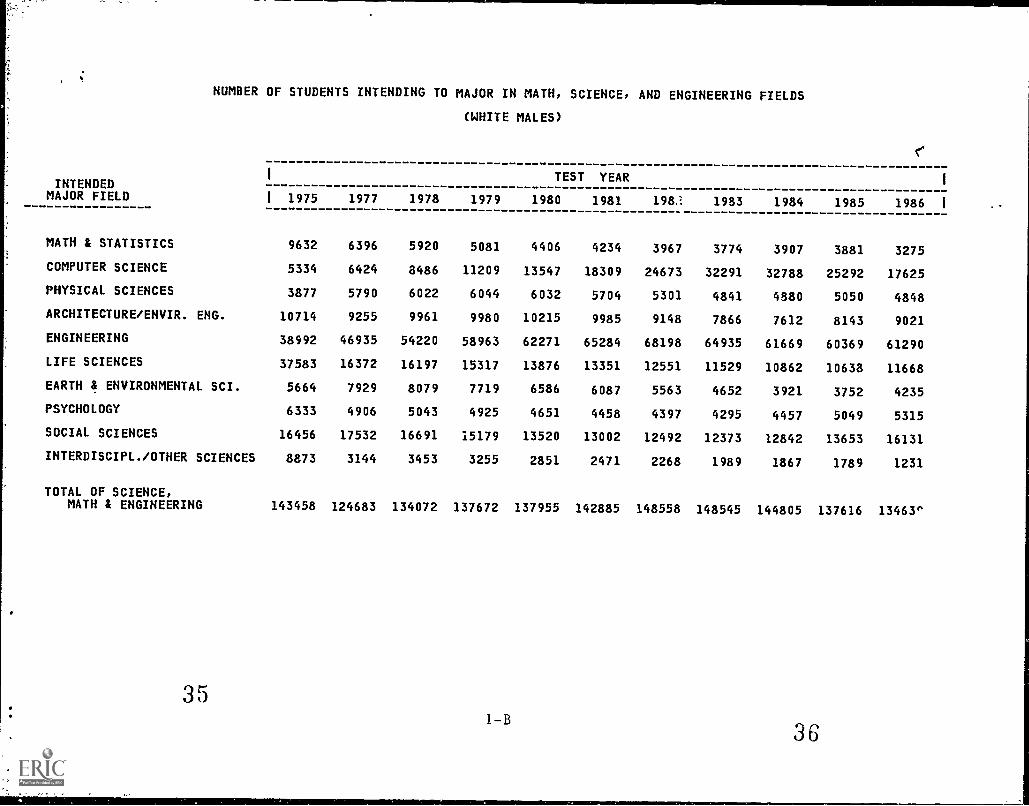
(WHITE MALES)
INTENDEDTEST YEAR
MAJOR FIELD1 1975 1977 1978 1979 1980 1981 198:1 1983 1984 1985 1986
MATH & STATISTICS 9632 6396 5920 5081 4406 4234 3967 3774 3907 3881 3275
COMPUTER SCIENCE 5334 6424 8486 11209 13547 18309 24673 32291 32788 25292 17625
PHYSICAL SCIENCES 3877 5790 6022 6044 6032 5704 5301 4841 4880 5050 4848
ARCHITECTURE/ENVIR. ENG. 10714 9255 9961 9980 10215 9985 9148 7866 7612 8143 9021
ENGINEERING 38992 46935 54220 58963 62271 65284 68198 64935 61669 60369 61290
LIFE SCIENCES 37583 16372 16197 15317 13876 13351 12551 11529 10862 10638 11668
EARTH & ENVIRONMENTAL SCI. 5664 7929 8079 7719 6586 6087 5563 4652 3921 3752 4235
PSYCHOLOGY 6333 4906 5043 4925 4651 4458 4397 4295 4457 5049 5315
SOCIAL SCIENCES 16456 17532 16691 15179 13520 13002 12492 12373 12842 13653 16131
INTERDISCIPL./OTHER SCIENCES 8873 3144 3453 3255 2851 2471 2268 1989 1867 1789 1231
TOTAL OF SCIENCE,MATH & ENGINEERING 143458 124683 134072 137672 137955 142885 148558 148545 144805 137616 13463^
I

NUMBER OF STUDENTS INTENDING TO MAJOR IN MATH, SCIENCE, AND ENGINEERING FIELDS
(WHITE FEMALES)
I TEST YEARINTENDED I
MAJOR FIELD I 1975 L,./ 1978 1979 1980 1981 1982 1983 1984 1985 1986 1
MATH & STATISTICS 6859 5048 4886 4278 4080 3973 3912 3862 4287 4282 3147
COMPUTER SCIENCE 2296 3221 4648 6585 8615 12093 17191 20659 17565 10413 6740
PHYSICAL SCIENCES 1023 1696 1786 1912 1922 1851 1902 1840 1969 2048 1856
ARCHITECTURE/ENVIR. ENG. 1931 2161 2392 2659 3019 2856 2722 2232 2229 2382 2781ENGINEERING 2750 4837 5993 7423 9082 10220 11917 11822 10820 10295 10343
LIFE SCIENCES 27218 17066 16719 15630 14425 14034 13135 12202 11793 11493 12707
EARTH & ENVIRONMENTAL SCI. 2137 3363 3474 3542 3091 2930 2772 2393 2080 2295 3052
PSYCHOLOGY 16535 15198 17729 18915 19118 18965 19106 18360 19110 22807 23291SOCIAL SCIENCES 14158 19856 20565 19569 17527 15947 14641 13341 14092 14815 17532
INTERDISCIPL./OTHER SCIENCES 2694 1113 1287 1418 1240 1088 1060 1010 1075 950 678
TOTAL OF SCIENCE,MATH & ENGINEERING 77601 73559 79479 81931 82119 83957 88358 87721 85020 81780 82127
J 1
1-C

NUMBER OF STUDENTS INTENDING TO MAJOR IN MATH, SCIENCE,
(BLACK MALES)
I TEST YEARINTENDED ,
AND ENGINEERING FIELDS
1
MAJOR FIELDI 1975 1977 1978 1979 1980 1981 1982 1983 1984 1985 1986 1
MATH & STATISTICS 476 320 322 320 266 281 260 239 211 262 168
COMPUTER SCIENCE 612 812 1134 1329 1604 2217 2835 3919 4037 3251 2795
PHYSICAL SCIENCES 160 199 220 223 220 222 198 202 167 208 168
ARCHITECTURE/ENVIR. ENG. 730 730 868 879 985 922 900 763 712 700 764
ENGINEERING 2719 3649 4531 4924 5557 5642 5670 5 88 5242 5122 3692LIFE SCIENCES 1400 817 852 826 770 754 740 630 649 586 667
EARTH & ENVIRONMENTAL SCI. 142 163 213 207 151 130 117 95 79 76 87
PSYCHOLOGY 744 666 668 642 611 506 468 414 422 480 506
SOCIAL SCIENCES 873 1346 1426 1283 1156 1080 963 861 891 872 1207
INTERDISCIPL./OTHER SCIENCES 198 73 93 93 53 74 57 50 42 47 25
TOTAL OF SCIENCE,MATH & ENGINEERING 8054 8775 10327 10726 11373 11828 12208 12661 12452 11604 12079

NUMBER OF STUDENTS INTENDING TO MAJOR IN MATH, SCIENCE, AND ENGINEERING FIELDS
(BLACK FEMALES)
INTENDEDMAJOR FIELD
MATH & STATISTICS
COMPUTER SCIENCE
PHYSICAL SCIENCES
ARCHITECTURE/ENVIR. ENG.
ENGINEERING
LIFE SCIENCES
EARTH & ENVIRONMENTAL SCI.
PSYCHOLOGY
SOCIAL SCIENCES
INTERDISCIPL./OTHER SCIENCES
TOTAL OF SCIENCE,MATH & ENGINEERING
1
1 1975
504
591
82
125
365
1582
44
2173
1214
149
6829
1977
404
750
138
214
750
914
58
2182
2749
57
8216
1978
385
1112
180
269
1010
947
87
2619
3106
76
9791
1979
343
1449
162
302
1289
866
73
2655
2804
49
9992
TEST
1980
321
1896
174
339
1655
915
68
2589
2474
69
10500
YEAR
1981
263
2760
151
339
1791
912
79
2321
2132
51
10799
1982
258
3678
158
323
2074
890
69
2050
1824
51
11375
1983
234
49(i
161
224
1992
848
53
1701
1480
45
11702
1984
268
4890
184
236
1958
945
44
1711
1437
/)
11713
1985
320
3637
165
247
1841
878
47
1972
1542
49
10698
1
1986 1
215
3360
130
261
2306
1134
46
2150
2198
29
11829
1 Lit
1-E
42
: r NUMBER OF STUDENTS INTENDING TO MAJOR IN MATH, SCIENCE, AND ENGINEERING FIELDS
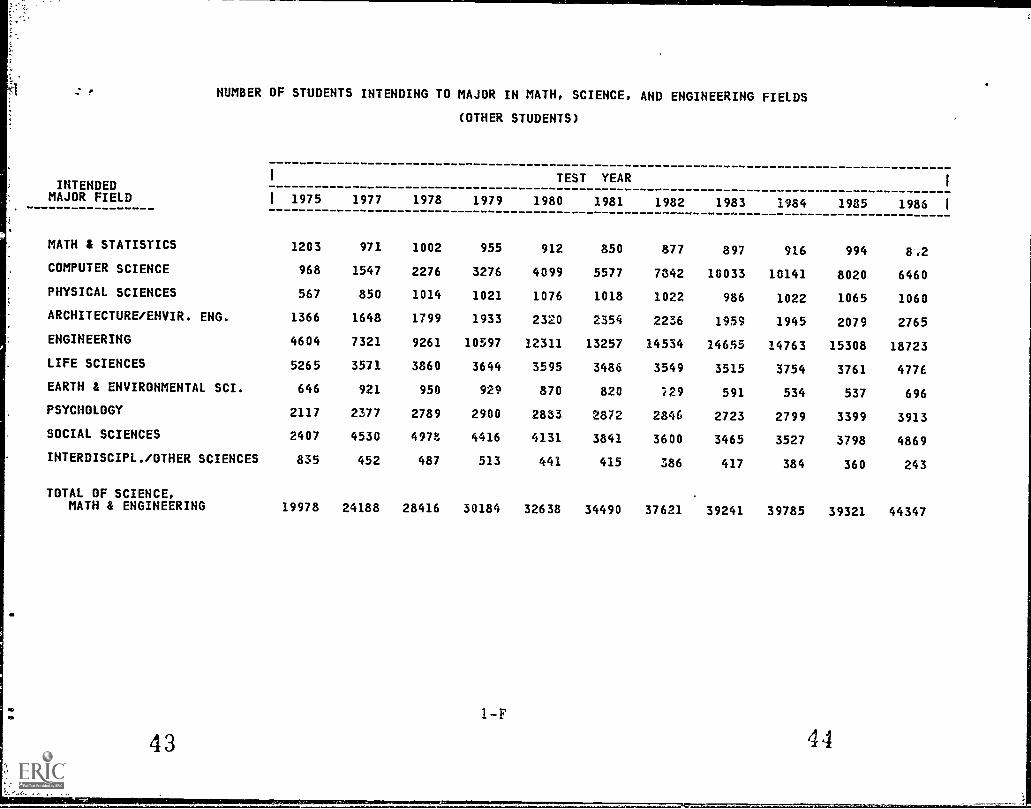
(OTHER STUDENTS)
INTENDEDI TEST YEAR
MAJOR FIELDi 1975 1977 1978 1979 1980 1981 1982 1983 1984 1985 1986
MATH & STATISTICS 1203 971 1002 955 912 850 877 897 916 994 8.2
COMPUTER SCIENCE 968 1547 2276 3276 4099 5577 7842 10033 10141 8020 6460
PHYSICAL SCIENCES 567 850 1014 1021 1076 1018 1022 986 1022 1065 1060
ARCHITECTURE/ENVIR. ENG. 1366 1648 1799 1933 2320 2354 2236 1959 1945 2079 2765
ENGINEERING 4604 7321 9261 10597 12311 13257 14534 14655 14763 15308 18723
LIFE SCIENCES 5265 3571 3860 3644 3595 3486 3549 3515 3754 3761 4776
EARTH & ENVIRONMENTAL SCI. 646 921 950 929 870 820 729 591 534 537 696
PSYCHOLOGY 2117 2377 2789 2900 2833 2872 2846 2723 2799 3399 3913
SOCIAL SCIENCES 2407 4530 4978 4416 4131 3841 3600 3465 3527 3798 4869
IHTERDISCIPL. /OTHER SCIENCES 835 452 487 513 441 415 386 417 384 360 243
TOTAL OF SCIENCE,MATH & ENGINEERING 19978 24188 28416 30184 32638 34490 37621 39241 39785 39321 44347
I

PERCENT OF STUDENTS INTENDING TO MAJOR IN MATH, SCIENCE,
(ALL STUDENTS)
i TEST YEARINTENDED
AND ENGINEERING FIELDS
I
MAJOR FIELD 1 1975 1977 1978 1979 1980 1981 1982 1983 1984 1985 1986 i
MATH 4 STATISTICS 1.86 1.34 1.27 1.11 1.01 0.97 0.94 0.94 0.99 1.00 0.76
COMPUTER SCIENCE 0.98 1.30 1.79 2.41 3.00 4%12 5.69 7.47 7.20 5.18 3.70
PHYSICAL SCIENCES 0.57 0.89 0.93 0.94 0.95 0.90 0.87 0.83 0.85 0.87 0.81
ARCHITECTURE/ENVIR. ENG. 1.48 1.43 1.55 1.59 1.70 1.66 1.55 1.36 1.32 1.39 1.56
ENGINEERING 4.93 6.48 7.59 8.39 9.17 9.68 10.37 10.28 9.79 9.51 9.83
LIFE SCIENCES 7.29 3.96 3.90 3.66 3.39 3.28 3.13 2.99 2.90 2.80 3.09
EARTH & ENVIRONMENTAL SCI. 0.86 1.27 1.29 1.26 1.09 1.01 0.94 0.81 0.69 0.69 0.81
PSYCHOLOGY 2.78 2.59 2.92 3.03 3.01 2.93 2.92 2 86 2.95 3.45 3.51
SOCIAL SCIENCES 3.50 4.70 4.73 4.36 3.92 3.62 3.39 3.28 3.40 3.55 4.19
INTERDISCIPL./OTHER SCIENCES 1.27 0.49 0.55 0.54 0.47 0.41 0.39 0.36 0.35 0.33 0.22
TOTAL OF SCIENCE,MATH & ENGINEERING 25.52 24.45 26.50 27.29 27.71 28.58 30.19 31.16 30.46 28.75 28.48
PERCENTS ARE BASEDON A TOTAL N OF: 1002693 979273 988927 991257 990787 993385 987449 962210 964550 9/357 1000747
4o
2 -A

PERCENT OF STUDENTS INTENDING TO MAJOR IN MATH, SCIENCE, AND ENGINEERING FIELDS
(WHITE MALES)
1 TEST YEARINTENDED
MAJOR FIELD 1
MATH & STATISTICS
COMPUTER SCIENCE
PHYSICAL SCIENCES
ARCHITECTURE/ENVIR. ENG.
ENGINEERING
LIFE SCIENCES
EARTH & ENVIRONMENTAL SCI.
PSYCHOLOGY
SOCIAL SCIENCES
INTERDISCIPL./OTHER SCIENCES
TOTAL OF SCIENCE,MATH & ENGINEERING
PERCENTS ARE BASEDON A TOTAL N OF:
47
1975 1977 1978 1979 1980 1981 1982 1983
2.35 1.67 1.54 1.33 1.17 1.12 1.06 1.04
1.30 1.68 2.21 2.93 3.59 4.85 6.61 8.90
0.94 1.51 1.57 1.58 1.60 1.51 1.42 1.33
2.61 2.41 2.60 2.61 2.71 2.65 2.45 2.17
9.50 12.25 14.15 15.43 16.52 17.31 18.26 17.90
9.16 4.27 4.23 4.01 3.68 3.54 3.36 3.18
1.38 2.07 2.11 2.02 1.75 1.61 1.49 1.28
1.54 1.28 1.32 1.29 1.23 1.18 1.18 1.18
4.01 4.57 4.36 3.97 3.59 3.45 3.35 3.41
2.16 0.82 0.90 0.85 0.76 0.66 0.61 0.55
34.95 32.53 34.99 36.03 36.61 37.88 39.78 40.95
410443 383280 383173 382077 376858 377193 373421 362742
2-B
1984 1985 1986
1.10 1.09 0.89
9.22 7.09 4.81
1.37 1.41 1.32
2.14 2.28 2.46
17.35 16.91 16.72
3.06 2.98 3.18
1.10 1.05 1.16
1.25 1.41 1.45
3.61 3.82 4.40
0.53 0.50 0.34
4 74 38.55 36.73
355433 356971 366553
48
I
1

PERCENT OF STUDENTS INTENDING TO MAJOR IN MATH, SCIENCE, AND ENGINEERING FIELDS
INTENDEDMAJOR FIELD
MATH & STATISTICS
COMPUTER SCIENCE
PHYSICAL SCIENCES
ARCHITECTURE/ENVIR. ENG.
ENGINEERING
LIFE SCIENCES
EARTH & ENVIRONMENTAL SCI.
PSYCHOLOGY
SOCIAL SCIENCES
INTERDISCIPL./OTHER SCIENCES
TOTAL OF SCIENCE,MATH & ENGINEERING.
PERCENTS ARE BASEDON A TOTAL. N OF:
EP
PI v .. 49
1
(WHITE FEMALES)
TEST YEAR
I 1975 1977 1978 1979 1980 1981 1982 1983 1984 1985 1986
1.62 1.24 1.20 1.04 1.00 0.97 0.97 0.99 1.11 1.11 0.79
0.54 0.79 1.14 1.60 2.11 2.96 4.25 5.28 4.55 2.70 1.69
0.24 0.42 0.44 0.47 0.47 0.45 0.47 0.47 0.51 0.53 0.47
0.46 0.53 0.59 0.65 0.74 0.70 0.67 0.57 0.58 0.62 0.70
0.65 1.19 1.47 1.81 2.23 2.50 2.95 3.02 2.80 2.67 2.60
6.45 4.19 4.09 3.81 3.54 3.43 3.25 3.12 3.05 2.98 3.20
0.51 0.83 0.85 0.86 0.76 0.72 0.69 0.61 0.54 0.59 0.77
3.92 3.73 4.34 4.61 4.69 4.63 4.73 4.69 4.95 5.91 5.86
3.35 4.88 5.03 4.77 ,..30 3.90 3.62 3.41 3.65 3.84 4.41
0.64 0.27 0.32 0.35 0.30 0.27 0.26 0.26 0.28 0.25 0.17
18.38 18.08 19.46 19.95 20.16 20.52 21.87 22.40 22.01 21.19 20.65
422126 406957 408455 410630 407369 409193 404065 391595 386280 385930 397684
2-C
1

PERCENT OF STUDENTS INTENDING TO MAJOR IN MATH, SCIENCE, AND ENGINEERING FIELDS
(BLACK MALES)
INTENDED1 TEST YEAR
1
MAJOR FIELD 1 1975 1977 1978 1979 1980 1981 1982 1983 1984 1985 1986 1
MATH & STATISTICS 1.57 1.01 0.97 0.96 0.78 0.84 0.78 0.74 0.67 0.84 0.50
COMPUTER SCIENCE 2.01 2.57 3.43 3.97 4.72 6.62 8.55 12.20 12.75 10.40 8.34
PHYSICAL SCIENCES 0.53 0.63 0.67 0.67 0.65 0.66 0.60 0.63 0.53 0.67 0.50
ARCHITECTURE/ENVIR. ENG. 2.40 2.31 2.62 2.63 2.90 2.75 2.71 2.37 2.25 2.24 2.28
ENGINEERING 8.95 11.55 13.70 14.71 16.34 16.85 17.10 17.08 16.55 16.39 16.98
LIFE SCIENCES 4.61 2.59 2.58 2.47 2.26 2.25 2.23 1.96 2.05 1.88 1.99
EARTH & ENVIRONMENTAL SCI. 0.47 0.52 0.64 0.62 0.44 0.39 0.35 0.30 0.25 0.24 0.26
PSYCHOLOGY 2.45 2.11 2.02 1.92 1.80 1.51 1.41 1.29 1.33 1.54 1.51
SOCIAL SCIENCES 2.87 4.26 4.31 3.83 3.40 3.23 2.90 2.68 2.81 2.79 3.60
INTERDISCIPL./OTHER SCIENCES 0.65 0.23 0.28 0.28 0.16 0.22 0.17 0.16 0.13 0.15 0.07
TOTAL OF SCIENCE,MATH & ENGINEERING 26.50 27.79 31.23 32.05 33.45 35.33 36.81 39.41 39.32 37.13 36.04
PERCENTS Alta BASEDON A TOTAL N OF: 30396 31581 33072 33467 33999 33481 33162 32127 31671 31251 33520

PERCENT OF STUDENTS INTENDING TO MAJOR IN MATH, SCIENCE, AND ENGINEERING FIELDS
INTENDEDMAJOR FIELD
MATH & STATISTICS
COMPUTER SCIENCE
PHYSICAL SCIENCES
ARCHITECTURE/ENVIR. ENG.
ENGINEERING
LIFE SCIENCES
EARTH & ENVIRONMENTAL SCI.
PSYCHOLOGY
SOCIAL SCIENCES
INTERDISCIPL./OTHER SCIENCES
TOTAL OF SCIENCE,MATH & ENGINEERING
PERCENTS ARE BASEDON A TOTAL N OF:
I
(BLACK FEMALES)
TEST YEAR
1 1975 1977 1978 1979 1980 1981 1982 1983 1984 1985
1.13 0.84 0.78 0.69 0.63 0.52 0.52 0.48 0.56 0.67
1.33 1.57 2.25 2.90 3.71 5.47 7.44 10.28 10.23 7.66
0.18 0.29 0.36 0.32 0.34 0.30 0.32 0.33 0.39 0.35
0.28 0.45 0.54 0.60 0.66 0.6, 0.65 0.46 0.49 0.52
0.82 1.57 2.04 2.58 3.24 3.55 4.20 4.12 4.10 3.87
3.55 1.91 1.91 1.73 1.79 1.81 1.80 1.76 1.98 1.85
0.10 0.12 0.18 0.15 0.13 0.16 0.14 0.11 0.09 0.10
4.88 4.56 5.29 5.30 5.06 4.60 4.15 3.52 3.58 4.15
2.73 5.74 6.28 5.60 4.84 4.22 3.69 3.06 3.01 3.25
0.33 0.12 0.15 0.10 0.13 0.10 0.10 0.09 0.08 0.10
15.34 17.15 19.79 19.96 20.54 21.39 23.02 24.23 24.52 22.52
44523 47900 49481 50049 51128 50494 49409 48294 47778 47511
2-E
1986
0.44
6.82
0.26
0.53
4.68
2.30
0.09
4.36
4.46
0.06
24.00
49283
5

PERCENT OF STUDENTS INTENDING TO MAJOR IN MATH, SCIENCE, AND ENGINEERING FIELDS
INTENDEDMAJOR FIELD
MATH & STATISTICS
COMPUTER SCIENCE
PHYSICAL SCIENCES
ARCHITECTURE/ENVIR. ENG.
ENGINEERING
LIFE SCIENCES
EARTH & ENVIRONMENTAL SCI.
PSYCHOLOGY
SOCIAL SCIENCES
INTERDISCIPL./OTHER SCIENCES
TOTAL OF SCIENCE,MATH & ENGINEERING
PERCENTS ARE BASEDON A TOTAL N OF:
I
1 1975
1.26
1.02
0.60
1.43
4.84
5.53
0.68
2.22
2.53
0.88
20.98
95205
1977
0.89
1.41
0.78
1.50
6.68
3.26
0.84
2.17
4.13
0.41
22.08
109555
1978
0.87
1.98
0.88
1.57
8.07
3.36
0.83
2.43
4.34
0.42
24.76
114746
(OTHER STUDENTS)
TEST YEAR
1979 1980 1981 1982 1983 1984 1985 1986
0.83 0.75 0.69 0.69 0.70 0.64 0.64 0.55
2.85 3.38 4.53 6.16 7.87 7.07 5.15 4.20
0.89 0.89 0.83 0.80 0.77 0.71 0.68 0.69
1.68 1.91 1.91 1.76 1.54 1.36 1.34 1.80
9.21 10.14 10.78 11.41 11.50 10.30 9.83 12.18
3.17 2.96 2.83 2.79 2.76 2.62 2.42 3.11
0.81 0.72 0.67 0.57 0.46 0.37 0.34 0.45
2.52 2.37 2.33 2.23 2.14 1.95 2.18 2.55
3.84 3.40 3.12 2.83 2.72 2.46 2.44 3.17
0.45 0.36 0.34 0.30 0.33 0.27 0.23 0.16
26.24 26.88 28.04 29.53 30.79 27.75 25.26 28.85
115034 121433 123024 127392 127452 143388 155694 153707
2 -F 56
I

NUMBER OF STUDENTS INTENDING TO MAJOR IN MATH, SCIENCE, AND ENGINEERING FIELDS(ALL STUDENTS)
INTENDEDMAJOR FIELD
MATH & STATISTICS
COMPUTER SCIENCE
illYSICAL SCIENCES
ASTRONOMYCHEMISTRYPHYSICS
ARCHITECTURE/ENVIR. U'
ENGINEERING
AEROSPACE ENGINEERINGELECTRICAL ENGINEERINGCHEMICAL ENGINEERINGMECHANICAL ENGINEERINGCIVIL ENGINEERINGOTHER ENGINEERING
LIFE SCIENCES
AGRICULTUREBIOLOGICAL SCIENCES
EARTH & ENVIRONMENTAL SCI.
PSYCHOLOGY
CHILD PSYCHOLOGYGENERAL PSYCHOLOGYSOCIAL PSYCHOLOGY
SOCIAL SCIENCES
ECONOMICSINTERNATIONAL RELATIONSLAW ENFORCEMFITPOLITICAL SCIENCESOCIOLOGYOTHER SOCIAL SCIENCES
INTERDISCIPL./OTHER SCIENCES
57TOTAL OF SCIENCE,
MATH & -NGINEERING
1 TEST YEARi
1 1'75 1977 1978 1979 1980 1981 1982 1983 1984 1985 1986 I
18674 13139 12515 10977 9985 9601 9274 9006 9389 9739 7647
9801 12754 17656 23848 29761 40956 56219 71866 69421 50613 36980
887 1040 1151 1313 1402 1251 1399 1223 1039 1066 15972898 4659 4731 4718 4533 4406 4100 3897 4110 4201 35901924 2974 3340 3331 3489 3289 3082 2910 3073 3269 2875
14866 14008 15289 15753 16878 16456 15329 13044 12734 13551 15592
4345 8198 10283 11901 13165 14294 15741 14726 15433 16234 173658787 13792 16079 17337 18837 20019 21408 22718 24204 24281 234612538 4251 4927 5405 6350 7037 806/ 7733 6085 5558 53864247 7049 8654 9658 10430 )1164 11535 10814 9907 9992 96033564 4812 5249 5592 5666 5649 5362 4875 4508 4382 496025949 25390 29823 33303 36428 38031 0286 38026 34315 32488 37579
16016 12211 11527 10589 9887 9406 8401 7317 6219 5579 688957032 26529 27048 25694 23694 23131 22464 21407 21784 21777 24063
8633 12434 12803 12470 10766 10046 9250 7784 6658 6707 8116
4370 5673 7013 7535 7461 7517 7418 6905 7180 8688 688620296 15797 17600 18113 18158 17528 17344 16788 17152 20179 254183236 3859 4235 4389 4233 4077 4105 3800 4167 4840 2871
1208 1529 1725 1860 2042 2091 2029 1860 1977 2004 20081069 1462 1523 1657 1725 2009 2214 2314 3002 3334 3921580 10023 9799 8189 6703 5852 5461 6172 6953 7341 123650 9362 6461 5652 5648 6152 6243 5634 5530 6174 76540 2914 2903 2486 2160 1855 1593 1258 1264 1333 179132251 20723 24355 23407 20530 19043 15980 14282 14063 14494 14198
12749 4839 5396 5328 4654 4099 3822 3511 3408 3195 2206
255920 239421 262085 270505 274585 283959 298120 299870 293775 281019 285021
3-A

IOC
GM
V
NUMBER OF STUDENTS INTENDING TO MAJOR IN MATH, SCIENCE, AND ENGINEERING FIELDS
INTENDEDMAJOR FIELD
MATH & STATISTICS
COMPUTER SCIENCE
PHYSICAL SCIENCES
ASTRONOMYCHEMISTRYPHYSICS
ARCHITECTURE/ENVIR. ENG.
ENGINEERING
AEROSPACE ENGINEERINGELECTRICAL ENGINEERINGCHEMICAL ENGINEERINGMECHANICAL ENGINEERINGCIVIL ENGINEERINGOTHER ENGINEERING
LIFE SCIENCES
AGRICULTUREBIOLOGICAL SCIENCES
EARTH & ENVIRONMENTAL SCI.
PSYCHOLOGY
CHILD PSYCHOLOGYGENERAL PSYCHOLOGYSOCIAL PSYCHOLOGY
SOCIAL SCIENCES
ECONOMICSINTERNATIONAL RELATIONSLAW ENFORCEMENTPOLITICAL SCIENCESOCIOLOGYOTHER SOCIAL SCIENCES
INTERDISCIPL./OTHER SCIENCES
TOTAL OF SCIENCE,MATH & ENGINEERING
59
i
(WHITE MALES)
TEST YEARI
I 1975 1977 1978 1979 1980 1981 1982 1983 1984 1985 1986 1
9632 6396 5920 5081 4406 4234 3967 3774 3907 3881 3275
5334 6424 8486 11209 13547 18309 2'i673 32291 32788 25292 17625
637 742 778 850 926 852 925 823 631 664 10181738 2733 2687 2651 2495 2429 2116 1913 2009 2069 18001502 2315 2557 2543 2611 2423 2260 2105 2240 2317 2030
10714 9255 9961 9980 10215 9985 9148 7866 7612 8143 9021
3399 6385 7747 8798 9595 10346 11585 10788 11134 11730 120226738 10408 11816 12517 13040 13687 14279 14764 15550 15396 140001736 2847 3174 3342 3795 4100 4609 4347 3422 3124 29993397 5513 6720 7386 7827 8355 8384 7947 7164 7175 67352748 3479 3828 3944 3872 3869 3576 3275 2951 2883 3330
20974 18303 20935 22976 24142 24927 25765 23814 21448 20061 22204
9708 5992 5853 5557 5052 4871 4426 3916 3395 3023 357827875 10380 10344 9760 8824 8480 8125 7613 7467 7615 8090
5664 7929 8079 7719 6586 6087 5563 4652 3921 3752 4235
349 416 500 500 475 457 400 426 434 460 2935250 3731 3807 3680 3515 3356 3325 3188 3325 3784 4566734 759 736 745 661 645 672 681 698 805 456
748 859 894 1007 1057 1082 1028 920 1010 1007 1050326 480 485 506 505 620 633 693 880 949 1076147 5708 5517 4671 3791 3320 3266 3722 4210 4467 6202
0 4636 3090 2571 2613 2939 2955 2652 2568 2948 35500 458 439 374 310 281 254 227 189 214 299
15235 5391 6266 6050 5244 4760 4356 4159 3985 4068 3954
8873 3144 3453 3255 2851 2471 2268 1989 1867 1789 1231
143458 124683 134072 137672 07955 142885 148558 148545 144805 137616 134639
3-B
60

NUMBER OF STUDENTS INTENDING TO MAJOR IN MATH, SCIENCE, AND ENGINEERING FIELDS(WHITE FEMALES)
INTENDEDMAJOR FIELD
MATH & STATISTICS
COMPUTER SCIENCE
PHYSICAL SCIENCES
ASTRONOMYCHEMISTRYPHYSICS
ARCHITECTURE/ENVIR. ENG.
ENGINEERING
AEROSPACE ENGINEERINGELECTRICAL ENGINEERINGCHEMICAL ENGINEERINGMECHANICAL ENGINEERINGCIVIL ENGINEERINGOTHER ENGINEERING
LIFE SCIENCES
AGRICULTUREBIOLOGICAL SCIENCES
EARTH & ENVI 1NMENTAL SCI.
PSYCHOLOGY
CHILD PSYCHOLOGYGENERAL PSYCHOLOGYSOCIAL PSYCHOLOGY
SOCIAL SCIENCES
ECONOMICSINTERNATIONAL RELATIONSLAW ENFORCEMENTPOLITICAL SCIENCESOCIOLOGYOTHER SOCIAL SCIENCES
InrDISCIPL./OTHER SCIENCES
TOTAL OF SCIENCE,MATH & ENGINEERING
1
1 1975
6859
2296
142724157
1931
1761653641152381692
511122107
2137
2947117511827
260571298
0
0
13029
2694
77601
1977
5048
3221
1711253272
2161
426357666228380
2780
510211964
3363
384490222332
386748282831591619
11116
1113
73559
1978
4886
4648
2201257309
2372
629427839322372
3404
458112138
3474
4702104312596
454791
265021791610
12881
1287
79479
1979
4278
6585
2681339305
2659
779599991428443
4183
403711593
3542
5165110362714
502866
21931987139712624
1418
81931
TEST
1980
4080
8615
2531317352
3019
933766
12375804725094
381710608
3091
5175112272716
58090517291905122911179
1240
82119
YEAR
1981
3973
12093
2211253377
2856
10369041483614516
5667
361610418
2930
5272110162677
59610251467208811129659
1088
83957
1982
3912
17191
3021281319
2722
1178111217867055286608
312810007
2772
5356110472703
593116812432208928
8501
1060
88358
1983
3862
20659
2291283328
2232
113713711841635455
6383
26689534
2393
5073108082479
568119114151987721
7459
1010
87721
1984
4287
17565
2351361373
2229
123714431360629451
5700
21969597
2080
5326110412743
561161815672026756
7564
1075
85020
1985
4282
10413
2521356440
2382
131913691220644410
5333
20149479
2295
6565131483094
5911877166421578027724
950
81180
1
1986 1
3147
6740
3561124376
2781
151711221163588i37
5516
259510112
3052
5174161841933
48121663442277710317635
678
82127
3-C

NUMBER OF STUDENTS INTENDING TO MAJOR IN MATH, SCIENCE, AND ENGINEERING FIELDSL .
INTENDEDI
(BLACK MALES)
TEST YEARI
MAJOR FIELD I 1975 1977 1978 1979 1980 1981 1982 1983 1984 1985 1,386 I
MATH & STATISTICS 476 320 322 320 266 281 _60 239 211 262 168
COMPUTER SCIENCE 612 812 1134 1329 1104 22i7 2835 3919 4037 3251 2795
PHYSICAL SCIENCES
ASTRONOMY 24 22 28 23 36 38 36 29 28 29 29CHEMISTRY 92 114 129 142 110 118 103 107 95 98 87PHYSICS 44 63 63 58 74 66 59 66 44 31 52
ARCHITECTURE/ENVIR. ENG. 730 730 868 879 985 922 900 763 712 700 764
ENGINEERING
AEROSPACE ENGINEERING 290 440 592 733 789 833 827 744 837 714 786ELECTRICAL ENGINEERING 890 1210 1495 1507 1803 1765 1784 1917 1904 1956 2050CHEMICAL ENGINEERING 125 175 199 210 285 294 323 287 238 204 206MECHANICAL ENGINEERING 284 408 478 596 615 672 707 651 532 560 528CIVIL ENGINEERING 144 253 294 323 316 320 305 260 246 233 248OTHER ENGINEERING 986 1163 1473 1555 1749 1758 1724 1629 1485 1455 1874
LIFE SCIENCES
AGRICULTURE 202 172 186 196 197 163 146 117 108 95 110BIOLOGICAL SCIENCES 1198 645 566 630 573 591 594 513 541 491 557
EARTH & ENVIRONMENTAL SCI. 142 163 213 207 151 130 117 95 79 76 67
PSYCHOLOGY
CHILD PSYCHOLOGY 86 122 139 138 :30 104 84 73 68 79 53GENERAL PSYCHOLOGY 514 433 405 388 369 320 291 267 277 299 412SOCIAL PSYCHOLOGY 144 111 124 116 112 82 93 74 77 102 41
SOCIAL SCIENCES
ECONOMICS 38 63 80 64 58 69 61 47 60 61 68MPINTERNATIONAL RELATIONS 20 17 21 26 27 30 29 39 25 26 33LAW ENFORCEMENT 32 283 287 242 219 207 197 238 279 263 590POLITICAL SCIENCE 0 325 249 265 266 234 227 182 176 194 218SOCIOLOGY 0 137 142 110 83 76 50 48 43 48 63OTHER SOCIAL SCIENCES 783 521 647 576 503 464 399 307 308 280 235
INTERDISCIPL./OTHER SCIENCES 198 73 93 93 53 74 57 50 42 47 25WOO
GO
TOTAL OF SCIENCE,MATH & ENGINEERING 8054 8775 10327 10726 11373 11828 12208 12661 12452 11604 12079
63 3 -ll 64

NUMBER OF STUDENTS INTENDING TO MAJOR IN MATH, SCIENCE, AND ENGINEERING FIELDS(BLACK FEMALES)
INTENDEDMAJOR FIELD
MATH & STATISTICS
COMPUTER SCIENCE
PHYSICAL SCIENCES
ASTRONOMYCHEMISTRYPHYSICS
ARCHITECTURE/ENVIR. ENG.
ENGINEERING
AEROSPACE ENGINEERINGELECTRICAL ENGINEERINGCHEMICAL ENGINEERINGMECHANICAL ENGINEERINGCIVIL ENGINEERINGOTHER ENGINEERING
LIFE SCIENCES
AGRICULTUREBIOLOGICAL SCIENCES
EARTH $ ENVIRONMENTAL SCI.
PSYCHOLOGY
CHILD PSYCHOLOGYGENERAL PSYCHOLOGYSOCIAL PSYCHOLOGY
SOCIAL SCIENCES
ECONOMICSINTERNATIONAL RELATIONSLAW ENFORCEMENTPOLITICAL SCIENCESOCIOLOGYOTHER SOCIAL SCIENCES
INTAIWISCIPL . /OTHER SCIENCES
bTOTAL OF SCIENCE,
MATH & ENGINEERING
1
1 1975
504
591
4708
125
1752562132
187
1061476
44
6121302259
2332580
0
1101
149
6829
1977
404
750
9
11415
214
351221243966
364
89825
58
7911070321
2645
2744084201576
57
8216
1978
385
1112
814923
269
611501606478
497
70877
87
9681301350
4442
3123414021965
76
9791
1979
343
1449
813717
302
8722118468
111618
84782
73
10091272374
4740
261289350
1817
49
9992
TEST
1980
321
1896
1014519
339
10228123594
133810
76839
68
9781252359
5952
255287299
1522
69
10500
YEAR
1981
263
2760
7
12321
339
99330261111120870
70842
79
8951132294
5845
2442792221284
51
10799
1982
258
3678
513122
323
122418287149138960
57833
69
782993275
5069
1712682111055
51
11375
1983
234
4964
613619
224
11740531112692
941
46802
53
612877212
5074
193241117805
45
11702
1984
268
4890
1014628
236
14249825312793
845
57888
44
617853241
3267
204233123778
40
11713
1985
320
3637
314220
247
14148224311870
787
55823
47
707984281
4274
205263134824
49
10698
1986
215
3360
1110415
261
1485582431181081131
831051
46
5581445147
5983
830296206724
29
11829
1

NUMBER OF STUDENTS INtENDING TO MAJOR IN MATH, SCIENCE, AND ENGINEERING FIELDS(OTHER STUDENTS)
INTENDEDI TEST YEAR
I
MAJOR FIELD I 1975 1977 1978 1979 1980 1981 1982 1983 1984 1985 1986 I
MATH 4 STATISTICS 1203 971 1002 955 912 850 877 897 916 994 842
COMPUTER SCIENCE 968 1547 2276 3276 4099 5577 7842 10033 10141 8020 6460
PHYSICAL SCIENCES
ASTRONOMY 80 96 117 164 177 133 131 136 135 118 183CHEMISTRY 274 445 509 449 466 483 469 458 499 536 475PHYSICS 213 309 388 408 433 402 422 392 388 411 402
ARCHITECTBRE/ENVIR. ENG. 1366 1648 1799 1933 2320 2354 2236 1959 1945 2079 2765
ENGINEERING
AEROSPACE ENGINEERING 463 912 1254 1504 1746 1980 2029 1940 2083 2330 2892ELECTRICAL ENGINEERING 942 1695 2191 2493 2947 3333 3815 4261 4809 5078 5731CHEMICAL ENGINEERING 257 439 555 678 798 899 1056 947 812 767 775MECHANICAL ENGINEERING 430 861 1070 1180 1314 1412 1590 1455 1455 1495 1634CIVIL ENGINEERING 402 634 677 771 873 824 815 793 767 786 837OTHER ENGINEERING 2110 278G 3514 3971 4633 4809 5229 5259 4837 4852 6854
LIFE SCIENCES
AGRICULTURE 889 856 837 715 745 686 644 570 463 392 523BIOLOGICAL SCIENCES 4376 2715 3023 2929 2850 2800 2905 2945 3291 3369 4253
EARTH 4 ENVIRONMENTAL SCI. 646 921 950 929 870 820 729 591 534 53i 696
PSYCHOLOGY
CHILD PSYCHOLOGY 376 500 704 723 703 789 796 721 735 877 808GENERAL PSYCHOLOGY 1469 1541 1656 1737 1795 1704 1688 1648 1656 1964 2811SOCIAL PSYCHOLOGY 272 336 429 440 385 379 362 354 408 558 294
SOCIAL SCIENCES
ECONOMICS 139 195 253 240 288 286 297 275 314 303 330INTERNATIONAL RELATIONS 120 172 184 219 236 289 315 317 412 408 563LAW ENFORCEMENT 45 930 1033 822 709 614 584 604 693 742 1301POLITICAL SCIENCE 0 834 602 540 577 612 585 572 527 612 813SOCIOLOGY 0 280 310 255 239 164 150 145 153 135 192U(HER SOCIAL SCIENCES 2103 2119 2596 2340 2082 1876 1669 1552 1428 1598 1650
INTERDISCIFL. /OTHER SCIENCES 835 452 487 513 441 415 386 (.-- 384 360 243
TOTAL OF SCIENCE,MATH & ENGINEERING 19978 24188 28416 30184 32638 34490 37621 392ot 39785 39321 44347
67 3-F 68.

110
MEAN SATV OF STUDENTS INTENDING TO MAJOR IN MATH, SCIENCE, AND ENGINEERING FIELDS
INTENDEDI
(ALL STUDENTS)
TEST YEAR
MAJOR FIELDI 1975 1977 1978 1979 1980 1981 1982 1983 1984
MATH I STATISTICS 465 464 464 459 455 456 455 452 457
COMPUTER SCIENCE 439 439 436 432 429 427 426 422 420
PHYSICAL SCIENCES 520 518 517 516 513 515 514 513 514
ARCHITECTURE/ENVIR. ENG. 432 424 423 418 415 414 413 412 415
ENGINEERING 453 451 450 448 446 448 451 450 455
LIFE SCIENCES 468 461 460 457 453 455 456 457 462
EARTH & ENVIRONMENTAL SCI. 464 457 456 453 451 451 449 451 454
PSYCHOLOGY 451 444 439 435 434 433 435 437 436
SOCIAL SCIENCES 476 449 443 443 445 446 453 454 457
INTERDIa,CIPL./OTHER SCIENCES 499 515 512 509 506 510 507 503 509
TOTAL OF SCIENCE,MATH & ENGINEERING 464 454 451 448 4,s 446 446 444 446
4-A
1
1985 1986 1
459 469
423 413
521 526
420 419
456 455
467 464
457 458
440 441
462 453
507 520
451 450
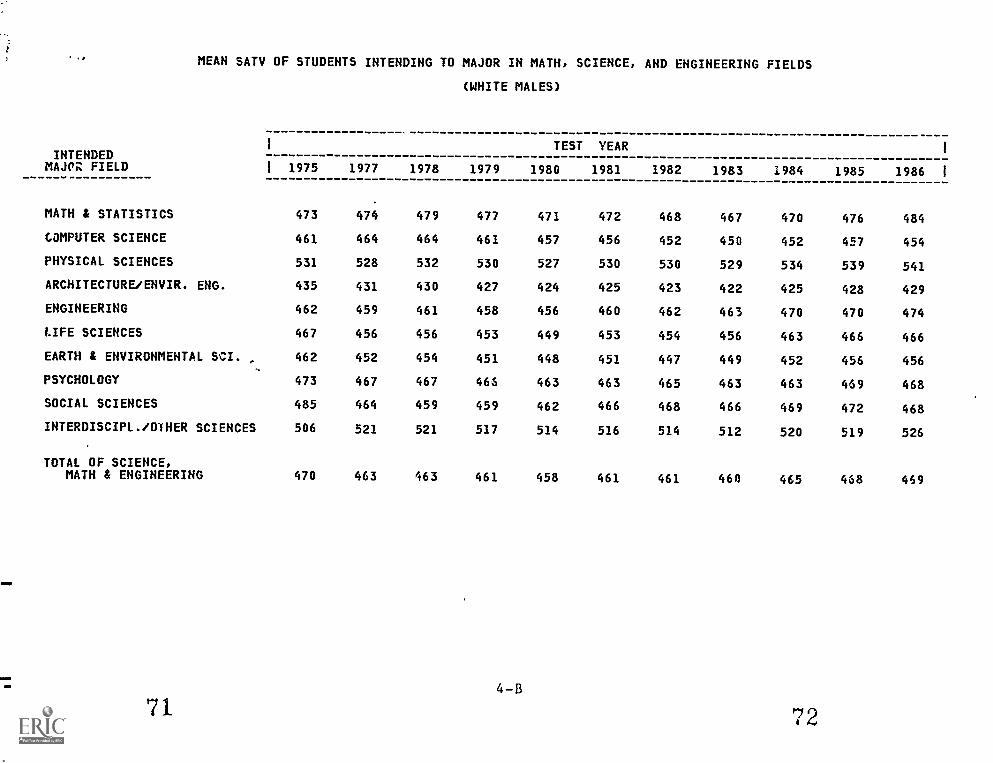
MEAN SATV OF STUDENTS INTENDING TO MAJOR IN MATH, SCIENCE, AND ENGINEERING FIELDS
(WHITE MALES)
INTENDEDI TEST YEAR
1
MAJPZ FIELD I 1975 1977 1978 1979 1980 1981 1982 1983 1984 1985 1986 1
MATH & STATISTICS 473 474 479 477 471 472 468 467 470 476 484
COMPUTER SCIENCE 461 464 464 461 457 456 452 450 452 457 454
PHYSICAL SCIENCES 531 528 532 530 527 530 530 529 534 539 541
ARCHITECTURE/ENVIR. ENG. 435 431 430 427 424 425 423 422 425 428 429
ENGINEERING 462 459 461 458 456 460 462 463 470 470 474
LIFE SCIENCES 467 456 456 453 449 453 454 456 463 466 466
EARTH & ENVIRONMENTAL SCI. ,. 462 452 454 451 448 451 447 449 452 456 456
PSYCHOLOGY 473 467 467 463 463 463 465 463 463 469 468
SOCIAL SCIENCES 485 464 459 459 462 466 468 466 469 472 468
INTERDISCIPL./OIHER SCIENCES 506 521 521 517 514 516 514 512 520 519 526
TOTAL OF SCIENCE,MATH & ENGINEERING 470 463 463 461 458 461 461 460 465 468 459

MEAN SATV OF STUDENTS INTENDING TO MAJOR IN MATH, SCIENCE, AND ENGINEERING FIELDS
(WHITE FEMALES)
INTENDEDI TEST YEAR
I
MAJOR FIELDI 1975 1977 1978 1979 1980 1981 1982 1983 1984 1985 1986 I
MATH & STATISTICS 476 477 476 471 468 467 471 468 472 474 481
COMPUTER SCIENCE 462 460 457 453 448 444 443 437 431 433 424
PHYSICAL SCIENCES 526 527 523 523 520 519 515 513 515 521 528
ARCHITECTURE /ENVIR. ENG. 479 468 465 459 451 450 446 451 451 455 455
ENGINEERING 520 519 511 507 502 500 500 499 501 501 499
LIFE SCIENCES 484 482 482 478 475 474 477 478 483 487 484
EARTH & ENVIRONMENTAL SCI. 482 479 475 471 470 466 465 470 469 471 471
PSYCHOLOGY 461 458 452 448 447 444 444 444 444 446 448
SOCIAL SCIENCES 485 467 461 461 462 461 470 471 472 477 470
INTERDISCIPL./OTHER SCIENCES 496 527 521 518 512 519 519 511 517 516 525
TOTAL OF SCIENCE,MATH & ENGINEERING 480 475 ' 468 466 464 465 463 463 468 467
734 -C

JMEAN SATV OF STUDENTS INTENDING TO MAJOR IN MATH, SCIENCE,
(BLACK MALES)
1 TEST YEARINTENDED
MAJOR FIELD 1 1975 1977 1978 1979 1980 1981
MATH & STATISTICS 335 327 316 326 309 322
COMPUTER SCIENCE 341 345 349 341 342 345
PHYSICAL SCIENCES 407 405 413 399 414 410
ARCHITECTURE/ENVIR. ENG. 345 325 337 32a 330 328
ENGINEERING 351 356 364 359 361 362
LIFE SCIENCES 369 35' 356 350 351 362
EARTH & ENVIRONMENTAL SCI. 384 374 372 374 379 368
PSYCHOLOGY 368 355 357 347 351 350
SOCIAL SCIENCES 372 349 345 345 350 553
INTERDISCIPL./OTHER SCIENCES 388 357 369 384 385 401
TOTAL OF SCIENCE,MATH & ENGINEERING 358 352 356 351 353 555
AND ENGINEERING FIELDS
1982 1983 1984
320 330 323
357 350 348
414 425 405
340 335 339
371 367 371
372 368 367
378 369 368
362 370 358
360 359 353
398 397 365
364 360 360
1985
332
354
420
343
374
373
392
380
366
391
367
1986
377
347
431
347
378
382
378
382
357
434
368
1

MEAN SATV OF STUDENTS INTENDING TO MAJOR IN MATH, SCIENCE, AND ENGINEERING FIELDS
INTENDEDMAJOR FIELD
MATH & STATISTICS
COMPUTER SCIENCE
PHYSICAL SCIENCES
ARCHITECTURE/ENVIR. ENG.
ENGINEERING
LIFE SCIENCES
EARTH & ENVIRONMENTAL SCI.
PSYCHOLOGY
SOCIAL SCIENCES
INTERDISCIPL./OTHER SCIENCES
TOTAL OF SCIENCE,MATH & ENGINEERING
77
I
(BLACK gEMALES)
TEST YEAR
I 1975 1977 1978 1979 1980 1981 1982 1983 1984 1985
343 336 344 326 328 336 331 350 345 344
333 334 338 327 331 331 338 331 330 329
385 372 380 382 383 387 393 388 386 410
371 353 359 351 341 344 340 354 352 362
396 411 400 395 392 386 393 394 392 388
379 370 368 369 370 373 380 382 385 393
410 398 394 393 372 372 389 385 398 393
360 354 350 345 346 348 354 356 361 366
368 331 333 329 330 331 347 353 351 354
356 361 353 344 357 384 369 387 386 383
365 351 351 347 349 349 357 354 354 358
4 -E
I
1986 I
365
323
410
365
384
386
378
374
341
438
357
7

MEAN SATV uF STUDENTS INTENDING TO MAJOR IN MATH, SCIENCE, AND ENGINEERING FIELDS
INTENDEDMAJOR FIELD
MATH & STATISTICS
COMPUTER SCIENCE
PHYSICAL SCIENCES
ARCHITECTURE/ENVIR. ENG.
ENGINEERING
LIFE SCIENCES
EARTH & ENVIRONMENTAL SCI.
PSYCHOLOGY
SOCIAL SCIENCES
INTERDISCIPL./OTHER SCIENCES
TOTAL OF SCIENCE,MATH & ENCINEERIM
1
1 1975
439
392
486
397
)06
449
445
428
455
480
433
1977
429
390
476
381
401
431
430
414
415
490
414
1978
411
381
464
376
396
429
425
405
408
478
406
(OTHER STUDENTS)
TEST
1979 1980
408 409
374 378
471 464
371 377
395 398
427 420
428 422
401 401
407 413
472 477
402 403
YEAR
1981
402
375
467
372
398
425
421
399
410
487
400
1982
398
374
466
370
400
425
421
405
415
459
400
1983
383
372
470
365
395
424
415
405
413
466
395
1984
390
368
458
368
400
429
626
400
419
463
397
1985
396
372
46R
380
401
437
429
409
423
460
403
1986
410
365
483
376
401
434
431
407
419
492
403
4 -F
7 9
I
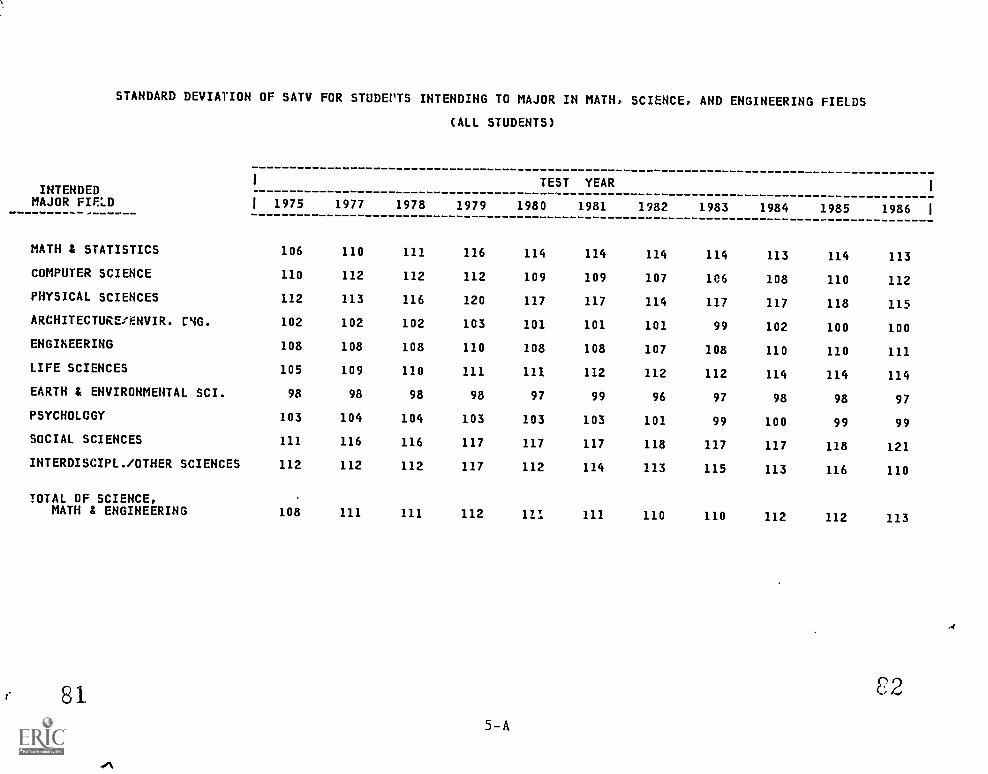
STANDARD DEVIATION OF SATV FOR STUDENTS INTENDING TO MAJOR IN MATH,
(ALL STUDENTS)
1 TEST YEARINTENDED
MAJOR FIF:.1) 1 1975 1977 1978 1979 1980 1981
MATH & STATISTICS 106 110 111 116 114 114
COMPUTER SCIENCE 110 112 112 112 109 109
PHYSICAL SCIENCES 112 113 116 120 117 117
ARCHITECTUREIENVIR. C4G. 102 102 102 103 101 101
ENGINEERING 108 108 108 110 108 108
LIFE SCIENCES 105 109 110 111 111 112
EARTH & ENVIRONMENTAL SCI. 98 98 98 98 97 99
PSYCHOLOGY 103 104 104 103 103 103
SOCIAL SCIENCES 111 116 116 117 117 117
INTERDISCIPL./OTHER SCIENCES 112 112 112 117 112 114
TOTAL OF SCIENCE,MATH & ENGINEERING 108 111 111 112 111 111
SCIENCE,
1982
114
107
114
101
107
112
96
101
118
113
110
AND ENGINEERING FIELDS
1983 1984 1985
114 113 114
106 108 110
117 117 118
99 102 100
108 110 110
112 114 114
97 98 98
99 100 99
117 117 118
115 113 116
110 112 112
1
1986 1
113
112
115
100
111
114
97
99
121
110
113
815 -A
C2

STANDARD DEVIATION OF SATV FOR STUDENTS INTENDING TO MAJOR IN MATH, SCIENCE, AND ENGINEERING FIELDS
(WHITE MALES)
INTENDEDTEST YEAR
I
MAJOR FIELD I 1975 1977 1978 1979 1980 1981 1982 1983 1984 1985 1936 I
MATH & STATISTICS 105 107 107 112 110 110 109 110 110 111 110
COMPUTER SCIENCE 104 104 104 104 101 102 101 99 101 102 101
PHYSICAL SCIENCES 104 104 106 111 106 107 107 108 107 108 107
ARCHITECTURE/ENVIR. ENG. 96 94 95 95 94 94 94 92 95 93 93
ENGINEERING 101 100 100 101 100 100 99 99 100 101 99
LIFE SCIENCES 102 105 107 108 106 107 109 107 111 112 110
EARTH & ENVIRONMENTAL SCI. 96 95 94 95 93 96 94 92 94 95 94
PSYCHOLOGY 102 98 100 100 99 99 98 99 100 99 99
SOCIAL SCIENCES 109 113 112 113 113 113 113 114 115 116 117
INTERDISCIPL./OTHER SCIENCES 107 105 103 111 106 109 105 108 107 109 144
TOTAL OF SCIENCE,MATH & ENGINEERING 104 104 105 106 104 104 103 102 1u4 105 104

STANDARD DEVIATION OF SATV FOR STUDENTS INTENDING TO MAJOR IN MATH, SCIENCE,
(WHITE FEMALES)
I TEST YEARINTENDED
AND ENGINEERING FIELDS
I
MAJOR FIELD I 1975 1977 1978 1979 1980 1981 1982 1983 1984 1985 1986 I
MATH & STAUSTICS 95 97 97 101 10. 100 99 99 99 100 98
COMPUTER SCIENCE 99 98 98 97 96 96 95 94 94 96 100
PHYSICAL SCIENCES 106 107 109 115 112 i10 106 108 106 110 108
ARCHITECTURE /ENVIR. ENG. 101 99 100 100 99 98 97 95 98 97 96
ENGINEERING 99 99 97 99 99 99 97 95 95 96 96
LIFE SCIENCES 101 103 103 103 105 106 106 104 106 106 106
EARTH & ENVIRONMENTAL SCI. 99 98 97 98 97 98 93 96 99 98 95
PSYCHOLOGY 95 96 97 96 97 96 95 93 95 1 94
SOCIAL SCIENCES 104 104 106 107 108 107 109 107 108 109 112
INTERDISCIPL./OTHER SCIENCES 111 110 107 108 109 108 105 107 106 110 10:
TOTAL OF SCIENCE,MATH & ENGINEERING 101 103 103 104 104 103 102 101 103 103 104
b 5
5-C
86

STANDARD DEVIATION OF SATV FOR STUDENTS INTENDING TO MAJOR IN MATH, SCIENCE. AND ENGINEERING FIELDS
INTENDEDI
(BLACK MALES)
TEST YEAR
MAJOR FIELD I 1975 1977 1978 1579 1980 1981 1982 1983
MATH & STATISTICS 99 95 92 102 88 107 98 105
COMPUTER SCIENCE 90 93 89 91 87 93 94 91
PHYSICAL SCIENCES 111 113 124 112 120 112 111 110
ARCHITECTURE/ENVIR. ENG. 96 85 89 86 91 90 90 90
ENGINEERING T8 100 102 99 100 100 100 100
LIFE SCIENCES 104 101 100 104 108 107 107 106
EARTH & ENVIRONMENTAL SCI. 110 100 102 105 99 97 105 95
PSYCHOLOGY 98 94 98 92 95 95 95 100
SOCIAL SCIENCES 105 104 100 102 104 104 107 113
INTERDISCIPL./OINER SCIENCES 103 104 121 111 106 109 123 124
TOTAL OF SCIENCE,MATH & ENGINEERING 101 100 100 99 99 100 100 99
87 5 -D
1
1984 1985 1986 I
88 92 101
93 91 90
115 106 101
85 87 86
101 101 101
107 109 106
93 102 86
94 96 98
109 110 112
99 111 110
99 100 100

STANDARD DEVIATION OF SATV FOR STUDENTS INTENDING TO MAJOR IN MATH, SCIENCE, AND ENGINEERING FIELDS
(BLACK FEMALES)
INTENDEDI TEST YEAR
I
MAJOR FIELDI 1975 1977 1978 . 1979 1980 1981 1982 1983 1984 1985 1936 I
MATH & STATIC .CS 86 98 93 95 93 93 96 95 95 97 99
COMPUTER SCIENCE 82 90 89 82 89 86 88 86 84 84 82
PHYSICAL SCIENCES 112 111 120 111 120 107 103 112 100 115 115
ARCHITEt.TURE/ENVIR. ENG. 64 101 97 98 85 93 91 83 89 98 90
ENGINEERING 101 102 104 104 99 99 99 100 99 95 95
LIFE SCIENCES lri 10C 103 108 108 105 102 108 105 104 105
EARTH & ENVIRONMNTAL SCI. 99 117 105 104 96 84 97 112 112 94 111
PSYCHOLOGY 93 93 92 91 83 93 93 93 94 93 93
SOCIAL SCIENCES 100 97 95 90 96 96 106 107 103 104 101
INTERDISCIPL./OTHER SCIENCES 95 105 108 94 107 112 105 121 108 113 127
TOTAL OF SCIENCE,MATH & ENGINEERING 98 100 98 97 97 97 98 98 96 97 98
bJ
-E
20

STANDARD DEVIATION OF SATV FOR STUDENTS INTENPING TO MAJOR IN MATH,
(OTHER STUDENTS)
1 TEST YEARINTENDED
MAJOR FIELD 1 1975 1977 1978 1979 1980 1981
MATH & STATISTICS 122 134 129 132 135 138
COMPUTER SCIENCE 113 116 115 115 112 113
PHYSICAL SCIENCES 138 142 137 143 141 :141
ARCHITECTURE/ENVIR. ENG. 111 107 108 108 106 102
ENGINEERING 121 120 120 120 118 117
LIFE SCIENCES 119 122 122 124 124 125
EARTH & ENVIRONMENTAL SCI. 109 105 108 107 101 104
PSYCHOLOGY 110 110 108 107 108 108
SOCIAL SCIENCES 125 124 123 125 126 125
INTERDISCIPL./OTHER SCIENCES 127 132 135 142 134 129
TOTAL OF SCIENCE,MATH & ENGINEERING 122 122 121 122 120 120
SCIENCE,
1982
135
112
135
104
120
126
108
104
125
144
120
AND ENGINEERING FIELDS
1983 1984 1985
136 135 130
112 111 112
141 1',1 140
102 107 105
120 123 122
127 128 129
106 106 107
106 105 105
123 125 126
139 135 135
120 122 122
1
1986 1
138
115
139
105
19.3
128
106
103
129
138
123

MEAN SATV OF STUDENTS INTENDING TO MAJOR IN MATH, SCIENCE,(ALL STUDENTS)
TEST YEARINTENDED
MAJOR FIELD 1 1975 1977 1978 1979 1980 1981
MATH t STATISTICS 465 464 464 459 455 456
COMPUTER SCIENCE 439 439 436 432 429 427
PHYSICAL SCIENCES
ASTRONOMY 507 512 506 501 501 502CHEMISTRY 502 496 495 493 489 491PHYSICS 554 553 551 555 548 553
ARCHITECTURE/ENVIR. ENG. 432 424 423 418 415 414
ENGINEERING
AEROSPACE ENGINEERING 445 448 451 452 451 455ELECTRICAL ENGINEERING 437 437 436 434 430 435CHEMICAL ENGINEERING 499 500 496 491 491 490MECHANICAL ENGINEERING 00 428 430 427 425 428CIVIL ENGINEERING 446 438 43: 432 429 431OTHER ENGINEERING 460 459 457 455 '53 454
LIFE SCIENCES
AGRICULTURE 426 *20 412 407 402 403BIOLOGICAL SCIENCES 480 489 480 477 474 476
EARTH & ENVIRONMENTAL SCI. 464 457 456 453 451 451
PSYCHOLOGY
CHILD PSYCHOLOGY 424 416 407 404 404 4018ENERAL PSYCHOLOGY 457 456 452 449 447 44iSOCIAL PSYCHOLOGY 451 438 438 434 433 433
SOCIAL SCIENCES
ECONOMICS 511 510 508 513 512 507INTERNATIONAL RELATIONS 528 532 531 532 529 526LAW ENFORCEMENT 419 393 386 384 380 381POLITICAL SCIENCE 0 501 497 495 490 489SOCIOLOGY 0 420 417 417 (16 418OTHER SOCIAL SCIENCES 474 447 444 442 443 440
ITERDISCIPL./OTHER SCIENCES 499 515 512 509 506 510
TOTAL OF SCIENCE,MATH fl ENGINEERING 464 454 451 448 446 446
AN') ENGINEERING FIELDS
1982 1983 1984
455 452 457
426 422 420
504 505 504490 489 489551 548 552
413 412 415
460 461 459435 434 442491 490 489429 430 434434 433 435456 456 461
401 399 399477 477 480
449 451 454
403 408 407449 449 449436 435 434
509 511 513551 530 533381 383 384495 493 498420 424 420448 452 456
507 503 509
446 444 446
1985
459
423
511495557
420
472442492537436459
399484
457
413452439
515542387504425457
507
451
1986 1
469
413
526500558
419
472436490442436460
404480
458
415448439
519544381507414458
520
450
C 4

MEAN SATV OF STUDENTS INTENDING TO MAJOR IN MATH, SCIENCE, AND ENGINEERING FIELDSs,
INTENDEDI
(WHITE MALES)
TEST YEAR
MAJOR FIELD I 1975 1977 1978 1979 1980 1981 1982 1983 1984 1985
MATH & STATISTICS 473 474 479 477 471 472 468 467 470 476
COMPUTER SCIENCE 461 464 464 461 457 456 452 450 452 457
PHYSICAL SCIENCES
ASTRONOMY 514 516 512 510 514 512 513 510 517 519CHEMISTRY 511 506 509 504 501 505 503 507 507 511PHYSICS 563 558 561 564 555 562 563 557 564 571
ARCHITECTURE/ENVIR. ENG. 435 431 430 427 424 425 423 422 425 423
ENGINEERING
AEROSPACE ENGINEERING 456 457 463 464 462 469 472 471 481 483ELECTRICAL ENGINEERING 455 453 454 453 45P 454 454 456 465 468CHEMICAL ENGINEERING 512 511 508 504 504 502 503 505 505 509MECHANICAL ENGINEERING 445 441 444 442 437 442 442 446 451 452CIVIL ENGINEERING 452 446 452 443 442 444 446 445 451 450OTHER ENGINEERING 465 464 464 44,1 459 461 462 464 470 468
LIFE SCIENCES
AGRICULTURE 416 407 401 398 393 396 392 390 393 390BIOLOGICAL SCIENCES 485 484 487 484 480 486 487 490 495 496
EARTH & ENVIRONMENTAL SCI. 462 452 454 451 448 451 447 449 452 456
PSYCHOLOGY
CHILD PSYCHOLOGY 444 428 419 428 428 427 422 420 428 431GENERAL PSYCHOLOGY 475 475 475 472 469 470 471 471 469 474SOCIAL PSYCHOLOGY 472 454 460 465 456 455 463 452 457 468
SOCIAL SCIENCES
ECONOMICS 524 528 526 526 517 520 519 524 530 529INTERNATIONAL RELATIONS 543 549 548 561 546 543 555 557 558 565LAW ENFORCEMENT 427 396 394 391 389 393 391 391 396 397POLITICAL SCIENCE 0 514 512 512 509 507 5n9 512 518 521SOCIOLOGY 0 455 450 452 461 457 45i', 453 460 465OTHER SOCIAL SCIENCES 483 476 473 470 472 470 474 477 481 484
INTERDISCIPL./OTHER SCIENCES 506 521 521 517 514 516 514 512 520 519
TOTAL OF SCIENCE,MATH & ENGINEERING 470 463 463 461 458 461 461 460 465 468
95 6-
I
1986 I
484
454
534514569
429
485467508458448477
3954Q7
456
424471468
537564397526463485
526
96469
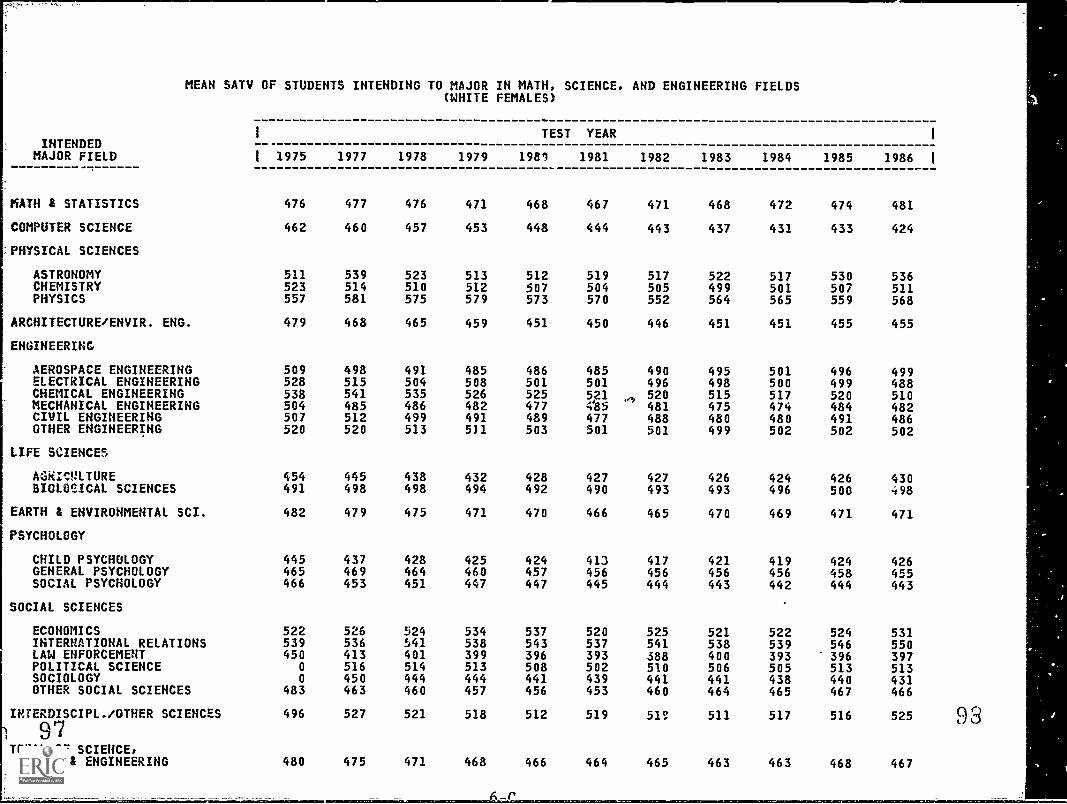
MEAN SATV OF STUDENTS INTENDING TO MAJOR IN MATH, SCIENCE, AND ENGINEERING FIELDS(WHITE FEMALES)
INTENDEDMAJOR FIELD
PATH & STATISTICS
COMPUTER SCIENCE
:PHYSICAL SCIENCES
ASTRONOMYCHEMISTRYPHYSICS
ARCHITECTURE/ENVIR. ENG.
ENGINEERING
AEROSPACE ENGINEERINGELECTRICAL ENGINEERINGCHEMICAL ENGINEERINGMECHANICAL ENGINEERINGCIVIL ENGINEERINGOTHER ENGINEERING
LIFE SCIENCES
AGraMTUREBIOLOGICAL SCIENCES
EARTH & ENVIRONMENTAL SCI.
PSYCHOLOGY
CHILD PSYCHOLOGYGENERAL PSYCHOLOGYSOCIAL PSYCHOLOGY
SOCIAL SCIENCES
ECONOMICSINTERNATIONAL RELATIONSLAW ENFORCEMENTPOLITICAL SCIENCESOCIOLOGYOTHER SOCIAL SCIENCES
INTERDISCIPL./OTHER SCIENCES
97TOTAL OF SCIENCE,
MATH & ENGINEERING
TEST YEAR1
1 1975 1977 1978 1979 1981 1981 1982 1983 1984 1985 1986 1
476 477 476 471 468 467 471 468 472 474 481
462 460 457 453 448 444 443 437 431 433 424
511 539 523 513 512 519 517 522 517 530 536523 514 510 512 507 504 505 499 501 507 511557 581 575 579 573 570 552 564 565 559 568
479 468 465 459 451 450 446 451 451 455 455
509 498 491 485 486 485 490 495 501 496 499528 515 504 508 501 501 496 498 500 499 488538 541 535 526 525 521 ,. 520 515 517 520 510504 485 486 482 477 485 481 475 474 484 482507 512 499 491 489 477 488 480 480 491 486520 520 513 511 503 501 501 499 502 502 502
454 445 438 432 428 427 427 426 424 426 430491 498 498 494 492 490 493 493 496 500 498
482 479 475 471 470 466 465 470 469 471 471
445 437 428 425 424 413 417 421 419 424 426465 469 464 460 457 456 456 456 456 458 455466 453 451 447 447 445 444 443 442 444 443
522 526 524 534 537 520 525 521 522 524 531539 536 541 538 543 537 541 538 539 546 550450 413 401 399 396 393 388 400 393 396 397
0 516 514 513 508 502 510 506 505 513 5130 450 444 444 441 439 441 441 438 440 431
483 463 460 457 456 453 460 464 465 467 466
496 527 521 518 512 519 51c.! 511 517 516 525
480 475 471 468 466 464 465 463 463 468 467
93

MEAN SATV OF STUDENTS INTENDING TO MAJOR IN MATH, SCIENCE,(BLACK MALES)
TEST YEARINTENDED
AND ENGINEERING FIELDS
MAJOR FIELD 1975 1977 1978 1979 1980 1981 1982 1983 1984 1985 1986
MATH & STATISTICS 335 327 316 326 309 322 320 330 323 332 377
COMPUTER SCIENCE 341 345 349 341 342 345 357 350 348 354 347
PHYSICAL SCIENCES
ASTRONOMY 383 378 387 365 388 398 401 454 425 383 436CHEMISTRY 392 385 400 386 383 391 384 386 404 394 408PHYSICS 451 451 449 444 474 450 475 476 396 464 469
ARCHITECTURE/ENVIR. ENG. 345 325 337 328 330 328 340 335 339 343 347
ENGINEERING
AEROSPACE ENGINEERING 371 371 377 382 384 384 399 395 401 404 413ELECTRICAL ENGINEERING 342 347 359 346 346 350 361 356 363 367 367CHEMICAL ENGINEERING 383 426 421 413 424 416 418 413 407 418 433MECHANICAL ENGINEERING 328 329 342 337 345 340 349 351 351 335 374CIVIL ENGINEERING 370 371 375 365 368 366 372 372 366 379 368OTHER ENGINEERING 353 357 363 360 360 362 367 365 366 370 373
LIFE SCIENCES
AGRICULTURE 301 301 303 297 301 298 314 288 289 305 312BIOLOGICAL SCIENCES 380 371 371 367 369 379 387 386 383 392 395
EARTH & ENVIRONMENTAL SCI. 384 374 372 374 379 368 378 369 368 392 378
PSYCHOLOCY
CHILD PSYCHOLOGY 321 321 317 323 321 318 331 339 347 338 330GENERAL PSYCHOLOGY 377 364 369 355 362 362 372 382 366 390 389SOCIAL PSYCHOLOGY 363 354 361 350 348 346 360 359 33V 381 383
SOCIAL SCIENCES
ECONOMICS 425 405 403 422 434 437 418 423 433 428 432INTERNATIONAL RELATIONS 403 461 391 455 386 418 439 439 497 473 519LAW ENFORCEMENT 322 313 312 309 309 312 324 309 298 316 315POLITICAL SCIENCE 0 390 391 384 375 380 388 391 392 414 425SOCIOLOGY 0 324 317 317 310 323 337 335 318 359 333OTHER SOCIAL SCIENCES 370 340 340 333 349 345 349 362 359 358 362
INTERDISCIPL./OTHER SCIENCES 388 357 369 384 385 401 398 397 365 391 434
TOTAL OF SCIENCE,MAIN & ENGINEERING 158 352 356 351 353 355 364 360 360 367 368
99 6-D 1 0 0
I

MEAN SATV OF STUDENTS INTENDING TO MAJOR IN MATH, SCIENCE, AND ENGINEERING FIELDS(BLACK FEMALES)
INTENDEDMAJOR FIELD
MATH & STATISTICS
COMPUTER SCIENCE
PHYSICAL SCIENCES
ASTRONOMYCHEMISTRYPHYSICS
ARCHITECTURE/ENVIR. ENG.
ENGINEERING
AEROSPACE ENGINEERINGELECTRICAL ENGINEERINGCHEMICAL ENGINEERINGMECHANICAL ENGINEERINGCIVIL ENGINEERINGOTHER ENGINEERING
LIFE SCIENCES
AGRICULTUREBIOLOGICAL SCIENCES
EARTH & ENVIRONMENTAL SCI.
PSYCHOLOGY
CHILD PSYCHOLOGYGENERAL PSYCHOLOGYSOCIAL PSYCHOLOGY
SOCIAL SCIENCES
ECONOMICSINTERNATIONAL RELATIONSLAW ENFORCEMENTPOLITICAL SCIENCESOCIOLOGYOTHER SOCIAL SCIENCES
INTERDISCIPL./OTHER SCIENCES1 r\ 1
TOTAL OF SCIENCE,MATH & ENGINEERING
1
1 1975
343
333
355386384
371
328381411429386400
371380
410
340369363
411403330
0
0
368
356
365
1977
336
334
472362395
353
408381417413397422
348372
398
337365357
353452305388321320
361
351
1978
344
338
413374406
359
396396417384365404
330371
394
328365353
402437309372327327
353
351
1979
326
327
380379410
351
412374405371379404
326373
393
325359350
402415305368320324
344
347
TEST
1980
318
331
344383399
341
397363410368381400
310376
372
325362347
404438302376323320
357
349
YEAR
1981
336
331
373372483
344
392376401365368390
319Z77
372
330362348
382451300379317323
384
349
1982
331
338
368387433
340
422379408364373398
345383
389
334370354
432449311383332336
369
357
1983
350
331
385383427
354
399381415362388397
338385
385
330374354
464474300375332344
387
354
1984
345
330
464377408
352
393378410369366400
344388
398
340377363
435486298378316348
386
354
1985
344
329
307406448
362
402378408377374388
348396
393
347379369
418452304392342343
383
358
1
1986 1
365
323
489395458
365
411371407372388384
347389
378
356381372
434501310388314340
438
357

rMEAN SATV OF STUDENTS INTENDING TO MAJOR IN MATH, SCIENCE, AND ENGINEERING FIELDS
(OTHER STUDENTS)
INTENDED1 TEST YEAR I
MAJOR FIELD I 1975 1977 1973 1979 1980 1981 1982 1983 1984 1985 1986 I
MATH & STATISTICS 439 429 411 408 409 402 398 383 390 396 410
COMPUTER SCIENCE 392 390 381 374 378 375 374 372 3f 372 365
PHYSICAL SCIENCES
ASTRONOMY 493 468 467 458 449 448 438 459 438 461 483CHEMISTRY 458 449 442 446 432 444 440 442 433 444 461PHYSICS 520 517 492 504 504 502 503 507 497 502 510
ARCHITECTURE /ENVIR. ENG. 397 381 376 371 377 372 370 365 368 380 376
ENGINEERING
AEROSPACE ENGINEERING 395 402 395 402 410 404 407 408 418 424 422ELECTRICAL ENGINEERING 390 390 382 380 383 386 387 379 389 386 381CHEMICAL ENGINEERING 432 425 420 425 430 435 432 416 426 429 431MECHANICAL ENGINEERING 361 376 369 365 373 371 375 366 374 381 388CIVIL ENGINEERING 395 382 373 373 373 377 381 381 382 379 390OTHER ENGINEERING 423 415 414 409 410 407 411 409 409 413 409
LIFE SCIENCES
AGRICULTURE 409 391 379 374 366 365 367 361 359 360 370BIOLOGICAL SCIENCES 457 443 4'3 440 434 439 438 436 439 446 442
EARTH & ENVIRONMENTAL SCI. 445 430 425 428 422 421 421 415 426 429 431
PSYCHOLOGY
CHILD PSYCHOLOGY 399 388 378 370 370 366 377 380 370 382 381GENERAL PSYCHOLOGY 437 424 414 415 413 414 418 415 413 419 414SOCIAL PSYCHOLOGY 422 403 412 393 405 399 409 409 404 412 409
SOCIAL SCIENCES
ECONOMICS 458 458 465 458 483 476 473 473 468 479 478INTERNATIONAL RELATIONS 490 491 483 474 477 475 472 467 470 493 492LAW ENFORCEMENT 372 356 352 348 347 344 345 349 348 3f4 343POLITICAL SCIENCE 0 476 470 466 454 451 457 447 461 463 471SOCIOLOGY 0 384 394 395 383 395 389 394 392 384 384OTHER SOCIAL SCIENCES 454 410 408 404 411 398 406 406 415 416 421
INTERDISCIPL./OTHER SCIENCES 480 490 478 472 477 487 459 466 463 460 492
TOTAL OF SCIENCE,MATH & ENGINEERING 433 414 406 402 403 400 400 395 397 403 403
103 6.-F 104
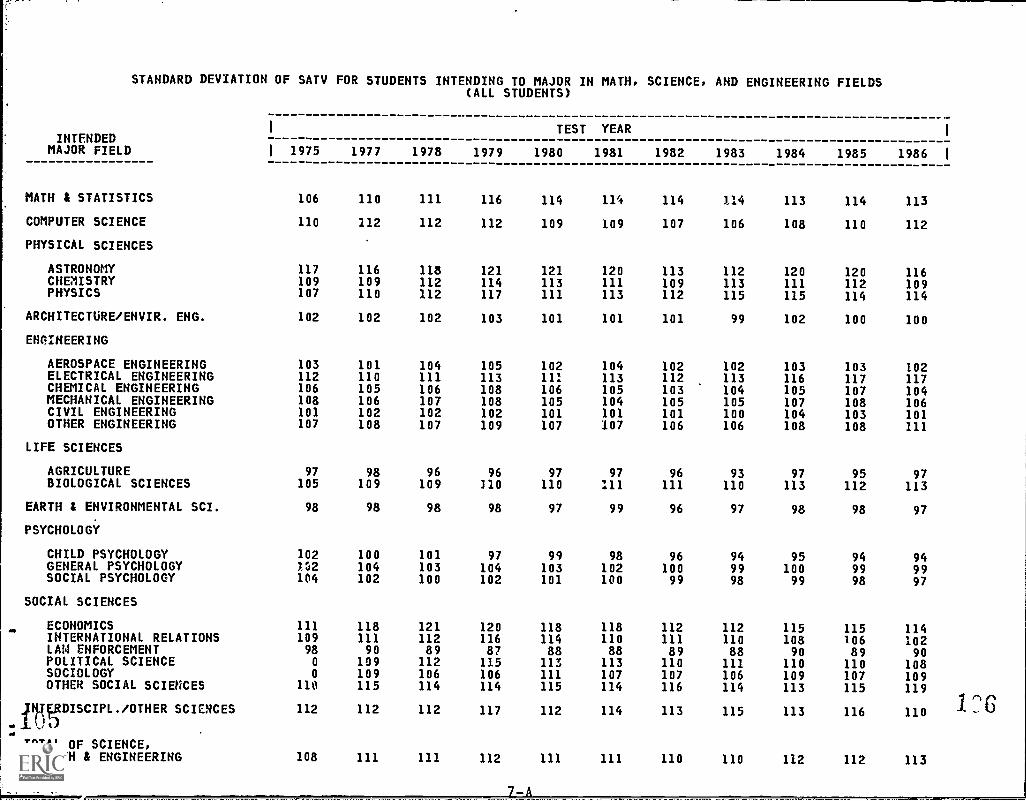
STANDARD DEVIATION OF SATV FOR STUDENTS INTENDING TO MAJOR IN MATH, SCIENCE, AND ENGINEERING FIELDS(ALL STUDENTS)
INTENDEDI TEST YEAR
I
MAJOR FIELD I 1975 1977 1978 1979 1980 1981 1982 1983 1984 1985 1986 I
MATH & STATISTICS 106 110 111 116 114 114 114 114 113 114 113
COMPUTER SCIENCE 110 112 112 112 109 109 107 106 108 110 112
PHYSICAL SCIENCES
ASTRONOMY 117 116 118 121 121 120 113 112 120 120 116CHEMISTRY 109 109 112 114 113 111 109 113 111 112 109PHYSICS 107 110 112 117 111 113 112 115 115 114 114
ARCHITECTURE/ENVIR. ENG. 102 102 102 103 101 101 101 99 102 100 100
ENGINEERING
AEROSPACE ENGINEERING 103 101 104 105 102 104 102 102 103 103 102ELECTRICAL ENGINEERING 112 110 111 113 111 113 112 113 116 117 117CHEMICAL ENGINEERING 106 105 106 108 106 105 103 104 105 107 104MECHANICAL ENGINEERING 108 106 107 108 105 104 105 105 107 108 106CIVIL ENGINEERING 101 102 102 102 101 101 101 100 104 103 101OTHER ENGINEERING 107 108 107 109 107 107 106 106 108 108 111
LIFE SCIENCES
AGRICULTURE 97 98 96 96 97 97 96 93 97 95 97BIOLOGICAL SCIENCES 105 109 109 210 110 111 111 110 113 112 113
EARTH 1 ENVIRONMENTAL SCI. 98 98 98 98 97 99 96 97 98 98 97
PSYCHOLOGY
CHILD PSYCHOLOGY 102 100 101 97 99 98 96 94 95 94 94GENERAL PSYCHOLOGY 1*2 104 103 104 103 102 100 99 100 99 99SOCIAL PSYCHOLOGY 104 102 100 102 101 100 99 98 99 98 97
SOCIAL SCIENCES
ECONOMICS 111 118 121 120 118 118 112 112 115 115 114INTERNATIONAL RELATIONS 109 111 112 116 114 110 111 110 108 106 102LAM ENFORCEMENT 98 90 89 87 88 88 89 88 90 89 90POLITICAL SCIENCE 0 109 112 115 113 113 110 111 110 110 108SOCIOLOGY 0 109 106 106 111 107 107 106 109 107 109OTHER SOCIAL SCIENCES 110 115 114 114 115 114 116 114 113 115 119
.413TISCIPL./OTHER SCIENCES 112 112 112 117 112 114 113 115 113 116 110
TOTAL OF SCIENCE,MATH & ENGINEERING 108 111 111 112 111 111 110 110 112 112 113

STANDARD DEVIATION OF SATV FOR STUDENTS INTENDING TO MAJOR IN MATH, SCIENCE, AND ENGINEERING FIELDS
INTENDEDI
(WHITE MALES)
TEST YEAR 1
MAJOR FIELD I 1975 1977 1978 1979 1980 1981 1982 1983 1984 1985 1986 I
MATH & STATISTICS 105 107 107 112 110 110 109 110 110 111 110
COMPUTER SCIENCE 104 104 104 104 101 102 101 99 101 102 101
PHYSICAL SCIENCES
ASTRONOMY 111 110 113 114 111 111 108 107 113 115 110CHEMISTRY 100 98 102 104 103 102 102 104 100 103 101PHYSICS 99 102 101 106 101 102 101 106 104 102 103
ARCHITECTURE/ENVIR. ENG. 96 94 95 95 94 94 94 92 95 93 93
ENGINEERING
AEROSPACE ENGINEERING 96 95 97 99 97 97 96 96 96 97 94ELECTRICAL ENGINEERING 105 102 103 105 102 104 102 103 105 105 103CHEMICAL ENGINEERING 94 93 94 96 94 93 91 92 95 95 92MECHANICAL ENGINEERING 99 98 99 100 98 97 97 97 97 99 97CIVIL ENGINEERING 94 93 93 93 94 93 93 92 95 94 93OTHER ENGINEERING 101 101 99 101 99 99 98 98 100 100 100
LIFE SCIENCES
AGRICULTURE 91 92 91 90 90 90 92 87 91 90 90BIOLOGICAL SCIENCES 100 101 102 104 102 103 103 100 104 105 103
EARTH & ENVIRONMENTAL SCI. 96 95 94 95 93 96 94 92 94 95 94
PSYCHOLOGY
CHILD PSYCHOLOGY 98 90 96 94 96 90 96 95 95 /01 88GENERAL PSYCHOLOGY 101 98 100 99 99 99 97 98 100 99 99SOCIAL PSYCHOLOGY 104 98 95 99 94 100 98 97 97 96 98
SOCIAL SCIENCES
ECONOMICS10 105 108 107 109 112 110 105 105 107 106 105INTERNATIONAL RELATIONS 105 107 113 111 107 99 99 103 101 102 97LAW ENFORCEMENT 91 85 85 83 83 84 86 84 86 87 87POLITICAL SCIENCE 0 103 104 106 104 105 103 106 104 105 101SOCIOLOGY 0 105 104 103 108 109 110 102 100 106 111OTHER SOCIAL SCIENCES 108 111 108 109 108 111 110 111 111 112 115
INTERDISCIPL./OTHER SCIENCES 107 105 103 111 106 109 105 108 107 109 104111
110
TOTAL OF SCIENCE,MATH & ENGINEERING 104 104 105 106 104 104 103 102 104 105 104
1077 -B
108

STANDARD DEVIATION OF SATV FOR STUDENTS INTENDING TO MAJOR IN MATH, SCIENCE, AND ENGINEERING FIELDS(WHITE FEMALES)
INTENDEDI TEST YEAR
I
MAJOR FIELD I 1975 1977 1978 1979 1980 1981 1982 1983 1984 1985 1986 I
MATH & STATISTICS 95 97 97 101 100 100 99 99 99 100 98
COMPUTER SCIENCE 99 98 98 97 96 96 95 94 94 96 100
PHYSICAL SCIENCES
ASTRONOMY 110 110 117 115 116 120 104 110 114 115 112CHEMISTRY 103 104 104 111 109 104 102 102 101 105 102PHYSICS 109 100 108 115 106 110 115 114 103 112 111
ARCHITECTURE/ENVIR. ENG. 102 99 100 100 99 98 97 95 98 97 96
ENGINEERING
AEROSPACE ENGINEERING 96 103 103 10I 101 104 97 93 96 97 97ELECTRICAL ENGINEERING 102 102 103 105 102 106 101 100 99 103 102CHEMICAL ENGINEERING 93 98 97 97 97 97 93 92 91 93 92MECHANICAL ENGINEERING 102 102 96 100 102 98 101 92 97 95 97CIVIL ENGINEERING 92 100 98 96 95 96 97 95 91 99 92OTHER ENGINEERING 100 95 94 97 97 97 95 94 93 95 95
LIFE SCIENCES
AGRICULTURE 96 95 94 94 96 97 95 93 97 96 96BIOLuGICAL SCIENCES 101 102 102 102 103 105 104 103 104 103 194
EARTH & ENVIRONMENTAL SCI. 95 98 97 98 97 98 93 96 99 98 95
PSYCHOLOGY
CHILD PSYCHOLOGY 93 92 94 90 93 92 91 89 91 90 90GENERAL PSYCHOLOGY 96 97 96 97 97 96 95 93 95 94 94SOCIAL PSYCHOLOGY 95 96 95 94 96 93 94 93 94 94 92
SOCIAL SCIENCES
ECONOMICS 99 105 112 111 108 106 102 102 99 106 97INTERNATIONAL RELATIONS 99 104 98 101 104 102 99 96 99 95 92LAW ENFORCEMENT 88 90 88 85 86 85 85 86 86 86 86POLITICAL SCIENCE 0 99 101 103 100 103 100 98 99 101 100SOCIOLOGY 0 95 92 94 100 94 96 94 99 98 97OTHER SOCIAL SCIENCES 103 101 104 104 104 104 107 104 104 105 111
INTERDISCIPL./OTHER SCIENCES 111 110 107 108 109 108 105 107 106 110 1U5
109TOTAL OF SCTEN'E,
MATH & ENGINEERING 101 103 103 104 104 103 102 101 103 103 104

STANDARD DEVIATION OF SATV FOR STUDENTS INTENDING TO MAJOR IN MATH, SCIENCE, AND ENGINEERING FIELDS(BLACK MALES)
INTENDEDMAJOR FIELD
MATH & STATISTICS
COMPUTER SCIENCE
PHYSICAL SCIENCES
ASTRONOMYCHEMISTRYPHYSICS
ARCHITECTURE/ENVIR. ENG.
ENGINEERING
AEROSPACE ENGINEERINGELECTRICAL ENGINEERINGCHEMICAL ENGINEERINGMECHANICAL ENGINEERINGCIVIL ENGINEERINGOTHER ENGINEERING
LIFE SCIENCES
AGRICULTUREBIOLOGICAL SCIENCES
EARTH & ENVIRONMENTAL SCI.
PSYCHOLOGY
CHILD PSYCHOLOGYGENERAL PSYCHOLOGYSOCIAL PSYCHOLOGY
SOCIAL SCIENCES
ECONOMICSINTERNATIONAL RELATIONSLAW ENFORCEMENTPOLITICAL SCIENCESOCIOLOGYOTHER SOCIAL SCIENCES
INTERDISCIPL./OTHER SCIENCES
TOTAL OF SCIENCE,MATH & ENGINEERING
1
1 1975
99
90
12110898
96
9494101969699
86103
110
889990
118101820
0
105
103
101
1977
95
93
91108115
85
9594
1079295104
79101
100
769982
1281478110293100
104
100
1978
92
89
108107153
89
9710197
10095
103
8798
102
8210291
11490811058098
121
100
1979
102
91
11396
131
88
9497999695
101
84105
105
849487
12413078
1067996
111
99
TEST
1980
88
87
12098
128
91
969593
10393
101
92107
99
889791
11010276
10479
107
106
99
YEAR
1981
107
93
109107112
90
9G97
1029193
103
89105
97
899496
124102769887105
109
100
1982
98
94
10693
119
90
9798989492
101
101103
105
9093102
1241079211086
100
123
100
1983
105
91
11097
103
90
1009998959499
72104
95
9398
104
12113383
113111111
124
99
1984
88
93
115114116
85
99999410398
103
74106
93
889590
11412472
10591
109
99
99
1985
92
91
8799104
87
991011029993
101
89107
102
949592
1331267511293
106
111
100
1
1986 1
101
90
10290
106
86
9596
104101100103
85104
86
9695106
1301168311680107
110
"00
7-D 1 1 2

STANDARD DEVIATION OF SATV FOR STUDENTS INTENDING TO MAJOR IN MATH, SCIENCE, AND ENGINEERING FIELDS
INTENDEDMAJOR FIELD
MATH & STATISTICS
COMPUTER SCIENCE
PHYSICAL SCIENCES
ASTRONOMYCHEMISTRYPHYSICS
ARCHITECTURE/ENVIR. ENG.
ENGINEERING
AEROSPACE ENGINEERINGELECTRICAL ENGINEERINGCHEMICAL ENGINEERINGMECHANICAL ENGINEERINGCIVIL ENGINEERINGOTHER ENGINEERING
LIFE SCIENCES
AGRICULTUREBIOLOGICAL SCIENCES
EARTH & ENVIRONMENTAL SCI.
PSYCHOLOGY
CHILD PSYCHOLOGYGENERAL PSYCHOLOGYSOCIAL PSYCHOLOGY
SOCIAL SCIENCES
ECONOMICSINTERNATIONAL RELATIONSLAW ENFORCEMENTPOLITICAL SCIENCESOCIOLOGYOTHER SOCIAL SCIENCES
111'TISCIPL./OTHER SCIENCES
TOTAL OF SrIENCE,MATH & ENGINEER:NG
1
1 1975
86
82
126109123
88
881108911410198
100104
99
919393
12098820
0
100
95
98
1977
98
90
68104147
101
11110010110685102
105106
117
899496
101137831058591
105
100
1978
93
89
136117124
97
104101102121101101
90103
105
859490
11611782968395
108
98
(BLACK FEMALES)
TEST
1979 1980
95 93
82 89
139 87101 118159 143
98 85
107 84104 9896 10396 9899 91
106 99
94 86108 108
104 96
81 8094 9196 88
103 115109 10172 7898 10277 8789 93
94 107
97 97
YEAR
1981
93
86
6884
171
93
10396959999
100
95105
84
889494
12211375
1018890
112
97
1982
96
88
9694
141
91
1049996969098
94102
97
899487
1111147910591105
105
98
1983
95
86
126105140
83
10195959786103
86108
112
869492
122114759998
101
121
98
1984
95
84
14691
108
89
981039896
10496
103105
112
899495
10011074998497
108
96
1985
97
84
42110140
98
919398
1028795
102104
94
909585
11611375
100100100
113
97
1986
99
82
165101126
90
129088898299
115103
111
909493
9111077
1029198
127
98
1

STANDARD DEVIATION OF SATV FOR STUDENTS INTENDING TO MAJOR IN MATH, SCIENCE, AND ENGINEERING FIELDS(OTHER STUDENTS)
INTENDEDMAJOR FIELD
MATH & STATISTICS
COMPUTER SCIENCE
PHYSICAL SCIENCES
ASTRONOMYCHEMISTRYPHYSICS
ARCHITECTURE/ENVIR. ENG.
ENGINEERING
AEROSPACE ENGINEERINGELECTRICAL ENGINEERINGCHEMICAL ENGINEERINGMECHANICAL ENGINEERINGCIVIL ENGINEERINGOTHER ENGINEERING
LIFE SCIENCES
AGRICULTUREBIOLOGICAL SCIENCES
EARTH & ENVIRONMENTAL SCI.
PSYCHOLOGY
CHILD PSYCHOLOGYGENERAL PSYCHOLOGYSOCIAL PSYCHOLOGY
SOCIAL SCIENCES
ECONOMICSINTERNATIONAL RELATIONSLAW ENFORCEMENTPOLITICAL SCIENCESOCIOLOGYOTHER SOCIAL SCIENCES
INTERDISCIPL./OTHER SCIENCES
TOTAL OF SCIENCE,MATH & ENGINEERING
1
1 1975
122
113
142130138
111
114115128114114122
108119
109
102111104
127122850
0
125
127
122
1977
134
116
140137140
107
111117126115111123
106124
105
102112103
13212492
127104123
132
122
1978
129
115
134132140
108
114117128115111121
102123
108
98111101
14613089"7114119
135
121
1979
132
115
137133150
108
115117130114112122
101126
107
99108105
14513886132108122
142
122
TEST
1980
135
112
141130143
106
112118129114100119
99126
101
9A112102
13513390
128114122
134
120
YEAR
1981
138
113
144131145
.102
111117125110107118
103126
104
99109106
14113287130108117
129
120
1982
135
112
127127137
104
1101231281:7107120
95129
108
97106100
12813790
121109121
144
120
1983
136
112
127137143
102
11112i128115110121
97128
106
100108103
13313488
121114119
139
120
1984
135
111
130133145
107
115127124117112123
106128
106
93108104
14212787
121116121
135
122
1985
130
112
127132146
105
113126129120106121
93129
107
95108102
13613189
122102120
135
122
1
1986 1
138
115
134131145
105
112125125119111125
109128
106
94104104
13612585
124110127
138
123
1157 -F 116

MEAN SATM OF STUDENTS INTENDING TO MAJOR IN MATH, SCIENCE, AND ENGINEERNG FIELDS
(ALL STUDENTS)
INTENDEDMAJOR FIELD
MATH & STATISTICS
COMPUTER SCIENCE
PHYSICAL SCIENCES
ARCHITECTURE/ENVIR. ENG.
ENGINEERING
LIFE SCIENCES
EARTH & ENVIRONMENTAL SCI.
PSYCHOLOGY
SOCIAL SCIENCES
INTERDISCIPL./OTHER SCIENCES
TOTAL OF SCIENCE,MATH & ENGINEERING
1
1 1975
584
524
592
509
546
509
500
461
495
569
520
1977
588
529
595
506
550
500
501
455
465
593
514
1978
585
522
590
501
543
496
495
449
456
585
509
1979
580
517
586
496
540
493
490
447
457
578
507
TEST
1980
577
513
585
492
538
490
489
447
460
574
507
YEAR
1981
572
507
580
489
537
489
486
447
461
575
507
1982
569
502
582
487
540
489
485
446
464
572
508
1983
572
497
583
486
543
494
485
449
468
572
509
1984
578
496
583
486
546
499
485
453
470
575
511
1985
57b
501
587
491
548
505
487
455
475
575
514
1986
593
489
598
494
553
504
489
455
469
589
513
1
1
1178-A
1:3

MEAN SATM OF STUDENTS INTENDING TO MAJOR IN MATH, SCIENCE, AND ENGINEERNG FIELDS
(WHITE MALES)
INTENDEDMAJOR FIELD
MATH & STATISTICS
COMPUTER SCIENCE
PHYSICAL SCIENCES
ARCHITECTURE/ENVIR. ENG.
ENGINEERING
LIFE SCIENCES
EARTH & ENVIRONMENTAL SCI.
PSYCHOLOGY
SOCIAL SCIENCES
INTERDISCIPL./OTHER SCIENCES
TOTAL OF SCIENCE,MATH & ENGINEERING
1
1 1975
606
556
610
517
555
524
508
501
520
584
543
1977
617
567
614
519
560
517
510
502
500
610
545
1978
617
562
612
514
556
510
505
495
490
605
541
1979
614
554
606
510
552
505
500
496
490
596
538
TEST
1980
608
551
605
505
550
502
499
491
493
592
537
YEAR
1981
604
544
599
502
549
503
497
491
494
590
536
1982
600
540
605
501
553
502
496
492
494
591
538
198:
601
534
605
498
555
505
494
490
492
591
538
1984
605
533
606
496
558
509
493
489
492
593
539
1985
608
540
609
502
561
514
497
495
497
591
543
1986
621
538
617
505
570
518
501
501
496
601
546
1

MEAN SATM OF STUDENTS INTENDING TO MAJOR IN MATH, SCIENCE, AND ENGIHEERNG FIELDS
(WHITE FEMALES)
INTENDEDMAJOR FIELD
MATH I STATISTICS
COMPUTER SCIENCE
PHYSICAL SCIENCES
ARCHITECTURE/ENVIR. ENG.
ENGINEERING
LIFE SCIENCES
EARTH I ENVIRONMENTAL SCI.
PSYCHOLOGY
SOCIAL SCIENCES
INTERDISCIPL./OTHER SCIENCES
TOTAL OF SCIENCE,MATH & ENGINEERING
I
1 1975
577
531
566
526
586
503
-,91
465
486
544
505
1977
578
534
570
521
585
500
491
461
465
573
498
1978
578
525
563
518
578
498
488
458
459
563
494
1979
570
521
562
514
571
494
482
455
459
559
493
TEST
1980
572
517
561
509
570
492
482
455
463
552
495
YEAR
1981
566
508
555
506
565
491
480
454
462
560
494
1982
564
501
551
501
564
491
475
450
465
553
495
1/83
568
495
555
503
567
495
479
453
469
556
497
1984
575
493
558
508
575
505
481
458
473
561
501
1985
575
495
564
511
574
510
482
459
478
567
501
1
1986 1
585
481
575
510
574
505
483
458
472
577
496
121
8-C
122

MEAN SATM OF STUDENTS INTENDING TO MAJOR IN MATH,
(BLACK MALES)
1 TESTINTENDED
SCIENCE, AND ENGINEERNG FIELDS
YEAR 1
MAJOR FIELD I 1975 1977 1978 1979 1980 1981 1982 1983 1984 1985 1986 1
MATH & STATISTICS 437 429 411 418 404 420 415 428 430 437 479
COMPUTER SCIENCE 388 399 396 395 393 399 400 399 401 403 396
PHYSICAL SCIENCES 450 464 451 453 456 455 457 473 449 467 469
ARCHITECTURE/ENVIR. ENG. 394 379 389 382 382 382 390 366 389 389 394
ENGINEERING 410 422 424 420 424 423 429 431 434 437 439
LIFE SCIENCES 404 386 386 387 385 392 395 400 397 406 409
EARTH & ENVIRONMENTAL SCI. 388 385 384 395 395 380 401 392 382 394 405
PSYCHOLOGY 378 369 364 367 366 366 368 369 375 389 390
SOCIAL SCIENCES 388 365 359 369 368 371 373 373 363 383 375
INTERDISCIPL./OTHER SCIENCES 429 402 418 427 436 450 446 433 420 445 452
TOTAL OF SCIENCE,MATH & ENGINEERING 403 400 401 402 404 406 410 411 411 417 417
123 8-D
124
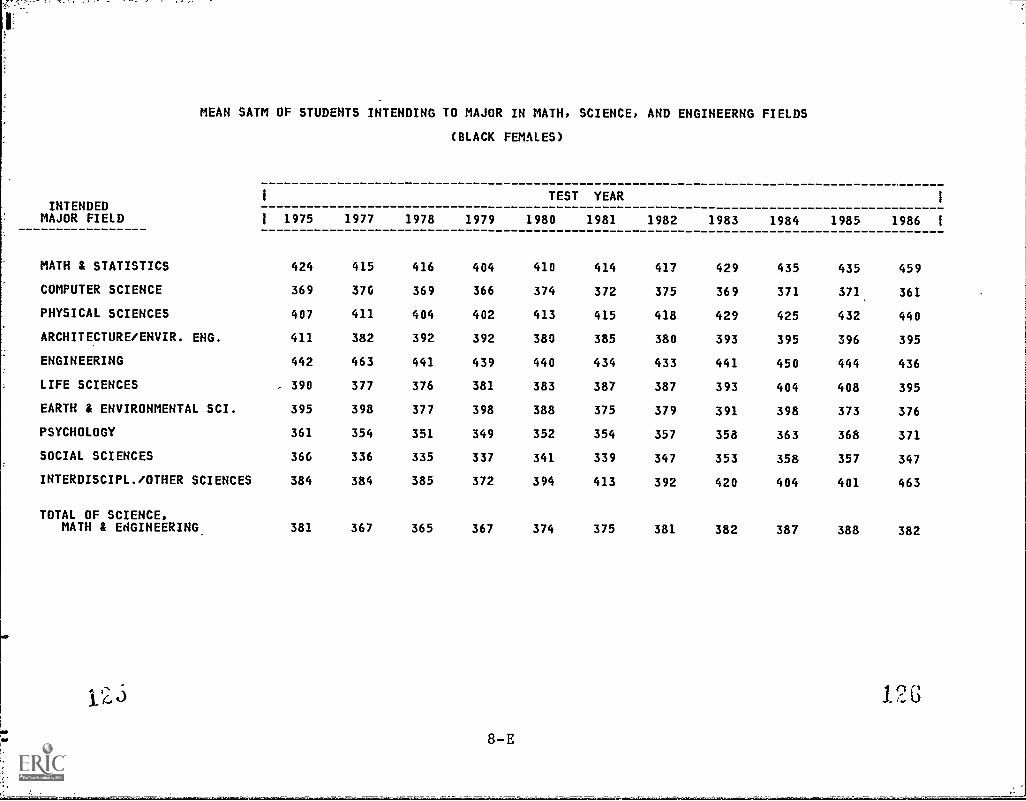
MEAN SATM OF STUDENTS INTENDING TO MAJOR IN MATH, SCIENCE,
(BLACK FEMALES)
1 TEST YEARINTENDED
MAJOR FIELD 1 1975 1977 1978 1979 1980 1981
MATH & STATISTICS 424 415 416 404 410 414
COMPUTER SCIENCE 369 370 369 366 374 372
PHYSICAL SCIENCES 407 411 404 402 413 415
ARCHITECTURE/ENVIR. ENG. 411 382 392 392 380 385
ENGINEERING 442 463 441 439 440 434
LIFE SCIENCES 390 377 376 381 383 387
EARTH & ENVIRONMENTAL SCI. 395 398 377 398 388 375
PSYCHOLOGY 361 354 351 349 352 354
SOCIAL SCIENCES 366 336 335 337 341 339
INTERDISCIPL./OTHER SCIENCES 384 384 385 372 394 413
TOTAL OF SCIENCE,MATH & EtIGINEERING 381 367 365 367 374 375
AND ENGINEERNG FIELDS
1982 1983 1984
417 429 435
375 369 371
418 429 425
380 393 395
433 441 450
387 393 404
379 391 398
357 358 363
347 353 358
392 420 404
381 382 387
1985
435
371
432
396
444
408
373
368
357
401
388
1986
459
361
440
395
436
395
376
371
347
463
382
12G
8-E
1

MEAN SATM OF STUDENTS INTENDING TO MAJOR IN MATH, SCIENCE, AND ENGINEERNG FIELDS
(OTHER STUDENTS)
INTENDEDI TEST YEAR I
MAJOR FIELD I 1975 1977 1978 1979 1980 1981 1982 1983 1984 1985 1986 I
MATH & STATISTICS 573 574 557 557 553 546 546 549 549 552 571
COMPUTER SCIENCE 510 506 499 494 492 492 484 480 478 482 469
PHYSICAL SCIENCES 585 577 571 573 567 571 571 571 569 579 593
ARCHITECTURE/ENVIR. ENG. 493 482 473 468 474 470 466 465 467 471 476
ENGINEERING 529 530 518 520 521 521 521 523 531 531 536
LIFE SCIENCES 501 487 483 484 482 479 482 492 497 505 508
EARTH & ENVIRONMENTAL SCI. 494 478 462 468 460 462 456 455 459 465 467
PSYCHOLOGY 446 433 420 418 423 421 423 428 429 430 433
SOCIAL SCIENCES 479 439 428 434 440 442 443 446 449 451 452
INTERDISCIPL./OTHER SCIENCES 561 581 567 566 568 572 559 555 563 559 592
TOTAL OF SCIENCE,MATH & ENGINEERING 508 495 486 489 492 493 493 494 497 500 502

STANDARD DEVIATION OF SATM FOR STUDENTS INTENDING TO MAJOR IN MATH, SCIENCE, AND ENGINEERING FIELDS
(ALL STUDENTS)
INTENDEDI TEST YEAR 1
MAJOR FIELD I 1975 1977 1978 1979 1980 1981 1982 1983 1984 1985 1986 I
MATH & STATISTICS 106 108. 111 115 114 113 114 114 111 111 111
COMPUTER SCIENCE 125 124 124 122 120 118 117 119 119 121 127
PHYSICAL SCIENCES 112 112 115 115 115 111 115 116 115 113 116
ARCHITECTURE/ENVIR. ENG. 108 110 109 109 108 108 108 109 109 108 110
ENGINEERING 115 115 116 115 114 112 113 115 115 115 118
LIFE SCIENCES 111 114 114 113 114 113 114 117 119 117 121
EARTH & ENVIRONMENTAL SCI. 102 104 104 102 102 102 101 104 103 104 105
PSYCHOLOGY 105 108 107 106 104 104 104 105 105 105 106
SOCIAL SCIENCES 113 117 115 115 116 116 117 118 118 118 123
INTERDISCIPL./OTHER SCIENCES 117 114 115 115 115 112 116 118 114 116 11*.$
TOTAL OF SCIENCE,MATH.& ENGINEERING 117 122 122 121 120 118 119 121 121 121 125
1 30
9-A

.
STANDARD DEVIATION OF SATM FOR STUDENTS INTENDING TO MAJOR IN MATH, SCIENCE, AND ENGINEERING FIELDS
(WHITE MALES)
INTENDEDMAJOR FIELD
MATH & STATISTICS
COMPUTER SCIENCE
PHYSICAL SCIENCES
ARCHITECTURE/ENVIR. ENG.
ENGINEERING
LIFE SCIENCES
EARTH & ENVIRONMENTAL SCI.
PSYCHOLOGY
SOCIAL SCIENCES
INTERDISCIPL./OTHER SCIENCES
TOTAL OF SCIENCE,MATH & ENGINEERING
I
1 1975
102
116
103
104
108
110
101
106
112
112
112
1977
101
112
102
104
108
114
193
109
117
105
115
1978
102
112
104
102
108
113
103
108
115
106
115
1979
105
113
106
102
109
113
101
107
116
110
115
TEST
1980
105
110
105
102
108
113
101
105
116
108
113
YEAR
1981
106
109
103
102
106
112
101
106
117
108
112
1982
109
110
106
102
107
114
101
105
117
108
112
1983
109
111
107
104
109
116
102
107
120
110
115
1984
107
110
106
104
108
118
102
106
119
108
114
1985
106
111
105
103
108
117
104
107
119
111
114
1986
106
114
108
105
109
120
105
109
122
108
117
1.31 9-B 132
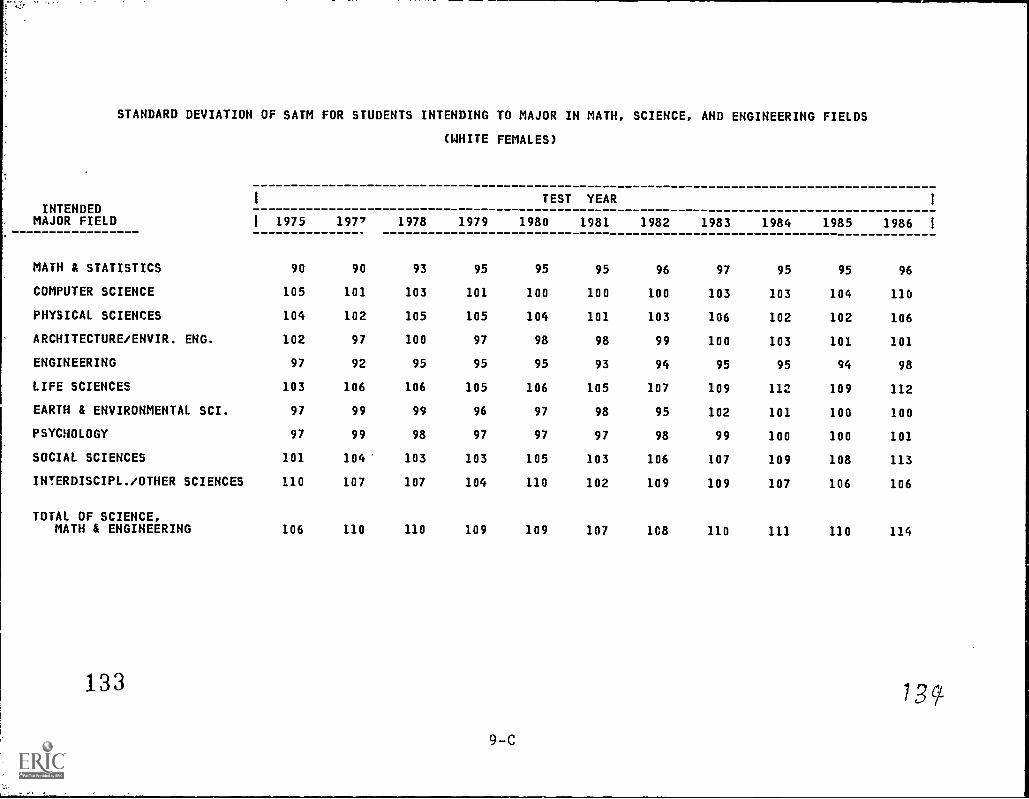
STANDARD DEVIATION OF SATM FOR STUDENTS INTENDING TO MAJOR IN MATH, SCIENCE, AND ENGINEERING FIELDS
(WHITE FEMALES)
INTENDEDMAJOR FIELD
MATH & STATISTICS
COMPUTER SCIENCE
PHYSICAL SCIENCES
ARCHITECTURE/ENVIR. ENG.
ENGINEERING
LIFE SCIENCES
EARTH & ENVIRONMENTAL SCI.
PSYCHOLOGY
SOCIAL SCIENCES
INTERDISCIPL./OTHER SCIENCES
TOTAL OF SCIENCE,MATH & ENGINEERING
1
1 1975
90
105
104
102
97
103
97
97
101
110
106
1977
90
101
102
97
92
106
99
99
104'
107
110
1978
93
103
105
100
95
106
99
98
103
107
110
1979
95
101
105
97
95
105
96
97
103
104
109
TEST
1980
95
100
104
98
95
106
97
97
105
110
109
YEAR
1981
95
100
101
98
93
105
98
97
103
102
107
1982
96
100
103
99
94
107
95
98
106
109
108
1983
97
103
106
100
95
109
102
99
107
109
110
1984
95
103
102
103
95
112
101
100
109
107
111
1985
95
104
102
101
94
109
100
100
108
106
110
1
1986 1
96
110
106
101
98
112
100
101
113
106
114
133
9-C
139.
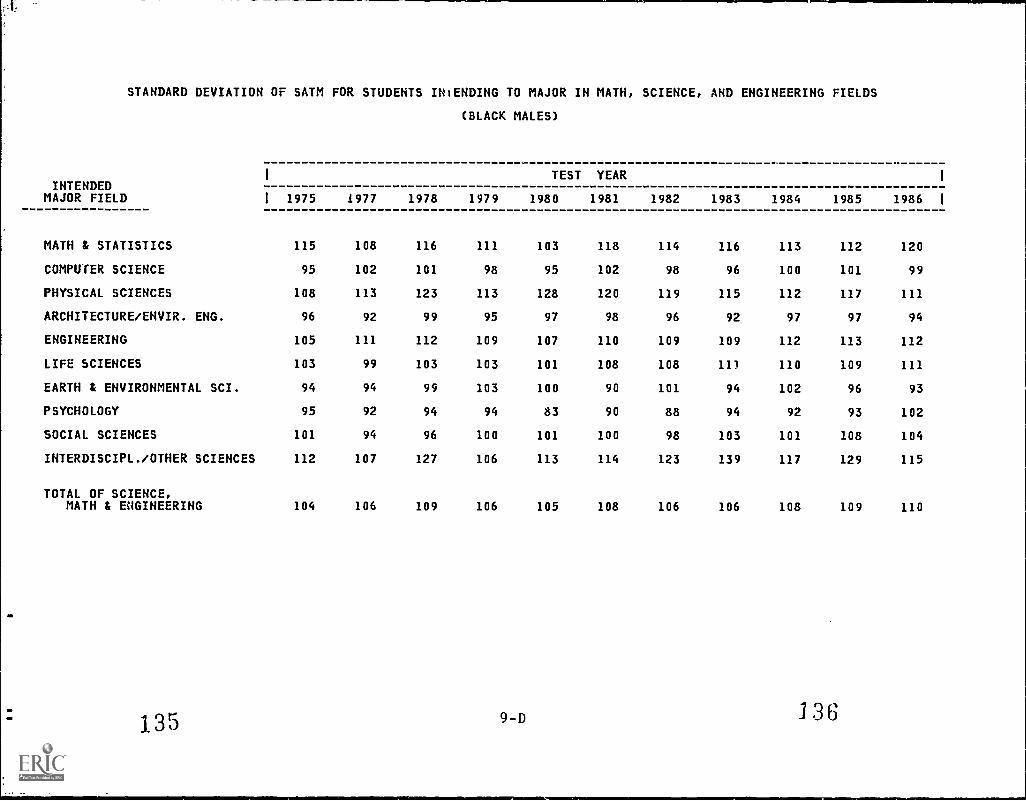
STANDARD DEVIATION OF SATM FOR STUDENTS IHiENDING TO MAJOR IN MATH, SCIENCE, AND ENGINEERING FIELDS
(BLACK MALES)
INTENDEDMAJOR FIELD
MATH & STATISTICS
COMPUTER SCIENCE
PHYSICAL SCIENCES
ARCHITECTURE/ENVIR. ENG.
ENGINEERING
LIFE SCIENCES
EARTH & ENVIRONMENTAL SCI.
PSYCHOLOGY
SOCIAL SCIENCES
INTERDISCIPL./OTHER SCIENCES
TOTAL OF SCIENCE,MATH & ENGINEERING
I
1 1975
115
95
108
96
105
103
94
95
101
112
104
1977
108
102
113
92
111
99
94
92
94
107
106
1978
116
101
123
99
112
103
99
94
96
127
109
1979
111
98
113
95
109
103
103
94
100
106
106
TEST
1980
103
95
128
97
107
101
100
83
101
113
105
YEAR
1981
118
102
120
98
110
108
90
90
100
114
108
1982
114
98
119
96
109
108
101
88
98
123
106
1983
116
96
115
92
109
11)
94
94
103
139
106
1984
113
100
112
97
112
110
102
92
101
117
108
1985
112
101
117
97
113
109
96
93
108
129
109
1986
120
99
111
94
112
111
93
102
104
115
110
1

STANDARD DEVIATION OF SATM FOR STUDENTS INTENDING TO MAJOR IN MATH,
(BLACK FEMALES)
1 TEST YEARINTENDED
MAJOR FIELD 1 1975 1977 1978 1979 1980 1981
MATH & STATISTICS 89 96 99 98 94 103
COMPUTER SCIENCE 83 89 90 87 85 87
PHYSICAL SCIENCES 97 116 111 100 108 98
ARCHITECTURE/ENVIR. DIG. 91 96 101 92 86 89
ENGINEERING 100 97 99 103 98 95
LIFE SCIENCES 95 ,4 93 95 95 95
EARTH s ENVIRONMENTAL SCI. 86 102 79 94 91 75
PSYCHOLOGY 78 81 80 78 76 81
SOCIAL :CIENCES 85 77 78 74 79 81
INTERDISCIPL./OTHER SCIENCES 105 98 88 86 102 106
TOTAL OF SCIENCE,MATH & ENGINEERING 90 93 92 91 92 93
SCIENCE, AND ENGINEERING FIELDS
1982 1983 1984 1985
104 107 109 101
86 85 85 86
108 103 104 107
85 90 91 99
96 101 101 100
92 99 100 101
102 99 98 80
81 81 85 85
83 86 91 87
102 113 105 116
93 95 97 96
1
1986 1
106
81
99
93
99
100
106
85
85
110
95
137
9-E
138

STANDARD DEVIATION OF SATM FOR STUDENTS INTENDING TO MAJOR IN MATH, SCIENCE, AND ENGINEERING FIELDS
(OTHER STUDENTS)
INTENDEDMAJOR FIELD
MATH & STATISTICS
COMPUTER SCIENCE
PHYSICAL SCIENCES
ARCHITECTURE/ENVIR. ENG.
ENGINEERING
LIFE SCIENCES
EARTH & ENVIRONMENTAL SCI.
PSYCHOLOGY
SOCIAL SCIENCES
INTERDISCIPL./OTHER SCIENCES
TOTAL OF SCIENCE,MATH & ENGINEERING
1
1 1975
115
129
121
113
126
118
111
109
120
128
124
1977
122
127
129
114
123
123
110
112
122
130
129
1978
124
129
130
119
127
124
107
108
120
128
130
1979
129
126
133
117
124
123
105
107
121
129
129
TEST
1980
131
126
131
113
123
125
107
107
122
130
128
YEAR
1981
133
124
126
115
121
126
108
106
123
127
127
1982
129
124
125
116
123
127
105
105
123
131
127
1983
134
125
132
116
125
128
107
110
123
138
129
1984
129
124
132
119
125
130
110
108
124
131
129
1985
125
127
123
114
125
131
112
108
125
130
130
1
1986 1
131
133
130
116
128
132
112
109
128
135
133

I
MEAN SATM OF STUDENTS INTENDING TO MAJOR IN MATH, SCIENCES AND ENGINEEENG FIELDS
INTENDEDMAJOR FIELD
MATH & STATISTICSC.. ..COMPUTER SCIENCE
PHYSICAL SCIENCES
ASTRONOMYCHEMISTRYPHYSICS
ARCHITECTURE /ENVIR. ENG.
ENGINEERING.
AEROSPACE ENGINEERINGELECTRICAL ENGINEERINGCHEMICAL ENGINEERINGMECHANICAL ENGINEERINGCIVIL ENGINEERINGOTHER ENGINEERING
LIFE SCIENCES
I RICULTUREBIOLOGICAL SCIENCES
EARTH & ENVIRONMENTAL SCI.
PSYCHOLOGY'
CHILD PSYCHOLOGYGENERAL PSYCHOLOGYSOCIAL PSYCHOLOGY
SOCIAL SCIENCES
ECONOMICSINTERNATIONAL RELATIONSLAW EFORCEMENTPOLITICAL SCIENCESOCIOLOGY-OTHER SOCIAL SCIENCES
INIMISCIPL./OTHER SCIENCES
TOTAL OF SCIENCE,MOTH & ENGINEERING
1 1975
584
524
558572638
509
522527598524547554
462523
500
432469453
556514428
0
0
493
569
520
1977
588
529
571573640
506
533534606530545560
458520
501
428467444
560525421514425459
593
514
1978
585
522
556567634
501
529528597526542553
447517
495
419463441
551517414503424453
585
509
(ALL STUDENTS/
TEST
1979 1980
580 577
517 513
549 554562 561634 629
496 492
528 529526 524586 587524 522533 529550 547
443 438513 511
490 489
418 420460 459442 441
557 558519 519410 409498 497426 426454 456
578 574
507 507
YEAR
1981
572
507
547556625
489
u.29
526583521526545
439510
486
419460441
553520406497426453
575
507
1982
569
502
555556629
487
536530583522528546
4.6509
485
418459440
553519405498424457
572
508
1983
572
497
554558628
486
538531585525529549
435514
485
422462444
562527404499434463
572
509
1984
578
496
553557628
486
541541586528529554
431519
485
427465447
560528407503425467
575
511
1985
578
501
555562631
491
547543585533532554
433523
487
433968449
564541413508435469
575
514
1986 1
593
489
578572641
494
555543589543533559
436524
489
42846345)
576546408515429467
589
513

MEAN SATM OF STUDENTS INTENDING TO MAJOR IN MATH, SCIENCE, AND ENGINEERNG FIELDS
INTENDED1
(WHITE MALES)
TEST YEAR 1
MAJOR FIELD I 1975 1977 1978 1979 1980 1981 1982 1983 1984 1985 1986 I
MATH & STATISTICS 606 617 617 614 608 604 600 601 605 608 621
',COMPUTER SCIENCE 556 567 562 554 551 544 540 534 533 540 538
PHYSICAL SCIENCES
ASTRONOMY 572 585 570 563 575 562 572 569 570 567 592CHEMISTRY 591 594 592 583 583 578 583 584 582 583 593PHYSICS 647 648 646 643 638 633 639 639 638 644 650
ARCHITECTURE/ENVIR. ENG. 517 519 514 510 505 502 501 498 496 502 505
-ENGINEERING
AEROSPACE ENGINEERING 533 545 543 542 541 542 550 550 553 559 569ELECTRICAL ENGINEERING 545 550 546 542 541 542 546 548 555 560 565CHEMICAL ENGINEERING 613 620 613 604 605 602 604 606 605 605 613MECHANICAL ENGINEERING 537 543 539 537 533 533 536 538 540 545 554CIVIL ENGINEERING 554 552 553 544 540 537 540 539 539 543 544OTHER ENGINEERING 560 569 563 558 557 554 557 560 563 565 576
LIFE SCIENCES
AGRICULTURE 467 467 456 452 445 448 444 441 437 437 443BIOLOGICAL SCIENCES 544 546 541 536 534 534 5:44 539 542 544 551
EARTH & ENVIRONMENTAL SCI. 508 510 505 500 499 497 496 494 493 497 501
PSYCHOLOGY
CHILD PSYCHOLOGY 471 463 447 455 450 4F2 453 450 457 455 466GENERAL PSYCHOLOGY 504 510 504 502 498 49e 497 498 495 500 503SOCIAL PSYCHOLOGY 494 487 483 493 483 484 486 479 480 496 502
SOCIAL SCIENCES
ECONOMICS 574 586 580 579 576 576 572 584 578 584 598INTERNATIONAL RELATIONS 543 560 552 554 548 545 553 568 557 572 575LAW ENFORCEMENT 461 438 431 426 425 424 421 417 423 428 430POLITICAL SCIENCE 0 544 536 530 529 526 526 529 531 535 544SOCIOLOGY 0 477 473 475 474 473 467 463 467 479 490OTHER SOCIAL SCIENCES 517 511 504 503 502 499 502 505 505 508 509
INTERDISCIPL./OTHER SCIENCES 584 610 SO5 596 592 590 591 591 593 591 601
TOTAL OF SCIENCE,MATH & ENGINEERING 543 545 541 538 537 536 538 538 539 543 545
143 10-B 144

MEAN SATM OF STUDENTS INTENDING TO MAJOR IN MATH, SCIENCE, AND ENGINEERNG FIELDS(WHITE FEMALES)
INTENDEDTEST YEAR
MAJOR FIELD 1975 1977 1978 1979 1980 1981 1982 1983 1984 1985 1986
;MATH & STATISTICS 577 57$ 578 570 572 5E6 564 568 575 575 585
{:COMPUTER SCIENCE 531 534 525 521 517 508 501 495 493 495 481
';PHYSICAL SCIENCES
'ASTRONOMY 525 553 538 531 534 523 534 532 542 554 564CHEMISTRY 565 562 556 555 553 546 543 547 548 555 564PHYSICS 609 621 609 620 610 604 599 603 608 597 618
=ARCHITECTURE/ENVIR. ENG. 526 521 518 514 509 506 501 503 508 511 510
:''ENGINEERING
AEROSPACE ENGINEERING 544 541 533 530 535 533 534 545 554 552 558ELECTRICAL ENGINEERING 5E6 581 568 576 570 562 565 568 577 573 571CHEMICAL ENGINEERING 605 608 603 586 591 581 582 583 589 585 584MECHANICAL ENGINEERING 568 559 554 551 549 551 551 552 554 561 566CIVIL ENGINEERING 574 582 568 556 561 545 552 550 555 564 568OTHER ENGINEERING 589 589 585 578 575 571 567 570 579 580 579
:LIFE SCIENCES
AGRICULTURE 462 456 449 443 440 439 435 436 433 439 436BIOLOGICAL SCIENCES 513 518 517 512 511 509 509 512 521 524 522
;EARTH & ENVIRONMENTAL SCI. 491 491 488 482 482 480 475 479 481 482 483
,PSYCHOLOGY
CHILD PSYCHOLOGY 449 447 439 436 438 434 429 433 438 440 440GENERAL PSYCHOLOGY 470 470 469 465 464 465 461 464 469 471 465SOCIAL PSYCHOLOGY 458 449 448 448 449 446 443 447 452 451 450
,SOCY4L SCIENCES
ECONOMICS 549 545 533 542 555 539 540 544 552 555 563INTERNATIONAL RELATIONS 515 517 515 515 521 518 517 518 526 536 542LAW ENFORCEMENT 446 419 411 410 408 405 400 404 407 411 411POLITICAL SCIENCE 0 506 497 494 495 492 493 496 497 503 507SOCIOLOGY 0 447 444 443 446 439 439 445 437 443 437OTHER SOCIAL SCIENCES 485 461 458 456 458 455 458 463 467 470 465
AUNTEEPASRIPL./OTHER SCIENCES 544 573 563 559 552 560 553 556 561 567 577
TOTAL OF SCIENCE,MATH & ENGINEERING 505 498 494 493 495 494 495 497 501 501 496
I
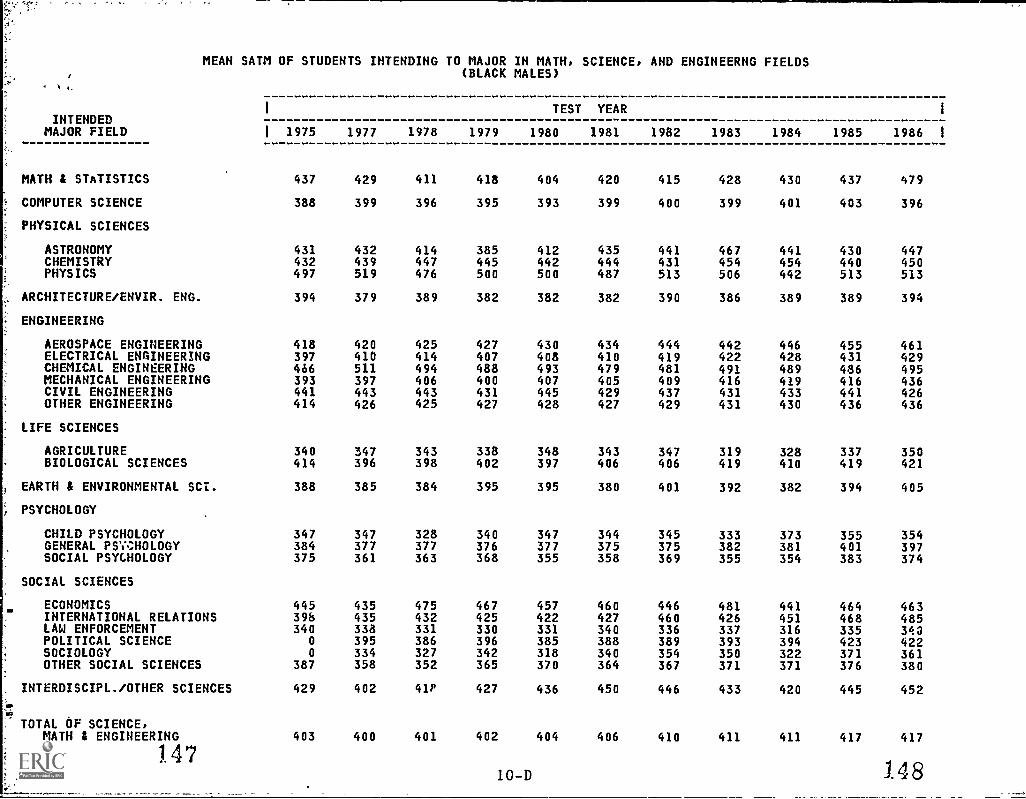
MEAN SATM OF STUDENTS INTENDING TO MAJOR IN MATH, SCIENCE, AND ENGINEERNG FIELDSi
' 1 4,
INTENDEDMAJOR FIELD
MATH & STATISTICS
COMPUTER SCIENCE
PHYSICAL SCIENCES
ASTRONOMYCHEMISTRYPHYSICS
ARCHITECTURE/ENVIR. ENG.
ENGINEERING
AEROSPACE ENGINEERINGELECTRICAL ENGINEERINGCHEMICAL ENGINEERINGMECHANICAL ENGINEERINGCIVIL ENGINEERINGOTHER ENGINEERING
LIFE SCIENCES
AGRICULTUREBIOLOGICAL SCIENCES
EARTH & ENVIRONMENTAL SCI.
PSYCHOLOGY
CHILD PSYCHOLOGYGENERAL PSY.NOLOGYSOCIAL PSYCHOLOGY
SOCIAL SCIENCES
ECONOMICSINTERNATIONAL RELATIONSLAW ENFORCEMENTPOLITICAL SCIENCESOCIOLOGYOTHER SOCIAL SCIENCES
INTERDISCIPL./OTHER SCIENCES
TOTAL OF SCIENCE,MATH & ENGINEERING
1
1 1975
437
388
431432497
394
418397466393441414
340414
388
347384375
4453915
3400
0
387
429
403
1977
429
399
432439519
379
420410511397443426
347396
385
347377361
435435338395334358
402
400
1978
411
396
414447476
389
425414494406443425
343398
384
328377363
475432331386327352
41P
401
(BLACK MALES)
TEST
1979 1980
418 404
395 393
385 412445 442500 500
382 382
427 430407 408488 493400 407431 445427 428
338 348402 397
395 395
340 347376 377368 355
467 457425 422330 331396 385342 318365 370
427 436
402 404
YEAR
1981
420
399
435444487
382
434410479405429427
343406
380
344375358
460427340388340364
450
406
1982
415
400
441431513
390
444419481409437429
347406
401
345375369
446460336389354367
446
410
1983
428
399
467454506
386
442422491416431431
319419
392
333382355
481426337393350371
433
411
1984
430
401
441454442
389
446428489419433430
328410
382
373381354
441451316394322371
420
411
1985
437
403
430440513
389
455431486416441436
337419
394
355401383
464468335423371376
445
417
I
1986 1
479
396
447450513
394
461429495436426436
350421
405
354397374
463485340422361380
452
417
14710-D 148

'LEAN SATM OF STUDENTS INTENDING TO MAJOR IN MATH,(BLACK FEMALES)
TESTINTENDED
SCIENCE,
YEAR
AND ENGINEERNG FIELDS
MAJOR FIELD I 1975 1977 1978 1979 1980 1981 1982 1983 1984 1985 1986
MATH $ STATISTICS 424 415 416 404 410 414 417 429 435 435 459
COMPUTER SCIENCE 369 370 369 366 374 372 375 369 371 371 361
PHYSICAL SCaNCES
ASTRONOMY 370 454 420 355 362 364 346 400 460 330 473CHEMISTRY 410 404 398 401 414 403 420 424 418 429 427PHYSICS 398 439 434 431 428 500 425 474 451 468 508
ARCHITECTURE/ENVIR. ENG. 411 382 392 392 380 385 380 393 395 396 395
ENGINEERING
AEROSPACE ENGINEERING 371 449 420 433 414 421 429 438 428 440 444ELECTRICAL ENGINEERING 423 433 436 415 418 431 422 429 442 438 430CHEMICAL ENGINEERING 463 469 463 440 456 446 451 459 466 463 458MECHANICAL ENGINEERING 440 482 427 416 424 421 411 422 435 434 429CIVIL ENGINEERING 438 469 407 440 423 422 417 434 416 422 441OTHER ENGINEERING 450 468 445 450 450 436 438 443 460 446 434
LIFE SCIENCES
AGRICULTURE 361 355 324 346 328 340 358 339 380 348 360BIOLOGICAL SCIENCES 392 379 380 385 388 391 389 396 406 412 398
EARTH & ENVIRONMENTAL SCI. 395 398 377 398 388 375 379 391 398 373 376
PSYCHOLOGY
CHILD PSYCHOLOGY 351 340 335 339 340 342 346 341 348 354 356GENERAL PSYCHOLOGY 367 363 363 355 363 365 367 370 374 379 376SOCIAL PSYCHOLOGY 358 358 353 351 346 349 351 356 359 367 378
SOCIAL SCIENCES
ECONOMICS 393 373 393 391 410 390 416 433 445 418 428INTERNATIONAL RELATIONS 382 416 396 399 417 425 417 426 459 426 452LAW ENFORCEMENT 336 316 317 319 320 316 331 320 324 321 328POLITICAL SCIENCE 0 375 363 361 370 370 373 362 376 384 384SOCIOLOGY 0 326 329 332 337 330 338 341 327 350 327OTHER SOCIAL SCIENCES 367 330 332 334 334 333 338 348 354 349 340
.
tIFITERDIICAPC1./OTHER SCIENCES 384 384 385 372 394 413 392 420 404 401 463P %
TOTAL OF SCIENCE,MATH & ENGINEERING 381 367 365 367 374 375 381 382 387 388 382
I

OW
MEAN SATM OF STUDENTS INTENDING TO MAJOR IN MATH, SCIENCE, AND ENGINEERNG FIELDS(OTHER STUDENTS)
INTENDEDTEST YEAR
MAJOR FIELD I 1975 1977 1978 1979 1980 1981 1982 1983 1984 1985 1986 I
MATH & STATISTICS 573 574 557 557 553 546 546 549 549 552 571
COMPUTER SCIENCE 510 506 499 494 492 492 484 480 478 482 469
PHYSICAL SCIENCES
ASTRONOMY 550 534 535 537 511 527 520 529 519 528 551CHEMISTRY 558 550 548 550 538 538 533 545 541 557 569PHYSICS 631 629 613 613 620 625 629 617 622 623 640
ARCHITECTURE/ENVIR. ENG. 493 482 473 468 474 470 466 465 467 471 476
ENGINEERING
AEROSPACE ENGINEERING 502 502 493 501 506 501 499 507 515 519 528ELECTRICAL ENGINEERING 514 520 508 511 515 522 524 520 537 536 534CHEMICAL ENGINEERING 579 585 566 568 564 574 563 560 572 568 570MECHANICAL ENGINEERING 499 507 492 499 504 497 498 499 504 517 533CIVIL ENGINEERING 537 532 525 522 513 514 511 521 520 516 516OTHER ENGINEERING 541 543 533 532 530 527 528 531 533 534 539
LIFE SCIENCES
AGRICULTURE 444 436 416 421 414 405 411 419 405 408 417BIOLOGICAL SCIENCES 513 504 501 499 499 497 498 506 510 516 519
EARTH & ENVIRONMENTAL SCI. 494 478 462 468 460 462 456 455 459 465 467
PSYCHOLOGY
CHILD PSYCHOLOGY 418 409 393 390 392 395 398 405 400 404 398GENERAL PSYCHOLOGY 455 444 432 431 434 434 435 439 442 443 443SOCIAL PSYCHOLOGY 434 419 416 413 430 417 420 425 427 427 432
SOCIAL SCIENCES
ECONOMICS 527 545 531 550 549 551 554 566 551 556 577INTERNATIONAL RELATIONS 482 500 467 488 482 498 489 508 490 515 522LAW ENFORCEMENT 381 385 378 375 381 372 373 379 373 384 379POLITICAL SCIENCE 0 490 431 479 475 474 475 463 482 473 486SOCIOLOGY 0 405 415 422 410 424 409 437 42b 418 419OTHER SOCIAL SCIENCES 478 433 424 428 435 431 430 432 442 440 446
INTERDISCIPL./OTHER SCIENCES 561 581 567 566 568 572 559 555 563 559 592
TGTAL OF SCIENCE,MATH & ENGINEERING 508 495 486 489 492 493 493 494 497 500 502
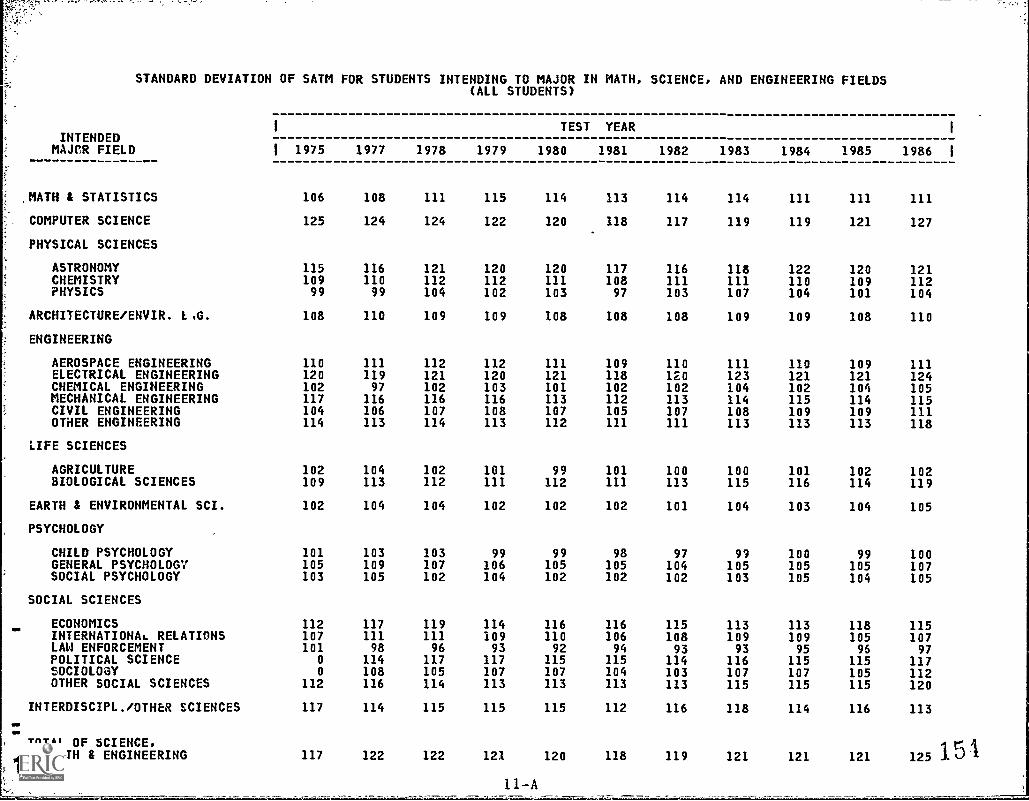
STANDARD DEVIATION OF SATM FOR STUDENTS INTENDING TO MAJOR IN MATH, SCIENCE, AND ENGINEERING FIELDS
INTENDEDMAJCR FIELD
MATH & STATISTICS
COMPUTER SCIENCE
PHYSICAL SCIENCES
ASTRONOMYCHEMISTRYPHYSICS
ARCHITECTURE/ENVIR. LIG.
ENGINEERING
AEROSPACE ENGINEERINGELECTRICAL ENGINEERINGCHEMICAL ENGINEERINGMECHANICAL ENGINEERINGCIVIL ENGINEERINGOTHER ENGINEERING
LIFE SCIENCES
AGRICULTUREBIOLOGICAL SCIENCES
EARTH & ENVIRONMENTAL SCI.
PSYCHOLOGY
CHILD PSYCHOLOGYGENERAL PSYCHOLOGYSOCIAL PSYCHOLOGY
SOCIAL SCIENCES
ECONOMICSONO
INTERNATIONAL RELATIONSLAW ENFORCEMENTPOLITICAL SCIENCESOCIOLOGYOTHER SOCIAL SCIENCES
INTERDISCIPL./OTHER SCIENCES
UN,
TOTAL OF SCIENCE,52rATH & ENGINEERING
1
1 1975
106
125
11510999
108
110120102117104114
102109
102
101105103
112107101
0
0
112
117
117
1977
108
124
11611099
110
11111997
116106113
104113
104
103109105
11711198
114108116
114
122
1978
111
124
121112104
109
112121102116107114
102112
104
103107102
11911196
117105114
115
122
(ALL STUDENTS)
TEST
1979 1980
115 114
122 120
120 120112 111102 103
109 108
112 111120 121103 101116 113108 107113 112
101 99111 112
102 102
99 99106 105104 102
114 116109 11093 92
117 115107 107113 113
115 115
121 120
YEAR
1981
113
118
11710897
108
109118102112105111
101111
102
98105102
11610694
115104113
112
118
1982
114
117
116111103
108
110120102113107111
100113
101
97104102
11510893
114103113
116
119
1983
114
119
118111107
109
111123104114108113
100115
104
99105103
11310993
116107115
118
121
1984
111
119
122110104
109
110121102115109113
101116
103
100105105
11310995
115107115
114
121
1985
111
121
120109101
108
109121104114109113
102114
104
99105104
11810596
115105115
116
121
1986
111
127
121112104
110
111124105115111118
102119
105
100107105
11510797
117112120
113
125
11-A
1
1

OM
INTENDEDMAJOR FIELD
STANDARD DEVIATION OF SATM FOR STUDENTS INTENDING TO MAJOR IN MATH, SCIENCE, AND ENGINEERING FIELDS(WHITE MALES)
MATH & STATISTICS
COMPUTER SCIENCE
PHYSICAL SCIENCES
ASTRONOMYCHEMISTRYPHYSICS
ARCHITECTURE/ENVIR. ENG.
ENGINEERING
AEROSPACE ENGINEERINGELECTRICAL ENGINEERINGCHEMICAL ENGINEERINGMECHANICAL ENGINEERINGCIVIL ENGINEERINGOTHER ENGINEERING
LIFE SCIENCES
AGRICULTUREBIOLOGICAL SCIENCES
EARTH & ENVIRONMENTAL SCI.
PSYCHOLOGY
CHILD PSYCHOLOGYGENERAL PSYCHOLOGYSOCIAL PSYCHOLOGY
SOCIAL SCIENCES
ECONOMICSINTERNATIONAL RELATIONSLAW ENFORCEMENTPOLITICAL SCIENCESOCIOLOGYOTHER SOCIAL SCIENCES
INTERDISCIPL./OTHER SCIENCES
TOTAL OF SCIENCE,MATH & ENGINEERING
1 TEST YEAR 1
1 1975 1977 1978 1979 1980 1981 1982 1983 1984 1985 198A 1
102 101 102 105 105 106 1.0 109 107 106 106
116 112 112 113 110 109 110 111 110 111 114
109 110 117 116 111 112 114 114 119 116 117100 100 101 103 102 99 102 103 101 103 10592 93 93 94 96 92 96 99 96 92 96
104 104 102 102 102 102 102 104 104 103 105
104 105 106 106 105 104 104 106 105 104 104111 111 112 112 112 110 111 115 113 112 11393 90 92 95 92 92 92 94 93 94 93
108 108 109 109 107 105 106 107 108 107 10898 100 98 101 101 98 99 102 102 102 106
109 108 108 109 107 106 107 109 108 108 110
101 105 102 101 98 101 100 99 99 101 10210o 108 108 108 108 107 108 111 111 103 112
101 103 103 101 101 101 101 102 102 104 105
106 103 103 100 103 98 104 105 101 106 105105 109 108 106 104 106 104 107 106 106 108104 111 103 109 104 106 104 105 103 105 110
108 110 105 108 111 107 109 111 107 110 109108 109 114 106 112 105 109 103 108 103 10693 97 94 93 90 93 93 91 94 94 970 108 1..2 111 111 113 109 113 111 113 1130 107 108 114 108 109 115 111 109 108 118
112 115 111 112 111 113 112 115 114 114 119
112 105 106 110 108 108 108 110 108 111 108
112 115 115 115 113 112 112 115 114 '14 117

STANDARD DEVIATION OF SATM FOR STUDENTS INTENDING TO MAJOR IN MATH, SCIENCE, AND ENGINEERING FIELDS
INTENDED
(WHITE FEMALES)
TEST YEAR
MAJOR FIELD I 1975 1977 1978 1979 1980 1981 1982 1983 1984 1985 1986
'MATH & STATISTICS 90 90 93 95 95 95 96 97 95 95 96
COMPUTER SCIENCE 105 101 103 101 100 100 100 103 103 104 110
'PHYSICAL SCIENCES
ASTRONOMY 112 103 115 108 112 110 106 114 111 112 113CHEMISTRY 100 100 102 101 100 98 100 100 99 99 100PHYSICS 101 92 98 96 93 91 99 105 93 100 109
ARCHITECTURE/ENVIR. ENG. 102 97 150 97 98 98 99 100 103 101 101
ENGINEERING
AEROSPACE ENGINEERING 106 101 103 105 101 97 103 100 99 98 104ELECTRICAL ENGINEERING 92 102 102 97 97 102 98 101 97 99 100CHEMICAL ENGINEERING 86 85 88 37 90 88 87 90 89 88 91MECHANICAL ENGINEERING 102 101 102 101 104 100 99 95 105 98 102CIVIL ENGINEERING 88 92 91 91 90 87 91 94 97 92 95OTHER ENGINEERING 98 87 91 91 93 89 92 94 92 91 96
LIFE SCIENCES
AGRICULTURE 99 100 98 97 96 95 96 97 100 99 99BIOLOGICAL SCIENCES 102 103 103 102 103 103 104 107 108 105 109
EARTH & ENV.L.ONMENTAL SCI. 97 99 99 96 97 98 95 102 101 100 100
PSYCHOLOGY
CHILD PSYCHOLOGY 95 97 97 94 94 94 93 94 98 96 97GENERAL PSYCHOLOGY 97 99 98 98 98 97 99 99 100 100 101SOCIAL PSYCHOLOGY 94 97 96 95 97 95 96 97 101 98 99
SOCIAL SCIENCES
ECONOMICS 92 99 109 102 105 103 103 101 105 111 103INTERNATIONAL RELATIONS 96 103 97 97 101 96 96 101 102 97 97LAW ENFORCEMENT 97 94 90 88 89 89 89 90 90 90 91POLITICAL SCIENCE 0 98 99 104 99 100 102 102 104 102 105SOCIOLOGY 0 98 92 97 97 96 94 96 99 97 100OTHER SOCIAL SCIENCES 100 103 101 100 102 100 103 105 106 105 111
INTERDISCIPL./OTHER SCIENCES 110 107 107 104 110 102 109 109 107 106 106
_TOTAL OF SCIENCE,TH & ENGINEERING 106 110 110 109 109 107 108 110 111 110 114
1_ 5

STANDARD DEVIATION OF SATM FOR STUDENTS INTENDING TO MAJOR IN MATH, SCIENCE, AND ENGINEERING FIELDS
INTENDEDMAJOR FIELD
.;.
:-. MATH & STATISTICS
COMPUTER SCIENCE
PHYSICAL SCIENCES
ASTRONOMYCHEMISTRYPHYSICS
ARCHITECTURE/ENVIR. iNG.
ENGINEERING
AEROSPACE ENGINEERINGELECTRICAL ENGINEERINGCHEMICAL ENGINEERINGMECHANICAL ENGINEERINGCIVIL ENGINEERINGOTHER ENGINEERING
LIFE SCIENCES
AGRICULTUREBIOLOGICAL SCIENCES
EARTH & ENVIRONMENTAL SCI.
PSYCHOLOGY
CHILD PSYCHOLOGYGENERAL PSYCHOLOGYSOCIAL PSYCHOLOGY
SOCIAL SCIENCES
ECONOMICS111
INTERNATIONAL RELATIONSLAW ENFORCEMENTPOLITICAL SCIENCESOCIOLOGYOTHER SOCIAL SCIENCES
INTERDISCIPL./OTHER SCIENCESMO
- TOTAL OF SCIENCE,MATH & ENGIIICEUNG
1 1975
115
95
103105103
96
10496
102104109108
83102
94
769892
13589580
0
100
112
104
1977
108
102
113106106
92
105103101102111117
76102
94
809680
12011070
1007191
107
106
1978
116
101
124112139
99
107110106111106316
89103
99
719796
13312567
1016790
127
109
(BLACK MALES)
TEST
1979 1980
111 103
98 95
111 117101 116124 137
95 97
102 102105 103113 99103 107101 101114 109
85 99103 99
103 100
87 8595 8395 73
126 136112 12771 67100 9277 6298 106
106 113
106 105
YEAR
1981
118
102
123125103
98
103108114102107113
100107
90
779392
13712574966098
114
108
1982
4
98
11197137
96
107107104107106111
96107
101
808599
12212975977894
123
106
1983
116
96
126103119
92
106111105107100108
82109
94
699986
12812170104101100
139
106
1984
113
100
130101121
97
106112109114107114
78110
102
849196
11612566
10464
101
117
103
1985
112
101
128101116
97
110112109114105113
83109
96
809588
134127721159099
129
109
1986
120
99
12198
114
94
109108116117107115
84112
93
91101115
12812078
11385102
115
110
11-D160
1
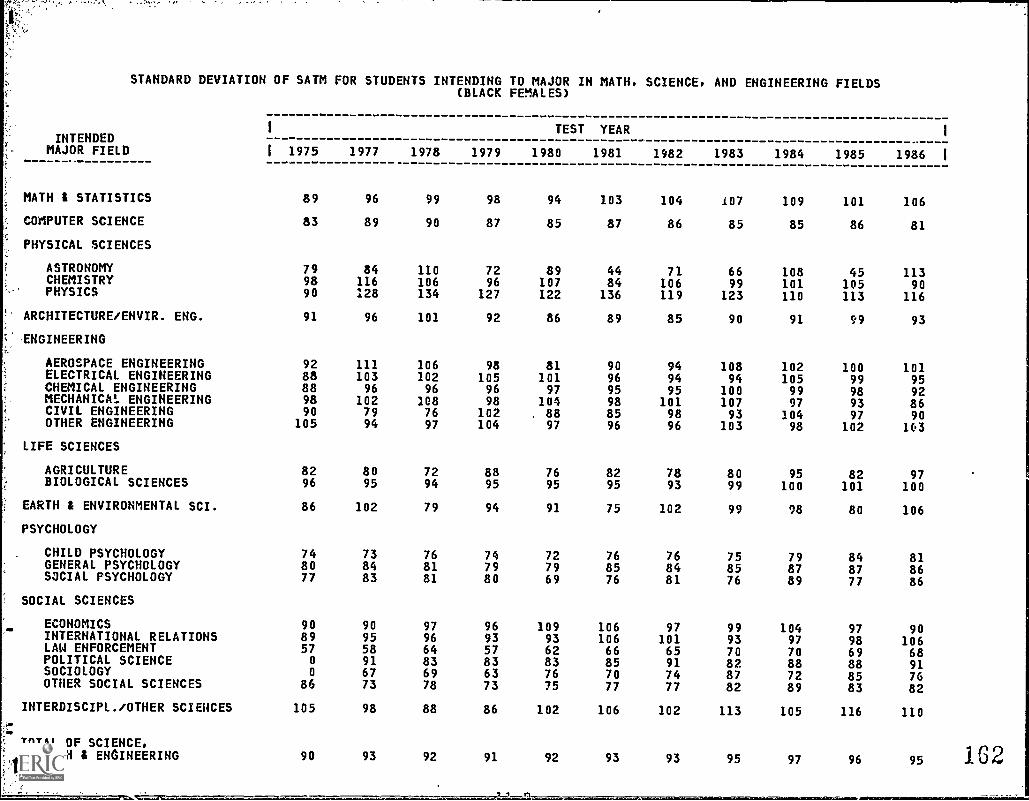
STANDARD DEVIATION OF SATM FOR STUDENTS INTENDING TO MAJOR IN MATH, SCIENCE, AND ENGINEERING FIELDS(BLACK FEMALES)
INTENDEDMAJOR FIELD
MATH I STATISTICS
COMPUTER SCIENCE
PHYSICAL SCIENCES
ASTRONOMYCHEMISTRYPHYSICS
ARCHITECTURE/ENVIR. ENG.
ENGINEERING
AEROSPACE ENGINEERINGELECTRICAL ENGINEERINGCHEMICAL ENGINEERINGMECHANICA. ENGINEERINGCIVIL ENGINEERINGOTHER ENGINEERING
LIFE SCIENCES
AGRICULTUREBIOLOGICAL SCIENCES
EARTH & ENVIRONMENTAL SCI.
PSYCHOLOGY
CHILD PSYCHOLOGYGENERAL PSYCHOLOGYSOCIAL PSYCHOLOGY
SOCIAL SCIENCES
ECONOMICSINTERNATIONAL RELATIONSLAW ENFORCEMENTPOLITICAL SCIENCESOCIOLOGYOTHER SOCIAL SCIENCES
INTERDISCIPL./OTHER SCIENCES
TOTAL OF SCIENCE,1111ATH & ENGINEERING
I.0 1
1
1 1975
89
83
799890
91
9288889890
105
8296
86
748077
90895700
86
105
90
1977
96
89
84116128
96
11110396
1027994
8095
102
738483
909558916773
98
93
1978
99
90
110106134
101
10610296
1087697
7294
79
768181
979664836978
88
92
1979
98
87
7296
127
92
981059698
102104
8895
94
747980
969357836373
86
91
TEST
1980
94
85
89107122
86
8110197
104. 88
97
7695
91
727969
1099362837675
102
92
YEAR
1981
103
87
4484136
89
909695988596
8295
75
768576
10610666857077
106
93
1982
104
86
71106119
85
949495
1019896
7893
102
768481
9710165917477
102
93
1983
107
85
6699
123
90
10894
10010793
103
8099
99
758576
999370828782
113
95
1984
109
85
108101110
91
1021059997
10498
95100
98
798789
1049770887289
105
97
1985
101
86
45105113
99
10099989397102
82101
80
848777
979869888583
116
96
1
1986 1
106
81
11390
116
93
10195928690
163
97100
106
818686
9010668917682
110
95 162

t. I
STANDARD DEVIATION OF SATM FOR STUDENTS INTENDING TO MAJOR IN MATH, SCIENCE, AND ENGINEERING FIELDS
t
INTENDEDMAJOR FIELD
MATH & STATISTICS
COMPUTER SCIENCE
PHYSICAL SCIENCES
ASTRONOMYCHEMISTRYPHYSICS
ARCHITECTURE/ENVIR. ENG.
ENGINEERING
AEROSPACE ENGINEERINGELECTRICAL ENGINEERINGCHEMICAL ENGINEERINGMECHANICAL ENGINEERINGCIVIL ENGINEERINGOTHER ENGINEERING
LIFE SCIENCES
AGRICULTUREBIOLOGICAL SCIENCES
EARTH & ENVIRONMENTAL SCI.
PSYCHOLOGY
CHILD PSYCHOLOGYGENERAL PSYCHOLOGYSOCIAL PSYCHOLOGY
SOCIAL SCIENCES
ECONOMICSNNW
INTERNATIONAL RELATIONSLAW ENFORCEMENTPOLITICAL SCIENCESOCIOLOGYOTHER SOCIAL SCIENCES
INiERDISCIPL./OTHER SCIENCESMI.NI
TOTAL OF SCIENCE,MATH & ENGINEERING
I
1 1975
115
129
130116106
113
119123113137124125
105117
111
104110100
111.;
113930
0
119
128
124
1977
122
127
140125114
114
120126105126118121
112122
110
102115106
12311593
124108118
130
129
1978
124
129
123126125
119
121130119126127124
101123
107
10111099
13511996124111115
128
130
(OTHER STUDENTS)
TEST
1979 1980
129 131
126 126
131 129129 125127 118
117 113
121 123127 128110 114125 120124 119122 121
101 102123 124
105 107
100 94109 110107 102
120 120125 11286 90123 120114 108117 120
129 130
129 128
YEAR
1981
133
124
125124107
115
115/24112119119120
105124
108
100108103
12511890
121108116
127
127
1982
129
124
119122107
116
117128115121119122
102126
105
9910899
12812187
120101117
131
127
1983
1s4
125
129126126
116
118130119125120123
108126
107
104111106
11711891
120118115
138
.,
1984
129
124
1321.26
121
119
119130112126118123
108128
110
96110108
11911588
122115120
131
129
1985
125
127
128116117
114
120131120124120123
110128
112
101110106
12711895
121106119
130
130
1
1986 1
131
133
129131115
X16
121132120126117127
105130
112
98110105
11712290
i21121125
135
133
163 11-F 164

C
MEAN GRADE IN MATHEMATICS (0.0 - 4.0 SCALE) OF STUDENTS INTENDING TO MAJOR IN MATH SCIENCE AND ENGINEERING FIELDS
(ALL STUDENTS)
I TEST YEAR1INTENDED
MAJOR FIELD 1 1975 1977 1978 1979 1980 1981 1982 1983 1984 1985 1986 1
MATH & STATISTICS 3.66 3.68 3.66 3.63 3.61 3.61 3.59 3.59 3.61 3.59
COMPUTER SCIENCE 3.19 3.25 3.23 3.21 3.18 3.16 3.14 3.10 3.06 3.04
PHYSICAL SCIENCES 3.38 3.39 3.38 3.34 3.33 3.33 3.32 3.32 3.32 3.33
ARCHITECTURE/EMVIR. ENG. 2.89 2.94 2.92 2.91 2.89 2.88 2.86 2.85 2.84 2.83
ENGINEERING 3.17 3.21 3.20 3.19 3.18 3.19 3.21 3.22 3.23 3.23
LIFE SCIENCES 2.98 2.95 2.93 2.93 2.92 2.91 2.92 2.94 2.95 2.98
EARTH & ENVIRONMENTAL SCI. 2.80 2.84 2.83 2.79 2.77 2.76 2.76 P.76 2.73 2.75
PSYCHOLOGY 2.72 2.71 2.70 2.70 2.68 2.69 2.67 2.67 2.67 2.67
SOCIAL SCIENCES 2.82 2.72 2.69 2.70 2.69 2.69 2.70 2.71 2.69 2.70
INTERDISCIPL./OTHER SCIENCES 3.25 3.37 3.33 3.28 3.26 3.29 3.25 3.27 3.28 3.28
TOTAL OF SCIENCE,MATH & ENGINEERING 3.04 3.02 3.01 3.01 3.01 3.01 3.04 3.05 3.03 3.02
12-A
165

MEAN GRADE IN MATHEMATICS (0.0 4.0
1
IPfENDEDMAJOR FIELD 1 1975
MATH & STATISTICS 3.63
COMPUTER SCIENCE 3.20
PHYSICAL SCIENCES 3.39
ARCHITECTURE/ENVIR ENG. 2.87
ENGINEERING 3.18
LIFE SCIENCES 2.95
EARTH & ENVIRONMENTAL SCI. 2.76
PSYCHOLOGY 2.69
SOCIAL SCIENCES 2.82
INTERDISCIPL./OTHER SCIENCES 3.25
TOTAL OF SCIENCE,MATH & ENGINEERING 3.06
SCALE) OF STUDENTS INTENDING TO MAJOR IN MATH SCIENCE AND ENGINEERING FIELDS
(WHITE MALES)
TEST YEAR
1977 1978 1979 1980 1981 1982 1983 1984 1985 1986
3.65 3.64 3.61 3.58 3.59 3.55 3.56 3.56 3.54
3.26 3.25 3.20 3.17 3.16 3.14 3.09 3.06 3.06
3.41 3.39 3.35 3.34 3.33 3.33 3.32 3.32 3.34
2.93 2.91 2.89 2.87 2.86 2.83 2.82 2.81 2.79
3.20 3.19 3.18 3.17 3.17 3.19 3.20 3.21 3.21
2.91 2.86 2.86 2.85 2.85 2.86 2.88 2.86 2.90
2.81 2.80 2.76 2.74 2.73 2.72 2.72 2.68 2.69
2.70 2.70 2.69 2.65 2.65 2.64 2.61 2.60 2.62
2.73 2.69 2.69 2.69 2.69 2.69 2.68 2.67 2.66
3.38 3.35 3.27 3.25 3.28 3.24 3.25 3.23 3.25
3.07 3.07 3.05 3.05 3.06 3.07 3.07 3.06 3.06
1

MEAN GRADE IN MATHEMATICS (0.0 - 4.0 SCALE) OF STUDENTS INTENDING TO MAJOR IN MATH SCIENCE AND ENGINEERING FIELDS
(WHITE FEMALES)
I TEST YEAR 1
INTENDEDMAJOR FIELD 1 1975 1977 1978 1979 1980 1981 1982 1983 1984 1985 1986 1
MATH & STATISTICS 3.74 3.76 3.74 3.72 3.70 3.70 3.69 3.67 3.69 3.68
COMPUTER SCIENCE 3.44 3.46 3.43 3.42 3.38 3.35 3.31 3.27 3.23 3.22
PHYSICAL SCIENCES 3.45 3.45 3.43 3.43 3.38 3.40 3.35 3.39 3.39 3.35
ARCHITECTURE/ENVIR. ENG. 3.17 3.19 3.13 3.15 3.12 3.09 3.07 3.06 3.07 3.06
ENGINEERING 3.58 3.57 3.54 3.53 3.50 3.51 3.50 3.50 3.51 3.49
LIFE SCIENCES 3.06 3.04 3.03 3.02 3.02 3.01 3.01 3.03 3.04 3.07
EARTH & ENVIRONMENTAL SCI. 2.93 2.97 2.95 2.91 2.91 2.89 2.89 2.87 2.88 2.86
PSYCHOLOGY 2.80 2.79 2.78 2.77 2.76 2.75 2.73 2.74 2.74 2.73
SOCIAL SCIENCES 2.90 2.80 2.78 2.79 2.7P, 2.78 2.80 2.83 2.79 2.80
INTERDISCIPL./OTHER SCIENCES 3.34 3.41 3.37 3.36 3.31 3.35 3.34 3.34 3.35 3.36
TOTAL OF SCIENCE,MATH & ENGINEERING 3.08 3.04 3.1,3 3.04 3.05 3.06 3.08 3.09 3.07 3.04
i SJ 12-C 1 ;' 3
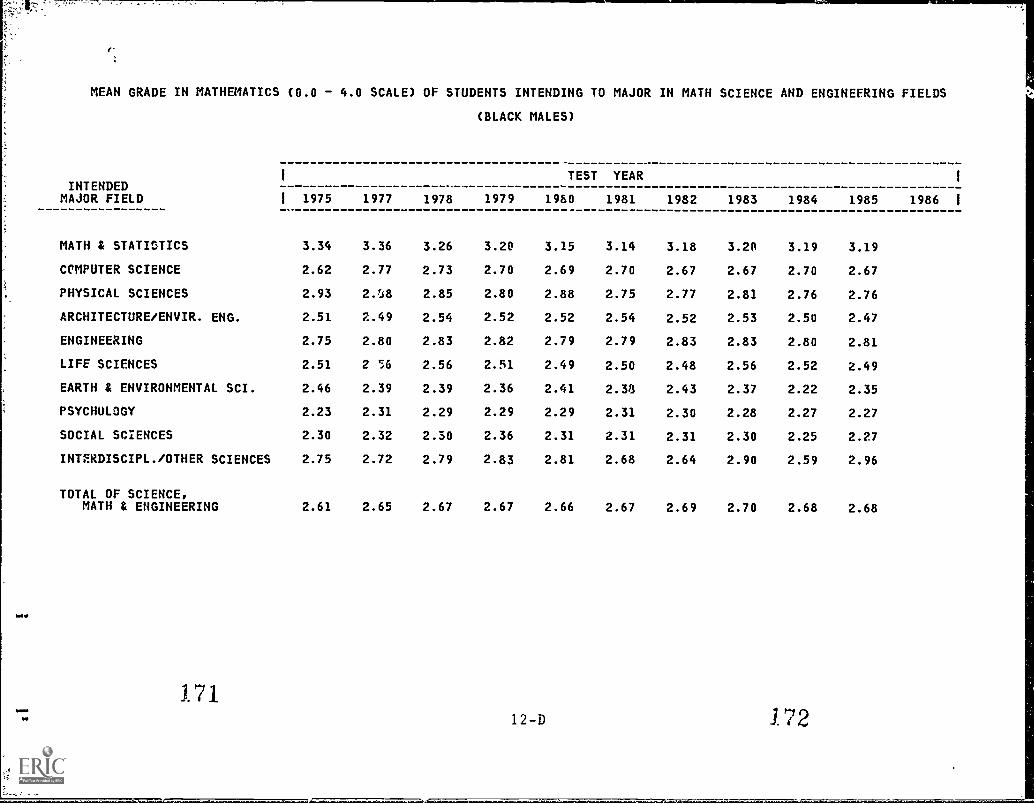
MEAN GRADE IN MATHEMATICS (0.0 - 4.0
INTENDED1
MAJOR FIELD 1 1975
MATH & STATISTICS 3.34
CCMPUTER SCIENCE 2.62
PHYSICAL SCIENCES 2.93
ARCHITECTURE/ENVIR. ENG. 2.51
ENGINEERING 2.75
LIFE SCIENCES 2.51
EARTH & ENVIRONMENTAL SCI. 2.46
PSYCHOLOGY 2.23
SOCIAL SCIENCES 2.30
INTERDISCIPL./OTHER SCIENCES 2.75
TOTAL OF SCIENCE,MATH & ENGINEERING 2.61
SCALE) OF STUDENTS INTENDING TO MAJOR IN MATH SCIENCE AND ENGINEERING FIELDS
(BLACK MALES)
TEST YEAR
1977 1978 1979 1980 1981 1982 1983 1984 1985 1986
3.36 3.26 3.20 3.15 3.14 3.18 3.2P 3.19 3.19
2.77 2.73 2.70 2.69 2.70 2.67 2.67 2.70 2.67
2.1i8 2.85 2.80 2.88 2.75 2.77 2.81 2.76 2.76
2.49 2.54 2.52 2.52 2.54 2.52 2.53 2.50 2.47
2.80 2.83 2.82 2.79 2.79 2.83 2.83 2.80 2.81
2 56 2.56 2.51 2.49 2.50 2.48 2.56 2.52 2.49
2.39 2.39 2.36 2.41 2.38 2.43 2.37 2.22 2.35
2.31 2.29 2.29 2.29 2.31 2.30 2.28 2.27 2.27
2.32 2.30 2.36 2.31 2.31 2.31 2.30 2.25 2.27
2.72 2.79 2.83 2.81 2.68 2.64 2.90 2.59 2.96
2.65 2.67 2.67 2.66 2.67 2.69 2.70 2.68 2.68
1

MEAN GRADE IN MATHEMATICS (0.0 - 4.0 SCALE) OF STUDENTS INTENDING TO MAJOR IN MATH SCIENCE AND ENGINEERING FIELDS
(BLACK FEMALES)
I TEST YEARI
INTENDEDMAJOR FIELD I 1975 1977 1978 1979 1980 1981 1982 1983 1984 1985 1986 I
MATH & STATISTICS 3.52 3.50 3.51 3.36 3.32 3.36 3.30 3.38 3.30 3.34
COMPUTER SCIENCE 2.81 2.83 2.89 2.83 2.80 2.7° 2.78 2.76 2.74 2.73
PHYSICAL SCIENCES 3.10 2.75 2.90 2.87 2.95 2.89 2.89 2.96 2.79 2.93
ARCHITECTURE/ENVIR. ENG. 2.77 2.70 2.72 2.76 2.62 2.65 2.63 2.67 2.66 2.71
ENGINEERING 3.14 3.28 3.18 3.16 3.08 3.05 3.04 3.09 3.33 3.03
LIFE SCIENCES 2.69 2.56 2.62 2.63 2.60 2.64 2.59 2.59 2.66 2.69
EARTH & ENVIRONMENTAL SCI. 2.58 2.60 2.71 2.54 2.38 2.26 2.51 2.53 2.59 2.50
PSYCHOLOGY 2.42 2.40 2.41 2.39 2.35 2.39 2.39 2.33 2.37 2.39
SOCIAL SCIENCES 2.40 2.38 2.39 2.38 2.33 2.32 2.35 2.34 2.36 2.32
INTERDISCIPL./OTHER SCIENCES 2.70 2.68 2.59 2.58 2.74 2.62 2.61 3.05 2.74 2.98
TOTAL OF SCIENCE,MATH & ENGINEERING 2.66 2.60 2.62 2.62 2.61 2.65 2.68 2.70 2.69 2.68
1.7312-E
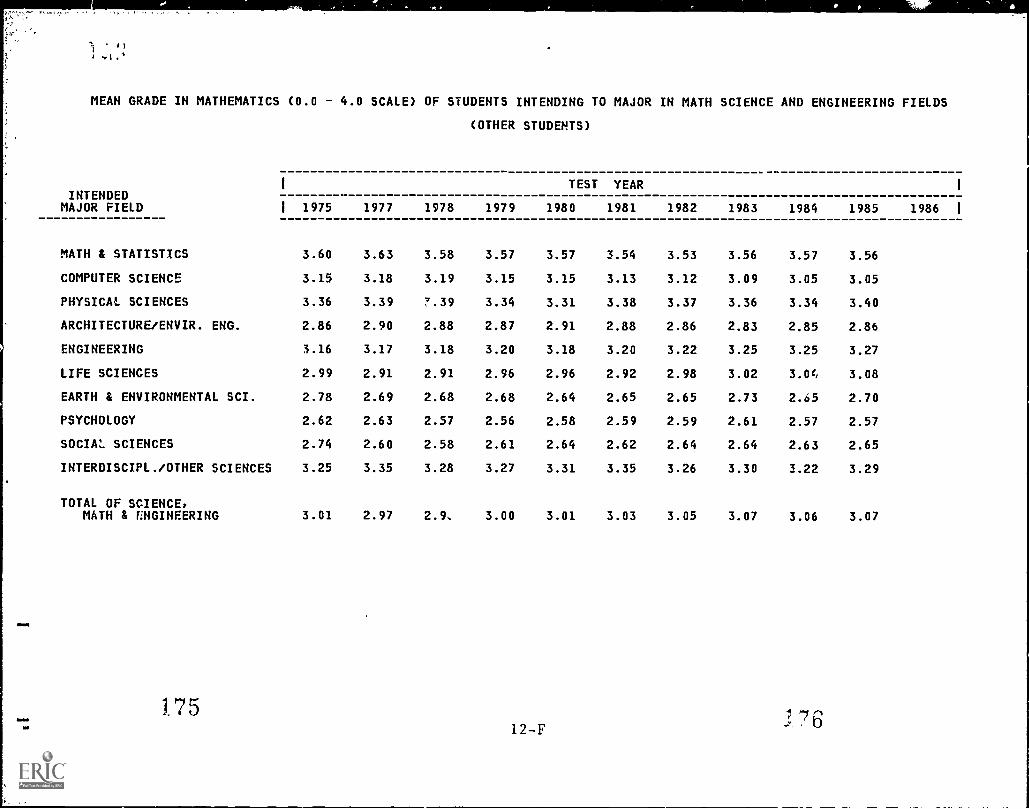
1. tyI wt,*
MEAN GRADE IN MATHEMATICS
INTENDED
(0.0 - 4.0 SCALE) OF STUDENTS INTENDING TO MAJOR IN MATH SCIENCE AND ENGINEERING FIELDS
(OTHER STUDENTS)
TEST YEAR 1
MAJOR FIELD 1 1975 1977 1978 1979 1980 1981 1982 1983 1984 1985 1986 1
MATH & STATISTICS 3.60 3.63 3.58 3.57 3.57 3.54 3.53 3.56 3.57 3.56
COMPUTER SCIENCE 3.15 3.18 3.19 3.15 3.15 3.13 3.12 3.09 3.05 3.05
PHYSICAL SCIENCES 3.36 3.39 7.39 3.34 3.31 3.38 3.37 3.36 3.34 3.40
ARCHITECTURE/ENVIR. ENG. 2.86 2.90 2.88 2.87 2.91 2.88 2.86 2.83 2.85 2.86
ENGINEERING 3.16 3.17 3.18 3.20 3.18 3.20 3.22 3.25 3.25 3.27
LIFE SCIENCES 2.99 2.91 2.91 2.96 2.96 2.92 2.98 3.02 3.0', 3.08
EARTH & ENVIRONMENTAL SCI. 2.78 2.69 2.68 2.68 2.64 2.65 2.65 2.73 2.65 2.70
PSYCHOLOGY 2.62 2.63 2.57 2.56 2.58 2.59 2.59 2.61 2.57 2.57
SOCIAL SCIENCES 2.74 2.60 2.58 2.61 2.64 2.62 2.64 2.64 2.63 2.65
INTERDISCIPL./OTHER SCIENCES 3.25 3.35 3.28 3.27 3.31 3.35 3.26 3.30 3.22 3.29
TOTAL OF SCIENCE,MATH & KNGINEERING 3.01 2.97 2.9, 3.00 3.01 3.03 3.05 3.07 3.06 3.07

MEAN GRADE IN MATHEMATICS (0.0 4.0 SCALE) OF STUDENTS INTENDING TO MAJOR IN MATH SCIENCE AND ENGINEERING FIELDS(ALL STUDENTS)
INTENDEDMAJOR FIELD
MATH & STATISTICS
COMPUTER SCIENCE
PHYSICAL SCIENCES
ASTRONOMYCHEMISTRYPHYSICS
ARCHITECTURE/ENVIR. EIG.
ENGINEERING
AEROSPACE ENGINEERINGELECTRICAL ENGINEERINGCHEMICAL ENGINEERINGMECHANICAL ENGINEERINGCIVIL ENGINEERINGOTHER ENGINEERING
LIFE SCIENCES
AGRICULTUREBIOLOGICAL SCIENCES
EARTH & ENVIRONMENTAL SCI.
PSYCHOLOGY
CHILD PSYCHOLOGYGENERAL PSYCHOLOGYSOCIAL PSYCHOLOGY
SOCIAL SCIENCES
ECONOMICSINTERNATIONAL RELATIONSLAW ENFORCEMENTPOLITICAL SCIENCESOCIOLOGYOTHER SOCIAL SCIENCES
INTERDISCIPL./OTHER SCIENCES
TOTAL OF SCIENCE,MATH & ENGINEERING
I
I 1975
3.66
3.19
3.143.343.55
2.89
3.023.073.493.043.233.22
2.653.07
2.80
2.642.752.63
3.102.942.510.000.002.81
3.25
3.'14
1977
3.68
3.25
3.203.333.56
2.94
3.073.113.533.063.223.28
2.723.06
2.84
2.662.752.63
3.132.972.482.932.592.70
3.37
3.02
1978
3.66
3.23
3.183.323.54
2.92
3.093.113.503.073.223.27
2.663.04
2.83
2.622.762.61
3.092.942.472.842.562.71
3.33
3.01
1979
3.63
3.21
3.123.303.50
2.91
3.073.113.483.073.203.26
2.663.04
2.79
2.622.752.62
3.102.942.452.832.572.71
3.28
3.31
TEST
1980
3.61
3.18
3.143.273.49
2.89
3.073.103.483.073.1(3.24
2.663.03
2.77
2.602.732.62
3.092.902.432.802.542.71
3.26
3.01
YEAR
1981
3.61
3.16
3.083.273.50
2.88
3.083.133.473.073.163.25
2.663.01
2.76
2.622.732.62
3.062.942.422.792.542.69
3.29
3.03
1982
3.59
3.14
3.143.263.47
2.86
3.113.163.473.083.163.25
2.653.02
2.76
2.592.722.62
3.102.932.412.782.532.70
3.25
3.04
1983
3.59
3.10
3.103.283.47
2.85
3.123.183.463.103.173.28
2.663.04
2.76
2.602.722.62
3.102.962.422.802.552.73
3.27
3.05
1984
3.61
3.06
3.113.253.47
2.84
3.143.223.453.103.153.28
2.623.04
2.73
2.622.712.63
3.082.962.422.772.522.71
3.28
3.03
1985
3.59
3.04
3.103.283.46
2.83
3.153.223.473.123.153.27
2.643.07
2.75
2.592.722.61
3.072.992.412.772.532.71
3.28
3.02
1986
I
I
173

MEAN GRADE IN MATHEMATICS (0.0 4.0 SCALE) OF STUDENTS INTENDING TO MAJOR IN MATH SCIENCE AND ENGINEERING FIELDS(WHITE MALES)
TEST YEARINTENDED
MAJC°. FIELD 1975 1977 1978 1979 1930 1981 1982 1983 1984 1985 1986
MATH & STATISTICS 3.63 3.65 3.64 3.61 3.58 3.59 3.55 3.56 3.56 3.54
COMPUTER SCIENCE 3.20 3.26 3.25 3.20 3.17 3.16 3.14 3.09 3.06 3.06
PHYSICAL SCIENCES
ASTRONOMY 3.15 3.21 3.20 3.11 3.17 3.08 3.14 3.09 3.07 3.11CHEMISTRY 3.33 3.32 3.30 3.28 3.25 3.25 3.26 3.24 3.22 3.26PHYSICS 3.56 3.57 3.55 3.51 3.50 3.50 3.47 3.47 3.48 3.47
ARCHITECTURE/ENVIR. ENG. 2.87 2.93 2.91 2.89 2.87 2.86 2.83 2.82 2.81 2.79
ENGINEERING
AEROSPACE ENGINEERING 3.04 3.09 3.11 3.09 3.09 3.09 3.13 3.13 3.16 3.17ELECTRICAL ENGINEERING 3.11 3.13 3.14 3.12 3.12 3.14 3.16 3.18 3.22 3.22CHEMICAL ENGINEERING 3.50 3.54 3.49 3.45 3.47 3.46 3.46 3.47 3.45 3.46MECHANICAL ENGINEERING 3.06 3.08 3.09 3.07 3.07 3.07 3.08 3.10 3.10 3.12CIVIL ENGINEEkING 3.22 3.20 3.22 3.19 3.16 3.15 3.17 3.16 3.15 3.14OTHER ENGINEERING 3.21 3.26 3.25 3.23 3.21 3.21 3.21 3.24 3.25 3.24
LIFE SCIENCES
AGRICULTURE 2.61 2.69 2.62 2.64 2.63 2.64 2.64 2.63 2.60 2.62BIOLOGICAL SCIENCES 3.07 3.03 3.00 2.99 2.98 2.97 2.98 3.00 2.98 3.01
EARTH & ENVIRONMENTAL SCI. 2.76 2.81 2.80 2.76 2.74 2.73 2.72 2.72 2.68 2.69
PSYCHOLOGY
CHILD PSYCHOLOGY 2.57 2.54 2.55 2.53 2.51 2.51 2.53 2.52 2.53 2.525ENERAL PSYCHOLOGY 2.70 2.73 2.75 2.71 2.68 2.68 2.66 2.64 2.63 2.63JOCIAL PSYCHOLOGY 2.61 2.61 2.54 2.66 2.61 2.60 2.58 2.52 2.55 2.59
SOCIAL SCIENCES
ECONOMICS 3.09 3.15 3.12 3.08 3.02 3.04 3.07 3.10 3.11 3.07INTERNATIONAL RELATIONS 2.85 2.97 2.95 2.88 2.89 2.89 2.39 2.98 2.97 2.96LAW ENFORCEMENT 2.47 2.46 2.45 2.42 2.41 2.42 2.39 2.39 2.40 2.41POLITICAL SCIENCE 0.00 2.95 2.86 2.83 2.82 2.79 2.78 2.80 2.77 2.76SOCIOLOGY 0.00 2.64 2.54 2.47 2.42 2.49 2.52 2.37 2.46 2.52OTHER SOCIAL SCIENCES 2.81 2.75 2.76 2.77 2.76 2.72 2.74 2.74 2.73 2.72
INTERDISCIPL./OTHER SCIENCES 3.25 3.38 3.35 3.27 3.25 3.28 3.24 3.25 3.28 3.25
TOTAL OF SCIENCE,MATH & ENGINEERING 3.06 3.07 3.07 3.05 3.05 3.06 3.07 3.07 3.06 3.06
179 13-B 1 0

1
MEAN GRADE IN MATHEMATICS (0.0 4.0 SCALE) OF STUDENTS INTENDING TO MAJOR IN MATH SCIENCE AND ENGINEERING FIELDS(WHITE FEMALES)
INTENDEDMAJOR FIELD
MATH & STATISTICS
COMPUTER SCIENCE
PHYSICAL SCIENCES
ASTRONOMYCHEMISTRYPHYSICS
ARCHITECTURE /ENVIR. ENG.
ENGINEERING
AEROSPACE ENGINEERINGELECTRICAL ENGINEERINGCHEMICAL ENOINEERINGMECHANICAL ENGINEERINGCIVIL ENGINEERINGOTHER ENGINEERING
LIFE SCIENCES
AGRICULTUREBIOLOGICAL SCIENCES
EARTH & ENVIRONMENTAL SC'.
PSYCHOLOGY
CHILD PSYCHOLOGYGENERAL PSYCHOLOGYSOCIAL PSYCrOLOGY
SOCIAL SCIENCES
ECONOMICSINTERNATIONAL RELATIONSLAW ENFORCEMENTPOLITICAL SCIENCE50CIOLOGYOTHER SOCIAL SCIENCES
INTERDISCIPL./OTHER SCIENCES
, TOTAL OF SCIENCE,MATH a ENGINEERING
1
i 1975
3.74
3.44
3.173.483.54
3.17
3.313.533.653.523.613.59
2.763.13
2.93
2.732.832.71
3.293.102.680.000.002.89
3.34
3.08
1977
3.76
3.46
3.263.443.63
3.19
3.313.593.663.413.543.60
2.783.15
2.97
2.752.832.69
3.232.992.613.002.702.77
3.41
3.04
1978
3.74
3.43
3.193.433.61
3.13
3.273.463.673.433.543.58
2.743.13
2.95
2.722.832.69
3,162.992.612.942.662.78
3.37
3.03
1979
3.72
3.42
3.203.433.63
3.15
3.273.533.663.403.503.57
2.743.12
2.91
2.702.832.68
3.223.042.592.942.672.78
5.36
3.04
TEST
1980
3.70
3.3-
3.163.383.55
3.12
3.283.463.613.383.423.55
2.743.12
2.91
2.692.822.70
3.282.992.552.892.682.77
3.31
3.05
YEAR
1981
3.70
3.35
3.243.383.54
3.09
3.273.513.593.433.443.54
2.723.11
2.89
2.692.802.69
3.193.012.542.902.642.76
1.35
3.06
1982
3.69
3.31
3.183.353.51
3.07
3.293.4C3.623.363.483.53
2.723.10
2.89
2.652.782.68
3.253 042.522.892.602.77
3.34
3.08
1983
3.67
3.27
3.193.393.55
3.06
3.343.493.573.373.433.54
2.723.11
2.87
2.662.792.68
3.183.012.552.932.682.81
3.34
3.09
1984
3.69
3.23
3.283.383.51
3.07
3.363.523.593.433.403.54
2.683.13
2.88
2.672.792.66
3.133.012.542.872.592.77
3.35
3.07
1985
3.68
3.22
3.183.343.48
3.06
3.333.503.593.A13..33.52
2.723.15
2.86
2.642.792.66
3.153.n32.b22.872.642.78
3.36
3.04
1986
1
I

MEAN GRADE IN MATHEMATICS
1
INTENDED
(0.0 - 4.0 SCALE) OF STUDENTS INTENDING TO MAJOR IN MATH SCIENCE AND ENGINEERING FIELDS(BLACK MALES)
TEST YEAR1
MAJOR FIFLD 1 1975 1977 1978 1979 1980 1981 1982 1983 1984 1985 1986 1
MATH & STATISTICS 3.34 3.34 3.26 3.20 3.15 3.14 3.18 3.20 3.19 3.19
COMPUTER SCIENCE 2.62 2.77 2.73 2.70 2.69 2.70 2.67 2.67 2.70 2.67
PHYSICAL SCIENCES
ASTRONOMY 2.52 2.55 2.64 2.32 2.54 2.54 2.80 2.59 2.59 2.59CHEMISTRY 2.97 2.82 2.83 2.76 2.88 2.77 2.55 2.83 2.72 2.69PHYSICS 3.07 3.11 2.97 :1.07 3.06 2.84 3.14 2.88 2.95 2.91
ARCHITECTURE/ENVIR. ENG. 2.51 2.49 2.54 2.52 2.52 2.54 2.52 2.53 2.50 2.47
ENGINEERING
AEROSPACE ENGINEERING 2.61 2.64 2.72 2.71 2.69 2.72 2.79 2.72 2.74 2.77ELECTRICAL ENGINEERING 2.74 2.74 2.80 2.77 2.75 2.73 2.78 2.83 2.81 2.80CHEMICAL ENGINEERING 3.16 3.16 3.12 3.17 3.11 3.11 3.15 3.06 3.06 3.06MECHANICAL ENGINEERING 2.6C 2.73 2.71 2.75 2.77 2.76 2.78 2.74 2.74 2.71CIVIL ENGINEERING 2.95 2.98 2.91 2.93 2.85 2.80 2.83 2.84 2.89 2.85OTHER ENGINEERING 2.74 2.87 2.88 2.87 2.83 2.83 2.86 2.88 2.78 2.85
LIFE SCIENCES
AGRICULTURE 2.27 2.40 2.46 7.25 2.29 2.40 2.28 2.31 2.30 2.27BIOLOGICAL SCIENCES 2.55 2.61 2.59 2.59 2.56 2.53 2.53 2.62 2.56 2.53
EARTH & ENVIRONMENTAL SCI. 2.46 2.39 2.39 2.36 2.41 2.38 2.43 2.37 2.22 2.35
PSYCHOLOGY
CHILD PSYCHOLOGY 2.24 2.32 2.09 2.09 2.:0 2.17 2.27 2.15 2.23 2.20GENERAL PSYCHOLOGY 2.25 2.37 2.36 2.34 2.33 2.33 2.28 2.33 2.33 2.29SOCIAL PSYCHOLOGY 2.16 2.06 2.29 2.37 2.13 2.37 2.39 2.23 2.06 2.27
SOCIAL SCIENCES
ECONOMICS 2.64 2.59 2.82 2.92 2.72 2.58 2.48 2.70 2.80 2.50INTERNATIONAL RELATIONS 2.37 2.76 2.55 2.77 2.26 2.07 2.41 2.61 2.24 2.65LAW ENFORCEMENT 2.09 2.18 2.19 2.24 2.17 2.30 2.32 2.19 2.17 2.15POLITICAL SCIENCE 0.00 2.44 2.34 2.35 2.42 2.31 2.30 2.29 2.34 2.33SOCIOLOGY 0.00 2.17 2.25 2.27 2.01 2.14 2.24 2.17 1.98 2.10OTHER SOCIAL SCIENCES 2.29 2.30 2.26 2.34 2.33 2.33 2.27 2.31 2.19 2.28
INTERDISCIPL./OTHER SCIENCES 2.75 2.72 2.79 2.83 2.81 2.68 2.64 2.90 2.59 2.96
TOTAL OF SCIENCE,MATH & ENGINEERING 2.61 2.65 2.67 2.67 2.66 2.67 2.69 2.70 2.68 2.68
183 13-D 184

MEAN GRADE IN MATHEMATICS (0.0 - 4.0 SCALE) OF STUDENTS INTENDING TO MAJOR IN MATH SCIENCE AND ENGINEERING FIELDS(BLACK FEMALES)
INTENDEDMAJOR FIELD
MATH & STATISTICS
COMPUTER SCIENCE
PHYSICAL SCIE"^ES
ASTRONOMYCHEMISTRYPHYSICS
ARCHITECTURE/ENVIR. ENG.
ENGINEERING
AEROSPACE ENGINEERINGELECTRICAL ENGINEERINGCHEMICAL ENGINEERINGMECHANICAL ENGINEERINGCIVIL ENGINEERINGOTHER ENGINEERING
LIFE SCIENCES
AGRICULTUREBIOLOGICAL SCIENCES
EARTH & ENVIRONMENTAL SCI.
PSYCHOLOGY
CHILD PSYCHOLOGYGENERAL PSYCHOLOGYSOCIAL PSYCHOLOGY
SOCIAL SCIENCES
ECONOMICSINTERNATIONAL RELATIONSLAW ENFORCEMENTPOLITICAL SCIENCESOCIO%0GYOTHER SOCIAL SCIENCES
INTERDISCIPL./OTHER SCIENCES
TOTAL OF SCIENCE,MATH & ENGINEERING
1 1975
3.52
2.81
3.003.103.13
2.77
2.942.943.303.053.163.17
2.532.70
2.58
2.382.432.48
2.772.332.020.000.002.41
2.70
2.66
1977
3.50
2.83
3.502.762.53
2.70
2.893.303.273.363.193.33
2.352.58
2.60
2.362.432.42
2.422.71'.302.512.412.34
2.68
2.60
1978
3.51
2.89
2.502.913.60
2.72
2.923.083.213.083.143.26
2.282.64
2.71
2.312.482.40
2.42.612.292.512.351.38
2.59
2.62
1579
3.36
2.83
2.572.922.59
2.76
2.903.033.313.063.153.20
2.422.65
2.54
2.382.402.37
2.532.262.332.472.362.37
2.58
2.62
TEST
1980
3.32
2.80
2.562.953.11
2.62
2.733.033.273.063.033.10
2.232.63
2.33
2.312.372.35
2.622.622.292.462.272.30
2.74
2.61
YEAR
1981
3.36
2.79
2.832.843.19
2.65
2.673.073.172.932.953.09
2.542.64
2.26
2.372.432.32
2.572.642.242.432.242.30
2.62
2.65
1982
3.30
2.78
2.202.883.10
2.63
2.803.063,103.062.953.06
2.462.60
2.51
L.372.452,21
2.772.412.322.482.372.30
2.61
2.68
1983
3.38
2.76
3.602.952.84
2.67
2.983.083.132.973.043.12
2.382.60
2.53
2.282.372.29
2.692.452.312.352.'c2.'34
3.05
2.70
1984
3.30
2.74
2.802.792.82
2.66
2.793.033.062.992.903.09
2.602.66
2.59
2.352.402.30
2.722.662.392.382.342.31
2.74
2.(9
1985
3.34
2.73
1.332.972.89
2.71
2.793.063.172.863.003.04
2.182.73
2.50
2.332.442.36
2.Ln2.512.322.452.212.26
2.98
2.68
1 5
1
1986 1
186

MEAN GRADE IN MATHEMATICS (0.0 - 4.0 SCALE) OF STUDENTS INTENDING TO MAJOR IN MATH SCIENCE AND ENGINEERING FIELDS(OTHER STUDENTS)
INTENDEDMAJOR FIELD
MATH a STATISTICS
COMPUTER SCIENCE
PHYSICAL SCIENCES
ASTRONOMYCHEMISTRYPHYSICS
ARCHITECTURE/ENVIR. ENG.
ENGINEERING
AEROSPACE ENGINEERINGELECTRICAL ENGINEERINGCHEMICAL ENGINEERINGME:HANICAL ENGINEERINGCIVIL ENGINEERINGOTHER ENGINEERING
LIFE SCIENCES
AGRICULTUREBIOLOGICAL SCIENCES
EARTH & ENVIRONMENTAL SCI,
PSYCHOLOGY
CHILD PSYCHOLOGYGENERAL PSYCHOLOGYSOCIAL PSYCHOLOGY
SOCILL !ZIENCES
ECONOOICSINTERNATIONAL RELATIONSLAW ENFORCEMENTPOLITICAL SCIENCESOCIOLOGYOTHER SOCIAL SCIENCES
INTERbISCIPL./OTHER SCIENCES
TOTAL OF SCIENCE,MATH & ENGINEERING
I
1 1975
3.60
3.15
3.113.273.57
2.86
3.023.083.413.003.163.23
2.623.06
2.78
2.562.672.46
2.982.682.420.000.002.73
3.25
3.01
1977
3.63
3.18
3.203.293.60
2.90
3.033.143.493.003.193.24
2.563.02
2.69
2.582.652.58
3.082.922.352.892.382.57
3.35
2.91
1978
3.58
3.19
3.203.363.48
2.88
3.063.113.483.063.213.24
2.563.01
2.68
2.502.602.55
2.992.782.402.742.442.58
3.28
2.96
1979
3.57
3.15
3.163.303.46
2.87
3.093.153.533.093.203.26
2.583.06
2.68
2.492.622.46
3.122.852.362.812.572.58
3.27
3.00
TEST
1980
3.57
3.15
3.093.223.51
2.91
3.063.163.493.083.123.22
2.603.06
2.64
2 492.622.54
3.102.732.352.782.452.65
3.31
3.01
YEAR
1981
3.54
3.13
3.013.343.55
2.88
3.063.223.513.063.153.24
2.493.03
2.65
2.592.622.48
3.062.932.2a2.722.532.59
3.35
3.03
1982
3.53
3.L2
3.163.293.51
2.36
3.083.263.463.073.103.25
2.523.09
2.65
2.512.632.58
3.062.752.362.722.462.63
3.26
3.05
:1983
3.56
3.09
3.053.353.48
2.83
3.123.253.483.143.183.29
2.633.09
2.73
2.512.652.63
3.062.862.422.692.552.60
3.30
3.07
19E4
3.57
3.05
3.153.293.49
2.85
3.123.323.493.123.093.28
2.553.11
2.65
2.522.602.50
3.022.822.332.742.512.62
3.22
3.06
1985
3.56
3.05
3.043.393.50
2.86
3.133.323.513.153.153.30
2.553.14
2.70
2.482.612.56
3.12.2.962.302.712.372.64
3.29
3.07
I
1986 1
187 13-F 188

MEAN RANK IN CLASS OF STUDENTS INTENDING TO MAJOR IN MATH SCIENCE AND ENGINEERING FIELDS
(ALL STUDENTS)
INTENDED1 TEST YEAR
1
MAJOR FIELD 1 1975 1977 1978 1979 1980 1981 1982 1983 1984 1985 1986 1
MATH & STATISTICS 83 83 82 82 82 81 81 81 81 81 82
COMPUTER SCIENCE 77 77 77 77 76 76 75 75 74 73 72
PHYSICAL SCIENCES 85 84 84 84 83 83 83 83 82 83 83
ARCHITECTURE/ENVIR. ENG. 74 73 72 72 72 71 71 70 7C 69 70
ENGINEERING 78 78 78 78 78 78 78 78 78 78 79
LIFE SCIENCES 78 77 76 76 75 75 75 76 76 76 77
EARTH & ENVIRONMENTAL SCI. 76 74 73 72 72 72 71 71 71 71 71
PSYCHOLOGY 75 7! 72 71 71 70 70 70 69 69 70
SOCIAL SCIENCES 77 73 71 72 72 71 72 72 71 71 71
INTERDISCIPL./OTHER SCIENCES 82 84 83 82 82 82 82 82 82 81 83
TOTAL 07 SCIENCE,MATH & ENGINEERING 78 i6 76 76 76 75 75 75 75 75 75
14-A
169J. "J

MEAN RANK IN CLASS OF STUDENTS INTENDING TO MAJOR IN MATH SCIENCE AND ENGINEERING FIELDS
(WHITE MALES)
INTENDEDMAJOR FIELD
MATH & STATISTICS
COMPUTER SCIENCE
PHYSICAL SCIENCES
ARCHITECTURE/ENVIR. ENG.
ENGINEERING
LIFE SCIENCES
EARTH & ENVIRONMENTAL SCI.
PSYCHOLOGY
SOCIAL SCIENCES
INTERDISCIPL./OTHER SCIENCES
TOTAL OF SCIENCE,MATH & ENGINEERING
1
1 1975
82
77
85
73
78
77
75
73
76
81
77
1977
82
77
84
72
78
75
73
72
72
84
76
X978
82
77
84
72
77
74
72
71
71
83
76
1979
82
77
84
71
77
74
71
71
71
82
76
TEST
1980
81
76
83
71
77
73
1
70
71
82
76
YEAR
1981
81
75
83
70
77
73
70
69
71
82
75
1982
80
75
83
70
77
73
70
69
71
81
75
1983
80
74
83
69
78
74
79
69
70
81
75
1984
80
73
82
68
78
74
69
67
70
82
75
1985
80
73
83
68
78
74
69
67
69
80
75
1
1986 1
81
73
83
69
79
74
69
68
69
82
75
14-B192

MEAN RANK IN CLASS OF STUDENTS INTENDING TO MAJOR IN MATH SCIENCE AND ENGINEERING FIELDS
(WHITE FEMALES)
INTENDED1 TEST YEAR 1
MAJOR FIELD I 1975 1977 1978 1979 1980 1981 1982 1983 1984 1985 1986 1
MAIN & STATISTICS 85 85 85 84 84 84 83 83 84 84 85
COMPUTER SCIENCE 82 82 81 81 80 80 79 78 77 76 75
PHYSICAL SCIENCES 87 86 85 86 85 85 85 85 85 84 85
ARCHITECTURE/ENVIR. ENG. 80 79 78 78 77 77 76 76 76 75 76
ENGINEERING 88 87 87 86 86 86 86 86 86 85 86
LIFE SCIENCES 80 79 79 78 78 78 78 78 7S 79 79
EARTH & ENVIRONMENTAL SCI. 79 78 77 76 76 76 75 75 75 74 74
PSYCHOLOGY 76 74 73 72 72 72 71 71 70 70 71
SOCIAL SCIENCES 78 75 74 74 74 74 74 74 74 74 73
OTERDISCIPL./OTHER SCIENCES 84 86 85 85 84 85 84 84 84 84 85
TOTAL OF SCIENCE,MATH & ENGINEER1A 80 78 77 77 77 77 77 77 77 76 76
WI
Ai,
at
M. ( 1_ 9 314-C
1 D 4

MEAN RANK IN CLASS OF STUDENTS INTENDING TO MAJOR IN MATH SCIENCE AND ENGINEERING FIELDS
(BLACK MALES)
INTENDEDI TEST YEAR I
MAJOR FIELD I 1975 1977 1978 1979 1980 1981 198? 1983 1984 1985 1986 I
MATH & STATISTICS 75 71 71 69 69 66 69 70 68 70 73
COMPUTER SCIFNCE 70 70 69 68 68 68 68 68 67 67 66
PHYSICAL SCIENCES 76 76 75 76 74 73 74 74 72 75 73
ARCHITECTURE/ENVIR. ENG. 70 67 67 67 66 66 67 65 65 64 66
ENGINEERING 73 72 72 72 72 71 72 72 71 71 72
LIFE SCIENCES 73 71 70 69 70 69 68 69 68 67 69
EARTH & ENVIRONMENTAL SCI. 70 68 67 66 67 64 64 62 66 64 65
PSYCHOLOGY 69 64 64 64 63 63 65 62 64 63 64
SOCIAL SCIENCES 68 66 65 66 65 66 65 65 63 64 63
INTERDISCIPL./OTHER SCIENCES 75 69 73 73 73 68 69 72 66 73 75
TOTAL OF SCIENCE,MATH & ENGINEERING 72 70 69 69 69 69 70 69 69 69 69
195 14 -P 196

MEAN RANK IN CLASS OF STUDENTS INTENDING TO MAJOR IN MATH SCIENCE AND ENGINEERING FIELDS
(BLACK FEMALES)
INTENDEDMAJOR FIELD
MATH & STATISTICS
COMPUTER SCIENCE
PHYSICAL SCIENCES
ARCHITECTURE/ENVIR. ENG.
ENGINEERING
LIFE SCIENCES
EARTH & ENVIRONMENTAL SCI.
PSYCHOLOGY
SOCIAL SCIENCES
INTERDISCIPL./OTHER SCIENCES
TOTAL OF SCIENCE,MATH & ENGINEERING.
1
1 1975
78
74
77
74
80
74
71
71
69
73
73
1977
76
70
76
69
81
72
70
68
65
74
69
1978
76
71
74
69
81
72
69
67
65
72
69
1979
11
70
75
70
79
71
71
66
65
70
69
TEST
1980
73
70
76
69
79
72
67
65
64
73
69
YEAR
1981
74
70
77
70
78
72
66
65
64
72
70
1982
74
70
77
68
77
71
69
66
65
73
70
1983
73
70
76
69
79
72
70
65
66
75
70
1984
73
69
74
67
78
73
70
65
65
76
70
1985
74
69
76
68
78
72
65
65
64
71
69
1
1986 1
79
69
75
68
78
72
66
66
65
79
70
10 14-E

'! .' 4 1:.,MEAN RANK IN CLASS OF STUDENTS INTENDING TO MAJOR IN MATH SCIENCE AND ENGINEERING FIELDS
1 :r i'l,, is .
INTENDEDMAJOR FIELD
MATH & STATISTICS
COMPUTER SCIENCE
PHYSICAL SCIENCES
ARCHITECTURE/ENVIR. ENG.
ENGINEERING
LIFE SCIENCES
EARTH I ENVIRONMENTAL SCI.
PSYCHOLOGY
SOCIAL SCIENCES
INTERDISCIPL./OTHER SCIENCES
TOTAL OF SCIENCEMATH & ENGINEERINP
1
1 1975
82
77
85
74
78
78
75
73
76
82
78
1977
81
77
83
73
77
76
73
72
71
83
76
1978
80
76
8z
72
77
76
71
70
70
82
75
(OTHER STUDENTS)
TEST
1979 1980
80 79
76 75
83 82
71 71
77 77
77 75
72 71
69 69
70 71
82 83
75 75
YEAR
1981
78
75
83
71
77
76
70
69
71
81
75
1982
78
74
82
70
77
76
70
69
71
81
75
1983
77
74
83
70
78
77
70
69
71
82
75
1984
78
73
82
69
78
77
69
68
71
81
75
1985
79
73
82
70
78
77
68
67
71
81
75
1986
82
73
83
71
79
79
69
69
71
84
76
14-F199
200
1
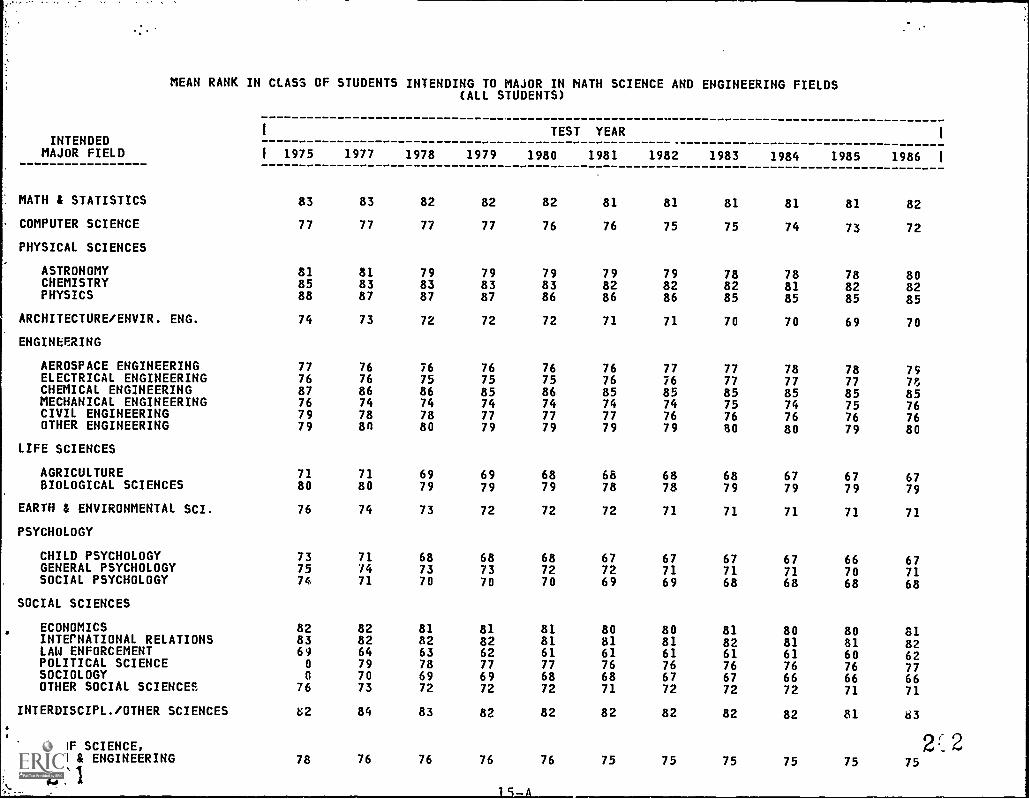
MEAN RANK IN CLASS OF STUDENTS INTENDING TO MAJOR IN MATH SCIENCE AND ENGINEERING FIELDS(ALL STUDENTS)
INTENDEDMAJOR FIELD
MATH I STATISTICS
COMPUTER SCIENCE
PHYSICAL SCIENCES
ASTRONOMYCHEMISTRYPHYSICS
ARCHITECTURE/ENVIR. ENG.
ENGINEERING
AEROSPACE ENGINEERINGELECTRICAL ENGINEERINGCHEMICAL ENGINEERINGMECHANICAL ENGINEERINGCIVIL ENGINEERINGOTHER ENGINEERING
LIFE SCIENCES
AGRICULTUREBIOLOGICAL SCIENCES
EARTH & ENVIRONMENTAL SCI.
PSYCHOLOGY
CHILD PSYCHOLOGYGENERAL PSYCHOLOGYSOCIAL PSYCHOLOGY
SOCIAL SCIENCES
ECONOMICSINTErNATIONAL RELATIONSLAW ENFORCEMENTPOLITICAL SCIENCESOCIOLOGYOTHER SOCIAL SCIENCES
INTERDISCIPL. /OTHER SCIENCES
TOTAL OF SCIENCE,MATH & ENGINEERING
21 1
1 TEST YEAR
1 1975 1977 1978 1979 1980 1981 1982 1983 1984 1985 1986
83 83 82 82 82 81 81 81 81 81 82
77 77 77 77 76 76 75 75 74 73 72
81 81 79 79 79 79 79 78 78 78 8085 83 83 83 83 82 82 82 81 82 8288 87 87 87 86 86 86 85 85 85 85
74 73 72 72 72 71 71 70 70 69 70
77 76 76 76 76 76 77 77 78 78 7976 76 75 75 75 76 76 77 77 77 PI87 86 86 85 86 85 85 85 85 85 8576 74 74 74 74 74 74 75 74 75 7679 78 78 77 77 77 76 76 76 76 7679 an 80 79 79 79 79 80 80 79 80
71 71 69 69 68 68 68 68 67 67 6780 80 79 79 79 78 78 79 79 79 79
76 74 73 72 72 72 71 71 71 71 71
73 71 68 68 68 67 67 67 67 66 6775 74 73 73 72 72 71 71 71 70 7174 71 70 70 70 69 69 68 68 68 68
82 82 81 81 81 80 80 81 80 80 8183 82 82 82 81 81 81 82 81 81 8269 64 63 62 61 61 61 61 61 60 620 79 78 77 77 76 76 76 76 76 770 70 69 69 68 68 67 67 66 66 66
76 73 72 72 72 71 72 72 72 71 71
82 84 83 82 82 82 82 82 82 81 83
78 76 76 76 76 75 75 75 75 75 75
1
1
2(..2

MEAN RANK IN CLASS OF STUDENTS INTENDING TO MAJOR IN MATH SCIENCE AND ENGINEERING FIELDS 0.(WHITE MALES)
INTENDEDMAJOR FIELD
MATH & STATISTICS
COMPUTER SCIENCE
PHYSICAL SCIENCES
ASTRONOMYCHEMISTRYPHYSICS
ARCHITECTURE/ENVIR. ENG.
ENGINEERING
AEROSPACE ENGINEERINGELECTRICAL ENGINEERINGCHEMICAL ENGINEERINGMECHANICAL ENGINEERINGCIVIL ENGINEERINGOTHER ENGINEERING
LIFE SCIENCES
AGRICULTUREBIOLOGICAL SCIENCES
EARTH & ENVIRONMENTAL SCI.
PSYCHOLOGY
CHILD PSYCHOLOGYGENERAL PSYCHOLOGYSOCIAL PSYCHOLOGY
SOCIAL SCIENCES
ECONOMICSINTERNATIONAL RELATIONSLAW ENFORCEMENTPOLITICAL SCIENCESOCIOLOGYOTHER SOCIAL SCIENCES
INTERDISCIPL./OTHER SCIENCES
TOTAL OF SCIENCE,MATH & ENGINEERING
1
1 1975
82
77
818488
73
777686757878
698C
75
717374
8282680
0
76
81
77
1977
82
77
818387
72
777686747779
6979
73
667369
8?3362796974
84
76
1978
82
77
798387
72
767586747879
6878
72
657270
818261786773
83
76
1979
82
77
798287
71
767585747778
6877
71
667270
818161776873
E2
76
TEST
1980
81
76
808286
71
767685747678
6777
71
647170
79El60776873
82
76
YEAR
1981
81
75
788285
70
767685747678
6777
70
647068
798060766772
82
75
1982
80
75
798286
70
777685747S78
6777
70
636968
798259766773
81
75
1983
80
74
788185
69
777785757679
6677
70
637067
808259766773
81
75
1984
80
73
788085
68
787785747679
6677
69
646866
808059756272
82
75
1985
80
73
778186
68
787785757578
6677
69
606866
798159756471
80
75
1
1986 1
81
73
808285
69
797885767679
6678
69
656868
808160776771
82
75
20315-B 204
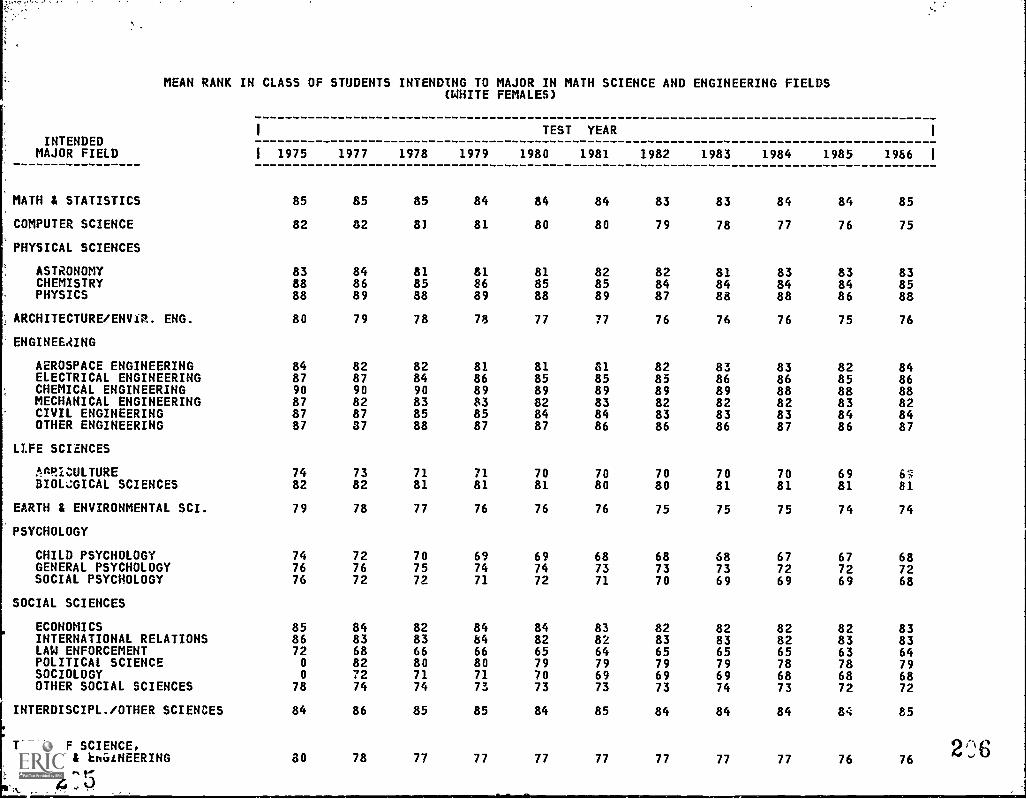
MEAN RANK IN CLASS OF STUDENTS INTENDING TO MAJOR IN MATH SCIENCE AND ENGINEERING FIELDS(WHITE FEMALES)
INTENDEDMAJOR FIELD
MATH & STATISTICS
COMPUTER SCIENCE
PHYSICAL SCIENCES
ASTRONOMYCHEMISTRYPHYSICS
ARCHITECTURE/ENVIR. ENG.
ENGINEERING
AEROSPACE ENGINEERINGELECTRICAL ENGINEERINGCHEMICAL ENGINEERINGMECHANICAL ENGINEERINGCIVIL ENGINEERINGOTHER ENGINEERING
LIFE SCIENCES
"nRICULTUREBIOL,GICAL SCIENCES
EARTH & ENVIRONMENTAL SCI.
PSYCHOLOGY
CHILD PSYCHOLOGYGENERAL PSYCHOLOGYSOCIAL PSYCHOLOGY
SOCIAL SCIENCES
ECONOMICSINTERNATIONAL RELATIONSLAW ENFORCEMENTPOLITICAL SCIENCESOCIOLOGYOTHER SOCIAL SCIENCES
INTERDISCIPL./OTHER SCIENCES
TOTAL OF SCIENCE,MATH & blGiNEERING
1 1975
85
82
838888
80
848790878787
7482
79
747676
8586720
0
78
84
80
1977
85
82
848689
79
828790828787
7382
78
727672
848368827274
86
78
1978
85
8)
818588
78
828490838588
7181
77
707572
828366807174
85
77
1979
84
81
818689
78
818689838587
7181
76
697471
848466807173
85
77
TEST
1980
84
80
818588
77
818589828487
7081
76
697472
848265797073
84
77
YEAR
1981
84
80
828589
77
818589838486
7080
76
687371
838264796973
85
77
1982
83
79
828487
76
828589828386
7080
75
687370
828365796973
84
77
1983
83
78
818488
76
838689828386
7081
75
687369
828365796974
84
77
1984
84
77
838488
76
838688828387
7081
75
677269
828265786873
84
77
1985
84
76
838486
75
828588838486
6981
74
677269
828363786872
84
76
1
1986 1
85
75
838588
76
848688828487
61;
81
74
687268
838364796872
85
762'8
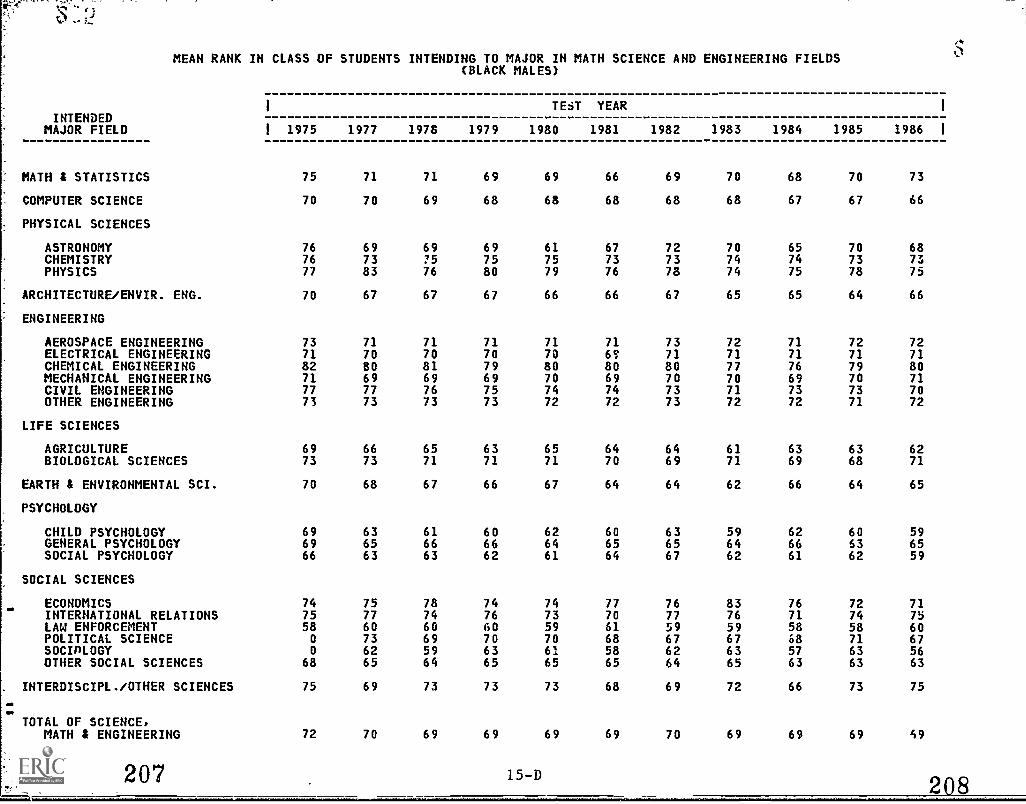
MEAN RANK IN CLASS OF STUDENTS INTENDING TO MAJOR IN MATH SCIENCE AND ENGINEERING FIELDS(BLACK MALES)
INTENDEDMAJOR FIELD
MATH $ STATISTICS
COMPUTER SCIENCE
PHYSICAL SCIENCES
ASTRONOMYCHEMISTRYPHYSICS
ARCHITECTURE/ENVIR. ENG.
ENGINEERING
AEROSPACE ENGINEERINGELECTRICAL ENGINEERINGCHEMICAL ENGINEERINGMECHANICAL ENGINEERINGCIVIL ENGINEERINGOTHER ENGINEERING
LIFE SCIENCES
AGRICULTUREBIOLOGICAL SCIENCES
EARTH & ENVIRONMENTAL SCI.
PSYCHOLOGY
CHILD PSYCHOLOGYGENERAL PSYCHOLOGYSOCIAL PSYCHOLOGY
SOCIAL SCIENCES
ECONOMICSINTERNATIONAL RELATIONSLAW ENFORCEMENTPOLITICAL SCIENCESOCIRLOGYOTHER SOCIAL SCIENCES
INTERDISCIPL./OTHER SCIENCES
TOTAL OF SCIENCE,MATH & ENGINEERING
1 1975
75
70
767677
70
737182717773
6973
70
696966
7475580
0
68
75
72
1977
71
70
697383
67
717080697773
6673
68
636563
757760736265
69
70
1978
71
69
69?576
67
717081697673
6571
67
616663
787460695964
73
69
1979
69
68
697580
67
717079697573
6371
66
606662
747660706365
73
69
TEST
1980
69
68
617579
66
717080707472
6571
67
626461
747359706165
73
69
YEAR
1981
66
68
677376
66
716?80697472
6470
64
606564
777061685865
68
69
1982
69
68
727378
67
737180707373
6469
64
636567
767759676264
69
70
1983
70
68
707474
65
727177707172
6171
62
596462
837659676365
72
69
1984
68
67
657475
65
717176697372
6369
66
626661
767158685763
66
69
1985
70
67
707378
64
727179707371
6368
64
606362
727458716363
73
69
1
1986
73
66
687375
66
727180717072
6271
65
596559
717560675663
75
59
207 15-D
s
208

MEAN RANK IN CLASS OF STUDENTS INTENDING TO MAJOR IN MATH SCIENCE AND ENGINEERING FIELDS
INTENDEDMAJOR FIELD
MATH & STATISTICS
-COMPUTER SCIENCE
PHYSICAL SCIENCES
ASTRONOMYCHEMISTRYPHYSICS
ARCHITECTURE/ENVIR. ENG.
ENGINEERING
AEROSPACE ENGINEERINGELECTRICAL ENGINEERINGCHEMICAL ENGINEERINGMECHANICAL ENGINEERINGCIVIL ENGINEERINGOTHER ENGINEERING
LIFE SCIENCES
AGRICULTUREBIOLOGICAL SCIENCES
EARTH & ENVIRONMENTAL SCI.
PSYCHOLOGY
CHILD PSYCHOLOGYGENERAL PSYCHOLOGYSOCIAL PSYCHOLOGY
SOCIAL SCIENCES
ECONOMICSINTERNATIONAL RELATIONSLAW ENFORCEMENTPOLITICAL SCIENCESOCIOLOGYOTHER SOCIAL SCIENCES
INTERDISCIPL./OTHER SCIENCES
TOTAL OF SCIENCE,MATH & ENGINEERING
1
1 1975
78
74
687877
74
827785707481
7175
71
697171
7371660
0
69
73
73
1977
76
70
747674
69
768083817982
6572
70
666968
707663716563
74
69
1978
76
71
797473
69
797983807781
6373
69
646967
727464736464
72
69
(BLACK FEMALES)
TEST
1979 1980
71 73
70 70
76 6875 7778 78
70 69
76 7477 7782 8279 7680 7880 79
67 6372 72
71 67
64 6468 6664 65
71 7278 7363 6270 7064 6454 63
70 73
69 69
YEAR
1981
74
70
787583
70
747881757479
6173
66
636863
757460716462
72
70
1982
74
70
617876
68
747582757478
6272
69 .
636865
736963726364
73
70
1983
73
70
757677
69
747882787779
5973
70
646664
797762706264
75
70
1984
73
69
747379
67
737779777479
7073
70
636663
757762696065
76
70
1985
74
69
837680
68
747782757577
6073
65
636664
727061706163
71
69
1986
79
69
767485
68
767582747878
6373
66
636766
777663706162
79
70
1
1
210
1

MEAN RANK IN CLASS OF STUDENTS INTENDING TO MAJOR IN MATH SCIENCE AND ENGINEERING FIELDS
INTENDEDMAJOR FIELD
MA TH $ STATISTICS
COM PUTER SCIENCE
PHY SICAL SCIENCES
A STRONOMYC HEMISTRYPH YSICS
ARCHI TECTURE/ENVIR. ENG.
ENGINE ERING
A ERO SPACE ENGINEERINGEL EC TRICAL ENGINEERINGCHEM ICAL ENGINEERINGMECHA NICAL ENGINEERINGCIVIL ENGINEERINGOTHER ENGINEERING
LIFE SCIE LACES
AGRICU LTUREBIOLOGI CAL SCIENCES
EARTH & EN IRONMENTAL SCI.
PSYCHOLOGY
CHILD PSY CHOLOGYGENERAL P SYCHOLOGYSOCIAL PS YCHOLOGY
SOCIAL SCIENC ES
ECONOMICSINTERNATION AL RELATIONSLAW ENFORCE MENTPOLITICAL S IENCESOCIOLOGYOTHER SOCIAL SCIENCES
INTERDISCIPL./07 HER SCIENCES
TOTAL OF SCIENCE,MATH & ENGINEE RING
1
1 1975
82
77
798488
74
767685777979
7180
75
717473
8080640
0
76
82
78
1977
81
77
808188
73
757685747779
6879
73
717269
828063796771
83
76
1978
80
76
818385
72
757585747779
6678
71
677169
828062786970
82
75
(OTHER STUDENTS)
TEST
1979 1980
80 79
76 75
78 7582 8286 85
71 71
76 7676 7684 8475 7477 7779 79
68 6679 78
72 71
66 6671 7068 68
81 8277 7962 6176 7770 6670 71
82 83
75 75
YEAR
1981
78
75
788285
71
757784737678
6578
70
667166
827960757070
81
75
1982
78
74
768185
70
757884737578
6479
70
667068
817861756670
81
75
1983
77
74
778286
70
76778373777'
6779
70
657069
838060736671
82
75
1984
78
73
778185
69
777884737579
6579
69
656968
807759756771
81
75
1985
79
73
788284
70
777883747679
6579
68
656967
818060746670
81
75
1986 1
82
73
798386
71
797984767780
6780
69
657070
828062766672
84
76
21 1
215-F .12

PERCENT OF STUDENTS WHO INTEND TO MAJOR IN MATH, SCIENCE, AND ENGINEERING WHO PLAN TO RECEIVE A GRADUATE DEGREE
(ALL STUDENTS)
INTENDED1 TEST YEAR
I
MAJOR FIELD I 1975 1977 1978 1979 1980 1901 1982 1983 1984 1985 1986 I
MATH & STATISTICS 61 61 61 60 61 61 60 62 62 62 65
COMPUTER SCIENCE 44 46 45 48 48 48 46 46 47 48 46
PHYSICAL SCIENCES 84 82 82 83 83 82 83 82 83 83 83
ARCHITECTURE/ENVIR. ENG. 58 60 59 59 59 59 58 57 57 57 56
ENGINEERING 54 55 55 56 57 57 58 58 60 60 61
LIFE SCIENCES 73 64 62 62 63 64 66 67 70 71 71
EARTH & ENVIRONMENTAL SCI. 69 68 66 65 66 66 65 64 63 64 65
PSYCHOLOGY 73 73 73 74 74 74 74 74 74 75 76
SOCIAL SCIENCES 69 59 57 59 60 61 62 62 61 62 59
IHTERDISCIPL./OTHER SCIENCES 74 76 76 75 76 77 77 78 77 76 77
TOTAL OF SCIENCE,MATH & ENGINEERING 66 61 60 61 61 60 60 59 60 62 63
16-A 214

PERCENT OF STUDENTS WHO INTEND TO MAJOR IN MATH, SCIENCE, AND ENGINEERING WHO PLAN TO RECEIVE A GRADUATE DEGREE
(WHITE MALES)
INTENDEDMAJOR FIELD
MATH & STATISTICS
COMPUTER SCIENCE
PHYSICAL SCIENCES
ARCHITECTURE/ENVIR. ENG.
ENGINEERING
LIFE SCIENCES
EARTH & ENVIRONMENTAL SCI.
PSYCHOLOGY
SOCIAL SCIENCES
INTERDISCIPL./OTHER SCIENCES
TOTAL OF SCIENCE,MATH & ENGINEERING
1
1 1975
64
47
86
56
52
75
69
80
73
75
66
1977
66
'9
84
58
52
64
67
79
60
78
60
1978
65
49
84
57
52
62
65
79
57
76
58
1979
63
51
84
57
53
60
64
80
57
75
58
TEST
1980
63
50
55
57
54
61
65
80
59
76
58
YEAR
1981
64
49
83
57
54
61
64
79
60
76
58
1982
62
48
85
55
55
62
62
79
60
77
57
1983
63
47
83
54
56
63
62
79
58
78
57
1984
64
47
84
55
57
64
61
79
57
77
57
1985
63
48
83
53
57
66
60
79
57
76
58
1
1986 1
66
47
84
53
59
66
62
80
55
77
59
21516-B 216

PERCENT OF STUDENTS WHO INTEND TO MAJOR IN MATH,
IINTENDED
SCIENCE, AND ENGINEERING WHO PLAN TO RECEIVE .
(WHITE FEMALES)
TEST YEAR
GRADUATE DEGREE
I
MAJOR FIELD I 1975 1977 1978 1979 1980 1981 1982 1783 1984 1985 1986 I
MATH & STATISTICS 54 53 54 55 56 56 57 58 59 59 63
COMPUTER SCIENCE 33 34 34 38 40 39 39 40 40 40 37
PHYSICAL SCIENCES 72 74 74 75 77 76 76 76 79 80 81
ARCHITECTURE/ENVIR. ENG. 58 61 58 61 60 61 60 60 62 61 61
ENGINEERING 62 61 61 62 62 64 65 65 67 68 69
LIFE SCIENCES 68 59 58 59 60 62 65 66 69 70 69
EARTH & ENVIRONMENTAL SCI. 67 68 66 65 67 68 69 66 68 68 69
PSYCHOLOGY 68 69 68 70 70 71 71 71 72 73 74
SOCIAL SCIENCES 63 57 55 57 59 60 62 63 63 64 62
INTERDISCIPL./OTHER SCIENCES 66 69 71 70 72 75 75 75 74 73 75
TOTAL OF SCIENCE,MATH & ENGINEERING 64 60 59 60 61 61 61 60 62 65 66
2,17 16-C 218
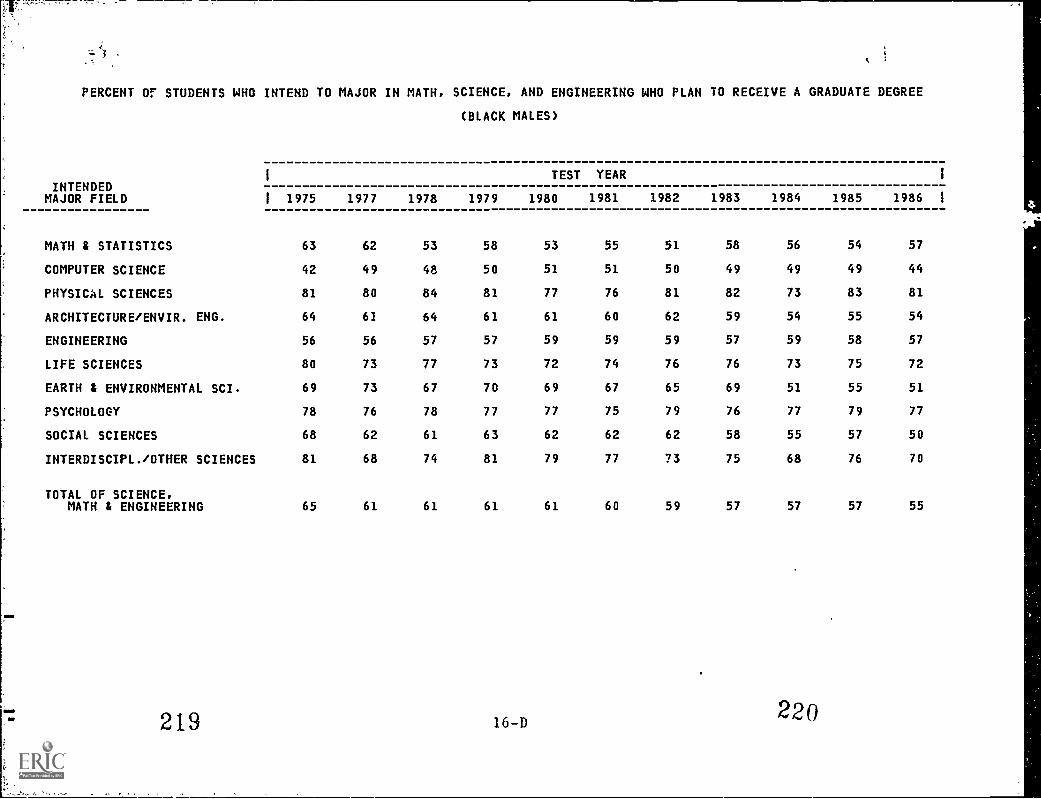
PERCENT or STUDENTS WHO INTEND TO MAJOR IN MATH, SCIENCE, AND ENGINEERING WHO PLAN TO RECEIVE A GRADUATE DEGREE
(BLACK MALES)
INTENDEDMAJOR FIELD
MATH & STATISTICS
COMPUTER SCIENCE
PHYSICAL SCIENCES
ARCHITECTURE/ENVIR. ENG.
ENGINEERING
LIFE SCIENCES
EARTH & ENVIRONMENTAL SCI.
PSYCHOLOGY
SOCIAL SCIENCES
INTERDISCIPL./OTHER SCIENCES
TOTAL OF SCIENCE,MATH & ENGINEERING
1
1 1975
63
42
81
64
56
80
69
78
68
81
65
1977
62
49
80
61
56
73
73
76
62
68
61
1978
53
48
84
64
57
77
67
78
61
74
61
1979
58
50
81
61
57
73
70
77
63
81
61
TEST
1980
53
51
77
61
59
72
69
77
62
79
61
YEAR
1981
55
51
76
60
59
74
67
75
62
77
60
1982
51
50
81
62
59
76
65
79
62
73
59
1983
58
49
82
59
57
76
69
76
58
75
57
1984
56
49
73
54
59
73
51
77
55
68
57
1985
54
49
83
55
58
75
55
79
57
76
57
1
1986 1
57
44
81
54
57
72
51
77
50
70
55

PERCENT OF STUDENTS WHO INTEND TO MAJOR IN MATH,
INTENDEDMAJOR FIELD 1 1975 1977 1978
MATH & STATISTICS 70 73 69
COMPUTER SCIENCE 48 47 49
PHYSICAL SCIENCES 83 77 87
ARCHITECTURE/ENVIR. ENG. 77 74 74
ENGINEERING 78 76 78
LIFE SCIENCES 87 81 82
EARTH & ENVIRONMENTAL SCI. 83 86 79
PSYCHOLOGY 86 85 86
SOCIAL SCIENCES 76 66 66
INTERDISCIPL./OTHER SCIENCES 74 81 76
TOTAL OF SCIENCE,MATH & ENGINEERING 79 73 73
SCIENCE, AND ENGINEERING WHO PLAN TO RECEIVE A GRADUATE DEGREE
(BLACK FEMALES)
TEST YEAR 1
1979 1980 1981 1982 1983 1984 1985 1986 1
69 72 73 71 72 68 65 73
54 54 56 55 54 53 50 48
90 85 92 90 87 87 83 82
74 73 69 72 71 65 75 69
75 77 76 74 76 76 73 71
84 83 83 85 85 86 86 86
83 79 70 72 81 72 66 68
84 63 84 84 84 83 84 83
68 66 68 68 67 67 65 64
77 84 81 80 86 76 74 90
74 73 72 70 68 67 68 68
221 16-E 12

PERCENT OF STUDENTS WHO INTEND TO MAJOR IN MATH,
1
INTENDEDMAJOR FIELD 1 1975 1977 1978
MATH & STATISTICS 72 72 72
COMPUTER SCIENCE 54 55 51
PHYSICAL SCIENCES 88 88 86
ARCHITECTURE/ENVIR. ENG. 68 66 64
ENGINEERING 65 63 64
LIFE SCIENCES 83 75 75
EARTH & ENVIRONMENTAL SCI. 77 75 71
PSYCHOLOGY 80 77 77
SOCIAL SCIENCES 75 63 62
INTERDISCIPL./OTHER SCIENCES 83 84 83
TOTAL OF SCIENCE,MATH & ENGINEERING 75 68 67
SCIENCE, AND ENGINEERING WHO PLAN TO RECEIVE A GRADUATE DEGREE
(OTHER STUDENTS)
TEST YEAR 1
1979 1980 1981 1982 1983 1984 1985 1986 1
67 71 69 65 68 71 68 70
53 54 54 52 52 54 54 51
86 87 87 87 86 86 88 87
63 65 65 64 62 63 62 62
64 64 65 65 65 66 66 66
76 76 78 78 79 81 83 82
71 72 68 71 66 65 68 68
79 79 78 80 79 76 77 81
62 64 65 67 67 67 67 65
82 85 84 81 84 85 85 84
67 67 67 66 65 66 67 68

PERCENT OF STUDENTS WHO INTEND TO MAJOR IN MATH, SCIENCE, AND ENGINEERING WHO PLAN TO RECEIVE A GRADUATE DEGREE(ALL STUDENTS)
INTENDEDMAJOR FIELD
TEST YEAR
I 1975 1977 1978 1979 1980 1981 1982 1983 1984 1985 1986 I
:MATH $ STATISTICS 61 61 61 60 61 61 60 62 62 62 65
, COMPUTER SCIENCE 44 46 45 48 48 48 46 46 47 48 46.
PHYSICAL SCIENCES
ASTRONOMY 85 85 83 81 82 82 82 83 82 83 86CHEMISTRY 78 76 77 77 79 77 78 76 77 77 78PHYSICS 91 91 89 91 90 89 90 88 90 90 89
4112CHITECTURE/ENVIR. ENG. 58 60 59 59 59 59 58 57 57 57 56
ENGINEERING
AEROSPACE ENGINEERING 53 56 55 57 57 59 60 60 61 62 63ELECTRICAL ENGINEERING 47 47 47 49 49 51 52 53 56 56 57CHEMICAL ENGINEERING 76 74 73 73 74 74 73 73 74 75 75MECHANICAL ENGINEERING 48 48 47 48 50 49 49 49 50 53 53CIVIL ENGINEERING 54 52 53 53 55 54 54 53 55 55 51OTHER ENGINEERING 56 58 58 59 60 60 61 61 63 63 65
;LIFE SCIENCES
AGRICULTURE 42 39 31 31 31 32 32 31 32 33 31BIOLOGICAL SCIENCES 81 74 74 73 74 75 77 78 79 80 81
.-EARTH & ENVIRONMENTAL SCI. 69 68 66 65 66 66 65 64 63 64 65
PSYCHOLOGY
CHILD PSYCHOLOGY 72 70 68 70 71 71 69 69 71 71 72GENERAL PSYCHOLOGY 74 75 75 76 76 76 76 77 77 77 78SOCIAL PSYCHOLOGY 71 69 68 70 69 71 71 71 71 73 67
-SOCIAL SCIENCES
ECONOMICS 79 80 79 79 78 81 81 82 81 81 81INTERNATIONAL RELATIONS 81 78 80 80 80 81 80 81 80 82 82LAW ENFORCEMENT 47 29 28 27 27 27 28 27 26 27 33POLITICAL SCIENCE 0 82 77 78 78 77 76 77 78 77 76SOCIOLOGY 0 52 52 53 54 51 53 53 54 55 50OTHER SOCIAL SCIENCES 69 59 60 61 62 61 62 63 63 64 61
`INTERDISCIPL./OTHER SCIENCES 74 76 76 75 76 77 77 78 77 76 77
'TOTAL OF SCIENCE,L MATHAMOINEERING 66 61 60 61 61 60 60 59 60 62 63 226, 4.....)

':.?g 1.4,;.^
PERCENT OF STUDENTS WHO INTEND TO MAJOR IN MATH, SCIENCE, AND ENGINEERING WHO PLAN TO RECEIVE A GRADUATE DEGREE(WHITE MALES)
INTENDEDMAJOR FIELD
MATH & STATISTICS
COMPUTER SCIENCE
PHYSICAL SCIENCES
ASTRONOMYCHEMISTRYPHYSICS
ARCHITECTURE/ENVIR. ENG.
ENGINEERING
AEROSPACE ENGINEERINGELECTRICAL ENGINEERINGCHEMICAL ENGINEERINGMECHANICAL ENGINEERINGCIVIL ENGINEERINGOTHER ENGINEERING
LIFE SCIENCES
AGRICULTUREBIOLOGICAL SCIENCES
EARTH & ENVIRONMENTAL SCI.
PSYCHOLOGY
CHILD PSYCHOLOGYGENERAL PSYCHOLOGYSOCIAL PSYCHOLOGY
SOCIAL SCIENCES
ECONOMICSINTERNATIONAL RELATIONSLAW ENFORCEMENTPOLITICAL SCIENCESOCIOLOGYOTHER SOCIAL SCIENCES
INTERDISCIPL./OTHER SCIENCES
TOTAL OF SCIENCE,MATH & ENGINEERING
1 1975
64
47
878191
56
524575455053
3786
69
838077
8287460
0
73
75
66
1977
66
49
867890
58
544475454956
3778
67
788076
818424836165
78
60
1978
65
49
837989
57
534471454956
2978
65
768074
828524775865
76
58
1979
63
51
827891
57
554673464956
2876
64
758177
818522786066
75
58
TEST
1980
63
50
838089
57
554674475057
2977
65
808173
768522796067
76
58
YEAR
1981
64
49
817889
57
574872464957
2877
64
827977
828421765365
76
58
1982
62
48
837990
55
584972464957
2778
62
748075
828223745865
77
57
1983
63
47
837688
54
585172474858
2779
62
758077
828522776165
78
57
1984
64
47
837789
55
595372485160
2779
61
758074
838422765465
77
57
1985
63
48
827689
53
615373505060
2780
60
747980
818623756065
76
58
1
1986 1
66
47
867689
53
615573514862
2781
62
798075
818425756162
77
59
22717-B 228

PERCENT OF STUDFNTS WHO INTEND TO MAJOR IN MATH,
1
INTENDEDMAJOR FIELD 1 1975 1977 1978
MATH & STATISTICS 54 53 54
COMPUTER SCIENCE 33 34 34
PHYSICAL SCIENCES
ASTRONOMY 79 83 84CHEMISTRY 69 70 69PHYSICS 83 88 89
ARCHITECTURE/ENVIR. ENG. 58 61 58
ENGINEERING
AEROSPACE ENGINEERING 60 65 61ELECTRICAL ENGINEERING 59 57 55CHEMICAL ENGINEERING 70 68 71MECHANICAL ENGINEERING 56 52 53CIVIL ENGINEERING 58 53 56OTHER ENGINEERING 62 61 61
LIFE SCIENCES
AGRICULTURE 46 39 30BIOLOGICAL SCIENCES 72 67 67
EARTH & ENVIRONMENTAL SCI. 67 68 66
PSYCHOLOGY
CHILD PSYCHOLOGY 67 66 63GENERAL PSYCHOLOGY 69 71 71SOCIAL PSYCHOLOGY 65 64 62
SOCIAL SCIENCES
ECONOMICS 67 75 73INTERNATIONAL RELATIONS 77 72 77LAW ENFORCEMENT 42 31 30POLITICAL SCIENCE 0 79 74SOCIOLOGY 0 46 45OTHER SOCIAL SCIENCES 62 55 56
INTERDISCIPL./OTHER SCIENCES 66 69 71
TOTAL OF SCIENCE,MATH I ENGINEERING 64 60 59
SCIENCE, AND ENGINEERING WHO PLAH TO RECEIVE A GRADUATE DEGREE(WHITE FEMALES)
TEST YEAR
1979 1980 1981 1982 1983 1984 1985 1986
55 56 56 57 58 59 59 63
38 40 39 39 40 40 40 37
76 77 81 76 80 81 87 8771 74 72 74 72 76 75 7787 91 88 84 89 89 90 86
61 60 61 60 60 62 61 61
60 63 61 67 65 69 69 7255 59 62 59 61 65 63 6368 70 69 72 71 73 75 7350 55 56 54 56 57 62 5857 57 55 62 55 60 67 6063 62 66 66 65 67 68 70
30 31 34 36 34 36 38 3468 69 70 73 73 76 76 77
65 67 68 69 66 68 68 69
67 68 68 66 67 70 69 7072 72 73 73 74 74 75 7766 66 68 68 68 69 69 64
76 76 78 76 77 79 78 7876 78 78 79 79 78 79 8130 31 30 31 32 31 31 3876 78 77 77 77 78 78 7647 50 49 50 48 54 52 4657 58 58 59 61 62 63 61
70 72 75 75 75 74 73 75
60 61 61 61 60 62 65 66
- 229
2 39
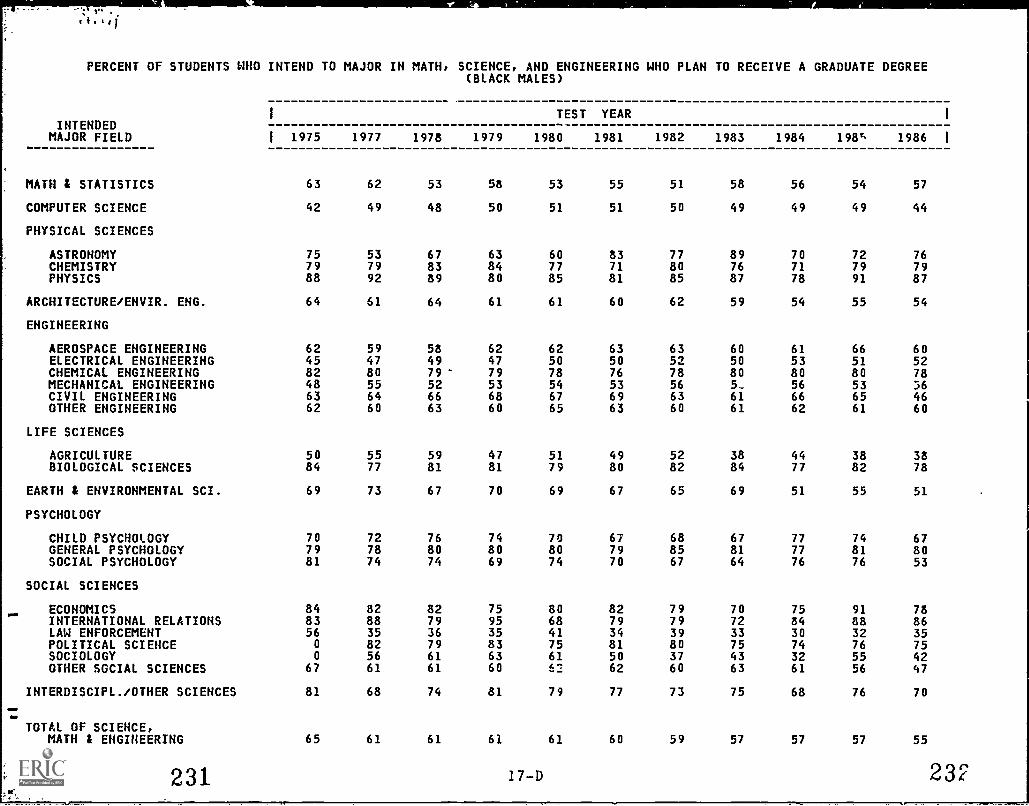
PERCENT OF STUDENTS WHO INTEND TO MAJOR IN MATH,
INTENDEDMAJOR FIELD 1 1975 1977 1978
MATH & STATISTICS 63 62 53
COMPUTER SCIENCE 42 49 48
PHYSICAL SCIENCES
ASTRONOMY 75 53 67CHEMISTRY 79 79 83PHYSICS 88 92 89
ARCHITECTURE/ENVIR. ENG. 64 61 64
ENGINEERING
AEROSPACE ENGINEERING 62 59 58ELECTRICAL ENGINEERING 45 47 49CHEMICAL ENGINEERING 82 80 79MECHANICAL ENGINEERING 48 55 52CIVIL ENGINEERING 63 64 66OTHER ENGINEERING 62 60 63
LIFE SCIENCES
AGRICULTURE 50 55 59BIOLOGICAL SCIENCES 84 77 81
EARTH & ENVIRONMENTAL SCI. 69 73 67
PSYCHOLOGY
CHILD PSYCHOLOGY 70 72 76GENERAL PSYCHOLOGY 79 78 80SOCIAL PSYCHOLOGY 81 74 74
SOCIAL SCIENCES
ECONOMICS 84 82 82INTERNATIONAL RELATIONS 83 88 79LAW ENFORCEMENT 56 35 36POLITICAL SCIENCE 0 82 79SOCIOLOGY 0 56 61OTHER SOCIAL SCIENCES 67 61 61
INTERDISCIPL./OTHER SCIENCES 81 68 74
TOTAL OF SCIENCE,MATH & ENGINEERING 65 61 61
SCIENCE, AND ENGINEERING WHO PLAN TO RECEIVE A GRADUATE DEGREE(BLACK MALES)
TEST YEAR I
1979 1980 1981 1982 1983 1984 198c 1986
58 53 55 51 58 56 54 57
50 51 51 50 49 49 49 44
63 60 83 77 89 70 72 7684 77 71 80 76 71 79 7980 85 81 85 87 78 91 87
61 61 60 62 59 54 55 54
62 62 63 63 60 61 66 6047 50 50 52 50 53 51 5279 78 76 78 80 80 80 7853 54 53 56 5_ 56 53 3668 67 69 63 61 66 65 4660 65 63 60 61 62 61 60
47 51 49 52 38 44 38 3881 79 80 82 84 77 82 78
70 69 67 65 69 51 55 51
74 70 67 68 67 77 74 6780 80 79 85 81 77 81 8069 74 70 67 64 76 76 53
75 80 82 79 70 75 91 7895 68 79 79 72 84 88 8635 41 34 39 33 30 32 3583 75 81 80 75 74 76 7563 61 50 37 43 32 55 4260 62 62 60 63 61 56 47
81 79 77 73 75 68 76 70
61 61 60 59 57 57 57 55
231 17-D 232

PERCENT OF STUDENTS WHO INTEND TO MAJOR IN MATH, SCIENCE, AND ENGINEERAhG WNO PLAN TO RECEIVE A GRADUATE DEGREE
INTENDEDMAJOR FIELD
MATH & STATISTICS
COMPUTER SCIENCE
PHYSICAL SCIENCES
ASTRONOMYCHEMISTRYPHYSICS
ARCNITECTURE/ENVIR. ENG.
ENGINEERING
AEROSPACE ENGINEERINGELECTRICAL ENGINEERINGCHEMICAL ENGINEERINGMECHANICAL ENGINEERINGCIVIL ENGINEERINGOTHER ENGINEERING
LIFE SCIENCES
AGRICULTUREBIOLOGICAL SCIENCES
EARTH & ENVIRONMENTAL SCI.
PSYCHOLOGY
CHILD PSYCHOLOGYGENERAL PSYCHOLOGYSOCIAL PSYCHOLOGY
SOCIAL SCIENCES
ECONOMICSINTERNATIONAL RELATIONSLAW ENFORCEMENTPOLITICAL SCIENCESOCIOLOGYOTHER SOCIAL SCIENCES
INTERDISCIPL./OTHER SCIENCES
'TOTAL OF SCIENCE,MATH & ENGINEERING
233
I
(BLACK FEMALES)
TEST YEARI
1 1975 1977 1978 1979 1980 1981 1982 1983 1984 1985 1986 I
70 73 69 69 72 73 71 72 68 65 73
48 47 49 54 54 56 55 54 53 50 48
50 83 100 100 78 100 67 80 71 100 9183 78 88 90 86 90 91 87 88 82 79100 71 78 88 82 100 86 89 86 89 100
77 74 74 74 73 69 72 71 65 75 69
64 76 84 86 70 76 73 81 78 68 6972 65 70 72 65 69 69 71 71 71 6996 83 81 80 84 82 82 83 83 80 8271 83 65 68 77 73 73 77 71 69 6479 68 81 71 80 74 74 76 74 70 7175 78 79 76 79 78 75 75 79 75 71
78 74 47 '3 60 55 73 67 68 62 6088 82 84 85 85 85 86 86 87 87 88
83 86 79 83 79 70 72 81 72 66 68
84 82 82 82 79 80 80 81 80 81 8288 88 88 86 87 88 87 87 85 86 8581 82 86 82 80 84 88 78 82 80 71
81 70 74 74 78 81 89 89 81 64 8079 95 87 86 83 85 89 86 79 83 8468 61 58 59 54 59 57 53 56 51 630 86 82 81 82 83 83 78 83 81 790 64 63 60 61 60 65 63 50 58 48
76 61 65 67 65 66 63 63 65 63 60
74 81 76 77 84 81 80 86 76 74 90
79 73 73 74 73 72 70 68 67 68 68 234

PERCENT OF STUDENTS WHO INTEND TO MAJOR IN MATH, SCIENCE, AND ENGINEERING WHO PLAN TO RECEIVE A GRADUATE DEGREE
INTENDEDMAJOR FIELD
MATH & STATISTICS
COMPUTER SCIENCE
PHYSICAL SCIENCES
ASTRONOMYCHEMISTRYPHYSICS
ARCHITECTURE/ENVIR. ENG.
ENGINEERING
AEROSPACE ENGINEERINGELECTRICAL ENGINEERINGCHEMICAL ENGINEERINGMECHANICAL ENGINEERINGCIVIL ENGINEERINGOTHER ENGINEERING
LIFE SCIENCES
AGRICULTUREBIOLOGICAL SCIENCES
EARTH & ENVIRONMENTAL SCI.
PSYCHOLOGY
CHILD PSYCHOLOGYGENERAL PSYCHOLOGYSOCIAL PSYCHOLOGY
SOCIAL SCIENCES
ECONOMICSINTERNATIONAL RELATIONSLAW ENFORCEMENTPOLITICAL SCIENCESOCIOLOGYOTHER SOCIAL SCIENCES
INTERDISCIPL./OTHER SCIENCES
TOTAL OF SCIENCE,MATH & ENGINEERING
1
1 1975
72
54
928395
68
585782647268
5587
77
798275
8684500
0
74
83
75
1977
72
55
918394
66
615779576267
4882
75
718073
848634845663
84
68
1978
72
51
918191
64
625779566767
4183
71
728174
828137835962
83
67
(OTHER STUDENTS)
TEST
1979 1980
67 71
53 54
87 8679 8493 92
63 65
63 6358 5879 7857 6165 6568 67
45 4283 83
71 72
77 7782 8271 73
79 8482 7833 2983 7955 6063 65
82 85
47 67
YEAR
1981
69
54
858293
65
646083606568
4484
68
738074
828033815565
84
67
1982
65
52
868292
64
656177576169
4385
71
758378
867934815368
81
66
1983
68
52
868389
62
666076566668
4185
66
748177
907832796367
84
65
1984
71
54
838192
63
676480566369
3986
65
737972
817732856468
85
66
1985
68
54
858493
62
666279626470
4787
68
728076
868431805968
85
67
1
1986 1
70
51
828593
62
686379596170
4686
68
798273
868239805964
84
68
23517-F 236
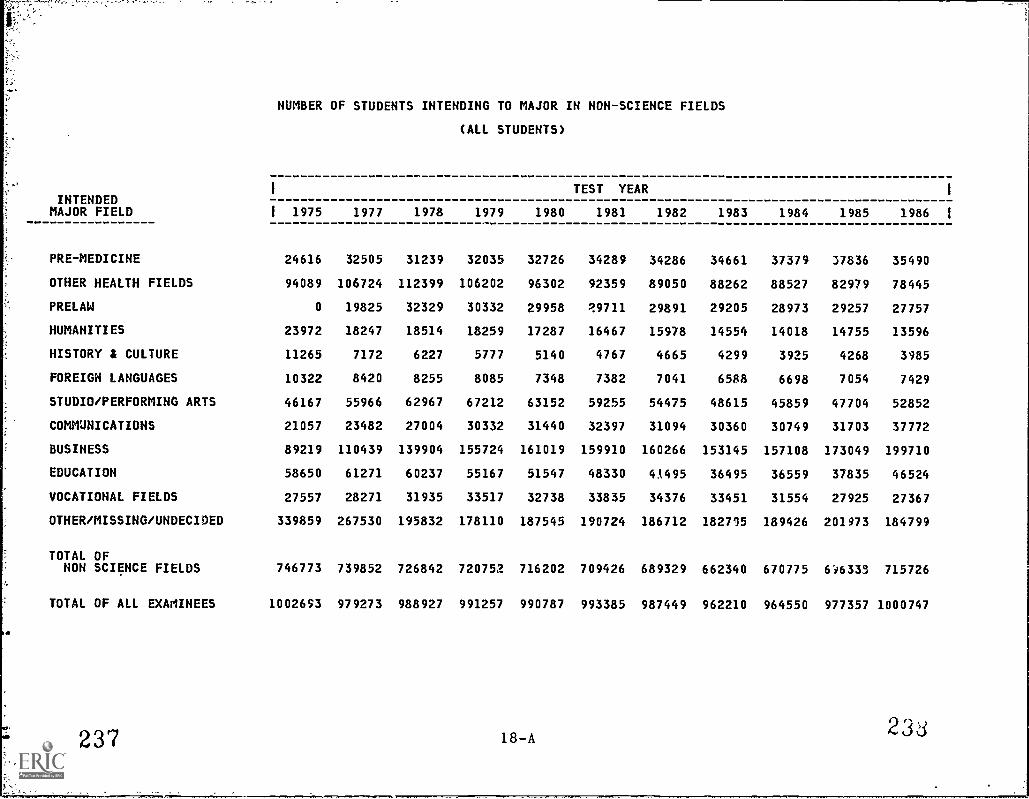
NUMBER OF STUDENTS INTENDING TO MAJOR IN NON-SCIENCE FIELDS
(ALL STUDENTS)
INTENDEDTEST YEAR
MAJOR FIELD I 1975 1977 1978 1979 1980 1981 1982 1983 1984 1985 1986
PRE-MEDICINE 24616 32505 31239 32035 32726 34289 34286 34661 37379 37836 35490
OTHER HEALTH FIELDS 94089 106724 112399 106202 96302 92359 89050 88262 88527 82979 78445
PRELAW 0 19825 32329 30332 29958 29711 29891 29205 28973 29257 27757
HUMANITIES 23972 18247 18514 18259 17287 16467 15978 14554 14018 14755 13596
HISTORY & CULTURE 11265 7172 6227 5777 5140 4767 4665 4299 3925 4268 3985
FOREIGN LANGUAGES 10322 8420 8255 8085 7348 7382 7041 6588 6698 7054 7429
STUDIO/PERFORMING ARTS 46167 55966 62967 67212 63152 59255 54475 48615 45859 47704 52852
COMMUNICATIONS 21057 23482 27004 30332 31440 32397 31094 30360 30749 31703 37772
BUSINESS 89219 110439 139904 155724 161019 159910 160266 153145 157108 173049 199710
EDUCATION 58650 61271 60237 55167 51547 48330 4A495 36495 36559 37835 46524
VOCATIONAL FIELDS 27557 28271 31935 33517 32738 33835 34376 33451 31554 27925 27367
OTHER/MISSING/UNDECIDED 339859 267530 195832 178110 187545 190724 186712 182715 189426 201973 184799
TOTAL OFNON SCIENCE FIELDS 746773 739852 726842 720752 716202 709426 689329 662340 670775 6A333 715726
TOTAL OF ALL EXAMINEES 1002693 979273 988927 991257 990787 993385 987449 962210 964550 977357 1000747
237 18-A23d

NUMBER OF STUDENTS INTENDING TO MAJOR IN NON-SCIENCE FIELDS
(WHITE MALES)
INTENDEDMAJOR FIELD
PRE-MEDICINE
OTHER HEALTH FIELDS
PRELAW
HUMANITIES
HISTORY 11 CULTURE
FOREIGN LANGUAGES
STUDIO/PERFORMING ARTS
COMMUNICATIONS
BUSINESS
EDUCATION
VOCATIONAL ;.IELDS
OTHER/MISSING/UNDECIDED
TOTAL OFNON SCIENCE FIELDS
TOTAL OF ALL EXAMINEES
1
1 1975
11928
13278
0
7738
6092
1203
12488
9965
44432
12007
12480
135374
266985
410443
1977
15185
/8171
9881
5947
3726
1191
14466
9518
48693
11330
13600
107089
258597
383280
1978
13959
19213
15887
5645
3217
955
15802
10550
58897
11001
16841
79134
249101
383173
1979
13411
18329
14522
5431
3053
9L.
16680
11388
63512
10080
15444
71644
:44405
382077
1980
13168
16350
13448
5306
2777
955
15928
11456
63011
9035
15040
72429
238903
376858
TEST YEAR
'1981 1982
13457 13168
15215 13605
13055 12528
5257 5195
2610 2567
1006 1008
15475 14435
11706 11016
59355 58536
8306 7142
15457 15478
73409 70187
23408 224863
377193 373421
1983
12979
12931
12147
4948
2344
947
12894
10731
55528
6317
14572
67859
214197
362742
1984
13954
13826
11563
4576
2206
959
12298
10411
56899
6446
13794
63696
210628
355433
1985
13871
13739
11675
4875
2330
977
12769
10801
63995
6591
12410
55322
219355
356971
1986
11793
14128
10208
4695
2316
1121
14623
11058
72639
7990
13283
68060
231914
366553
1

NUMBER OF STUDENTS INTENDING TO MAJOR IN NON-SCIENCE FIELDS
(WHITE FEMALES)
INTENDED$ TEST YEAR
MAJOR FIELD I 1975 1977 1978 1979 1980 1981 1982 1983 1984 1985 1986
PRE-MEDICINE 7490 9901 9359 10214 10497 11387 11670 11768 12628 12828 11466
OTHER HEALTH FIELDS 66031 69156 71577 67321 60870 58651 57069 56734 55986 51233 46730
PRELAW 0 5852 10400 10007 10674 10922 11660 11515 11892 11818 11385
HUMANITIES 13494 9953 10406 10314 9610 9043 8725 7691 7528 7980 7119
HISTORY I CULTURE 3806 2587 2162 2013 1716 1610 1513 1457 1266 1409 1200
FOREIGN LANGUAGES 7855 6130 5924 5836 51S1 5211 4852 4554 4648 4908 5053
STUDIO/PERFORMING ARTS 26988 31839 35561 38570 35944 33360 30387 27243 25486 26588 28663
COMMUNICATIONS 7729 9593 11079 12983 13730 14180 13651 13756 14319 14717 19223
BUSINESS 29641 40538 53640 61628 65953 68465 69773 67783 69590 73861 82619
EDUCATION 38359 39930 39094 36097 34251 32945 28250 24914 25130 26248 31957
VOCATIONAL FIELDS 10656 8981 10142 10869 10427 10606 10907 10591 9851 8351 7222
OTHER/MISSING/UNDECIDED 13247( 98938 69632 62847 66417 68856 67250 65868 62936 64209 62920
TOTAL OFNON SCIENCE FIELDS 344525 333398 328976 328699 325250 325236 315707 303874 301260 304150 315557
TOTAL OF ALL EXAMINEES 422126 406957 408455 410630 407369 409193 404065 391595 386280 385930 39768.
18-C
241242
I

NUMBER OF STUDENTS INTENDING TO MAJOR IN NON-SCIENCE FIELDS
(BLACK MALES)
INTENDEDMAJOR FIELD
PRE-MEDICINE
OTHER HEALTH FIELDS
PRELAW .
HUMANITIES
HISTORY & CULTURE
FOREIGN LANGUAGES
STUDIO/PERFORMING ARTS
COMMUNICATIONS
BUSINESS
EDUCATION
VOCATIONAL FIELDS
OTHER/MISSING/UNDECIDED
TOTAL OFNON SCIENCE FIELDS
TOTAL OF ALL EXAMINEES
1
1 1975
861
1233
0
393
455
53
1493
1012
3398
1806
1228
10410
22342
30396
1977
1116
1516
897
343
261
59
1930
1133
4085
1858
1399
8209
22806
31581
1978
1068
1692
1127
378
253
56
2334
1433
5219
1804
1611
5770
22745
33072
1979
1037
1689
1189
377
196
65
2255
1544
5769
1666
1766
5188
22741
33467
1980
1079
1442
1074
308
180
56
2112
1528
5849
1380
1740
5878
22626
33999
TEST YEAR
1981
1047
1392
1022
298
150
59
1821
1509
5489
1161
1850
5855
21653
33481
1982
1020
1213
995
266
137
55
1670
1478
5422
912
1794
5992
20954
33162
1983
1053
1230
969
221
115
41
1500
1262
4847
785
1852
5591
19466
32127
1984
1094
1209
979
235
92
41
1358
1257
4967
720
1783
5484
19219
31671
1985
1030
111,
868
207
115
48
1248
1240
5885
664
1528
5677
19647
31251
1
1986 1
956
1150
882
175
101
80
1368
1390
7292
878
1605
5564
21441
33520

NUMBER OF STUDENTS INTENDING TO MAJOR IN NON-SCIENCE FIELDS
(BLACK FEMALES)
INTENDEDMAJOR FIELD
PRE-MEDICINE
OTHER HEALTH FIELDS
PRELAW
HUMANITIES
HISTORY & CULTURE
FOREIGN LANGUAGES
STUDIO/PERFORMING ARTS
COMMUNICATIONS
BUSINESS
EDUCATION
VOCATIONAL FIELDS
OTHER /MISSING /UNDECIbED
TOTAL OFNON SCIENCE FIELDS
TOTAL OF ALL EXAMINEES
I
1 1975
1431
6621
0
842
276
253
2024
1115
5385
3311
1263
15173
37694
44523
1977
1933
8101
1204
617
134
241
2964
1468
7240
38 2
1487
10453
39684
47900
1978
2125
8697
1804
611
102
242
3384
1811
8608
3659
1822
6825
39690
49481
1979
2280
8069
1815
626
86
239
3495
2014
9770
3270
1807
6586
40057
50049
1980
2458
7392
1837
481
77
208
3060
2232
10209
2911
1941
7822
40628
51128
TEST YEAR
1981
2521
7147
1847
443
62
236
2807
2367
10139
2349
2102
7675
39695
50494
1982
2454
7010
1795
433
64
219
2409
2282
9642
1880
2101
7745
38034
49409
1983
2505
7255
1726
376
47
203
1944
2112
8925
1579
2323
7597
36592
48294
1984
2681
7265
1754
375
46
201
1878
2145
8997
1443
2270
7010
36065
47778
1985
2646
6524
1948
353
63
211
2007
2210
9960
1421
1902
7568
36813
47511
1986
2850
6117
2089
284
52
229
1956
2506
11958
1807
1484
6122
37454
49283
I
1

NUMBER OF STUDENTS INTENDING TO MAJOR IN NONSCIENCE FIELDS
(OTHER STUDENTS)
INTENDEDMAJOR FIELD
PREMEDICINE
OTHER HEALTH FIELDS
PRELAW
HUMANITIES
HISTORY & CULTURE
FOREIGN LANGUAGES
STUDIO/PERFORMING ARTS
COMMUNICATIONS
BUSINESS
EDUCATION
VOCATIONAL FIELDS
OTHER/MISSING/UNDECIDED
TOTAL OFNON SCIENCE FIELDS
TOTAL OF ALL EXAMINEES
1
1 1975
2906
6926
0
1505
636
958
3174
1236
6363
3167
1930
46426
75227
95205
1977
4370
9780
1991
1387
464
999
4767
1770
9883
4311
2804
42841
85367
109555
1978
4728
11220
3111
1474
493
1078
5886
2131
13540
4679
3519
34471
86330
114746
1979
5093
10794
2799
1511
429
1034
6212
2403
15045
4054
3631
31845
84850
115034
19E0
5524
10248
2925
1582
390
968
6108
2494
15997
3970
3590
34999
88795
121433
TEST YEAR
1981 1982
5877 5974
9954 10153
2865 2913
1426 1359
335 384
870 907
5792 5574
2`;35 2669
16462 16893
3569 3311
3820 4096
34929 35538
$8534 89771
123024 127392
1983
6356
10112
2848
1318
336
843
5034
2499
16062
2900
4113
35790
88211
127452
1984
7022
10241
2785
1304
315
849
4839
2617
16655
2820
3856
50300
103603
143388
1985
7461
10366
2928
1340
351
910
5092
2735
19348
2911
3734
59197
116373
155694
1986
8425
10320
3193
1323
316
946
6242
3595
25202
3892
3773
42133
109360
153707
1
1
- 24718-F 248

PERCENT OF EXAMINEES PLANNING TO MAJOR IN NON-SCIENCE FIELDS
(ALL STUDENTS)
INTENDEDTEST YEAR
MAJGR FIELD 1 1975 1977 1978 1979 1980 1981 1982 1983 1984 1985 1986
PRE-MEDICINE 2.45 3.32 3.16 3.23 3.30 3.45 3.47 3.60 3.88 3.87 3.55
OTHER HEALTH FIELDS 9.38 10.90 11.37 10.71 9.72 9.30 9.02 9.17 9.18 8.49 7.84
PRELAW 0.00 2.02 3.27 3.06 3.02 2.99 3.03 3.04 3.00 2.99 2.77
HUMANITIES 2.39 1.86 1.87 1.84 1.74 1.66 1.62 1.51 1.45 1.51 1.36
HISTORY & CULTURE 1.12 0.73 0.63 0.58 0.52 0.48 0.47 0.45 0.41 0.44 0.40
FOREIGN LANGUAGES 1.03 0.86 0.83 0.82 0.74 0.74 0.71 0.68 0.69 0.72 0.74
STUDIO/PERFORMING ARTS 4.60 5.72 6.37 6.78 6.37 5.96 5.52 5.05 4.75 4.88 5.28
COMMUNICATIONS 2.10 2.40 2.73 3.06 3.17 3.26 3.15 3.16 3.19 3.24 3.77
BUSINESS 8.90 11.28 14.15 15.71 16.25 16.10 16.23 15.92 16.29 17.71 19.96
EDUCATION 5.85 6.26 6.09 5.57 5.20 4.87 4.20 3.79 3.79 3.87 4.65
VOCATIONAL FIELDS 2.75 2.89 3.23 3.38 3.30 3.41 3.48 3.48 3.27 2.86 2.73
OTHER/MISSING/UNDECIDED 33.89 27.32 19.80 17.97 18.93 19.20 18.91 18.99 19.64 20.67 18.47
TOTAL OFNON SCIENCE FIELDS 74.48 75.55 73.50 72.71 72.29 71.41 69.81 68.84 69.54 71.25 71.52
TOTAL OF ALL EXAMINEES 1002693 979273 988927 991257 990787 993385 987449 962210 964550 977357 1000747
249 19-A
1

PERCENT OF EXAMINEES PLANNING TO MAJOR IN NON-SCIENCE FIELDS
(WHITE MALES)
INTENDEDMAJOR FIELD
PRE-MEDICINE
OTHER HEALTH FIELDS
PRELAW
HUMANITIES
HISTORY & CULTURE
FOREIGN LANGUAGES
STUDIO/PERFORMING ARTS
COMMUNICATIONS
BUSINESS
EDUCATION
VOCATIONAL FIELDS
OTHER/MISSING/UNDECIDED
TOTAL OFNON SCIENCE FIELDS
TOTAL OF ALL EXAMINEES
I
1 1975
2.91
3.24
0.00
1.89
1.48
0.29
3.04
2.43
10.83
2.93
3.04
32.98
65.05
410443
1977
3.96
4.74
2.58
1.55
0.97
0.26
3.77
2.48
12.70
2.96
3.55
27.94
67.47
383280
1978
3.64
5.01
4.15
1.47
0.84
0.25
4.12
2.75
15.37
2.87
3.87
20.65
65.01
383173
1979
3.51
4.80
3.80
1.42
0.80
0.24
4.37
2.98
16.62
2.64
4.04
18.75
63.97
382077
1980
3.49
4.34
3.57
1.41
0.74
0.25
4.23
3.04
16.72
2.40
3.99
19.22
63.39
376858
TEST YEAR
1981 197,2
3.57 3.53
4.03 3.64
3.46 3.35
1.39 1.39
0.69 0.69
0.27 0.27
4.13 3.87
3.10 2.95
15.74 15.68
2.20 1.91
4.10 4.14
19.46 18.80
62.12 60.22
377193 373421
1983
3.58
3.56
3.35
1.36
0.65
0.26
3.55
2.96
15.31
1.74
4.02
18.71
59.05
362742
1984
3.93
3.89
3.25
1.29
0.62
0.27
3.46
2.93
16.01
1.81
3.88
17.92
59.26
355433
1985
3.89
3.85
3.27
1.37
0.65
0.27
3.58
3.03
17.93
1.85
3.48
18.30
61.45
356971
I
1986 I
3.22
3.85
2.78
1.28
0.63
0.31
3.99
3.02
19.82
2.18
3.62
18.57
63.27
366353

PERCENT OF EXAMINEES PLANNING TO MAJOR IN NON-SCIENCE FIELDS
(WHITE FEMALES)
INTENDEDMAJOR FIELD
PRE-MEDICINE
OTHER HEALTH FIELDS
PRELAW
HUSANITIES
HISTORY & CULTURE
FOREIGN LANGUAGES
STUDIO/PERFORMING ARTS
COMMUNICATIONS
BUSINESS
EDUCATION
VOCATIONAL FIELDS
OTHER/MISSIhJ/UNDECIDED
TOTAL OFNON SCIENCE FIELDS
TOTAL OF ALL EXAMINEES
1
1 1975
1.77
15.64
0.00
3.20
0.90
1.86
6.39
1.83
7.02
9.09
2.52
31.38
81.6?
422126
1977
2.43
16.99
1.44
2.45
0.64
1.51
7.82
2.36
9.96
9.81
2.21
24.31
81.92
406957
1978
2.29
17.52
2.55
2.55
0.53
1.45
8.71
2.71
13.13
9.57
2.48
17.05
80.54
408455
1979
2.49
16.39
2.44
2.51
0.49
1.42
9.39
3.16
15.01
8.79
2.65
15.31
80.05
410630
1980
2.58
14.94
2.62
2.36
0.42
1.27
8.82
3.37
16.19
8.41
2.56
16.30
79.84
407369
TEST YEAR
1981 1982
2.78 2.89
14.33 14.12
2.67 2.89
2.21 2.16
0.39 0.37
1.27 1.20
8.15 7.52
3.47 3.38
16.73 17.27
8.05 6.99
2.59 2.70
16.83 16.64
79.48 78.13
409193 404065
1983
3.01
14.49
2.94
1.96
0.37
1.16
6.96
3.51
17.31
6.36
2.70
16.82
77.60
391595
1984
3.27
14.49
3.08
1.95
0.33
1.20
6.60
3.71
18.02
6.51
2.55
16.29
77.99
386280
1985
3.32
13.28
3.06
2.07
0.37
1.27
6.89
3.81
19.14
6.40
2.16
16.64
78.81
385930
1
1986 1
2.88
11.75
2.86
1.79
0.30
1.27
7.21
4.83
20.78
8.04
1.82
15.82
79.35
397684

PERCENT OF EXAMINEES PLANNING TO MAJOR IN NON-SCIENCE FIELDS
(BLACK MALES)
INTENDEDMAJOR FIELD
PRE-MEDICINE
OTHER HEALTH FIELDS
PRELAW
HUMANITIES
HISTORY & CULTURE
FOREIGN LANGUAGES
STUDIO/PERFORMING ARTS
COMMUNICATIONS
BUSINESS
EDUCATION
VOCATIONAL FIELDS
OTHER/MISSING/UNDECIDED
TOTAL OFNON SCIENCE FIELDS
TOTAL OF ALL EXAMINEES
1
1 1975
2.83
4.06
0.00
1.29
1.50
0.17
4.91
3.33
11.18
5.94
4.04
34.25
73.50
30396
1977
3.53
4.80
2.84
1.09
0.83
0.19
6.11
3.59
12.93
5.88
4.43
25.99
72.21
31581
1978
3.23
5.12
3 41
1.14
0.76
0.17
7.06
4.33
15.78
5.45
4.E7
17.45
68.77
33072
1979
3.10
5.05
3.55
1.13
0.59
0.19
6.74
4.61
17.24
4.98
5.28
15.50
67.95
33467
1980
3.17
4.24
3.16
0.91
0.53
0.16
6.21
4.49
17.20
4.06
5.12
17.29
66.55
33999
TEST YEAR
1981
3.13
4.16
3.05
0.89
0.45
0.18
5.44
4.51
16.39
3.47
5.53
17.49
64.67
33481
198,.
3.08
3.66
3.00
0.80
0.41
0.17
5.04
4.46
16.35
2.75
5.41
18.07
63.19
33162
1983
3.28
3.83
3.02
0.69
0.36
0.13
4.67
3.93
15.09
2.44
5.76
17.40
60.59
32127
1984
3.45
3.82
3.09
0.74
0.29
0.13
4.29
3.97
15.68
2.27
5.63
17.32
60.68
31671
1985
3.30
3.57
2.84
0.66
0.37
0.15
3.99
3.97
18.83
2.12
4.89
18.17
62.87
31251
I
1986 1
2.85
3.43
2.63
0.52
0.30
0.24
4.08
4.15
21.75
2.62
4.79
16.60
63.96
33520
255 19-D 256

PERCENT OF EXAMINEES PLANNING TO MAJOR IN NON-SCIENCE FIELDS
(BLACK FEMALES)
INTENDEDI TEST YEAR
MAJOR FIELD I 1975 1977 1978 1979 1980 1981 1982 1983 1984 1985 1986
PRE-MEDICINE 3.21 4.04 4.29 4.56 4.81 4.99 4.97 5.19 5.61 5.57 5.78
OTHER HEALTH FIELDS 14.87 16.91 17.58 16.12 14.46 14.15 14.19 15.02 15.21 13.73 12.41
PRELAW 0.00 2.51 3.65 3.63 3.59 3.66 3.63 3.57 3.67 4.10 4.24
HUMANITIES 1.89 1.29 1.23 1.25 0.94 0.88 0.88 0.78 0.78 0.74 0.58
HISTORY & CULTURE 0.62 0.28 0.21 0.17 0.15 0.12 0.13 0.10 0.10 0.13 0.11
FOREIGN LANGUAGES 0.57 0.50 0.49 0.48 0.41 0.47 0.44 0.42 0.42 0.44 0.46
STUDIO/PERFORMING ARTS 4.55 6.19 6.t4 6.98 5.98 5.56 4.88 4.03 3.93 4.22 3.97
COMMUNICATIONS 2.50 3.06 3.66 4.02 4.37 4.69 4.62 4.37 4.49 4.65 5.08
BUSINESS 12.09 15.11 17.40 19.52 19.97 20.08 19.51 18.48 18.83 20.96 24.26
EDUCATION 7.44 8.02 7.39 6.53 5.69 4 65 3.80 3.27 3.02 2.99 3.67
VOCATIONAL FIELDS 2.84 3.10 3.68 3.61 3.80 4.16 4.25 4.81 4.75 4.00 3.01
OTHER/MISSING/UNDECIDED 34.08 21.82 13.79 13.16 15.30 15.20 15.68 15.73 14.67 15.93 12.42
TOTAL OFNON SCIENCE FIELDS 84.66 82.85 80.21 80.04 79.46 78.61 76.98 75.77 75.48 77.48 76.00
TOTAL OF ALL EXAMINEES 44523 47900 49481 50049 51128 50494 49409 48294 47778 47511 49283
257 19-E 253
1

PERCENT OF EXAMINEES PLANNING TO MAJOR IN NON-SCIENCE FIELDS
(OTHER STUDENTS)
INTENDEDTEST YEAR
MAJOR FIELD i 1975 1977 1978 1979 1980 1981 1982 1983 1984 1985 1986
PRE-MEDICINE 3.05 3.99 4.12 4.43 4.55 4.78 4.69 4.99 4.90 4.79 5.48
OTHER HEALTH FIELDS 7.27 8.93 9.78 9.38 8.44 8.09 7.97 7.93 7.14 6.66 6.71
PRELAW 0.00 1.82 2.71 2.43 2.41 2.33 2.29 2.23 1.94 1.88 2.08
HUMANITIES 1.58 1.27 1.28 1.31 1.30 1.16 1.07 1.03 0.91 0.86 0.86
HISTORY t CULTURE 0.67 0.42 0.43 0.37 0.32 0.27 0.30 0.26 0.22 0.23 0.21
FOREIGN LANGUAGES 1.01 0.91 0.94 0.90 0.80 0.71 0.71 0.66 0.59 0.58 0.62
STUDIO/PERFORMING ARTS 3.33 4.35 5.13 5.40 5.03 4.71 4.38 3.95 3.37 3.27 4.06
COMMUNICATIONS 1.30 1.62 1.86 2.09 2.05 2.14 2.10 1.96 1.83 1.76 2.34
BUSINESS 6.68 9.02 11.80 13.08 13.17 13.38 13.26 12.60 11.62 12.43 16.40
EDUCATION 3.33 3.94 4.08 3.52 3.27 2.90 2.60 2.28 1.97 1.87 2.53
VOCATIONAL FIELDS 2.03 2.56 3.07 3.16 2.96 3.11 3.22 3.23 2.69 2.40 2.45
OTHER/MISSING/UNDECIDED 48.76 39.10 30.04 27.68 28.82 28.39 27.90 28.08 35.08 38.02 27.41
TOTAL OFNON SCIENCE FIELDS 79.02 77.92 75.24 73.76 73.12 71.96 70.47 69.21 72.25 74.74 71.15
TOTAL OF ALL EXAMINEES 95205 109555 114746 115034 121433 123024 127392 127452 143388 155694 153707
25919-F 260
I
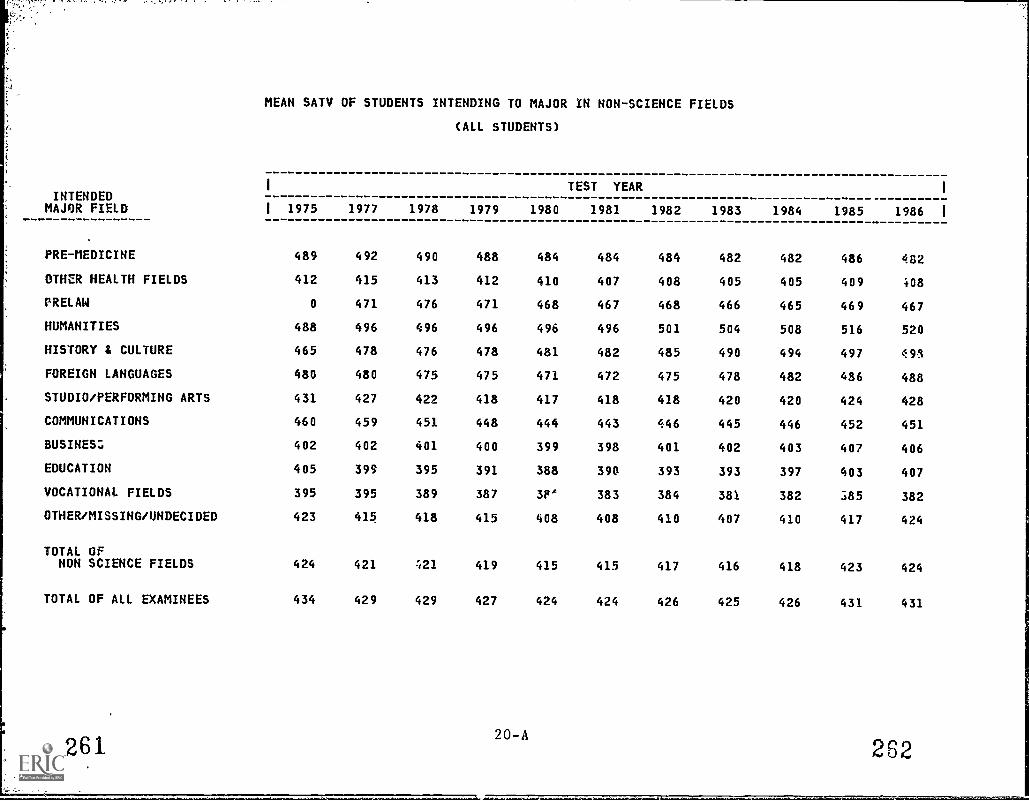
MEAN SATV OF STUDENTS INTENDING TO MAJOR IN NON-SCIENCE FIELDS
(ALL STUDENTS)
INTENDEDI TEST YEAR
I
MAJOR FIELD I 1975 1977 1978 1979 1980 1981 1982 1983 1984 1985 1986 I
PRE-MEDICINE 489 492 490 488 484 484 484 482 482 486 482
OTHER HEALTH FIELDS 412 415 413 412 410 407 408 405 405 409 ;08
PRELAW 0 471 476 471 468 467 468 466 465 469 467
HUMANITIES 488 496 496 496 496 496 501 504 508 516 520
HISTORY & CULTURE 465 478 476 478 481 482 485 490 494 497 493
FOREIGN LANGUAGES 480 480 475 475 471 472 475 478 482 486 488
STUDIO/PERFORMING ARTS 431 427 422 418 417 418 418 420 420 424 428
COMMUNICATIONS 460 459 451 448 444 443 446 445 446 452 451
BUSINESL 402 402 401 400 399 398 401 402 403 407 406
EDUCATION 405 399 395 391 388 390 393 393 397 403 407
VOCATIONAL FIELDS 395 395 389 387 3P' 383 384 381 382 385 382
OTHER/MISSING/UNDECIDED 423 415 418 415 408 408 410 407 410 417 424
TOTAL OFNON SCIENCE FIELDS 424 421 21 419 415 415 417 416 418 423 424
TOTAL OF ALL EXAMINEES 434 429 429 427 424 424 426 425 426 431 431
20-A261 262

MEAN SATV OF STUDENTS INTENDING TO MAJOR IN NON-SCIENCE FIELDS
(WHITE MALES)
INTGDEDI TEST YEAR
MAJOR FIELD I 1975 1977 1978 1979 1980 1981 1982 1983 1984 1985 1986
PRE-MEDICINE 501 507 509 510 506 507 505 502 506 509 507
OTHER HEALTH FIELDS 433 440 442 443 443 442 440 437 439 439 436
FRELAW 0 486 492 490 488 488 488 484 487 492 492
PUMANITIES 503 504 509 510 508 509 511 512 521 531 534
HISTORY & CULTURE 463 477 473 476 479 482 483 48: 494 498 499
FOREIGN LANGUAGES 90 499 494 498 492 498 497 499 507 5C9 512
STUDIO/PERFORMING ARTS 444 443 442 441 437 441 440 440 444 447 451
COMMUNICATIONS 461 461 453 455 451 454 456 455 457 461 461
BUSINESS 420 420 417 416 415 416 418 418 421 424 425
EDUCATION 396 393 390 385 382 385 387 385 391 398 405
VOCATIONAL FIELDS 405 417 414 412 i09 411 411 410 415 417 408
OTHER/MISSING/UNDECIDED 430 421 425 423 417 418 4)9 416 418 422 436
TOTAL OFNON SCIENCE FIELDS 434 434 437 435 431 433 434 432 436 439 441
TOTAL OF ALL EXAMINEES 447 443 446 444 441 443 444 444 448 450 451
263 20-B264
I
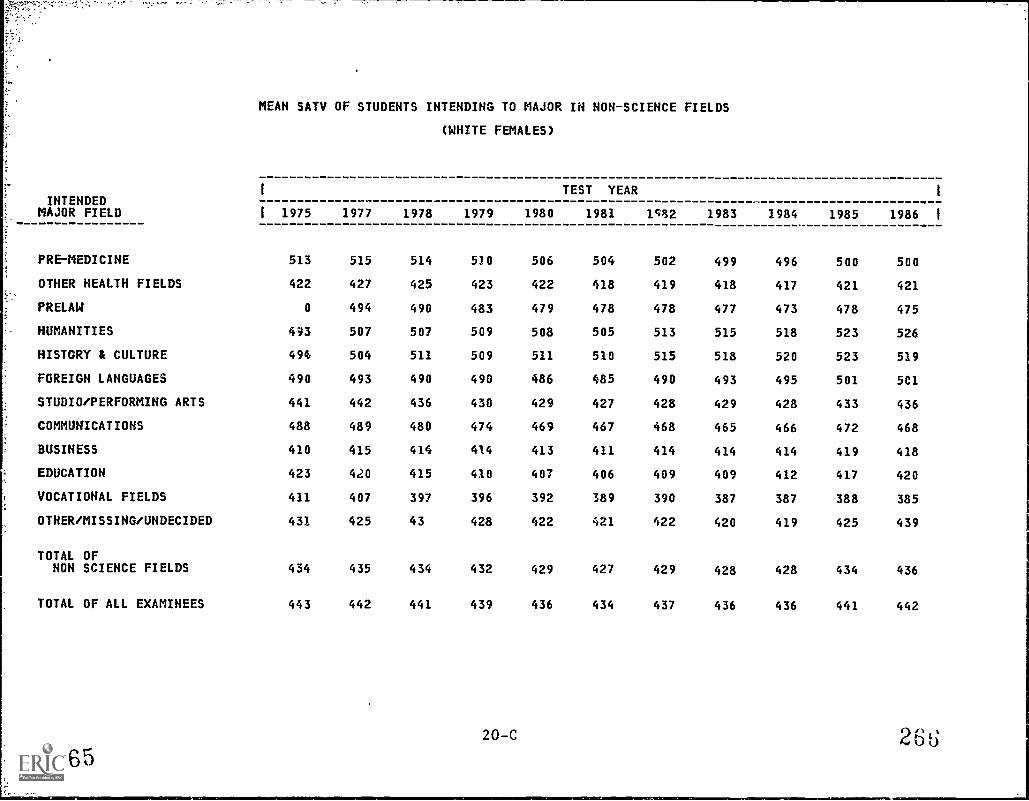
MEAN SATV OF STUDENTS INTENDING TO MAJOR IN NON-SCIENCE FIELDS
(WHITE FEMALES)
INTENDEDMAJOR FIELD
PRE-MEDICINE
OTHER HEALTH FIELDS
PRELAW
HUMANITIES
HISTORY & CULTURE
FOREIGN LANGUAGES
STUDIO/PERFORMING ARTS
COMMUNICATIONS
BUSINESS
EDUCATION
VOCATIONAL FIELDS
OTHER/MISSING/UNDECIDED
TOTAL OFNON SCIENCE FIELDS
TOTAL OF ALL EXAMINEES
I
1 1975
513
422
0
493
496
490
441
488
410
423
411
431
434
443
1977
515
427
494
507
504
493
442
489
415
420
407
425
435
442
1978
514
425
490
507
511
490
436
480
414
415
397
43
434
441
1979
510
423
483
509
509
490
430
474
414
410
396
428
432
439
1980
506
422
479
508
511
486
429
469
413
407
392
422
429
436
TEST YEAR
1981
504
418
478
505
510
485
427
467
411
406
389
421
427
434
1,032
502
419
478
513
515
490
428
468
414
409
390
422
429
437
1983
499
418
477
515
518
493
429
465
414
409
387
420
428
436
1984
496
417
473
518
520
495
428
466
414
412
387
419
428
436
1985
500
421
478
523
523
501
433
472
419
417
388
425
434
441
1
1986
500
421
475
526
519
5C1
436
468
418
420
385
439
436
442
20-C
265266

. A ,. t .
MEAN SATV OF STUDENTS INTENDING TO MAJOR IN NON-SCIENCE FIELDS
(BLACK MALES)
INTENDEDMAJOR FIELD
PRE-MEDICINE
OTHER HEALTH FIELDS
PRELAW
HUMANITIES
HISTORY & CULTURE
FOREIGN LANGUAGES
STUDIO/PERFORMING ARTS
COMMUNICATIONS
BUSINESS
EDUCATION
VOCATIONAL FIELDS
OTHER/MISSING/UNDECIDED
TOTAL OFNON SCIENCE FIELDS
TOTAL OF ALL EXAMINEES
I
1 1975
397
332
0
356
328
360
320
344
319
286
307
355
338
344
1977
409
342
377
342
335
397
31b
340
324
284
310
352
338
342
1978
409
338
377
350
323
388
316
343
326
283
305
346
334
341
1979
404
348
384
343
328
371
318
332
323
278
307
340
332
338
1980
407
341
384
347
332
373
316
339
7,20
278
306
334
330
338
TEST YEAR
1981
415
345
381
351
325
389
321
339
325
281
312
336
334
342
1982
425
349
395
362
352
402
323
346
330
283
31S
342
340
349
1983
409
346
389
365
354
377
323
344
327
283
314
342
339
347
1984
417
351
389
377
354
417
335
349
333
290
312
346
344
350
1985
419
351
398
389
348
407
337
353
338
291
320
346
347
354
1
1986 1
423
360
397
405
369
413
342
355
341
298
323
360
352
358

MEAN SATV OF STUDENTS INTENDING TO MAJOR IN NON-SCIENCE FIELDS
(BLACK FEMALES)
INTENDEDMAJOR FIELD
PRE-MEDICINE
OTHER HEALTH FIELDS
PRELAW
HUMANITIES
HISTORY & CULTURE
FOREIGN LANGUAGES
STUDIO/PERFORMING ARTS
COMMUNICATIONS
BUSINESS
EDUCATION
VOCATIONAL FIELDS
OTHER/MISSING/UNDECIDED
TOTAL OFNON SCIENCE FIELDS
TOTAL OF ALL EXAMINEES
I
1 1975
395
318
0
357
355
395
325
376
306
312
298
343
332
337
1977
393
315
370
363
344
397
314
366
305
298
289
341
326
330
1978
392
316
368
353
326
387
317
361
308
298
288
340
325
330
1979
386
314
303
354
356
388
312
360
309
295
284
337
323
328
1980
386
314
361
360
349
390
314
355
308
293
289
331
323
328
TEST YEAR
1981
387
310
360
370
345
384
314
349
309
294
286
330
322
328
1982
392
320
368
373
370
411
322
365
317
296
292
334
330
336
1983
391
314
370
394
388
414
321
360
318
300
297
340
331
337
1984
388
315
366
398
378
408
321
361
320
306
296
338
332
337
1985
397
320
368
390
359
426
328
367
325
310
300
344
338
342
I
1986 I
398
324
380
400
396
414
338
375
330
317
300
359
344
347
269 20-E 2 7 0

MEAN SATV OF STUDENTS INTENDING TO MAJOR IN NON-SCIENCE FIELDS
(OTHER STUDENTS)
INTENDEDMAJOR FIELD
PRE-MEDICINE
OTHER HEALTH FIELDS
PRELAW
HUMANITIES
HISTORY & CULTURE
FOREIGN LANGUAGES
STUDIO/PERFORMING ARTS
COMMUNICATIONS
BUSINESS
EDUCATION
VOCATIONAL FIELDS
OTHER/MISSING/UNDECIDED
TOTAL OFNON SCIENCE FIELDS
TOTAL OF ALL EXAMINEES
I
1 1975
453
379
0
481
456
413
408
452
367
377
361
419
411
415
1977
452
376
434
480
456
406
391
435
364
362
354
406
398
401
1978
451
375
440
461
446
397
387
424
361
356
346
405
493
397
1979
446
375
435
461
443
397
382
424
360
355
346
401
390
393
1980
447
370
435
461
465
392
382
414
362
353
344
395
388
392
TEST YEAR
1981
448
367
429
464
442
398
379
414
361
353
345
393
386
390
1982
452
371
431
455
449
391
381
418
365
357
347
395
389
392
1983
456
365
429
465
446
395
379
414
361
352
342
391
386
389
1984
455
365
425
460
451
400
378
415
362
355
337
406
394
395
1985
463
370
430
46i
455
399
380
421
370
362
341
419
405
404
1
1986 1
459
364
435
479
469
414
385
421
370
363
340
400
393
396

STANDARD DEVIATION OF SATV FOR STUDENTS INTENDING TO MAJOR IN NON-SCIENCE FIELDS
(AIL STUDENTS)
INTENDEDMAJOR FIELD
PRE-MEDICINE
OTHER HEALTH FIELDS
PRELAW
HUMANITIES
HISTORY & CULTURE
FOREIGN LANGUAGES
STUDIO/PERFORMING ARTS
COMMUNICATIONS
BUSINESS
EDUCATION
VOCATIONAL FIELDS
OTHER/MISSING/UNDECIDED
TOTAL OFNON SCIENCE FIELDS
TOTAL OF ALL EXAMINEES
1
1 1975
105
95
0
114
115
110
105
107
97
98
98
110
108
109
1977
108
98
108
117
115
116
108
1'09
97
99
103
130
109
110
1978
109
100
107
118
119
116
108
108
97
99
102
112
109
110
1979
112
100
109
121
121
116
107
108
97
97
101
113
109
110
1980
110
100
108
119
121
116
106
106
97
97
101
112
108
110
TEST YEAR
1981
109
100
107
119
119
115
106
106
96
96
101
112
108
110
1982
107
99
104
118
118
116
106
105
97
97
101
113
108
110
1983
106
98
105
116
116
115
104
104
96
97
100
111
107
109
1984
108
99
106
117
120
117
106
105
97
98
102
113
109
110
1985
107
99
105
118
118
116
106
105
97
98
102
114
109
111
1
1986 1
107
99
104
115
117
114
106
103
93
99
99
115
108
110
273 21-A 271
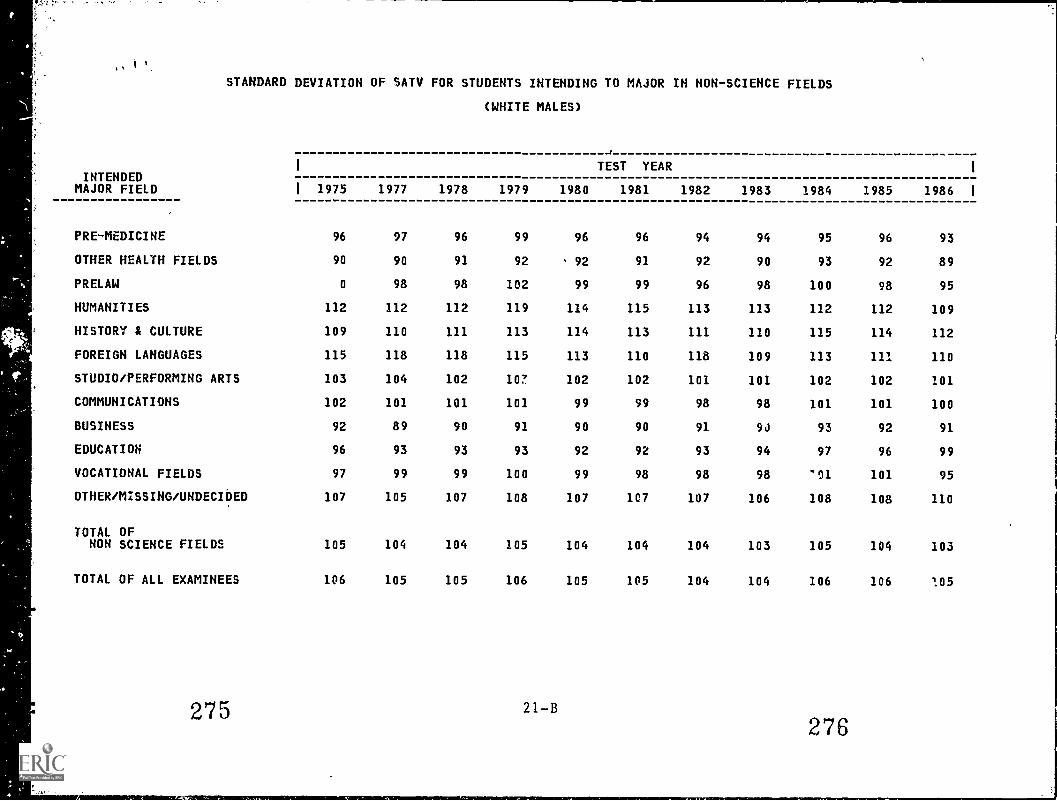
i
STANDARD DEVIATION OF SATV FOR STUDENTS INTENDING TO MAJOR IN NON-SCIENCE FIELDS
(WHITE MALES)
INTENDEDI
..1
TEST YEARi
MAJOR FIELD I 1975 1977 1978 1979 1980 1981 1982 1983 1984 1985 1986 I
PRE-MEDICINE 96 97 96 99 96 96 94 94 95 96 93
OTHER HEALTH FIELDS 90 90 91 92 92 91 92 90 93 92 89
PRELAW 0 98 98 102 99 99 96 98 100 98 95
HUMANITIES 112 112 112 119 114 115 113 113 112 112 109
HISTORY & CULTURE 109 110 111 113 114 113 111 110 115 114 112
FOREIGN LANGUAGES 115 118 118 115 113 110 118 109 113 111 110
STUDIO/PERFORMING ARTS 103 104 102 107 102 102 101 101 102 102 101
COMMUNICATIONS 102 101 101 101 99 99 98 98 101 101 100
BUSINESS 92 89 90 91 90 90 91 9J 93 92 91
EDUCATION 96 93 93 93 92 92 93 94 97 96 99
VOCATIONAL FIELDS 97 99 99 100 99 98 98 98 '91 101 95
OTHER /MISSING /UNDECIDED 107 105 107 108 107 107 107 106 108 108 110
TOTAL OFNON SCIENCE FIELDS 105 104 104 105 104 104 104 103 105 104 103
TOTAL OF ALL EXAMINEES 106 105 105 106 105 105 104 104 106 106 105

STANDARD DEVIATION OF SATV FOR STUDENTS INTENDING TO MAJOR IN NON-SCIENCE FIELDS
(WHITE FEMALES)
INTENDEDI TEST YEAR I
MAJOR FIELD I 1975 1977 1978 1979 1980 1981 1982 1983 1984 1985 1986 I
PRE-MEDICINE 96 101 99 102 100 99 98 97 97 98 96
OTHER HEALTH FIELDS 89 92 94 93 94 94 93 91 92 92 93
PRULAW 0 100 100 101 101 100 99 96 98 97 97
HUMANITIES 105 109 109 109 109 110 109 107 108 109 108
HISTORY & CULTURE 107 105 110 116 112 110 112 108 112 106 112
FOREIGN LANGUAGES 102 107 106 106 107 107 1P5 107 107 105 103
STUDIO/PERFORMING ARTS 99 101 101 99 100 99 100 98 99 99 100
COMMUNICATIONS 99 99 97 98 98 98 97 97 96 97 96
BUSINESS 91 93 93 91 93 92 93 91 92 92 93
EDUCATION 91 92 93 91 91 92 93 92 93 93 94
VOCATIONAL FIELDS 89 93 92 90 90 91 92. 88 90 90 91
OTHER/MISSINGIUNDECIIn) 106 107 110 109 109 109 109 108 107 108 110
TOTAL OFNON SCIENCE FIELDS 101 103 103 102 102 102 103 101 101 102 102
TOTAL OF ALL EXAMINEES 103 104 104 103 104 104 104 102 103 103 103
21-C 27,3

STANDARD DEVIATION OF SATV FOR STUDENTS INTENDING TO MAJOR IN NON-SCIENCE FIELDS
(BLACK MALES)
INTENDEDMAJOR FIELD
PRE-MEDICINE
OTHER HEALTH FIELDS
PRELAW
HUMANITIES
HISTORY & CULTURE
FOREIGN LANGUAGES
STUDIO/PERFORMING ARTS
COMMUNICATIONS
BUSINESS
EDUCATION
VOCATIONAL FIELDS
OTHER/MISSIAG/U,DECIDED
TOTAL OFNON SCIENCE FIELDS
TOTAL OF ALL EnMINEES
I
1 1975
97
85
0
111
87
95
89
95
83
76
80
113
103
102
1977
103
88
100
110
97
109
90
96
86
72
84
113
102
102
1978
101
38
98
110
88
124
87
95
86
71
81
114
99
100
1979
102
94
104
115
92
119
91
92
86
70
83
109
98
99
1980
98
88
103
120
99
121
92
91
85
70
82
106
97
99
TEST YEAR
1981
103
95
102
111
99
97
91
94
87
73
89
107
99
100
1982
100
94
101
116
114
96
90
96
89
76
86
108
101
101
1983
101
91
101
109
98
104
92
97
87
74
86
107
99
100
1984
102
93
101
113
111
127
95
96
90
79
81
106
100
100
1985
103
92
102
125
106
134
95
95
88
80
86
104
99
100
1
1986 1
99
8:
98
114
104
117
95
96
90
82
85
117
102
102
. 279 21-0 280

STANDARD DEVIATION OF SATV FOR STUDENTS INTENDING TO MAJOR IN NON SCIENCE FIELDS
(BLACK FEMALES)
INTENDEDMAJOR FIELD
PRE-MEDICIh
OTHER HEALTH FIELDS
PRELAW
HUMANITIES
HISTORY & CULTURE
FOREIGN LANGUAGES
STUDIO/PERFORMING ARTS
COMMUNICATIONS
BUSINESS
EDUCATION
VOCATIONAL FIELDS
OTHER/MISSING/UNDECIDED
TOTAL OFNON SCIENCE FIELDS
TOTAL OF ALL EXAMINEES
1
1 1975
96
81
0
102
103
108
90
96
76
83
77
1t5
96
97
1977
101
85
98
108
105
111
92
99
81
80
76
108
97
98
1978
100
85
100
105
99
108
88
98
80
79
74
108
94
95
1979
100
84
98
112
106
114
86
98
79
76
68
109
93
94
1980
100
85
99
111
103
101
91
94
80
78
77
107
94
95
TEST YEAR
1981
)00
84
99
116
97
106
89
94
81
78
72
105
94
95
1982
102
87
100
112
127
114
93
99
86
83
76
106
97
98
1983
99
84
98
115
142
111
90
95
85
85
76
105
95
97
1984
S7
83
97
114
132
115
92
95
84
84
74
103
94
95
1985
100
85
97
125
107
118
93
97
86
86
76
105
96
97
1
1986 1
98
86
98
116
132
113
93
98
87
82
77
115
98
98
281 21-E
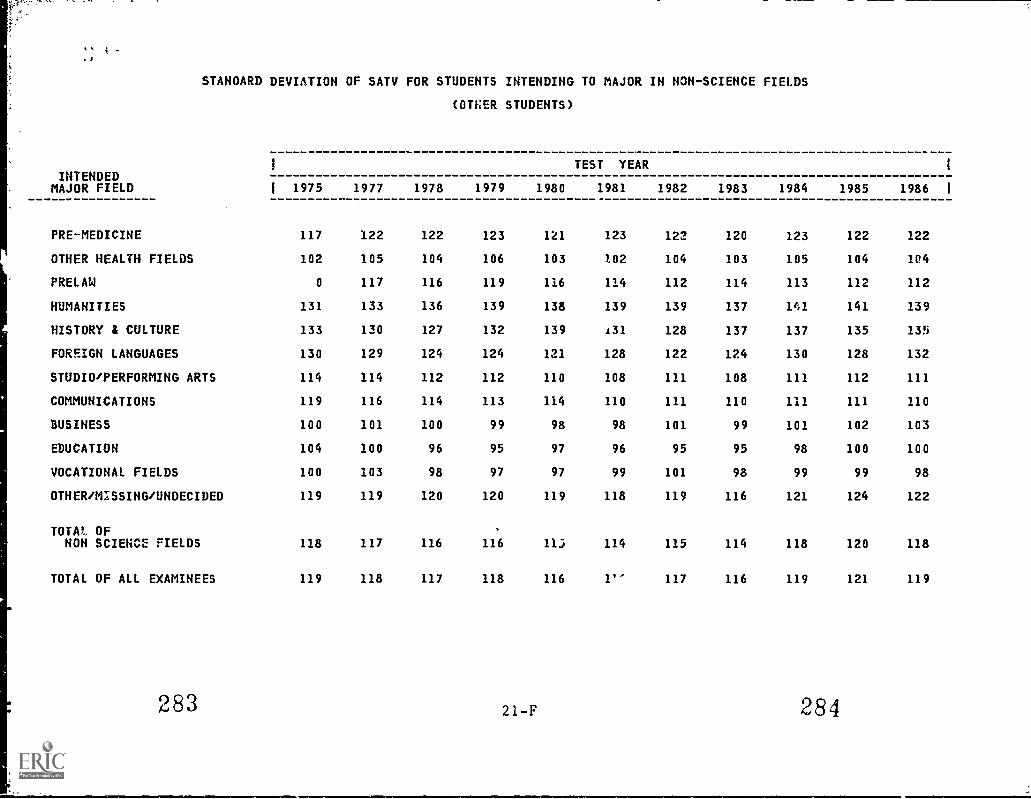
../
STANOARD DEVIATION OF SATV FOR STUDENTS INTENDING TO MAJOR IN NON-SCIENCE FIELDS
COTNER STUDENTS)
INTENDEDI TEST YEAR I
MAJOR FIELD I 1975 1977 1978 1979 1980 1981 1982 1983 1984 1985 1986 I
PRE-MEDICINE 117 122 122 123 121 123 122 120 123 122 122
OTHER HEALTH FIELDS 102 105 104 106 103 102 104 103 105 104 1t!4
PRELAW 0 117 116 119 116 114 112 114 113 112 112
HUMANITIES 131 133 136 139 138 139 139 137 141 141 139
HISTORY I CULTURE 133 130 127 132 139 131 128 137 137 135 135
FOREIGN LANGUAGES 130 129 124 124 121 128 122 124 130 128 132
STUDIO/PERFORMING ARTS 114 114 112 112 110 108 111 108 111 112 111
COMMUNICATIONS 119 116 114 113 114 110 111 110 111 111 110
BUSINESS 100 101 100 99 98 98 101 99 101 102 103
EDUCATION 104 100 96 95 97 96 95 95 98 100 100
VOCATIONAL FIELDS 100 103 98 97 97 99 101 98 99 99 98
OTHER/MISSING/UNDECIDED 119 119 120 120 119 118 119 116 121 124 122
TOTM., OFNON SCIENCE FIELDS 118 117 116 116 11) 114 115 114 118 120 118
TOTAL OF ALL EXAMINEES 119 118 117 118 116 1'' 117 116 119 121 119

MEAN SATM OF STUDENTS INTENDING TO MAJOR IN NON-SCIFNCE FIELDS
(ALL STUDENTS)
INTENDEDI TEST YEAR
I
MAJOR FIELD I 1975 1977 1978 1979 1980 1981 1982 1983 1984 1985 1986 1
PRE-MEDICINE 537 547 542 537 534 534 !;33 535 537 539 539
OTHER HEALTH FIELDS 44E 451 448 447 447 444 440 438 442 447 445
PRELAW 0 493 496 493 489 488 486 485 486 489 488
HUMANITIES 475 480 477 478 479 481 482 489 491 498 506
HISTORY 14 CULTURE 466 474 467 471 474 472 475 478 480 484 492
FOREIGN LANGUA'ES 486 482 476 476 474 474 477 479 486 492 496
STUDIO/PERFORMING ARTS 445 438 433 432 431 432 431 432 432 438 442
COMMUNICATIONS 462 460 450 449 446 446 446 445 447 454 454
BUSINESS 454 453 447 447 446 446 446 445 449 455 454
EDUCATION 434 426 422 420 418 418 418 418 424 431 434
VOCATIONAL FIELDS 443 447 436 436 433 431 430 426 426 431 426
OTHER /MISSING /UNDECIDED 455 454 456 454 449 449 448 449 152 460 468
TOTAL OFNON SCIENCE FIELDS 455 456 454 452 450 450 450 450 453 460 460
TOTAL OF ALL EXAMINES 472 470 468 467 466 466 467 468 471 475 475
285 22-A 28t;

MEAN SATM OF STUDENTS INTENDING TO MAJOR IN NON-SCIENCE FIELDS
(WHITE MALES)
INTENDEDMAJOk FIELD
PRE-MEDICINE
OTHER HEALTH FIELDS
PRELAW
HUMANITIES
HISTORY & CULTURE
FOREIGN LANGUAGES
STUDIO/PERFORMING ARTS
COMMUNICATIONS
BUSINESS
EDUCATION
VOCATIONAL FIELDS
OTHER/MISSING/UNDECIDED
TOTAL OFNON SCIENCE FIELDS
TOTAL OF ALL EXAMINEES
1
1 1975
565
500
0
509
477
512
474
484
437
446
469
471
480
502
1977
582
513
528
514
491
522
473
490
492
447
487
470
488
507
1978
579
511
530
514
479
510
470
478
484
440
478
472
488
506
1979
577
509
530
512
482
522
468
478
'82
437
475
471
486
505
1980
573
508
525
511
485
513
463
473
479
431
470
466
482
502
TEST YEAR
1981
571
507
524
514
482
517
465
476
480
434
470
466
482
503
1982
571
502
523
511
485
511
463
476
480
434
469
465
482
504
1983
572
498
521
516
485
515
462
475
479
429
466
463
481
504
1984
571
499
522
517
488
522
462
474
481
436
467
464
483
506
1985
57S
501
528
526
493
529
469
481
487
445
473
470
488
509
1986
579
497
530
535
501
538
475
485
489
454
462
484
492
512

...
MEAN SATM OF STUDENTS INTENDING TO MAJOR IN NON-SCIENCE FIELDS
(WHITE FEMALES)
INTENDEDI TEST YEAR I
MAJOR FIELD I 1975 1977 1978 1979 1980 1981 1982 1983 1984 1985 1986 I
PRE-MEDICINE 535 542 542 535 535 533 529 532 535 535 536
OTHER HEALTH FIELDS 448 451 450 448 449 445 442 440 445 450 447
PRELAW 0 491 490 485 483 484 481 480 483 485 484
HUMANITIES 467 473 472 475 475 474 478 484 488 492 496
HISTORY & CULTURE 471 473 476 475 478 480 478 484 486 491 495
FOREIGN LANGUAGES 492 487 485 482 480 481 482 485 491 498 500
STUDIO/PERFORMING ARTS 447 442 438 435 435 434 432 433 433 439 440
COMMUNICATIONS 464 463 458 455 452 453 451 448 452 460 458
BUSINESS 441 443 442 442 444 443 443 442 446 452 450
EDUCATION 446 439 436 432 430 428 428 427 433 439 440
VOCATIONAL FIELDS 440 434 424 424 423 419 417 415 416 415 408
OTHER /MISSING. UNDECIDED 453 453 456 453 450 450 449 450 450 456 470
TOTAL OFNON SCIENCE FIELDS 453 453 452 450 449 448 447 448 451 456 458
TOTAL OF ALL EXAMINEES 463 461 460 458 458 458 458 459 462 466 465
28922-C
2:u

MEAN SATM OF STUDENTS INTENDING TO MAJOR IN NON-SCIENCE FIELDS
(BLACK MALES)
INTENDEDMAJOR FIELD
PRE-MEDICINE
OTHER 1EALTH FIELDS
PRELAW
4UMANITIES
HISTORY & CULTURE
FOREIGN LANGUAGES
STUDIO/PERFORMING ARTS
COMMUNICATIONS
BUSINESS
EDUCATION
VOCATIONAL FIELDS
OTHER/MISSING/UNDECIDED
TOTAL OFNON SCIENCE FIELDS
TOTAL OF ALL EXAMINEES
1
1 1975
438
371
0
362
342
388
345
358
361
326
349
387
372
380
1977
453
382
383
355
343
393
340
352
366
324
350
389
373
381
1978
448
371
386
348
336
379
336
347
361
316
342
379
363
375
1979
447
383
398
356
340
398
340
345
364
320
350
378
366
378
1980
447
382
394
358
342
375
341
355
364
322
350
375
367
379
TEST YEAR
1981
453
382
391
365
343
407
343
351
366
320
354
377
349
382
1982
458
382
400
366
361
400
344
356
365
320
355
38.,
372
386
1983
451
383
401
373
354
337
344
357
369
318
354
384
L74
388
1984
456
387
395
364
342
405
349
359
372
328
351
384
376
396
1985
454
387
404
389
351
417
353
362
376
330
361
388
380
394
1
1986 1
460
394
405
396
358
432
354
361
378
331
356
397
383
395
)91
22-D
292

MEAN SATM OF STUDENTS INTENDING TO MAJOR IN NON-SCIENCE FIELDS
(BLACK FEMALES)
IUTENDEDI TEST YEAR 1
MAJOR FIELD I 1975 1977 1978 1979 1980 1981 1982 1983 1984 1985 1986 1
PRE-MEDICINE 406 408 403 400 400 406 406 408 413 419 416
OTHER HEALTH FIELDS 339 337 333 337 340 337 340 337 342 347 345
PRELAW U 367 363 364 363 366 365 368 373 375 378
HUMANITIES 351 345 * 346 347 344 358 357 369 376 367 379
HISTORY & CULTURE 347 340 333 342 344 330 347 363 353 346 373
FOREIGN LANGUAGES 391 387 375 381 388 376 395 391 400 408 397
STUDIO/PERFORMING ARTS 335 329 326 327 330 328 333 332 333 340 343
COMMUNICATIONS 357 349 346 350 348 347 348 348 356 358 362
BUSINESS 331 333 329 336 337 338 341 344 349 353 35S
EDUCATION 331 321 317 320 321 320 322 323 329 334 339
VOCATIONAL FIELDS 327 317 313 317 323 322 326 328 328 330 327
OTHER /MISSING /UNDECIDED 365 373 366 367 364 361 364 372 371 375 391
TOTAL OFNON SCIENCE FIELDS 351 348 341 344 346 346 350 352 356 361 364
TOTAL OF ALL EXAMINEES 355 351 346 349 352 352 357 360 363 367 368
c.., ,i
4, J i 23.1

MEAN SATM OF STUDENTS INTENDING TO MAJOR IN NON-SCIENCE FIELDS
(OTHER STUDENTS)
INTENDEDMAJOR FIELD
PRE-MEDICINE
OTHER HEALTH FIELDS
PRELAW
HUMANITIES
HISTORY & CULTURE
FOREIGN LANGUAGES
STUDIO/PERFORMING ARTS
COMMUNICATIONS
BUSINESS
EDUCATION
VOCATIONAL FIELDS
OTHEROMI4SING/UNDECIDED
TOTAL OFNON SCIENCE FIELDS
TOTAL OF ALL EXAMINEES
I
1 1975
523
437
0
474
462
431
429
452
434
41g.
424
459
453
465
1977
524
434
455
470
463
437
411
439
427
393
416
450
443
455
1978
518
426
457
451
449
424
408
426
421
386
405
449
437
449
1979
517
431
460
461
449
424
408
428
423
389
405
447
437
451
1980
518
428
459
460
460
427
409
426
425
388
406
443
436
451
TEST YEAR
1981
520
425
453
467
447
437
411
424
425
385
408
444
437
453
1982
520
426
452
458
455
436
409
424
426
389
407.
444
438
454
1983
527
423
451
473
455
433
412
422
423
390
404
445
438
456
1984
532
427
450
471
457
442
415
426
429
392
403
458
449
462
1985
534
432
454
477
460
442
415
429
435
403
405
473
459
469
1
1986 1
535
427
463
497
476
455
422
435
438
407
404
459
451
466
295 296

STANDARD DEVIATION OF SATM FOR STUDENTS INTENDING TO MAJOR IN NON-SCIENCE FIELDS
(ALL STUDENTS)
INTENDEDMAJOR FIELD
PRE - MEDICINE
OTHER HEALTH FIELDS
PRELAW
HUMANITIES
HISTORY & CULTURE
FOREIGN LANGUAGES
STUDIO/PERFORMING ARTS
COMMUNICATIONS
BUSINESS
EDUCATION
VOCATIONAL FIELDS
OTHER/MISSING/UNDECIDED
TOTAL OFNON SCIENCE FIELDS
TOTAL OF ALL EXAMINEES
1
1 1975
109
101
0
109
108
103
105
105
109
100
107
113
110
115
1977
112
108
114
113
113
107
108
109
112
102
116
116
114
119
1978
114
108
113
112
112
108
106
107
110
102
114
116
114
118
1979
115
107
114
111
112
107
106
106
109
100
112
116
113
117
1980
115
107
111
111
114
107
104
105
107
98
110
115
112
117
TEST YEAR
1981
112
107
111
111
113
/05
104
106
107
98
111
116
112
117
1982
113
106
111
112
115
107
104
104
107
99
110
116
112
117
1983
115
106
111
111
114
109
105
104
108
99
111
117
113
118
1984
114
107
112
114
117
109
106
105
109
101
111
118
114
119
1985
113
108
112
113
117
108
105
106
109
102
113
120
115
119
1986
116
109
113
116
119
112
108
106
111
104
110
123
116
121
297 23-A
298
1

STANDARD DEVIATION OF SATM FOR STUDENTS INTENDING TO MAJOR IN NON-SCIENCE FIELDS
(WHITE MALES)
1 TEST YEAR 1
INTENDEDMAJOR FIELD 1 1975 1977 1978 1979 1980 1981 1982 1983 1984 1985 1986 1
°RE-MEDICINE 100 99 101 102 101 99 101 102 102 101 101
OTHER HEALTH FIELDS 103 104 305 104 105 105 104 106 105 105 105
PRELAW 0 107 106 106 105 104 104 107 107 106 106
HUMANITIES 112 114 111 114 112 112 111 111 115 112 117
HISTORY 4 CULTURE 106 111 110 111 112 111 116 113 116 116 117
FOREIGN LANGUAGES 108 113 113 114 114 111 115 113 114 110 116
STUDIO/PERFORMING ARTS 109 110 108 108 107 107 107 108 108 108 111
COMMUNICATIONS 104 107 305 105 103 105 103 105 106 106 108
BUSINESS 104 106 105 105 103 104 104 105 106 106 108
EDUCATION 102 104 103 102 98 100 102 101 104 106 111
VOCATIONAL FIELDS 107 112 111 110 108 108 108 111 110 112 108
OTHER/MISSING/UNDECIDED 112 115 114 114 113 114 115 115 116 117 120
TOTAL OFNON SCIENCE FIELDS 111 114 112 112 111 :11 112 113 113 113 115
TOTAL OF ALL EXAMINEES 115 117 116 116 115 114 115 117 117 117 119
299
23-B300

STANDARD DEVIATION OF SATM FOR STUDENTS INTENDING TO MAJOR IN NON-SCIENCE FIELDS
(WHITE FEMALES)
INTENDEDMAJOR FIELD
PRE-MEDICINE
OTHER HEALTH FIELDS
PRELAW
HUMANITIES
HISTORY & CULTURE
FOREIGN LANGUAGES
STUDIO/PERFORMING ARTS
COMMUNICATIONS
BUSINESS
EDUCATION
VOCATIONAL FIELDS
OPIERIMISSING/UNDECInED
TOTAL OFNON SCIENCE FIELDS
TOTAL OF ALL EXAMINEES
I
1 1975
97
93
0
98
101
97
96
95
98
95
95
106
101
104
1977
97
99
100
102
105
100
100
97
10'..
96
100
111
105
107
1978
97
98
99
101
103
100
97
96
100
95
98
110
103
106
1979
98
97
100
99
105
99
98
96
100
95
97
110
102
105
1980
99
98
98
100
106
99
96
95
99
94
97
109
102
105
TEST YEAR
1981
97
98
99
102
104
97
97
95
99
94
97
110
102
105
1982
98
97
99
103
105
100
97
94
98
95
96
110
102
105
1983
100
98
100
103
107
103
98
95
100
95
96
112
104
107
1984
101
99
102
106
110
101
99
96
101
97
98
112
105
108
1985
99
99
101
106
107
101
99
97
101
97
98
112
105
108
I
1986 1
100
101
102
107
112
104
100
97
1113
99
97
117
107
110
3 1 23-C3 ^4

STANDARD DEVIATION OF SATM FOR STUDENTS INTENDING TO MAJOR IN NON-SCIENCE FIELDS
(BLACK MALES)
INTENDEDMAJOR FIELD
PRE-MEDICINE
OTHER HEALTH FIELDS
PRELAW
HUMANITIES
HISTORY & CULTURE
FOREIGN LANGUAGZS
STUDIO/PERFORMING ARTS
COMMUNICATIONS
BUSINESS
EDUCATION
VOCATIONAL FIELDS
OTHER/MISSING/UNDECIDED
TOTAL OFNON SCIENCE FIELDS
TOTAL OF ALL EXAMINEES
J
1 1975
95
86
0
90
75
90
79
82
84
69
80
109
98
101
1977
106
96
93
91
82
94
79
85
88
68
84
114
101
103
1978
106
94
95
91
76
97
80
83
92
70
83
114
99
104
1979
107
97
98
96
78
107
81
80
89
69
85
109
97
101
1980
104
95
94
97
88
108
79
84
88
69
81
107
96
100
TEST YEAR
1981
108
100
99
97
95
99
84
85
91
73
91
110
100
104
1982
106
99
96
96
90
101
80
86
91
69
87
109
99
104
1983
107
101
97
87
84
99
81
84
90
69
86
110
99
104
1984
105
99
97
96
78
96
86
86
93
79
86
111
101
105
1985
110
102
101
111
96
102
88
85
93
80
91
112
102
106
1
1986 1
111
98
97
101
87
115
90
89
93
76
87
122
104
108

STANDARD DEVIATION OF SATM FOR STUDENTS INTENDING TO MAJOR IN NON-SCIENCE FIELDS
(BLACK FEMALES)
INTENDEDMAJOR FIELD
PRE-MEDICINE
OTHER HEALTH FIELDS
PRELAW
HUMANITIES
HISTORY & CULTURE
FOREIGN LANGUAGES
STUDIO/PERFORMING ARTS
COMMUNICATIONS
BUSINESS
EDUCATION
VOCATIONAL FIELDS
OTHER/MISSING/UNDECIDED
TOTAL OFNON SCIENCE FIELDS
TOTAL OF ALL EXAMINEES
1
1 1975
89
71
0
80
76
95
73
77
71
72
68
98
86
88
1977
96
75
81
79
74
89
72
78
72
67
66
106
87
88
1978
96
76
87
79
72
87
74
78
73
69
64
107
85
87
1979
94
74
85
84
78
93
71
78
73
67
63
106
84
86
1980
93
75
83
75
73
90
72
75
73
66
67
102
83
86
TEST YEAR
1981
94
77
87
88
74
91
76
78
77
67
71
102
86
88
1982
93
77
82
85
87
95
73
78
76
69
69
103
86
88
1983
96
75
83
90
92
90
75
75
77
69
69
105
87
90
1984
97
78
88
91
86
99
74
83
81
76
70
103
89
92
1985
96
81
87
94
91
99
79
82
81
75
72
103
89
92
1
1986 1
96
79
87
98
101
103
78
83
81
75
71
116
92
93
30523-E
306

STANDARD DEVIATION OF SATM FOR STUDENTS INTENDING TO MAJOR IN NON-SCIENCE FIELDS
(OTHER STUDENTS)
INTENDEDMAJOR FIELD
PRE-MEDICINE
OTHER HEALTH FIELDS
PRELAW
HUMANITIES
HISTORY & CULTURE
FOREIGN LANGUAGES
STUDIO/PERFORMING ARTS
COMMUNICATIONS
BUSINESS
EDUCATION
VOCATIONAL FIELDS
OTHER/MISSING/UNDECIDED
TOTAL OFNON SCIENCE FIELDS
TOTAL OF ALL EXAMINEES
1
1 1975
116
111
0
118
117
112
107
110
110
102
109
119
118
121
1977
123
116
117
120
120
119
108
114
114
99
114
122
120
124
1978
125
115
118
120
118
115
105
107
113
98
110
122
119
124
1979
124
115
120
121
117
113
107
106
112
97
109
122
119
124
1980
125
112
116
120
127
114
103
103
111
96
109
121
118
123
TEST YEAR
1981
122
113
115
120
121
119
106
107
111
94
111
120
118
123
1982
125
113
115
123
120
117
107
106
112
95
109
121
119
124
1983
127
114
116
120
125
116
106
104
112
96
109
121
120
125
1984
125
115
114
121
131
119
110
109
113
99
112
125
123
127
1985
124
116
115
123
125
119
109
110
113
104
113
126
124
127
1
1986 1
128
116
120
126
126
119
111
109
115
105
111
128
125
129

MEAN GRADE IN MATHEMATICS (0.0 - 4.0 SCALE) OF STUDENTS INTENDING TO MAJOR IN MATH SCIENCE AND ENGINEERING FIELDS
(ALL STUDENTS)
TEST YEAR1
INTENDEDMAJOR FIELD 1 1975 1977 1978 . 1979 1980 1981 1982 1983 1984 19P5 1986 1
PRE-MEDICINE 3.24 3.32 3.31 3.30 3.28 3.29 3.28 3.28 3.26 3.26
OTHER HEALTH FIELDS 2.81 2.87 2.87 2.87 2.87 2.86 2.84 2.84 2.83 2.84
PRELAW 0.00 2.88 2.92 2.91 2.91 2.89 2.89 2.88 2.86 2.86
HUMANITIES 2.66 2.72 2.71 2.72 2.72 2.71 2.70 2.73 2.72 2.72
HISTORY & CULTURE 2.59 2.67 2.63 2.64 2.63 2.62 2.63 2.63 2.60 2.60
FOREIGN LANGUAGES 2.90 2.88 2.85 2.84 2.84 2.82 2.84 2.83 2.83 2.84
STUDIO/PERFORMING ARTS 2.58 2.60 2.58 2.58 2.58 2.55 2.55 2.56 2.55 2.53
COMMUNICATIONS 2.56 2.61 2.f:9 2.58 2.57 2.57 2.57 2.56 2.55 2.56
BUSINESS 2.80 2.83 2.82 2.81 2.81 2.80 2.79 2.79 2.78 2.78
EDUCATION 2.67 2.69 2.68 2.67 2.65 2.65 2.65 2.66 2.67 2.67
VOCATIONAL FIELDS 2.68 2.74 2.71 2.70 2.69 2.69 2.70 2.69 2.67 2.67
OTHER/MISSING/UNDECIDED 2.71 2.76 2.73 2.73 2.73 2.73 2.73 2.74 2.74 2.74
TOTAL OFNON SCIENCE FIELDS 2.74 2.80 2.79 2.78 2.78 2.77 2.77 2.78 2.77 2.77
TOTAL OF ALL EXAMINEES 2.83 2.87 2.86 2.85 2.85 2.85 2.86 2.87 2.86 2.85
309 310

MEAN GRADE IN MATHEMATICS (0.0 - 4.0 SCALE) OF STUDENTS INTENDING TO MAJOR IN MATH SCIENCE AND ENGINEERING FIELDS
(WHITE MALES)
'II t
INTENDEDMAJOR FIELD
PRE-MEDICINE
OTHER HEALTH FIELDS
PRELAW
HUMANITIES
HISTORY & CULTURE
FOREIGN LANGUAGES
STUDIO/PERFORMING ARTS
COMMUNICATIONS
BUSINESS
EDUCATION
VOCATIONAL FIELDS
OTHER/MISSING/UNDECIDED
TOTAL OFNON SCIENCE FIELDS
TOTAL OF ALL EXAMINEES
1
1 1975
3.27
2.90
0.00
2.69
2.53
2.84
2.52
2.53
2.78
2.52
2.64
2.68
2.72
2.87
1977
3.38
3.00
2.93
2.73
2.62
2.81
2.56
2.59
2.82
2.56
2.78
2.72
2.81
2.91
1978
3.38
3.01
2.96
2.75
2.57
2.76
2.55
2.57
2.80
2.56
2.77
2.69
2.80
2.90
1979
3.36
3.01
2-96
2.74
2.58
2.82
2.55
2.55
2.79
2.55
2.73
2.68
2.78
2.89
1980
3.34
3.01
2.95
2.72
2.55
2.83
2.54
2.55
2.77
2.51
2.73
2.68
2.77
2.88
TEST YEAR
1981
3.34
2.99
2.93
2.73
2.55
2.75
2.51
2.54
2.76
2.52
2.71
2.68
2.76
2.89
1982
3.35
2.98
2.92
2.67
2.56
2.80
2.51
2.55
2.76
2.53
2.71
2.68
2.76
2.90
1983
3.32
2.94
2.90
2.72
2.56
2.84
2.51
2.54
2.75
2.50
2.71
2.69
2.76
2.90
1984
3.30
2.95
2.88
2.70
2.51
2.77
2.49
2.51
2.75
2.53
2.72
2.69
2.76
2.90
1985
3.31
2.93
2.89
2.71
2.55
2.85
2.48
2.53
2.75
2.54
2.71
2.70
2.76
2.89
1986
I
1
311:
24-B312

MEAN GRADE IN MATHEMATICS (0.0 4.0 SCALE) OF STUDENTS INTENDING TO MAJOR IN MATH SCIENCE AND ENGINEERING FIELDS
i
INTENDEDMAJOR FIELD I 1975 1977 1978 1979 1980 1981 1982 1983 1?84 1985 1986
PRE-MEDICINE 3.33 3.39 3.38 3.38 3.36 3.36 3.34 3.34 3.32 3.3',
OTHER HEALTH FIELDS 2.83 2.90 2.90 2.89 2.90 2.88 2.86 2.87 2.86 2.87
PRELAW 0.00 3.00 3.02 3.00 3.00 3.00 2.98 2.97 2.96 2.95
HUMANITIES 2.69 2.78 2.75 2.77 1.77 2.75 2.76 2.78 2.78 2.77
HISTORY & CULTURE 2.76 2.80 2.80 2.81 2.84 2.80 2.80 2.79 2.84 2.74
FOREIGN LANGUAGEF 2.96 2.95 2.92 2.90 2.89 2.88 2.90 2.87 2.90 2.88
STUDIO/PERFORMING ARTS 2.66 2.68 2.66 2.65 2.65 2.62 2.62 2.62 2.62 2.60
COMMUNICATIONS 2.71 2.74 2.73 2.72 2.70 2.70 2.69 2.67 2.66 2.67
BUSINESS 2.90 2.94 2.93 2.93 2.92 2.91 2.89 2.89 2.88 2.88
EDUCATION 2.78 2.78 2.77 2.76 2.73 2.73 2.72 2.74 2.75 2.74
VOCATIONAL FIELDS 2.77 2.79 2.74 2.76 2.75 2.76 2.77. 2.76 2.73 2.70
OTHER/MISSING/UNDECIDED 2.80 2.89 2.85 2.86 2.85 2.84 2.84 2.85 2.84 2.84
TOTAL OFNON SCIENCE FIELDS 2.81 2.87 2.86 2.85 2.85 2.84 2.84 2.84 2.84 2.83
TOTAL OF ALL EXAMINEES 2.87 2.91 2.89 2.89 2.89 2.89 2.90 2.90 2.90 2.88
ft.
(WHITE FEMALES)
TEST YEAR I
3133 I -1

MEAL! SRADE IN MATHEMATICS (0.0 - 4.0 SCALE) OF STUDENTS INTENDING TO MAJOR IN MATH SCIENCE AND ENGINEERING FIELDS
(BLACK MALES),-.
1 TEST YEARINTENDED
MAJOR FIELD 1 1975 1977 1978 1979 1980 1981 1982 1983 1984 1985 1986
PRE-MEDICINE 2.80 2-93 2.90 2.93 2.89 2.93 2.90 2.94 2.83 2.83
OTHER HEALTH FIELDS 2.50 2.54 2.53 2.57 2.55 2.52 2.54 2.51 2.52 2.52
eRELAW 0.00 2.41 2.47 2.46 2.48 2.42 2.45 2.44 2.43 2.43
HUMANITIES 2.19 2.23 2.25 2.24 2.28 2.21 2.28 2.32 2.24 2.17
HISTORY & CULTURE 2.13 2.13 2.23 2.30 4.11 2.27 2.24 2.18 2.00 2.23
FOREIGN LANGUAGES 2.45 2.33 2.16 2.48 2.70 2.39 2.40 2.46 2.03 2.43
STUDIO/PERFORMING ARTS 2.21 2.27 2.28 2.25 2.27 2.23 2.23 2.30 2.25 2.22
COMMUNICATIONS 2.09 2.13 2.18 2.12 2.18 2.18 2.18 2.19 2.15 2.17
BUSINESS 2.46 2.52 2.52 2.48 2.46 2.48 2.47 2.47 2.45 2.42
EDUCATION 2.22 2.30 2.30 2.31 2.28 2.32 2.28 2.31 2.30 2.28
VOCATIONAL FIELDS 2.43 2.51 2.48 2.48 2.43 2.46 2.46 2.45 2.42 2.45
OTHER/MISSING/UNDECIDED 2.34 2.38 2.38 2.37 2.38 2.39 2.42 2.43 2.40 2.41
TOTAL OFNON SCIENCE FIELDS 2.36 2.43 2.43 2.42 2.42 2.43 2.43 2.44 2.42 2.41
TOTAL OF ALL EXAMINEES 2.44 2.51 2.51 2.51 2.51 2.52 2.54 2.56 2.53 2.52
I
1
315
24-D
316

MEAN GRADE IN MATHEMATICS (0.0 - 4.0
1
INTENDEDMAJOR FIELD 1 1975
PRE-MEDICINE 2.82
OTHER HEALTH FIELDS 2.46
PRELAW 0.00
HUMANITIES 2.25
HISTORY & CULTURE 2.32
FOREIGN LANGUAGES 2.53
STUDIO/PERFORMING ARTS 2.27
COMMUNICATIONS :.24
BUSINESS 2.60
EDUCATION 2.35
VOCATIONAL FIELDS 2.47
OTHER/MISSING/UNDECIDED 2.39
TOTAL OFNON SCIENCE FIELDS 2.45
TOTAL OF ALL EXAMINEES 2.49
SCALE) OF STUDENTS INTENDING TO MAJOR IN MATH SCIENCE AND ENGINEERING FIELDS
(BLACK FEMALES)
TEST YEAR
1977 1978 1979 1980 1981 1982 1983 1984 1985 1986 1
2.86 2.82 2.82 2.81 2.83 2.78 2.82 2.81 2.82
2.51 2.52 2.51 2.49 2.51 2.47 2.47 2.46 2.48
2.52 2.48 2.50 2.47 2.49 2.45 2.48 2.47 2.52
2.30 2.30 2.29 2.29 2.31 2.38 2.31 2.26 2.24
2.39 2.26 2.34 2.24 2.38 2.29 2.35 2.36 2.16
2.47 2.33 2.37 2.32 2.34 2.35 2.49 2.37 2.45
2.32 2.31 2.33 2.28 2.27 2.30 2.28 2.24 2.30
2.28 2.31 2.29 2.28 2.27 2.29 2.28 2.29 2.24
2.62 2.62 2.58 2.57 2.54 2.53 2.54 2.50 2.50
2.42 2.40 2.39 2.35 2.37 2.37 2.35 2.33 2.35
2.47 2.47, 2.46 2.49 2.48 2.50 2.48 2.43 2.47
2.45 2.43 2.43 2.44 2.41 2.48 2.44 2.44 2.42
2.50 2.50 2.50 2.48 2.48 2.48 2.49 2.46 2.48
2.52 2.53 2.52 2.51 2.52 2.53 2.54 2.53 2.53
r 3 7 313

MEAN GRADE IN MATHEMATICS (0.0 - 4.0 SCALE) OF STUDENTS INTENDING TO MAJOR IN MATH SCIENCE AND ENGINEERING FIELDS
(OTHER STUDENTS)
INTENDEDI TEST YEAR I
MAJOR FIELD I 1975 1977 1978 1979 1980 1981 1982 1983 1984 1985 1986 I
PRE-MEDICINE 3.21 3.28 3.28 3.26 3.28 3.29 3.28 3.30 3.29 3.30
OTHER HEALTH FIELDS 2.78 2.80 2.80 2.83 2.82 2.83 2.83 2.82 2.82 2.84
PRELAW 0.00 2.67 2.76 2.79 2.79 2.75 2.75 2.74 2.72 2.75
HUMANITIES 2.61 2.64 2.61 2.62 2.62 2.63 2.63 2.65 2.64 2.64
HISTORY & CULTURE 2.53 2.64 2.51 2.53 2.57 2.52 2.56 2.59 2.55 2.54
FOREIGN LANGUAGES 2.67 2.68 2.65 2.63 2.72 2.72 2.69 2.70 2.64 2.73
STUDIO/PERFORMING ARTS 2.52 2.48 2.49 2.49 2.51 2.47 2.49 2.51 2.52 2.50
COMMUNICATIONS 2.49 2.52 2.47 2.47 2.51 2.49 2.49 2.49 2.48 2.50
BUSINESS 2.71 2.74 2.73 2.74 2.73 2.71 2.73 2.73 2.73 2.75
EDUCATION 2.54 2.54 2.52 2.52 2.54 2.52 2.51 2.55 2.57 2.59
VOCATIONAL FIELDS 2.64 2.62 2.59 2.60 2.63 2.63 2.66 2.66 2.63 2.63
OTHER/MISSING/UNDECIDED 2.69 2.67 2.68 2.67 2.68 2.70 2.69 2.73 2.72 2.73
TOTAL OFNON SCIENCE FIELDS 2.71 2.72 2.71 2.72 2.73 2.73 2.74 2.76 2.76 2.77
TOTAL OF ALL EXAMINEES 2.80 2.80 2.79 2.81 2.82 2.83 2.85 2.88 2.87 2.88
319 320

MEAN RANK IN CLASS OF STUDENTS INTENDING TO MAJOR IN MATH SCIENCE AND ENGINEERING FIELDS
(ALL STUDENTS)
INTENDEDMAJOR FIELD
PRE-MEDICINE
OTHER HEALTH FIELDS
PRELAW
HUMANITIES
HISTORY & CULTURE
FOREIGN LANGUAGES
STUDIO/PERFORMING ARTS
COMMUNICATIONS
BUSINESS
EDUCATION
VOCATIONAL FIELDS
OTHER/MISSING/UNDECIDED
TOTAL OFNON SCIENCE FIELDS
TOTAL OF ALL EXAMINEES
1
1 1975
84
74
0
76
74
81
72
74
71
71
69
72
73
75
1977
84
74
78
76
74
79
70
72
70
69
68
70
72
73
1978
84
73
78
75
73
78
69
72
69
69
67
69
71
73
1979
84
73
77
76
72
78
68
71
69
68
67
69
71
72
1980
84
73
77
75
73
77
68
71
69
67
67
69
71
72
TEST YEAR
1981
83
72
77
75
72
77
68
70
69
67
66
69
70
72
1982
83
72
76
75
72
77
67
70
68
67
66
68
70
72
1983
83
72
76
75
72
77
67
70
68
67
66
68
70
72
1984
82
71
75
75
72
77
66
69
68
67
65
68
70
72
1985
82
71
75
75
71
77
66
69
68
67
65
68
70
71
1
1986 1
83
72
75
75
72
77
67
70
68
69
64
68
70
72
r 321 3:2

MEAN RANK IN CLASS OF STUDENTS INTENDING TO MAJOR IN MATH SCIENCE AND ENGINEERING FIELDS
(WHITE MALES)i.
INTENDEDMAJOR FIELD
PRE-MEDICINE
OTHER HEALTH FIELDS
PRELAW
HUMANITIES
HISTORY $ CULTURE
FOREIGN LANGUAGES
STUDIO/PERFORMING ARTS
COMMUNICATIONS
BUSINESS
EDUCATION
VOCATIONAL FIELDS
OTHER/MISSING/UNDECIDED
TOTAL OFNON SCIENCE FIELDS
TOTAL OF ALL EXAMINEES
1 1975
84
76
0
75
72
79
70
71
70
67
67
71
72
74
1977
85
76
78
75
72
77
69
70
69
65
69
69
72
73
1978
85
76
78
75
71
77
68
69
68
65
68
68
71
73
1979
85
76
78
75
70
77
68
69
68
64
67
67
70
72
1980
84
76
77
74
71
78
67
69
68
63
67
67
70
72
TEST YEAR
1981
84
75
77
74
70
76
67
68
67
63
67
67
70
72
1982
84
75
76
73
70
76
66
68
67
63
66
67
69
72
1983
83
74
76
74
70
76
66
68
67
63
66
67
69
72
1984
83
73
75
73
69
76
65
67
66
63
66
67
69
72
1985
83
73
75
73
69
76
65
67
66
63
66
67
69
71
1
1986 1
84
73
76
74
71
77
65
67
67
65
65
66
69
71
32325-B
324

MEAN RANK IN CLASS OF STUDENTS INTENDING TO MAJOR IN MATH SCIENCE AND ENGINEERING FIELDS
(WHITE FEMALES)
INTENDEDMAJOR FIELD
PRE-MEDICINE
OTHER HEALTH FIELDS
PRELAW
HUMANIT,ES
HISTORY & CULTURE
FOREIGN LANGUAGES
STUDIO/PERFORMING ARTS
COMMUNICATIONS
BUSINESS
EDUCATION
VOCATIONAL FIELDS
OTHER/MISSING/UNDECIDED
TOTAL OFNON SCIENCE FIELDS
10TAL OF ALL EXAMINEES
1 1975
86
74
0
77
78
82
73
78
73
73
71
75
75
76
1977
86
74
80
77
78
81
72
77
72
72
70
74
74
75
1978
86
74
80
77
78
80
71
76
72
71
68
73
73
74
1979
86
73
79
77
77
79
70
75
72
70
68
73
73
74
1980
86
73
79
77
77
79
70
74
71
70
68
72
73
74
TEST YEAR
1981
85
73
79
76
77
79
69
74
71
69
67
72
72
73
1982
85
72
78
77
76
79
69
73
71
69
67
72
72
73
1983
85
72
78
77
77
79
69
73
71
69
67
72
72
73
1984
85
72
77
;7
77
78
68
72
70
69
66
71
72
73
1985
84
72
77
76
76
78
67
72
70
69
65
71
71
73
1
1986 1
85
73
77
77
77
78
68
73
70
70
65
71
72
73
r 325iI-1 n
b-,

MEAN RANK IN CLASS OF STUDENTS INTENDING TO MAJOR IN MATH SCIENCE AND ENGINEERING FIELDS
C.
INTENDEDMAJOR FIELD
PRE-MEDICINE
OTHER HEALTH FIELDS
PRELAW
HUMANITIES
HISTORY & CULTURE
FOREIGN LANGUAGES
STUDIO/PERFORMING ARTS
COMMUNICATIONS
BUSINESS
EDUCATION
VOCATIONAL FIELDS
OTHER/MISSING/UNDECIDED
TOTAL OFNON SCIENCE FIELDS
TOTAL OF ALL EXAMINEES
1
1 1975
77
70
0
69
67
72
66
66
68
63
66
68
67
69
1977
77
69
70
65
64
71
63
63
65
59
63
64
65
67
1978
77
69
69
65
61
70
63
62
65
58
63
61
64
66
(BLACK MALES)
1979 1980
77 78
68 69
70 69
64 65
63 63
73 69
63 62
60 62
64 63
59 59
63 63
62 61
64 64
66 66
TEST YEAR
1981
77
68
69
64
66
66
62
61
63
59
62
61
64
66
1982
77
68
68
66
63
66
61
62
63
59
63
63
64
66
1983
77
68
69
65
63
69
62
61
63
58
63
62
64
66
1984
75
67
67
67
57
62
61
60
63
59
61
61
63
66
1985
74
67
67
65
62
73
61
61
62
56
62
61
63
65
1986
75
66
67
66
60
67
61
59
63
59
61
60
63
65
1

MEAN RANK IN CLASS OF STUDENTS INTENDING TO MAJOR IN MATH SCIENCE AND ENGINEERING FIELDS
(BLACK FEMALES)
INTENDEDMAJOR FIELD
PRE-MEDICINE
OTHER HEALTH FIELDS
PRELAW
HUMANITIES
HISTORY & CULTURE
FOREIGN LANGUAGES
STUDIO/PERFORMING ARTS
COMMUNICATIONS
BUSINESS
EDUCATION
VOCATIONAL FIELDS
OTHER/MISSMG/UNDECIDED
TOTAL OFNON SCIENCE FIELDS
TOTAL OF ALL EXAMINEES
1
1 1975
79
69
0
70
71
71.
67
71
69
66
65
68
69
70
1977
76
67
72
70
67
72
64
69
66
63
63
65
67
67
1978
75
66
70
69
63
72
63
69
66
63
62
64
66
67
1979
75
67
70
68
66
70
63
67
65
62
62
65
66
67
1980
75
66
70
68
65
71
63
66
65
62
63
64
66
67
TEST YEAR
1981
76
66
69
68
68
71
63
66
65
61
62
64
66
66
1982
75
66
69
68
66
69
62
67
65
61
62
64
65
67
1983
75
65
69
68
70
72
62
66
65
61
62
65
66
67
1984
74
65
68
68
68
70
61
65
64
61
62
63
65
66
1985
75
65
68
68
65
71
62
65
65
62
61
64
65
66
1
1986 1
76
66
69
69
63
69
62
67
65
63
63
64
66
67
330329

MEAN RANK IN CLASS OF STUDENTS INTENDING TO MAJOR IN MATH SCIENCE AND ENGINEERING FIELDS
'
INTENDEDMAJOR FIELD
PRE-MEDICINE
OTHER HEALTH FIELDS
PRELAW
HUMANITIES
HISTORY & CULTURE
FOREIGN LANGUAGES
STUDIO/PERFORMING ARTS
COMMUNICATIONS
BUSINESS
EDUCATION
VOCATIONAL FIELDS
OTHER/MISSING/UNDECIDED
TOTAL OFNON SCIENCE FIELDS
TOTAL OF ALL EXAMINEES
1 1975
84
74
0
76
75
75
71
73
71
69
68
72
73
. 74
1977
83
72
75
75
72
74
68
72
69
67
66
68
71
72
1978
83
72
75
73
70
72
67
70
68
66
65
67
70
71
(OTHER STUDENTS)
1979 1980
83 83
72 71
75 75
74 73
71 73
72 72
66 66
70 69
68 68
65 65
65 65
67 67
70 70
71 71
TEST YEAR
1981
82
71
74
73
71
72
66
69
68
65
65
67
69
71
1982
82
71
74
72
71
72
65
69
68
64
65.
66
69
71
1983
83
71
74
73
68
71
65
69
67
65
65
67
69
72
1984
82
71
72
72
69
71
66
69
67
65
64
67
69
71
1985
82
71
72
73
71
72
64
68
67
65
64
67
69
71
1
1986 1
83
71
74
75
72
73
65
69
69
67
64
68
70
72
331
25-F
332

PERCENT OF STUDENTS WHO INTEND TO MAJOR IN NONSCIENCE WHO PLAN TO RECEIVE A GRADUATE DEGREE
(ALL STUDENTS)
INTENDEDi TEST YEAR
I
MAJOR FIELD I 1975 1977 1978 1979 1980 1981 1982 1983 1984 1985 1986 I
PREMEDICINE 99 98 98 98 98 98 98 98 98 98 98
OTHER HEALTH FIELDS 40 47 49 52 54 54 53 53 54 58 59
PRELAW 0 87 87 87 87 86 87 86 85 86 85
HUMANITIES 55 59 58 58 60 60 61 62 63 63 65
HISTORY & CULTURE 57 61 59 58 60 60 61 62 60 62 63
FOREIGN LANGUAGES 56 57 56 56 58 60 61 61 61 62 61
STUDIO/PERFORMING ARTS 40 39 38 37 38 38 38 37 37 37 37
COMMUNICATIONS 44 45 44 45 44 45 45 44 45 46 45
BUSINESS 35 36 36 37 39 40 41 41 42 43 43
EDUCATION 46 43 43 43 43 -7i3 42 42 42 43 44
VOCATIONAL FIELDS 25 29 29 29 29 30 29 29 30 31 27
OTHER/MISSING/UNDECIDED 49 43 41 41 43 43 4c 44 45 46 45
TOTAL OFNON SCIENCE FIELDS 46 49 49 49 50 50 50 51 52 52 51
TOTAL OF ALL EXAMINEES 53 53 52 52 53 54 54 54 55 56 55
26-A
331

PERCENT OF STUDENTS WHO INTEND TO MAJOR IN NON-SCIENCE WHO PLAN TO RECEIVE A GRADUATE DEGREE
(WHITE MALES)
INTENDEDMAJOR FIELD
PRE-MEDICINE
OTHER HEALTH FIELDS
PRELAW
HUMANITIES
HISTORY & CULTURE
FOREIGN LANGUAGES
STUDIO /PERFORMING ARTS
COMMUNICATIONS
BUSINESS
EDUCATION
VOCATIONAL FIELDS
OTHER/MISSING/UNDECIDED
TOTAL OFNON SCIENCE FIELDS
TOTAL OF ALL EXAMINEES
1
1 1975
99
79
0
64
57
69
49
41
41
45
25
51
53
59
1977
99
82
89
65
61
69
48
41
42
42
33
43
56
58
1978
99
83
89
65
59
70
45
40
41
40
31
40
55
56
1979
99
82
88
65
58
67
44
40
42
39
31
39
54
56
1980
99
84
88
67
59
70
43
40
43
38
30
41
54
56
TEST YEAR
1981
99
83
88
65
58
70
43
40
44
38
31
41
54
56
1982
98
82
88
66
59
69
42
40
45
37
31
42
54
56
1983
99
81
87
65
60
70
41
39
45
38
31
42
54
55
1984
98
79
87
65
58
69
42
39
46
39
32
42
55
56
1985
98
79
88
66
61
70
41
41
46
40
32
44
55
56
1
1986 1
98
78
86
67
60
68
39
40
45
42
26
42
52
55
33526-B
336
PERCENT OF STUDENTS WHO INTEND TO MAJOR IN NON-SCIENCE WHO PLAN TO RECEIVE A GRADUATE DEGREE
(WHITE FEMALES)
INTENDEDTEST YEAR
I
MAJOR FIELD I 1975 1977 1978 1979 1980 1981 1982 1983 1984 1985 1986 I
PRE-MEDICINE 98 98 97 97 98 98 98 98 98 98 98
OTHER HEALTH FIELDS 27 34 37 39 42 43 43 43 45 49 50
PRELAW 0 84 85 84 85 85 86 86 85 84 84
HUMANITIES 48 53 53 53 55 57 58 59 62 61 63
HISTORY & CULTURE 55 60 59 59 62 64 63 65 65 66 67
FOREIGN LANGUAGES 53 53 53 53 55 57 59 59 60 61 61
STUDIO/PERFORMING ARTS 34 34 33 33 33 34 34 34 34 34 34
COMMUNICATIONS 43 44 43 44 43 44 43 45 45 47 45
BUSINESS 20 24 25 28 31 33 34 35 36 37 37
EDUCATION 44 43 43 44 43 43 43 41 43 43 44
VOCATIONAL FIELDS 20 22 22 22 22 23 22 23 24 24 22
OTHER/MISSING/UNDECIDED 44 39 38 38 40 42 42 43 45 45 46
TOTAL OFNON SCIENCE FIELDS 38 40 41 42 43 44 45 45 47 48 46
TOTAL OF ALL EXAMINErS 44 45 45 46 47 48 49 49 51 5a 52
,- 337 333

PERCENT OF STUDENTS WHO INTEND TO MAJOR IN NON-SCIENCE WHO PLAN TO RECEIVE A GRADUATE DEGREE
(BLACK MALES)
INTENDEDMAJOR FIELD
PRE-MEDICINE
OTHER HEALTH FIELDS
PRELAW
HUMANITIES
HISTORY & CULTURE
FOREIGN LANGUAGES
STUDIO/PERFORMING ARTS
COMMUNICATIONS
BUSINESS
EDUCATION
VOCATIONAL FIELDS
OTHER/MISSING/UNDECIDED
TOTAL OFNON SCIENCE FIELDS
TOTAL OF ALL EXAMINEES
1
1 1975
99
76
0
67
53
67
50
48
51
40
30
60
56
59
1977
98
76
83
64
54
79
49
47
51
40
32
45
56
58
1978
98
77
86
56
40
73
47
43
51
37
33
44
55
57
1979
99
78
85
63
44
73
(7
44
51
36
35
45
55
57
1980
99
80
87
64
46
66
46
45
51
35
33
45
55
57
TEST YEAR
1981
98
78
86
60
46
80
46
46
50
36
35
47
55
57
1982
98
75
84
57
54
70
43
49
49
34
34
47
54
56
1983
98
74
83
57
49
64
41
43
49
33
34
46
53
55
1984
98
75
82
63
44
50
40
40
48
32
34
43
53
55
1985
97
75
82
65
41
72
42
41
46
37
33
48
53
55
1986 1
97
74
84
63
50
60
38
39
44
34
29
39
48
51
339
26-D
340

PERCENT OF STUDENTS WHO INTEND TO MAJOR IN NON-SCIENCE WHO PLAN TO RECEIVE A GRADUATE DEGREE
INTENDEDMAJOR FIELD
PRE-MEDICINE
OTHER HEALTH FIELDS
PRELAW
HUMANITIES
HISTORY & CULTURE
FOREIGN LANGUAGES
STUDIO/PERFORMING ARTS
COMMUNICATIONS
BUSINESS
EDUCATION
VOCATIONAL FIELDS
OTHER/MISSING/UNDECIDED
TOTAL OFNON SCIENCE FIELDS
TOTAL OF ALL EXAMINEES
1
(BLACK FEMALES)
TEST YEAR
1 1975 1977 1978 1979 1980 1981 1982 1983 1984 1985
98 99 98 98 98 98 98 98 98 98
53 56 57 58 60 61 59 56 58 60
0 88 87 88 86 87 85 86 84 84
65 70 66 71 69 71 64 66 66 68
66 70 59 62 73 58 75 68 64 66
73 74 66 66 73 73 69 75 72 64
50 47 49 46' 48 49 46 45 42 44
67 65 69 66 62 62 63 61 60 58
42 45 46 47 48 50 50 47 46 48
60 56 55 54 54 55 53 52 50 50
40 33 37 37 37 39 40 36 36 36
63 55 58 58 56 57 58 57 57 55
57 57 59 59 59 60 60 58 58 59
62 61 62 62 62 63 62 61 61 61
1
1986 1
98
59
84
66
59
61
40
57
48
50
35
55
58
60
342

PERCENT OF STUDENTS WHO INTEND TO MAJOR IN NON-SCIENCE WHO PLAN TO RECEIVE A GRADUATE DEGREE
(OTHER STUDENTS)
INTENDEDMAJOR FIELD
PRE-MEDICINE
OTHER HEALTH FIELDS
PRELAW
HUMANITIES
HISTORY & CULTURE
FOREIGN LANGUAGES
STUDIO/PERFORMING ARTS
COMMUNICATIONS
BUSINESS
EDUCATION
VOCATIONAL FIELDS
OTHER/MISSING/UNDECIDED
TOTAL OFNON SCIENCE FIELDS
TOTAL OF ALL EXAMINEES
1
1 1975
98
57
0
68
65
60
47
52
43
53
33
59
58
64
1977
98
59
86
67
68
58
41
52
42
47
33
51
56
60
1978
99
59
86
66
66
53
41
48
42
46
33
49
55
59
1979
98
64
88
64
60
60
41
52
43
47
35
49
57
60
1980
98
65
86
66
67
59
40
52
45
48
34
51
57
61
TEST YEAR
1981
98
65
86
64
61
56
42
50
46
45
35
51
58
61
1982
98
65
86
62
67
59
41
51
46
46
34
50
58
61
1983
98
65
84
68
68
57
41
51
-t8
46
34
51
59
61
1984
98
66
84
65
67
58
40
52
48
46
35
54
60
62
1985
98
68
85
66
63
59
41
51
49
47
36
55
61
63
1986
98
66
86
66
69
57
41
53
50
48
32
51
59
62
1