DOCUMENT RESUME ED 100 565
149
ED 100 565 AUTHOR TITLE INSTITUTION SPONS AGENCY REPORT NO PUB DATE NOTE AVAILABLE FROM DOCUMENT RESUME RC 008 255 Reid, Joseph M.; Miles, Guy M. An Evaluation of Three Experimental Rural Youth Projects: The Projects' First Year. Final Report. North Star Research and Development Inst., Minneapolis, Minn. Manpower Administration (DOL), Washington, D.C. DLMA-41-1-001-27-3 May 74 149p.; For related documents, see RC 008 246 and 247 National Technical Information Service, Springfield, Virginia 22151 ($3.00) !MPS PRICE MF-$0.75 MC-86.60 PLUS POSTAGE Behavior Patterns; *Control Groups; Employment Patterns; *Experimental Groups; Job Satisfaction; Job Training; *Post Secondary Education; *Program Evaluation; *Rural Youth; Tables (Data); Work Experience Prog.'ms *Neighborhood Youth Corps; North Central States DESCRIPTORS ABSTRACT The Rural Youth Program, a model Neighborhood Youth Corps program based on previous research, was designed to maximize racial and occupational adjustment of rural youth in the North Central States. Although the program's first year (1972-73) was not full year, it was initially evaluated at three sites (northern Minnesota, southern Iowa, and central Nebraska) to: (1) test the effectiveness of the program guidelines; and (2) gather baseline data on the experimental and control groups for this evaluation. Onestionnaires were mailed to both the experimental and control groups approximately 6 months after most of the youths had completed high school. Respondents were grouped according to: (1) youths who entered a post-high school educational of training institution; (2) youths who did not enter a post-high school institution but left their community in 1972-73; and (3) youths who did not migrate from their community in 1972-73. Criterion measurements for this evaluation were: (1) preparation of participants for the world of work; (2) post-high school education or training; (3) post-high school employment--job hunting behavior, job characteristics, and job satisfaction; and (4) social participation behavior. A longer observation period was recommended in order to obtain a more accurate measure of program effectiveness. (NQ)
Transcript of DOCUMENT RESUME ED 100 565

ED 100 565
AUTHORTITLE
INSTITUTION
SPONS AGENCYREPORT NOPUB DATENOTE
AVAILABLE FROM
DOCUMENT RESUME
RC 008 255
Reid, Joseph M.; Miles, Guy M.An Evaluation of Three Experimental Rural YouthProjects: The Projects' First Year. Final Report.North Star Research and Development Inst.,Minneapolis, Minn.Manpower Administration (DOL), Washington, D.C.DLMA-41-1-001-27-3May 74149p.; For related documents, see RC 008 246 and247National Technical Information Service, Springfield,Virginia 22151 ($3.00)
!MPS PRICE MF-$0.75 MC-86.60 PLUS POSTAGEBehavior Patterns; *Control Groups; EmploymentPatterns; *Experimental Groups; Job Satisfaction; JobTraining; *Post Secondary Education; *ProgramEvaluation; *Rural Youth; Tables (Data); WorkExperience Prog.'ms*Neighborhood Youth Corps; North Central States
DESCRIPTORS
ABSTRACTThe Rural Youth Program, a model Neighborhood Youth
Corps program based on previous research, was designed to maximizeracial and occupational adjustment of rural youth in the NorthCentral States. Although the program's first year (1972-73) was notfull year, it was initially evaluated at three sites (northernMinnesota, southern Iowa, and central Nebraska) to: (1) test theeffectiveness of the program guidelines; and (2) gather baseline dataon the experimental and control groups for this evaluation.Onestionnaires were mailed to both the experimental and controlgroups approximately 6 months after most of the youths had completedhigh school. Respondents were grouped according to: (1) youths whoentered a post-high school educational of training institution; (2)youths who did not enter a post-high school institution but lefttheir community in 1972-73; and (3) youths who did not migrate fromtheir community in 1972-73. Criterion measurements for thisevaluation were: (1) preparation of participants for the world ofwork; (2) post-high school education or training; (3) post-highschool employment--job hunting behavior, job characteristics, and jobsatisfaction; and (4) social participation behavior. A longerobservation period was recommended in order to obtain a more accuratemeasure of program effectiveness. (NQ)

I I
I
4. *
BEST COPY AVAILABLE
FINAL REPORT
on
EXPERIMENTAL RURAL YOUTH PROJECTS:THE PROJECTS' FIRST YEAR
AN EVALUATION OF THREE
1 p
byJoseph M. Reid and Cu) H. Miles
to
MANPOWER ADMINISTRATIONU. S. DEPARTMENT OF LABOR
from
kr:NORTH STAR RESEARCH INSTITUTE
3100 38th Avenue SouthMinneapolis, Minnesota 55406
"Ii!) May 1974
0002
S PAstINTI NT OF Hl4l THt Out ATION ti teft L VAMP'NATIONAL NSTITUTE Of
1.01,JC4fION.'r ht r or ; M.
I I .; 4 .t t .1 1, .14,40...r.L. %.t .
t 1 Mt PM'

DISCLAIMER
This research was prepared under ContractNo, 41-1-001-27 with the Manpower Admini-stration, U. S. Department of Labor, underthe authority of the Economic OpportunityAct. Researchers undertaking such projectsunder government sponsorship are encouragedto express their on judgments. Interpre-tations or viewpoints stated in this docu-ment do not necessarily represent the offi-cial position or policy of the Departmentof Labor. ;If ,

STANDARD TITLE PACEFOR TECHNICAL REPORTS
el. Keport No.
DL MA 41-1-001-27-13* Gore. AteststoR
No.3. Ho: tplent's Catalog No.
4. ale An. '.uottele
An Evaluation of Three Experimental Rural Youth Projects:The Projects' First Year
S. Keport Date
May 19746. Pettormtng Organtzat ton Code
7. Authotts)Joseph M. Reid and Guy H. Miles
11. Preforming OrgAnitation kept.No.
9. Peetotrnsig Organitation Name and Address
North Star Research Institute3100 38th Avenue South
.
Minneapolis, Minnesota 55406
10. Protect:Tasl %Wel: Una No.
11. Contract/Grant No.
DL 41-1-001-27
12. Sportior.n.: k,ten, s Name a. i Alters*U.S. Department of LaborManpower AdministrationOffice or" Research and Development
1111 20th St., 11.W. Washington, D.C. 20210
13. Tyre of Report & PeriodCoveted
Final Report
14. Sponsoting Ageno Code
S. Supp:ement.tey Notes
16. AbstractsA model program for rural youth in the
the result of previous research in the Northone year of operation. The purpose of the evaluationness of the program in attaining its goals ofjustment of participating rural youth. Thesites -- in northern Minnesota, southern Iowaof the evaluation show no statistically significantthe exp.,,rimental sample who participated infrom the control sample who did not participate.
The program's first year was not a full-yearnot carried out according to the guidelines
North Central states, which wasCentral region, was evaluated after
was to test the effective-better occupational and social ad-
program was tested at three differentand central Nebraska. The results
difference between youth fromthe program's first year and youth
program and, in Iowa, wasestablished for it. For these
on attached page)TfiCey 4 urd% and Document Analysts. 17a. Desettptotscontin4ed
EvaluationRural Areas
176. loenetfieraiOpen-Indid Terms
Model ProgramsMut".
lie. C tr;A TI 1.1e1(1/ttlop 5K
18.. vset,,,, . n .# ,to.n nt
Distribution in unlimited. Available fromNational. Technical Information service, SpringfieldVA., 22151.
...--
19. sc, way Class (fistskepotO
'.24.-,.
21. Nin. ,f l'Iges155
ovy(.11.0.(ihiiPage
ItN, 1.A(1/411:11 0
n. Pet, e$3
roma f .I', )1
0004
USCWAU.C,C. 63u:abttp

Abstract (Continued)
reasons the evaluation outlined in this report is not an adequate testot the Rural Youth Program as it was designed to be operated. The Program
was continued for a second year in Minnesota and Iowa and a separate eval-
uation will be made of the program's second year in these two states.
00(Th

ACKNOWLEDGEXENTSBEST COPY AVAILABLE
It is not pos:lible, of ourt.e, to acknowledge thecontribl:tion.; of everyone who cooperated in the study. Weare particularly iudlqed to the ad!ainistrators and staffmember!, of the Emperirlentll Rural Youth Prograas and theNYC who :011t out of their way to cooperate withui;. We arc alo indebted to the administrators and staffmvmhers of th: high schools that are participatinr, in thisstudy.
At the U. S. Deparment of Labor, Dr. Howard Rosenand hi:; staff, is particular, Dr. Harry Lieberman, werevery helpful t) u.; in carring out the re:.oareh aspects ofthe pre.,ra:n. urther,lore, Mr. Morwin Han':, Director, Of-f ice 01. E..:!:,loy:-.!at Development Programs, without whose in-terest and support the study could not have been conducted,and Ms. PF;iv MoClow, Manpower Specialist. in the Divisionof Work E%perionce Programa, were very helpful to us inmany ways.
At the regional offices of the U. S. Department ofLabor, Mr. Harold Associate Manpower Administratorfor Iowa and ::ebraska, and Mr. Richard Palmore and Mr. MelHoward, Associate Manpower AdJnistrators for Minnesota andtheir staffs, in particular, Adrian Curtiss and WoodrowAustin of the Kan;; :; City office and David Johnson of theChicago office, responded to every request for help.
Finally, we wish to thank Sharon Strom, Norma Hruska,Mary Hoaglund, and Marie L. Allen who acted as liaisons be-tween-rearch and operation staff and collected much of thedata used to write this report.

TABLE OF CONTENTS
INTRODUCTION
Page
1
How the Rural Youth Program was Developed 1
Major Features of the Rural Youth Programas Outlined in the Original Guidelines 5
THE APPROACH USED TO EVALUATE THE RURAL YOUTH PROGRAM 7
Evaluation Design 7
Criterion Measures 9
Previous Evaluation Reports 13
Barriers to Implementing this Design 15
RESULTS OF THE EVALUATION 17
Survey Bias 17
Observation Period of the Evaluation 19
Incomplete Responses to the Questionnaire 21
The High Percentage of Youths in the Nebraska Control.Sample Who Enrolled in Post-High School Institutions 23
The Problem of Finding an American Indian Control Sample 25
Comparison of NYC Enrollee Respondents from the ControlSample with Summer Enrollee Respondents from the 27Experimental Sample
THE ORGANIZATION OF THE EVALUATION 29
EVALUATIoN OF THE MINNESOTA PROJECT IMPLEMENTEDBY THE MINNESOTA SPONSOR 33
General Features of the Minnesota Project 33
Area Served and Project Administration 33Summer Program 33School Year Program 34
Results of the Evaluation of the Minnesota Project 39
Preparation of nigh School Seniors for aFull-time Job 39
Enrollment in a Post-High School Educationalnr 'training Institution . 39
Post-High (11(1(it Empinymont 40Social PartiJ:tpation h,ihavi.or 43
0 0 0

TAtal CC:I.C.N1S ((mtainoed)
LVAI):\i10': h 11;0AFo.
kVA SP6-
Pa^e
45
6cneral Fo,:turos of the Iowa Proi:ct 45
AroA .n1 Project Adhluistraticot 45
c rt. 45s:11,01 1r Ptohr,rn 46
Re:;u1ts oC th E:a1ALItion of the Iowa Project 49
Preparitio2 of School. Seniors for a
Fut l-t i Job 49Enrolt:,.at in a Pest-illi.,h :;chool Educational
or Irdinin... Iu8titution 49
Post-Hih Sool !:.oloy-ent 50So.tal flehavior 52
EV\LUA11 0 TN!: NiAIR%S7A Pr,OJFCT IPLEMETD BY THENEBIC.;);.:A 53
GenrAl FeilturA of the Nebrasl:a Project 53
Area S...rve0 :nd Project Administration 53Pr0::ral 53
School_ YoiT ii :u 54
Results of the EvaluAtIon of the Nebras%a Project 59
Prep.:rottr:n of High School. Seniors for a
Pull -ti , Joh 59Eurollr!nt in : P0A-11iRh School Uuational
or Trai,lin:-; 591.1i,r- 63
S,) 141 i'articipatiim 66
Ao!!:: A: W. (r! %Eir: OF THE EVALUATION QUEST1oNrAin
1;: C11:.':,(jC.:F.,T1(': Nol THE',':It !Vo.:PLES
(:: () r A!;) (:()N 1.11()I,c:c.t.-; ;rt.!:
CM:::;;!: oFFEnD
" ."4"1r.
NOS

TABLE OF CONTENTS (Continued)
APPENDIX F: TABLES OF VARIABLES USED FOR THE POST-HIGH SCHOOL EDUCATION AND TRAINING CRITERIONMEASURES .ro
APPENDIX G: TABLES OF VARIABLES USED AS CRITERION MEASURESOF POST-HIGH SCHOOL EMPLOYMENT
APPENDIX H: TABLES OF VARIABLES USED FOR THE SOCIAL PARTICI-PATION CRITERION MEASURES
APPENDIX I: TABLES COMPARING AMERICAN INDIMIRESPONDENTSFROM THE MINNESOTA EXPERIMENTAL AND CONTROL SAMPLES
APPENDIX J: TABLES COMPARING NYC RESPONDENTS FROM THE CONTROLSAMPLE WITH SUMMER EXPERIMENTAL PROJECT RESPONDENTS
0009

INTRODUCTION
How the Rural Youth_ Program was DevelopedProgram
1968 North Star Research Institute began a research study for
the Mandower Administration aimed at developing a model NYC program to
meet the needs of rural youth in the North Central States. The first
phase of the study was designed to identify the factors that influence
the future well-being of young people who grow up in the rural parts of
the North Central States. During this phase of the research, opinionsof three groups of experts -- those who publish, rural community leaders
who deal with youth, and urban leaders who deal with youthful rural-to-urban migrants -- were used to develop hypotheses concerning the factors
that affect the later occupational and social adjustment of rural youth.
These hypotheses were then tested in a longitudinal study of a cross
section of young adults who had grown up in rural areas in the region.1/
The flowchart on Page 2 (Part A) delineates the design of this first
phase of the study.
17Miles, G. H., "Phase 1 -- Optimizing the Benefits of Neighborhood YouthCorps Projects for Rural Youth", prepared for the Office of ManpowerPolicy, Evaluation, and Research; U. S. Department of Labor (1968).
Miles, G. H., "Survey of Recent Literature Relevant to Optimizing theBenefits of Neighborhood Youth Corps Projects for Rural Youth", pre-pared for the Office of Manpower Policy, Evaluation, and Research;U. S. Department cf. Labor (1968).
Miles, G. H., Henry, W. F., and Taylor, R. N., "Optimizing the Bene-fits of Neighborhood Youth Corps Projects for Rural Youth, Phase 2:A Follow-up Study of 1144 Young Adults", prepared for the ManpowerAdministration: U. S. Department of Labor (1969).
-1-
0010

LiteratureReview
UrbanInterviews
Rural
Interviews
Develop
Hypotheses
Test Hypothesesin Follow-up Study
Is
HypothesisHypothesisSubstantiated
Yes
Drop
Hypothesis
PART A
DESV;t4 FOP PHASE 1 OF THE STUDY"OPTIMIZING THE BENEFITS 1W THE NEIGHRORHOOD YOUTH CORPS FOR RURAL. YOUTH"
(Report Submitted August l')69)
co to page 4-2-
0011

During the second phase of the study, the hypotheses that wore
substantiated in the longitudinal study were used to develop guidelines
for a model program. The steps taken to convert the research findings
to program guidelines are delineated in the flowchart on Page 4 (Part B).
C. R., 'Cuidelines for an Experimental Rural Youth Programfor the North Central States", prepared for the Manpower Administra-tifm, V. Department of Labor (1971).
Mi I'''-;, G. H.. and Thompson, D. 1.., "Three Model Projects for an Ex-perimental Runtl Youth Prce;r1m", prepAred for the Manpower Admlnis-tri'ion, t.. Department of Labor (1971).
C. H. , and Theqp.;on, D. L., "Handh(Oks for the ExperimentaIRurd Youth Provx4m", prelred ri,r. the 'Alnpower AdmInktration, U.S.1)plrtment of L.0,or (19/1).
-3-
0012

ManipulableVariable
Is \)..
\.--
Yes
Drop
Variable
YesYes
ManipulableBy LocalCommunity
Yes,
ManipulableBy Federally
SponsoredPrograms
Yea
Include
CuiielinesIn Initial
AcceptableFor Rural
\!!!thfltLi
YesInclude inTentativeGuidelines
.----1
Is Model
Acceptable YesTo RuralLeaders
Include in.TentativeGuidelines
Review ModelWith
Departmentof Labor
No
--N 1=111.111111111ILM.
Modify Modify Prepare
Initial Tentative Final
Guidelines Guidelines
* *
PART B
DESIGN FOR PHASF 2 OF THE STUDY"OPTIMIZING THE BENEFITS OF THE NEIGHBORHOOD YOUT11 CORPS FOR RURAL YOUTH"
(Report Submitted 'lay 1971)
From page 2
Go to page 10 -4-

Mayor Features of Pro ,ramas Outlined in tile bridinaT GuideTines
The program guidelines that were developed through this process
of research and analysis differed so markedly from the basic NYC con-
cepts that the program has been named "Rural Youth Program" rather than
"Rural NYC".
The program has both in-school and out-of-school enrollees. It
has a summer program that emphasizes urban living experience and selected
skill training; it has a school-year program which provides the enrollees
with specified services, experiences and training that the community is
unable to provide. Within the limits of a prescribed set of program com-
ponents the program is individualized to fit the needs of each enrollee.
The eligibility requirements are liberal: poverty, geographical
and social isolation, and inadequacy of the existing educational system
are reasons for eligibility. Work experience is a component, but is uti-
lized as a counseling tool, not as an end in itself. Only those enrollees
who meet established poverty criteria are paid for participation. Counsel-
ing is provided from two sources: the project has full-time counselors,
and a member of the regular teaching staff of each participating school is
hired as a part-time project employee.
The components from which the project director can develop his
program are listed below. Those components marked "*" are mandatory for
all enrollees.
intake*Assessment
*Counseling
Vocational/EducationalSchool
Personal/CoachingOrientationEducationTrainingWork Experience
-5-
0 01.

Orientation to Work and Higher Education*World of Work Information*Orientation to Higher Education*Occupational Familiarization*Orientation to Armed Services
Social Skills DevelopmentPreparation for Urban LivingFinancial TrainingLeadership DevelopmentDriver Education
Supportive Services*Health ServicesTransportationDay Care
Opportunity DevelopmentJob DevelopmentPlacementFollow-up
The results of the original research indicated that rural communi-
ties vary widely in what they can offer their youths; the model program
was therefore designed to be flexible enough that each project director
could fit the program content to the needs of the youths that the program
was trying to serve. The program guidelines allowed sponsors and project
directors considerable freedom in determining the program content that was
to be used in the rural area served by their project.
-6-
0015

THE APPROACH USED TO EVALUATE1E kU AL roViiP-RRAW
Evaluation Design.
The rural areas in the North Central states do not provide a homo-
geneous economic climate within which to teat a new social program. Rather,
there are three major rural economies, each posing a different set of oc-
cupational and social problems for the youths growing up in the rural com-
munities involved. Roughly, these economies are defined geographically as
the Corn Belt, the Great Plains, and the Northern Forest Region.
Our evaluation design therefore provided for three separate experi-
mental projects -- one in northern Minnesota (the Northern Forest Region),
one in southern Iowa (the Corn Belt), and one in central Nebraska (the
Great Plains). One group of youths in each state would be enrolled in
the new program; a matched group of youths would not be offered the pro-
gram.1/
An effort was made to2/select two areas in each state that were
socioeconomically comparable. Communities in one area were offered the
model program, those in the other were not. As a result, although youths
were not randomly assigned to experimental and control groups, it could
be expected that the two groups of youths would be exposed to very sim-
ilar social, community and educational environments.
.11.1=110-..Y.will'Ideally, youths would have been assigned randomly to experimental andcontrol groups. Such random assignment, however, was not suited to thevoluntary character of the model program. Furthermore, it was apparentthat local community lenders and school administrators would have opposedany program that was available to some youths who were eligible but notto other young people in the same school who were equally eligible.Consequently, it was decided to construct experimental and control groupsthat would he as closely matched as possible.
2/See Appendix C, "Characteristics of the Experimental and Control Commun-ities"
-1-
0016

Youths from the experimental area who participated in the Rural
Youth Program were individually matched with youths in the control area
for sex, race and intelligence.
The flowchart on page 10, entitled "Part C", summarizes the over-
all evaluation design.
-8-
0017

Criterion Measures
The primary objective of the experimental program was "the place-
ment of an enrollee into a job, a higher education experience, or an ad-
ditional training opportunity that would not otherwise be available to
him". A second objective was to aid rural youth in making a trannition
from rural to urban living, if that was their choice.
The evaluation of the degree to which the program was successful
in achieving these goals is based on a broad range of occupation) and
social adjustment measures. The following is a complete list of the
criterion measurements:
1. Preparation for the World of Work
High school graduationAn idea of the type of work desired
2. Post-High School Education or )raining
Post-high school institutional edu-cation or training
Type of post-high school institutionaleducation or training
Subject dropped out of post-high schoolinstitutional education or training
3. Post-High School Employment
a. Job-Hunting Behavior
Amount of time spent looking for work.Applications for jobsInterviews for jobsOffers of jobs
b. Job Characteristics
Type of jobNumber of weeks employedSalary earned
c. Job Satisfaction
Subject found type of job desired
4. Social Participation Behavior
Knowledge of recreational facilitiesKnowledge of essential facilitiesSubject spends weekends in the new town or city
-9-
001A

Sample
RuralCounties inMinnesota,Nebraska,and Iowa
*From page 4
ExperimentalCounties
. P I
(Program)Given
.... IIIIMMIZIa GlIk \ /1 Baseline 1 1 , Re asmiriaea". k
Measures ) I /Occupationaliof
IIndividual 6 Adjustment
1 and Sociald lidi
. 1i..
On-site observat4n of operation
PSample)
Allocation Make Comparison Mike ComparisonBy Matching To Ensure To FindCommunity Equivalence DifferenceCharacteristics To Begin With I As A Result
Of Program
I
On-site observation olf existing programs
...01(: ControlCounties
/Baseline/ Measures
ktividuals
of
Gomorra rummorma
PART C
tICograu
not`Given /%is./
STUDY DESIGN FOR
EVALUAT I tiC PROCRM EFFECT I MIES S
-10-
0019
I/ MeasureOccupational\and Social
t Adjustment/

The variables examined under the first general category are not
directly related to the model program objectives, but they may be associ-
ated with the attainment of the objectives. The failure of a youth to
complete high school or the failure of a youth to decide on a possible
career by the time he leaves high school may have a detrimental effect on
his ability to adjust to a full-time job.
The variables examined in the second general category apply to
youths who entered college or some other post-high school educational or
training institution. The short observation period of the evaluation
limited the number and variety Of the variables in this category that could
be used for comparison. The number of youths entering a post-high school
institution, tha type of institution.(college or other), and the dropout
ratio were the criterion measures used to compare youths in the experi-
mental and control samples.
Youths who did not enter a post-high school institution are grouped
into two categories, those who migrated from their local community and those
who did not. The variables examined under the third general category are
grouped into the following subcategories: job hunting behavior, job char-
acteristics, and job satisfaction.
The original North Star study showed that many young people who
migrated to larger towns and cities after graduation from high school were
not able to adjust to the new surroundings. Again, the short observation
period of the evaluation limited the variety of variables of this type that
could be used for comparison. Knowledge of the recreational and essential
facilities of the new town or city and "weekends in the city" are the vari-
ables used for the fourth general category.
0020

Previous Evaluation Reports
North Star field staff on site at each project and North Star
professional staff who traveled to the three projects collected detailed
information about how the project was being operated, how the guidelines
were being interpreted, and the difficulties encountered in applying the
guidelines to practical situations. These data show what the program
actually is, as contrasted with what it was intended to be. This infor-
mation is contained in the first report of the evaluation phase of the
research study.1/
Extensive data were gathered on the experimental and control sub-
jects to ensure that the control and experimental subjects were adequately
matched, and to provide a baseline needed for this test of the effective-
ness of the program in attaining its goals. These data were the subject
of a report submitted to the Department of Labor in September 1973. 2/
The initial evaluation quickly disclosed that the project direc-
tors in the three states had used the flexibility that the program al-
lowed them in different ways. There were, in fact, three quite different
programs being evaluated.
The matching of experimental and control subjects was found to be
adequate, with one exception. At the request of the Department of Labor,
an American Indian subgroup was added to the Minnesota experiment. An
adequate number of American Indian control subjects was not available,
so no attempt was madc! to match the experimental and control groups in
this case.
1/Reid, J. M., "An Evaluation of Three Experimental Rural Youth Projects",prepared for the Manpower Administration, U. S. Department of Labor(1971).
2/Reid, J. M. and Miles, G. H., "An Evaluation of Three ExperimentalRural Youth Proleets: Baseline Data for Experimental and Controlcroups", prepared for the Manpower Administration, U. S. Departmentof Labor (1971).
-13-
0021

6arr1ysto1121menting this Design
The authors do not consider the evaluation that is outlined in
this report to be an adequate test of the effectiveness of the Rural
Youth Program as it was designed to be operated.
Two sets of factors combined to prtvent any meaningful evaluation
of the model program from the 1972-73 projects. First, although tenta-
tive agreement was reached in February 1971 that the experimental pro-
jects should be funded, funding was not conpleted until May 1972. The
summer program was started in June 1972. The local sponsors did not
have adequate time in which to hire and train staff, set up offices,
publicize the program, recruit enrollees and do the many other tasks
that are required in starting any-new program. It is difficult for a
new rural program to become fully operational in its first year, under
ideal conditions. Rural community leaders are generally suspicious of
federally sponsored programs. Their interest, cooperation and support
are not earned overnight.
Because of the late funding, the Summer Program was not carried
out in Minnesota, and the Summer Programs in Iowa and Nebraska were a
makeshift effort that did not include the kind of skill training and ur-
ban experience outlined in the guidelines. The In-School Program was not
fully organized and operating smoothly until after the Christmas vacation.
Also, the way in which the project was administered gave the
evaluators no control over the manner in which the program was carried
out. Ordinarily this restriction would be desirable. In this case,
however, the Flexibility of action afforded to the three project spon-
so-N led to a situation in which the intent of the program guidelines
was not reflected in the projects, especially in the Iowa project.
These problems wire recognized early in the year; a decision was
made b the Department of Labor to fund the Iowa and Minnesota projects
-15-
0022

for an additional year (1973-1974) under administrative procedures that
would ensure project' compliance to the intent of the guidelines.1/
Although it was recognized that the overall 1972-73 program was
neither the program intended by the guidelines nor a full-year program,
it was agreed that an evaluation would be carried out as planned in or-
der to determine whether the projects as carried out resulted in any
measurable benefits to the enrollees. The evaluation of the 1972-1973
experimental projects can be no more than a preliminary evaluation of the
success of the Iowa and Minnesota models. The upcoming evaluation of
the 1973-74 programs in Iowa and Minnesota must be viewed as the first
meaningful evaluation of the Rural Youth Program2/
in the Corn Belt and .
the Northern Forest regic.ls.
Although the inexperience of the Nebraska sponsoring agency and
project staff led to a number of administrative problems that influenced
program implementation, the project did follow the general intent of the
guidelines. The project showed that manpower and educational services,
can be adequately delivered to a sparsely settled region such as the
Sandhills.
North Star did not recommend that the Nebraska model project be con-tinued; however, there was sufficient local interest and support ofthe program for the Department of Labor regional office in Kansas Cityto recommend that it also be extended for a year. (Because it wasthought that sufficient information about the Nebraska model had beenobtained during the 1972-1973 program, no evaluation is being made ofthe 1973-1974 program in Nebraska.
2/The evaluation report for the 1973-1974 program year will be availablein February 1975.
-16-
oo2a

RESULTS OF THE EVALUATION
Survey Bias
The evaluation of this 1972-1973 model project is based on a ques-
tionnaire that was sent to both groups of youths (experimental and control)
in November and December 1973. This was approximately 6 months after most
of the youths had completed the senior year of high si.hool.
The data on return of the evaluation questionnaire, which are tabu-
lated in Appendix A, agree with findings reported in the literature that
the likelihood of response to a mailed questionnaire increases with edu-
cation and IQ.
To the slight extent that such a tendency exists, there is a bias
introduced in the data by the failure of lower IQ youth who did not go
into college to respond to the questionnaire. Still, enough youths in
the lower IQ groups did respond to give representation.
The pattern of response by IQ (or class quartile) and college at-
tendance is the same for both the control and experimental groups. Thus,
for analytic comparisons of these two groups, the differential response
of different IQ groups to the questionnaire introduces no bias.
0024
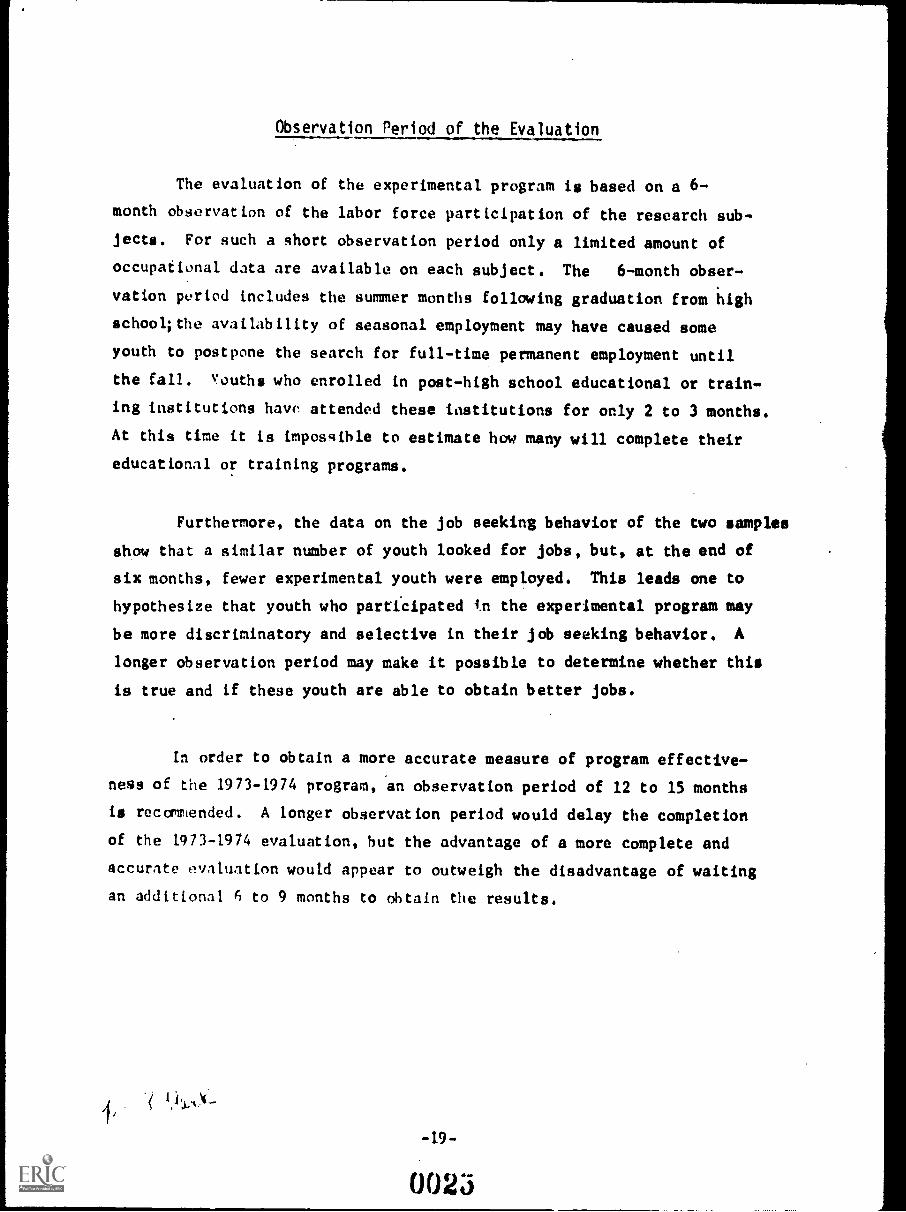
Observation Period of the Evaluation
The evaluation of the experimental program is based on a 6-
month observation of the labor force participation of the research sub-
jects. For such a short observation period only a limited amount of
occupational data are available on each subject. The 6-month obser-
vation period includes the summer months following graduation from high
school; the availability of seasonal employment may have caused some
youth to postpone the search for full-time permanent employment until
the fall. Youths who enrolled in post-high school educational or train-
ing institutions have attended these institutions for only 2 to 3 months.
At this time it is impossible to estimate how many will complete their
educational or training programs.
Furthermore, the data on the job seeking behavior of the two samples
show that a similar number of youth looked for jobs, but, at the end of
six months, fewer experimental youth were employed. This leads one to
hypothesize that youth who participated ill the experimental program may
be more discriminatory and selective in their job seeking behavior. A
longer observation period may make it possible to determine whether this
is true and if these youth are able to obtain better jobs.
In order to obtain a more accurate measure of program effective-
ness of the 1973-1974 program, an observation period of 12 to 15 months
is recommended. A longer observation period would delay the completion
of the 1973-1974 evaluation, but the advantage of a more complete and
accurate evaluation would appear to outweigh the disadvantage of waiting
an additional 6 to 9 months to obtain the results.
(
-19-
0023

Incomplete Responses to the Questionnaire
Because some respondents will not answer certain questions, the
information used for the evaluation is not complete. Of the three cat-
egories of respondents -- college, noncollege migrant and noncollege
nonmigrant -- the noncollege nonmigrant respondents provided the least
complete data.
In order to 'obtain more cc4plete information for the evaluation
of the 1973-1974 program, the questionnaire is being redesigned; the
telephone numbers of all research subjects have been obtained and, whenthey send in the coupon for their five-dollar payment for completing the
questionnaire, respondents will be asked to provide a telephone number
where they can be reached. This will make it possible for research staff
to contact respondents and to seek information that was not provided on
the respondent's questionnaire.
)
-21-
0026

The High Percentage of Youths in the Nebraska ControlSaiiirl) a wino Enral1eJinFoit cc-FoiiInstitutions
The primary purpose for including a Nebraska project was to deter-
mine whether manpower services could he successfully delivered to geo-
graphically isolated communities in the Great Plains section of the
Ninth Central states. The Nebraska experimental project showed that
this can he done,
The Nebraska experimental and control samples appeared to be well.
matched. The seeioconomic characteristics of the two areas were simi-
lar. There was no statistical difference between the two groups of re-
search subjects with respect to the individual matching variables of
sex, race and intelligence. The Saudhills, the experimental area, has
a social and cultural identity that is not found in the control area.
However, there was no reason to believe that this would have a major in-
fluence on the post-high school behavior of the research subjects. The
outmigration pattern for the experimental and control areas was similar.
Nevertheless, the significant difference between the two samples
with respect to post-high school status suggests that the two samples
are not well matched. The difference between the Nebraska control sam-
ple and the Minresota and Iowa experimental and control samples indi-
cates that snr... unaccounted for influence produced a much higher post-
high School enrollment ratio for the Nebraska control sample, one that
makes the Nebraska control sample different from the other samples
at a statistically significant level.
-23-
002 /

The Problem of of
onFinling_an
n IndAmericai Ctrol Sample
The original research study included only a small number of min-
ority youths.1/
The number was not large enough to provide reliable
data; therefore, the results of the study could not be generaliLed to
minority youths. Nevertheless, the Department of Labor requested that
the Minnescqa experimental project serve the larger Indian reserva-
tions in Minnesota. A large number of minority youths participated in
the Minnesota project. The distribution of the remaining Indian popu-
lation in Minnesota made it difficult to locate a suitable control
group. The three rural high schools with the largest number of reserva-
tion Indian youths not covered by the experimental project were added
to the control group, but because of the small number of Indians in
these schools, we were still not able to provide an adequate control
group for the Indian program participant.
A smaller proportion of American Indian than of white youth
responded to the mailed questionnaire. Because of the small number
of respondents in the control sample, a statistical analysis of the
data for the American Indian experimental and control samples is not
warranted.
1/Minority youths are less than 1 percent of the youth in the rural areasof the North Central states.
-25-
0028

In order to make it possible to evaluate the 1973-1974 Amer :can
Indian experimental sample, the following steps will be taken:
schools with American Indian Students will be added
to the control group of schools,
The mailed questionnaire will seek direct informa-
tion from the youths about their racial ancestry,
American Indian nonrespondents will be contacted
directly to ensure a high response rate.
-26-
0029

ConTarison of NYC Enrollee Respondents from the Control Smithwith Sumner Enrollee Resiondents from the Exp-DiiiiiiralSample
The number of Nebraska control respondents who were enrolled in
NYC is so small that no analysis of this group is possible. The NYC
youths in Minnesota and Iowa were matched with economically disadvantaged
youths who participated in the experimental summer program.1/
With re-
spect to the criterion measures used in this evaluation the experimental
and eouLrol subgroups of NYC enrollees and summer experimental program
enrollees do not differ at a statistically significant level. (The
data for this analysis are in Appendix J.).
41,......In order to participate in NYC, youths must be economically disadvan-taged. The NYC programs in the Iowa and Minnesota control countiesare primarily summer programs.
-27-
0030

THE ORGANIZATION OF THE EVALUATION
Each of the three model projects is evaluated separately. The
projects that were implemented by the program sponsors in each area are
described, and their special features are specified. Tne experimental
and control samples are compared for each criterion measure. When there
is a statistically significant difference between the two samples, the
difference is analysed. 'Mien there is no statistically significant dif-
ference the data for that variable are displayed in the tables in the
appendices.1/
Experimental and control respondents are placed into three groups:
yout6 who entered a post-high school educational or training institution;
youths who did not enter a post-high school institution, but migrated from
the community where they lived in 1972-1973; youths who did not migrate
from the community where they lived in 1972-1973. Tables 1 to 3 showthe proportions of research respondents who fall into these three groups.
2/
1As explained on page 7, research subjects were not assigned randomly toexperimental and control groups, Because of this some of the assumptionsof the statistical test used to compare the samples are not met. Thishas caused us to treat the X2 tests conservatively and accept only thoseresults that are significant at the p s <.001 level. However, becauseso few of the results were significant, we have included some tables inthe body of the report so that the reader can identify the number ofyouth in each of the major categories without turning to the appendices.These categories are: youth who attended a post-high school institution,migrant and nonmigrant youth who did not attend a post-high school in-stitution, youth who hunted for jobs and youth who were employed.
2/The data for the Minnesota American Indian Respondents are presentedin Appendix I.
-29-
0031
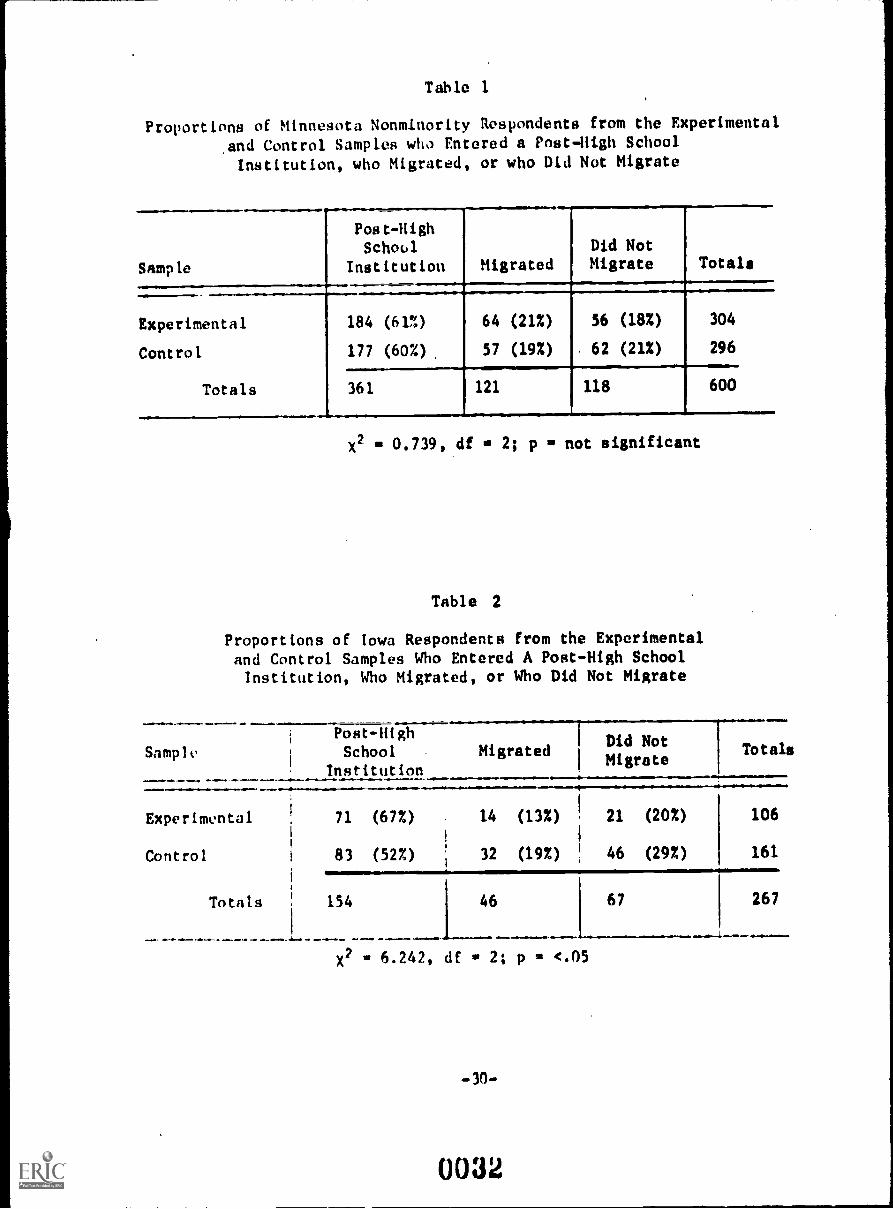
Table 1
Proportions of Minnesota Nonminority Respondents from the Experimental
and Control Samples who Entered a Post-High SchoolInstitution, who Migrated, or who Did Not Migrate
Sample
Post-HighSchool
Institution Migrated
Did NotMigrate Totals
- --
Experimental
Control
Totals
184 (61%)
177 (60%)
64 (21%)
57 (19%)
56 (18%)
62 (21%)
304
296
361 121 118 600
x2 = 0.739, df = 2; p = not significant
Table 2
Proportions of Iowa Respondents from the Experimentaland Control Samples Who Entered A Post-High SchoolInstitution, Who Migrated, or Who Did Not Migrate
Sample
Post-HighSchool Migrated
Institution
Did NotMi rateg
Totals
...11.111111.4-Experimental
Control
Totals
71 (67%) 14 (13%)
83 (52%) 32 (192)11111111
21 (202)
46 (292)
106
161
154 46 67 267
x2 * 6.242, df = 2; p = <.05
-30-
0032

Table 3
Proportions of Nebraska Respondents from the Experimentaland Control Samples Who Entered a Post-High School Institution,
Who Migrated or Who Did Not Migrate
Post-114;5-1
School MigratedDid Not
SampleMigrate
I Institution
Experimental
Control
Totals
Totals
98 (527) 46 (25%) 43 (23%) 187
108 (80%) 13 (10%) 13 (10%) 134
206 59 56 321
X2 a 26.9997, df = 2; p = <.001
-31-

EVALUATION OF THE MINNESOTA PROJECT
plplimpiyferitirliONntrroNsbR
General Features of the Minnesota Project
Area ServedandProject Administration
The Minnesota model was designed to serve the Northern Forest
region, a nonagricultural rural area where the population is distributed
in "pockets" rather than bting scattered, as in a typical farm-based
rural area. (See Map A on age 28),
The Minnesota model project included in-school and out-of-school
enrollees,1/ The program was run by the Rural Minnesota Concentrated Em-
ployment Program; the main project office was in Detroit Lakes.
Summer Program
The 1972 summer program was limited to recruiting, testing, and
counseling enrollees. Economically disadvantaged youth were placed in
work experience situations with public and private nonprofit agencies.
One hundred sixty-six youths participated in the summer program. Table
4 shows the participation rate, by sex, of students in schools where the
summer program waa offered.
Table 4
Minnesota Summer Program Participation, by Sex
I
Participant
1Nonparticipant Totals
Male 78 (27%) 208 (73%) 286
Female 88 (31%) 194 (69%) 282
Totals 166 402 568
....111. -..1. amr.n.....01* . .1/An out-of-school enrollee Is a youth who has dropped out of school.
-33-
1.24 1 Adck:t.L.
0W34

School Year Program
In its school :ear program the Minnesota project emphasized voca-
tional counseling, field trips, special program orientation, supplemental
education and training, and work experience.1/
Of those youths who attended the schools where the Rural Youth
Program was offered, a very high percentage enrolled in the program.
Tables shows the proportion of the total student body that were enrollees.
Table 5
Proportion of Participants and Nonparticipantsin Schools Where the Rural Youth Program was Offered, by Sex
Participant Nonparticipant Totals
Male 232 (81%) 54 (19%) 286
Female 264 (94%) 18 (6%) 282
Totals 496 72 568
Because the provy4m as individualized to meet the needs, interests,
and availabilit!. of e..th enrollee, not all 496 enrollees were exposed to
all the progra -,,mponent. that were offered. Each component and the pro-
portions of enrollees who took part in it are described in the following
paragraphs.
A project vocational counselor was assigned to each high school
participating in the program, and members of the local high school facul-
ties were hired to provide services to enrollees in each high school on a
part-time basis. Counselors took enrollees on field trips to colleges,
7See Appendix D for descriptions of the special program orientation andthe supplemental education and training courses.
-34-
,0035

vocational schools, and employment centers. The trips were designed to
help enrollees make career choices. All of the youth enrolled in the Minne-
sota project participated in some aspect of the project's counseling pro-
gram.
Special youth program curriculum classes were taught at the local
high schools by project instructors, who were hired and trained by the
Rural Youth ProiviL htaff. Fild ttIph dehIgned to supplement the cur-
riculum were available to youths who participated in the course. As
shown in Table '6, most of the enrollees participated in the special cur-
riculum.
Tab le 6
Proportion of Program Enrollees Who Participatedin the Special Youth Program Curriculum, by Sex
Participant Nonparticipant Totals
Male 152 (66%) 80 (24%) 232
Female 216 (82%) 48 (182) 264
Totlls 368 128 496
-35-
0036

Instructors at the local high schools were encouraged to expand
their curricula. Administrators were persuaded to make high school fa-
cilities available for aftet-school education and training classes. Pro-
ject staff worked with instructors at the local high schools, community
colleges, and vocational schools to design supplemental offerings that
would advance the program objectives and improve the current curriculum
at each school. About one-third of the youth enrolled in the project
participated in a supplemental class.
Table 7
Proportion of Enrollees Who Participatedin Supplemental Education and Training Classes, by Sex
Participant Nonparticipant Totals
Male
Female
Totals
70
91
(30%)
(34%)
-
162
173
(70%)
(66%)
232
264
161 335 496
-36-
0037

A productive work experience situation in a public or private non-
profit agency was sought for each economically disadvantaged youth. Al-
most half of the enrollees were placed in a productive work situation.
Table 8
Proportion of Enrollees Who Participated in Work Experience, by Sex
---1 Participant Nonparticipant Totals
Male 96 (41%) 136 (59%) 232
Female 125 (47%) 139 (53%) 264
Totals 221 275 496
-37-
0038

..
MAP A
Minnesota Model Youth Project
Regional Office(Bem:dji)
2 counselors
Schools
Red LakeCass LakeWalkerPark RapidsBackusMahnomenWaubunBagley
,,.
StiffDirectorCoordinatorOperations SpecialistPiaci]. Officer
SecretaryVocational Counselors (4)School Representatives (at
,et -a ism!.
I 1 I. V 1.)p.
least one per school)
, So,
P.. 11*
J.6
11
et.`doi, :
} .6,
dr.
/ :-WMA.M,VIONWIllmogam::
0 .t.. T" ..t , lo.;4,
I 4,
,......,
' "
1.. 4.a. Co.
tt, II.1
. ,
)1,) ,
0.1
it).. .. .
I, ii ..41,:1,7 14:,.
r....
.4 Do.
0: .5', a. 1.4..
°II: 4"..;efa,1\': .- "... . . . .15C., e. ,
*.
...) I / `/ii
i 11.0.4 .3 NI..
. I CAS 1 / . 4 I . tar.....,,... t f -.' . . %. It
.. I ,. . i . ' '"....i..... .
34..
. 'e :\ ' ' 1t IA -". : . . ., ' / ,,, .... ., i4 .- ....
..
A 1
i . .4
.0.4.11
1 . .1 , 1
. ' / I ..1 16, it. . .' .--)...' ,
,....,,
,..%.....\-0.-4.....".' ),I . I ... 1
1 ;NMA10044,5..47f
i,,-"MN 04 4.1
ti ,
...roe* sr° F, It , 1
Administrative Center(Detroit Lakes)
Regional Office
(Staples)
1 counselor
Schools---Staples
Motley
r. ,f
11w) imeo
..l.
. ,e
.
. e
t... ..:: : 4 i .. 1%
11, Ye `0'.I . / ". _t .., ..
A.... i : ..+ .,.,..
44.4 I . '...
I..81111 a
.1.0r,
,,S.
N.gt .: 4
I ^, \*ma. .116. WHINY.
1.
-38- p,
0039al/4
Regional Off(Crosby)
1 counselo
Schools
Crosby -iron
Pine Ri.er

Results of the Evaluation of the Minnesota Project
Preparation. of High SchoolSenioisro-r A ruill-Ilid6--ap
There was no statistically significant difference between the ex-
perimental and control samples with respect to high school graduation or
having an idea of the type of work wanted when a youth looked for a full-
time job.
A small number of respondents from the Minnesota experimental and
controt samples did not graduate. The most common reasons given for not
graduating were that the classes were boring, or that the youth was mar-
rying and needed to quit school for financial reasons.
Enrollment in A Post-High School
Respondents who were enrolled in the Minnesota Experimental pro-
ject were no more likely to enroll in a post-high school institution than
respondents from the control sample. Approximately 60 percent of the re-
spondents from both samples enrolled in a post-high school institution.
The difference between the two groups of respondents in not statistically
significant.
17-The evaluntIon of the Minnesota project does not include the AmericanIndian regpondents, See page 25 for an explanation of why an evalua-tion of the American Indian enrollees is Impossible to carry out.
0040
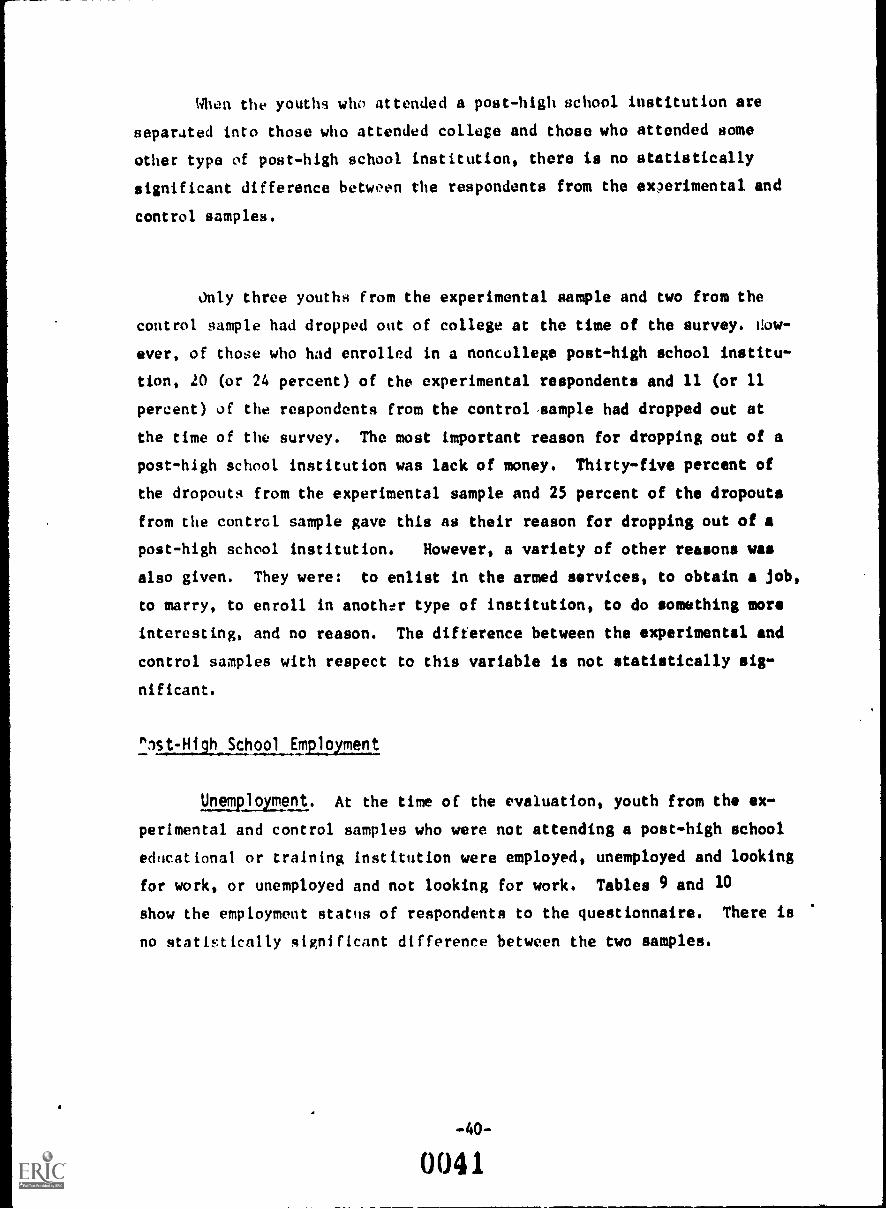
When the youths who attended a post-high school institution are
separated into those who attended college and those who attended some
other type of post-high school institution, there is no statistically
significant difference between the respondents from the experimental and
control samples.
only three youths from the experimental sample and two from the
control sample had dropped out of college at the time of the survey. eow-
ever, of those who had enrolled in a noncullege post-high school institu-
tion, 20 (or 24 percent) of the experimental respondents and 11 (or 11
percent) of the respondents from the control sample had dropped out at
the time of the survey. The most important reason for dropping out of a
post-high school institution was lack of money. Thirty-five percent of
the dropouts from the experimental sample and 25 percent of the dropouts
from the control sample gave this as their reason for dropping out of a
post-high school institution. However, a variety of other reasons was
also given. They were: to enlist in the armed services, to obtain a job,
to marry, to enroll in another type of institution, to do something more
interesting, and no reason. The difference between the experimental and
control samples with respect to this variable is not statistically sig-
nificant.
"111:111± School Employment
Unemployment. At the time of the evaluation, youth from the ex-
perimental and control samples who were not attending a post-high school
educational or training institution were employed, unemployed and looking
for work, or unemployed and not looking for work. Tables 9 and 10
show the employment status of respondents to the questionnaire. There is
no statistically significant difference between the two samples.
-40-
0041

Table 9
Employment Status of Noncollege Migrant Respondentsfrom the 'qnnesota White Experimental and Control Samples
Sample
........
EmployedUnemployed,
LookingUnemployed,Not Looking Totals
-Experimental
Control
Totals
.1.
4...w.
42
48
(66%)
(84%)
12
4
(18%)
(7%)
10
5
(16%)
(9%)
64
57
90 16 15 121
X2 = 5.681, df = 2; p = not significant
Table 10
Employment Status of Noncollege, Nonmigrant Respondentsfrom the Minnesota White Experimental and Control Samples
Sample EmployedUnemployed,Looking
Unemployed,Not Looking Totals
4.44....44.4.4-.4.4.4444r44.44.4444444....
Experimental
Control
Totals
_...... __
34 (61%)
48 (78%)
18
10
(32%)
(16%)
4
4
(7%)
(62)
56
62
+4441.4444
82
._
28
... _ _ . .
8
.. _ ..........
118
x2 4.382, df = 2; p = not significant
-41-
0042

Job HuntiniBehavior. Young people were asked to provide informa-
tion about their job hunting behaviort They were asked about the number
of weeks they had spent looking for a job, the number of Job applications
they had submitted, the number of job interviews they had obtained, the
number of job offers they had received, and whether they had had a hard
time finding work. Some youths, especially nonmigrants, from both samples
were reluctant to provide information abcut their job hunting behavior.
This situation makes it impossible to do statistical tests of these data.
Furthermore, unless they had actively looked for a job, most youth did not
provide this information. Youths who worked with or for parents, relatives,
or friends had not actuallyIunted for a job. Table 11 shows the job
hunting status of experimental and control respondents. There is no statis-
tically significant difference between the two samples.
Table 11
Proportion of Minnesota White Respondents from the Experimentaland Control Samples Who Had Hunted for a Full-Time Job
SampleHuntedFor A Job
Did Not HuntFor A Job
Totals
Experimental
Control
Totals
78
76
(65%)
(64%)
42
43
(35%)
(36%)
120
119
154 85 239
X2 0.034, df 0 1; p .1 not significant
Job Characteristics of EmployedlopthS. Experimental and control
respondents who were employed did not differ from one anot%lr at a sta-
tistically significant level with respect to the "job characteristic"
criterion measures.
-42-
oo4a
Job 'Satisfaction of Employed Youths. Experimental and control
espondents did not differ from one another at a statistically significant
level when compared for the job satisfaction criterion measure.
Social Participation Behavior
There is no statistically significant difference between the mi-
grant respondents from the two samples with respect to their knowledge
of the existence and location of recreational and essential facilities
in a new town or city.
Earlier research by North Star has shown that youthful rural mi-
grants to a new city or town tend to leave the city, on weekends. They
return to their homes in small rural communities for the weekend because
the city is foreign to them. With respect to this variable there is no
statistically significant difference between the two samples.
-43-
0044

EVALUATION OF THE IOWA PROJECTIMPIrmtylsb- W IiirlpyaThijuN"syri
General Features of the Iowa Project
Area Served and Project Administration
The Iowa model was designed to serve agricultural areas located
in the Corn Belt Region. (See Map B on rage 48)
The Iowa model project included in-school and out-of-school enrol-
lees. The program was run by the MATURA Community Action Agency; the main
project office was in Creston, Iowa.
Summer Program
The 1972 summer program included the following components: special
program curriculum, testing, counseling and selected skills training. Forty-
three economically disadvantaged youths participated in the summer program.
Table 12 shows the participation rate of students, by sex, in schools where
the summer program was offered.
Table 12
Iowa Summer Program Participation, by Sex
Male
Female
Totals
...IINIR...111--.......11101.-........01101.
Participant
18 WO25 (29%)
43 151
Nonparticipant
89 (83%)
62 (71%)
Totals
107
87
194
A"-Qad'S--,
-45-
0045

School Year Program
The school year program emphasized vocational counseling and career
exploration. Field trips to a large metropolitan area were also provided.
Of those youths who attended the schools where the Rural Youth
Program was offered, about 71 percent enrolled in the program. Table
13 shows the proportion of the total student body that were enrollees.
Table 3.3
Proportion of Participants and Nonparticipants inSchool; Where the Rural Youth Program was Offer( by Sex
Participant Nonparticipant Totals
Male 76 (71%) 31 (29%) 107
Female 62 (71%) 25 (29%) 87
Totals I 138 56 194
Because the program was individualized to meet the needs, interests,
and availability of each enrollee, not all enrollees were exposed to all
the program components that were offered. Each component and the propor-
tion of enrollees who took part in it are described in the following
paragraphs.
-46-
0046

The program equipped and operated two community centers. Equip-
ment and materials were provided for several "exploration stat ions ".
These stations contained all the materials needed for a youth to conduct
a preliminary exploration in a selected skill area, such as plumbing,
masonry, nursing, photography, etc. l/The project also persuaded some
local employers and tradesmen to provide youths with an opportunity to
observe a person practicing his skill. Most of the enrollees partici-
pated in t!Ie exploration activities.
Table 14
Proportion of Enrollees Who Participatedin Exploration Activities, by Sex
Participant Nonparticipant Totals.........
Male
Female
Totals
70
52
(92%)
(84%)
6
10
(8%)
(16%)
76
62
12/ 16 1 138
A project vocational counselor was assigned to each community cen-
ter. The Iowa project did not hire local high school faculty members to
provide services to enrollees in each high school. The edu:ation and
training-and counseling components were supplemented with frequent field
trips to educational and training institutions and to regional employment
centers. These trips were an integral part of the counseling activities.
All but 12 enrollees participated in the counseling component of the Iowa
prnino-.
See Appendix D for a complete list of the "exploration stations".
-47-
0047

MAP B
Iowa Model Youth Project
441.1s
04'*4
Administrative Center(Creston)
Staff
DirectorJob SpecialistFiscal OfficerSecretaryVocational. Counselors (2)Community Center Coordinators(2)Instructors (4)
Co .49)1 Held
ONn11v11111
WiNMO01 J., we, I
Community Center(Corning)
1 Center Coordinator
1 Counselor2 Instructors
School
Corning
IrIYA t..
CfammAMOMmolmr.,
dIPA,,,01.411
MIS
Lelia*
1:)(1,A, (
IdAPE .1r.1
0
AmovosI
....1111111410111611111014
i
00r0
Atr W MAI;:1 ,I) 1')
". j..A1 . A. litMIMI. I 11.0
-48-
Community Center(Mt.. Ayr)
1 Center Coordinato1 Counselor2 Instructors
Schools
Mt. AyrDiagonal
Kellerton

Results of the Evaluation of the Iowa Project
Preparation of High School
Seniors for 071=075Eab
There was no statistically significant difference between the ex-
perimental and control samples with respect to high school graduation
or a youth's having an idea of the type of work wanted when he/she looked
for a full-time job.
Only two respondents, both from the control sample, did not grad-
uate. One youth said that he did not graduate because the classes were
boring; one youth said he got married.
Enrollment in a Post-High School
Educational or Training_ Institution
A majority of the respondents from both samples enrolled in a
post-high school institution; 67 percent of the respondents from the ex-
perimental sample and 52 percent of the respondents from the control sam-
ple enrolled in a post-high school institution. The difference between
the two groups is not statistically significant at the desired level.
Among those who enrolled in a post-high school institution,
the respondents from both samples tended to enroll in a college rather
than a noncollege post-high school institution. The difference between
the two samples is not statistically significant at the desired level.
-49-
0049

ono female respondent from the experimental sample, and one male
and three female respondents from the control sample dropped out of
coilege. Four respondents from each sample dropped out of a noncollege
post-high school institution. The reasons given for the decision to
leave a post-high school institution were the following: not enough
money, to obtain a job, to marry, and to do something more interesting.
The difference between the experimental and control samples with respect
to this variable is not statistically significant.
Post-High School Emoloreht
Unemoloront. At the time of the evaluation, youth from the ex-
perimental and control samples who were not attending a post-high school
educational or training institution were employed, unemployed and look-
ing for work, or unemployed and not looking for work. Tables 15
and 16 show the employment status of respondents to the questionnaire.
The:e is no statistically significant difference between the two samples.
Job Hunting Behavior. Young people were asked:to provide infor-
mation about their job hunting behavior. They were asked about the
number of weeks they had spent looking for a job, the number of job appli-
cations they had submitted, the number of job intervi ws they had ob-
tained, the number of job offers they had received, and whether they had
had a hard time finding work. Some youths, especially nonmigrants,
from both samples were reluctant to provide information about their job
hunting behavior. This situation makes it impossible to do statistical
tests for these data. Furthermore, unless they had actively looked for
a job, most youth did not provide this information. Youths who worked
with or for parents, relatives, or friends had not actually hunted for
a job. Table 17 shows the job hunting status of experimental and con-
trol respondents. There is no statistically significant difference
between the two samples.
-50-
005U

Table 15
BEST COPY AVAILABLE
Employment Status of Noncollege Migrant Respondentsfrom the Iowa Experimental and Control Samples
/
Sample EmployedUnemployed,Looking
Unemployed,Not Looking Totals
.......--
Experimental
ContrIl
Totals
11 (79%)
...,..(7c.)
3
4
(21%)
(12.5t)
0
4
---..
(12.5%)
14
32
35 7 4 46
X2 0 2.276, df e 2; p e not significant
Tab le 16
Employment Status of Noncollege, Nonmigrant Respondentsfrom the Iowa Experimental and Control Samples
Sample EmployedUnemployed,
LookingUnemployed,Not Looking Totals
Experimental
Control
Totals
17
41
(81%)
(892)
2
1
(9.5%)
(2%)
2
4
(9.5%)
(9%)
21
46
58 3 6 67
X2 = 1.862, df = 2; p = not significant
-51-
0051

Table 17
Proportion of Iowa Respondents from the Experimental
and Control Samples who had Hunted for a Full-Time Job
...
Sample
HuntedFor a Job
Did not HuntFor a Job Totals
.
Experimantal
Control
Totals
_
22 (63%)
45 (58%)
13 (37%)
.33 (42%)
35
78
67 46 113
X2 u 0.267, df 1; p = not significant
Job Characteristics of Employed Youths. Experimental and control
respondents who were employed did not differ from one another at a sta-
tistically significant level with respect to the "job characteristic"
criterion measures.
Job Satisfaction of Employed Youths. Experimental and control
respondents did not differ from one another at a statistically signifi-
cant level when compared for the job satisfaction criterion measure.
Social Participation Behavior
There is no statistically significant difference between the mi-
grant respondents from the two samples with respect to their knowledge
of the existence and location of recreational and essential facilities in
a new town or city.
Earlier research by North Star has shown that youthful rural mi-
grants to a new city or town tend to leave the city on weekends. They
return to their homes in small rural communities for the weekend because
the city is foreign to them. With respect to this variable there is no
statistically significant difference between the two samples.
-52-
0052

EVALUATION OF THE NEBRASKA PROJECT
jmpumofrtbliyMK-ppm5KA:sPONSUR
Genoral Features of the Nebraska Project
Area Served and Project .Administration
The Nebraska model was designed to serve rural areas in the Great
PlAing region, 1 cparely settled region, where the population is scat-
tered. (See Map C on page 57.) Few community services are available to
those people, and outmigration of young people is heavy.
The Nebraska model project included only in-school enrollees. The
program was run by the Grand Island Diocesan Department of Education; the
main office was in Grand Island.
Summer Program
The 1972 summer program emphasized the following components: spe-
cial proram orientation, testing, selected skill training, and a fieldtrip to a large metropolitan area.
Only a few youths were economically disadvantaged; youths who werenot economically disadvantaged participated on a part-time basis. Evening
sessions were scheduled to make it possible for working youths to attend.
Almost 50 percent of the enrollees participated in the summer program.
Table 18 shows the participation rate of students by sex, in schools
where the summer program was offered.
-5 3-
0053

Table 18
Nebraska Summer Program Participation, by Sex
Participant Nonparticipant Totals
Male
Female
Totals
55
67
(43%)
(47%)
74
76
(57%)
(53%)
129
143
122 150 272
School Year Program
The school year program emphasized vocational counseling, post-
high school educational and vocational courses, and individualized train-
ing.
Of those youths who attended the schools where the Rural Youth
Program was offered, a very high percentage er:olled in the program.
Table 19 shows the proportion of the total student body, by sex, that
were enrollees.
Table 19
Proportion of Participants and of Nonparticipantsin Schools Where the Rural Youth Program was Offered, by Sex
-------_----Participant Nonparticipant Totals
Mile
Female
-----
Totals
120
135
(93%)
(94%)
9
8
(7%)
(6%)
129
143
255 17 272
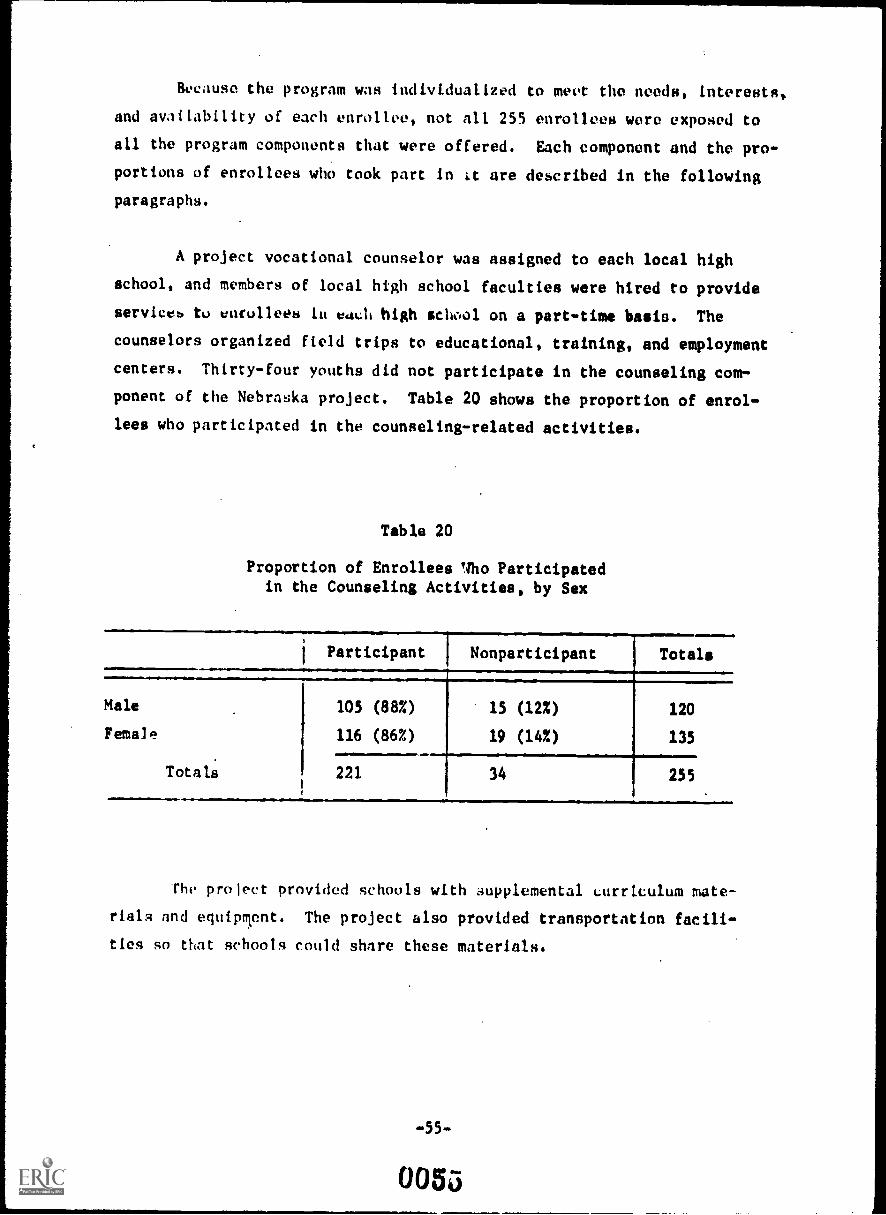
Because the program was individualized to meet the needs, interests*
and availability of each enrollee, not all 255 enrollees were exposed to
all the program components that were offered. Each component and the pro-
portions of enrollees who took part in it are described in the following
paragraphs.
A project vocational counselor was assigned to each local high
school, and members of local high school faculties were hired to provide
services to enrollees lu each high school on a part-time basis. The
counselors organized field trips to educational, training, and employment
centers. Thirty-four youths did not participate in the counseling com-
ponent of the Nebraska project. Table 20 shows the proportion of enrol-
lees who participated in the counseling-related activities.
Table 20
Proportion of Enrollees Tio Participatedin the Counseling Activities, by Sex
Participant Nonparticipant
41111.
Totals
Male 105 (88%) 15 (12%) 120
Female 116 (862) 19 (14%) 135
Totals 221 34 255
The proleet provided schools with supplemental curriculum mate-
rials and equiplent. The project also provided transportation facili-
ties so that schools could share these materials.
-55-
0053

Because distance was a major factor, the education and training
components were most effectively provided through group transportation
to a training center, and by equippinpip trailer to bring certain train-
ing classes to the local communities. Local craftsmen and tradesmen
were alio hired to provide training on an individual and small-group
basis. Over 60 percent of the enrollees participated in the supple-
mental offerings.
Table21
Proportion of Enrollees Who Participatedin Education and Training Activities, by Sex
-.
Participant Nonparticipant Totals
..
.
Male
Female
.
Totals
92
72
(77%)
(53%)
28
63
.
(23%)
(47%)
120
135
164
.
.
91
.
255
1/See Appendix D for a complete list of the educational and vocational
courses offered to enrollees.
-56-
0056

MAP C
Nebraska Model Youth.Project
Stafflop
DirectorCoordinatorFiscal OfficerSecretaryJob Sepcialist
Vocational Counselor (2)School Representatives (1 per school)
Regional Office(Broken Bow)1 counselor
Schools
Broken BowSargentThedford
Anselmo-MersaSandhillsTaylor
A ministrative Center
(Grand Island)
NOM '5444h1 11&Num
(1)
4, ................................. ......... . .....'4
am I
71.46'..."....6.0"."'r Wet
1111451 too
M. ota1f#0 4141,141
Regional Office(North Platte)1 counselor
Schools
HyannisArthurMullenArnoldStapletonTryon
0 i 79414444.4/4414 t 4 . 4 4
N.A."
arwoluteat,
nn
4::j(4#: y3
-.
Joh.,
44,46,04, 44,1. or .10060.
Iffattlwo.la.4#0414441
101.4.
1,11..4 .1..6.14................-..
0.14# r,.II Oa
J.,Po I
1 ((IR top I Of. 6140/a
'.#
1+ tea OM0. 4,1 #4, 11
q4
B #1.1170 4 lothetr!.0-t,
10,141
ftrtoo
1st. sett/babas AI
1004411 0.0 1
%atom.tatlas
SIst1 rtt., ;pa
11?1,14)
,00.4444'IN.,. ao
r
4, 4 rg
. 0.11 t ti111.0 v,,,
4 if a ft
#- ."V.14 II
I t
/Nita'
60444Itt41840it 1 ta
,411 i..41r_
K I. /11'4
5.. 1411 Po,
Q3)
kkel es nryIunti
r. .1 ta) t t 04, .111
.* :.. ..1.....s.i
1 iL ..irtfr'4. ., " I ' 'f'''ait:. .a -n slda . a
II,,, ,
etnnd I I n
;/fir .pat; /yes,011'
It
C. 1-101
Os p,.
I ' o. a 10. . ,,,, , a 51.51.4
a , ... ! . "a '''4' 1 jil,,,inimmioar. .4It, ritiI t...'. ' ! I -. .' o
1
!.. . /if , ' 4 r ........1111tCoull [I') 110.1514to007 . "'-' '
$1. a....
.aw tut a r11,4.4. Pa.
I al , ...0..orimd 1./.1.".. ,.., 4
1 4....b.".
.r.-.- .:.. if :;...-4:.* -; ''.'
'1 ova,
'A
*
u ,
A1.411
(o111414:#.
411110Wort 1 . ---
Vat pa
1
a .. 11 1 i, , I111111411141144111414411411=4,.,1 ...ie..%
114
woo t. ,',/,..,.. fs4 , ii, - .1,' I
.. a a du. AO 0444 . 1.... I a . ...... ......
11: ..elf

Results of the Evaluation of the Nebraska Project
Preparation of High SchoolSeniors for a Full-time Job
There was no statistically significant difference between the ex.,
perimental and control samples with respect to high school graduation
or a youth's having an idea of the type of work wanted when he/she looked
fee a full-time job.
Only three respondents, one from the control sample and two from
the experimental sample, did not graduate. The reason given for not
graduating was that the youths married.
Enrollment in a Post-High Schooleducational or Training Institution
The difference between the respondents from the control sample and
the respondents from the experimental sample with respect to the educa-
tional status variable is statistically significant (x2 26.983, df 1;
p <.001). The socioeconomic data tht were used to match these two
groups may not adequately reflect the characteristics of the local commun-
ities that tend to influence the enrollment of Great Plains youths in a
post-high school.institution. On the other hand, the control area commun
ities also differs from the Iowa control and Minnesota experimental and
control area communities at a statistically significant level. There may
be special, unidentified factors in the Nebraska control area that account
for the unusually large proportion of youths who enroll in a post -high
school. instittlIn. Tables 22 to 26 compare the proportion of Nebraska con-
trol respondents who enrolled in a post-high school institution with the
proportion from each of the other samples.
59
-59-
0058
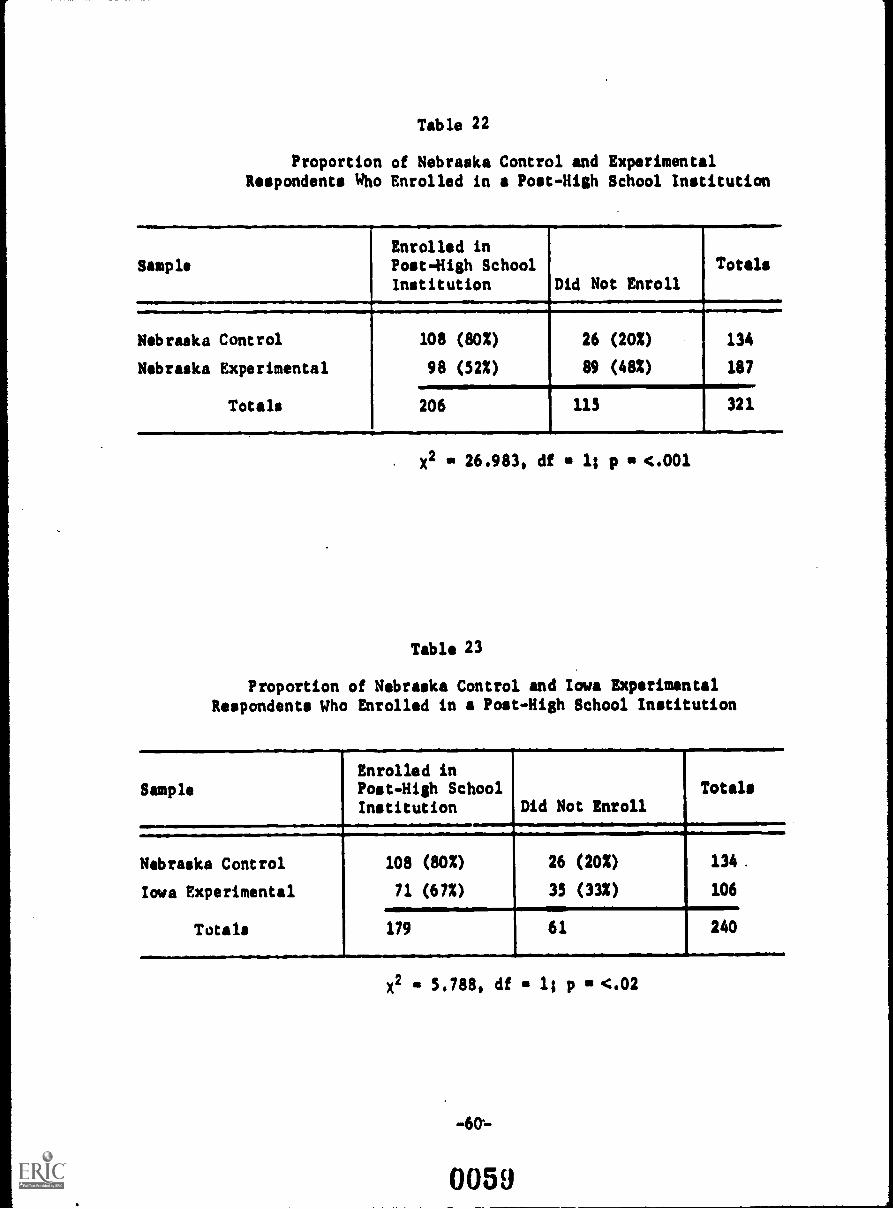
Table 22
Proportion of Nebraska Control and ExperimentalRespondents Who Enrolled in a Post-High School Institution
Sample
Enrolled inPost-High SchoolInstitution Did Not Enroll
Totals
,
Nebraska Control
Nebraska Experimental
Totals
108 (80%)
98 (52%)
26 (202)
89 (48%)
134
187
206 115 321
X2 26.983, df 1; p <.001
Table 23
Proportion of Nebraska Control and Iowa ExperimentalRespondents Who Enrolled in a Post-High School Institution
Sample
Enrolled inPost-High SchoolInstitution
eDid Not Enroll
Totals
. .;
Nebraska Control
Iowa Experimental
Totals
108 (80%)
71 (67%)
26 (202)
35 (33X)
134.
106
179 61
a
240
X2 a 5.788, df 1; p 11,4.02
0059

Table 24
Proportion of Nebraska Control and Iowa ControlRespondents Who Enrolled in a Post-High School Institution
SampleEnrolled inPost-High SchoolInstitution Did Not Enroll
Totals
....._
.
Nebraska Control
Iowa Control
Totals
108 (80%)
83 (52%)
.
26 (20%)
78 (48%) .
134
161
191 104 295
X2 27.027, df 1; p <.001
Table 25
Proportion of Nebraska Control and Minnesota ExperimentalRespondents Who Enrolled in a Post-High School Institution
SampleEnrolled inPost-High SchoolInstitution
.
Did Not EnrollTotals
Nebraska Control
Minnesota
ExperimentalTotalm
108 (80%)
184 (61%)
26 (20%)
120 (39%)
134
304
292 146 438
X2 - 16.859, df - 1; p <.001
41-
0060

Table 26
Proportion of Nebraska Control and Minnesota ControlRespondents Who Enrolled in a Post-High School Institution
Sample
Enrolled inPost High-School
Institution Did Not Enroll
Totals
Nebraska Control
MinnesotaExperimental
Totals
108 (80*
177 (602)
26 (20%)
117 (402)
134
296
285
.
145
4
430
X2 17.855, df a 1; p <.001
-62-
0061

BEST COPY AVAILABLE
Among those who did enroll in a post -high school institution, 66
percent of the respondents from the experimental sample and 74 percent
of the respondents from the control sample enrolled in a college. The
difference between the two samples with respect to the type of institu-
tion enrolled in is not statistically significant.
One male from the experimental sample and one male and one female
from the control sample had dropped out of college at the time of the
sumo>. Fiv feleite,; from Cub experimental sample and one male and two
females from the control sample had dropped out of a noncollege post-high
school institution. The reasons given for this decision were the follow-ing: to seek a job, to marry, to do something more interesting, and no
reason. The difference between the experimental and control samples with
respect to this variable is not statistically significant.
Post-High School Employment
Unemployment. At the time of the evaluation, youth from the ex-
perimental and control samples who were not attending a post-high school
educational or training institution were employed, unemployed and look-
ing for work, or unemployed and not looking for work. Tables 27 and 28
show the employment status of respondents to the questionnaire. There
is no statistically significant difference between the two samples.
-63-
0062

Table 27
Employment Status of Noncollege Migrant Respondentsfrom the Nebraska Experimental and Control Samples
Sample
.
EmployedUnemployed,
LookingUnemployed,Not Looking
,
Totals
Experimental
Control
Totals
34
11
(74%)
(85%)
,
3
0
.
(7%) 9
2
(192)
(15%)
46
13.
45 3
.
11 59
X2 1.095, df = 2; p = not significant
Table 28
Employment Status of Noncollege, Nonmigrant Respondentsfrom the Nebraska Experimental and Control Samples
Sample EmployedUnemployed,
LookingUnemployed,Not Looking Totals
.,
Experimental
Control
Totals
30
13
(70%)
(100%)
4 (9%)
0
9
0
(21%) 43
13
43 4 9 56
X2 = 5.118, df so 2; p = not significant
-64-
0063

Job Hunting Behavior. Young people were asked to provide infor-
mation about their job hunting behavior. They were asked about the num-
ber of weeks they had spent looking for a job, the number of job appli-
cations they had submitted, the number of job interviews they had ob-
tained, the number of jot offers they had received, and whether they had
had a hard time finding work. Some youths, especially nonmigrants, from
both samples were reluctant to provide information about their job hunt-
ing heha..,ior. This ,;ttuation mikcs it impossible to do statistical tests
for these data. Furthermore, unless they had actively looked for a job,
most youth did not provide this information. Youths who worked with or
for parents, rel.tives or friends had not actually hunted for a job.
Table 29 shows the job hunting status of experimental and control respon-
dents. There is no statistically significant difference between the two
samples.
Table 29
Proportion of Nebraska Respondents from the Experimentaland Control Samples Who had Hunted for a Full-time Job
SampleHuntedFor a Job
Did not HuntFor a Job Totals
Experimental
Control
Totals
41 (46%)
12 (46%)
48 (54%)
14 (54%)
89
26
53 62 115
2 0X = 0.000, df = 1; p la not significant
IisticsoLlaiabChareCtet111011r.!Youths. Experimental and control
respondents who were employed did not differ from one another at a sta-
tistically significant level with respect to the "job characteristic"
criterion measures.
-65-
0064

Job Satisfacti)n of Employed Youths. Experimental and control
respondents did not differ from one another at a statistically significant
level when compared for the job satisfaction criterion measure.
Social Participation Behavior
There is no statistically significant difference between the mi-
grant respondents from the two samples with respect to their knowledge of
the existence and location of recreational and essential facilities in
a new ~own or city.
Earlier research by North Star has shown that youthful rural migrants
to a new city or town tend to leave the city on weekends. They return to
their homes in small rural communities for the weekend because the city is
foreign to them. With respect to this variable there is no statistically
significant difference between the two samples.
-66-
0065

APPENDIX A
DATA ON RETURN OF THE
EVALUATION QUESTIONNAIRE
0066

Table A-1
Proportion of Iowa and Nebraska Respondents andNonrespondents to Mailed Questionnaire by IQ Score
IQ Score
Totals<110 110 or Creator
Respondents
Nonrespondents
Totals
303 (44%)
170 (74%)
263 (56%)
61 (262)
566
231
473 324 797
X2 27.360, df 1; p 4.001
Table A-2
Proportion of Minnesota Respondents andNonrespondents to Mailed Questionnaire by Class Rank
Class Rank Percentile
TotalsLower 50 Percent Upper 50 Percent
Respondents 235 (40%) 348 (60%) 583
Nonrespondents 101 (62%) 61 (38%) 162
Totals 336 409 745=rftX2 24.864, df - 1; p - <.001
- A-1 -
0067

Tab le A-3
Proportion of Iowa and Nebraska Experimental and ControlNonrespondents to Mailed Questionnaire by IQ Score
Sample
.IQ Score
Totals<110 110 or Greater
Experimental 64 (70%) 28 (30%) 92
Control 106 (76%) 33 (24%) 139
Totals 170 61 231
X2 1.276, df 0 1; p = not significant
Table A-4
Proportion of Minnesota Experimental and ControlNonrespondents to Mailed Questionnaire by Class Rank
Sample
Class Rank Percentile
TotalsLower 50 Percent Upper 50 Percent
Experimental 48 (65%) 26 (3! .) 74
Control 53 (60%) 35 (46t) 88
Totals 101 61 162
zof
X2 0.368, df 1; p 0 not significant
A-2 -
0068

Table A-5
Proportion of Respondents and Nonreapondents to
Mailed Questionnaire by Research Sample'
Sample
Experimental Control
Respondents 579 (50%) 570 (50%)
Nonrespondents 186 (47%) 227 (53%)
Totals 745 797,
Totals
1
1149
393
1542
X2 3.487, df 1; p not significant
- A-3 -
0069

APPENDIX 8
CHARACTERISTICS OF THE RESPONDENTS
FROM THE EXPERIMENTAL AND CONTROL SAMPLES
0070

Characteristic! if Experimental andContrai-SamieThespondents
Sex
The male/female ratio of the experimental and control sample re-
spondents was not significartly different, as is shown in TablesB-1
through 11-4. Although the control and experimental samples for the
Minnesota Indian project were not well matched with respect to sex,
they also showed no significant differences (see page 25).
Table 11-1
Sex of Respondents from the MinnesotaWhite Experimental and Control Samples
Sample Male 1 Female Totals
Experimental
Control
Totals
132
138
(43%)
(47%)
172
158
(57%)
(53%)
304
296
270 330 600
X2 m 0.621, df 1; not significant
Table 11-2
Sex of Respondents from the MinnesotaIndian Experimental and Control Samples
----------.Sample Male
--......--------Female Totals
32
6
---.Experimental
Control
_----._Totals
..._.....
18
4
(36%)
(40%)
(64%)
(60%)
50
10
22 38 60
X2 0.014, df 1; not Significant
0071

Table 8-3
Sox of Respondents from the IowaExperimental and Control Samples
Sample Male Female Totals,
txperimental
Control
Totals
55
84
(522)
(52%)
51
77
(482)
(48%)
106
161
139 128 267
0.002, df 1; not significant
Table 8-4
Sex of Respondents from the NebraskaExperimental and Control Samples
Sample Male Female Totals
Werimental
Control
Totals
82
63
(442)
(472)
105
71
(56%)
(532)
187
134
145
.
176 321
XS 0.316, df 1; not significant
- 3-2 -
0072

Intellipence
An intelligence measure was used to match the experimental and
control subjects?'/
(Class rank was used in Minnesota; IQ score, in Iowa
and Nebraska.) The composition of the six groups of nonminority respon'
dents is shown in Tables 11-5 through 8-13. Table 8-5 shows the total
Minnesota project; Table 8-6, the Iowa project; and Table 8-7, the
Nebraska project. The x2 tests do not reject the hypothesis that this
experimental and control respondents are from the Immo population (i.e.,
the groups appear to have similar distributions with respect to intelli-
gence scores). The x2 teats for the experimental and control subsamplei
of youth who attended college2/
and youth who did not attend college h1-
so do noc reject the hypothesis that the subsamples are from the same
population.
Table 8-5
Proportion of Respondents for the Minnesota WhiteExperimental and Control Samples by Class Rank Quartile
SatpleClass Rank
1 2 3 4 Totals
Experimental
Control
Totals
=rmarommorarlIME.41...11.alye....aolorloy......
94
89
(31%) 88.
(30%) 84
(29%)
(28%)
67
62
(22%)
(21%)
55
61
(18%)
(21%)
304
296
183 172 129 116
11=1.1.1...111
600
x2 0.627, df 3; p a not significant
Rd Joseph M. and Miles, Cuy H., "An Evaluation of Three ExperimentalRural Youth Projects: Baseline Data for Experimental and Control Croups",pp. 20-26.
2/"Collf.ge" refers to all types of post -high school education or training.
- B-3 -
0073

Table 8-6
Proportion of Respondents From the IowaExperimental and Control Samples,by IQ Quartile
Sample
IQ Score
>129 110-129 I 90-109 490
Experimental
Control
Totals
5
8
(52)
(82)
38
68
(362)
(42%)
53
71
(502)
(442)
10
14
13 106 124 24
Totals
192) 106
(9%) 161
267
R2 1.183, df s 3; p not significant
. Table 1-7
Proportion of Respondents from the NebraskaExperimental and Control Sample; by IQ Quartile
Sample
IQ Score
'129
.110-129 90-109 . c90 Totals
Experimental
Control
Totals
11
6
(62)
(42)
79
58
(422)
(432)
92
67
(492)
(502)
5
3
(32)
(22) 134
17 137 159 321
X2 a 0.380, df = 3; p = not significant
-8-4-
0074

Table B-8
BEST COPY /MANI
Proportion of Respondents from the Minnesota WhiteExperimental and Control Samples Who Entered A Post-HighSchool Educational Institutioneby Class RApnk Quartile
SampleClass Rank
1 I 2 i 3 4 Totals
Experimental
Control
Totals
81 (44X)
68 (38%)
52 (28%) 33 (18%)
56 (322) I 33 (192)
18 .(102) 184
20 (112) 177
149 108 66 38 361.
X2 1.058, df 3; p not significant
Table 11-9
Proportion of Respondents from the Minnesota WhiteExperimental and Control Samples Who Did Not Enter
A Post-High School Educational institution, by Class Rank Quartile
SampleClass Rank
1 I 2 3 4
MMIINIMIMMIMhm=...+.D-WIN.....=1.01N.IMi
Experimental 13 (11%) 36 (30X)
Control 21 (18%) 1 28 (24%)
Totals 34 64
34 (28%) 37 (31%)
29 (24%) 41 (34%)
I 63 78
-
Totals
120
119
239
X2 " 3.68, df 3; p * not significant
00Th

Table B-10
Proportion of Respondents from the Iowa Experimentaland Control Samples Who Entered A Post-High School
Educational Institutionlby IQ Quartile
Sample 10110 IQ4110 Totals
Experimental
Control
Totals
35
48
(49%)
(58X)
36
34
(51X)
(421)
71
83
83
.. .
71
.
154
1.122, df 1; p not significant
Table 8-11
Proportion of Respondents from the Iowa Experimentaland Control Samples Who Did Not Enter A Post-High
School Educational Institutioniby IQ Quartile
Sample ' IQ)110 . IQ4110 Total;
Experimental 8 (23%) 27 (77X) 35
Control 28 (36%) 50 (642) 78
""i"'","`"a"'i'''''""°""1"°'-'-`''''''''''"-'.
Totals 36 77 113
-------..------ ,
X2 mi 1.892, df 1; p not significant
0076

Tab1i B-12
Proportion of Respondents from the.NebraskaExperimehtal and Control Samples Who Entered
Post-High School Educational Inatitutioq by IQ Quartile
Sample IQ>110 IQ<110I
Total
Experimental
Control
Totals
58
54
(59%)
(50%)
40
54
(412)
(50%)
98
108
112 94 - 206
40°X2 1.747, df 1; p not significant
Table B-13
Proportion of Respondents from the NebraskaExperimental and Control Samples Who Did Not Enter
A Post-High School Educational Institution, by IQ Quartile
Sample IQ>110 /Q<110 Totals
Experimental 32 (36%) I 57 (642) 89
Control 10 (38%) 16 (622) 26
Total 42 73 115
1
X2 0.055, df = 1; p m not significant
9-7 -
007i

The Minnesota experimental and control samples included a small
number of youths for whom there was no available measure of class rank.
They were included in the study because it was assumed that they were
youths who had failed to complete the coursework for their senior year,
and that they most likely would have fallen into the fourth quartile.
Thus, "class rank data not available (NA)" would have been a meaningful
category for matching purposes.
The data obtained from the respondents do not support the original
assumption. Several of the "NA" youths did continue their education and
training at a post-secondary institution. Therefore, the assumed reason
for the missing data does not appear to have been correct. Because it
cannot be assumed that the "NA" respondents would have fallen into the
fourth quartile, they are not included in the evaluation. Table 8 -14
shows the post-high school status of the "NA" youths who responded to the
questionnaire.
Table 1-14
Post-High School Status of Minnesota WhiteExperimental and Control Sample Respondent',For Whom There Was No Intelligence Measure',
Sample College Noncollege Totals
Experimental
Contrc'
Totals
3
3
(252)
(60%)
9
2
(75%)
OOP
12
5
6 11 . 17
X m 0.671, df 0 1; p a not significant
Two of the three "NA" youths in Iowa responded to the questionnaire;
they were both in college. In Nebraska, two of the seven "NA" youths re-
sponded; neither was in college.
1/There were 17 "NA" youths in the experimental sample and 10 "NA" youthsin the control simple.
- B-8 -
0078

Faintly Income
Two types of family income information were available to North
Star research staff: 1) the research respondents supplied family in-
come data; 2Y the rural youth projects in the experimental areas and
NYC projects in the control areas also provided data about the family
income of youths enrolled in their programs. However, there are prob-
lems with the information that was obtained. Many youths lack suffi-
ciently detailed information to provide complete economic date for their
families. Youth project staff are able to obtain more complete, ac-
curate data directly from the parents; but many rural families are too
proud to admit that they are economically disadvantaged, and project
staff do not seek this information unless a youth enrolls in a youth
program. Furthermore, in rural areas the types of jobs that are avail-
able through the youth programs are more likely to appeal to females
than to males (secretarial, clerical, nurses aides, etc.). Because of
this, females are recruited more often than males, who either are able
to find'better paying jobs or are not interested in the types of jobs
available through a youth program. As a result, more females than males
have some knowledge about the yearly income of their families. For
matching purposes, the information obtained'from the youths is a better
estimate of family income.
Our data clearly indicate that, when the respondents were asked to
divulge their family income, a larger proportion of females than males said
they come from poor families. It appears obvious that poor families are no
more likely to have a larger proportion of female children than rich fami-
lies, and that an approximately equal number of males and females should in-
dicate that they come from poor families.
Two explanations of our data are pussible. The First is that males
from poor families are more reluctant than females from poor families to
respond to questionnaires, and that our sample of respondents does contain
more poor females than poor males. The second possibility is that equal
numbers of poor males and poor females responded to the questionnaire, but
that the male respondents were less willing than the female respondents to
provide Information about family income that could be used to show that they
are poor. Tables 8 -15 through R-17 show the data grouped according to the
information received from questionnaires.
- 8-9 -
007a

Table B-15
Proportion of Minnesota White Respondentsfrom the Experimental and Control Samples
Who Are from Economically Disadvantaged Families
Sample Poor Not Poor Totals
Experimentalmale 34 (26%) 98 (742) 132
female 45 (26%) 127 (74%) 172
Totals 79 (26%) 225 (742) 304
Controlmale 35 (25%) 103 (75%) 138
female 60 (382) 98 (62%) 158
Totals 95 (322) 201 (68%) 296
Totals 174 426 SOO
Male x2 = 0.005, df 1; p not significant
Female x2 5.296, df 1; p (.025
Total - x2 2.717, df 1; p not significant
Table 8-16
Proportion of Iowa Respondents from theExperimental and Control Samples Who Arefrom Economically Disadvantaged Familes
Sample Poor Not Poor Totals
.- 4
Experimentalmale 8 (12%) 47 (88%) 55
female 18 (35%) 33 (65%) 51
Totals 26 (25%) 80 (75%) 106
Control9 (11%) 75 (89%) 84male
female 15 (191K) 62 (81%) _11.
Totals 24 (15%) 137 (852) 161
. ----
Totals 50 217 267
We x2 - 0.454, df 1; p not significant
Female . x2 4.nn1. df 1; p '.05
Total e - 3.887, df 1; p w (.05

Table B-17
Proportion of Nebraska Respondents fromthe Experimental and Control Samples Who
Are from Economically Disadvantaged Families
SampleI
TPoor Not Poor Totals
Experimentalmale 5 (6%) 77 (94%) .82female 11 (102) 94 (90%) 105
Totals 16 (9%) 171 (91%) 187
Control
2 (3%) 61 (97%) 63malefemale 12 (17%) 59 (83%) 71
Totals 14 (10%) 120 (90%) 134
Totals 30 291 321
Male = x2 = 0.179, df = 1; p = not significantFemale = x2 = 1.539, df = 1; p = not significantTotal = x2 * 0.329, df = 1; p = not significant
- 8-11 -
0081
APPENDIX C
CHARACTERISTICS OF THE EXPERIMENTAL
AND CONTROL COMMUNITIES
0082

The Experimental and Control Communities
Nebraska -- The Great Plains
BEST COPY AVAILABLE
Experimental Area
Control Area
Scale in Miles:
0 200 200
[
The Geographic Area to be Covered. The Nebraska project serves an
area of 6900 square miles of sparsely settled Nebraska Sandhills prairie.
In the entire area, only four towns -- Sargent, (population 789), Arnold
(population 752), Broken Bow (population 3734) and Mullen (population 667)
.have popaations. of over500.E ,044mejocetegi JA.Cpstva .... ...... .... .. .414 ow.* a.... . 4 I . 41 4 4
County. In the part of Custer County that is covered by this project there
are 7.1 people per square mile; the remaining 8 counties covered by the pro-
ject have only 1.2 people per square mile. In the four control counties
there are also four towns with over 500 population: Imperial (population
11). Wirmett (i) 718), genkelman (populatien 1149) and Grant
(population 1099). In thera four counties there are 3.5 people per square
mile.
- C-1 -
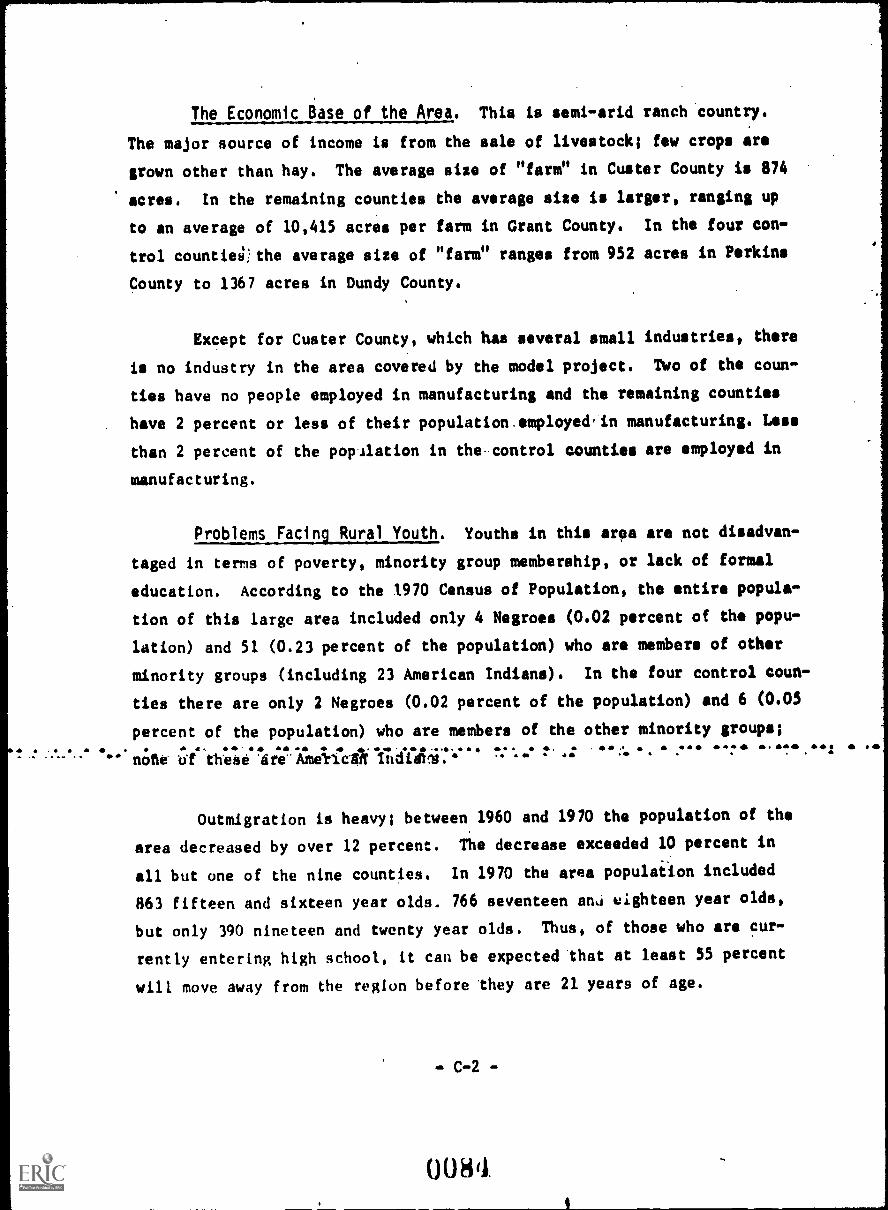
The Economic Base of the Area. This is semi-arid ranch country.
The major source of income is from the sale of livestock; few crops are
grown other than hay. The average size of "farm" in Custer County is 874
acres. In the remaining counties the average size is larger, ranging up
to an average of 10,415 acres per farm in Grant County. In the four con-
trol countiefithe average size of "farm" ranges from 952 acres in Perkins
County to 1367 acres in Dundy County.
Except for Custer County, which has several small industries, there
is no industry in the area covered by the model project. Two of the coun-
ties have no people employed in manufacturing and the remaining counties
have 2 percent or less of their population.omployed'in manufacturing. Less
than 2 percent of the population in thecontrol counties are employed in
manufacturing.
Problems Facing Rural Youth. Youths in this area are not disadvan-
taged in terms of poverty, minority group membership, or lack of formal
education. According to the 1970 Census of Population, the entire popula-
tion of this large area included only 4 Negroes (0.02 percent of the popu-
lation) and 51 (0.23 percent of the population) who are members of other
minority groups (including 23 American Indians). In the four control coun-
ties there are only 2 Negroes (0.02 percent of the population) and 6 (0.05
percent of the population) who are members of the other minority groups;
.t - - . . . b . 4. SO 0. *4
' none these 'are" Aneliciffi Indidtrs. 1
Outmigration is heavy; between 1960 and 1970 the population of the
area decreased by over 12 percent. The decrease exceeded 10 percent in
all but one of the nine counties. In 1970 the area population included
863 fifteen and sixteen year olds. 766 seventeen an.; eighteen year olds,
but only 390 nineteen and twenty year olds. Thus, of those who are cur-
rently entering high school, it can be expected that at least 55 percent
will move away from the region before they are 21 years of age.
-C-2-

.1
The four control counties also lost over 12 percent of their popu-
lations between 1960 and 1970; 3 of these counties lost over 10 percent --
of these 3 one lost over 20 percent. In 1970 the population included 491
fifteen and sixteen year olds, 40 seventeen and eighteen year olds and
179 nineteen and twenty year'olds. Thus we can expect that 63 percent of
those who are entering high school now will move away from these counties
before they are 21 years old.
rhe experimental area is not now served by NYC; the control area
is served by a multi-county NYC program but there are only six enrollees
in the four control counties. Several school officials who were inter-
viewed were very skeptical that anyone would actually do anything for their
area. They cited repeated instances in which surveys were taken but programs
were not instituted, usually on the basis that services could not be delivered
to a sparsely settled region such as this.
Iowa -- The Corn Belt
a*,
N. %.4.- k -f - --
211ksj I %. .
t -
- ' ass.. a.
allo 74 N '1/41._
r"..1 ."Tiafa" .
go, Do oslow
:I - 4 1146.4, -
Die 4., I 1..4,4, 4 ..1.11 I... 4 ./ ?,
BEST COPY AVAILABLE
Experimental Area
Control Area
""
C-3 -
WPC
I* #00.6
Scale in Miles:
0 100 200
.1.

The Geographic Area Covered. This project covers thy.* counties
in the Southern part of Iowa near the Missouri border. These counties
are situated in the Corn Belt, but the rolling hills of the area make the
land somewhat less productive than the richer soil further north. ?here
are no towns of over 2500 population in these counties. The largest towns
are Lenox (population 1215), Corning (population 2095), Bedford (population
1733), and Mount Ayr (population 1762). This three control counties are
adjacent to the three experimental counties and certain two towns of over
2500 population -- Osceola (3124 population) and Lemon/ (population 2540).
There are two others with populations over 1000 -- Leon (population 2142)
and Corydon (population 1745).
The three experimental counties cover an area of 1492 square miles
and have a population' density of 14.4 people per square mile. The three
control counties contain a land area of 1491 square miles; the population
density is 17.3 people per square mile.
The Economic Base of the Area. Over 95 percent of all the land in
the three experimental counties is in farms. Over 3100 farms are in oper-
ation and average about 290 acres each. The sale of livestock provides th1
major portion of farm income. Most of the crops that are grown are used
to feed'hogs and cattle. In the three control counties over 89 percent
of the land is farmed; in 1970 there were 2986 farms that averaged about0 41. * - 4: :1 *i 6
Earn.
Only about 2.7 percent of the population is employed in manufactur-
ing in the experimental counties and 3.4 percent in the control counties.
The small amount of industry that does exist is mainly concerned with
agricultural products and their processing.
Problems Facing Rural Youth. These six counties have among the
lowest median family incomes in Iowa; only 11 other counties of the 99
Iowa counties have median family incomes as low.
- C -4

This is a heavy.outmigration region. Between 1960 and 1970 the
peOulation of Taylor County decreased by 14.6 percent; Adams County by
15.3 percent; and Ringgold County by 19.4 percent. Among the control
counties, Clarke County lost 7.8 percent of its population between 1960
and 1970; Decatur County decreased by 7.6 percent; and Wayne County lust
14.2 percent. Our previous studies have show that a large proportion
of the youth from this part of Iowa leave their home communities and
move to a city. Yet, what little vocational education is offered in the
Schools tends to be weighted toward vocational agriculture. Only one
high school offers a broad range of vocational subjects.
Minnesota -- The Northern Forest
epy
. .
t 0*O.
..... . 1 .r.. .. ..............__
_
1,......... ,:::-. .... .
C:.....4.4 ; r --;,,,
ooo
!. ...G...--r-- r-- t-
o
Experimental Area
Control Area
c-5
.
Scale of Miles;
0 100 200V±. awn1
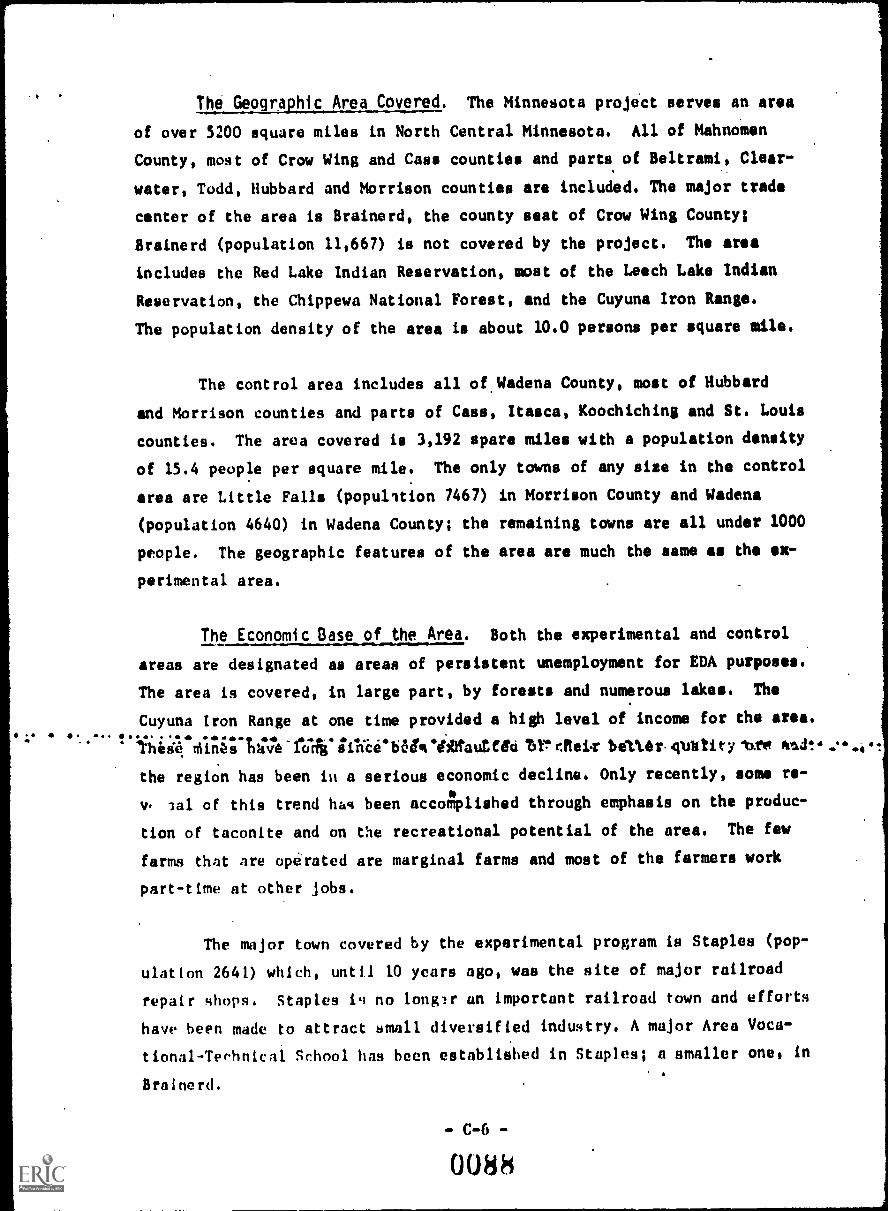
The Geographic Area Covered. The Minnesota project serves an area
of over 5200 square miles in North Central Minnesota. All of Mahnomen
County, most of Crow Wing and Cass counties and parts of Beltrami, Clear-
water, Todd, Hubbard and Morrison counties are included. The major trade
center of the area is Brainerd, the county seat of Crow Wing County;
Brainerd (population 11,667) is not covered by the project. The area
includes the Red Lake Indian Reservation, most of the Leech Lake Indian
Reservation, the Chippewa National Forest, and the Cuyuna Iron Range.
The population density of the area is about 10.0 persons per square mile.
The control area includes all of.Wadena County, most of Hubbard
and Morrison counties and parts of Cass, Itasca, Koochiching and St. Louis
counties. The area covered is 3,192 spare miles with a population density
of 15.4 people per square mile. The only towns of any size in the control
area are Little Falls (population 7467) in Morrison County and Wadena
(population 4640) in Wadena County; the remaining towns are all under 1000
people. The geographic features of the area are much the same as the ex-
perimental area.
The Economic Base of the Area. Both the experimental and control
areas are designated as areas of persistent unemployment for EDA purposes.
The area is covered, in large part, by forests and numerous lakes. The
Cuyuna Iron Range at one time provided a high level of income for the area.0.4p Oe
f. .these Minas'huve-faliliiebegeVigautfle ticReiv beTteroutity -are opl.it:.
the region has been in a serious economic decline. Only recently, some re-
v 3a1 of this trend hag been accomplished through emphasis on the produc-
tion of taconite and on the recreational potential of the area. The few
farms that are operated are marginal farms and most of the farmers work
part-time at other jobs.
The major town covered by the experimental program is Staples (pop-
ulation 2641) which, until 10 years ago, was the site of major railroad
repair shops. Staples it; no longer an important railroad town and efforts
have been made to attract small diversified industry. A major Area Voca-
tional-Teohnical School has been established in Staples; a smaller one, in
Brainerd.
- C -6 -
0088

About 4 percent of the population of the experimental counties and
5 percent of the control counties are employed in manufacturing. The man-
ufacturing is primarily of wood products (including paper), wood preserv-
ing, and sawmills. Numerous small dairies and dairy processing plants are
also located throughout the area, and a couple of areas manufacture clothing
for men and boys. Only about 5 percent of the population of the experimen-
tal area and 3 percent of the control area are employed in agricultural,
forestry and fisheries occupations. Most of the counties in the whole area
have less than 40 percent of the land area in farms., only four counties --
Mahnomen, Morrison, Todd and Wadena -- have between 55 and 78 percent of
the area in farms.
Problems Facing the Rural Vouth. Approximateil $$ portiont of the
students enrolled in grades 10 to 12 are from latiliea classified as Whitbelow the poverty level. Poveety is especially prs$tefl 60008 0%0 Ameri-
can Indians in the area.
The schools are all fairly large sa4 hinge up to 421 students id
Staples and 490 student* is Crosby. ftly the Staple* othold offers a full
range of vocational courses, (graining, *Mich is not severed the mede%k
also has a full vocatioos0 education cueticutian.) few of the 'Awls et.,
Ler any type of occupational amilAarizatieo course, ai the school diem.
tricts covered by the model oniy Staples offers GED treAting.
00, 0 0,00-4 fft - 4ti ,4t. 41 s o o,Despite the high rate of unemployment to, the 000 the outmigratian
from this irea is not pifficulatiy high. 0/ tbose six etrustios which ere
primarily experimental only thitee lust popu14100, 014y one of he 040-nomen County) decreased by more thon #4 Porrg0/ 14110 OFPO Pt 00 0Pc
111;o1;.1,1rily C. .N.a lo,t all of 14em
decreased by 1.ss than 7 percent. However, 0 Ihn axperimental eoL0,04
11in 15t70 wire 4275 fifteen and sixteen pox. olds 014 7437 seventeey
and eighteen year olds but only WM nineteen and twenty yenr 0.(49 044
nearly 56 perreht of those entering hl0 scio.). now can be expected to
leave the area before the age of 21. In tho LorLrol counties there were
7

5095 fifteen and sixteen year olds, 4112 seventeen and eighteen year olds
and 2339 nineteen and twenty year olds; from these counties we can expect
that about 54 percent of those entering high school now will leave the
area bafore the age of 21.
1111' P . a . .-.40 a a. 1.
- C-8 -
JON

APPENDIX D
LIST OF EDUCATION AND TRAINING COURSES
OFFERED BY EXPERIMENTAL PROJECTS
S. . MI.. t 0 II. .42 41 . 0 S. 00.. .0440 * .0 .4..6 4. .0 O. .

MINNESOTA SPECIAL PROGRAM ORIENTATION
CONTENT OF WORLD OF WORK UNIT
A. Urban Jobs and Role of Work
B. Occupational Information
C. Job Seeking
1. Sources of help
2. State Employment Service and fee agencies
3. Personnel offices -- what they are and howto find them
4. Filling out job applications
5. The job interview
6. Sources of information and referral
7. Screening and 'selecting potential jobs
D. Work Routines and Careers
1. Calling absences
2. Dress/grooming
3. Breaks, lunches
4. Time/hours of work
5. Getting along with supervisors. . . .. . . .... -
6. Cetting along with ccworkers
E. Lost Job and Social Security
0092

CONTENT OF OCCUPATIONAL FAMILIARIZATION UNIT
A. An Introduction to Career Planning
B. Occupational Information
1. Kinds of jobs
2. Work duties
3. Pay
4. Fringe benefits
S. Working conditions
6. Hours
7. Location -- rural or urban
:8. Promotion
C. In-depth Occupational Exploration
oon

Po.
CONTENT OF ORIENTATION TO HIGHER EDUCATION UNIT
A. College
1. Financial aides
2. Appling
3. Registering
4. BeLavlor !ri college
5. Description of schools
6. What to look for
B. Vocational Schools
1. How to choose a school
2. Information on schools
3. Bogus vocational institutes
40 *4 .4 .

CONTENT OF ORIENTATION TO URBAN LIVING UNIT
A. Your Move to the City -- Finding a Place to Live
B. Roommates
C. Drugs, Alcival and %funereal Disease
D. Food and Diet Away from Home
E. Social Interaction
F. Personal Safety
G. Urban Transportation
H. Choosing a City
.61... *A.4 --
- D-4 -
U096

CONTENT OF FINANCIAL TRAINING UNIT
A. The Techniques in Advertising that May Mislead While EncouragingPurchases
B. Consumer Education and Consumer Rights
C. Credit
D. Contracts/Sales Agreements
E. Personal Finances and Money
F. Taxes -- Filing and Regulations'
. 'a* *4***
t
411

CONTENT OF COMMUNICATIONS UNIT
A. Introduction
S. Self-disclosure
C. Body Language
D. Levels of Communication
Z. Thoughts and Feelings
P. Self-awareness
G. Self-esteem
M. Sharing Meaning
I. Wrap-up of the Course
- D -6 -
1009/

CONTENT OF ORIENTATION TO THE ARMED SERVICES UNIT.
A. Utilization of Military Service
1. Training opportunities -- transferability tocivilian jobs
2. Pay
3. Advantages and disadvantages of service
S. Induction in Service
1. Preparation for the induction process --what happens
2. Assessment and intake
3. How to maximize opportunities to get assignmentsor training of interest
4. Military experience preparation for service
-D-7-
009A

MINNESOTA EDUCATION AND TRAINING COURSES
$c12901 Course
Backus
Cass Lake
Crosby- Ironton
ibtley
Park Rapids
Pequot Lakes
Pine River
Red Lake
Band Instrument RepairIntroduction to the Computer
Small Business Management CourseTutoring Course
Introduction to the ComputerChemistry Tutoring CourseBusiness EducationDrivers EducationBasketball OfficiatingTraining in Snowmobile ConstructionMath TutoringPoetryPsychologyflorist shop Management
Introduction to the Computer
Auto Body RepairFarm Implement MechanicsTutoring
Introduction to the Computer
Journalism and New CommunicationMachine, Showcard, Lettering and
Hand LetteringPhotographyIntroduction to the Computer
Advanced EnglishTutoring
-D-8-
0099

tf.
IOWA CENTERS AND "EXPLORATION STATIONS"
Mt. Ayr CenterExploration Stations
Health Occupations
Commercial Art:
PotteryJewelry makingPainting (acrylics)Interior designWeaving - macrameCeramics.
Zrocheting, knitting,needlepoint
Media:IA
PhotographyRadioMovies
Graphics:
LetteringDrawingDrafting
Shop :
Auto mechanicsSmall engine mechanicsFoundryWelding, electric & gasCarpentryElectricity, basic and
electronicsAviation - ground schoolTV rervir prmIrPt kite
Mac Auto Body ShopExploration Stations
Auto Body
Frame and_Body Pulls
Front End Aligmmemt
- D -9 -
0100
Corning Downtown CenterExploration Stations
Caypontry
4loctricity
(round School Aviation
Photomaphy
RultIt Occupations
Interior Design

NEBRASKA EDUCATION AND TRAINING COURSES
MID-PLAINS VOCATIONAL TEChNICAL SCHOOL
Diesel Mechanics
Autg Mechanics
finish Carpentry
Training for Nurses Aide
Livestock Production
Survey Data Processing
Arc and Oxy-Acetylene
Offset
Machine Shop
Consumei Economics
English
English
Speech
KEARNEv STATE COLLEGE
Pilot Cround School
Blueprint Reading
Upholstery
Secretarial Typing
Photography
Office Machines Practice
Survey of Sheet Metal
English
Psychology
Computer Science
Psychology
NORTH PLATTE JUNIOR COLLEGE
- D-10 -
0 101
Psychology

APPENDIX E
TABLES OF VARIABLES USED TO MEASURE
PREPARATION OF HIGH SCHOOL SENIORS FOR FULL-TIME JOBS
01U

Table S-1
Respondents from the Minnesota White Experimental and ControlSamples 'ho Graduated or Did Not Graduate from High School
Sample Graduated Did Not Graduate Totals
Experimental
Control
Totals
293
292
(96%)
(99%)
11
4
(4%)
(1%)
304
296
585 15 600
X2 3.162, df 1; p not significant
Table E -2
Respondents from the Iowa Experimental and ControlSamples Who Graduated or Did Not Graduate from High School
Samples Graduated Did Not Graduate Totals
Experimental 106 (100%) 0 (0%) 106
Control 159 ( 99%) 2 (1%) 161..............
Totals 265 2 267
X2 0.182, df 1; p not significant
- E-1 -
0104
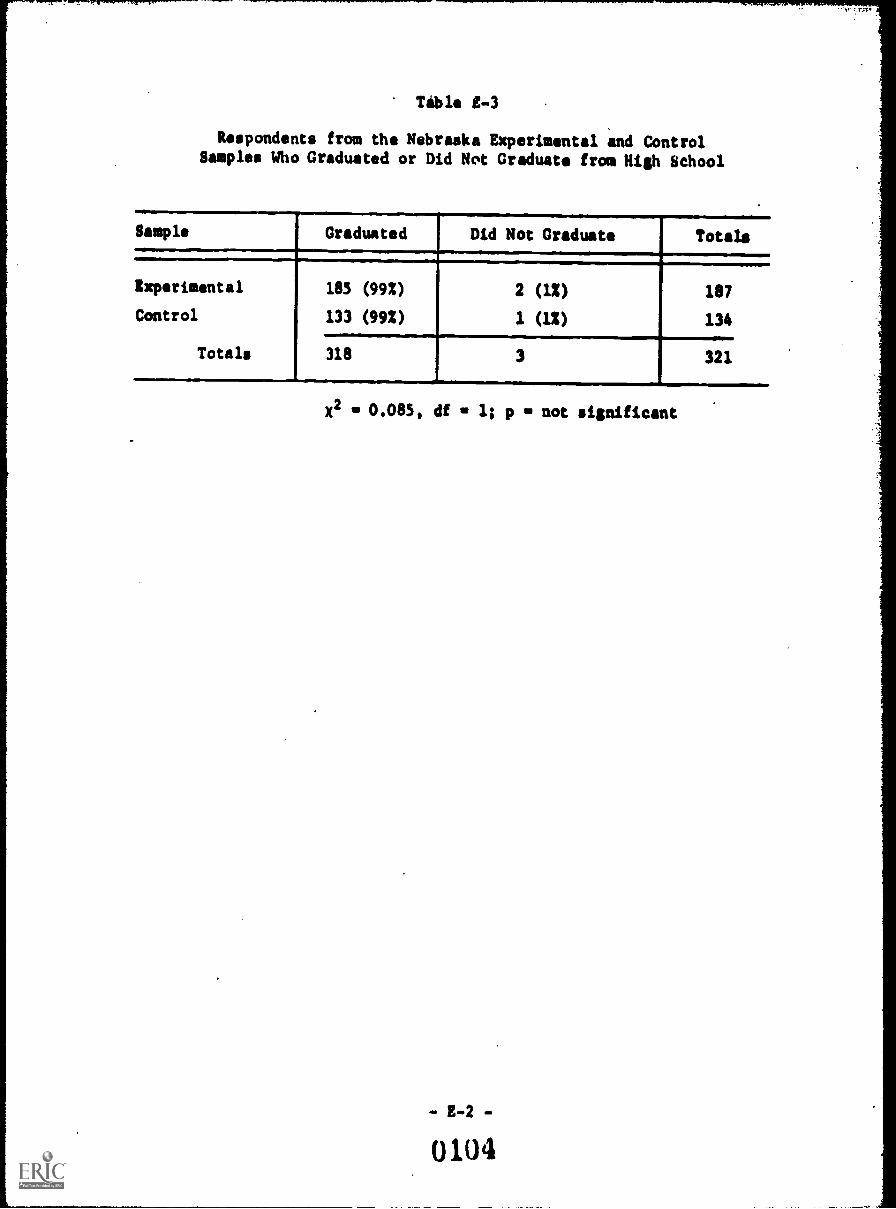
Table E -3
Respondents from the Nebraska Experimental and ControlSamples Who Graduated or Did Not Graduate from Nish School
Sample Graduated Did Not Graduate Totals
Experimental
Control
Totals
185 (99%)
133 (992)
2 (1%)
1 (1%).
187
134
318 3
,
321
X2 0.085, df 1; p not sisnificant
- E-2 -
0104

Table E-4
Proportion of Job-Seeking Respondents from theMinnesota White Experimental and Control SamplesWho Had an Idea of the Type of Work They Desired
Had an Idea Had No IdeaSample of Type of of Type of Totals
Work Desired Work Desired
Experimentalj 69 (58%) 51 (422) 120
Control' 67 (57%) 51 (432) 118
Totals 136 102 238
X2 0.0003, df 1; p not significant
Table 8-5
Proportion of Job-Seeking Respondents from theIowa Experimental and Control Samples
Who Had an Idea of the Type of Work They Desired
SampleHad an Ideaof Type ofWork Desired
Had No Ideaof Type ofWork Desired
Experimental
Control
Totals
20
55
(57%)
(717.)
15
23
(43%)
(29%)
75 38
Totals
35
78
I 113
_A-
X2 1.934, df a 1; p - not significant
- 5 -3 -
010o

Table E -6
Proportion of Job- Seeking Respondents from theNebraska Experimental and Control Samples
Who Had an Idea of the Type of Work They Desired
Sample
.....,
Had an Ideaof Type of
Work Desired
Had No Ideaof Type ofWork Desired
Totals
Experimental
Control
Totals
56 (63%)
if (50*
33 (37S)
13 (50%)
89
26
69 46 115
X2 1.399, df 1; p not sisnificant

APPENDIX F
TABLES OF VARIABLES USED FOR THE POST-HIGH
SCHOOL EDUCATION AND TRAINING CRITERION MEASURES
A,
WM /

Table 1-1
Post-High School Educational Statusof Respondents from the Minnesota
White Experimental and Control Samples
Sample Enrolled Did Not Enroll Totals
Experimental
Control
Totals
184 (61%)I
120 (39%) 304
177 (602) 1 119 (402) 296
251 I 239 600
X2 - 0.033, df 1; p not significant
Table F-2
Post-High School Educational Statusof Respondents from the Iowa
Experimental and Control Samples
Sample Enrolled Did Not Enroll Totals
Experimental 71 (67%) 35 (332) 106
Control 83 (52%) 78 (48%) 161
Totals 154 113 267
X2 gm 6.232, df 1; p 0 <.02
- F-1 .
0108.

Table 1-3
24t-High School Educational Status. Respondents from the Nebraska.--.rimentel and Control Samples
Er ~bled Did Not Enroll
01111111=0
98 (52%) 89 (48%)
108 (81%, I 26 (19%)
206
X2
115
Totals
187
134
321
is 26.983, df = 1; p = <.001
-1-2-
010J

Table F-4
Post High School Enrollment of Respondentsfrom the Minnesota White Experimental
and Control Samples by Type of Institution
Sample College Other Totals
xperimental
Control
Totals
99
77
(542)
(44%)
85
100
(46%)
(56%)
184
177
176 185 361
X2 a 3.831, df 1; p = not significant
Table 1P-5
Post High School Enrollment of Respondentsfrom the Iowa Experimental
and Control Samples by Type of Institution
Sample College Other Totals
Experimental
Control
Totals
39
61
(55%)
(73%)
32
22
(45%)
(27%)
1 71
83
100. 541
154
X2 al 5.791, df = 1; p = <.02
E -3 -
0110

Table
Post Nigh School Enrollment of Respondentsfrom the Nebraska Experimental
and Control Samples by Type of Institution
Sample College Other Totals
Experimental
Control
Total s
65
80
(66%)
(74X)
33
28
(342)
(26X)
98
108
145 61 206
X2 1.479, df 1; p not significant
0111

Table F-7
Proportion of Minnesota White Respondents from theExperimental and Control Samples Enrolled in a
Post-High School Institution who Dropped Out of the Institution
Sample Dropped Out Did Not Drop Out Totals
Experimental
Control
Totals
23
13
(13%)
( 72)
161
164
(87%)
(93%)
184
171
36 325 361
X2 2.670, df 1; p not significant
Table F-8
Proportion of Iowa Respondents from theExperimental and Control Samples Enrolled in a
Post-Nigh School Institution who Dropped Out of the Institution
Sample Dropped Out Did Not Drop Out Totals
Experimental
Control
ToidlA
5
8
( 7%)
(10%)
66
75
(932)
(90%)
71
83
13 141 154
X2 0.333, df 1; p not significant
- F-5 -
0112

Table F-9
Proportion of Nebraska Respondents from the
Experimental and Control Samples Enrolled in aPoet-High School Institution who Dropped Out of the Institution
Sample Dropped Out Did Not Drop Out Totals
Experimental
Control
Totals
i
1
92 (94X) i 98
1C3 I
3 (95X) . 108
11 195 I206
X2 0.226, , df 1; p not significant
- F-6 -
0113

APPENDIX G
TABLES OF VARIABLES USED AS CRITERION
MEASURES OF POST-HIGH SCHOOL EMPLOYMENT
0114
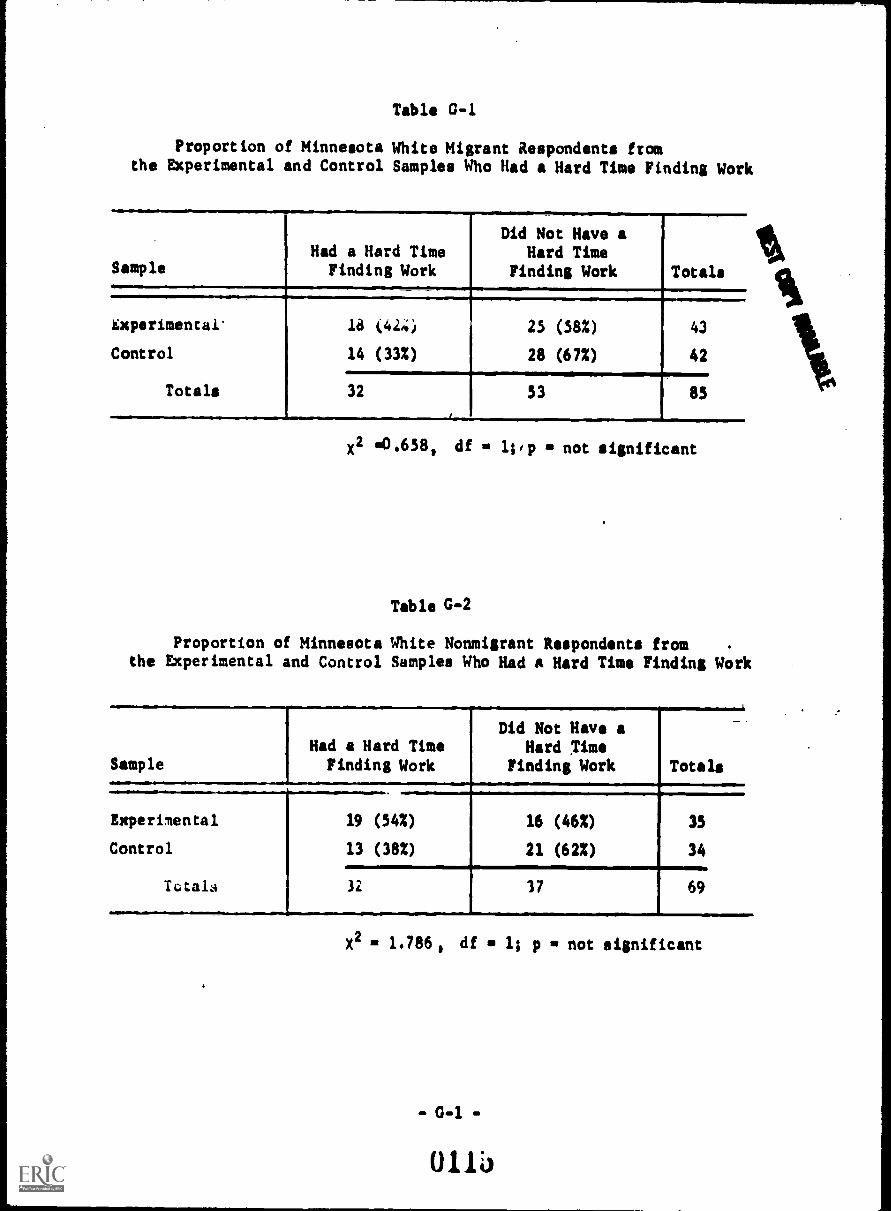
Table G-1
Proportion of Minnesota White Migrant Respondents ftomthe Experimental and Control Samples Who Had a Hard Time Finding Work
SampleHad a Hard TimeFinding Work
Did Not Have aHard Time
Finding Work Totals
.
Experimental-
Control
Totals
18 (42,;)
14 (33%)
- -
25 (58%)
28 (67%)
43
42
32
,
53 85
x2 df 1;fp not significant
Table G-2
Proportion of Minnesota White Nonmigrant Respondents fromthe Experimental and Control Samples Who Had a Hard Time Finding Work
SampleHad a Hard Time
Finding Work
Did Not Have aHard Time
Finding Work
-
Totals
Experimental
Control
Totals
19 (54%)
13 (38%)
16 (46%)
21 (62%)
35
34
32 37 69
1X2 .7861 df 1; p not significant
- 0-1 -
O11

Table C -3
Proportion of Iowa Migrant Respondents from the Experimentaland Control Samples Vho Had a Hard Time Finding Work
.
Sample
Had a Hard TimeFinding Work
Did Not Have aHard Time
Finding Work
.
Totals
Experimental
Control
Totals
5 (45%)
7 (33%)
6 (55%)
14 (67%)
11
21,
12 20 32
x2 "0.083, df 1; p not significant
Table G-4
Proportion of Iowa Nonmigrant Respondents from the Experimentaland Control Samples Who Had a Hard Time Finding Work
Sample
Had a Hard TimeFinding Work
Did Not Have aHard Time
Finding Work Totals
Experimental
Control
Totals
._
2 (18%)
8 (33%)
9 (82%)
16 (67X)
11
24
10 25
V
35
x2 =0,268, df 1; p not significant
- G -2 -
0 1 lb

Table G-5
Proportion of Nebraska Migrant Respondents from the Experimentaland Control Samples Who Had a Hard Time Finding Work
SampleHad a Hard Time
Finding Work
Did Not Have aHard Time
Finding Work Totals
ExperimeLlt.il
Control
Totals
6 (232)
2 (40%)
20 (172)
5 (60%)
26
7
8 25 33
X2 .038, df 1; p - not significant
Table G-6
Proportion of Nebraska Nonmigrant Respondents from the Experimentaland Control Samples Who Had a Hard Time Finding Work
SampleHad a Hard TimeFinding Work
.
Did Not Have aHard Time
Finding Work Totals___,
Experimental
Control
Totals
..............._____
6 (40%)
0
9 (60%)
5 (100E)4....
15
5
206 14 -.X2 - 1.269, df 1; p not significant
- 0 -3 -
U 11'1

Table G-7
Type of Job Held by Minnesota White Migrant
Respondents from the Experimental and Control Samples
Sample
Type of Job
TotalsBlue Collar White Collar411
Experimental 27 (75%) 9 (25%) 36
Control 30 (73%) 11 (27%) 41
Totals 57 20 77
X2 10.033, df 1; p not significant
Tab la G-8
Type of Job Held by Minnesota White Nonmigrant
Respondents from the Experimental and Control Samples
Type of Job
TotalsSample Blue Collar White Collar
Experimental
Control
Totals
19
36
(611)
(88%)
12
5
(39X)
(122)
31
41,N=MIN
55 17 72
X2 6.881, df 1; p <.01
- G -4 -
0118

1
Table G-9
Type of Job Held by Iowa Migrant Respondentsfrom the Experimental and Control Samples
Sample
Type of Job
TotalsBlue Collar White Collar
Experimentql 6 (67%) 3 (33%) 9
Control 15 (75%) 5 (25%) 20
Totals 21 8 29
X2 0.02, df = 1; p - not significant
Table G-10
Type of Job Held by Iowa Nonmigrant Respondentsfrom the Experimental and Control Samples
Sample
Type of Job.
TotalsBlue Collar White Collar
Experimental 14 (88%) 2 (12%) 16
Control 28 (85%) 5 (15%) 33
Totals 42 7 49
444- .4.844.-4.
X2 df 1; p - not signifi-ant
- 0-5 -
0119

Table G-11
Type of Job Held by Nebraska Migrant Respondentsfrom the Experimental and Control Samples
Sample
Type of Job
TotalsBlue Collar White Collar
Experimental 20 (712) 8 (292) 28
Control 5 (632) 3 (372) 8
Totals 25 11 36
X2 '0.0029 df 1; p not significant
Table G-12
Type of Job Held by Nebraska Nonmigrant Respondents
from the Experimental and Control Samples
Sample
Type of Job
TotalsBlue Collar White Collar
Experimental 23 (BM 3 (122) 26
Control 10 (1002) 0 10
Totals 33 3 36
.X2
110.401 df - 1; p not significant

Table G-13
Weeks Minnesota White Migrant Respondentsfrom he Experimental and Control Samples were Employed
Sample
Weeks Employed
Totals<13 13 or More
Experimental 24 (63%) 14 (37%) 38
Control 20 (50%) 20 (50X) 40
Totals 44 34 78
X2 w 1.372, df s 1; p = not significant
Table G-14
Weeks Minnesota White Nonmigrant Respondentsfrom the Experimental and Control Samples were Employed
Sample
Weeks Employed
Totals<13 13 or More
Experimental 11 (35%) 20 (65%) 31
Control 16 (39%) 25 (61%) 41
TotAlg 27 45 72
aarma........sommomemmair
x2 .0.094, df = 1; p 0 not significant
. G.7
0121

Table G-15
Weeks Iowa Migrant Respondentsfrom the Experimental and Control Samples were Employed
Sample
Weeks Employed
<13 13 or More
Experimental
Control
Totals
6
10
(67%)
(50%)
3
10
(33X)
(502)
16 13
x2 '0 .697, df 1; p not significant
Table G-16
Weeks Iowa Nonmigrant Respondents
from the Experimental and Control Samples were Employed
Sample
Experimental
Control
Totals
Weeks Employed
<13 13 or More
7 (S0.%)
12 (40%)
19
7 On)18 (602)
25
x2 0.389, df 1; p not significant
G -8
0122

Table G-17
Weeks Nebraska Migrant Respondentsfrom the Experimental and Control Samples were Employed
40,
Sample
Weeks Employed
Totals<13 13 or More
Experimental 15 (52Z) 14 (48%) 29
Control 6 (87%) 3 (332) 9
Totals 21 17 38
4
X2 0.163, df 1; p - not significant
Table G-18
Weeks Nebraska Nonmigrant Respondentsfrom the Experimental and Control Samples were Employed
Weeks Employed
TotalsSample <13 13 or More
Experimental 7 (29%) 17 (71X 24
Control 0 6 (10 0%) 6
Totals 7 23 30
X2 0.943, df 1; p
0.9 -
012
not significant

Table G-19
Hourly Wage Earned by Minnesota White MigrantRespondents from the Experimental and Control Samples
Sample
Hourly Wage
Totals$2.40 or less
a
$> 2.40
Experimental 22 (61X) 14 (39X) 36
Control 21 (51X) 20 (49X) 41
Totals 43 34 77
x2 0.761, df 1; p not significant
Table G-20
Hourly Wage Earned by Minnesota White NonmigrantRespondents from the Experimental and Control Samples
Hourly Wage
TotalsSample
WIIIM11111116,
$2.40 or leis $>2.40
Experimental 19 (63X) 11 (37X) 30
Control 31 (782) 9 (22X) 40
Totals 50 20 70
Ali
x2 1.686, df 1; p not significant
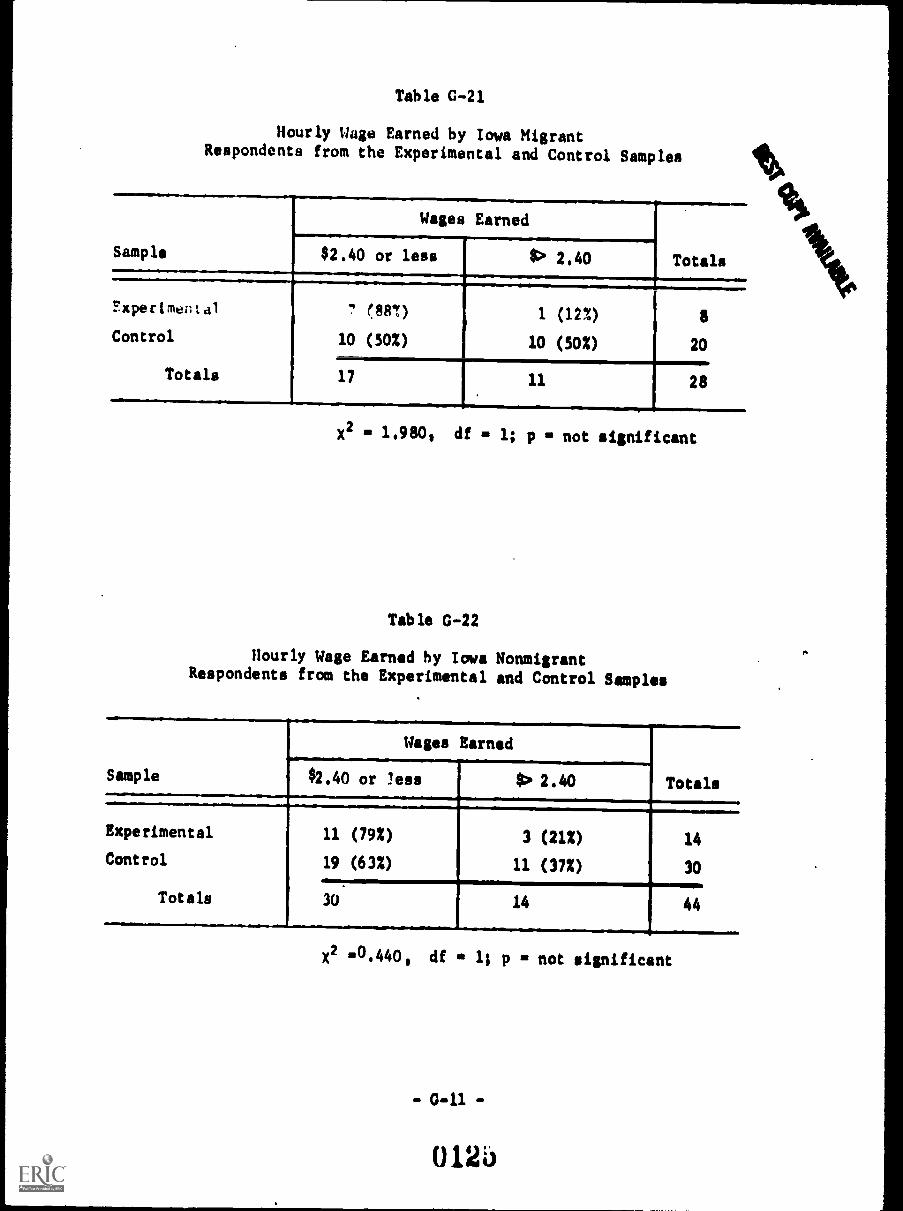
Table C-21
Hourly Wage Earned by Iowa MigrantRespondents from the Experimental and Control Samples
Sample
Wages Earned
Totals$2.40 or less 11> 2.40
!xpertmevtal (88!) 1 (12%)Control 10 (50%) 10 (50%) 20
Totals 17 11 28
1X2
1.980, df 1; p not significant
Table G-22
Hourly Wage Earned by Iowa NonmigrantRespondents from the Experimental and Control Samples
111/
Wages Earned
TotalsSample $2.40 or less $ 2.40
Experimental 11 (79%) 3 (21%) 14
Control 19 (63%) 11 (37%) 30
Totals 30 14 44
x2 0.440, df 1; p - not significant
- G-11 -
012i)
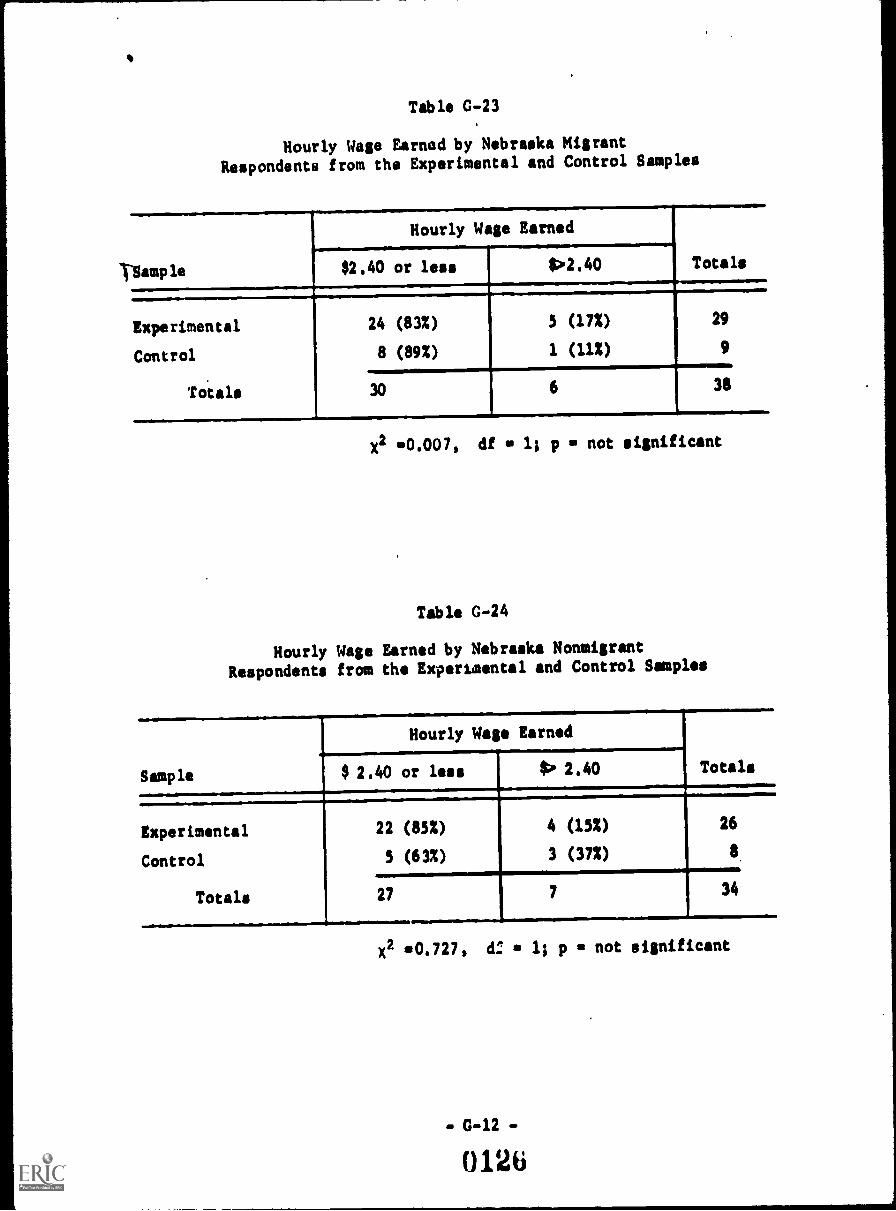
Table G-23
Hourly Wage Earned by Nebraska Migrant
Respondents from the Experimental and Control Samples
'rSamp le
Hourly Wage Earned
Totals.1.11
$2.40 or less 102.40
Experimental 24 (83X) 5 (17X) 29
Control 8 (89%) 1 (11X) 9
Totals 30 6 38
x2 - 0.007, df 1; p not significant
Table G-24
Hourly Wage Earned by Nebraska Nonmigrant
Respondents from the Experimental and Control Samples
Hourly Wage Earned
TotalsSample $ 2.40 or less $ 2.40
Experimental 22 (85X) 4 (15X) 26
Control 5 (63%) 3 (37X) S.
Totals 27 7 34
e -0.727, d: 1; p - not significant
G-12 -
012U

Table G-25
Proportion of Employed Minnesota White MigrantRespondents from the Experimental and Control
Respondents Who Found the Type of Work They Wanted
SampleFound Typeof Work
Did Not FindType of Work Totals
, ..
Experimental
Control
Totals
14 (39%)
18 (60%)
22 (61%)
12 (40X)
36
30
32 34 66
ft
X2 2.920, df 1; p not significant
Table G-26
Proportion of Employed Minnesota White NonmigrantsRespondents from the Experimental and Control
Respondents Who Found the Type of Work They Wanted
SampleFound Typeof Work
Did Not FindType of Work Totals
Experimental
Control
Tonle
-
15 (68%)
21 (58%)
7 (32X)
15 (42X)
22
36
36 27 58
.
x2 0.563, df 1; p not significant
- G-13 -
012`1

Table G-27
Proportion of Employed Iowa Migrant Respondents
from the Experimental and Control Respondents
Who Found the Type of Work they Wanted
Sample
Pound Typeof Work
Did Not FindType of Work Totals
Experimental
Control
Totals
3 (50%)
11 (58%)
3 (50%)
8 (42%)
6
19
14 11 25
X2 Q0179 df 1; p not significant
Table G-28
Proportion of Employed Iowa Nonmigrant Respondents
from the Experimental and Control Respondents
Wno Found the Type of Work they Wanted
Sample
Found Typeof Work
Did Not FindType of Work Totals
.
Experimental
Control
Totals__
,
7 (70%)
20 (69%)
3 OOP
9 (312)
.
10
29
27
,
12 39
X2 -0.113, df 1; p not significant
- 0-14 -
0128

Table 0-29
Proportion of Employed Nebraska Migrant Respondentsfrom the Experimental and Control Respondents
Who Found the Type of Work they Wanted
Sample
Found Typeof Work
Did Not FindType of Work Totals
Experimental
Control
Totals
----...------17 (68%)
4 (loOu
8 (32%)
0
25
9
26 8 34
X2 2.198, df = 1; p = not significant
Table G-30
Proportion of Employed Nebraska Nonmigrant Respondentsfrom the Experimental' and Control Respondents
Who Found the Type of Work they Wanted
Sample
Found Typeof Work
Did Not FindType of Work Totals
Experimental 17 (71%) 7 (29%) 24
Control 3 (752) 1 (25%) 4
Totals 20 8 28
x2 .4182 df 1; p = not significant
- G-15 -
O12

APPENDIX H
TABLES OF VARIABLES USED FOR
THE SOCIAL PARTICIPATION CRITERION MEASURES
0130

Table H-1
Proportion of Minnesota Migrant Respondents from theExperi"ental and Control Samples Who Had a Good to Fair
Knowledge of Recreational Facilities in a New Town or City
Sample
Knowledge of Recreational Facilities
TotalsGood to Fair Poor
Experimental
Control
Totals
36
30
(597)
(73%)
25
11
(41%)
(27%)
61
41
66 36 102
X al 2.151, df 1; p not significant
Table H-2
. Proportion of Troia Migrant Respondents from theExperimentvl and Control Samples Who Had a Good to Fair
Knowledge of ?ecreational facilities in a New Town or City
Sample
Knowledge of Recreational Facilities
TotalsGood to Fair Poor
Experimental 7 ( ?O2) 3 (302) 10
Control 14 ( 70%) 6 (30%) 20
Totals 21 9 30
410.
2 1X .0* 1 1071 df AS 1; p a not significant
- H -1 -
0131

Table H-3
Proportion of NebraHka Migrant Respondents from the .
Experimental and Control Samples Who Had a Good to FairKnowledge of Recreational Facilities in a New Town or City
Sample
Knowledge of Recreational Facilities
Totals
ON'
Good to Fair Poor
Experimental 25 (732) 9 (272) 34
Control 5 (832) 1 (172) 6
Totals 30 10 40
X2 0.000, df 1; p not significant
Table H-4
Proportion of Minnesota Migrant Respondents from theExperimental and Control Samples Who Had a Good to FairKnowledge of Essential Facilities in a New Town or City
Sample
Knowledge of Essential Facilities
TotalsGood to Fair Poor
Experimental 51 (82%) 11 (18%) 62
Control 40 (97%) 1 (3%) 41
Totals 91 12 103
AX2
4.227, df 1; p <.05
- H-2 -
0132
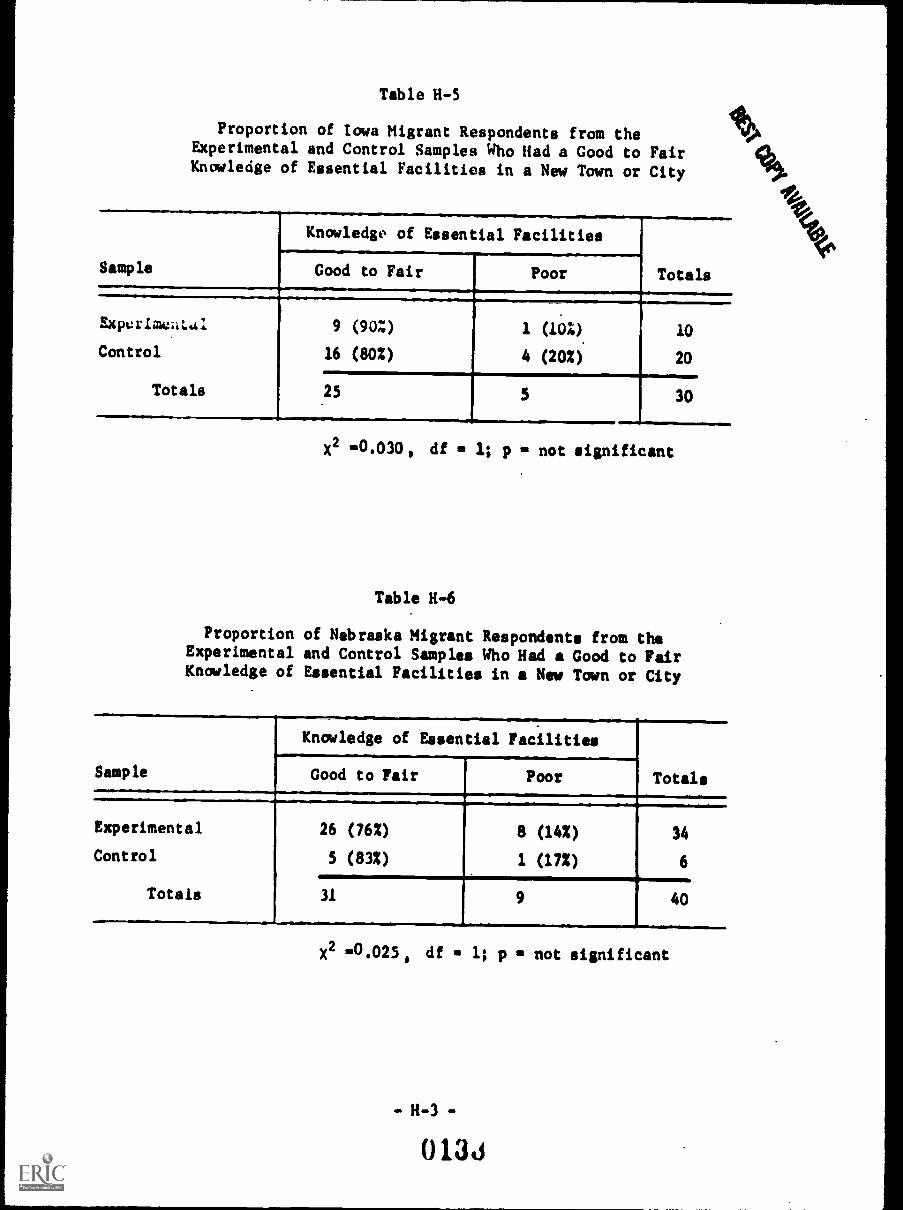
Table H-5
Proportion of Iowa Migrant Respondents from theExperimental and Control Samples Who Had a Good to FairKnowledge of Essential Facilities in a New Town or City
Sample
Knowledge of Essential Facilities
TotalsGood to Fair Poor
ExperimcilLal 9 (90:) 1 (lia). 10
Control 16 (80%) 4 (202) 20
Totals 25 5 30remmyllII
X2 0 .030, df 1; p not significant
Table H-6
Proportion of Nebraska Migrant Respondents from theExperimental and Control Samples Who Had a Good to FairKnowledge of Essential Facilities in a New Town or City
Sample
Knowledge of Essential Facilities
Totals
r
Good to Fair Poor
Experimental 26 (76%) 8 (14%) 34
Control 5 (832) 1 (17%) 6
Totals 31 9 40
x2 0.025, df 1; p not significant
- 11-3 -
O13

Table H-7
Proportion of Migrant Respondents from the Minnesota Experimentaland Control Samples Who Spent 50 Percent or More of Their
Weekends in the City
,
Sample 50% or More Less than 50% Totals
Experimental
Control
Totals
.40 (68%)
20 (50%)
19 (32%)
20 (10%)
59
40
60 39 99
X2 a 3.162, df 1; p - not significant
Table H-8
Proportion of Migrant Respondents from the Iowa Experimental andControl Samples Who Spent 50 Percent or More of Their Weekends in the City
Sample 50% or More Less than 50% Totals
Experimental
Control
Totals
7
10
(64%)
(50%)
4
10
(36%)
(50%)
11
20I
17 14
,
31
X2
Is 4123, df = 1; p - not significant
- 0 -4 -
0134

Table H-9
Proportion of Migrant Respondents from the Nebraska Experimentaland Control Samples Who Spent 50 Percent or More of Their
Weekends in the City
Sample 502 or More Less than 30% Totals
Experimental
Control
Totals
23 (74%)
6 (100%)
8
0
(26%) 31
6
29 8 37
x2 - 0,746, df 1; p not significant
- H-5 -
O11)

APPENDIX I
TABLES COMPARING AMERICAN INDIAN RESPONDENTS
FROM THE MINNESOTA EXPERIMENTAL AND CONTROL SAMPLES
0136

RaceIs
The Iowa and Nebraska research populations did not include a mi-
nority subgroup. The Minnesota experimental program enrolled American
Indian youth. (The reasons for the enrollment of American Indian youth
and the problems created for the evaluation because of the small number
of Indian youth available for the control sample are described on page 25.
Remise of the small number of youth in the control sample, a statistical
analysis of the data for American Indian experimental and control samples
is impossible. A summary of the data for the Minnesota minority subgroup
is included in Tables I-1 through 1-7).
Table I-1
Proportion of Minnesota American Indian Respondentsin the Experimental and Control Samples by Class Rank
Sample
Clads Rank
Upper 50% Lower 50%
Experimental
Control
Totals
11,
20 (40%)
5 (50%)
30 (60%)
3 (30%)
25 35
Totals
50
10
60
X2 0.0549, df = 1; p = not significant
0137

Table 1-2
Respondents from the Minnesota Indian Experimental and Control
Samples Who Graduated from or Did Not Graduate from High School
Sample Graduated I Did Not Graduate Totals
Experimental
Control
Totals
46
8
(92%)
(80%)
4
2
(8%)
(202)
50
10
54 6 60
X2 4.333, df -.1; p not significant
Table 1-3
Proportion of Job-Seeking Respondents from theMinnesota Indian Experimental and Control SamplesWho Had an Idea of the Type of Work They Desired
Sample
Had an Ideaof Type of
Work Desired
Had No Ideaof Type of
Work Desired Totals
.
Experimental
Control
Totals
5 (23Z)
3 (100Z)
17 (77Z)
0
22
3, ..
8 17 25
X2 4.1284, df 1; p <.05
- 1-2 .
0138

Table 1-4
Post-High School Educational Status of Respondents fromthe Minnesota Indian Experimental and Control Samples
Sample Enrolled Did Not Enroll Totals
Experimental
Control
Totals
28 (56%)
7 (70!)
22 (44%)
3 (30%)
50
10
35 25 60
x2 - 0.219, df al 1; p 4.1 not significant
Table I-5
Proportion of Minnesota Indian Respondents from the Experimentaland Control Samples Who Had Hunted for a Full-Time Job
SampleHunted
For a JobDid Not HuntFor Job Totals
....
Experimental
Control
Totals
14 (64%)
1 (33%)
8 (362)
2 (672)
22
3
15 10 25
r2 JD 0142, df 1; p = not signific-
0139

Table 1-6
Proportion of the Minnesota Indian Respondents from the Experimental
and Control Samples Who Had a Hard Time Finding Work
Sample
Had a Hard TimeFinding Work
Did Not Have aHard Time
Finding Work Totals
0erimental
Control
Totals
, .
12 (55%)
1 (332)
10 (452)
2 (672)
22
3
13
.
12
-.
25
X2"0.005, df 1; p gis not significant
Table /-7
Employment Status of Noncollege Respondents from
the Minnesota Indian Experimental and Control Samples
Sample EmployedUnemployed,
LookingUnemployed,Not Looking Taal.
Experimental ,
Control
Totals
6
3
(27X)
(1002)
9
0
(41Z) 7
0
(322) 22
3
9 9 7 25
X2
6.061, df 2; p not significant
- 1-4 -
0140
APPENDIX J.
TABLES COMPARING NYC RESPONDENTS FROM THE CONTROL SAMPLE
WITH SUMMER EXPERIMENTAL PROJECT RESPONDENTS
0141

Neighborhood Youth Corps
Although youths selected to the controls for experimental youth
program enrollees did not participate in the experimental program, some
of them did participate in the NYC programs in the control areas. The
number of Nebraska control youths who were enrolled in NYC was so small
that no analysis of this group is possible. The NYC youths in Minne-
sota and Iowa werc matc.hed with economically disadvantaged youths who
participated in the experimental summer program. /1 Chi-squared tests of
significance show that the two groups are adequately matched with respect
to the sex and intelligence variables (see Tables J-1 to J-4). With
respect to the criterion measures used to evaluate the experimental pro-
gram the Minnesota and Iowa experimental samples do not differ from
the control samples at a statistically significant level. A summary of
the data for the NYC and summer experimental program subgroups is in-
cluded in Tables J-5 through J-14.
.1=111
/1/n order to participate in NYC youths must be economically disadvantaged.The NYC programs in the Iowa and Minnesota control counties are primarily
'summer programs.
J-1
0142

Table J-1
Sex of White Economically DisadvantagedRespondents Who Participated in a Summer Youth
Program in the Minnesota Experimental and Control Areas
Sample
Sex
Male Female Totals
Experimental
Control
Totals
33 (44%)
20 (27%)
42 (56%)
53 (73%)
75
73
53 95 148
X2 = 4.436 df = 1; p = <.05
Table J-2
Proportion of White Economically DisadvantagedRespondents Who Participated in a Summer Youth Program
in the Minnesota Experimental and Control Areas, by Class Rank
Sample
Experimental
Control
Class Rank
Upper 50% Lover 50% Totals
Totals
41 (55%)
35 (48%)
34 (45%)
38 (52%)
75
73
76 72 148
X2 0.669 df = 1; p = not significant
- J-2 -
0143

Table J-3
Sex of Iowa Economically Disadvantaged
Respondents Who Participated in a Summer YouthProgram in the Iowa Experimental and Control Areas
Sample
,
Sex
TotalsMale Female
Experimental
Control
Totals
10 (40%)
10 (422)
15 (60%)
14 (58%)
25
24
20 29 49
X2 0.014, df 1; p not significant
Table J-4
Proportion of Iowa Economically DisadvantagedRespondents Who Participated in a Summer Youth Programin the Iowa Experimental and Control Areas, by IQ Score
Sample
IQ Score
Totals>110 1 <110
Experimental
Control
Totals
9 (36%).
13 (547)
16 (64%)
11 (46%)
25
24
22 27 49
X2 1.634, df = 1; p not significant
-J-3.
0144

Table J-5
NYC and Summer Experimental Respondents from the MinnesotaExperimental and Control Samples Who Graduated
from or Did Not Graduate from High School
Sample Graduated Did Not Graduate Totals
.
Experimental
Control
Totals
70 (93%)
71 (97%)
-
5 (1%)
2 (3%)
75
73
141 7 148
x2 =0,545, df = 1; p is not significant
Table J-6
NYC and Summer Experimental Respondents from the IowaExperimental and Control Samples Who Graduated
from or Did Not Graduate from Nigh School
Sample Graduated Did Not Graduate Totals
Experimental
Control
Totals
25 (1002)
23 (96%)
0
1 (4%)
25
24
48 1 49
X2 '10.000, df = 1; p 0 not significant
- J-4 -
'O145

Table J-7
Proportion of Job-Seeking NYC and Summer ExperimentalRespondents from the Minnesota White Experimental and ControlSamples Who Had an Idea of the Type of Work They Desired
Sample
Had an Ideaof Type of
Work Desired
Had No Ideaof Type of
Work Desired Totals
.
Experimental
Control
Totals
22 (69%.)
20 (63%)
_
10 (31%)' 32
12 (37%) 32
42
4
22 64
X20.277, df 1; p not significant
Table J-8
Proportion of Job-Seeking NYC and Summer ExperimentalRespondents from the Iowa Experimental and Control
Samples Who Had an Idea of the Type of Work They Desired
Sample
Had an Ideaof Type of
Work Desired
Had No Idea.of Type ofWork Desired Totals
Experimental
Control
Totals
5 (50%)
9 (64%)
5 (50%)
5 (36%)
10
14
14 10 24
X2 al 0.078, df 1; p - not significant

Table J-9
Post-High School Educational Status of NYC and SummerExperimental Respondents from the
Minnesota White Experimental and Control Samples
Sample Enrolled Did Not Enroll Totals
Experimental
Control
Totals
45
41
(60%)
(56%)
30
32
(40%)
(44%)
75
73
86 62 148
X2 s0.224, df 1; p not significant
Table J-10
Post-High School Educational Status of NYC and SummerExperimental Respondents from theIowa Experimental and Control Samples
Sample Enrolled ! Did Not Enroll Totals
Experimental 15 (60%) 10 (40%) 25
Control 10 (42%) 14 (58%) 24
Totals 25 24 49
X2 1.647, df 1; p not significant
- 1 -6 -
0147

Table J-11
Proportion of MinnosLta White NYC and Summer Experimental ProgramRespondents Who Had Hunted for a Full-Tlme Job
Sample
Experimental I
Lull rol
Totals
HuntedFl a Job
Did Not HuntFor a Job Totals
27
22
(72%)
(-1;)
6
11
(18%)
(33%)
33
33
49 17 66
X2= 1.981, df = 1; p = not significant
Table J-12
Proportion of Iowa NYC and Summer Experimental ProgramRespondents Who Had Hunted for a Full-Time Job
SampleHunted
For a JobDid Not HuntFor a Job Totals
Experimental
Control
Totals
9 (75%)
9 (60%)
3 (25%)
6 (40%)
12
15
18
X20.169, df ...
9 27
1; p = not significant

Table J-13
Employment Status of Summer NYC and Experimentd1 Program Respondentsfrom the Minnesota White Experimental and Control Samples
Sample EmployedUnemployed,Looking
Unemployed,Not Looking Totals
Experimental
Control.
Totals
18
28
(55%)
(85%)
12
3
(36%)
(9%)
3
2
(9%)
(6%)
33
33
46 15 5
.
66
X2 - 7.774, df 1; p = <.01
Table J-14
Exployment Status of Summer NYC and Experimental Program Respondentsfrom the Iowa Experimental and Control Samples
Sample EmployedUnemployed,Looking
Unemployed,Not Looking Totals
Experimental
Control
Totals
7 (58%)
12 (80%)
5 (42%)
2 (13%)
0
1 (7%)
12
15
19 7 1 27
,.2 - 3.309. df - li o - not sianificant
- J-8 -
014a